Northwest Quadrant Joint Security Study Southern Company Headquarters Birmingham, Alabama August 12,...
14
Northwest Quadrant Northwest Quadrant Joint Security Study Joint Security Study Southern Company Headquarters Southern Company Headquarters Birmingham, Alabama Birmingham, Alabama August 12, 2002 August 12, 2002 Presented by Saeed Arabi Presented by Saeed Arabi
-
Upload
carolina-rollins -
Category
Documents
-
view
218 -
download
1
Transcript of Northwest Quadrant Joint Security Study Southern Company Headquarters Birmingham, Alabama August 12,...
Northwest QuadrantNorthwest QuadrantJoint Security StudyJoint Security Study
Southern Company HeadquartersSouthern Company HeadquartersBirmingham, AlabamaBirmingham, AlabamaAugust 12, 2002August 12, 2002Presented by Saeed ArabiPresented by Saeed Arabi

2 Powertech Labs Inc.
OutlineOutline
ScopeScope
AssumptionsAssumptions
ResultsResults
Proposed SolutionsProposed Solutions

3 Powertech Labs Inc.
Joint Security Study ScopeJoint Security Study Scope
Identify critical contingencies and constraintsIdentify critical contingencies and constraints• Scanning about two-thirds of the State of Alabama, the Scanning about two-thirds of the State of Alabama, the
extreme northwest portion of Georgia, and a small portion of extreme northwest portion of Georgia, and a small portion of eastern Mississippieastern Mississippi
Determine generation limits for various system Determine generation limits for various system conditionsconditions
Define the boundary of the security problemDefine the boundary of the security problem• SensitivitiesSensitivities• Worst-case scenarioWorst-case scenario
Propose solutions to stability constraintsPropose solutions to stability constraints
4 Powertech Labs Inc.
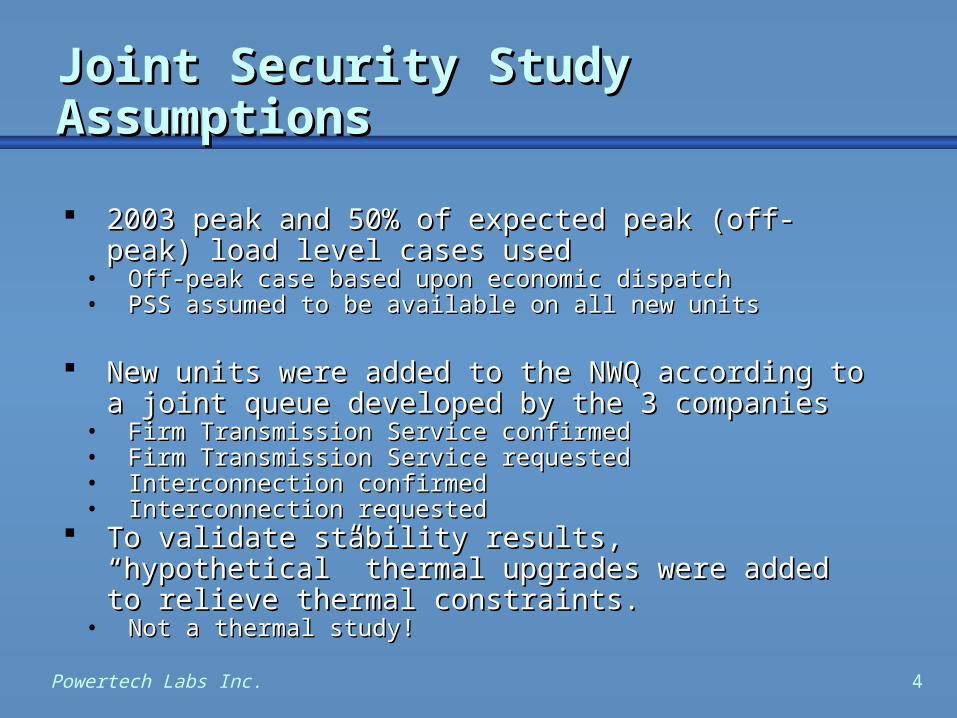
Joint Security Study AssumptionsJoint Security Study Assumptions
2003 peak and 50% of expected peak (off-peak) load 2003 peak and 50% of expected peak (off-peak) load level cases usedlevel cases used
• Off-peak case based upon economic dispatchOff-peak case based upon economic dispatch• PSS assumed to be available on all new unitsPSS assumed to be available on all new units
New units were added to the NWQ according to a New units were added to the NWQ according to a joint queue developed by the 3 companiesjoint queue developed by the 3 companies
• Firm Transmission Service confirmedFirm Transmission Service confirmed• Firm Transmission Service requestedFirm Transmission Service requested• Interconnection confirmedInterconnection confirmed• Interconnection requestedInterconnection requested
To validate stability results, “hypothetical” thermal To validate stability results, “hypothetical” thermal upgrades were added to relieve thermal constraints.upgrades were added to relieve thermal constraints.
• Not a thermal study!Not a thermal study!

5 Powertech Labs Inc.
Joint Security Study Assumptions Joint Security Study Assumptions (cont)(cont)
Four “Normal” source/sink scenariosFour “Normal” source/sink scenarios• EST-EST: Sink generation in the company territory where it is EST-EST: Sink generation in the company territory where it is
locatedlocated• EST-E: Sink generation in EntergyEST-E: Sink generation in Entergy• EST-S: Sink generation in SouthernEST-S: Sink generation in Southern• EST-T: Sink generation in TVAEST-T: Sink generation in TVA
One “Worst” source/sink scenarioOne “Worst” source/sink scenario• EST_W-S: Source ordered by TDFEST_W-S: Source ordered by TDF
Do not violate interface capacities of 3 companiesDo not violate interface capacities of 3 companies

6 Powertech Labs Inc.
Standard criteria usedStandard criteria used• Used each company’s current and voltage ratings and limitsUsed each company’s current and voltage ratings and limits• Voltage collapse margin: 5% Voltage collapse margin: 5% • Transient voltage dips: 75% for < 40 cyclesTransient voltage dips: 75% for < 40 cycles• Minimum damping: 3% Minimum damping: 3% • Fault clearing margin: 2 cyclesFault clearing margin: 2 cycles
Combinations of constant power, current, and Combinations of constant power, current, and impedance load models usedimpedance load models used
Joint Security Study Assumptions Joint Security Study Assumptions (cont)(cont)

7 Powertech Labs Inc.
The most limiting contingency from a damping standpoint The most limiting contingency from a damping standpoint was the Miller - Bellefonte 500 kV line was the Miller - Bellefonte 500 kV line (Line tripping event)(Line tripping event)
The most limiting contingency from a transient voltage The most limiting contingency from a transient voltage dip standpoint was the Farley – Raccoon Creek 500 kV dip standpoint was the Farley – Raccoon Creek 500 kV line line (Normally cleared 3ph fault)(Normally cleared 3ph fault)
The most limiting normal scenario identified was EST-S The most limiting normal scenario identified was EST-S (Sinking to Southern under off-peak conditions)(Sinking to Southern under off-peak conditions)
SVC will raise stability limit some – Big increases will SVC will raise stability limit some – Big increases will require 500 kV linesrequire 500 kV lines
Joint Security Study ResultsJoint Security Study Results

8 Powertech Labs Inc.
New generation added without PSS severely deteriorated New generation added without PSS severely deteriorated system damping: PSS requiredsystem damping: PSS required
Limit is very source/sink dependent: Sequential studies Limit is very source/sink dependent: Sequential studies requiredrequired
5625 MW “Normal” limit based on the joint EST Queue5625 MW “Normal” limit based on the joint EST Queue
3500 MW “Worst” limit based on TDF of Farley-Raccoon 3500 MW “Worst” limit based on TDF of Farley-Raccoon LineLine (Limits are above year 2000 generation)(Limits are above year 2000 generation)
Line re-conductoring had small impact on security limitsLine re-conductoring had small impact on security limits
Table 3-2Table 3-2 w/ PSSw/ PSS w/o PSSw/o PSS
EST-SEST-S >9500>9500 00
Joint Security Study Results Joint Security Study Results (cont)(cont)

9 Powertech Labs Inc.
Buf. Case Scenario Contingency
Bus # Bus Name Buf.Bus voltage magnitude (pu)
Time in seconds
0.000 4.000 8.000 12.000 16.000 20.0000.000
0.250
0.500
0.750
1.000
1.250Bus voltage magnitude (pu)
Time in seconds
0.000 4.000 8.000 12.000 16.000 20.0000.000
0.250
0.500
0.750
1.000
1.250Bus voltage magnitude (pu)
Time in seconds
0.000 4.000 8.000 12.000 16.000 20.0000.000
0.250
0.500
0.750
1.000
1.250Bus voltage magnitude (pu)
Time in seconds
0.000 4.000 8.000 12.000 16.000 20.0000.000
0.250
0.500
0.750
1.000
1.250
1 50% of 2003 Expected Peak Load. EST-EST Without PSS for IPP&NLs 15: 94600-96280
90218 S BAINBR230. 1
2 50% of 2003 Expected Peak Load. EST-E Without PSS for IPP&NLs 15: 94600-96280
90218 S BAINBR230. 2
3 50% of 2003 Expected Peak Load. EST-S Without PSS for IPP&NLs 15: 94600-96280
90218 S BAINBR230. 3
4 50% of 2003 Expected Peak Load. EST-T Without PSS for IPP&NLs 15: 94600-96280
90218 S BAINBR230. 4
Joint Security Study Results Joint Security Study Results (cont)(cont)
Buf. Case Scenario Contingency
Bus # Bus Name Buf.Bus voltage magnitude (pu)
Time in seconds
0.000 4.000 8.000 12.000 16.000 20.0000.000
0.250
0.500
0.750
1.000
1.250Bus voltage magnitude (pu)
Time in seconds
0.000 4.000 8.000 12.000 16.000 20.0000.000
0.250
0.500
0.750
1.000
1.250Bus voltage magnitude (pu)
Time in seconds
0.000 4.000 8.000 12.000 16.000 20.0000.000
0.250
0.500
0.750
1.000
1.250Bus voltage magnitude (pu)
Time in seconds
0.000 4.000 8.000 12.000 16.000 20.0000.000
0.250
0.500
0.750
1.000
1.250
1 50% of 2003 Expected Peak Load. EST-EST With PSS for IPP&NLs 15: 94600-96280
90218 S BAINBR230. 1
2 50% of 2003 Expected Peak Load. EST-E With PSS for IPP&NLs 15: 94600-96280
90218 S BAINBR230. 2
3 50% of 2003 Expected Peak Load. EST-S With PSS for IPP&NLs 15: 94600-96280
90218 S BAINBR230. 3
4 50% of 2003 Expected Peak Load. EST-T With PSS for IPP&NLs 15: 94600-96280
90218 S BAINBR230. 4

10 Powertech Labs Inc.
Joint Security Study- Proposed SolutionsJoint Security Study- Proposed Solutions
Dynamic shunt compensation can increase the transient Dynamic shunt compensation can increase the transient security limit by 1400 – 2150 MW security limit by 1400 – 2150 MW (In South Bainbridge and Auburn (In South Bainbridge and Auburn
regions)regions)
• Minimal increase after 900 Mvar addedMinimal increase after 900 Mvar added• 230 kV re-conductoring and static capacitors would be required230 kV re-conductoring and static capacitors would be required• Cost of SVC: Approximately $5 million per 100 MvarCost of SVC: Approximately $5 million per 100 Mvar
Series compensation was evaluated, but found to not be Series compensation was evaluated, but found to not be an effective solutionan effective solution
• Candidate lines were already heavily loadedCandidate lines were already heavily loaded
11 Powertech Labs Inc.
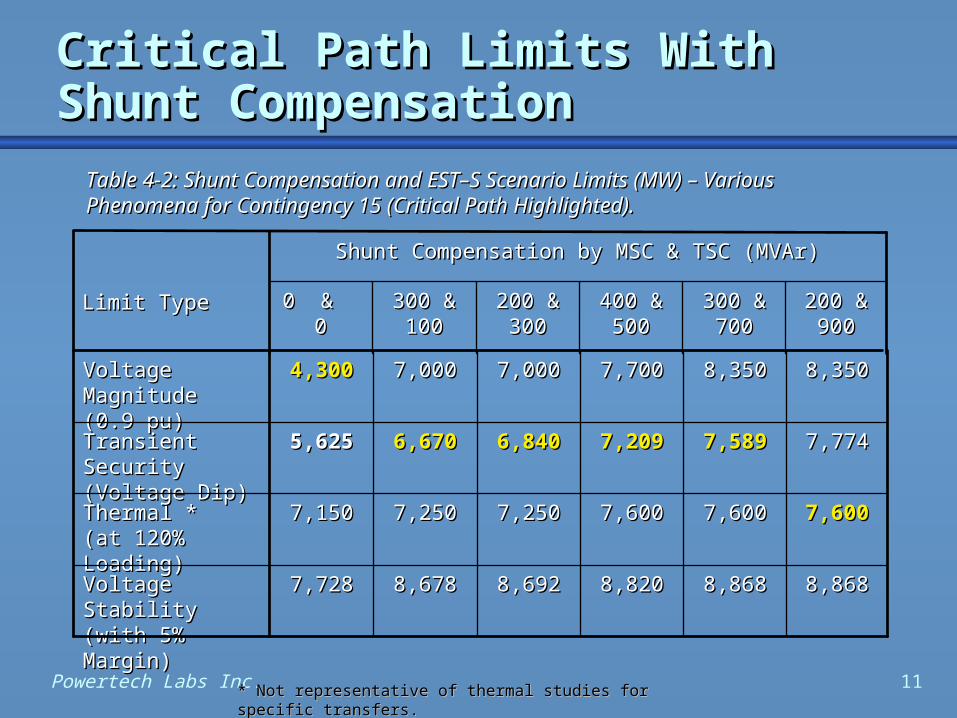
8,8688,8688,8688,8688,8208,8208,6928,6928,6788,6787,7287,728Voltage Stability Voltage Stability
(with 5% Margin)(with 5% Margin)
7,6007,6007,6007,6007,6007,6007,2507,2507,2507,2507,1507,150Thermal *Thermal *
(at 120% Loading)(at 120% Loading)
7,7747,7747,5897,5897,2097,2096,8406,8406,6706,6705,6255,625Transient Security Transient Security
(Voltage Dip)(Voltage Dip)
8,3508,3508,3508,3507,7007,7007,0007,0007,0007,0004,3004,300Voltage Magnitude Voltage Magnitude (0.9 pu)(0.9 pu)
200 & 200 & 900900
300 & 300 & 700700
400 & 400 & 500500
200 & 200 & 300300
300 & 300 & 100100
0 & 0 & 00
Shunt Compensation by MSC & TSC (MVAr)Shunt Compensation by MSC & TSC (MVAr)
Limit TypeLimit Type
Table 4‑2: Shunt Compensation and EST–S Scenario Limits (MW) – Various Phenomena Table 4‑2: Shunt Compensation and EST–S Scenario Limits (MW) – Various Phenomena for Contingency 15 (Critical Path Highlighted).for Contingency 15 (Critical Path Highlighted).
Critical Path Limits With Shunt Critical Path Limits With Shunt CompensationCompensation
* Not representative of thermal studies for specific transfers. * Not representative of thermal studies for specific transfers.

12 Powertech Labs Inc.
Questions?Questions?

13 Powertech Labs Inc.
Northwest QuadrantNorthwest Quadrant

14 Powertech Labs Inc.
BackgroundBackground
Southern company internal studies indicated ~5000 Southern company internal studies indicated ~5000 MW of new generation above year 2000 before MW of new generation above year 2000 before transient stability limit reachedtransient stability limit reached
~20,000 MW of new generation requests in the NWQ~20,000 MW of new generation requests in the NWQ
Joint study initiated with Powertech Labs last summerJoint study initiated with Powertech Labs last summer
Entergy and TVA included in the study and modelEntergy and TVA included in the study and model
TSR facility studies on hold pending the results of the TSR facility studies on hold pending the results of the joint studyjoint study