Northwest Power Conservation Council Natural Gas Advisory Committee June 16, 2011.
22
NW Gas Market Outlook: Winds of Change Northwest Power Conservation Council Natural Gas Advisory Committee June 16, 2011
-
Upload
blake-marshall -
Category
Documents
-
view
222 -
download
0
Transcript of Northwest Power Conservation Council Natural Gas Advisory Committee June 16, 2011.
NW Gas Market Outlook:Winds of Change
Northwest Power Conservation CouncilNatural Gas Advisory Committee
June 16, 2011

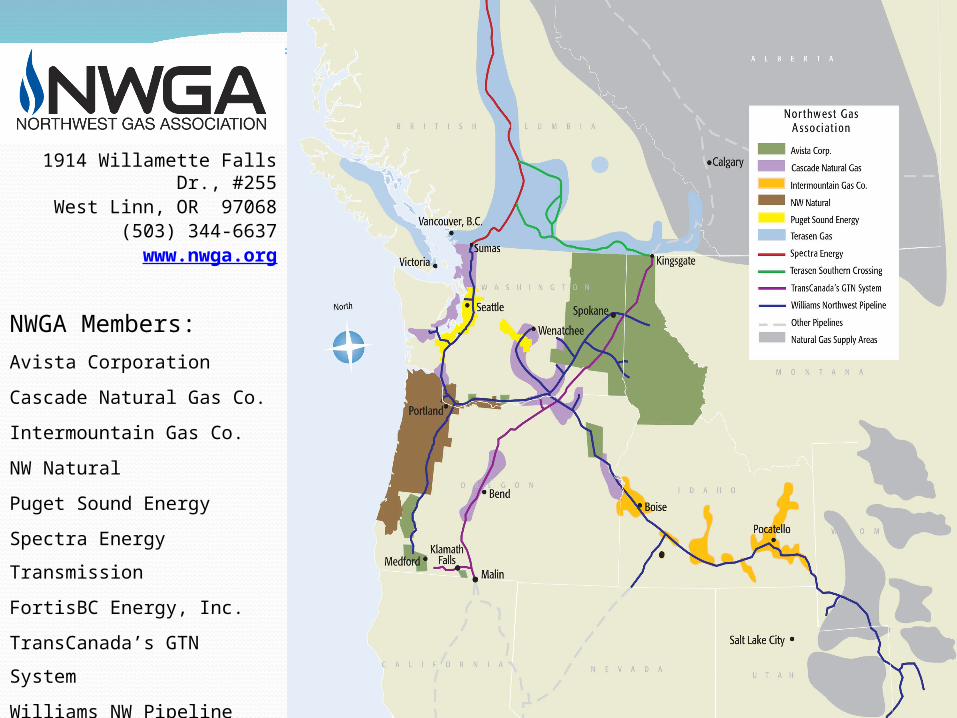
1914 Willamette Falls Dr., #255West Linn, OR 97068
(503) 344-6637www.nwga.org
NWGA Members:
Avista Corporation
Cascade Natural Gas Co.
Intermountain Gas Co.
NW Natural
Puget Sound Energy
Spectra Energy Transmission
FortisBC Energy, Inc.
TransCanada’s GTN System
Williams NW Pipeline
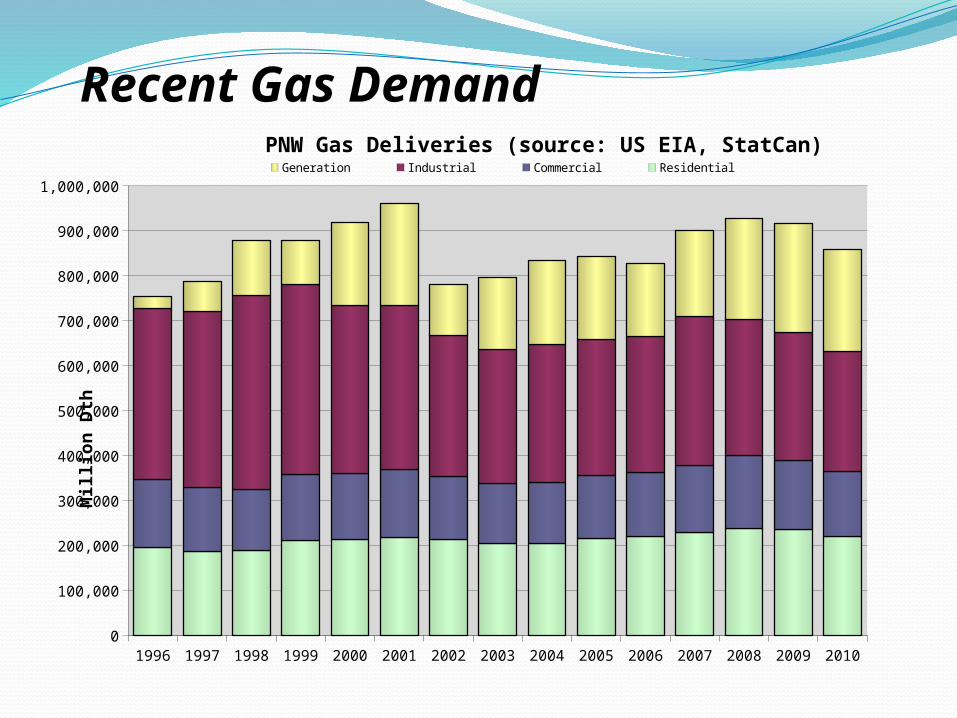
Recent Gas Demand
1996 1997 1998 1999 2000 2001 2002 2003 2004 2005 2006 2007 2008 2009 20100
100,000
200,000
300,000
400,000
500,000
600,000
700,000
800,000
900,000
1,000,000
PNW Gas Deliveries (source: US EIA, StatCan)Generation Industrial Commercial Residential
Mil
lio
n D
th
Hydro NatGas Coal Nuclear Wind (32%)
0
2000
4000
6000
8000
10000
12000
14000
16000
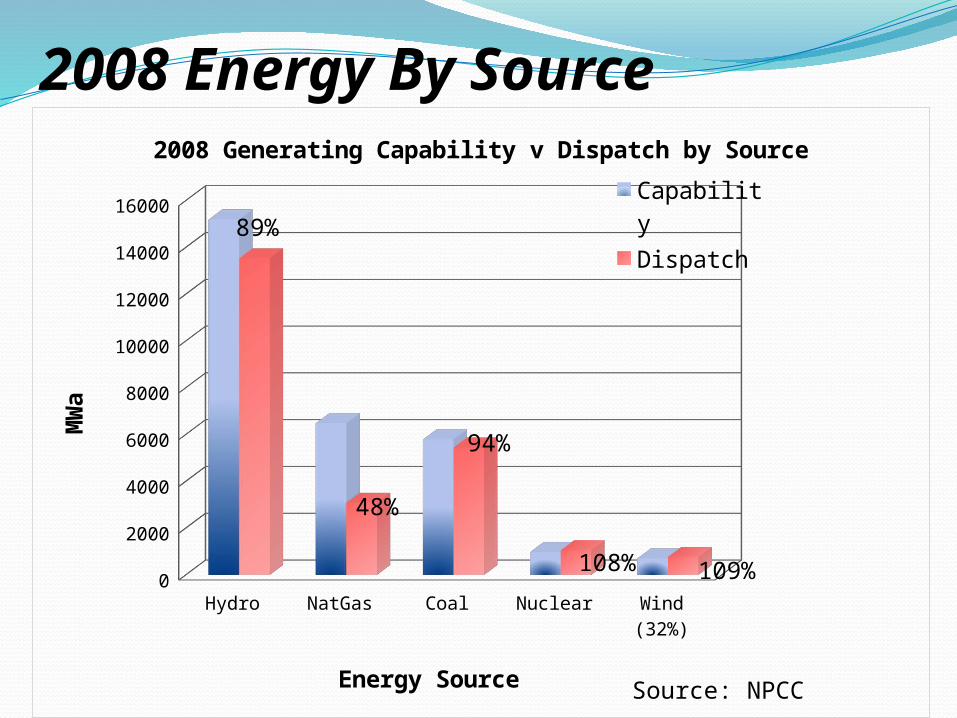
2008 Generating Capability v Dispatch by Source
Capability
Dispatch
Energy Source
MW
a2008 Energy By Source
89%
48%
94%
108% 109%
Source: NPCC
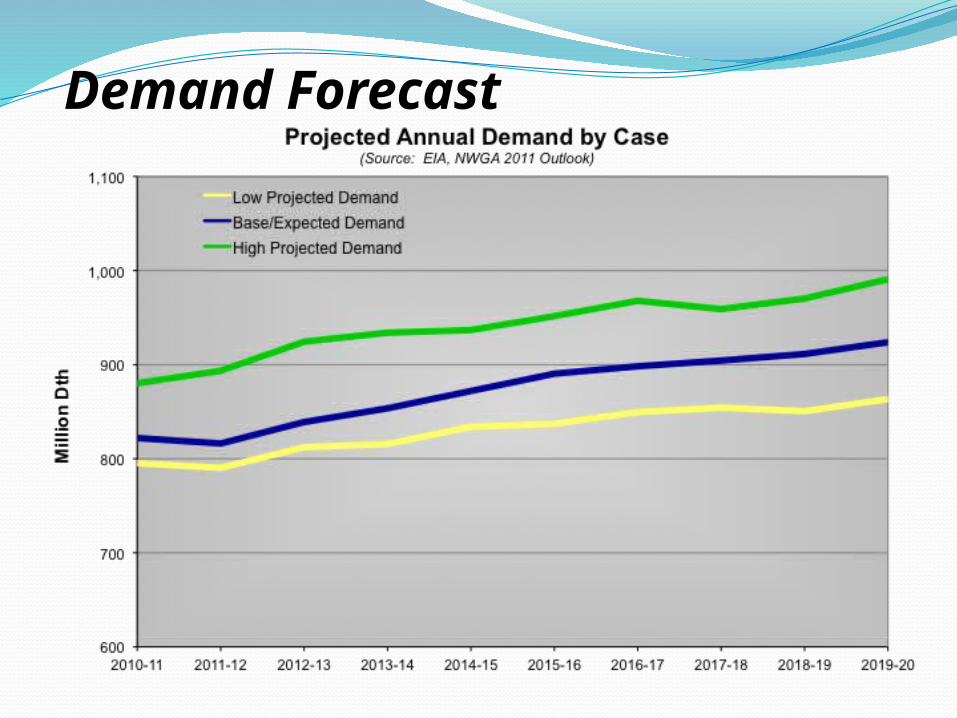
Demand Forecast
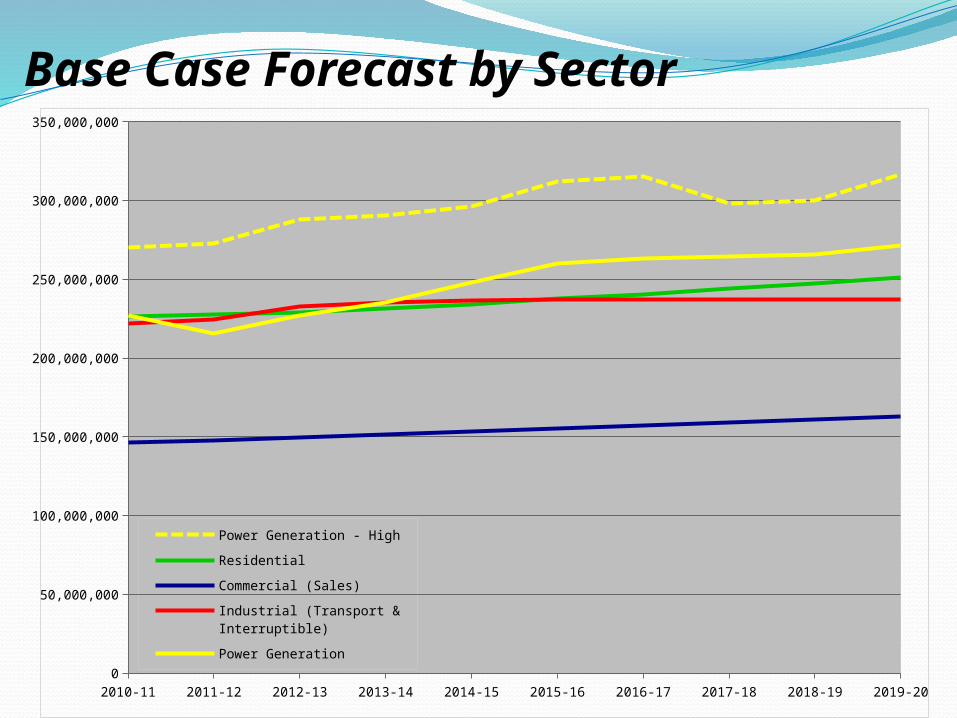
Base Case Forecast by Sector
2010-11 2011-12 2012-13 2013-14 2014-15 2015-16 2016-17 2017-18 2018-19 2019-200
50,000,000
100,000,000
150,000,000
200,000,000
250,000,000
300,000,000
350,000,000
Power Generation - High
Residential
Commercial (Sales)
Industrial (Transport & In-terruptible)
Power Generation
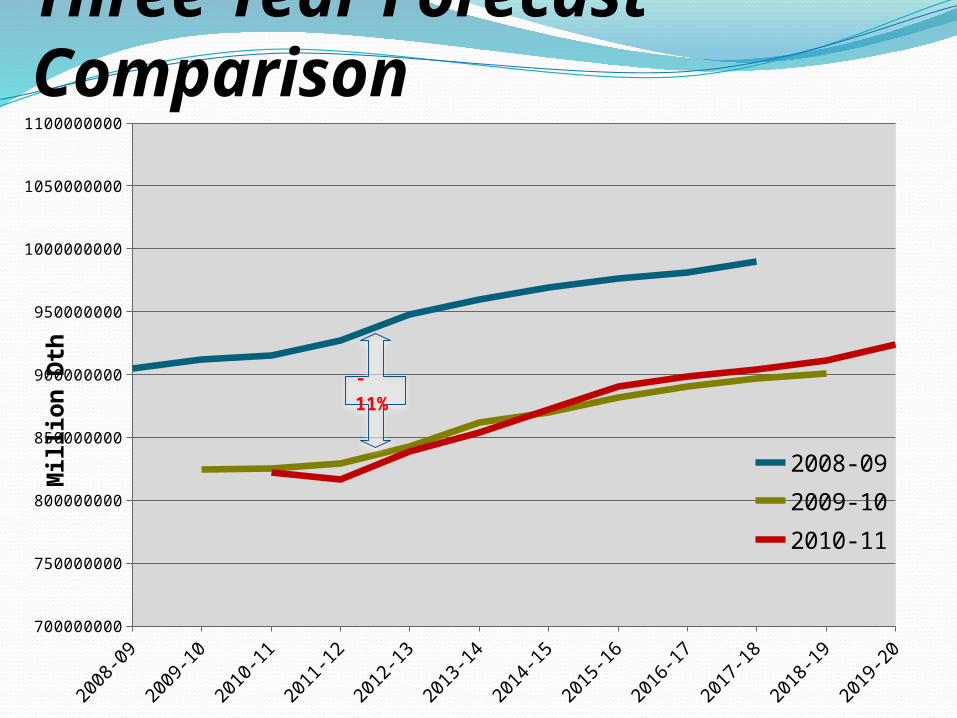
Three Year Forecast Comparison
700000000
750000000
800000000
850000000
900000000
950000000
1000000000
1050000000
1100000000
2008-09
2009-10
2010-11
Mil
lion
Dth
-11%
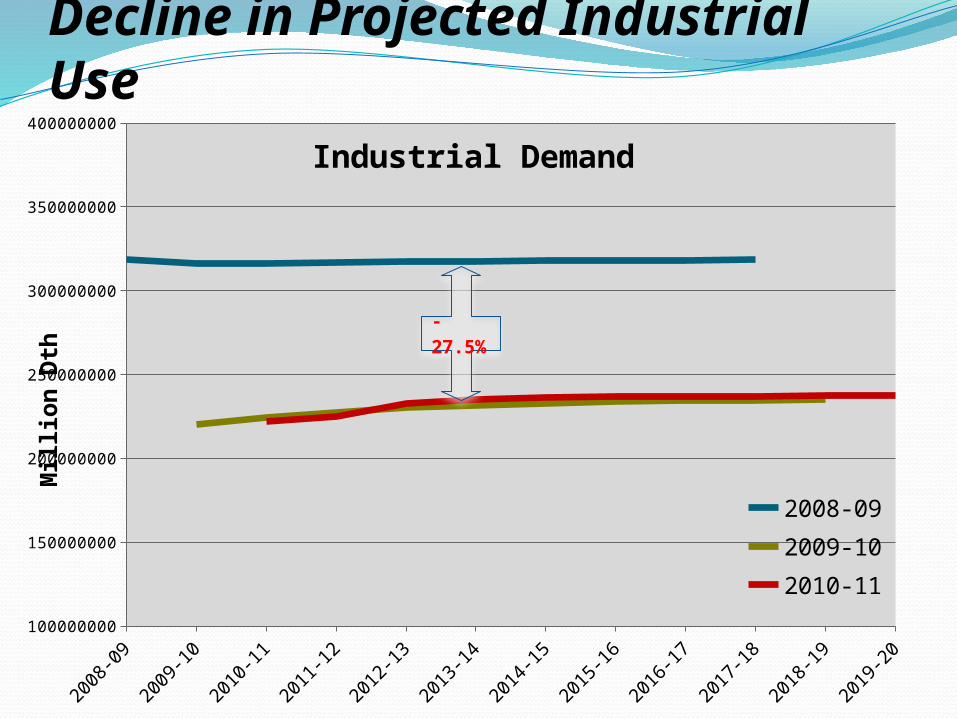
Decline in Projected Industrial Use
2008
-09
2009
-10
2010
-11
2011
-12
2012
-13
2013
-14
2014
-15
2015
-16
2016
-17
2017
-18
2018
-19
2019
-20
100000000
150000000
200000000
250000000
300000000
350000000
400000000
Industrial Demand
2008-09
2009-10
2010-11
Mil
lion
Dth
-27.5%
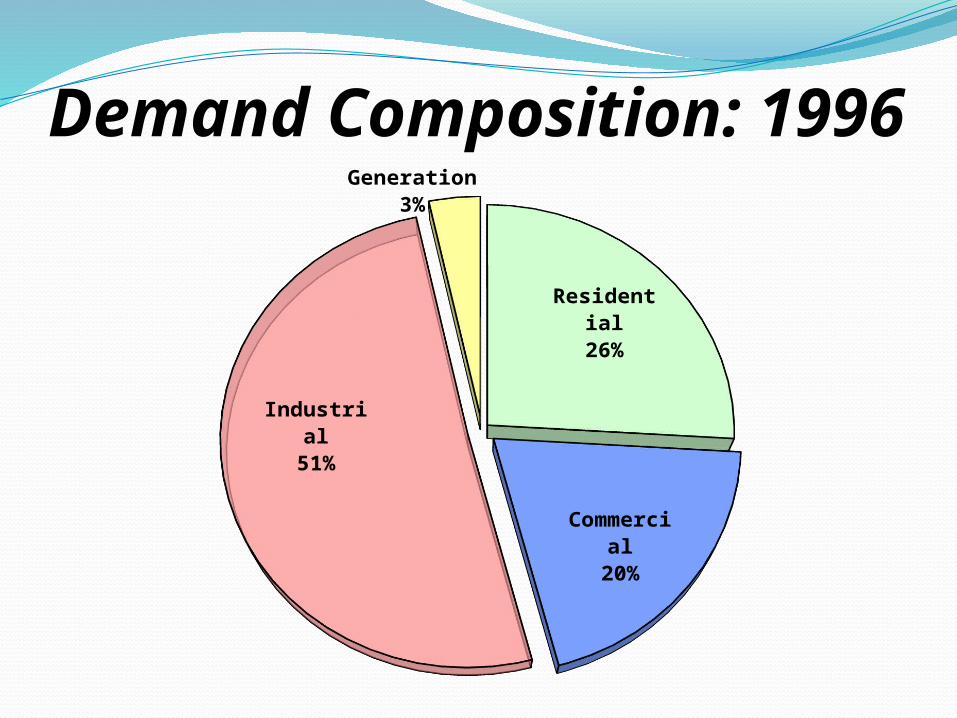
Demand Composition: 1996
Residen-tial
26%
Com-mercial
20%
Industrial51%
Generation3%
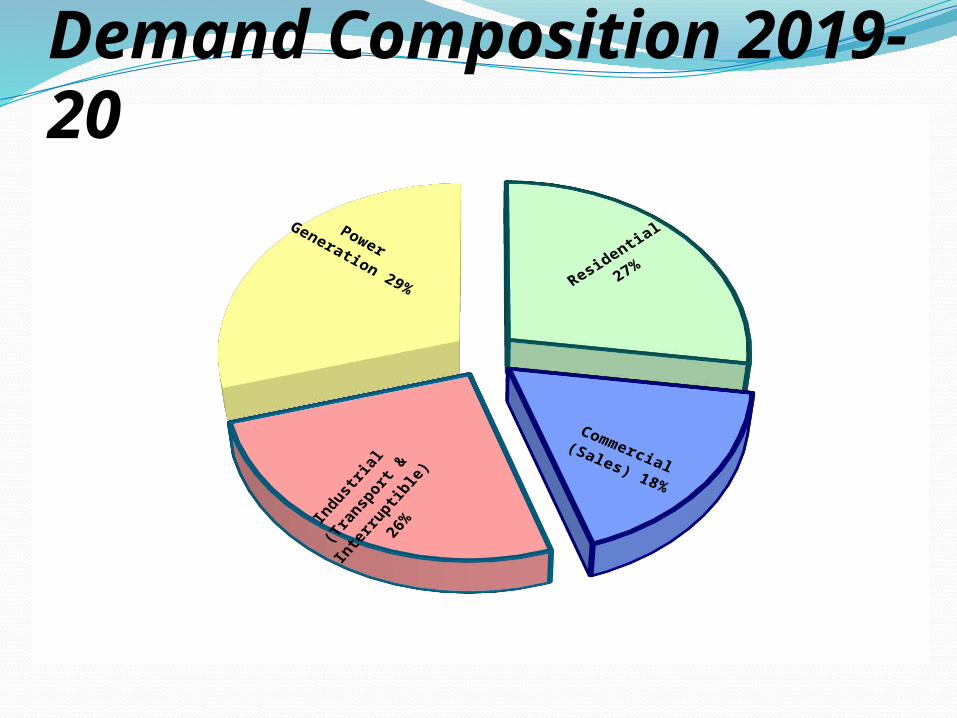
Demand Composition 2019-20
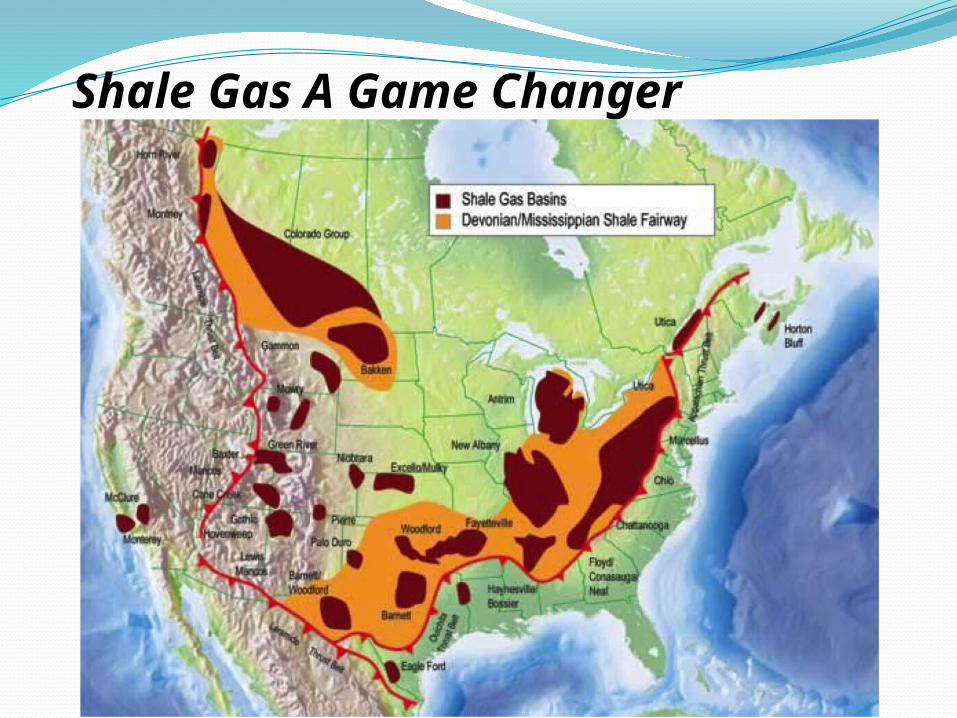
Shale Gas A Game Changer
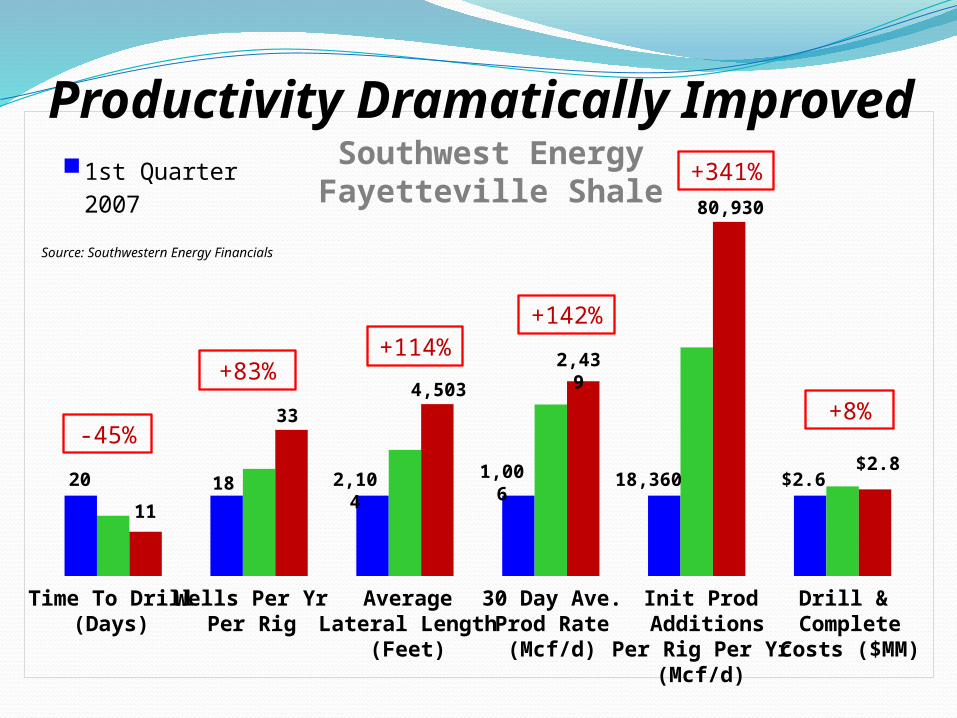
1st Quarter 20071st Quarter 20083rd Quarter 2010
1,006
2,439
80,930
Productivity Dramatically Improved Southwest EnergyFayetteville Shale
2,104
4,503
+114%
20
11
-45%
+142%
$2.8$2.6
+8%
18
33
+83%
18,360
+341%
Source: Southwestern Energy Financials
Time To Drill(Days)
Wells Per YrPer Rig
AverageLateral Length
(Feet)
30 Day Ave.Prod Rate
(Mcf/d)
Init Prod Additions
Per Rig Per Yr(Mcf/d)
Drill & Complete
Costs ($MM)
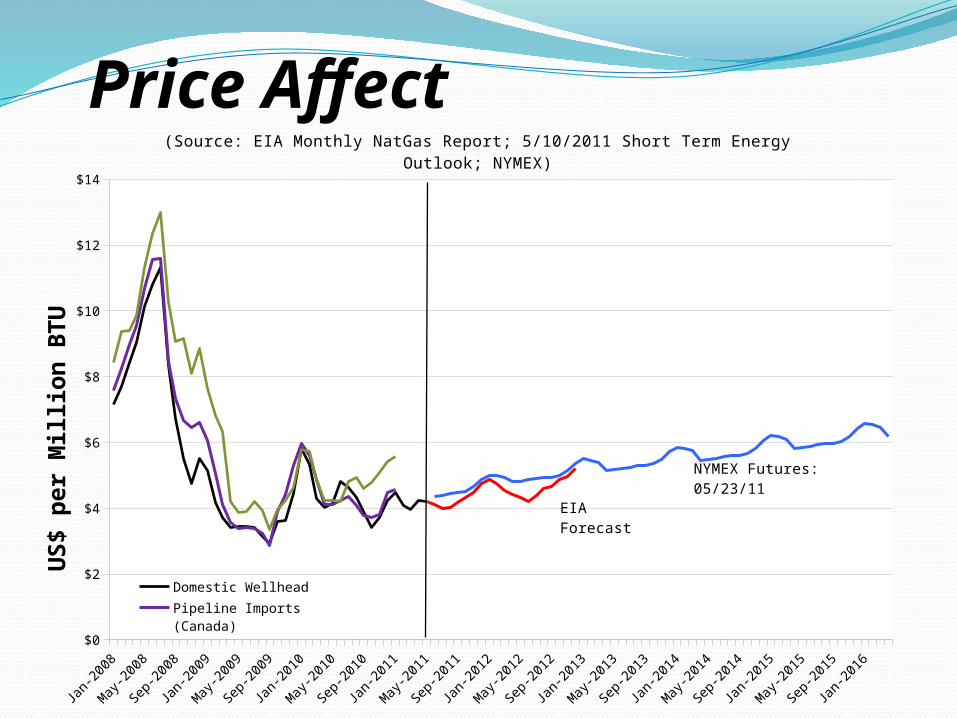
Price Affect
Jan-
2008
Apr-2
008
Jul-2
008
Oct-2
008
Jan-
2009
Apr-2
009
Jul-2
009
Oct-2
009
Jan-
2010
Apr-2
010
Jul-2
010
Oct-2
010
Jan-
2011
Apr-2
011
Jul-2
011
Oct-2
011
Jan-
2012
Apr-2
012
Jul-2
012
Oct-2
012
Jan-
2013
Apr-2
013
Jul-2
013
Oct-2
013
Jan-
2014
Apr-2
014
Jul-2
014
Oct-2
014
Jan-
2015
Apr-2
015
Jul-2
015
Oct-2
015
Jan-
2016
Apr-2
016
$0
$2
$4
$6
$8
$10
$12
$14
(Source: EIA Monthly NatGas Report; 5/10/2011 Short Term Energy Outlook; NYMEX)
Domestic Wellhead
Pipeline Imports (Canada)
LNG Imports
US
$ p
er
Mil
lion
BT
U
EIA Forecast
NYMEX Futures: 05/23/11
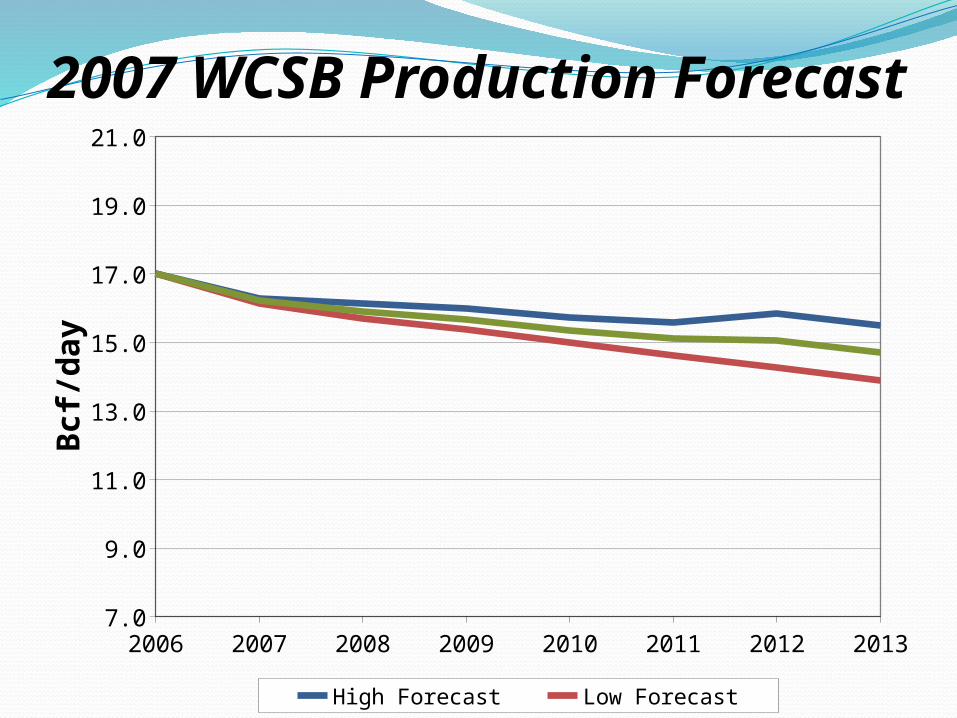
2007 WCSB Production Forecast
2006 2007 2008 2009 2010 2011 2012 20137.0
9.0
11.0
13.0
15.0
17.0
19.0
21.0
High Forecast Low Forecast Average
Bc
f/d
ay
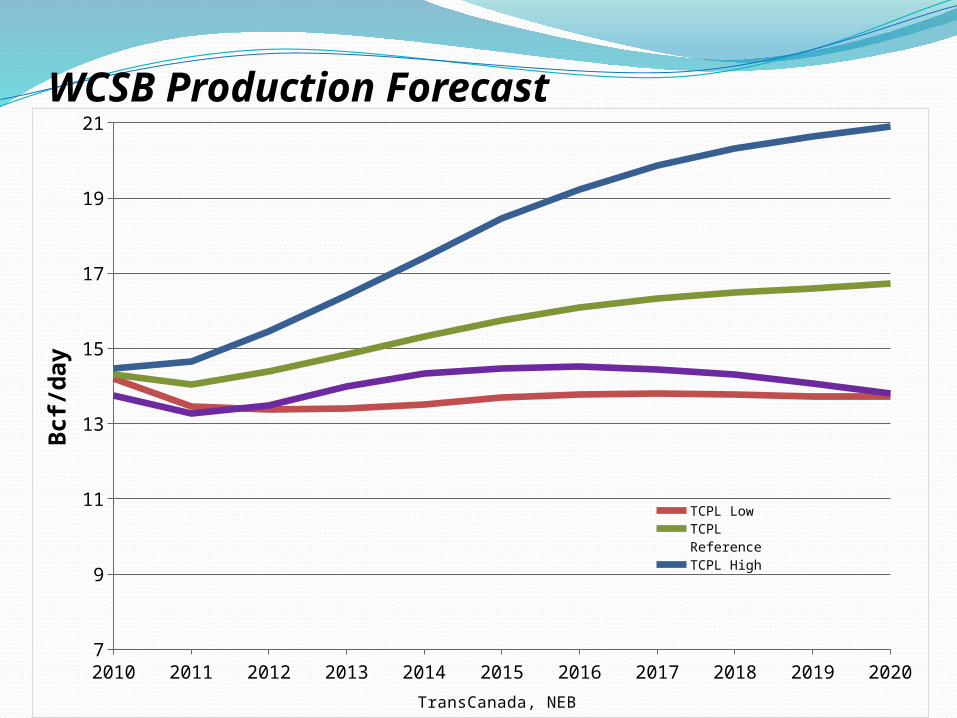
WCSB Production Forecast
2010 2011 2012 2013 2014 2015 2016 2017 2018 2019 20207
9
11
13
15
17
19
21
TCPL LowTCPL ReferenceTCPL HighNEB Reference
TransCanada, NEB
Bcf/
day
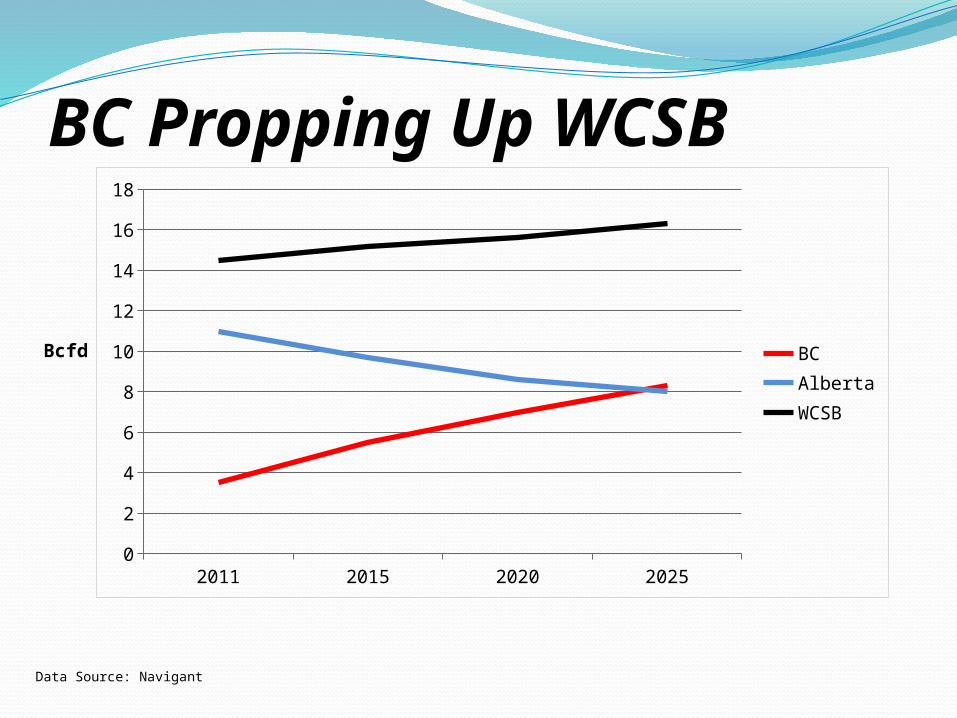
BC Propping Up WCSB
Bcfd
2011 2015 2020 20250
2
4
6
8
10
12
14
16
18
BCAlbertaWCSB
Data Source: Navigant
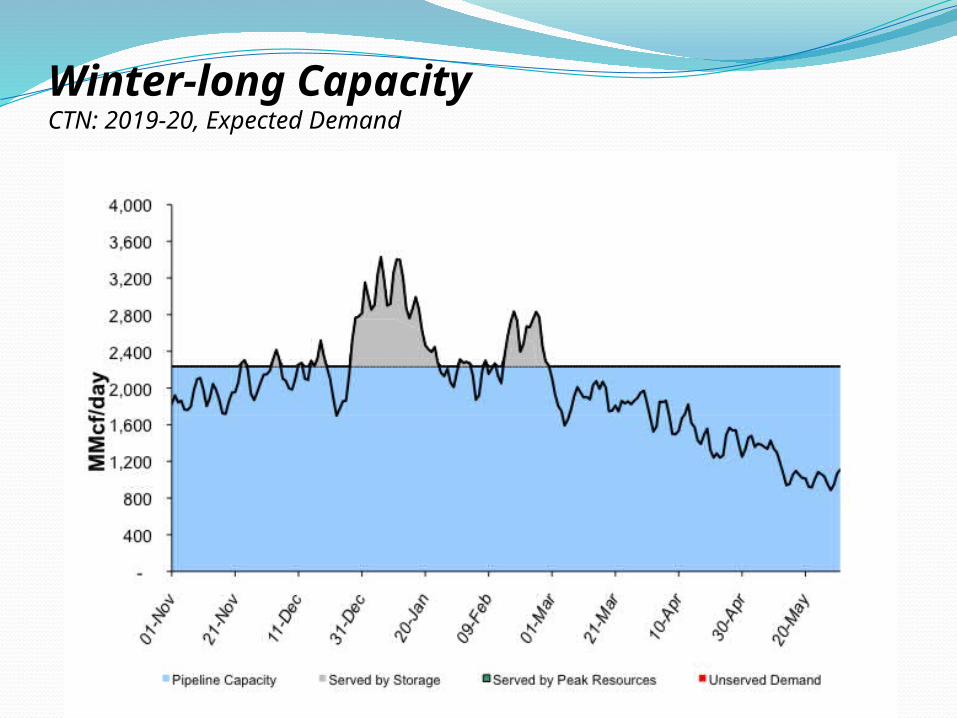
Winter-long CapacityCTN: 2019-20, Expected Demand
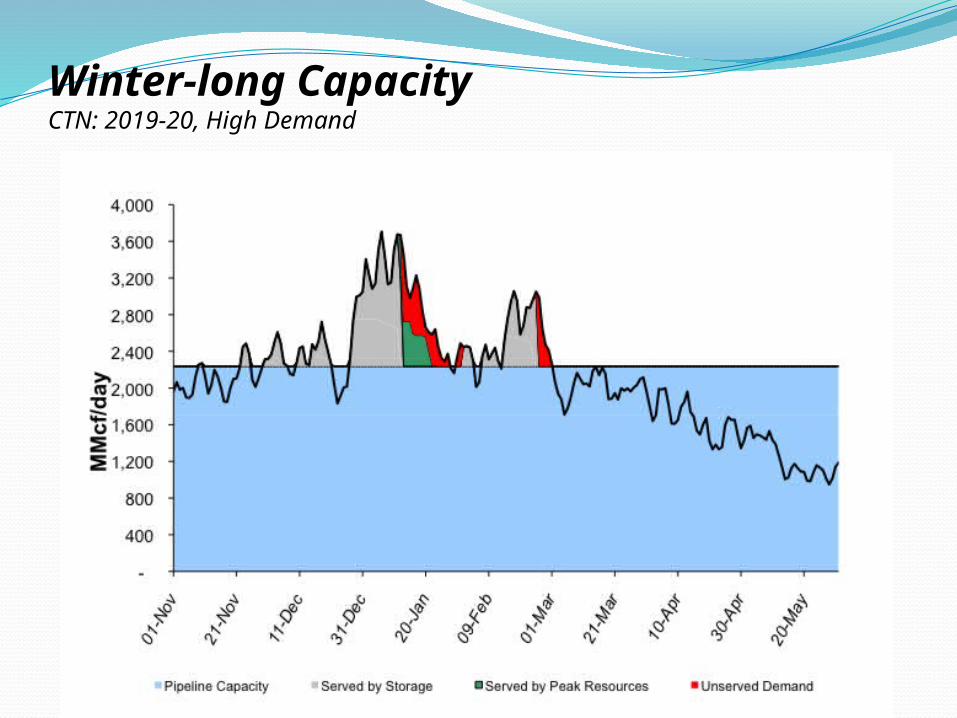
Winter-long CapacityCTN: 2019-20, High Demand
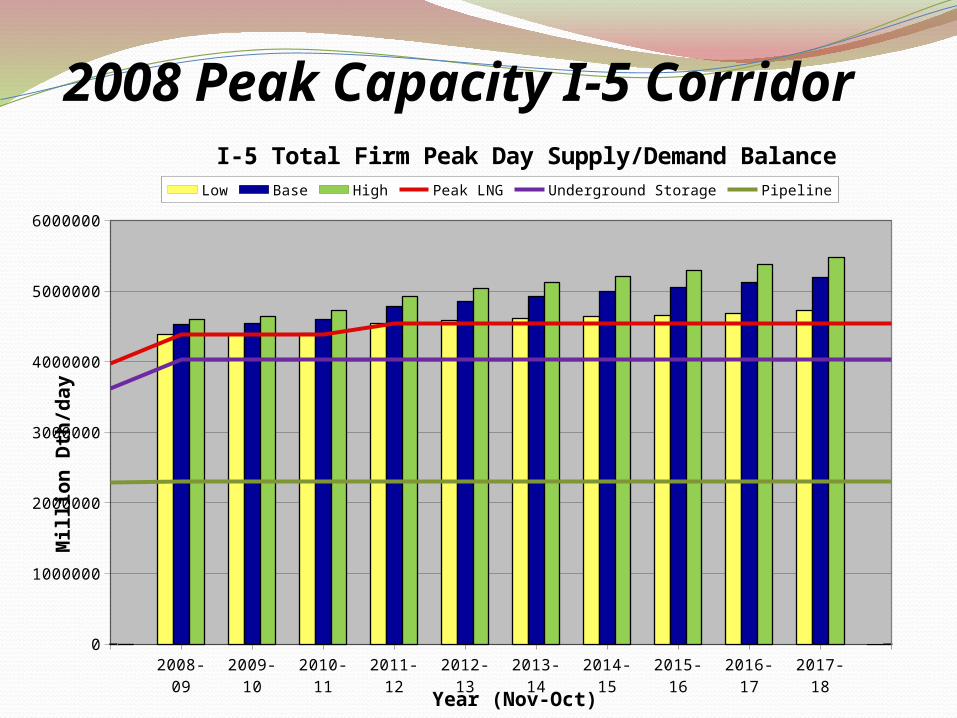
2008 Peak Capacity I-5 Corridor
2008-09 2009-10 2010-11 2011-12 2012-13 2013-14 2014-15 2015-16 2016-17 2017-18 0
1000000
2000000
3000000
4000000
5000000
6000000
I-5 Total Firm Peak Day Supply/Demand Balance
Low Base High Peak LNG Underground Storage Pipeline
Year (Nov-Oct)
Mil
lio
n D
th/d
ay
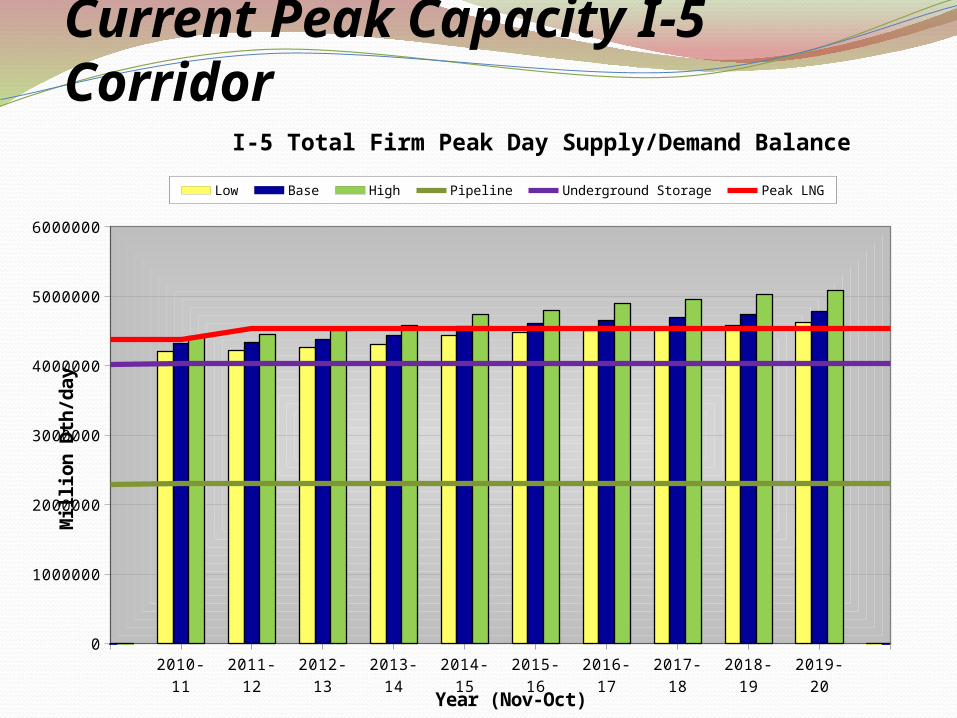
Current Peak Capacity I-5 Corridor
2010-11 2011-12 2012-13 2013-14 2014-15 2015-16 2016-17 2017-18 2018-19 2019-20 0
1000000
2000000
3000000
4000000
5000000
6000000
I-5 Total Firm Peak Day Supply/Demand Balance
Low Base High Pipeline Underground Storage Peak LNG
Year (Nov-Oct)
Mill
ion
Dth
/da
y
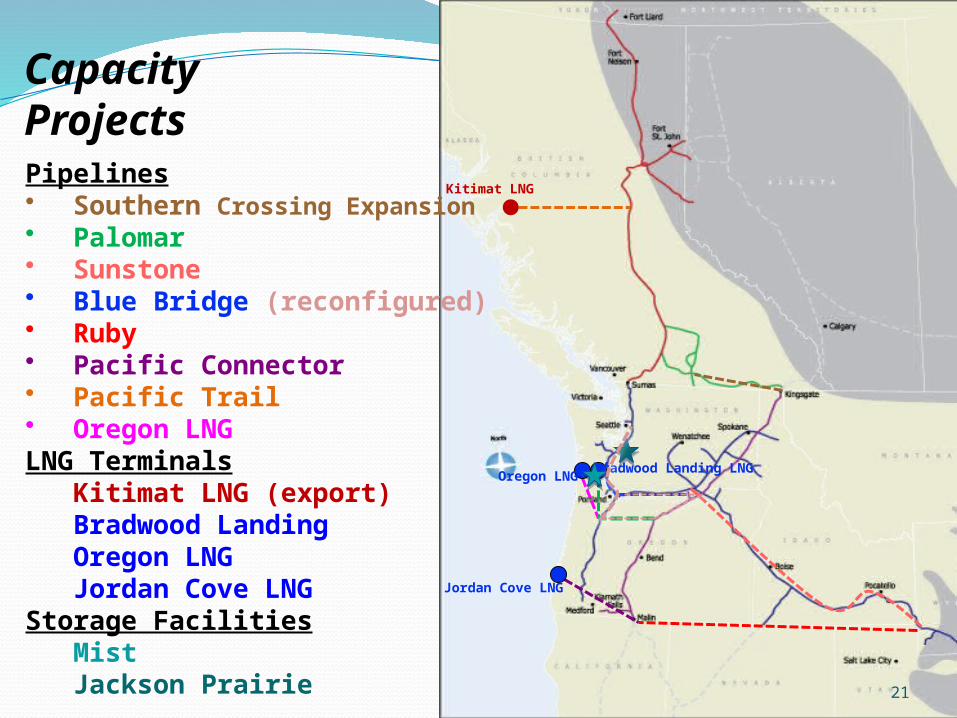
Capacity Projects
21
Pipelines• Southern Crossing Expansion• Palomar• Sunstone• Blue Bridge (reconfigured)• Ruby• Pacific Connector• Pacific Trail• Oregon LNGLNG Terminals
Kitimat LNG (export)Bradwood LandingOregon LNGJordan Cove LNG
Storage FacilitiesMistJackson Prairie
Oregon LNG Bradwood Landing LNG
Jordan Cove LNG
Kitimat LNG
1914 Willamette Falls Dr., #255West Linn, OR 97068
(503) 344-6637www.nwga.org
NWGA Members:
Avista Corporation
Cascade Natural Gas Co.
Intermountain Gas Co.
NW Natural
Puget Sound Energy
Spectra Energy Transmission
FortisBC Energy, Inc.
TransCanada’s GTN System
Williams NW Pipeline