
Northern Star Resources Ltd 2011 Annual Report · Chairman’s Report 2 | Northern Star Resources...
59
Northern Star Resources Ltd 2011 Annual Report
Transcript of Northern Star Resources Ltd 2011 Annual Report · Chairman’s Report 2 | Northern Star Resources...

Northern Star Resources Ltd 2011 Annual Report

2011 Annual Report
1 | Northern Star Resources Ltd
Section Page
Corporate Directory 1 Chairman’s Report 2 Highlights 3 Review of Operations 4 Report of the Directors 10 Corporate Governance Statement 19 Auditor’s Independence Declaration 24 Statements of Comprehensive Income 25 Statements of Financial Position 26 Statements of Cash Flows 27 Statements of Changes in Equity 28 Notes to the Financial Report 29 Directors’ Declaration 53 Independent Audit Report 54 Additional ASX Information 56 Tenement Schedule 58
Corporate Directory
Directors Share Registry Christopher Rowe Advanced Share Registry Limited Bill Beament 150 Stirling Highway Peter Farris Nedlands WA 6009 Michael Fotios Telephone: (08) 9389 8033 Investor website: www.advancedshare.com.au
Company Secretary Karen Brown Home Stock Exchange ASX Limited (Australian Securities Exchange)
Registered Office 2 The Esplanade 65 Burswood Road Perth WA 6000 Burswood WA 6100 ASX Code: NST Telephone: (08) 9227 1186 Facsimile: (08) 9227 8178 Auditors Rothsay Chartered Accountants
Principal Office 152-158 St Georges Tce 24 Mumford Place Perth WA 6000 Balcatta WA 6021 Telephone: (08) 6241 1866 Facsimile: (08) 6241 1831 Web Page: www.nsrltd.com Email: [email protected]
Chairman’s Report
2 | Northern Star Resources Ltd
Dear Shareholder, It is with both pride and much anticipation that I pen my first annual report address to you since Northern Star Resources was promoted to the league of substantial Australian gold producers. Your Company has enjoyed a stellar year during which it has evolved from a small Kimberley explorer to a highly profitable gold miner with enviable growth prospects and a host of opportunities. The foundations of Northern Star are now rock solid, with production on track to exceed forecasts of 75,000 ounces this calendar year. This is expected to generate more than $40 million in surplus cash at $1,400 per ounce gold price. In addition, your Company is debt-free after repaying the $40 million in costs associated with the acquisition of the Paulsens Gold Mine in June last year. I think the Company’s financial strength is probably best summarised by the observation contained in its recent annual profit announcement. This noted that had the current gold price of about $1,750 an ounce applied throughout the year, and the acquisition costs were excluded, underlying gross operating profit would have been in the order of $100 million. This makes Northern Star a substantial mining Company by any standards. More importantly, it highlights the robust base on which we are now seeking to build what we believe will be one of Australia’s leading gold miners. When Northern Star took ownership of Paulsens in July 2010, the mine plan allowed for eight months’ production. We are now confident that, thanks to some outstanding exploration success, it has at least five years in front of it. This is a direct result of extensions to the Voyager 1 lode and the discovery of the Voyager 2 lode. At the same time as we push to grow the resources, production and cash flow at Paulsens, the Company is working hard to establish its second operating mine at its recently acquired Ashburton Project. Ashburton already has a JORC resource of 668,000oz and we believe there is significant scope to increase this substantially. As well as offering huge exploration potential, Ashburton is particularly attractive to Northern Star because it is within trucking distance of the Paulsens processing plant. In addition to the significant growth potential at Paulsens and Ashburton, Northern Star is now in a financial position which allows it to consider other opportunities as they arise. The Company has however no intention of pursuing growth for the sake of it and the same strict financial and operational criteria which has been applied to our existing business will govern any future acquisitions and investments. Much of Northern Star’s success over the past year is a direct result of the skills and commitment of the Executive and Operational team. I extend a huge thank you to them for working so diligently to make the Company one of the year’s mining and share market success stories. I also would to like to thank you, the shareholders, for the strong support you have given to Management and the Board as we have sought to grow your company. I trust you will join with me in looking forward to another year of strong growth for Northern Star. Yours faithfully
Chris Rowe Chairman
Highlights
3 | Northern Star Resources Ltd
OUR PERFORMANCE
1. Northern Star Resources Ltd
became an Australian gold producer in July 2010 after acquiring Paulsens
Gold Mine.
8. The Company is debt-free after repaying $40 million in costs associated with the acquisition of the Paulsens Gold Mine.
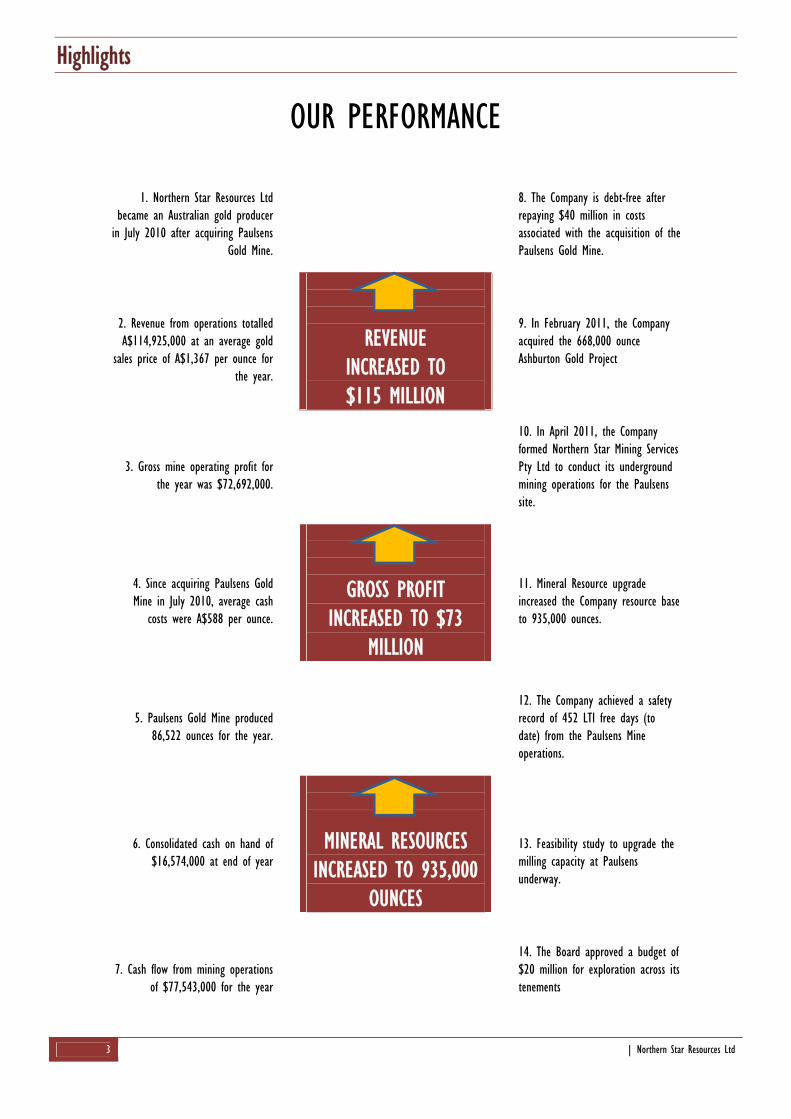
2. Revenue from operations totalled A$114,925,000 at an average gold
sales price of A$1,367 per ounce for the year.
REVENUE INCREASED TO $115 MILLION
9. In February 2011, the Company acquired the 668,000 ounce Ashburton Gold Project
3. Gross mine operating profit for
the year was $72,692,000.
10. In April 2011, the Company formed Northern Star Mining Services Pty Ltd to conduct its underground mining operations for the Paulsens site.
4. Since acquiring Paulsens Gold Mine in July 2010, average cash
costs were A$588 per ounce.
GROSS PROFIT INCREASED TO $73
MILLION
11. Mineral Resource upgrade increased the Company resource base to 935,000 ounces.
5. Paulsens Gold Mine produced
86,522 ounces for the year.
12. The Company achieved a safety record of 452 LTI free days (to date) from the Paulsens Mine operations.
6. Consolidated cash on hand of
$16,574,000 at end of year
MINERAL RESOURCES INCREASED TO 935,000
OUNCES
13. Feasibility study to upgrade the milling capacity at Paulsens underway.
7. Cash flow from mining operations
of $77,543,000 for the year
14. The Board approved a budget of $20 million for exploration across its tenements
Review of Operations
4 | Northern Star Resources Ltd
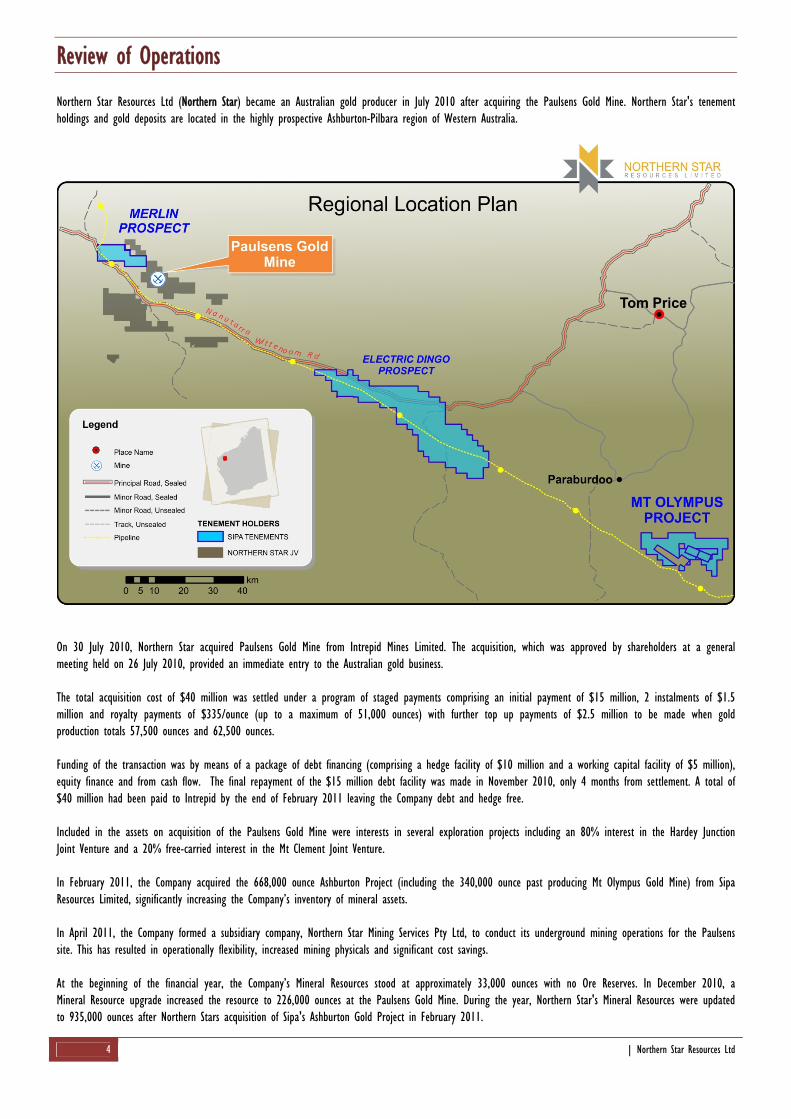
Northern Star Resources Ltd (Northern Star) became an Australian gold producer in July 2010 after acquiring the Paulsens Gold Mine. Northern Star's tenement holdings and gold deposits are located in the highly prospective Ashburton-Pilbara region of Western Australia.
On 30 July 2010, Northern Star acquired Paulsens Gold Mine from Intrepid Mines Limited. The acquisition, which was approved by shareholders at a general meeting held on 26 July 2010, provided an immediate entry to the Australian gold business. The total acquisition cost of $40 million was settled under a program of staged payments comprising an initial payment of $15 million, 2 instalments of $1.5 million and royalty payments of $335/ounce (up to a maximum of 51,000 ounces) with further top up payments of $2.5 million to be made when gold production totals 57,500 ounces and 62,500 ounces. Funding of the transaction was by means of a package of debt financing (comprising a hedge facility of $10 million and a working capital facility of $5 million), equity finance and from cash flow. The final repayment of the $15 million debt facility was made in November 2010, only 4 months from settlement. A total of $40 million had been paid to Intrepid by the end of February 2011 leaving the Company debt and hedge free. Included in the assets on acquisition of the Paulsens Gold Mine were interests in several exploration projects including an 80% interest in the Hardey Junction Joint Venture and a 20% free-carried interest in the Mt Clement Joint Venture. In February 2011, the Company acquired the 668,000 ounce Ashburton Project (including the 340,000 ounce past producing Mt Olympus Gold Mine) from Sipa Resources Limited, significantly increasing the Company’s inventory of mineral assets. In April 2011, the Company formed a subsidiary company, Northern Star Mining Services Pty Ltd, to conduct its underground mining operations for the Paulsens site. This has resulted in operationally flexibility, increased mining physicals and significant cost savings. At the beginning of the financial year, the Company’s Mineral Resources stood at approximately 33,000 ounces with no Ore Reserves. In December 2010, a Mineral Resource upgrade increased the resource to 226,000 ounces at the Paulsens Gold Mine. During the year, Northern Star's Mineral Resources were updated to 935,000 ounces after Northern Stars acquisition of Sipa's Ashburton Gold Project in February 2011.
Re
As aNortincr
Cash
Prod 1. Cas
* Ave
HeaThe to atime Spec
Injumin
eview of O
5
at 30 June 2011thern Star as oneease on the 2010
h Cost 1 A$/oz
duction oz
sh costs include all ope
erage Cash cost since a
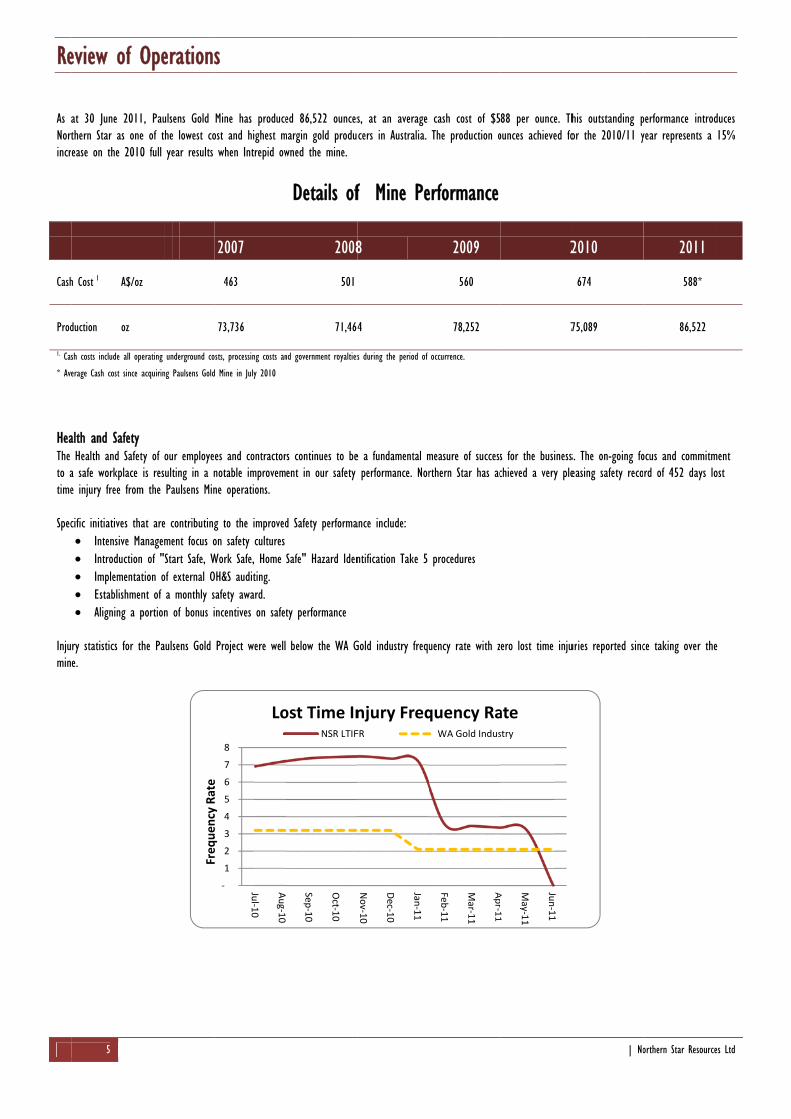
alth and Safety Health and Safetya safe workplace e injury free from
cific initiatives tha Intensive Ma Introduction Implementat Establishmen Aligning a p
ry statistics for the.
Operation
, Paulsens Gold e of the lowest co0 full year results
erating underground co
acquiring Paulsens Gold
y of our employeis resulting in a n
m the Paulsens Min
at are contributinganagement focus o of "Start Safe, Wtion of external Ont of a monthly sportion of bonus i
he Paulsens Gold
Frequency
Rate
s
Mine has produceost and highest m when Intrepid ow
2007
463
73,736
osts, processing costs an
d Mine in July 2010
es and contractornotable improvemne operations.
g to the improvedon safety cultures Work Safe, Home OH&S auditing. safety award. incentives on safet
Project were well
‐
1
2
3
4
5
6
7
8
Jul‐1
0
Aug‐1
0
Frequency Rate
Lo
ed 86,522 ouncesmargin gold produwned the mine.
Details of
2008
501
71,464
nd government royalties
rs continues to beent in our safety
d Safety performa Safe" Hazard Iden
ty performance
below the WA G
Sep‐10
Oct‐1
0
ost Time InNSR LTIF
s, at an average cers in Australia.
f Mine Pe
8
4
s during the period of
e a fundamental m performance. Nor
ance include:
ntification Take 5
Gold industry frequ
Nov‐1
0
Dec‐1
0
Jan‐11
njury FreqFR
cash cost of $5The production o
erformance
2009
560
78,252
occurrence.
measure of successrthern Star has ac
procedures
uency rate with z
Feb‐11
Mar‐1
1
Apr‐1
1
quency RaWA Gold Indus
88 per ounce. Thounces achieved fo
2
7
s for the businesschieved a very ple
ero lost time inju
A11
May‐1
1
Jun‐11
atestry
| No
his outstanding por the 2010/11 y
2010
674
75,089
s. The on-going foeasing safety reco
uries reported sinc
orthern Star Resource
performance introdyear represents a
2011
588*
86,522
ocus and commitmrd of 452 days lo
ce taking over the
es Ltd
duces 15%
ment ost
e

Re
FinaNorttotaSinc Othe The 1. I2. W Expto ato tin toper Depfinaof m The
The Pausom In tof oat c
$Million
eview of O
6
ancial Performathern Star movedalled $114,925,000ce acquiring Paulse
er revenue of $33
royalty expense f
ntrepid Mines proWA State Governm
loration expensed accounting for expthe extent that ththe area have notrations are contin
reciation and amncial year which mine development
cash on hand at
net assets of thlsens site and str
me of the undergro
the past 12 montother opportunitiecash costs of appr
0
10
20
30
40
Jun‐10 S
$Million
Operation
ance d from an explora0 predominately fens Gold Mine in
31,000 comprised
for the year of $
oduction royalty ament ($2,743,000)
in the income stploration costs pehey are expected t yet reached a nuing.
mortisation of fixereflects the purch costs totalled $1
30 June 2011 w
he Company haverong gold sales anound mining fleet
ths the Company es that may arise.roximately $620 p
ep‐10 Dec‐10
B
Actual
s
ation company tofrom gold sales a July 2010, averag
mainly of interes
24,828,000 can b
s part of the sale)
tatement in the yermits capitalisatioto be recouped tstage which perm
ed assets and cahase and acquisiti8,853,000 this w
was $16,574,000 (
e increased by $2nd high prices re and motor vehic
has achieved an . Northern Star foper ounce maintai
Mar‐11 Jun‐11
Bank Balance
Estimate
o a gold producend an average sage cash costs wer
st earned during t
be broken up into
e agreement ($22,
year was $767,00on of expenditurethrough the succemits a reasonable
apitalised mine deion of $16,545,00as attributable to
(2010 $1,095,000
21,043,000 on thsulting in surplus les.
outstanding resulorecasts calendar ining Northern Sta
Sep‐11 Dec‐11
er following the pales price of $1,36re $588 per ounc
the year.
o two categories:-
,085,000)
00 with total exple where there is aessful developmentassessment of th
evelopments total00 of property pl mine developmen
0).
he previous year cash flows. Borr
t in its operationyear 2011 gold par's position as on
1 Mar‐12
purchase of Pauls67 per ounce. Groe.
loration expenditua viability of eacht of the area of e existence or ot
lled $24,424,000.lant and equipment at Paulsens.
due mainly to towings have incre
nal performance aproduction of 75,ne of Australia's l
ens during the fioss mine operatin
ure totalling $5,29h area of interestinterest (or alternherwise of econom
. Depreciation of nt and an assessm
the acquisition of eased by $4,089,0
nd restructuring o000 ounces generowest cost and h
| No
inancial year. Revng profit for the y
94,000. The compt. Such costs arenatively by its salmically recoverabl
f fixed assets wament of their use
f the assets from000 due to the e
of its business unrating surplus cashighest margin gol
orthern Star Resource
venue from operayear was $72,692
pany policy in rele only carried fore), or where actile reserves, and a
s $5,570,000 foreful lives. Amortis
m the purchase ofequipment financin
nits to take advansh flow of $40 mld producers.
es Ltd
ations ,000.
ation rward vities active
r the ation
f the ng of
ntage million

Review of Operations
7 | Northern Star Resources Ltd
Operations Current gold production is from the Paulsens mine. As at 30 June 2011, Paulsens mine has produced 86,522 ounces.
Details of 2011 Production Performance
FY 2011 Sep Qtr Dec Qtr Mar Qtr Jun Qtr
Underground Ore Mined 250,885 69,795 65,633 57,703 57,754 Grade g/t 10.40 12.70 8.60 10.60 9.70 Contained Ounces 84,267 28,464 18,236 19,626 17,941
Ore Milled 287,072 80,976 59,821 69,882 76,393 Grade g/t 10.0 12.1 9.4 9.4 8.7 Recovery % 94.1 96.5 92.7 92.3 93.6
Gold Production oz 86,522 30,329 16,741 19,380 20,072 Ore mined to date is positive in reference to the Mineral Resource Statement. Project Development Northern Star is currently undertaking a feasibility study to upgrade the milling capacity at Paulsens. It is expected that this project will commence in first quarter of 2012. Feed for the mill is expected to come from Voyager 1, Paulsens upper levels, Voyager 2, Paulsens open pit and the Ashburton free milling Project.
EXPLORATION Paulsens in Mine Drilling Exploration at Paulsens has been focused on the ore body extensions of the Voyager 1 Lode and the new high grade discovery of the Voyager 2 mineralisation. Drilling totalled 215 drill holes for 30,200 metres with two drill rigs running continuously underground since November 2010. Ashburton Group Geological review and exploration defined geological drill targets, with a focus on the historic Mt. Olympus gold mining centre 50km southeast of Paraburdoo. The first phase of reverse circulation drilling was completed at the Peake Prospect (32 drill holes for 5,209m), which intercepted high grade gold intercepts down dip, down plunge and along strike from the existing Peake Open Pit. A Reverse Circulation drilling at the Mt. Olympus Prospect (8 drill holes for 775m) also intercepted high gold grades along the Zoe fault system, beneath the existing Mt. Olympus Open pit. Metallurgical test work underway on transitional and fresh sulphide zones. Paulsens Group Since purchasing the Paulsens Gold Project in 2010, a full scale geological review was undertaken in the region in association with a highly detailed aeromagnetic survey being completed (50m line spacing, 17,000 line kilometres). Geophysical interpretation generated a large number of exploration targets, which are being systematically field validated. Geological review and field programs have also defined new drill targets both regionally and in close proximity to the Paulsens Gold Mine. Cheroona Group The Cheroona Project is located just 80km southwest of Sandfire Resources DeGrussa Cu-Au deposit, in a similar geological setting. The tenements have had limited historic exploration on them. Northern Star completed a rock chip program where assays returned anomalous gold results up to 8g/t gold. This confirmed the prospectively of the area and is drill ready on 2 walk-up drill targets. A VTEM survey (200m line spacing, 750 line kilometres) and an Aeromagnetic survey (50m line spacing, 6,800 line kilometres) were also completed. Geophysical targets have been generated from both these surveys and field validation is now underway.

Review of Operations
8 | Northern Star Resources Ltd
Mineral Resources The Mineral Resource for the company has increased substantially through the acquisition of the Paulsens gold mine and Ashburton gold project.
Details of 2011 Mineral Resource Performance
GOLD MINERAL RESOURCES 1
As at December 31, 2010
MEASURED (M) INDICATED (I) INFERRED TOTAL
MEASURED/INDICATED/ INFERRED
Tonnes Grade Ounces Tonnes Grade Ounces Tonnes Grade Ounces Tonnes Grade Ounces Based on attributable ounces
(000's) (g/t) (000's) (000's) (g/t) (000's) (000's) (g/t) (000's) (000's) (g/t) (000's) Cut Off Grade
PAULSENS GOLD PROJECT Surface
Paulsens
- - -
471 2.9 43
200 3.3 21
671 3.0 64
1.2 g/t Au
Mt Clement (20%)
- - -
105 2.4 8
- - -
105 2.4 8
1.0 g/t Au
Underground
Upper Paulsens
- - -
110 7.5 27
23 5.0 4
133 7.1 30
3 g/t Au
Voyager 1
- - -
230 9.9 73
234 6.3 47
464 8.1 121
3 g/t Au
Stockpiles
- - 7
- - -
- - -
- - 7
Gold in Circuit - - 4
- - -
- - -
- - 4
ASHBURTON GOLD PROJECT Surface
Mt Olympus 1,512 2.700 129
1,412 2.6 119
4,221 3.1 420
7,145 2.9 668
0.9 g/t Au
-
KIMBERLEY PROJECT Surface
Golden Crown - - -
323 3.3 33
- - -
323 3.2 33
1.0 g/t Au
TOTAL 1,512 0.093 140
2,651 3.6 303
4,678 3.3 492
8,841 3.3 935
1Resources are exclusive of Reserves and do not have demonstrated economic viability. Resources for Ashburton Gold Project acquired February 2011 Competent Persons Statements The information that relates to Exploration Results, Mineral Resources or Ore Reserves in the ‘Exploration’ section of this annual report is based on information compiled by Mr Jason Boladeras, who is Exploration Manager for Northern Star Resources, a Member of the Australian Institute of Geoscientists and is employed by Geoarc Pty Ltd. The information that relates to Exploration Results, Mineral Resources or Ore Reserves in the ‘Operations’ section of this annual report is based on information compiled by or under the supervision of Brook Ekers, Member AIG, who is a full-time employee of Northern Star Resources Ltd. Mr Boladeras and Mr Ekers have sufficient experience which is relevant to the style of mineralisation and type of deposit under consideration and to the activity which each is undertaking to qualify as a Competent Person as defined in the 2004 Edition of the ‘Australasian Code for Reporting of Exploration Results, Mineral Resources and Ore Reserves’. Mr Boladeras and Mr Ekers consent to the inclusion in the report of the matters based on their information in the form and context in which it appears. Forward Looking Statements Some of the information contained in the Annual Report has been obtained from third parties and has not been independently verified by Northern Star. In particular the financial projections model on which the forward looking statements included in the Annual Report have not been prepared by the Company and the Company has not undertaken any verification of the model. The Company takes no responsibility and is not liable for the projections in any way. Given the risks and uncertainties that may cause the Company’s actual future results, performance or achievements to be materially different from that expected, expressed or implied the forward looking statements included in this report, undue reliance should not be placed on these statements. Nothing contained in this Annual Report is a promise or representation as to the future. No assurance or representation is made by any person that any forecast or projection will be achieved. Accordingly, investors must make their own investigations and inquiries regarding all assumptions, uncertainties and contingencies, which may affect the future operations of the Company.

Review of Operations
9 | Northern Star Resources Ltd
CORPORATE
Northern Star raised approximately $4 million in equity to fund the purchase of Paulsens along with a financing facility of $15 million, repaid in November 2010. The Ashburton project was purchased for nil consideration up front, with a trailing royalty of 1.75% after the production of the first 250,000 ounces and replacement of a performance bond facility of $525,000. Northern Star Mining Services Pty Ltd was set up as a wholly owned subsidiary of Northern Star Resources Ltd and tasked with the underground mining at Paulsens. The majority of the underground equipment from the previous underground contractor was purchased ensuring a seamless transition to owner miner.

Report of the Directors 2011
10 | Northern Star Resources Ltd
Your Director’s submit their report for the year ended 30 June 2011.
DIRECTORS The Directors in office at the date of this report and at any time during the financial year are as follows. Directors were in office for the entire year unless otherwise stated. Christopher K G Rowe Chairman William J (Bill) Beament Managing Director Peter C P Farris Director Michael G Fotios Director
INFORMATION ON DIRECTORS Christopher Kenneth George Rowe BA, MA Economics and Law (Chairman) Age 67 Mr Rowe has practised as a lawyer both in the United Kingdom and in Western Australia before becoming a full time consultant to the mining and oil and gas industry. He has been chairman or deputy chairman of a number of public listed mining and oil and gas related companies in Australia and North America holding both executive and non-executive positions. Special Responsibilities Member of nomination and remuneration committees Member of audit committee. Other Current Directorships of Listed Companies Target Energy Ltd (chairman from January 2010) Former Directorships of Listed Companies in last three years Tangiers Petroleum Ltd (from April 2008 to October 2010) Bill Beament BEng-Mining (Hons) (Managing Director) Age 36 Mr Beament is a mining engineer with more than 15 years’ experience in the resource sector in mine management including several senior management positions, including General Manager of the Eloise Copper Mine in Queensland and Operations manager for Barminco Limited with overall responsibility for 12 mine sites across Western Australia. Special Responsibilities Member of nomination committee. Other Current Directorships of Listed Companies None Former Directorships of Listed Companies in last three years None

Report of the Directors 2011
11 | Northern Star Resources Ltd
Peter Charles Farris Diploma Business Perth Tech, Diploma Business RMIT, MAICD (Non-executive Director) Age 66 Mr Farris is a well-respected and highly credentialed businessman in the Perth real estate industry and corporate advisory services. He has managed and developed major real estate companies with turnovers in excess of $200 million and has extensive experience in company management. Special Responsibilities Member of nomination and remuneration committees Member of audit committee. Other Current Directorships of Listed Companies None Former Directorships of Listed Companies in last three years None Michael George Fotios BSc (Hons) MAusIMM (Non-executive Director) Age 49 Mr Fotios has qualifications in Geology specialising in Economic Geology with extensive experience in exploration throughout Australia working with gold, base metals, tantalum, tin and nickel from exploration to feasibility over the last 26 years. He previously held positions with Homestake Australia Limited and Sons of Gwalia Limited. Special Responsibilities Member of nomination and remuneration committees Member of audit committee. Other Current Directorships of Listed Companies Pegasus Metals Limited (from December 2009) Former Directorships of Listed Companies in last three years Galaxy Resources Limited (April 2006 to December 2008)
MEETINGS OF THE COMPANY’S DIRECTORS The number of meetings of the Company’s Directors held during the year ended 30 June 2011, and the numbers of meetings attended by each Director were: Board of Directors Audit Committee Remuneration Committee Nomination Committee Attended Held Attended Held Attended Held Attended Held Christopher Rowe 7 9 2 2 1 1 1 1 Bill Beament 9 9 N/A* N/A* N/A* N/A* 1 1 Peter Farris 9 9 2 2 1 1 1 1 Michael Fotios 9 9 2 2 1 1 1 1 * Not a member of the relevant committee
Report of the Directors 2011
12 | Northern Star Resources Ltd
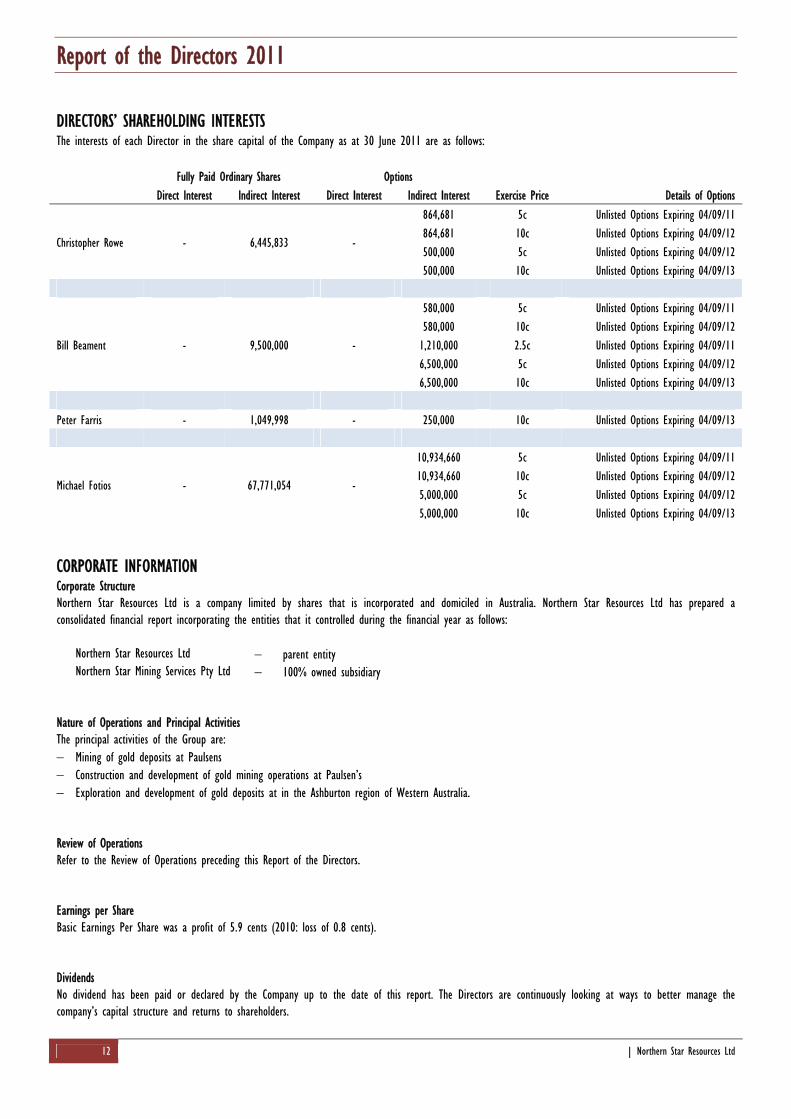
DIRECTORS’ SHAREHOLDING INTERESTS The interests of each Director in the share capital of the Company as at 30 June 2011 are as follows: Fully Paid Ordinary Shares Options Direct Interest Indirect Interest Direct Interest Indirect Interest Exercise Price Details of Options
Christopher Rowe - 6,445,833 -
864,681 5c Unlisted Options Expiring 04/09/11 864,681 10c Unlisted Options Expiring 04/09/12 500,000 5c Unlisted Options Expiring 04/09/12 500,000 10c Unlisted Options Expiring 04/09/13
Bill Beament - 9,500,000 -
580,000 5c Unlisted Options Expiring 04/09/11 580,000 10c Unlisted Options Expiring 04/09/12 1,210,000 2.5c Unlisted Options Expiring 04/09/11 6,500,000 5c Unlisted Options Expiring 04/09/12 6,500,000 10c Unlisted Options Expiring 04/09/13
Peter Farris - 1,049,998 - 250,000 10c Unlisted Options Expiring 04/09/13
Michael Fotios - 67,771,054 -
10,934,660 5c Unlisted Options Expiring 04/09/11 10,934,660 10c Unlisted Options Expiring 04/09/12 5,000,000 5c Unlisted Options Expiring 04/09/12 5,000,000 10c Unlisted Options Expiring 04/09/13
CORPORATE INFORMATION Corporate Structure Northern Star Resources Ltd is a company limited by shares that is incorporated and domiciled in Australia. Northern Star Resources Ltd has prepared a consolidated financial report incorporating the entities that it controlled during the financial year as follows:
Northern Star Resources Ltd parent entity Northern Star Mining Services Pty Ltd 100% owned subsidiary
Nature of Operations and Principal Activities The principal activities of the Group are: Mining of gold deposits at Paulsens Construction and development of gold mining operations at Paulsen’s Exploration and development of gold deposits at in the Ashburton region of Western Australia. Review of Operations Refer to the Review of Operations preceding this Report of the Directors. Earnings per Share Basic Earnings Per Share was a profit of 5.9 cents (2010: loss of 0.8 cents). Dividends No dividend has been paid or declared by the Company up to the date of this report. The Directors are continuously looking at ways to better manage the company’s capital structure and returns to shareholders.
Report of the Directors 2011
13 | Northern Star Resources Ltd
Financial Position The Group did not have any controlled entities prior to 30 June 2010. Accordingly, the Group does not have any 30 June 2010 comparative financial information. 30 June 2010 comparative financial information for the Parent Company is shown instead. The Group reported a net profit for the year of $20,016,000 (2010: loss of $1,281,000). The net assets of the group have increased by $21,043,000 from 30 June 2010 to $26,127.000 in 2011. The major movements were: Share issues raising $4,957,000 after expenses; Inventory of $4,812,000; and Property, plant and equipment of $10,960,000. The Group’s working capital, being current assets less current liabilities was $11,432,000 in 2011 compared to $542,000 in 2010. During the past year, the Company has invested in additional gold resource assets and joint venture operations to increase its asset base. The Company will continue its policy of adding to its resource base. The Directors believe the Company is in a strong and stable position to expand and grow its current operations.
SIGNIFICANT CHANGES IN STATE OF AFFAIRS During the financial year, the Company: (i) Acquired from Intrepid Mines Limited, the Paulsens Gold Mine in Western Australia's Pilbara region on 30 July 2010. (ii) Acquisition interests in several exploration projects including an 80% interest in the Hardey Junction Joint Venture and a 20% free-carried interest in
the Mt Clement Joint Venture. (iii) The Company entered into an option agreement to acquire the Ashburton Project from Sipa Exploration NL on 17 February 2011. (iv) The Company formed a subsidiary Company, Northern Star Mining Services Pty Ltd, to conduct its underground mining operations for the Paulsens site in
April 2011. These matters are described in further details above under Review of Operations.
FUTURE DEVELOPMENTS, PROSPECTS AND BUSINESS STRATEGIES Refer to the Review of Operations preceding this Report of the Directors.
MATTERS SUBSEQUENT TO THE END OF THE FINANCIAL YEAR There are no other matters or circumstances other than the future development of the production site that have arisen since 30 June 2011 that have or may significantly affect the operations, results, or state of affairs of the Group in future financial years, except for the following. On 28 July 2011 93,332 options were exercised at 5c per option and 246,666 options were exercised at 10c per option on this date. On 16 August 2011, 2,781,290 options were exercised at 5c per option, 121,167 options were exercised at 10c per option and 1,210,000 options were exercised at 2.5c per option on this date. On 25 August 2011, 333,334 options were issued at an issue price of 35c per share, 333,333 options were issued at an issue price of 50c per share and 333,333 options were issued at an issue price of 65c per share. In addition to this, 13,700,466 options were exercised at 5c per option, 12,294,655 options were exercised at 10c per option and 11,500,000 options were exercised at 5c per option, 250,000 options were exercised at 10c per option and 500,000 options were exercised at 20c per option on this date. On 4 September 2011 235,426 options lapsed unexercised on this date. On 8 September 2011, 1,041,507 options were exercised at 5c per option and 568,293 options were exercised at 10c per option on this date.
Report of the Directors 2011
14 | Northern Star Resources Ltd
ENVIRONMENTAL REGULATION AND PERFORMANCE The Company holds licences and abides by Acts and Regulations issued by the relevant mining and environmental protection authorities. The Company has a policy of at least complying with, but in most cases exceeding, its statutory environmental performance obligations. These licences, Acts and Regulations specify limits and regulate the management of various environmental management issues, including discharges to the air, surface water and groundwater associated with the Company’s mining operations as well as the storage and use of hazardous materials. All environmental performance obligations are monitored by the Board and subjected from time to time to Government agency audits and site inspections. No environmental breaches have occurred or have been notified by any Government agencies during the year ended 30 June 2011.
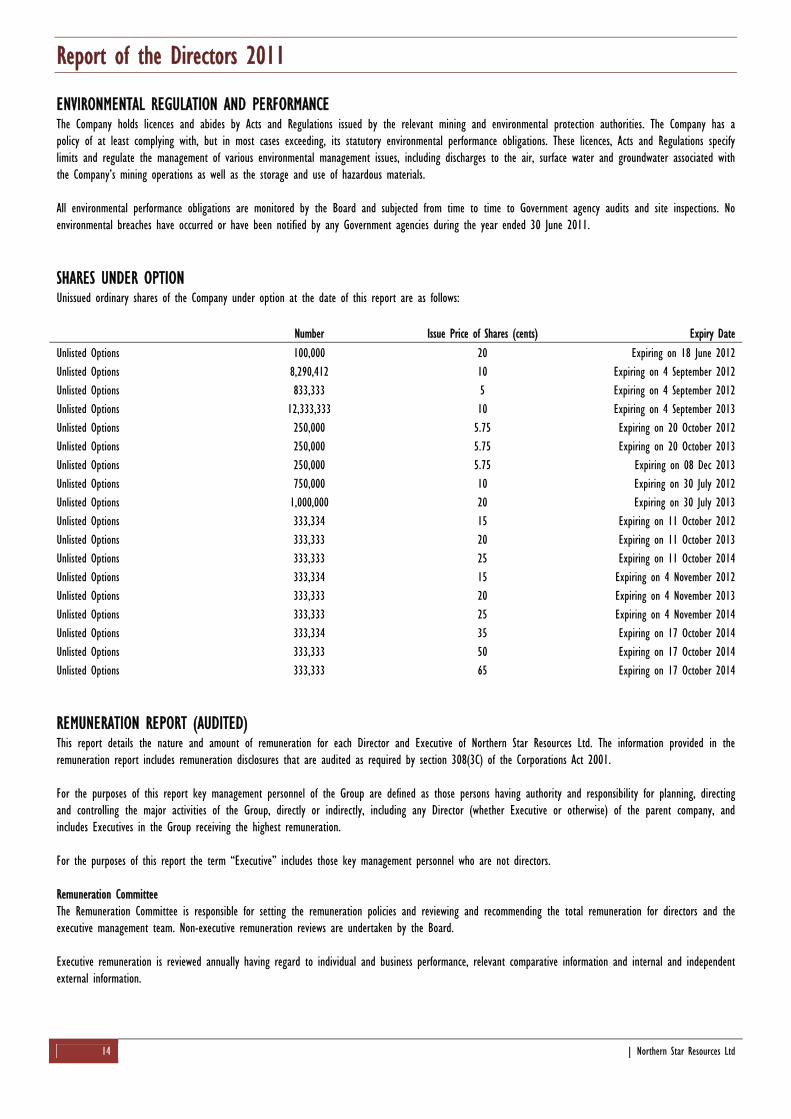
SHARES UNDER OPTION Unissued ordinary shares of the Company under option at the date of this report are as follows: Number Issue Price of Shares (cents) Expiry Date Unlisted Options 100,000 20 Expiring on 18 June 2012 Unlisted Options 8,290,412 10 Expiring on 4 September 2012 Unlisted Options 833,333 5 Expiring on 4 September 2012 Unlisted Options 12,333,333 10 Expiring on 4 September 2013 Unlisted Options 250,000 5.75 Expiring on 20 October 2012 Unlisted Options 250,000 5.75 Expiring on 20 October 2013 Unlisted Options 250,000 5.75 Expiring on 08 Dec 2013 Unlisted Options 750,000 10 Expiring on 30 July 2012 Unlisted Options 1,000,000 20 Expiring on 30 July 2013 Unlisted Options 333,334 15 Expiring on 11 October 2012 Unlisted Options 333,333 20 Expiring on 11 October 2013 Unlisted Options 333,333 25 Expiring on 11 October 2014 Unlisted Options 333,334 15 Expiring on 4 November 2012 Unlisted Options 333,333 20 Expiring on 4 November 2013 Unlisted Options 333,333 25 Expiring on 4 November 2014 Unlisted Options 333,334 35 Expiring on 17 October 2014 Unlisted Options 333,333 50 Expiring on 17 October 2014 Unlisted Options 333,333 65 Expiring on 17 October 2014
REMUNERATION REPORT (AUDITED) This report details the nature and amount of remuneration for each Director and Executive of Northern Star Resources Ltd. The information provided in the remuneration report includes remuneration disclosures that are audited as required by section 308(3C) of the Corporations Act 2001. For the purposes of this report key management personnel of the Group are defined as those persons having authority and responsibility for planning, directing and controlling the major activities of the Group, directly or indirectly, including any Director (whether Executive or otherwise) of the parent company, and includes Executives in the Group receiving the highest remuneration. For the purposes of this report the term “Executive” includes those key management personnel who are not directors. Remuneration Committee The Remuneration Committee is responsible for setting the remuneration policies and reviewing and recommending the total remuneration for directors and the executive management team. Non-executive remuneration reviews are undertaken by the Board. Executive remuneration is reviewed annually having regard to individual and business performance, relevant comparative information and internal and independent external information.

Report of the Directors 2011
15 | Northern Star Resources Ltd
A. PRINCIPLES USED TO DETERMINE THE NATURE AND AMOUNT OF REMUNERATION Remuneration Philosophy The performance of the Company depends upon the quality of its Directors and Executives. To prosper, the Company must attract, motivate and retain highly skilled Directors and Executives. To this end, the Company embodies the following principles in its remuneration framework: provide competitive rewards to attract high calibre Executives; link Executive rewards to shareholder value; and establish appropriate performance hurdles in relation to variable Executive remuneration. Remuneration Structure In accordance with best practice corporate governance, the structure of Non-executive Director and executive management remuneration is separate and distinct. Non-executive Director Remuneration Objective The Board seeks to set aggregate remuneration at a level which provides the Company with the ability to attract and retain Directors of the highest calibre, whilst incurring a cost which is acceptable to shareholders. Structure Non-executive Directors’ fees are paid within an aggregate limit (currently $150,000 per annum) which is approved by the shareholders from time to time. Retirement payments, if any, are agreed to be determined in accordance with the rules set out in the Corporations Act as at the time of the Director’s retirement or termination. Non-executive Directors’ remuneration may include an incentive portion consisting of bonuses and/or equity based remuneration, as considered appropriate by the Board, which may be subject to shareholder approval in accordance with ASX listing rules. Any option incentive portion is targeted to add to shareholder value by having a strike price considerably greater than the market price at the time of granting. The amount of aggregate remuneration sought to be approved by shareholders and the manner in which it is apportioned amongst Directors is reviewed annually. The Board considers the amount of Director fees being paid by comparable companies with similar responsibilities and the experience of the Non-executive Directors when undertaking the annual review process. Executive Director and Senior Executive Remuneration Objective The Company aims to reward Executives with a level and mix of remuneration commensurate with their position and responsibilities within the Company and so as to: reward Executives for company, and individual performance; ensure continued availability of experienced and effective management; and ensure total remuneration is competitive by market standards. Structure In reviewing the level and make-up of Executive total remuneration, the Remuneration Committee ensures remuneration reflects the market salary for a position and individual of comparable responsibility and experience. Remuneration is compared with the external market by participation in industry salary surveys and during recruitment activities generally. If required, the Remuneration Committee may engage an external consultant to provide independent advice in the form of a written report detailing market levels of remuneration for comparable Executive roles. Total remuneration consists of a fixed remuneration and a long term incentive portion (equity based remuneration and/or bonuses) as considered appropriate. Fixed Remuneration - Objective The level of fixed remuneration is set so as to provide a base level of remuneration which is both appropriate to the position and is competitive in the market. Fixed remuneration is reviewed annually and the process consists of a review of Company and individual performance, and relevant comparative remuneration in the market. Fixed Remuneration - Structure The fixed remuneration is a base salary plus super or monthly consulting fee. Variable Pay — Long Term Incentives - Objective The objective of long term incentives is to reward Executives in a manner which aligns this element of remuneration with the creation of shareholder wealth.

Report of the Directors 2011
16 | Northern Star Resources Ltd
Variable Pay — Long Term Incentives – Structure Long term incentives granted to Executives are in the form of share based remuneration, e.g. options or performance shares. These incentives granted are aimed to motivate Executives to pursue the long term growth and success of the Company within an appropriate control framework and demonstrate a clear relationship between key Executive performance and remuneration. Executive Director options are granted at the discretion of the Board as recommended by the Remuneration Committee and approved by shareholders. The Executive Management Team are granted options under Northern Star’s employee incentive scheme as recommended by the Remuneration Committee. Performance hurdles are not attached to vesting periods; however the Remuneration Committee determines appropriate vesting periods to provide rewards over a period of time to the recipients. Bonus plan As part of the Executive remuneration package, bonuses may be granted based on the achievement of agreed milestones set by the Remuneration Committee. The intention of this program is to facilitate goal congruence between Executives with that of the Company’s business and shareholders. The milestones are set with a certain level of consultation with Executives to ensure buy-in. The measures are specifically tailored to the areas each Executive is involved in and has a level of control over. The milestones target areas covering financial and non-financial as well as short and long-term goals. The level set for each milestone is based on budgeted figures for the Company and respective industry standards. Performance in relation to the milestones is assessed annually, with bonuses being awarded depending on the number of the milestones achieved. Following the assessment, the milestones are reviewed by the Remuneration Committee in light of the desired and actual outcomes, and their efficiency is assessed in relation to the Company’s goals and shareholder wealth, before the milestones are set for the following year. Bonuses may also be granted at discretion of the Board to reward performance. B. SERVICE AGREEMENTS Remuneration and other terms of employment for the executive directors are also formalised in service agreements. Each of these agreements provide for the provision of performance related cash bonuses, director options and participation, when eligible, in the Northern Star Resources Ltd Employee Incentive scheme. Bill Beament entered into a contract to provide services by way of consultancy at a daily rate of $1,250 for service rendered. The agreement was terminated on the 1 February 2011 when Bill Beament became an employee of the company. C. DETAILS OF REMUNERATION Directors The following persons were Directors of Northern Star Resources Ltd during the financial year: Christopher K G Rowe Chairman Bill Beament Managing Director Peter C P Farris Director Michael G Fotios Director Other Key Management Personnel (employees and consultants) Karen Elizabeth Vere Brown Company Secretary There were no other persons that fulfilled the role of a key management person, other than those disclosed as Directors.

Report of the Directors 2011
17 | Northern Star Resources Ltd
Remuneration of Key Management Personnel Details of the remuneration of each Director and named Executive Officer of the Company, including their personally-related entities, during the year was as follows: Salary / consulting
fees Cash
Bonus Directors
Fees Super Options Total Remuneration consisting of options
during the year Year $ $ $ $ $ $ % Directors Christopher Rowe 2011 62,150 - - - 3,309 65,459 5.06% 2010 36,958 - - - 13,155 50,113 26.25% Bill Beament 2011 380,675# 28,026 - 12,500 43,014 464,215 9.27% 2010 274,986# - - 2,187 171,020 448,193 38.16% Peter Farris 2011 60,898 - - - 4,396 65,294 6.73% 2010 28,292 - - 625 7,274 36,191 20.10% Michael Fotios 2011 36,667 - - - 33,088 69,755 47.43% 2010 24,313 - - - 131,554* 155,867 84.40% Notes: * Options were issued to Delta Resources Pty Ltd, a company with which Mr Fotios is associated. # Amount includes allowances to cover Mr Beament’s statutory salary on-costs and insurances Salary / consulting
fees Cash
Bonus Directors
Fees Super Options Total Remuneration consisting of options
during the year Year $ $ $ $ $ $ % Key Management Personnel Karen Brown 2011 33,000 - - - 2,206 35,206 6.27% 2010 31,750 - - - 8,770 40,520 21.64% Performance hurdles are not attached to remuneration options; however the Board determines appropriate vesting periods to provide rewards over a period of time to key management personnel. D. SHARE-BASED COMPENSATION No options were granted as equity compensation benefits to key management personnel. During the year, 2,000,000 options belonging to Bill Beament lapsed. This is the end of the audited remuneration report.
INDEMNIFICATION AND INSURANCE OF OFFICERS The Company has paid a premium to insure the Directors and Officers of the Company and its controlled entities. Details of the premium are subject to a confidentiality clause under the contract of insurance. The liabilities insured are costs and expenses that may be incurred in defending civil or criminal proceedings that may be brought against the officers in their capacity as officers of entities in the group.
AUDITOR INDEPENDENCE The auditor’s independence declaration for year ended 30 June 2011 under s307C of the Corporations Act 2001 has been received and can be found after the Corporate Governance Statement.
NON-AUDIT SERVICES No other services were provided by the auditor.
Re
ROThe avai
COIn rthe Sign
Bill ManPert26
eport of t
18
UNDING amounts containilable to the Com
RPORATE GOVrecognising the neprinciples of corp
ned in accordance
Beament naging Director th, Western AustraSeptember 2011
the Direct
ed in this report pany under ASIC
VERNANCE eed for the higheporate governance
with a resolution
alia
tors 2011
and in the finanClass Order 98/01
st standards of c. The Company’s
n of the Directors.
ncial statements h100. The Company
orporate behaviouCorporate Governa
.
ave been roundedy is an entity to
ur and accountabiance Statement is
d to the nearest which the Class O
ility, the Directorss contained in the
$1,000 (where roOrder applies.
s of Northern Stae following section
| No
ounding is applica
ar Resources Ltd sn of this report.
orthern Star Resource
able) under the o
support and adhe
es Ltd
ption
re to

Corporate Governance Statement 2011
19 | Northern Star Resources Ltd
INTRODUCTION Northern Star Resources Limited (Company) has adopted systems of control and accountability as the basis for the administration of corporate governance. Some of these policies and procedures are summarised in this statement. Commensurate with the spirit of the ASX Corporate Governance Council's Corporate Governance Principles and Recommendations 2nd edition (Principles & Recommendations), the Company has followed each recommendation where the Board has considered the recommendation to be an appropriate benchmark for its corporate governance practices. Where the Company's corporate governance practices follow a recommendation, the Board has made appropriate statements reporting on the adoption of the recommendation. In compliance with the "if not, why not" regime, where, after due consideration, the Company's corporate governance practices depart from a recommendation, the Board has offered full disclosure and an explanation for the adoption of its own practice. Further information about the Company's corporate governance practices may be found on the Company's website at www.nsrltd.com, under the section marked "Corporate - Corporate Governance". The Company reports below on how it has followed (or otherwise departed from) each of the Principles & Recommendations during the 2010/2011 financial year (Reporting Period). The Principles & Recommendations were amended in 2010, and these amendments apply to the Company's first financial year commencing on or after 1 January 2011. Accordingly, disclosure against the Principles & Recommendations as amended in 2010 will be made in relation to the Company's financial year ending 30 June 2012. The report below is made against the Principles and Recommendations prior to their amendment in 2010.
BOARD Roles and responsibilities of the Board and Senior Executives (Recommendations: 1.1, 1.3) The Company has established the functions reserved to the Board, and those delegated to senior executives and has set out these functions in its Statement of Board and Management Functions. The Board is collectively responsible for promoting the success of the Company through its key functions of ensuring the Company is properly managed, providing overall corporate governance of the Company, monitoring the financial performance of the Company, engaging appropriate management, involvement in the development of corporate strategy and performance objectives, and supervising the Company’s framework of control and accountability systems to enable risk to be assessed and managed and monitoring and ensuring compliance with all of the Company’s legal obligations. Senior executives are responsible for supporting the Managing Director in implementing the running of the general operations and financial business of the Company, in accordance with the delegated authority of the Board. Senior executives are responsible for reporting all matters which fall within the Company's materiality thresholds at first instance to the Managing Director or, if the matter concerns the Managing Director, directly to the Chair or the lead independent director, as appropriate. The Company's Statement of Board and Management Functions is available on the Company's website. Skills, experience, expertise and period of office of each Director (Recommendation: 2.6) A profile of each Director setting out their skills, experience, expertise and period of office is set out in the Directors' Report. Director independence (Recommendations: 2.1, 2.2, 2.3, 2.6) The Board does not have a majority of directors who are independent. The Board considers that its current size and composition has been an appropriate blend of skills and expertise, relevant to the Company's business. The Board is aware of the importance of independent judgement and considers independence when new appointments are made to the Board. However, at this stage the Board considers that relevant experience and familiarity with the Company’s activities and strategies are a priority over independence. Given the significant growth of the Company’s activities during the Reporting Period, the Board is considering augmenting the Board by seeking a potential appointment of a further director with a finance background and complementary skills. The Board will continue to evaluate its composition as its activities develop and expand. The Board considers the independence of directors having regard to the relationships listed in Box 2.1 of the Principles & Recommendations and the Company's materiality thresholds (Independence Criteria). The Board has agreed on, and set out in the Company’s Board Charter, the following guidelines for assessing the materiality of matters:
• Balance sheet items are material if they have a value of more than 10% of pro-forma net asset. • Profit and loss items are material if they will have an impact on the current year operating result of 10% or more.
Corporate Governance Statement 2011
20 | Northern Star Resources Ltd
• Items are also material if they impact on the reputation of the Company, involve a breach of legislation, are outside the ordinary course of business, could affect the Company’s rights to its assets, if accumulated would trigger the quantitative tests, involve a contingent liability that would have a probable effect of 10% or more on balance sheet or profit and loss items, or will have an effect on operations which is likely to result in an increase or decrease in net income or dividend distribution of more than 10%.
• Contracts will be considered material if they are outside the ordinary course of business, contain exceptionally onerous provisions in the opinion of the Board, impact on income or distribution in excess of the quantitative tests, there is a likelihood that either party will default, and the default may trigger any of the quantitative or qualitative tests, are essential to the activities of the Company and cannot be replaced or cannot be replaced without an increase in cost which triggers any of the quantitative tests, contain or trigger change of control provisions, are between or for the benefit of related parties, or otherwise trigger the quantitative tests.
The sole independent director of the Company is Mr Christopher Rowe. Mr Rowe is considered to be independent as he is a non-executive director who is not a member of management and who is free of any business or other relationship that could materially interfere with, or could reasonably be perceived to materially interfere with, the independent exercise of his judgment. The non-independent directors of the Company are Messrs William Beament, Michael Fotios and Peter Farris. Mr Beament is the Managing Director and is therefore not considered independent. Mr Farris is a director of a substantial shareholder of the Company, Investmet Limited, and therefore, having regard to the Independence Criteria is not independent. However, the Board considers that Mr Farris is able to exercise independence of mind in all matters except in areas where a declared interest, such as his relationship to Investmet Limited could, or could be perceived to, lead to conflicts of interests. It is noted that Mr Farris does not participate in discussions of matters in which he could be considered to have an interest. Mr Fotios is a director and significant shareholder of Investmet Limited, a substantial shareholder of the Company, and therefore is not considered independent in accordance with the Independence Criteria. The independent Chair of the Board is Mr Rowe, and the Managing Director is Mr Beament who is not Chair of the Board. Independent professional advice (Recommendation: 2.6) To assist directors with independent judgement, it is the Board's policy that if a director considers it necessary to obtain independent professional advice to properly discharge the responsibility of their office as a director then, provided the director first obtains approval from the Chair for incurring such expense, the Company will pay the reasonable expenses associated with obtaining such advice. Selection and (Re)Appointment of Directors (Recommendation: 2.6) In determining candidates for the Board, the Nomination Committee (or equivalent) follows a prescribed process whereby it evaluates the mix of skills, experience and expertise of the existing Board. Candidates for the Board are considered and selected by reference to a number of factors which include, but are not limited to, their relevant experience and achievements, compatibility with other Board members, credibility within the Company's scope of activities, and intellectual and physical ability to undertake Board duties and responsibilities. In particular, the Nomination Committee (or equivalent) is to identify the particular skills that will best increase the Board's effectiveness. Consideration is also given to the balance of independent directors. Potential candidates are identified and, if relevant, the Nomination Committee (or equivalent) recommends an appropriate candidate for appointment to the Board. Any appointment made by the Board is subject to ratification by shareholders at the next general meeting. The Board recognises that Board renewal is critical to performance and the impact of Board tenure on succession planning. Each director other than the Managing Director, must not hold office (without re-election) past the third annual general meeting of the Company following the director's appointment or three years following that director's last election or appointment (whichever is the longer). However, a director appointed to fill a casual vacancy or as an addition to the Board must not hold office (without re-election) past the next annual general meeting of the Company. At each annual general meeting a minimum of one director or a third of the total number of directors must resign. A director who retires at an annual general meeting is eligible for re-election at that meeting and the re-appointment of directors is not automatic. The Company's Policy and Procedure for the Selection and (Re)Appointment of Directors is available on the Company's website www.nsrltd.com.

Corporate Governance Statement 2011
21 | Northern Star Resources Ltd
BOARD COMMITTEES Nomination Committee (Recommendations: 2.4, 2.6) The Board has not established a separate Nomination Committee. Given the current size and composition of the Board, the Board believes that there would be no efficiencies gained by establishing a separate Nomination Committee. Accordingly, the Board performs the role of the Nomination Committee. Items that are usually required to be discussed by a nomination committee are marked as separate agenda items at Board meetings when required. When the Board convenes as the Nomination Committee it carries out those functions which are delegated to it in the Company’s Nomination Committee Charter. The Board deals with any conflicts of interest that may occur when convening in the capacity of the Nomination Committee by ensuring that the director with conflicting interests is not party to the relevant discussions. The full Board, in its capacity as the Nomination Committee, held one meeting during the Reporting Period. Details of the attendance at the Nomination Committee meeting are set out in the Directors Report. The Company's Nomination Committee Charter which describes the role, composition, functions and responsibilities of the Nomination Committee is available on the Company's website. Audit Committee (Recommendations: 4.1, 4.2, 4.3, 4.4) The Board has established an Audit Committee comprised of Christopher Rowe (Chair), Michael Fotios and Peter Farris. The Audit Committee is not structured in compliance with Recommendation 4.2. The chair of the Audit Committee is currently Mr Rowe who is also the Chair of the Board and the Company’s sole independent director. Mr Rowe is considered by the Board to be the most appropriate person to chair the Audit Committee given his extensive experience. Further, given the size and level of activity of the Company to date, and the division of authority between the Chair and management, the Board does not consider that a different chair for the Audit Committee would further enhance the operation of the Audit Committee. The Company has adopted an Audit Committee Charter which describes the role, composition, functions and responsibilities of the Audit Committee. The Audit Committee held two meetings during the Reporting Period. Details of attendance at Audit Committee meetings are set out in the Directors Report. Details of each of the director's qualifications are set out in the Directors' Report. While none of the members of the Audit Committee have specific financial qualifications, each one has many years’ experience in business as outlined in the Directors’ Report. The Company has established procedures for the selection, appointment and rotation of its external auditor. The Board is responsible for the initial appointment of the external auditor and the appointment of a new external auditor when any vacancy arises, as recommended by the Audit Committee. Candidates for the position of external auditor must demonstrate complete independence from the Company through the engagement period. The Board may otherwise select an external auditor based on criteria relevant to the Company's business and circumstances. The performance of the external auditor is reviewed on an annual basis by the Audit Committee and any recommendations are made to the Board. The Company's Audit Committee Charter and the Company's Procedure for Selection, Appointment and Rotation of External Auditor are available on the Company's website. Remuneration Committee (Recommendations: 8.1, 8.2, 8.3) The Board has established a Remuneration Committee comprised of Christopher Rowe (Chair), Michael Fotios and Peter Farris. The Remuneration Committee held one meeting during the Reporting Period and details of attendance at that meeting are set out in the Directors Report. To assist the Remuneration Committee to fulfil its function as the Remuneration Committee, the Board has adopted a Remuneration Committee Charter which describes the role, composition, functions and responsibilities of the Remuneration Committee. Details of remuneration, including the Company’s policy on remuneration, are contained in the “Remuneration Report” which forms of part of the Directors’ Report. Non-executive directors are remunerated at a fixed fee for time, commitment and responsibilities. Remuneration for non-executive directors is not linked to individual performance. Pay and rewards for executive directors and senior executives consists of a base salary and performance incentives. Long term

Corporate Governance Statement 2011
22 | Northern Star Resources Ltd
performance incentives may include options granted at the discretion of the Board and subject to obtaining the relevant approvals. Executives are offered a competitive level of base pay at market rates and are reviewed annually to ensure market competitiveness. There are no termination or retirement benefits for non-executive directors (other than for superannuation). The Company's Remuneration Committee Charter includes a statement of the Company's policy on prohibiting transactions in associated products which limit the risk of participating in unvested entitlements under any equity based remuneration schemes. The Company's Remuneration Committee Charter is available on the Company's website.
PERFORMANCE EVALUATION Senior executives (Recommendations: 1.2, 1.3) It is the responsibility of the Managing Director to manage and implement performance evaluation of other senior executives and management, reporting to the Board (as the Nomination Committee) and the Remuneration Committee at least annually. The current size and structure of the Company allows the Managing Director to conduct informal evaluation of management personnel on a regular basis, conducting a formal evaluation annually in conjunction with a remuneration review. This formal evaluation follows a structured format including interviews, self-assessment and measurement of performance of the individual and the Company against a set of parameters and benchmarks. Open and regular communication with senior staff and consulting personnel allows the Managing Director to ensure that key performance indicators are identified and met, and to provide feedback and guidance particularly where performance or mismanagement issues are evident. Board, its committees and individual directors (Recommendations: 2.5, 2.6) Evaluation of the Board and its members is carried out by way of an ongoing review by the Chairman (see the Performance Evaluation Process on the Company’s website for details of the means by which the review is conducted), discussing issues as they arise, and periodically conducting interviews with each director This ongoing process has remained in house and informal throughout the year relying on discussion and consultation summarised with an annual report from the Chairman in preference to more formal means of evaluation The full Board (acting as the Nomination Committee) reviews the performance of the Managing Director on an ongoing basis. During the Reporting Period an evaluation of the Board, its committees, and individual directors took place in accordance with the process disclosed above.
ETHICAL AND RESPONSIBLE DECISION MAKING Code of Conduct (Recommendations: 3.1, 3.3) The Company has established a Code of Conduct as to the practices necessary to maintain confidence in the Company's integrity, the practices necessary to take into account its legal obligations and the reasonable expectations of its stakeholders, and responsibility and accountability of individuals for reporting and investigating reports of unethical practices. The Company's Corporate Code of Conduct is available on the Company website. Policy for Trading in Company Securities (Recommendations: 3.2, 3.3) The Company has established a Policy for Trading in Company Securities by directors, officers and employees, and all of their “connected persons” (which includes family members and controlled entities). A copy of the Company's Policy for Trading in Company Securities is available on the Company's website.

Corporate Governance Statement 2011
23 | Northern Star Resources Ltd
Continuous Disclosure (Recommendations: 5.1, 5.2) The Company has established written policies and procedures designed to ensure compliance with ASX Listing Rule disclosure requirements and accountability at a senior executive level for that compliance. A summary of the Company's Continuous Disclosure Policy and Procedures is available on the Company's website. Shareholder Communication (Recommendations: 6.1, 6.2) The Company has designed a communications policy for promoting effective communication with shareholders and encouraging shareholder participation at general meetings. The Company's Shareholder Communication Policy is available on the Company's website. Risk Management Recommendations: 7.1, 7.2, 7.3, 7.4) The Board has adopted a Risk Management Policy, which sets out the Company's risk profile. Under the policy, the Board is responsible for approving the Company's policies on risk oversight and management and satisfying itself that management has developed and implemented a sound system of risk management and internal control. Since the acquisition of the Paulsens Gold Mine, the Company’s risk profile has changed significantly and a comprehensive review of the risk management policy, procedures and register has been in progress with the Company advancing towards having a more formalised risk management structure in place. The Company has implemented strict operational and site management risk management procedures and is developing its corporate risk management procedures. The Board is responsible for approving the Company’s policies on risk oversight and management and satisfying itself that management has developed and implemented a sound system of risk management and internal control. The Audit Committee has the responsibility of monitoring and reviewing the Company’s internal financial control system, the integrity of the financial reporting and consideration of risk management systems. The Managing Director has responsibility for identifying, assessing, monitoring and managing risks. Managers and supervisors report to the Managing Director in relation to their specific areas of responsibility, enabling him to fulfil his responsibilities. The Managing Director reports to the Board on risk management matters at each Board meeting. Risks identified as being of specific relevance to the Company included operational risks; exploration, evaluation and environmental risks; general economic and share market risks; commodity price risks; native title and tenure risks; risks relating to joint venture parties, agents and contractors; risks associated with future capital requirements and with potential acquisitions; risk relating to resource and mineralisation estimations; and risk associated with reliance on key personnel. The Board requires management to design, implement and maintain risk management and internal control systems to manage the Company's material business risks. The Board also requires management to report to it confirming that those risks are being managed effectively. During the Reporting Period a number of specific areas of risk have been addressed and reported to the Board although a final overall report is not available. The Board, along with management are in the process of reviewing the risk management and internal controls of the Company. Specialist consultants have been engaged to assist with the review. Once the review is completed and a report submitted, the Board will oversee the implementation of any recommendations that arise. The Managing Director and the Chief Financial Officer have provided a declaration to the Board in accordance with section 295A of the Corporations Act and have assured the Board that such declaration is founded on a sound system of risk management and internal control and that the system is operating effectively in all material respects in relation to financial reporting risks. A summary of the Company's Risk Management Policy is available on the Company's website.

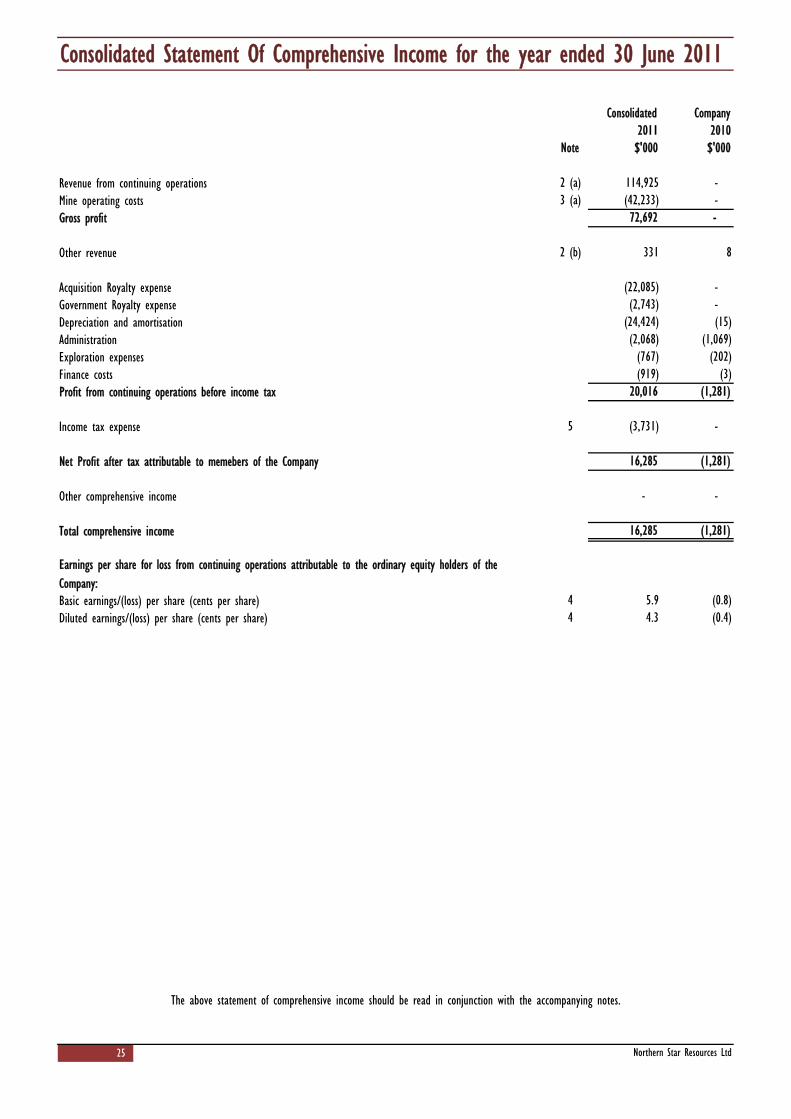
Consolidated Statement Of Comprehensive Income for the year ended 30 June 2011
Revenue from continuing operationsMine operating costsGross profit
Other revenue
Acquisition Royalty expenseGovernment Royalty expenseDepreciation and amortisation Administration Exploration expensesFinance costsProfit from continuing operations before income tax
Income tax expense
Net Profit after tax attributable to memebers of the Company
Other comprehensive income
Total comprehensive income
Basic earnings/(loss) per share (cents per share)Diluted earnings/(loss) per share (cents per share)
25
Consolidated Company2011 2010$'000 $'000
(15)(2,743) -
- -
Earnings per share for loss from continuing operations attributable to the ordinary equity holders of the Company:
114,925 - (42,233) -
(22,085) -
331 8
20,016 (1,281)
(767) (202)(2,068) (1,069)
(24,424)
(919) (3)
16,285 (1,281)
(3,731) -
16,285 (1,281)
4.3 (0.4)5.9 (0.8)
72,692 -
Note
2 (a)3 (a)
2 (b)
5
44
The above statement of comprehensive income should be read in conjunction with the accompanying notes.
Northern Star Resources Ltd
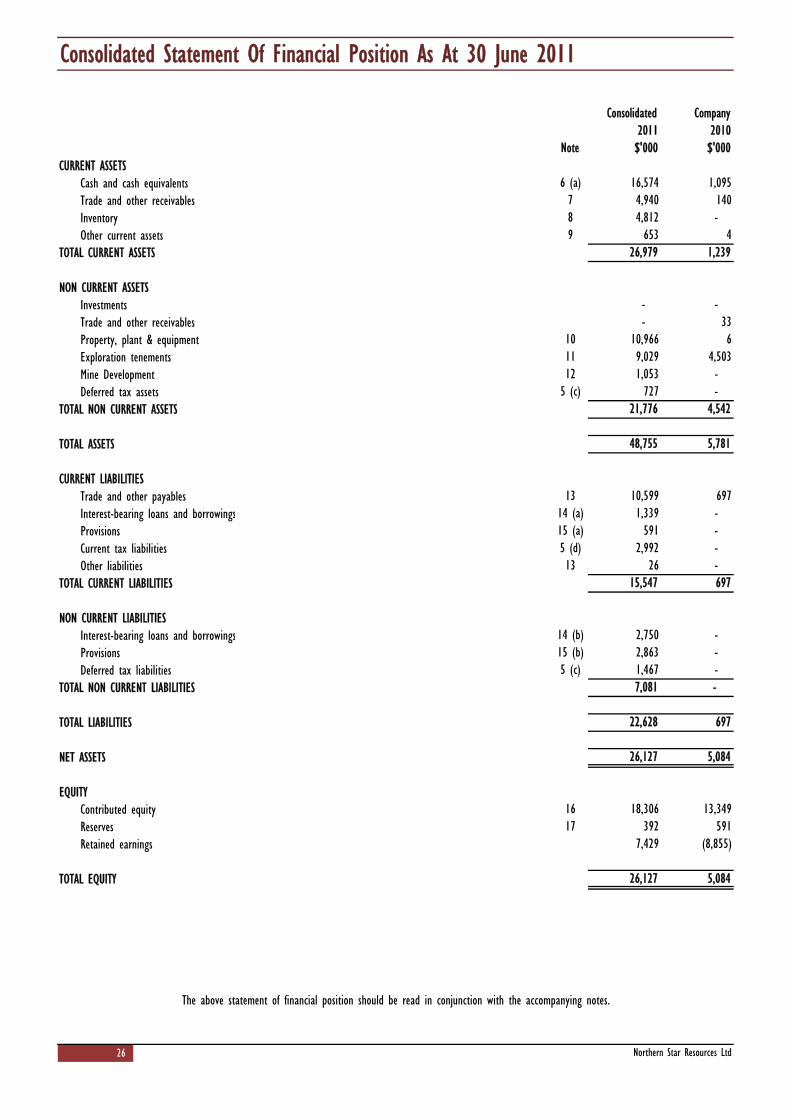
Consolidated Statement Of Financial Position As At 30 June 2011
CURRENT ASSETSCash and cash equivalentsTrade and other receivablesInventoryOther current assets
TOTAL CURRENT ASSETS
NON CURRENT ASSETSInvestmentsTrade and other receivablesProperty, plant & equipmentExploration tenementsMine DevelopmentDeferred tax assets
TOTAL NON CURRENT ASSETS
TOTAL ASSETS
CURRENT LIABILITIESTrade and other payablesInterest-bearing loans and borrowingsProvisionsCurrent tax liabilitiesOther liabilities
TOTAL CURRENT LIABILITIES
NON CURRENT LIABILITIESInterest-bearing loans and borrowingsProvisionsDeferred tax liabilities
TOTAL NON CURRENT LIABILITIES
TOTAL LIABILITIES
NET ASSETS
EQUITYContributed equityReservesRetained earnings
TOTAL EQUITY
26
Consolidated Company
1,339 -
2,750 -
789
- -
10,966 6
16,574 1,095
2011 2010$'000 $'000
26,979 1,239
4,940 1404,812 - 653 4
- 33
10,599 697
21,776 4,542
48,755 5,781
9,029 4,5031,053 - 727 -
15,547 697
591 -
26 - 2,992 -
7,081 -
22,628 697
2,863 - 1,467 -
18,306 13,349392 591
26,127 5,084
7,429 (8,855)
26,127 5,084
6 (a)
Note
101112
5 (c)
1314 (a)15 (a)
13
14 (b)15 (b)
5 (d)
16
5 (c)
17
The above statement of financial position should be read in conjunction with the accompanying notes.
Northern Star Resources Ltd
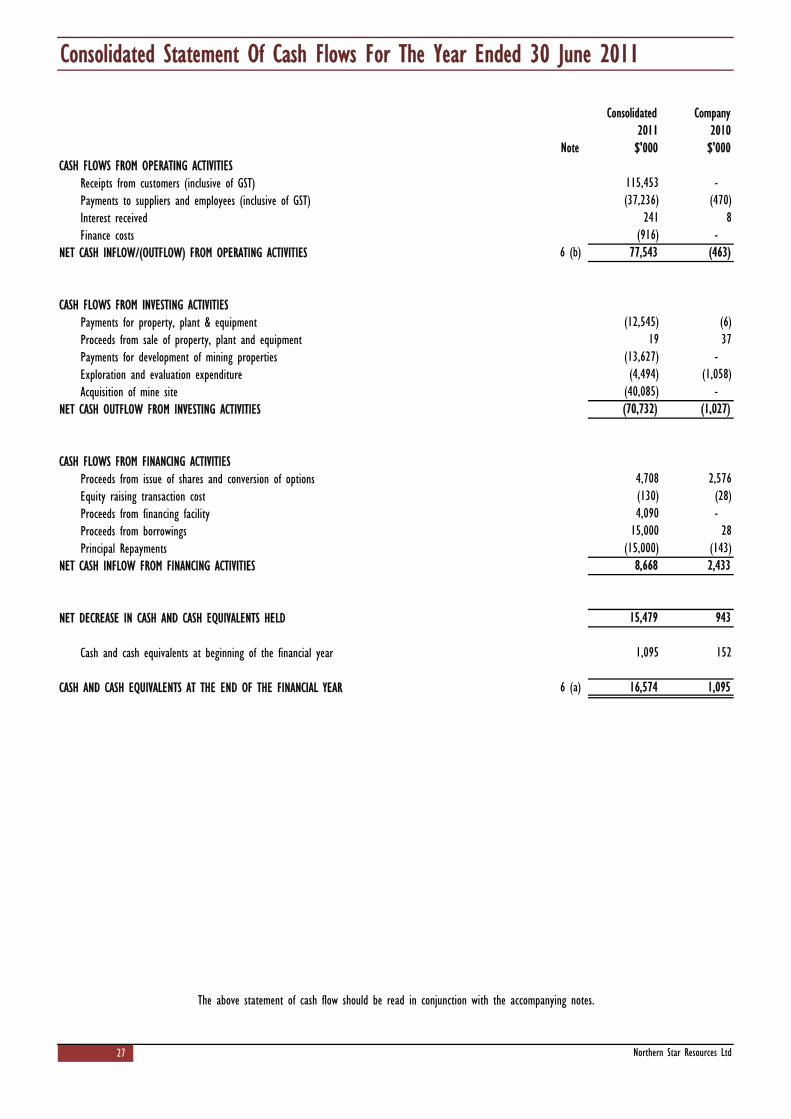
Consolidated Statement Of Cash Flows For The Year Ended 30 June 2011
CASH FLOWS FROM OPERATING ACTIVITIESReceipts from customers (inclusive of GST)Payments to suppliers and employees (inclusive of GST)Interest receivedFinance costs
NET CASH INFLOW/(OUTFLOW) FROM OPERATING ACTIVITIES
CASH FLOWS FROM INVESTING ACTIVITIESPayments for property, plant & equipmentProceeds from sale of property, plant and equipmentPayments for development of mining propertiesExploration and evaluation expenditureAcquisition of mine site
NET CASH OUTFLOW FROM INVESTING ACTIVITIES
CASH FLOWS FROM FINANCING ACTIVITIESProceeds from issue of shares and conversion of optionsEquity raising transaction costProceeds from financing facilityProceeds from borrowingsPrincipal Repayments
NET CASH INFLOW FROM FINANCING ACTIVITIES
NET DECREASE IN CASH AND CASH EQUIVALENTS HELD
Cash and cash equivalents at beginning of the financial year
CASH AND CASH EQUIVALENTS AT THE END OF THE FINANCIAL YEAR
27 Northern Star Resources Ltd
Consolidated Company
(13,627) - (4,494) (1,058)
The above statement of cash flow should be read in conjunction with the accompanying notes.
$'000 $'0002011 2010
77,543 (463)
115,453 - (37,236) (470)
19 37
241 8(916) -
(12,545) (6)
(40,085) -
2,433
(130) (28)4,090 -
15,000 28
4,708 2,576
16,574 1,095
1,095 152
15,479 943
(15,000) (143)8,668
(70,732) (1,027)
Note
6 (b)
6 (a)

Consolidated Statement Of Changes In Equity For The Year Ended 30 June 2011
At 1 July 2010
Equity issues (net of transaction costs)Share based paymentsTransfer from option reserveTotal comprehensive income for the half year
At 30 June 2011
At 1 July 2009
Equity issues (net of transaction costs)Share based paymentsTransfer from option reserveTotal comprehensive income for the half year
At 30 June 2010
28 Northern Star Resources Ltd
$'000 $'000 $'000 $'000
392 7,429 26,127
ReservesRetained Earnings
Total EquityNotes
Contributed Equity
Attributable to equity holders of the Company
$'000 $'000 $'000$'000
591 (8,855) 5,08413,349
- 16,285 16,285 -
- - 4,956179 - 179
4,956 -
(378) - (378) -
Notes
18,306
Attributable to equity holders of the CompanyContributed
EquityReserves
Retained Earnings
Total Equity
273 (7,575) 3,52110,823
- - 2,503340 - 340
2,503 -
(23) - - - (1,280) (1,280)
23 -
The above statement of changes in equity should be read in conjunction with the accompanying notes
590 (8,855) 5,08413,349
Notes to the Financial Report 2011
29 | Northern Star Resources Ltd
1. ACCOUNTING POLICIES (i) Basis of Preparation These financial statements are general purpose financial statements, which have been prepared in accordance with the requirements of the Corporations Act 2001, Australian Accounting Standards and other authoritative pronouncements of the Australian Accounting Standards Board including the Australian Accounting Interpretations. The financial statements have been prepared on a historical cost basis. The financial statements are presented in Australian dollars, which is the parent company’s functional and presentation currency, and all values are rounded to the nearest thousand dollars ($’000) unless otherwise stated. The Group is of a kind referred to in Class Order 98/0100, issued by the Australian Securities and Investments Commission, relating to the “rounding off” of amounts in the financial report. Amounts in the financial report have been rounded off in accordance with that class order to the nearest thousand dollars. (ii) Statement of Compliance The financial statements comply with Australian Accounting Standards and International Financial Reporting Standards (IFRS). (iii) Adoption of New and Revised Standards The AASB has issued new and amended accounting standards and interpretations that have mandatory application dates for future reporting periods. The Group has decided against early adoption of these standards. A discussion of those future requirements and their impact on Northern Star Resources Ltd and its controlled entities follows: AASB 9: Financial Instruments (December 2010) (applicable for annual reporting periods commencing on or after 1 January 2013).
This Standard is applicable retrospectively and includes revised requirements for the classification and measurement of financial instruments, as well as recognition and derecognition requirements for financial instruments. The Group has not yet determined any potential impact on the financial statements. The key changes made to accounting requirements include: simplifying the classifications of financial assets into those carried at amortised cost and those carried at fair value; simplifying the requirements for embedded derivatives; removing the tainting rules associated with held-to-maturity assets; removing the requirements to separate and fair value embedded derivatives for financial assets carried at amortised cost; allowing an irrevocable election on initial recognition to present gains and losses on investments in equity instruments that are not held for trading in
other comprehensive income. Dividends in respect of these investments that are a return on investment can be recognised in profit or loss and there is no impairment or recycling on disposal of the instrument; and
reclassifying financial assets where there is a change in an entity's business model as they are initially classified based on: a. the objective of the entity's business model for managing the financial assets; and b. the characteristics of the contractual cash flows.
AASB 1053: Application of Tiers of Australian Accounting Standards and AASB 2010-2: Amendments to Australian Accounting Standards arising from Reduced
Disclosure Requirements [AASB 1, 2, 3, 5, 7, 8, 101, 102, 107, 108, 110, 111, 112, 116, 117, 119, 121, 123, 124, 127, 128, 131, 133, 134, 136, 137, 138, 140, 141, 1050 & 1052 and Interpretations 2, 4, 5, 15, 17, 127, 129 & 1052] (applicable for annual reporting periods commencing on or after 1 July 2013). AASB 1053 establishes a revised differential financial reporting framework consisting of two tiers of financial reporting requirements for those entities preparing general purpose financial statements: Tier 1: Australian Accounting Standards; and Tier 2: Australian Accounting Standards - Reduced Disclosure Requirements Tier 2 of the framework comprises the recognition, measurement and presentation requirements of Tier 1, but contains significantly fewer disclosure requirements. The following entities are required to apply Tier 1 reporting requirements (i.e. full IFRS): for-profit private sector entities that have public accountability; and the Australian Government and state, territory and local governments. Since the Group is a for-profit private sector entity that has public accountability, it does not qualify for the reduced disclosure requirements for Tier 2 entities.
AASB 2010-6: Amendments to Australian Accounting Standards — Disclosures on Transfers of Financial Assets [AASB 1 & AASB 7] (applicable for annual
reporting periods beginning on or after 1 July 2011). This Standard adds and amends disclosure requirements about transfers of financial assets, especially those in respect of the nature of the financial assets involved and the risks associated with them. Accordingly, this Standard makes amendments to AASB 1: First-time Adoption of Australian Accounting Standards
Notes to the Financial Report 2011
30 | Northern Star Resources Ltd
and AASB 7: Financial Instruments: Disclosures, establishing additional disclosure requirements in relation to transfers of financial assets. This Standard is not expected to impact the Group.
AASB 2010-7: Amendments to Australian Accounting Standards arising from AASB 9 (December 2010) [AASB 1, 3, 4, 5, 7, 101, 102, 108, 112, 118, 120,
121, 127, 128, 131, 132, 136, 137, 139, 1023 & 1038 and Interpretations 2, 5, 10, 12, 19 & 127] (applies to periods beginning on or after 1 January 2013). This Standard makes amendments to a range of Australian Accounting Standards and Interpretations as a consequence of the issuance of AASB 9: Financial Instruments in December 2010. Accordingly, these amendments will only apply when the entity adopts AASB 9. As noted above, the Group has not yet determined any potential impact on the financial statements from adopting AASB 9.
AASB 2010-8: Amendments to Australian Accounting Standards — Deferred Tax: Recovery of Underlying Assets [AASB 112] (applies to periods beginning on
or after 1 January 2012). This Standard makes amendments to AASB 112: Income Taxes. The amendments brought in by this Standard introduce a more practical approach for measuring deferred tax liabilities and deferred tax assets when investment property is measured using the fair value model under AASB 140: Investment Property. Under the current AASB 112, the measurement of deferred tax liabilities and deferred tax assets depends on whether an entity expects to recover an asset by using it or by selling it. The amendments introduce a presumption that an investment property is recovered entirely through sale. This presumption is rebutted if the investment property is held within a business model whose objective is to consume substantially all of the economic benefits embodied in the investment property over time, rather than through sale. The amendments brought in by this Standard also incorporate Interpretation 121 into AASB 112. The amendments are not expected to impact the Group.
AASB 2010-9: Amendments to Australian Accounting Standards — Severe Hyperinflation and Removal of Fixed Dates for First-time Adopters [AASB 1] (applies
to periods beginning on or after 1 July 2011). This Standard makes amendments to AASB 1: First-time Adoption of Australian Accounting Standards. The amendments brought in by this Standard provide relief for first-time adopters of Australian Accounting Standards from having to reconstruct transactions that occurred before their date of transition to Australian Accounting Standards. Furthermore, the amendments brought in by this Standard also provide guidance for entities emerging from severe hyperinflation either to resume presenting Australian Accounting Standards financial statements or to present Australian Accounting Standards financial statements for the first time. This Standard is not expected to impact the Group.
AASB 2010-10: Further Amendments to Australian Accounting Standards — Removal of Fixed Dates for First-time Adopters [AASB 2009-11 & AASB 2010-7]
(applies to periods beginning on or after 1 January 2013). This Standard makes amendments to AASB 2009-11: Amendments to Australian Accounting Standards arising from AASB 9, and AASB 2010-7: Amendments to Australian Accounting Standards arising from AASB 9 (December 2010). The amendments brought in by this Standard ultimately affect AASB 1: First-time Adoption of Australian Accounting Standards and provide relief for first-time adopters from having to reconstruct transactions that occurred before their transition date. [The amendments to AASB 2009-11 will only affect early adopters of AASB 2009-11 (and AASB 9: Financial Instruments that was issued in December 2009) as it has been superseded by AASB 2010-7.] This Standard is not expected to impact the Group.
Consolidated Financial Statements (applies to periods beginning on or after 1 January 2013).
IFRS 10 establishes a new control model that applies to all entities. It replaces parts of IAS 27 Consolidated and Separate Financial Statements dealing with the accounting for consolidated financial statements and SIC-12 Consolidation — Special Purpose Entities. The new control model broadens the situations when an entity is considered to be controlled by another entity and includes new guidance for applying the model to specific situations, including when acting as a manager may give control, the impact of potential voting rights and when holding less than a majority voting rights may give control. This is likely to lead to more entities being consolidated into the group. This Standard is not expected to impact the Group.
Joint Arrangements (applies to periods beginning on or after 1 January 2013).
IFRS 11 replaces IAS 31 Interests in Joint Ventures and SIC-13 Jointly- controlled Entities - Non-monetary Contributions by Ventures. IFRS 11 uses the principle of control in IFRS 10 to define joint control, and therefore the determination of whether joint control exists may change. In addition IFRS 11 removes the option to account for jointly controlled entities (JCEs) using proportionate consolidation. Instead, accounting for a joint arrangement is dependent on the nature of the rights and obligations arising from the arrangement. Joint operations that give the venturers a right to the underlying assets and obligations themselves are accounted for by recognising the share of those assets and obligations. Joint ventures that give the venturers a right to the net assets is accounted for using the equity method. This may result in a change in the accounting for the joint arrangements held by the group. This Standard is not expected to impact the Group.
Notes to the Financial Report 2011
31 | Northern Star Resources Ltd
Disclosure of Interests in Other Entities (applies to periods beginning on or after 1 January 2013). IFRS 12 includes all disclosures relating to an entity's interests in subsidiaries, joint arrangements, associates and structures entities. New disclosures have been introduced about the judgements made by management to determine whether control exists, and to require summarised information about joint arrangements, associates and structured entities and subsidiaries with non-controlling interests. This Standard is not expected to impact the Group.
Fair Value Measurement (applies to periods beginning on or after 1 January 2013).
IFRS 13 establishes a single source of guidance under IFRS for determining the fair value of assets and liabilities. IFRS 13 does not change when an entity is required to use fair value, but rather, provides guidance on how to determine fair value under IFRS when fair value is required or permitted by IFRS. Application of this definition may result in different fair values being determined for the relevant assets. IFRS 13 also expands the disclosure requirements for all assets or liabilities carried at fair value. This includes information about the assumptions made and the qualitative impact of those assumptions on the fair value determined. This Standard is not expected to impact the Group.
(iv) Significant Accounting Estimates and Assumptions
Significant accounting judgments In the process of applying the Group’s accounting policies, management has made the following judgments, apart from those involving estimations, which have the most significant effect on the amounts recognised in the financial statements. Exploration and evaluation assets The Group’s accounting policy for exploration and evaluation expenditure is set out at Note 1(v). The application of this policy necessarily requires management to make certain estimates and assumptions as to future events and circumstances. Any such estimates and assumptions may change as new information becomes available. If, after having capitalised expenditure under the policy, it is concluded that the expenditures are unlikely to be recovered by future exploitation or sale, then the relevant capitalised amount will be written off to the statement of comprehensive income. Critical accounting estimates and assumptions The carrying amounts of certain assets and liabilities are often determined based on estimates and assumptions of future events. The key estimates and assumptions that have a significant risk of causing a material adjustment to the carrying amounts of certain assets and liabilities within the next annual reporting period are: Impairment of assets In determining the recoverable amount of assets, in the absence of quoted market prices, estimations are made regarding the present value of future cash flows using asset-specific discount rates and the recoverable amount of the asset is determined. Value-in-use calculations performed in assessing recoverable amounts incorporate a number of key estimates. The recoverable amounts of cash generating units and individual assets have been determined based on the higher of value-in-use calculations and fair values. The calculations require the use of estimates and assumptions. It is reasonably possible that the gold price assumption may change which may then impact our estimated life of mine determinant and may then require a material adjustment to the carrying value of tangible assets. The Group reviews and tests the carrying value of assets when events or changes in circumstances suggest that the carrying amount may not be recoverable. Assets are grouped at the lowest level for which identifiable cash flows are largely independent of cash flows of other assets and liabilities. If there are indications that impairment may have occurred, estimates are prepared for future cash flows of the mining assets. Expected future cash flows used to determine the value in use of tangible assets are inherently uncertain and could materially change over time. They are significantly affected by a number of factors including reserves and production estimates, together with economic factors such as spot gold prices, discount rates, estimates of costs to produce reserves and future capital expenditure. Provisions for restoration costs Restoration costs are a normal consequence of mining, and the majority of this expenditure is incurred at the end of a mine’s life. In determining an appropriate level of provision consideration is given to the expected future costs to be incurred, the timing of these expected future costs (largely dependent on the life of the mine), and the estimated future level of inflation. The ultimate cost of restoration is uncertain and costs can vary in response to many factors including changes to the relevant legal requirements, the emergence of new restoration techniques or experience at other mine-sites. The expected timing of expenditure can also change, for example in response to changes in reserves or to production rates. Changes to any of the estimates could result in significant changes to the level of provisioning required, which would in turn impact future financial results.
Notes to the Financial Report 2011
32 | Northern Star Resources Ltd
Share-based payment transactions The Group measures the cost of equity-settled transactions with employees by reference to the fair value of the equity instruments at the date at which they are granted. The fair value is determined using the Black-Scholes model. Should the assumptions used in these calculations differ, the amounts recognised could significantly change. Commitments - Exploration The Group has certain minimum exploration commitments to maintain its right of tenure to exploration permits. These commitments require estimates of the cost to perform exploration work required under these permits. These have been disclosed in Note 19. Recoverability of deferred income tax assets The Group recognises deferred income tax assets in respect of tax losses and temporary differences to the extent that the future utilisation of these losses and temporary differences is considered probable. Assessing the future utilisation of these losses and temporary differences requires the Group to make significant estimates related to expectations of future taxable income. Estimates of future taxable income are based on forecast cash flows from operations and the application of existing tax laws. To the extent that future cash flows and taxable income differ significantly from estimates, this could result in significant changes to the deferred income tax assets recognised, which would in turn impact future financial results. Basis of consolidation The consolidated financial statements include the financial statements of Northern Star Resources Ltd (“the Company”), and its subsidiaries (“the Group” or “Group”). The financial statements of subsidiaries are prepared for the same reporting period as the parent company, using consistent accounting policies. Adjustments are made to bring into line any dissimilar accounting policies that may exist. Where an entity has been acquired during the year, its results are included in consolidated results from the date control commenced. Unrealised gains and losses and inter-entity balances resulting from transactions with or between controlled entities are eliminated in full on consolidation. Segment reporting Operating segments are reported in a manner consistent with the internal reporting provided to the chief operating decision maker. The chief operation decision maker, who is responsible for allocating resources and assessing performance of the operating segments, has been identified as the board of directors that makes strategic decisions. Cash and cash equivalents Cash and short-term deposits in the statement of financial position comprise cash at bank and in hand and short-term deposits with an original maturity of three months or less. For the purposes of the statement of cash flows, cash and cash equivalents consist of cash and cash equivalents as defined above, net of outstanding bank overdrafts. Trade and other receivables Receivables are initially recognised at fair value and subsequently measured at amortised cost, less allowance for doubtful debts. Current receivables for GST are due for settlement within 30 days and other current receivables within 12 months. Cash on deposit is not due for settlement until rights of tenure are forfeited or performance obligations are met. Inventories Ore stockpiles are physically measured or estimated and valued at the lower of cost or net realisable value. The stockpile amount is determined by reference to mining cost, including amortisation at the relevant stage of production. Plant and equipment Plant and equipment is stated at cost less accumulated depreciation and any impairment in value. Depreciation is calculated on a straight line basis to write off the net cost of each item of plant and equipment over its expected useful life, being 1 to 5 years. Depreciation of the processing plant, which is not ready for use, will commence when ready for use, and be based over future periods on a basis related to expected benefits. Other items of plant are amortised over life of mine. The life of mine expectation is reviewed periodically. Exploration and Evaluation Expenditure Costs related to the acquisition of properties that contain resources are allocated separately to specific areas of interest. These costs are capitalised until the viability of the area of interest is determined. Exploration and evaluation expenditure is stated at cost and is accumulated in respect of each identifiable area of interest. Such costs are only carried forward to the extent that they are expected to be recouped through the successful development of the area of interest (or alternatively by its sale), or where activities in the area have not yet reached a stage which permits a reasonable assessment of the existence or otherwise of economically recoverable reserves, and active operations are continuing. Accumulated costs in relation to an abandoned area are written off to the statement of comprehensive income in the period in which the decision to abandon the area is made. The company reviews the carrying value of each
Notes to the Financial Report 2011
33 | Northern Star Resources Ltd
area of interest as at the reporting date and any exploration expenditure which no longer satisfies the above policy is written off. Restoration costs expected to be incurred are provided for as part of exploration, evaluation, development or production phases that give rise to the need for restoration. Development expenditure When the technical and commercial feasibility of extracting a mineral resource has been demonstrated the resource enters its development phase. The costs of the assets are transferred from exploration and evaluation expenditure and reclassified into development expenditure and include past exploration and evaluation costs and development costs. Although development expenditure is not amortised, it is tested annually for impairment. Mine Development expenses Capitalised development costs are amortised on a unit-of-production basis over the economically recoverable resources of the mine. The unit of account will be ounces produced. Capitalised development costs include exploration and evaluation expenditure previously deferred relating to that ore body. Separate calculations are undertaken for each ore body. Impairment of assets At each reporting date, the Group assesses whether there is any indication that an asset may be impaired. Where an indicator of impairment exists, the Group makes a formal estimate of recoverable amount. Where the carrying amount of an asset exceeds its recoverable amount the asset is considered impaired and is written down to its recoverable amount. Recoverable amount is the greater of fair value less costs to sell and value in use. It is determined for an individual asset, unless the asset’s value in use cannot be estimated to be close to its fair value less costs to sell and it does not generate cash inflows that are largely independent of those from other assets or groups of assets, in which case, the recoverable amount is determined for the cash-generating unit to which the asset belongs. When the carrying amount of an asset or cash-generating unit exceeds its recoverable amount, the asset or cash-generating unit is written down to its recoverable amount. In assessing value in use, the estimated future cash flows are discounted to their present value using a pre-tax discount rate that reflects current market assessments of the time value of money and the risks specific to the asset. Derecognition of financial assets and liabilities A financial asset (or, where applicable, a part of a financial asset or part of a group of similar financial assets) is derecognised when: the rights to receive cash flows from the asset have expired; the Company retains the right to receive cash flows from the asset, but has assumed an obligation to pay them in full without material delay to a third
party; or the Company has transferred its rights to receive cash flows from the asset and either
a. has transferred substantially all the risks and rewards of the asset, or b. has neither transferred nor retained substantially all the risks and rewards of the asset, but has transferred control of the asset.
A financial liability is derecognised when the obligation under the liability is discharged, cancelled or expired. When an existing financial liability is replaced by another from the same lender on substantially different terms, or the terms of an existing liability are substantially modified, such an exchange or modification is treated as a derecognition of the original liability and the recognition of a new liability. The difference in the respective carrying amounts is recognised in the statement of comprehensive income. Restoration, rehabilitation, and environmental costs The Group recognises any legal restoration obligation as a liability at the time a legal liability exists. The carrying amount of the long lived assets to which the legal obligation relates is increased by the restoration obligation costs and amortised over the producing life of the asset. A provision is raised for the restoration and rehabilitation of each mine site. Restoration and rehabilitation works can include facility decommissioning and dismantling; removal or treatment of waste materials; land rehabilitation; and site restoration. The extent of the work required and the associated costs are dependent on the relevant regulatory requirements and the group’s environmental policies. Investments Non-current investments in subsidiaries are carried at their cost of acquisition in the Company’s statement of financial position. An allowance for impairment loss of an investment is made where the Company has assessed the investment as impaired.

Notes to the Financial Report 2011
34 | Northern Star Resources Ltd
Trade and other payables Trade payables and other payables are recognised initially at fair value and subsequently at amortised cost and represent liabilities for goods and services provided to the Group prior to the end of the financial year that are unpaid and arise when the Group becomes obliged to make future payments in respect of the purchase of these goods and services. The amounts are unsecured and usually paid within 30 days of recognition. Provisions Provisions are recognised when the Group has a present obligation (legal or constructive) as a result of a past event, it is probable that an outflow of resources embodying economic benefits will be required to settle the obligation and a reliable estimate can be made of the amount of the obligation. Where the Group expects some or all of a provision to be reimbursed, for example under an insurance contract, the reimbursement is recognised as a separate asset but only when the reimbursement is virtually certain. The expense relating to any provision is presented in the statement of comprehensive income net of any reimbursement. If the effect of the time value of money is material, provisions are determined by discounting the expected future cash flows at a pre-tax rate that reflects current market assessments of the time value of money and, where appropriate, the risks specific to the liability. Where discounting is used, the increase in the provision due to the passage of time is recognised as a finance cost. Employee benefits Liabilities for wages and salaries, including non-monetary benefits, annual leave, and any other employee entitlements expected to be settled within twelve months of the reporting date are measured at their nominal amounts based on remuneration rates which are expected to be paid when the liability is settled. Long service leave liabilities are measured at current cost for those employees with greater than 5 years’ service up to the reporting date. Consideration is given to future wage and salary levels, experience of employee departures and period of service. Employee entitlements expenses and revenues arising in respect of wages and salaries, non-monetary benefits, annual leave, long service leave, sick leave and other entitlements are charged against profits on a net basis. Contributions are made to employee superannuation plans and are charged as expenses when incurred. Share-based payment transactions The Group may provide benefits to employees (including directors) of the Group in the form of share-based payment transactions, whereby employees render services in exchange for shares or rights over shares (‘equity-settled transactions’). The cost of these equity-settled transactions with employees is measured by reference to the fair value at the date at which they are granted. The fair value is determined using a Black-Scholes option pricing model that takes into account the exercise price, the term of the option, the impact of dilution, the share price at grant date and expected price volatility of the underlying share, the expected dividend yield and the risk free interest rate for the term of the option. The fair value of the options granted is adjusted to reflect market conditions, but excludes the impact of any non-market vesting conditions. Non-market vesting conditions, if any, are included in assumptions about the number of options likely to be exercisable. Upon exercise of the options the proceeds received, net of any transaction costs, are credited to issue capital. Jointly controlled interest The proportionate interests in the assets, liabilities and expenses of a joint interest activity have been incorporated in the financial statements under the appropriate headings. Details of the joint ventures are set out in Note 24. Revenue recognition Revenues are recognised at fair value of the consideration received net of the amount of goods and services tax (GST) payable to the taxation authority. Exchanges of goods or services of the same nature and value without any cash consideration are not recognised as revenues. Interest revenue Interest revenue is recognised as it accrues, taking into account the effective yield on the financial asset. Borrowing costs Borrowing costs are recognised in the statement of comprehensive income in the period in which they are incurred except borrowing costs that are directly attributable to the acquisition, construction, or production of a qualifying asset that necessarily takes a substantial period to get ready for its intended use or sale. In this case, borrowing costs are capitalised as part of the cost of such a qualifying asset. Income tax Current tax assets and liabilities for the current and prior periods are measured at the amount expected to be recovered from or paid to the taxation authorities. The tax rates and tax laws used to compute the amount are those that are enacted or substantively enacted by the statement of financial position date. Deferred income tax is provided on all temporary differences at the statement of financial position date between the tax bases of assets and liabilities and their carrying amounts for financial reporting purposes. Deferred income tax liabilities are recognised for all taxable temporary differences, except where the deferred income tax liability arises from the initial recognition of an asset or liability in a transaction that is not a business combination and, at the time of the transaction, affects neither the accounting profit nor taxable profit or loss.

Notes to the Financial Report 2011
35 | Northern Star Resources Ltd
Deferred income tax assets are recognised for all deductible temporary differences, carry-forward of unused tax assets and unused tax losses, to the extent that it is probable that taxable profit will be available against which the deductible temporary differences, and the carry-forward of unused tax assets and unused tax losses can be utilised, except where the deferred income tax asset relating to the deductible temporary difference arises from the initial recognition of an asset or liability in a transaction that is not a business combination and, at the time of the transaction, affects neither the accounting profit nor taxable profit or loss. The carrying amount of deferred income tax assets is reviewed at each reporting date and reduced to the extent that it is no longer probable that sufficient taxable profit will be available to allow all or part of the deferred income tax asset to be utilised. Deferred income tax assets and liabilities are measured at the tax rates that are expected to apply to the year when the asset is realised or the liability is settled, based on tax rates (and tax laws) that have been enacted or substantively enacted at the reporting date. Unrecognised deferred income tax assets are reassessed at each reporting date and are recognised to the extent that it has become probable that future taxable profit will allow the deferred tax asset to be recovered. Income taxes relating to items recognised directly in equity are recognised in equity and not in the statement of comprehensive income. Deferred tax assets and deferred tax liabilities are offset only if a legally enforceable right exists to set off current tax assets against current tax liabilities and the deferred tax assets and liabilities relate to the same taxable entity and the same taxation authority. Tax consolidations Northern Star Resources Ltd is the head entity in the tax-consolidated group comprising its wholly-owned subsidiaries. The effective date of implementation was 9 March 2011 for the tax-consolidated group. Northern Star Resources Ltd accounts for the consolidated group’s current and deferred tax amounts. These tax amounts are measured as if each entity in the tax consolidated group continues to be a standalone taxpayer in its own right. In addition to its own current and deferred tax amounts, Northern Star Resources Ltd also recognises the current tax liabilities (or assets) and the deferred tax assets arising from unused tax losses and unused tax credits assumed from controlled entities in the tax consolidated group. Other taxes Revenues, expenses and assets are recognised net of the amount of GST, except where the amount of GST incurred is not recoverable from the taxation authority. In these circumstances the GST is recognised as part of the cost of acquisition of the asset or as part of an item of the expense as applicable. Receivables and payables are stated with the amount of GST included. The net amount of GST recoverable from, or payable to, the taxation authority is included as part of receivables or payables in the statement of financial position. Cash flows are included in statement of cash flows on a gross basis. The GST components of cash flows arising from investing and financing activities that are recoverable from, or payable to, the taxation authority are classified as operating cash flows. Commitments and contingencies are disclosed net of the amount of GST recoverable from, or payable to, the taxation authority. Contributed equity Issued and paid up capital is recognised at the fair value of the consideration received by the Company. Any transaction costs arising on the issue of ordinary shares are recognised directly in equity as a reduction of the share proceeds received. Earnings per share (EPS) Basic EPS is calculated as net profit attributable to members, adjusted to exclude costs of servicing equity (other than dividends) and preference share dividends, divided by the weighted average number of ordinary shares, adjusted for any bonus element. Diluted earnings per share are determined when the Company has on issue potential ordinary shares which are dilutive. It is calculated by dividing net profit attributable to members, adjusted to exclude costs of servicing equity (other than dividends) and any expenses associated with dividends and interest of dilutive potential ordinary shares, by the weighted average number of ordinary shares (both issued and potentially dilutive) adjusted for any bonus element.
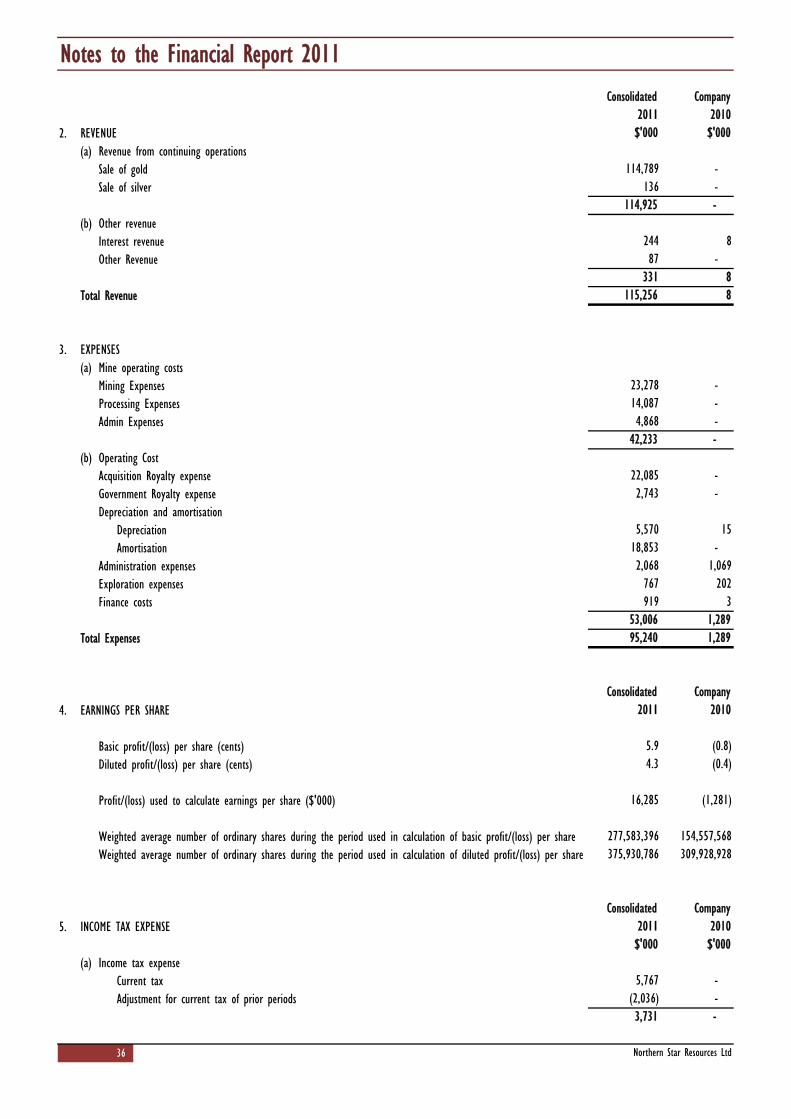
Notes to the Financial Report 2011
2. REVENUE(a) Revenue from continuing operations
Sale of goldSale of silver
(b) Other revenueInterest revenueOther Revenue
Total Revenue
3. EXPENSES(a) Mine operating costs
Mining ExpensesProcessing ExpensesAdmin Expenses
(b) Operating CostAcquisition Royalty expenseGovernment Royalty expenseDepreciation and amortisation
DepreciationAmortisation
Administration expensesExploration expensesFinance costs
Total Expenses
4. EARNINGS PER SHARE
Basic profit/(loss) per share (cents)Diluted profit/(loss) per share (cents)
Profit/(loss) used to calculate earnings per share ($'000)
Weighted average number of ordinary shares during the period used in calculation of basic profit/(loss) per shareWeighted average number of ordinary shares during the period used in calculation of diluted profit/(loss) per share
5. INCOME TAX EXPENSE
(a) Income tax expenseCurrent taxAdjustment for current tax of prior periods
36
4.3 (0.4)
Northern Star Resources Ltd
CompanyConsolidated
2011 2010
2,743
Company
$'000 $'000
331115,256 8
23,278
1,289
42,233 -
Consolidated
309,928,928
16,285 (1,281)
(2,036) -
5,570 1518,853 -
5,767 -
3,731 -
53,006 1,289
2,068 1,069
Consolidated Company2011
5.9
375,930,786277,583,396 154,557,568
767 202919 3
(0.8)
2010
95,240
2011 2010$'000 $'000
114,789 -
- 14,087 - 4,868 -
- 22,085
8
-
136 - 114,925 -
87244 8
-
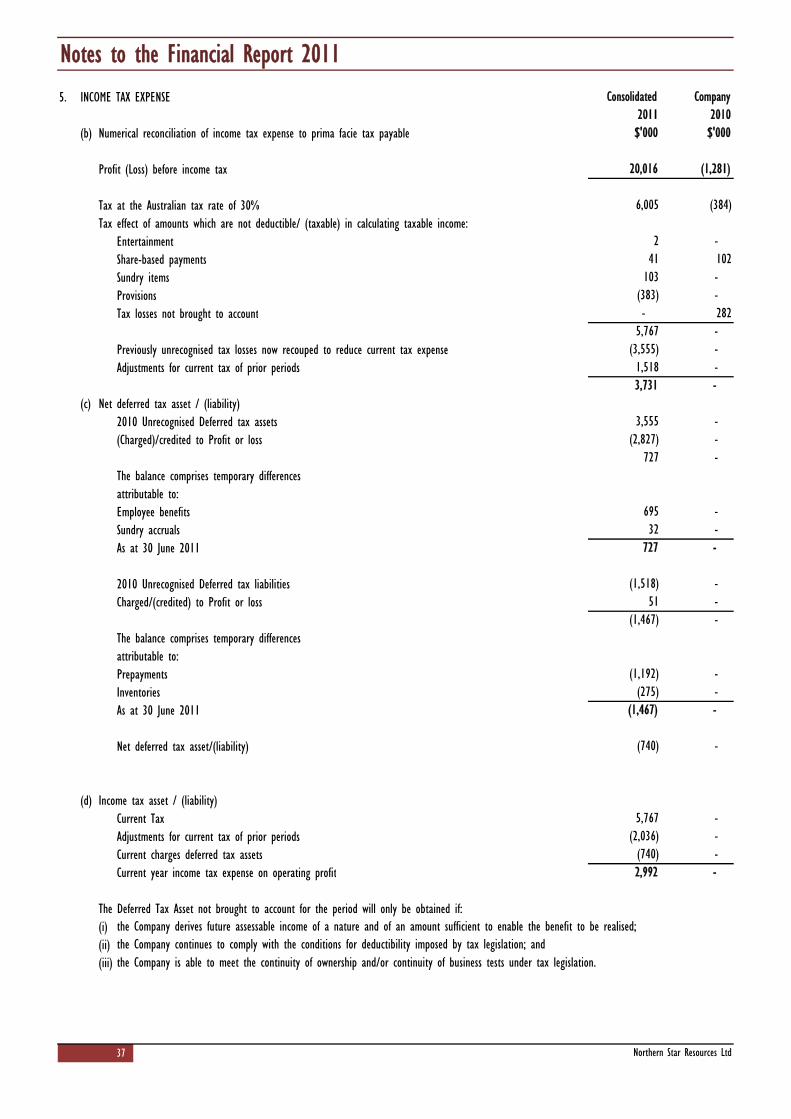
Notes to the Financial Report 20115. INCOME TAX EXPENSE
(b) Numerical reconciliation of income tax expense to prima facie tax payable
Profit (Loss) before income tax
Tax at the Australian tax rate of 30% Tax effect of amounts which are not deductible/ (taxable) in calculating taxable income:
EntertainmentShare-based paymentsSundry itemsProvisionsTax losses not brought to account
Previously unrecognised tax losses now recouped to reduce current tax expenseAdjustments for current tax of prior periods
(c) Net deferred tax asset / (liability)2010 Unrecognised Deferred tax assets(Charged)/credited to Profit or loss
The balance comprises temporary differencesattributable to:Employee benefitsSundry accrualsAs at 30 June 2011
2010 Unrecognised Deferred tax liabilitiesCharged/(credited) to Profit or loss
The balance comprises temporary differencesattributable to:PrepaymentsInventoriesAs at 30 June 2011
Net deferred tax asset/(liability)
(d) Income tax asset / (liability)Current TaxAdjustments for current tax of prior periodsCurrent charges deferred tax assetsCurrent year income tax expense on operating profit
The Deferred Tax Asset not brought to account for the period will only be obtained if:(i) (ii)(iii)
37 Northern Star Resources Ltd
(275) - (1,467) -
-
(3,555) - 1,518 - 3,731 -
5,767 -
695 - 32 -
(2,036) -
-
20,016 (1,281)
3,555 -
102 -
2011 2010$'000
5,767
Consolidated Company
282
the Company is able to meet the continuity of ownership and/or continuity of business tests under tax legislation.the Company continues to comply with the conditions for deductibility imposed by tax legislation; and
6,005 (384)
(1,192)
41
-
(383) -
-
the Company derives future assessable income of a nature and of an amount sufficient to enable the benefit to be realised;
- 51 -
(1,467) -
-
(1,518)
727
(740) - 2,992
$'000
(2,827) - 727 -
2
103 -
-
(740)
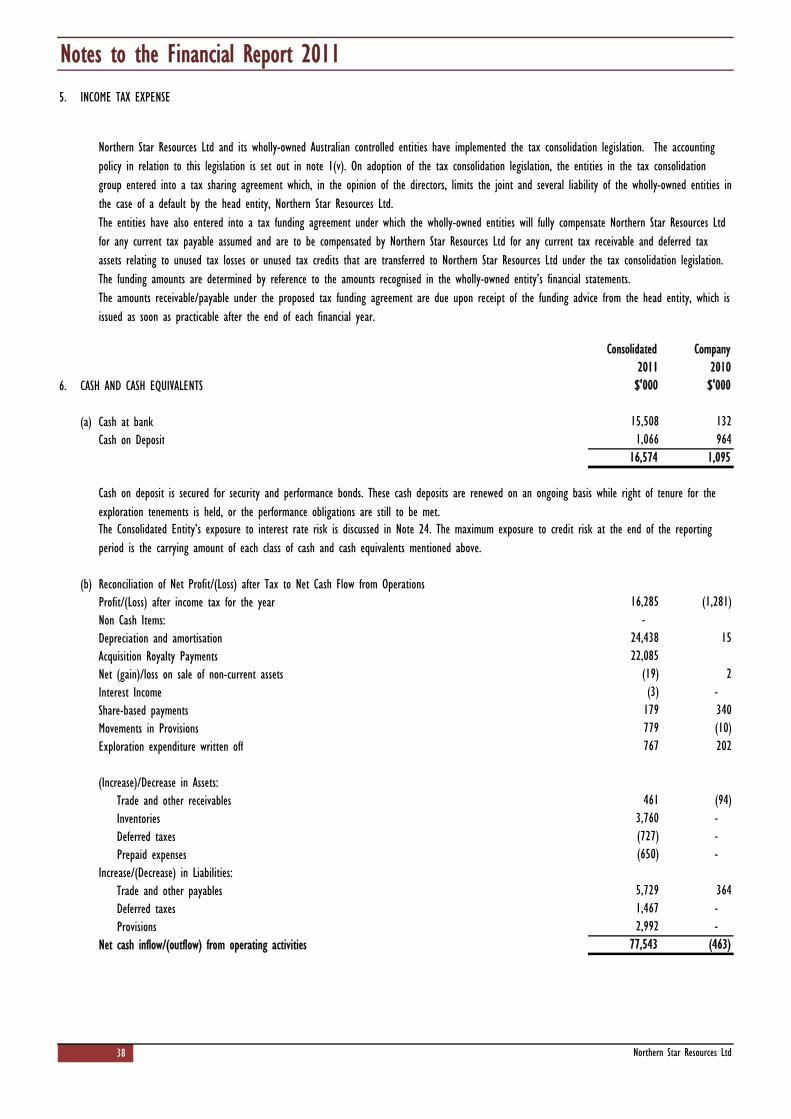
Notes to the Financial Report 20115. INCOME TAX EXPENSE
6. CASH AND CASH EQUIVALENTS
(a) Cash at bank Cash on Deposit
(b) Reconciliation of Net Profit/(Loss) after Tax to Net Cash Flow from OperationsProfit/(Loss) after income tax for the yearNon Cash Items:Depreciation and amortisationAcquisition Royalty PaymentsNet (gain)/loss on sale of non-current assetsInterest IncomeShare-based paymentsMovements in ProvisionsExploration expenditure written off
(Increase)/Decrease in Assets:Trade and other receivablesInventoriesDeferred taxesPrepaid expenses
Increase/(Decrease) in Liabilities:Trade and other payablesDeferred taxesProvisions
Net cash inflow/(outflow) from operating activities
38 Northern Star Resources Ltd
Consolidated Company
202
16,574964
(3)
461
2,992
-
- 77,543
364
The Consolidated Entity’s exposure to interest rate risk is discussed in Note 24. The maximum exposure to credit risk at the end of the reporting period is the carrying amount of each class of cash and cash equivalents mentioned above.
24,438 15
2
767
Northern Star Resources Ltd and its wholly-owned Australian controlled entities have implemented the tax consolidation legislation. The accounting policy in relation to this legislation is set out in note 1(v). On adoption of the tax consolidation legislation, the entities in the tax consolidation group entered into a tax sharing agreement which, in the opinion of the directors, limits the joint and several liability of the wholly-owned entities in the case of a default by the head entity, Northern Star Resources Ltd.The entities have also entered into a tax funding agreement under which the wholly-owned entities will fully compensate Northern Star Resources Ltd for any current tax payable assumed and are to be compensated by Northern Star Resources Ltd for any current tax receivable and deferred tax assets relating to unused tax losses or unused tax credits that are transferred to Northern Star Resources Ltd under the tax consolidation legislation. The funding amounts are determined by reference to the amounts recognised in the wholly-owned entity’s financial statements.The amounts receivable/payable under the proposed tax funding agreement are due upon receipt of the funding advice from the head entity, which is issued as soon as practicable after the end of each financial year.
340
22,085
16,285 (1,281) -
179
(650)
(19)
(94)3,760
1,066
-
1,095
2011 2010$'000
132
Cash on deposit is secured for security and performance bonds. These cash deposits are renewed on an ongoing basis while right of tenure for the exploration tenements is held, or the performance obligations are still to be met.
$'000
15,508
5,729
-
(463)
(727) -
1,467 -
779 (10)

Notes to the Financial Report 2011
7. TRADE AND OTHER RECEIVABLES
Amounts receivable from Sundry debtors
Goods and services tax recoverableFuel RebatesOther receivables
Fair Value and Risk Exposures(i)
(ii) The maximum exposure to credit risk is the fair value of receivables. Collateral is not held as security.(iii) Details regarding interest risk exposure are disclosed in note 24.(iv) Other receivables generally have repayments between 30 and 90 days.(v)
8. INVENTORY
ConsumablesOreGold In Circuit
(a) Lower of Cost and Net Realisable ValueAt 30 June 2011, there where no ore stockpiles valued at Net Realisable Value (2010: Nil)
9. OTHER CURRENT ASSETS
Prepayments
Inventories recognised as expenses during the year ended 30 June 2011 amounted to $653,000 (2010: $4,000)
10. PROPERTY, PLANT AND EQUIPMENT
Plant and equipment at costAccumulated depreciation
39 Northern Star Resources Ltd
2011 2010
2011
4,812 -
$'000
Company
Consolidated Company
653
2010
4
4,457
$'000
10,966 6
16,643 50(5,677) (44)
2011Consolidated
Transactions between Northern Star Resources Ltd and its subsidiaries consist of intercompany loans, upon which no interest is charged and no repayment schedule exists. The intercompany loans have no set repayment date and the fair value approximates the carrying value of the receivable.
$'000 $'000
417
2011 2010
-
4,940 140
Due to the short term nature of these receivables, their carrying value is assumed to approximate their fair value. For the non-current security bonds, due to the liquid nature of the asset, their carrying value also reflects their fair value.
101
57 39
2,698 -
9 -
917 - 1,197 -
2010$'000 $'000
Consolidated Company
Consolidated Company
$'000 $'000

Notes to the Financial Report 2011
10. PROPERTY, PLANT AND EQUIPMENT
As at 1 July 2009Cost Accumulated depreciationNet Book Amount
Year ended 30 June 2010Opening net book amountAdditionsDisposals/transfersDepreciation chargeClosing net book amount
As at 30 June 2010Cost Accumulated depreciationNet Book Amount
Year ended 30 June 2011Opening net book amountAdditionsDisposals/transfersDepreciation chargeClosing net book amount
As at 30 June 2011Cost Accumulated depreciationNet Book Amount
11. EXPLORATION AND EVALUATION COSTS
Exploration costs brought forwardExploration costs this yearExploration costs now written offTransfer to development expenditureExploration costs carried forward
Impairment
40 Northern Star Resources Ltd
1,207
(44)
10,966
-
291(87)74
(5,570)
125(87)38
-
- -
-
14,241(4,477)9,764 837
- -
- 953(15)
74
1,207
6
193(119)
-
(164) (916)291
6156
- (15)
Plant &Equipment
$'000
- - -
(101)837
1,001
- -
MotorVehicles$'000
-
-
- 14,229
- (4,466)9,764
- (11)
6
6(39)(15)
-
- - -
6(44)
50
-
385
(39)(4)
-
Total$'000
173
-
(119)
-
Office furniture& equipment
$'000
48(32)
2011
9,029 4,503
Ultimate recoupment of exploration and evaluation expenditure carried forward is dependent on successful development and commercial exploitation or, alternatively, sale of the respective areas.
Exploration and evaluation expenditure written off during the year relates to the mineral tenements. This is due to the low level of current and planned activity to assess the existence of economically recoverable reserves of the tenements.
2010$'000 $'000
16
161 -
54
54
Land &Buildings
$'000
50
6
-
(916)
616,545
Consolidated
16,643(5,677)10,966
Company
4,503 3,6465,294 1,058(767) (202)
- -

Notes to the Financial Report 2011
12. DEVELOPMENT EXPENDITURE
Development expenditure brought forward (acquired)Transfer from exploration and evaluation costsDevelopment expenditure this yearAccumulated amortisationDevelopment expenditure carried forward
13. TRADE AND OTHER PAYABLES
Trade payablesOther payables
Fair Value and Risk Exposures(i) Due to the short term nature of these payables, their carrying value is assumed to approximate their fair value.(ii) Details regarding liquidity risk are disclosed in note 24.(iii) Trade and other payables are unsecured and usually paid within 60 days of recognition.
14. BORROWINGS(a) Current
Term PurchaseHire Purchase Agreement
(b) Non-CurrentTerm PurchaseHire Purchase Agreement
Risk ExposuresDetails of the group’s exposure to risks arising from borrowings are set out in note 24.
(i) $10 million debt facility; and(ii) $5 million working capital facility.
41 Northern Star Resources Ltd
$'000 $'0002011
421
199
$'000
2010
- 2,750 -
In July 2010, Northern Star Resources Ltd entered into a Debt Financing Facility Agreement with RMB Australia Holding Pty Ltd. The agreement provides for a:
$'000
-
2,329
2011 2010Consolidated Company
During the year ended 30 June 2011, Northern Star Resources Ltd drew down $15 million of the Debt Financing facility. The final repayment of the $15 million dollar facility was made in Novemeber 2010.
The Group has entered into Hire Purchase Agreements with Atlas Copco and Toyota Finance for the Purchase of Plant and Equipment. The interest rate are fixed and are payable over a period of up to 36 months.
1,3391,140 -
1,053 -
2011 2010$'000
$'000 $'000
697
- - 15,038 -
(18,853)
Consolidated Company
26 - 10,625 697
-
Consolidated Company
$'000
10,599
2010
4,869
2011Consolidated Company
-

Notes to the Financial Report 2011
15. PROVISIONS
(a) CurrentProvision for annual leave
(b) Non-CurrentProvision for long service leaveProvision for rehabilitation
Reconciliation of provision for rehabilitation:Carrying amount at beginning of the yearIncrease during the yearAccretionCarrying amount at end of the year
16. CONTRIBUTED EQUITY
(a) Issued CapitalOrdinary shares fully paid
(b) Movements in Ordinary Share Capital
Summary of Movements
Opening balance at 1 July 2009PlacementsExercise of OptionsTransfer from Option ReserveLess: Cost of IssueClosing Balance at 30 June 2010
PlacementsExercise of OptionsTransfer from Option ReserveLess: Cost of IssueClosing Balance at 30 June 2011
42 Northern Star Resources Ltd
304,830,925 205,902,801
9,577,896
304,830,925
99,260,631
(712)
97,064,275
2,640
2,209324
2,06946,138,123
-
-
The provision for rehabilitation represents the legal obligation for rehabilitation over tenement areas acquired and other non-current assets acquired. The timing of the provision is based on licences in existence at the end of the financial year.
Number of
2,676
Shares
-
$'000
2010
- 2,676 -
-
Company2011 2010
2,676 - 2,863 -
591 - 591 -
- 187
$'000
Consolidated
52,790,000
378
- -
205,902,802
22
$'000
-
13,349
Company
11,506
18,306 - (130)
Consolidated Company2011
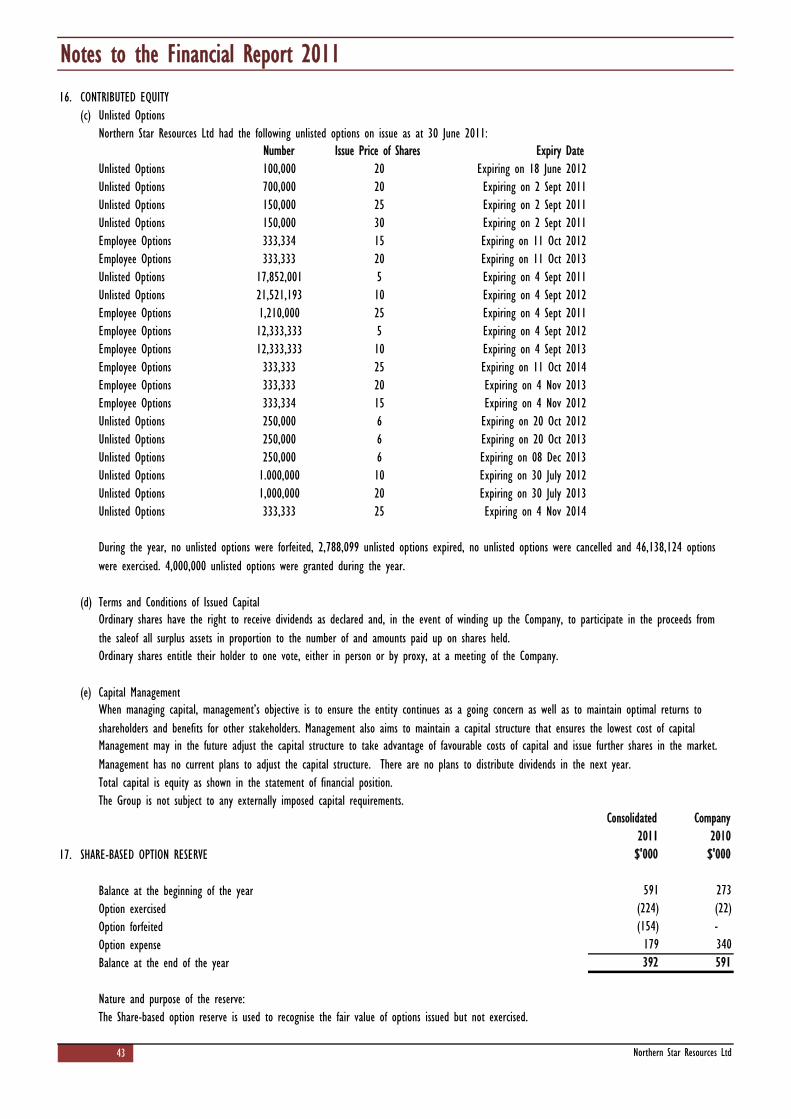
Notes to the Financial Report 201116. CONTRIBUTED EQUITY
(c) Unlisted OptionsNorthern Star Resources Ltd had the following unlisted options on issue as at 30 June 2011:
(d) Terms and Conditions of Issued Capital
(e) Capital Management
Total capital is equity as shown in the statement of financial position.The Group is not subject to any externally imposed capital requirements.
17. SHARE-BASED OPTION RESERVE
Balance at the beginning of the yearOption exercisedOption forfeitedOption expenseBalance at the end of the year
Nature and purpose of the reserve:The Share-based option reserve is used to recognise the fair value of options issued but not exercised.
43
(154) -
Northern Star Resources Ltd
Expiring on 4 Sept 2011
591 273(224)
Unlisted Options 610
700,000Unlisted Options
20
Unlisted Options20Unlisted Options
Unlisted Options
Number100,000 20
Expiring on 2 Sept 2011
Expiring on 11 Oct 2014
Expiring on 2 Sept 2011
Expiring on 11 Oct 2013Expiring on 4 Sept 2011
179 340392
Expiring on 30 July 2012
Expiring on 4 Nov 2013Expiring on 4 Nov 2012Expiring on 20 Oct 2012Expiring on 20 Oct 2013
During the year, no unlisted options were forfeited, 2,788,099 unlisted options expired, no unlisted options were cancelled and 46,138,124 options were exercised. 4,000,000 unlisted options were granted during the year.
(22)
Expiring on 4 Nov 2014
2011 2010
591
$'000
When managing capital, management’s objective is to ensure the entity continues as a going concern as well as to maintain optimal returns to shareholders and benefits for other stakeholders. Management also aims to maintain a capital structure that ensures the lowest cost of capital Management may in the future adjust the capital structure to take advantage of favourable costs of capital and issue further shares in the market. Management has no current plans to adjust the capital structure. There are no plans to distribute dividends in the next year.
150,000
10255102520
25150,000
Employee Options Employee Options 333,333
Employee Options
12,333,333Employee Options 12,333,333
Ordinary shares have the right to receive dividends as declared and, in the event of winding up the Company, to participate in the proceeds from the saleof all surplus assets in proportion to the number of and amounts paid up on shares held.Ordinary shares entitle their holder to one vote, either in person or by proxy, at a meeting of the Company.
Employee Options 333,333Employee Options 333,334
250,000Unlisted Options
Expiring on 4 Sept 2012Expiring on 4 Sept 2013
Expiring on 30 July 2013
517,852,001Unlisted Options 21,521,193Employee Options
3015
333,333
15
Expiring on 4 Sept 2012
Issue Price of Shares
Expiring on 2 Sept 2011
Unlisted Options 1,000,000
$'000
1,210,000Employee Options
Unlisted Options 333,334
250,000
Expiring on 11 Oct 2012
Expiry DateExpiring on 18 June 2012
Unlisted Options 333,333
250,000Unlisted Options 1.000,000
6Unlisted Options
20
Expiring on 08 Dec 20136
25
Consolidated Company
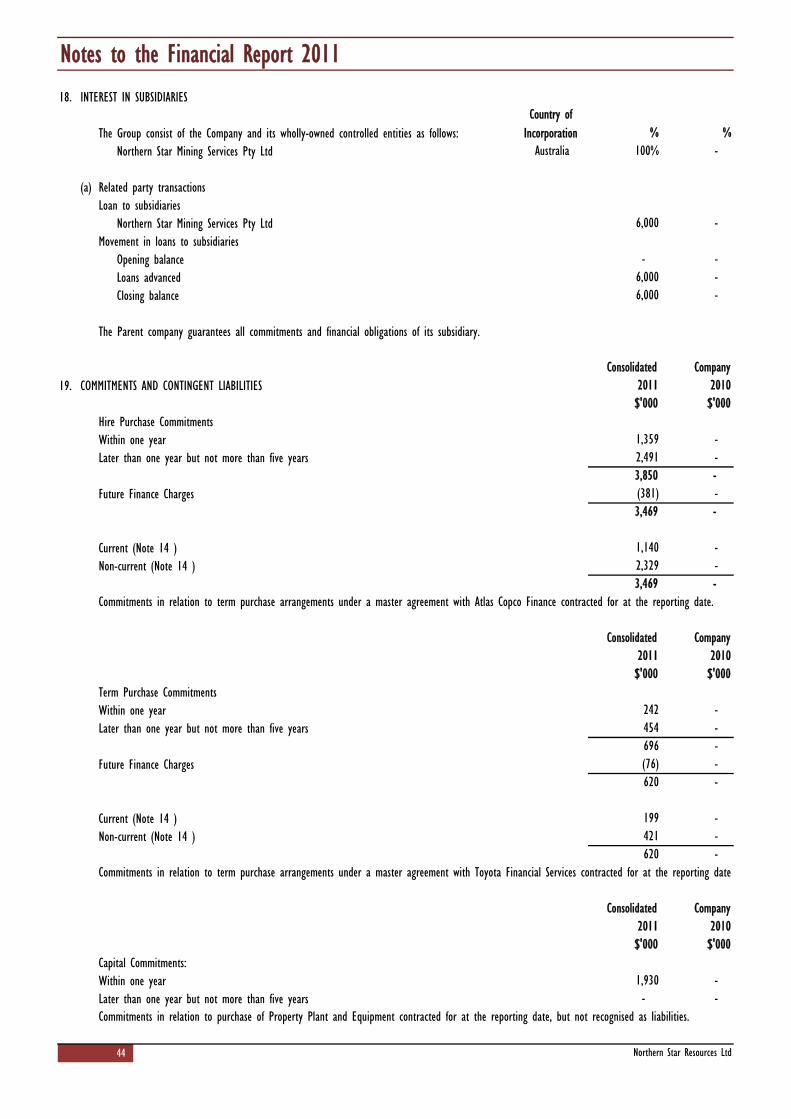
Notes to the Financial Report 201118. INTEREST IN SUBSIDIARIES
The Group consist of the Company and its wholly-owned controlled entities as follows:Northern Star Mining Services Pty Ltd
(a) Related party transactionsLoan to subsidiaries
Northern Star Mining Services Pty LtdMovement in loans to subsidiaries
Opening balanceLoans advancedClosing balance
The Parent company guarantees all commitments and financial obligations of its subsidiary.
19. COMMITMENTS AND CONTINGENT LIABILITIES
Hire Purchase CommitmentsWithin one yearLater than one year but not more than five years
Future Finance Charges
Current (Note 14 )Non-current (Note 14 )
Term Purchase CommitmentsWithin one yearLater than one year but not more than five years
Future Finance Charges
Current (Note 14 )Non-current (Note 14 )
Capital Commitments:Within one yearLater than one year but not more than five years
44 Northern Star Resources Ltd
Country of Incorporation
Company
$'000
-
- -
696 - (76) - 620 -
-
2011 2010$'000
242 - 454
-
3,850
199421 - 620
$'000
Consolidated
1,930 -
- 3,469
(381) -
%100%
2,491
Company2011 2010
1,359 -
-
%Australia
3,469
-
-
-
1,140 -
-
Commitments in relation to term purchase arrangements under a master agreement with Atlas Copco Finance contracted for at the reporting date.
-
2,329
$'000
Consolidated2010
$'000 $'000
-
Commitments in relation to term purchase arrangements under a master agreement with Toyota Financial Services contracted for at the reporting date
Commitments in relation to purchase of Property Plant and Equipment contracted for at the reporting date, but not recognised as liabilities.
2011Company
6,000 - -
6,000 -
6,000
Consolidated
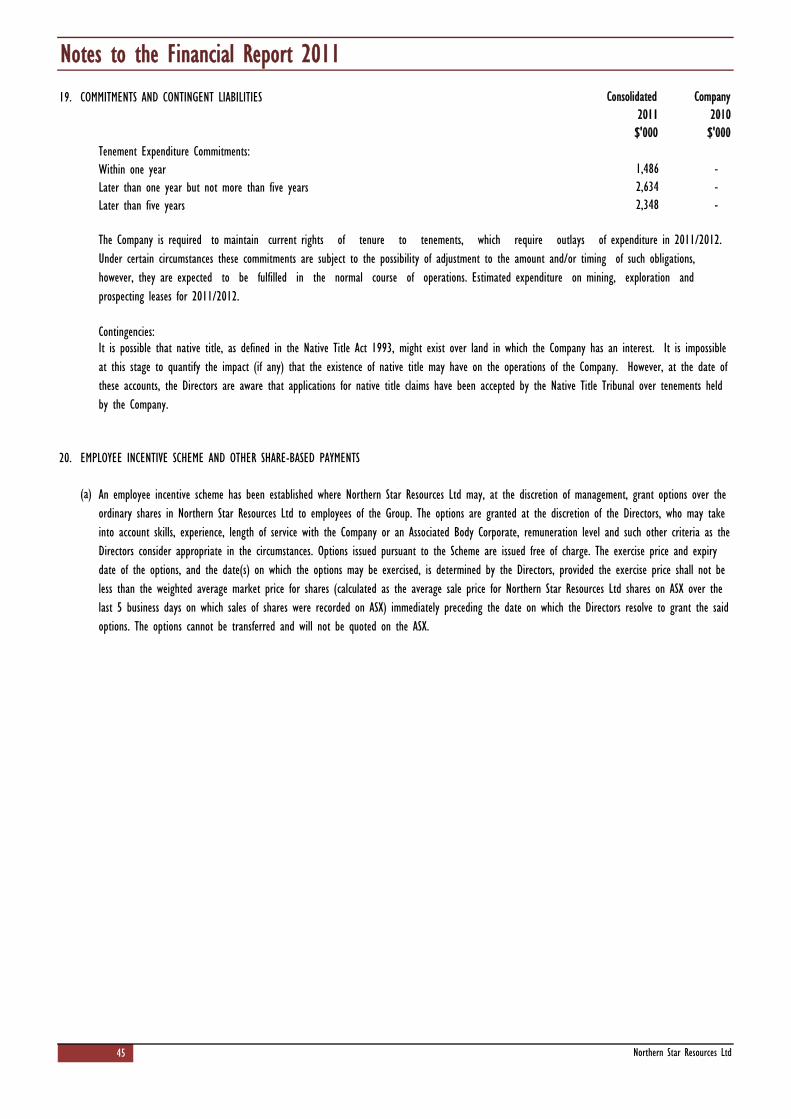
Notes to the Financial Report 201119. COMMITMENTS AND CONTINGENT LIABILITIES
Tenement Expenditure Commitments:Within one yearLater than one year but not more than five yearsLater than five years
Contingencies:
20. EMPLOYEE INCENTIVE SCHEME AND OTHER SHARE-BASED PAYMENTS
(a)
45 Northern Star Resources Ltd
Consolidated
$'000 $'000
It is possible that native title, as defined in the Native Title Act 1993, might exist over land in which the Company has an interest. It is impossible at this stage to quantify the impact (if any) that the existence of native title may have on the operations of the Company. However, at the date of these accounts, the Directors are aware that applications for native title claims have been accepted by the Native Title Tribunal over tenements held by the Company.
Company
The Company is required to maintain current rights of tenure to tenements, which require outlays of expenditure in 2011/2012. Under certain circumstances these commitments are subject to the possibility of adjustment to the amount and/or timing of such obligations, however, they are expected to be fulfilled in the normal course of operations. Estimated expenditure on mining, exploration and prospecting leases for 2011/2012.
-
An employee incentive scheme has been established where Northern Star Resources Ltd may, at the discretion of management, grant options over the ordinary shares in Northern Star Resources Ltd to employees of the Group. The options are granted at the discretion of the Directors, who may take into account skills, experience, length of service with the Company or an Associated Body Corporate, remuneration level and such other criteria as the Directors consider appropriate in the circumstances. Options issued pursuant to the Scheme are issued free of charge. The exercise price and expiry date of the options, and the date(s) on which the options may be exercised, is determined by the Directors, provided the exercise price shall not be less than the weighted average market price for shares (calculated as the average sale price for Northern Star Resources Ltd shares on ASX over the last 5 business days on which sales of shares were recorded on ASX) immediately preceding the date on which the Directors resolve to grant the said options. The options cannot be transferred and will not be quoted on the ASX.
1,486 - 2,634 - 2,348
2011 2010
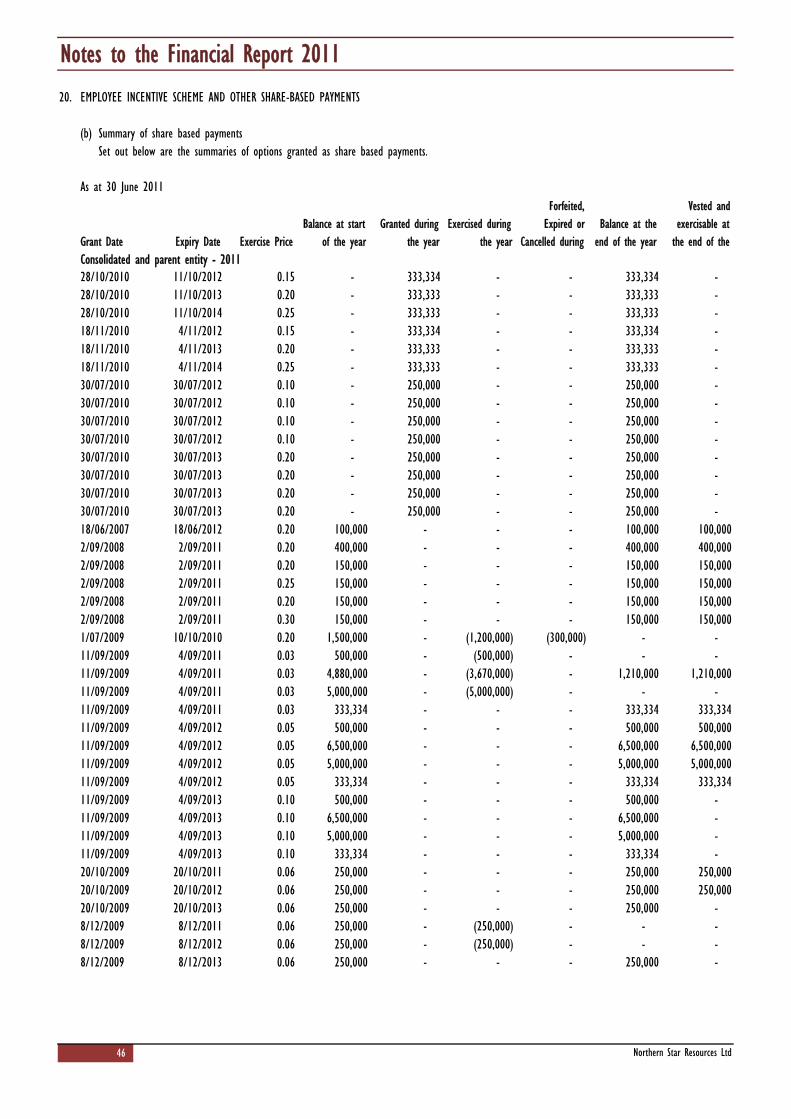
Notes to the Financial Report 201120. EMPLOYEE INCENTIVE SCHEME AND OTHER SHARE-BASED PAYMENTS
(b) Summary of share based paymentsSet out below are the summaries of options granted as share based payments.
Consolidated and parent entity - 2011
46 Northern Star Resources Ltd
- 250,000 -
- 150,000 150,000
250,000 -
8/12/2009 8/12/2012 0.06 250,000 - (250,000) - - -
- - - 250,000 250,000
20/10/2009 20/10/2013 0.06
8/12/2009 8/12/2013 0.06 250,000 - - - 250,000 -
- 8/12/2009 8/12/2011 0.06 250,000 - (250,000) - - -
250,000 -
11/09/2009 4/09/2013 0.10 5,000,000 - - - 5,000,000 - 11/09/2009 4/09/2013 0.10 333,334 - - - 333,334 - 20/10/2009 20/10/2011 0.06 250,000 - 250,00020/10/2009 20/10/2012 0.06 250,000 -
11/09/2009 4/09/2013 0.10 500,000 - - - 500,000 - 11/09/2009 4/09/2013 0.10 6,500,000 - - - 6,500,000 -
11/09/2009 4/09/2012 0.05 5,000,000 - - - 5,000,000 5,000,00011/09/2009 4/09/2012 0.05 333,334 - - - 333,334 333,334
11/09/2009 4/09/2012 0.05 500,000 - - - 500,000 500,00011/09/2009 4/09/2012 0.05 6,500,000 - - - 6,500,000 6,500,000
11/09/2009 4/09/2011 0.03 333,334 - - - 333,334 333,334
11/09/2009 4/09/2011 0.03 4,880,000 - 11/09/2009 4/09/2011 0.03 500,000 - (500,000)
(3,670,000) - 1,210,000 1,210,00011/09/2009 4/09/2011 0.03 5,000,000 - (5,000,000) - -
1/07/2009 10/10/2010 0.20 1,500,000 - (1,200,000)
- - 2/09/2008 2/09/2011
- - 2/09/2008 2/09/2011 0.25 150,000
-
-
150,000
0.20
250,000 - - 30/07/2013 0.20 - 250,000
0.20 150,000 - -
2/09/2008 2/09/2011 0.30 150,000 - -
30/07/2010 30/07/2013 0.20 - 250,000 - - 250,000 - 30/07/2010 30/07/2013 0.20 - 250,000 - - 250,000 -
30/07/2010 30/07/2012 0.10 - 250,000 - - 250,000 - 30/07/2010 30/07/2012 0.10 - 250,000 - - 250,000 - 30/07/2010 30/07/2012 0.10 - 250,000
333,333 -
-
2/09/2011 0.20 400,000 - - - 400,000 400,000
- 150,000 150,000150,000
- - -
150,000
-
250,000 - 250,000 -
- 150,000 150,000
2/09/2008
-
- - 11/10/2012 333,33428/10/2010 11/10/2013
0.15 -
18/11/2010
18/06/2007
28/10/20100.15
100,000
250,000 - -
333,334
333,334
333,333 -
0.20 -
18/06/2012 0.20 100,000 - 100,000
2/09/2008 2/09/2011 0.20
28/10/2010
30/07/2010 -
- 30/07/2010 30/07/2013
333,333 -
- 333,334 - -
0.10 -
- - 333,333 -
Exercised during the year
Forfeited, Expired or
Cancelled during Balance at the
end of the year
Vested and exercisable at
the end of the Balance at start
of the year
As at 30 June 2011
Grant Date Expiry Date Exercise Price
4/11/2012
Granted during the year
250,000
-
-
(300,000) -
-
-
18/11/2010
-
30/07/2010 30/07/2012
11/10/2014 0.25 - 333,333
4/11/2013 0.20 - 333,333 - - 333,333 - 18/11/2010 4/11/2014 0.25 -
-
333,333 - -
-
250,000
-

Notes to the Financial Report 201120. EMPLOYEE INCENTIVE SCHEME AND OTHER SHARE-BASED PAYMENTS
Consolidated and parent entity - 2010
21. KEY MANAGEMENT PERSONNEL DISCLOSURES
(a) Key management personnel compensationShort-term employee benefits - cash fees and bonusPost-employment benefits - superannuationEquity based payments
(b) Equity Instruments Discolsures Relating to Key Management Personnel
(i) Share Holdings
47
Grant Date Expiry Date Exercise PriceBalance at start
of the yearGranted during
the year
Northern Star Resources Ltd
Exercised during the year
Forfeited, Expired or
Cancelled during Balance at the
end of the year
Vested and exercisable at
the end of the
11/09/2009 4/09/2011 0.03 500,000 - - - 500,000 500,000
11/09/2009 0.03
8/12/2009 8/12/2013 0.06 250,000 - - - 250,000 -
8/12/2009 8/12/2011 0.06 250,000 - - - 250,000 250,0008/12/2009 8/12/2012 0.06 250,000 - - - 250,000 -
- - - 5,000,000
250,000 -
11/09/2009 4/09/2012
333,334 -
20/10/2009 20/10/2011 0.06 250,000 - - - 250,000 250,000
11/09/2009 4/09/2013 0.10 5,000,000 -
20/10/2009 20/10/2012
- 333,334 -
-
-
-
333,334 333,334500,000
0.06
- -
-
6,500,000 -
-
-
20/10/2009 20/10/2013 0.06 250,000 - - - 250,000 -
150,000 - - 150,0002/09/2008 2/09/2011
- -
- 5,000,000 -
- 333,334 - - 500,000
396
5,000,000
-
2/09/2008 2/09/2011 0.30 150,000 - - - 150,000 150,000
13
- - - 6,500,000 - 11/09/2009
11/09/2009
1,500,000
2011
4/09/2013
- -
2/09/2008
4/09/2012 0.05
11/09/2009
250,000
0.10 333,334 -
0.054/09/2012 0.05 5,000,000
4/09/2011
6,500,000
11/09/2009 4/09/2011 0.03 6,500,000 - (1,620,000) - 4,880,000 4,880,00011/09/2009 4/09/2011 0.03 5,000,000
2/09/2008 2/09/2011 0.20 400,000 -
0.25 150,000 - -
- -
$'000 $'000
-
1/07/2009 10/10/2010 0.20 1,500,000 -
18/06/2007 18/06/2012 0.20 100,000 - - - 100,000 100,000
11/09/2009 4/09/2012 0.05
-
333,334 - - 11/09/2009 4/09/2013 0.10 500,000 - - 11/09/2009
0.20
2010
- - - 5,000,000
- 0.20
400,000 400,000 -
4/09/2013 0.10
150,000 150,0002/09/2008 2/09/2011 150,000
2/09/2011
86 3323
- 150,000 150,000
-
601
150,000
- -
- - 1,500,000
6,500,000500,000
The number of ordinary shares in the Company held during the financial year by each Director of Northern Star Resources Ltd and any other key management personnel of the Group, including their personally related parties, are as follows
Consolidated Company

Notes to the Financial Report 201121 KEY MANAGEMENT PERSONNEL DISCLOSURES
Shares (held directly and indirectly) - Number
Shares (held directly and indirectly) - Number
There were no shares granted during the year as compensation (2010: nil).
(i) Option Holdings
Options (held directly and indirectly) - Number
48
4,130,000
Key Management Personnel
Bill Beament - 4,130,000
Net Change during the year
Balance at the end of the year
2010
DirectorsChristopher RoweBill Beament
470,666 1,191,666
The number of options over ordinary shares in the Company held during the financial year by each Director of Northern Star Resources Ltd and any other key management personnel of the Group, including their personally related parties, are as follows:
2011
2011
-
31,869,320 26,869,320 -
1,205,998 872,664
Name
47,803,980 - (15,934,660) -
2,729,362 2,229,362Bill Beament
-
Name
-
Granted during the year
Exercised during the year
Forfeited, Expired or
Cancelled during DirectorsChristopher Rowe
21,040,000 - (3,670,000) (2,000,000) 15,370,000 8,870,000836,666
(1,364,681)
Balance at start of the year
4,094,043
Balance at the end of the year
Key Management PersonnelKaren Brown
721,000
Northern Star Resources Ltd
(586,666) - 250,000 -
Vested and exercisable at
the end of the
-
Peter Farris Michael Fotios
1,205,998 -
Michael Fotios
Key Management PersonnelKaren Brown
Karen Brown 515,000 206,000
Peter Farris - 1,863,332Michael Fotios - 48,976,394
1,931,152 4,581,152
48,976,394
(813,334)5,370,000 9,500,000
1,863,332
4,581,152 1,864,681 6,445,833
NameBalance at start
of the year
48,976,394 18,794,660 67,771,054
1,863,332
Balance at start of the year
Peter Farris 1,049,998
Net Change during the year
Balance at the end of the year
Christopher Rowe 2,650,000Directors
721,000
4,130,000

Notes to the Financial Report 201121. KEY MANAGEMENT PERSONNEL DISCLOSURES
Options (held directly and indirectly) - Number
(c) Other Related Party Transactions with Key Management Personnel
22. AUDITOR'S REMUNERATION
Rothsay Chartered Accountants - Auditors for the Group
23. SEGMENT INFORMATION
24. JOINT VENTURES
The Group has the following interest in unincorporated joint ventures:
Joint VentureCullen Exploration Pty Ltd - Hardey Junction Joint VentureArtemis Resources Ltd - Mt Clement Joint VentureU3O8 Ltd - Tunganary Joint Venture
49 Northern Star Resources Ltd
Exploration 10% 10%
2011
80% 0%
63
Company
Michael Fotios, a related party, is a shareholder and director of Delta Resources Management Pty Ltd. During the year an amount of $576,212 was paid to Delta Resources for professional services at normal commercial rates. Michael Fotios is also a shareholder and director of Investmet Limited. During the year and amount of $85,800 was paid to this business for corporate advice at normal commercial rates.
Consolidated
ExplorationExploration
20
2011Company
2010
2010
20% 0%
2010
Balance at start of the year
Granted during the year
Exercised during the year
Forfeited, Expired or
Cancelled during
-
During the year the following fees were paid or payable for services provided by the auditor of the parent entity, its related practices and non-related audit firms:
Management has determined the operating segments based on the reports reviewed by the board of directors that are used to make strategic decisions. The consolidated entity does not have any operating segments with discrete financial information. All the group’s assets and liabilities are located within Australia. The Board of Directors review internal management reports on a monthly basis that is consistent with the information provided in the statement of comprehensive income, statement of financial position and statement of cash flows. As a result no reconciliation is required because the information as presented is what is used by the Board to make strategic decisions.
$'000$'000
Michael Fotios - 47,803,980
Key Management PersonnelKaren Brown - 1,205,998 - - 1,205,998 539,330
The joint ventures are not separate legal entities. They are contractual arrangements between participants for the sharing of costs and outputs and do not in themselves generate revenue and profit. The joint ventures are of the type where initially one party contributes tenements with the other party earning a specified percentage by funding exploration activities; thereafter the parties often share exploration and development costs and output in proportion to their ownership of joint venture assets. The joint ventures do not hold any assets and accordingly the Company’s share of exploration evaluation and development expenditure is accounted for in accordance with the policy set out in note 1.
PrincipalActivities
Consolidated
- Peter Farris - (173,332) - 836,666 336,666
3,427,375Bill Beament 2,000,000 21,379,998 (2,339,998) - 21,040,000 8,040,000
37,803,980
Balance at the end of the year
4,094,043 - - 4,094,043
47,803,9801,009,998
Vested and exercisable at
the end of the NameDirectorsChristopher Rowe -
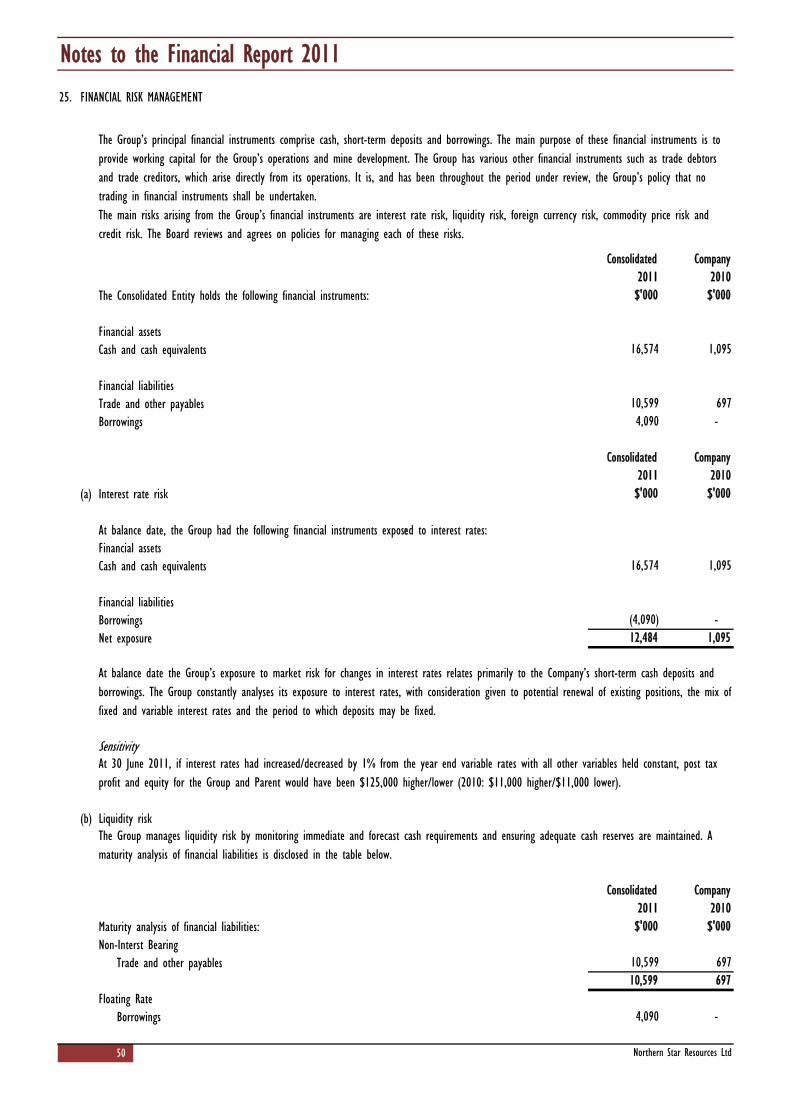
Notes to the Financial Report 201125. FINANCIAL RISK MANAGEMENT
The Consolidated Entity holds the following financial instruments:
Financial assetsCash and cash equivalents
Financial liabilitiesTrade and other payablesBorrowings
(a) Interest rate risk
At balance date, the Group had the following financial instruments exposed to interest rates:Financial assetsCash and cash equivalents
Financial liabilitiesBorrowingsNet exposure
Sensitivity
(b) Liquidity risk
Maturity analysis of financial liabilities:Non-Interst Bearing
Trade and other payables
Floating RateBorrowings
50
The Group manages liquidity risk by monitoring immediate and forecast cash requirements and ensuring adequate cash reserves are maintained. A maturity analysis of financial liabilities is disclosed in the table below.
Northern Star Resources Ltd
10,599
Consolidated Company
697
$'000 $'000
Consolidated Company
(4,090) - 12,484 1,095
10,599 697
10,599 6974,090 -
$'000 $'000
At 30 June 2011, if interest rates had increased/decreased by 1% from the year end variable rates with all other variables held constant, post tax profit and equity for the Group and Parent would have been $125,000 higher/lower (2010: $11,000 higher/$11,000 lower).
16,574
Consolidated Company2011 2010
1,095
4,090 -
$'000
2011 2010
16,574 1,095
$'000
The Group’s principal financial instruments comprise cash, short-term deposits and borrowings. The main purpose of these financial instruments is to provide working capital for the Group’s operations and mine development. The Group has various other financial instruments such as trade debtors and trade creditors, which arise directly from its operations. It is, and has been throughout the period under review, the Group’s policy that no trading in financial instruments shall be undertaken.The main risks arising from the Group’s financial instruments are interest rate risk, liquidity risk, foreign currency risk, commodity price risk and credit risk. The Board reviews and agrees on policies for managing each of these risks.
2011 2010
At balance date the Group’s exposure to market risk for changes in interest rates relates primarily to the Company’s short-term cash deposits and borrowings. The Group constantly analyses its exposure to interest rates, with consideration given to potential renewal of existing positions, the mix of fixed and variable interest rates and the period to which deposits may be fixed.

Notes to the Financial Report 201125. FINANCIAL RISK MANAGEMENT
(c) Foreign Currency Risk
(d) Commodity Price Risk
(e) Credit risk
Cash and cash equivalentsAA
26. PARENT ENTITY INFORMATION
(a) Information relating to Northern Star Resources Ltd:
Results of the parent entityProfit/(Loss) for the periodOther comprehensive income for the yearTotal comprehensive income for the year
Financial position of the parent entity at year endCurrent assetsNon current assetsTotal assets
Current liabilitiesNon current liabilitiesTotal liabilitiesNet assets
Contributed equityReservesRetained earningsTotal equity
51 Northern Star Resources Ltd
5919,622
18,306 13,349
(8,855)
20102011$'000$'000
20,472 4,54245,213 5,781
- - 21,348
24,742 1,239
The Consolidated Entity measures credit risk on a fair value basis. The carrying amount of financial assets recorded in the financial statements, net of any provision for losses, represents the Consolidated Entity’s maximum exposure to credit risk. All receivables noted above are due within 30 days. None of the above receivables are past due.
21,348 (1,281)
(1,281)
392
12,564 6974,330 -
16,894 69728,319 5,084
28,319 5,084
2011 2010$'000 $'000
16,574 1,095
The credit quality of financial assets that are neither past due nor impaired can be assessed by reference to external credit ratings (if available) or to historical information about counterparty default rates:
Consolidated Company
Credit risk refers to the risk that a counterparty will default on its contractual obligations resulting in financial loss to the Group. The Group has adopted the policy of dealing with creditworthy counterparties and obtaining sufficient collateral or other security where appropriate, as a means of mitigating the risk of financial loss from defaults. Cash is deposited only with institutions with a minimum credit rating of AA (or equivalent) as determined by a reputable credit rating agency e.g. Standard & Poor. The Group has all cash deposited with one bank. The Group does not have any other significant credit risk exposure to a single counterparty or any group of counterparties having similar characteristics.
As a result of exposure to the gold commodity market, the Company has exposure to the USD. The Company manages this exposure by selling gold in AUD.
The Group does not hold financial instruments which are exposed to commodity price risk (2010: Nil)

Notes to the Financial Report 201126. PARENT ENTITY INFORMATION
(b) Details of any guarantees entered into by the parent entity in relation to the debts of its subsidiariesRefer to Note 19
(c) Details of any contingent liabilities of the parent entityRefer to Note 19
(d) Details of any contractual commitments by the parent entity for the acquisition of plant,plant and equipmentThere are no contractual commitments by the parent entity for the acquisition of property, plant and equipment as at reporting date.
(e ) Tax Consolidation
27 EVENTS SUBSEQUENT TO YEAR END
(a)
(b)
(c)
(d)
(e)
52
There are no other matters or circumstances other than the future development of the production site that have arisen since 30 June 2011 that have or may significantly affect the operations, results, or state of affairs of the Group in future financial years, except for the following.
On 28 July 2011 93,332 options were exercised at 5c per option and 246,666 options were exercised at 10c per option on this date.
On 16 August 2011, 2,781,290 options were exercised at 5c per option, 121,167 options were exercised at 10c per option and 1,210,000 options were exercised at 2.5c per option on this date.
On 25 August 2011, 333,334 options were issued at an issue price of 35c per share, 333,333 options were issued at an issue price of 50c per share and 333,333 options were issued at an issue price of 65c per share. In addition to this, 13,700,466 options were exercised at 5c per option, 12,294,655 options were exercised at 10c per option and 11,500,000 options were exercised at 5c per option, 250,000 options were exercised at 10c per option and 500,000 options were exercised at 20c per option on this date.
On 4 September 2011 235,426 options lapsed unexercised on this date.
On 8 September 2011, 1,041,507 options were exercised at 5c per option and 568,293 options were exercised at 10c per option on this date.
Northern Star Resources Ltd
The Company and its 100% owned controlled entities have formed a tax consolidated group. Members of the group entered into a tax sharing arrangment in order to allocate income tax expense to the wholly owned controlled entities. The head entity of the consolidated group is Northern Star Resources Ltd.
Di
In a In t1.
2.
3.
On
Bill ManPert26
rectors’ D
53
accordance with a
the opinion of the(a) the financial with the Corpora
i. giving a tdate; and
ii. complying
(b) there are rea
(c) the remunerasection 300A of
The company haStandards (IFRS).
This declaration Act 2001 for the
behalf of the Boa
Beament naging Director th, Western AustraSeptember 2011
Declaration
a resolution of the
e Directors: statements, noteations Act 2001, i
true and fair view
g with Accounting
asonable grounds
ation disclosures sthe Corporations
as included in the.
has been made e financial year en
ard
alia
n 2011
e Board of Directo
es and audited reincluding:
w of the Compan
Standards and Co
to believe that th
set out in the DirAct 2001.
notes to the fin
after receiving thnding 30 June 20
ors, I state that:
muneration disclo
y’s and Group’s f
orporations Regula
he Company will b
rectors’ Report (as
ancial statements
e declarations req011.
osures included in
financial position
ations 2001; and
be able to pay it
s part of the aud
an explicit and u
quired to be mad
the directors’ re
at 30 June 2011
s debts as and w
ited Remuneration
unreserved statem
de to the Directo
eport of the Comp
1 and of their pe
hen they become
n Report) for the
ment of compliance
rs in accordance
| No
pany and the Gro
erformance for th
due and payable
year ended 30 Ju
e with Internation
with section 295
orthern Star Resource
oup are in accord
e year ended on
e; and
une 2011 comply
nal Financial Repo
5A of the Corpora
es Ltd
dance
that
with
orting
ations


Additional ASX Information 2011
56 | Northern Star Resources Ltd
Additional information required by the Australian Securities Exchange and not shown elsewhere in this report is as follows. The information is current as at 19 September 2011.
TWENTY LARGEST SHAREHOLDERS Name Number of Ordinary shares Percentage of Issue Capital
1 Investmet Limited 65,536,900 18.77%
2 National Nominees Limited 14,748,168 4.22%
3 Mr William James Beament <The Beament Family A/C> 14,370,000 4.12%
4 J P Morgan Nominees Australia 13,416,902 3.84%
5 Delta Resource Management Pty Ltd 12,160,000 3.48%
6 Wyllie Group Pty Ltd 10,000,000 2.86%
7 HSBC Custody Nominees 8,578,769 2.46%
8 Little Breton Nominees Pty Ltd <The Little Breton S/F A/C> 7,363,846 2.11%
9 Mr Michael George Fotios <Michael Fotios Family A/C> 4,713,052 1.35%
10 Multi Metal Consultants Pty Ltd <The Mmc S/F A/C> 4,326,125 1.24%
11 Lujeta Pty Ltd <The Margaret Account> 4,200,000 1.20%
12 Kyim Pty Ltd <The Ransted Family Fund A/C> 4,198,333 1.20%
13 Auralandia No Liability 4,114,250 1.18%
14 Leefab Pty Ltd 3,199,998 0.92%
15 Mr Ian Davies 3,000,000 0.86%
16 Sharic Superannuation Pty Ltd <Farris Super Fund A/C> 3,000,000 0.86%
17 Viridian Capital Pty Ltd 3,000,000 0.86%
18 Citicorp Nominees Pty Limited 2,569,153 0.74%
19 Pan Australian Nominees Pty Limited 2,318,443 0.66%
20 Mrs Catherine Anne Wilkinson 2,165,000 0.62%
Total 186,978,939 53.55%
SUBSTANTIAL SHAREHOLDERS The substantial shareholders as disclosed in the substantial shareholding notices received by the Company are:
Name Number of Ordinary shares
Investmet Limited 65,536,900
Paradice Investment Management Pty Ltd 23,438,775
Mr Michael George Fotios 19,103,474
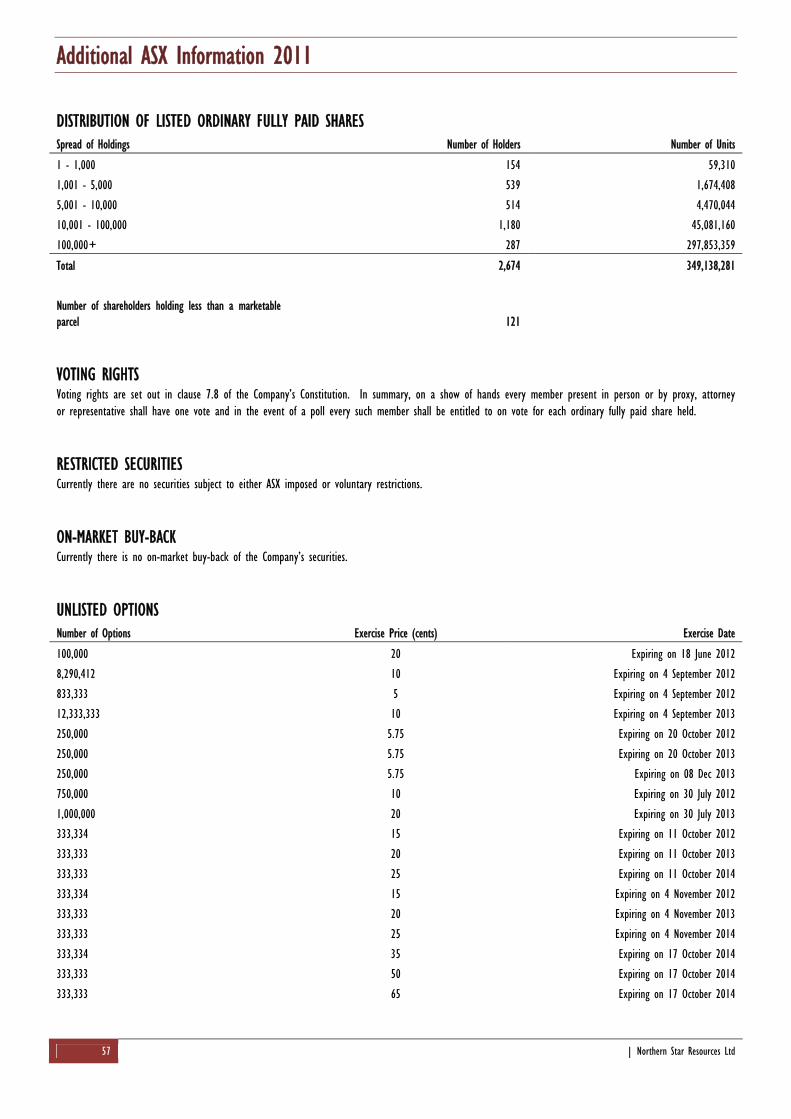
Additional ASX Information 2011
57 | Northern Star Resources Ltd
DISTRIBUTION OF LISTED ORDINARY FULLY PAID SHARES Spread of Holdings Number of Holders Number of Units
1 - 1,000 154 59,310
1,001 - 5,000 539 1,674,408
5,001 - 10,000 514 4,470,044
10,001 - 100,000 1,180 45,081,160
100,000+ 287 297,853,359
Total 2,674 349,138,281
Number of shareholders holding less than a marketable parcel 121
VOTING RIGHTS Voting rights are set out in clause 7.8 of the Company’s Constitution. In summary, on a show of hands every member present in person or by proxy, attorney or representative shall have one vote and in the event of a poll every such member shall be entitled to on vote for each ordinary fully paid share held.
RESTRICTED SECURITIES Currently there are no securities subject to either ASX imposed or voluntary restrictions.
ON-MARKET BUY-BACK Currently there is no on-market buy-back of the Company’s securities.
UNLISTED OPTIONS Number of Options Exercise Price (cents) Exercise Date
100,000 20 Expiring on 18 June 2012
8,290,412 10 Expiring on 4 September 2012
833,333 5 Expiring on 4 September 2012
12,333,333 10 Expiring on 4 September 2013
250,000 5.75 Expiring on 20 October 2012
250,000 5.75 Expiring on 20 October 2013
250,000 5.75 Expiring on 08 Dec 2013
750,000 10 Expiring on 30 July 2012
1,000,000 20 Expiring on 30 July 2013
333,334 15 Expiring on 11 October 2012
333,333 20 Expiring on 11 October 2013
333,333 25 Expiring on 11 October 2014
333,334 15 Expiring on 4 November 2012
333,333 20 Expiring on 4 November 2013
333,333 25 Expiring on 4 November 2014
333,334 35 Expiring on 17 October 2014
333,333 50 Expiring on 17 October 2014
333,333 65 Expiring on 17 October 2014

Tenement Schedule 2011
58 | Northern Star Resources Ltd
Tenement Number Project Name and Location Interest
E08/1744 Paulsens, Ashburton WA 100% E08/1745 Paulsens, Ashburton WA 100% E47/1134 Paulsens, West Pilbara WA 100% E47/1553 Paulsens, West Pilbara WA 100% E08/1187 Paulsens, Ashburton WA 100% E08/1649 Paulsens, Ashburton WA 100% E08/1845 Paulsens, Ashburton WA 100% E(A)08/2251 Paulsens, Ashburton WA 100% E(A)08/2252 Paulsens, Ashburton WA 100% M08/196 Paulsens, Ashburton WA 100% M08/99 Paulsens, Ashburton WA 100% M08/222 Paulsens, Ashburton WA 100% P08/516 Paulsens, Ashburton WA 100% P08/543 Paulsens, Ashburton WA 100% P08/544 Paulsens, Ashburton WA 100% P08/565 Paulsens, Ashburton WA 100% P(A)08/625 Paulsens, Ashburton WA 100% P(A)08/626 Paulsens, Ashburton WA 100% P47/1264 Paulsens, West Pilbara WA 100% P47/1265 Paulsens, West Pilbara WA 100% P47/1313 Paulsens, West Pilbara WA 100% L08/12-15 Paulsens, Ashburton WA 100% E08/1166 Hardey Junction JV, Ashburton WA 80% E08/1189 Hardey Junction JV, Ashburton WA 80% E08/1763 Hardey Junction JV, Ashburton WA 80% E08/1842 Hardey Junction JV, Ashburton WA 80% E08/1843 Hardey Junction JV, Ashburton WA 80% E08/1844 Hardey Junction JV, Ashburton WA 80% P08/546 Hardey Junction JV, Ashburton WA 80% E08/1606 Mt Clement JV, Ashburton WA 20% free carried M08/191 Mt Clement JV, Ashburton WA 20% free carried M08/192 Mt Clement JV, Ashburton WA 20% free carried M08/193 Mt Clement JV, Ashburton WA 20% free carried E(A)08/2232 Ashburton, Ashburton WA 100% E(A)08/2240 Ashburton, Ashburton WA 100% E08/1650 Ashburton, Ashburton WA 100% E52/1941 Ashburton, Peak Hill WA 100% M52/639 Ashburton, Peak Hill WA 100% M52/640 Ashburton, Peak Hill WA 100% M52/734 Ashburton, Peak Hill WA 100% M52/735 Ashburton, Peak Hill WA 100% E51/1391 Cheroona, Murchison WA 100% E52/2509 Beatty Park, Peak Hill WA 100% E80/2612 Emull (Red Billabong), Kimberley WA 100% E80/2394 Golden Crown, Kimberley WA 100% E80/3550 Tunganary JV, Kimberley WA 10% free carried E80/3640 Tunganary JV, Kimberley WA 10% free carried E80/4001 Range (Wilson River), Kimberley WA 100%