
Northern Australian Aspirations
16
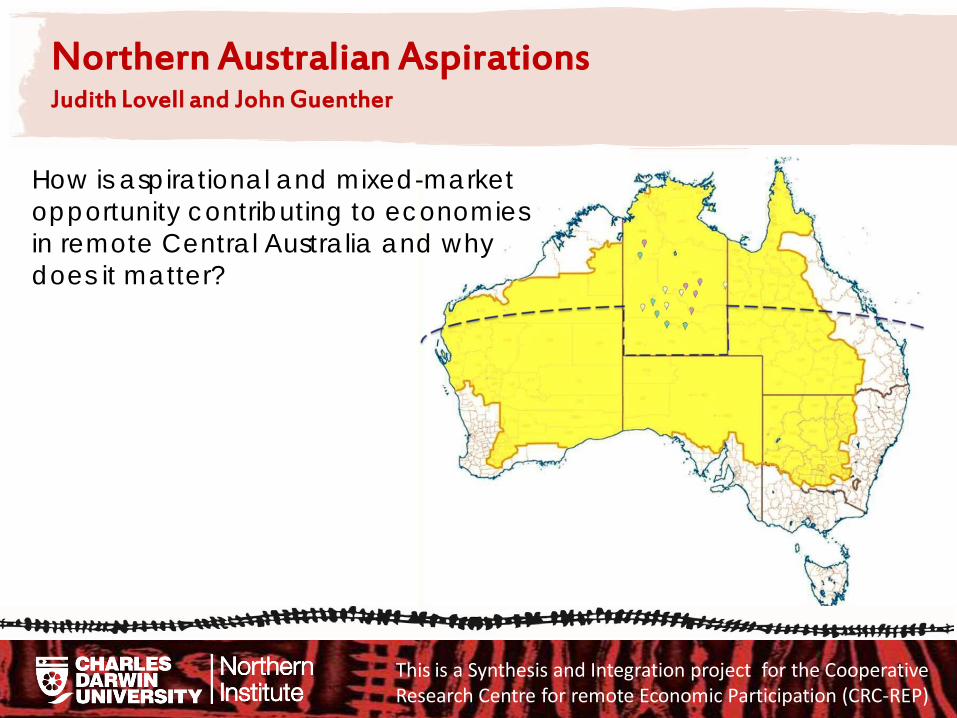
Northern Australian Aspirations Judith Lovell and John Guenther How is aspirational and mixed-market opportunity contributing to economies in remote Central Australia and why does it matter? This is a Synthesis and Integration project for the Cooperative Research Centre for remote Economic Participation (CRC-REP)
-
Upload
nintione -
Category
Economy & Finance
-
view
36 -
download
0
Transcript of Northern Australian Aspirations
Northern Australian Aspirations
Judith Lovell and John Guenther
How is aspirational and mixed-market opportunity contributing to economies in remote Central Australia and why does it matter?
This is a Synthesis and Integration project for the Cooperative Research Centre for remote Economic Participation (CRC-REP)

Terminology ‘Non-Market’ is Wolf’s (1979) conceptualization. It includes government, philanthropy, charity and others acting in the public sector ‘Mixed-market’ includes the influence of customary (Altman, 2006) and other market economies. In our sample mixed-market activity intersects with non-market economic activity non-markets
(public) customary and other markets
mixed-markets

What does Literature tell us?
Human Capital Theory ….education, mobility and employment are causal, logical and consequential (Tan, 2012) Neo-classical economics … income is a good proxy for wellbeing (Colquhoun and Dockery, 2012). Public policy should serve the interests of wellbeing (Dockery, 2015) Remote and sparse populations need fine grained analysis to establish how change impacts on services and business (Carson et.al 2014) Expression of Indigenous Knowledge is a human right (UNESCO) … and we suggest it is also a huge local and regional advantage
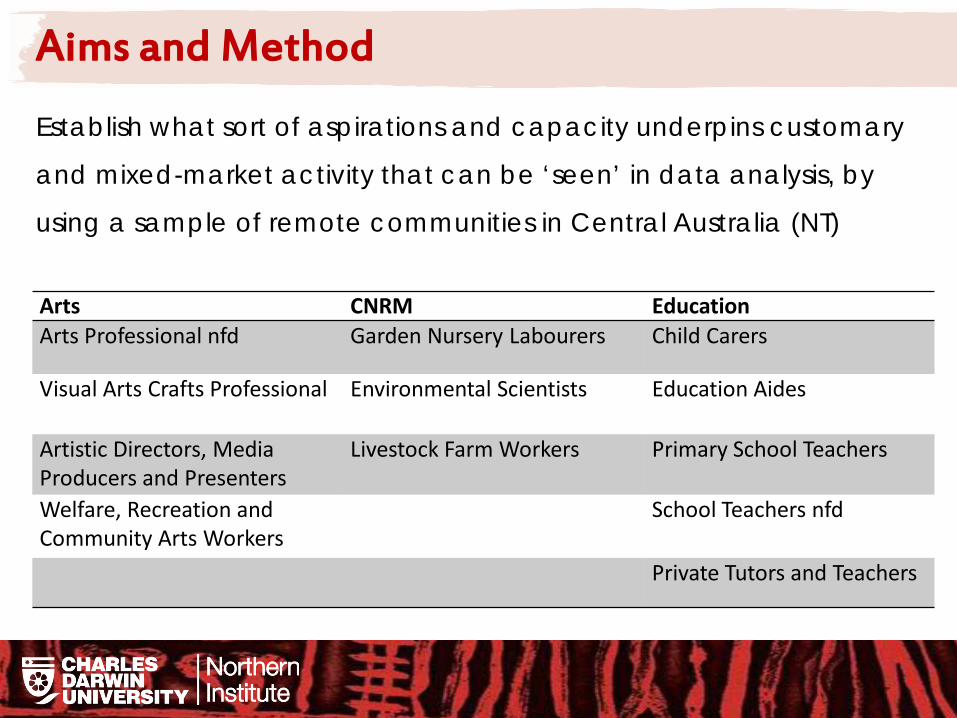
Aims and Method Establish what sort of aspirations and capacity underpins customary
and mixed-market activity that can be ‘seen’ in data analysis, by
using a sample of remote communities in Central Australia (NT)
Arts CNRM Education Arts Professional nfd Garden Nursery Labourers Child Carers
Visual Arts Crafts Professional Environmental Scientists Education Aides
Artistic Directors, Media Producers and Presenters
Livestock Farm Workers Primary School Teachers
Welfare, Recreation and Community Arts Workers
School Teachers nfd
Private Tutors and Teachers

Industry and mixed-market activity
The absence or presence of an active regional industry or peak body is an indicator of community activity. There are no records of Aboriginal Tourism businesses active in the sample region in 2011
* There are Tourism products that involve sites within the sample
region. These are not ATSI owned or run, do not utilise local governance or business structures, and may employ locals intermittently as guides
* There was a regional ATSI tourism group in Central Australia in 2011, but this did not involve communities in our sample.

Data Sample Cluster 1 = 3 mixed-market activities
* Ntaria, Lajamanu, Ltyentye Apurte,
Yuendumu, Papunya
Cluster 2 = 1 or 2 mixed-market activities
* Atitjere, Daguragu, Owairtilla,
Ampilatwatja, Alekerenge
Cluster 3 = 0 mixed-market activities
* Wirliyatjarrayi, Alpurrulam, Nyirripi,
Laramba, Tara
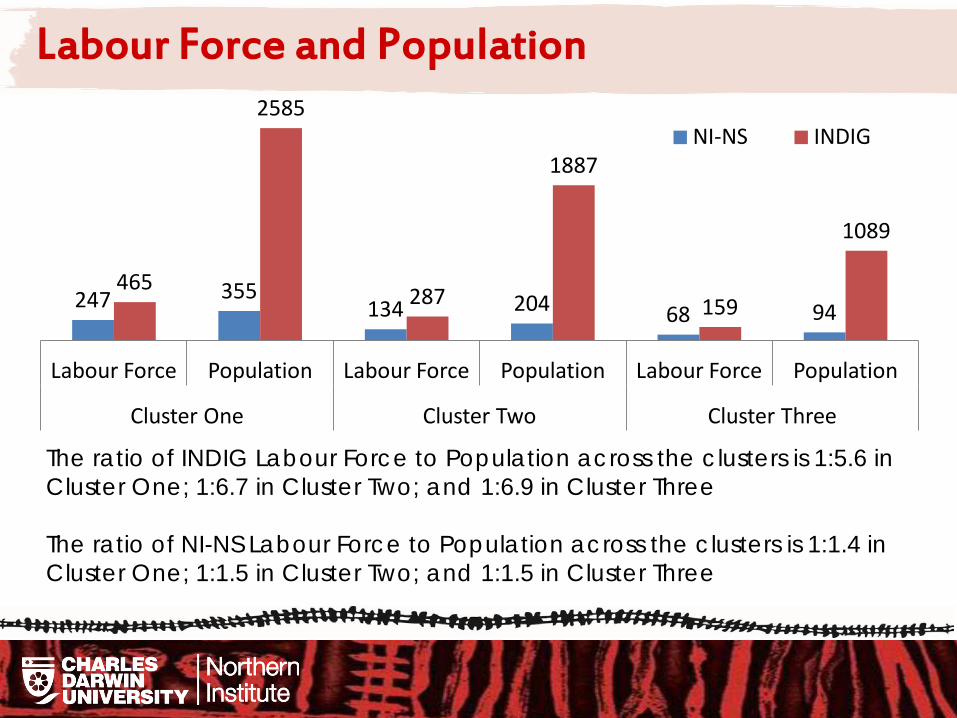
Labour Force and Population
The ratio of INDIG Labour Force to Population across the clusters is 1:5.6 in Cluster One; 1:6.7 in Cluster Two; and 1:6.9 in Cluster Three The ratio of NI-NS Labour Force to Population across the clusters is 1:1.4 in Cluster One; 1:1.5 in Cluster Two; and 1:1.5 in Cluster Three
247 355 134 204 68 94
465
2585
287
1887
159
1089
Labour Force Population Labour Force Population Labour Force Population
Cluster One Cluster Two Cluster Three
NI-NS INDIG
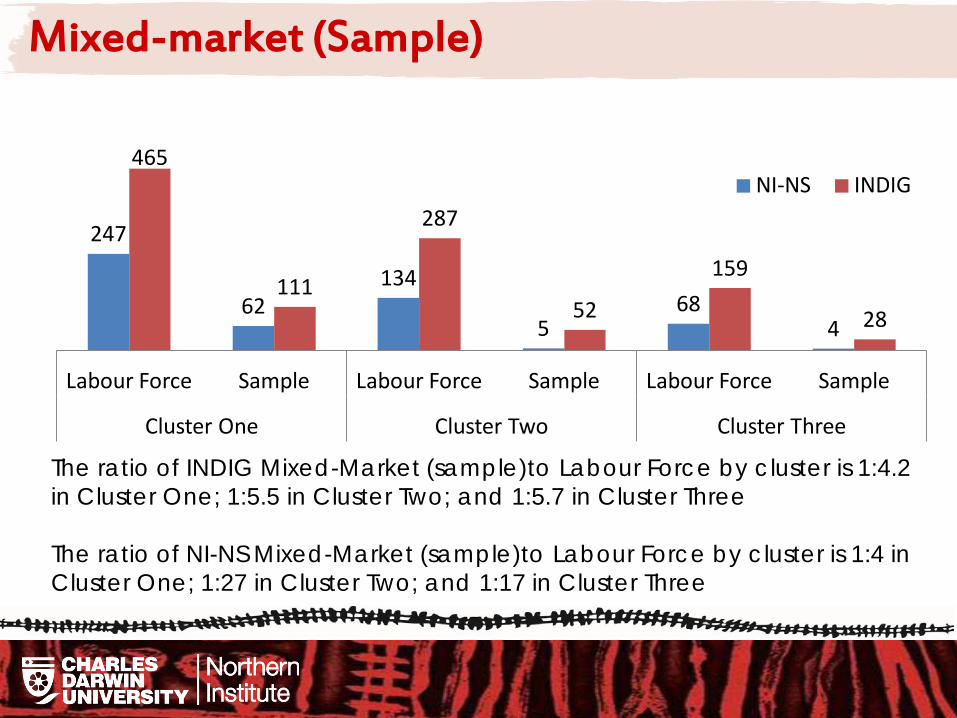
Mixed-market (Sample)
The ratio of INDIG Mixed-Market (sample)to Labour Force by cluster is 1:4.2 in Cluster One; 1:5.5 in Cluster Two; and 1:5.7 in Cluster Three The ratio of NI-NS Mixed-Market (sample)to Labour Force by cluster is 1:4 in Cluster One; 1:27 in Cluster Two; and 1:17 in Cluster Three
247
62 134
5 68
4
465
111
287
52
159
28
Labour Force Sample Labour Force Sample Labour Force Sample
Cluster One Cluster Two Cluster Three
NI-NS INDIG
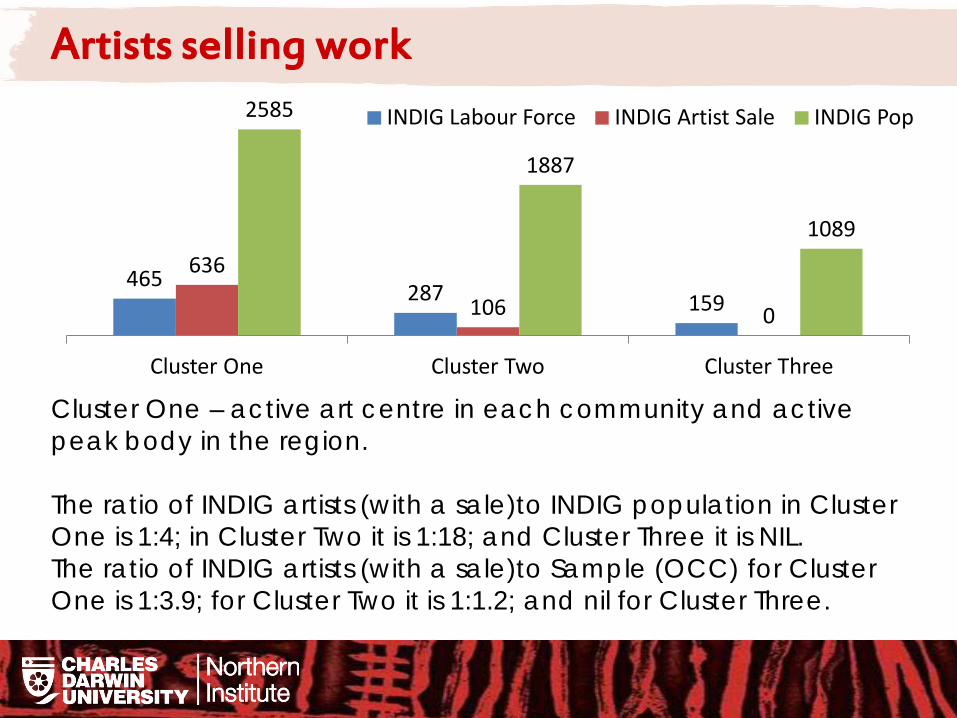
Artists selling work
465 287 159
636
106 0
2585
1887
1089
Cluster One Cluster Two Cluster Three
INDIG Labour Force INDIG Artist Sale INDIG Pop
Cluster One – active art centre in each community and active peak body in the region. The ratio of INDIG artists (with a sale)to INDIG population in Cluster One is 1:4; in Cluster Two it is 1:18; and Cluster Three it is NIL. The ratio of INDIG artists (with a sale)to Sample (OCC) for Cluster One is 1:3.9; for Cluster Two it is 1:1.2; and nil for Cluster Three.

Sample, Non-market and Artist Sale
The ratio of Artist Sale to Sample (OCC) for Cluster One is 1:3.9; for Cluster Two it is 1:1.2; and nil for Cluster Three. The market activity of artists is opportunistic. Occupation and economic participation are higher where local infrastructure is available.
30 14 4 53 38 24 28 0 0 50 30 26
636
106 0
Cluster One Cluster Two Cluster Three
arts cnrm research education art sales
Constraining factors
* The ABS classification of Occupation captures only one primary activity
* Indicators for non-market failure and mixed-
market aspiration are not readily available at the local level
* The centrality of locally nuanced mixed-market activity essential to aspirations and wellbeing
* The cost (to economies and wellbeing) of mediating change which is driven by successive policy shifts and political cycles

Findings
Non-market structures do not reflect these qualities of mixed-
market activity:
* the extent to which people in remote communities value and
participate in secondary employment
* the impetus and motivation to invest time and effort in
occupations with attainable benefits and outcomes
* customary economic activity as both essential undertaking s
and ones from which mixed-market activities may flow
* The centrality of wellbeing and the impetus to avoid ill-being
Findings
Paucity of information at the local level contributes to regional and
national indicators that are contrary to wellbeing:
* overstated non-market reliance
* perceived lack of mixed-market opportunity
* missed opportunity to make and experience choices
* eroded economic empowerment
* confused governance and implementation
* diminished consideration of living languages

Conclusion
The language barrier: has the language of deficit overcrowded the reality and begun to promote ‘disadvantage’? We suggest that evaluating industry pathways and regional industry bodies in the context of local activity (and inactivity) is the first step towards recognising remote capacity and advantage. Local scale is required to interpret the values and variables * cultural and knowledge capital * natural and linguistic characteristics * property rights
Aspiration, capacity and advantage is apparent in remote areas through * mixed-market activity * customary activity

15
We would like to acknowledge the contribution of: * The Australian Government Department of Business and
Science Cooperative Research Centres Program * The CRC-REP and project partners * The Central Australian Research Group (CARG) of the Northern
Institute, Charles Darwin University

Northern Australian Aspirations
Judith Lovell and John Guenther
This is a Synthesis and Integration project for the Cooperative Research Centre for remote Economic Participation (CRC-REP)
For further information from the authors, or any questions please contact us: [email protected] 0408 081 813 [email protected] 0412 125 661