North West Leicestershire Retail Study Update Report
52
North West Leicestershire Retail Study Update Report North West Leicestershire District Council November 10, 2020
Transcript of North West Leicestershire Retail Study Update Report

North West Leicestershire Retail Study Update Report
North West Leicestershire District Council
November 10, 2020
© 2020 Nathaniel Lichfield & Partners Ltd, trading as Lichfields. All Rights Reserved. Registered inEngland, no. 2778116. 14 Regent’s Wharf, All Saints Street, London N1 9RL Formatted for double sided printing. Plans based upon Ordnance Survey mapping with the permission of Her Majesty’s Stationery Office. © Crown Copyright reserved. Licence number AL50684A 16003/01/PW 19050927v1

North West Leicestershire Retail Study : Update Report
Contents 1.0 Introduction 1
Purpose of the report 1
2.0 Updated floorspace capacity assessment 2
Introduction 2
Implications of Covid-19 and trends 2
Study area 4
Population projections 4
Expenditure forecasts 4
Growth in turnover densities 5
Base year market shares 6
Capacity for convenience goods retail floorspace 6
Capacity for comparison goods floorspace 7
Capacity for food/beverage floorspace 7
3.0 Accommodating growth 9
Introduction 9
Accommodating growth and floorspace projections 9
Development opportunities 10
4.0 Policy review 11
Introduction 11
National policy and other changes 11
Meeting needs over the plan period 13
Retail hierarchy 14
Impact test and thresholds 14
Town centre boundary and primary shopping area 15
Appropriate mix of uses 15
5.0 Conclusions and recommendations 17
Accommodating growth 17
Other policy options 17


North West Leicestershire Retail Study : Update Report
Pg 1
1.0 Introduction Purpose of the report
1.1 Lichfields was commissioned by North West Leicestershire District Council in 2018 to prepare a Retail and Leisure Capacity Study (RLCS 2019). The key objective of the RLCS was to provide a robust and credible evidence base to inform the emerging Local Plan Review. The study provided a quantitative and qualitative assessment of the need for new retail and leisure uses within North West Leicestershire District.
1.2 This 2020 report provides a partial update of the study, which has been commissioned to explore the implications of recent changes including new housing, population and expenditure forecasts; potential implications of the Covid-19 pandemic and changes to the Use Classes Order. This update report should be read alongside the RLCS 2019. It replaces the following sections and paragraph references in the RLCS 2019 report:
• Section 4.0: The need for retail uses (paragraphs 4.1 to 4.31 and 4.45 to 4.53;
• Section 5.0: The need for food/beverage uses (paragraphs 5.13 to 5.18);
• Section 8.0: Planning policy analysis (paragraphs 8.1 to 8.45);
• Section 9.0: Accommodating growth (paragraphs 9.3 to 9.18);
• Section 10.0: Conclusions and recommendations (paragraphs 10.1 to 10.19);
• Appendix 2 - Convenience goods capacity;
• Appendix 3 - Comparison goods capacity; and
• Appendix 4 - Food/beverage capacity.
Report structure
1.3 Section 2 of this report provides an update of the retail and food/beverage floorspace capacity assessment based on the latest available population and expenditure projections.
1.4 Section 3 re-examines the options for accommodating the identified floorspace capacity.
1.5 Section 4 reviews potential policy options for the emerging Local Plan Review taking account of updated floorspace capacity projections and recent changes to the Use Classes Order (UCO).

North West Leicestershire Retail Study : Update Report
Pg 2
2.0 Updated floorspace capacity assessment Introduction
2.1 This section updates the quantitative scope for new retail and food/beverage floorspace in the District during the Local Plan up to 2036. The updated projections adopt Experian’s latest forecasts for population growth, average expenditure per person, special forms of trading (SFT) and sales density growth rates. A further consideration is the potential implications of the Covid-19 crisis.
Implications of Covid-19 and trends 2.2 As indicated in the RLCS 2019, historic trends indicate that consumer expenditure has grown
consistently in real terms, generally following a cyclical growth trend. This growth fuelled demand for new retail floorspace. Since the last recession expenditure growth has been much slower and the demand for retail floorspace has reduced. Experian’s latest forecasts suggest slower growth in the short-term and home shopping/internet spending is expected to grow at a much faster rate than traditional shopping. Experian’s short-term expenditure growth projections (2020 and 2021) for retail and leisure now reflect the coronavirus pandemic.
2.3 The main implications of the Covid-19 crisis for the evidence base are likely to be as follows:
• impact on the reliability of demographic and economic projections i.e. population growth and Experian expenditure forecasts;
• short terms impact on the mix of uses and customer behaviour that are likely to distort the base year position; and
• longer terms structural impacts that could affect the nature of town centres and the way household shop, eat/drink out and participate in leisure activities.
2.4 The key uncertainties relating to the first two points are primarily the length of crisis/potential further lockdowns and likely recovery period. The longer term structural implications are harder to predict and quantify at this early stage.
2.5 In the short term, operators have faced elevated risk to cash flow and increased costs arising from a slump in consumer demand and disruption to supply chains. Non-essential products, hospitality and leisure services have been hardest hit. Short term supply chain disruption could lead to inflationary pressure, which may have an impact of consumer demand. Retailers with infrastructure to fulfil on-line orders/home delivery are benefiting at least in the short term. There is likely to be a longer terms structural shift to multi-channel shopping, reducing the demand for physical space within town centres. Bearing these trends in mind, following the Covid-19 crisis there is likely to be a spike in town centre vacancies with unfortunately some businesses failing to re-open, particularly non-food retail operators and restaurants. Many national operators have already announced job losses and store closures.
2.6 The Covid-19 could have some short-term impact in terms of population migration levels and a pause in construction activity. Given that the focus of this update is to assess the long-term need over the plan period within five year interval projections (i.e. 2021 to 2026, 2026 to 2031, and 2031 to 2036), the development plan should assume population projections will return to projected levels by 2026. The first interval population projections at 2026, and certainly later years, should not be significantly affected by the Covid-19 crisis.
2.7 Office of National Statistic (ONS) monthly sales volume information for Great Britain indicates total retail sales volumes were over 22% lower in April 2020 compared with the pre-Covid-19

North West Leicestershire Retail Study : Update Report
Pg 3
position in February 2020 (seasonally adjusted). However, the July and August 2020 sales volumes had recovered to pre-Covid levels, with the August figure now 4% higher than the pre-Covid figure in February.
2.8 The comparison goods (non-food) sector was particularly affected with a 50% drop in sales from February to April, whilst the food sector experienced 10% growth in sales during March in part due to panic buying at the start of the crisis. Food sales volumes have been consistently higher than the February level during March to August.
2.9 ONS data suggested on-line retail sales peaked at 62% higher in June 2020 compared with February 2020. The latest figures for July and August 2020 were 50% and 47% higher than the pre-Covid sales in February 2020, respectively. Food store on-line sales doubled during May and June but still represents a relatively small proportion of total sales in this sector, reaching about 11%; it remained over 10% during July and August. For the non-food sector on-line sales as a percentage of total sales nearly trebled between February and April, reaching 44% of sales. On-line sales in this sector remain over 50% higher than pre-Covid levels.
2.10 These Covid-19 affected trends are still at an early stage and it is difficult to predict the longer term implications for retail sales and the amount of on-line sales. Nevertheless, ONS’s most recent data suggests retail sales should recover to previous levels of growth but the proportion of retail sales spent on-line is likely to represent a higher proportion of total sales, which will have an impact on traditional bricks and mortar retailing.
2.11 Experian’s latest expenditure growth projections were published in October 2020 and assess the likely impact of Covid-19 and Brexit. In the longer term to 2026, 2031 and 2036, Experian recommends relatively modest levels of growth when compared with historic trends. These longer term forecasts should be monitored and kept under review.
2.12 Planning based on long terms expenditure growth projections has always had inherent uncertainties. Despite these uncertainties, the Local Plan must assume a return to reasonable rates of growth and relative normality, although the implications of the short-term impacts should not be ignored. It is better to plan for a return to growth and then modify the strategy later if levels of growth are lower than originally predicted, rather than not planning for growth because there are significant uncertainties. The latter approach is likely to fail to respond in time if higher levels of growth are achieved, and any growth will go elsewhere. Nevertheless, a cautious approach to expenditure growth should be adopted.
2.13 For convenience goods, Experian’s latest forecasts (October 2020) anticipate limited growth (0.1% per annum after 2027). Experian expects slow growth in the future, but most of the growth will relate to non-store sales. Any need for new convenience goods retail floorspace in North Leicestershire District is likely to relate to population growth or qualitative areas of deficiency.
2.14 For comparison goods, higher levels of growth are expected in the future (between 2.9% to 3% per annum), still at a lower rate than previous pre-recession trends (8% per annum between 1997 and 2007). The previous comparison goods growth forecast was slightly higher in the RLCS 2019 at 3.2% per annum. Historically comparison goods expenditure has grown significantly more than convenience goods expenditure, and Experian’s latest national growth rate recommendations are consistent with these past trends.
2.15 New forms of retailing (multi-channel and home shopping) have and will continued to grow. Home/electronic shopping and home delivery has increased with the growth in the use of personal computers, smart phones and the internet. Click and collect / click and return shopping has become more popular. Recent trends suggest continued strong growth in multi-channel activity. Experian’s Retail Planner Briefing Note 18 (October 2020) states:

North West Leicestershire Retail Study : Update Report
Pg 4
“After easing in 2021, we expect the SFT (special forms of trading (SFT) market share to continue to grow strongly in the mid-term, hitting around 30% in 2027. The pace of e-commerce is anticipated to moderate over the longer term, reaching 35% of total retail sales by 2040.”
2.16 The floorspace capacity assessment in this update makes an allowance for future growth in e-tailing based on Experian projections. Given the likelihood that multi-channel expenditure will continue to grow at a faster pace than other consumer expenditure, the needs assessment adopts relatively cautious growth projections for expenditure and an allowance is made for operators to increase their turnover/sales density, due to growth in home shopping and click and collect.
2.17 Lower expenditure growth and deflationary pressures (i.e. price cutting) in the non-food sector have had an impact on the high street in the past decades. Because of these trends, the UK average shop vacancy rate (based on Goad Plan data) increased from around 10% in 2005 to about 14% in 2012. Vacancy rates gradually improved to 11.8% in 2018 but have now increased to 12.4% in 2020. It seems likely there will be a sharp increase in shops vacancies in many town centres, as and when the impacts of the coronavirus pandemic are fully felt.
2.18 Property owners, landlords and funds have also come under increasing pressure with struggling occupiers seeking to renegotiate terms through company voluntary arrangement (CVA) i.e. an insolvency process designed to let a firm with debt problems reach an agreement with creditors to help pay off part or all of its debts. Elsewhere, retailers have been continuing to ‘right size’ their portfolios, with operators announcing store closures. These trends have impacted on rental income and the capital value of retail/ leisure assets. These trends are likely to be exacerbated by the coronavirus pandemic, at least in the short-term.
2.19 Whilst the CVA process has created headaches for landlords in terms of rent negotiations, at the same time newly freed-up space has opened up new opportunities. Vacated premises have been reconfigured and reused for food/beverage, trampolines, climbing and indoor golf.
Study area 2.20 As in the RLCS 2019, the quantitative capacity analysis is based on the defined study area zones
that cover the catchment areas of the main shopping destinations in the District. The study area is sub-divided into seven zones as shown in Appendix 1 of the RLCS.
Population projections 2.21 Experian’s MMG3 population projections have been adopted as shown in Table 1 (Appendix 1).
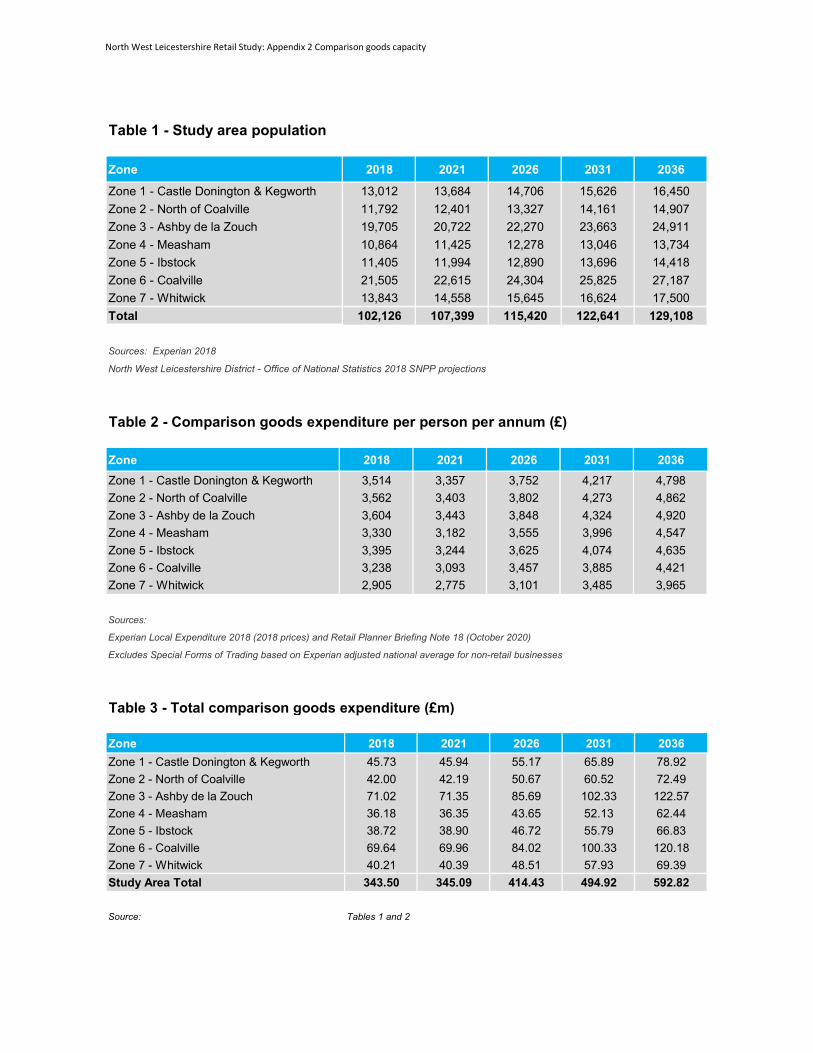
The RLCS 2019 adopted ONS 2014 based sub-national population projections (SNPP 2014). These projections suggested the study area population would increase by +12.8% between 2018 and 2036. The ONS’s most up to date SNPP 2018 projections, suggest much higher (+26.4%) growth between 2018 to 2036.
Expenditure forecasts 2.22 All monetary values expressed in this update report are at 2018 prices, consistent with
Experian’s latest expenditure information. The RLCS adopted a 2016 price base and therefore the figures are not directly comparable.
2.23 Experian's latest national expenditure information (Experian Retail Planner Briefing Note 18 – October 2020) has been used to forecast expenditure within the District. Actual (rather than projected) change in average expenditure per capita during 2017, 2018 and 2019 was as follows:
• convenience goods: +2.0%;

North West Leicestershire Retail Study : Update Report
Pg 5
• comparison goods: +13.7%;
• leisure: -1.6%.
2.24 Experian's short term EBS growth forecast rates during 2020, 2021 and 2022 reflect current economic circumstances, including the current Covid-19 crisis. The forecast changes during this period are as follows:
• convenience goods: +14.1%;
• comparison goods: +1.2%;
• leisure: -12.6%.
2.25 These short term forecasts, particularly for comparison goods and leisure, are relatively cautious. In the longer term it is more difficult to forecast year on year changes in expenditure. Experian's medium and long term growth average forecasts have been adopted, as follows:
• convenience goods: 0% per annum growth for 2023 to 2027 and +0.1% per annum after 2027;
• comparison goods: +3.0% per annum growth for 2023 to 2027 and +2.9% per annum after 2027; and
• leisure: +2.9% per annum growth for 2023 to 2027 and +0.9% per annum after 2027.
2.26 These growth figures relate to real growth and exclude inflation.
2.27 Experian’s latest adjusted deductions for SFT (i.e. home and online shopping through non-retail businesses) in 2018 were:
• 3.8% of convenience goods expenditure; and
• 16.8% of comparison goods expenditure.
2.28 Experian’s projections suggest that these percentages will increase to 5.4% and 22.5% by 2022 respectively. The long term Experian projections suggest an increase to 7.2% and 28.2% by 2036 respectively.
2.29 Table 2 in Appendix 1 sets out the updated forecasts for spending per head on convenience goods within each zone in the study area up to 2036, excluding SFT. Average convenience goods expenditure is expected to reduce due to a higher proportional increase in SFT. Forecasts for comparison goods spending per capita are shown in Table 2 in Appendix 2 and food/beverage expenditure is shown in Table 2 in Appendix 3.
2.30 As a consequence of growth in population, total convenience goods spending within the study area is forecast to increase by +24.2% from £235.62 million in 2018 to £292.73 million in 2036, as shown in Table 3 (Appendix 1). Comparable growth in the RLCS was lower at +12.3%.
2.31 Comparison goods spending is forecast to increase by +72.6% between 2018 and 2036, increasing from £343.5 million in 2018 to £592.82 million in 2036, as shown in Table 3 (Appendix 2). Comparable growth in the RLCS was higher at +90.7%.
2.32 Food and beverage spending is forecast to increase by +36.2% between 2018 and 2036, increasing from £129.86 million in 2018 to £178.44 million in 2036, as shown in Table 3 (Appendix 3). Comparable growth in the RLCS was marginally higher at +38.6%.
Growth in turnover densities 2.33 Experian's Retail Planner Briefing Note 18, October 2020 indicates comparison goods retail
sales floorspace is expected to increase its average sales density by +2.9% between 2018 to 2022

North West Leicestershire Retail Study : Update Report
Pg 6
(average about 0.7% per annum), but higher growth is envisaged in the medium term (+3.0% per annum during 2023 and 2027), and longer term (+2.6% per annum beyond 2027). These increases have been adopted and will absorb much of the future expenditure growth. These growth rates are relatively high compared with historic forecasts but are consistent with the likely high increase in on-line/home shopping through retail businesses i.e. the total sales of retail businesses will increase at a much higher rate than the amount of physical sales floorspace they provide.
2.34 For convenience goods retail, Experian indicates a small decrease in sales densities between 2018 and 2022 and no predicted growth in sales densities thereafter.
2.35 Experian does not provide projections for food and beverage sales densities. An average growth rate of 1% per annum has been adopted, consistent with the RLCS 2019.
Base year market shares 2.36 Expenditure patterns in the 2018 base year adopt market shares within each study area zones
taken from the RLCS 2019. These market shares were calculated from the results of a household shopper survey in July 2018. These market shares are assumed to remain constant up to 2022 and beyond, because there have been no significant changes in retail and food/beverage provision since the RLCS, although the amount of SFT expenditure deducted has increased based on Experian’s latest data.
Capacity for convenience goods retail floorspace 2.37 The future level of available convenience goods expenditure at 2021, 2026, 2031 and 2036 is
shown at Tables 6 to 9, Appendix 2.
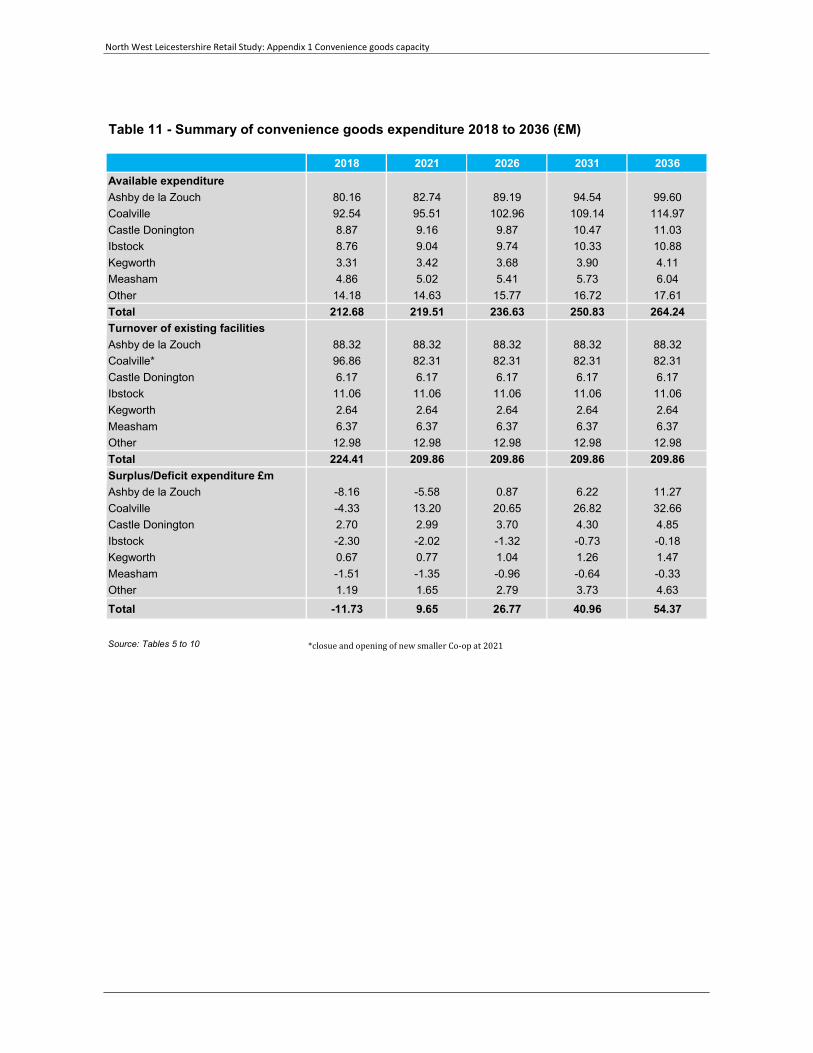
2.38 The total level of convenience goods expenditure available for shops in the District between 2018 and 2036 is summarised in Table 11, Appendix 2. Convenience expenditure available to shopping facilities in the District is expected to increase from £212.68 million in 2018 to £264.24 million in 2036 due to population growth.
2.39 Table 11 subtracts the turnover of existing floorspace from available expenditure to calculate the amount of surplus expenditure that may be available for further development. In the base year there is an expenditure deficit of -£11.73 million suggesting an over-supply of floorspace. By 2021 there is a small surplus of +£9.65 million due to population growth and the closure of the Co-op store at Bridge Road in Coalville in 2020. This surplus is projected to increase to +£26.77 million by 2026, growing to +£40.96 million by 2031 and +£54.37 million by 2036, due to future population growth.
2.40 The surplus expenditure projections have been converted into potential new floorspace estimates in Table 12, Appendix 2. Surplus expenditure is converted into floorspace estimates based on an assumed average sales density figure of £12,000 per sq. m, an approximate average turnover density for main food supermarket operators (Aldi, Asda, Lidl, Morrison’s, Sainsbury’s, Tesco and Waitrose). The figures are summarised in Table 2. below. Projected population growth is expected to generate an expenditure surplus in most parts of the District.
2.41 Surplus expenditure up to 2036 indicates that there is capacity for additional convenience goods floorspace in the District of 6,473 sq.m gross. The RLCS 2019 suggested a much lower floorspace projection of only 960 sq.m gross. This difference is due to the closure of the Co-op store at Bridge Road in Coalville and the much lower population growth suggested by the ONS’s 2014 based SNPP projections, i.e. +12.8% between 2018 and 2036 compared with the updated projection of +26.4%.

North West Leicestershire Retail Study : Update Report
Pg 7
Table 2.1 Convenience goods floorspace projections (sq.m gross - cumulative)
Centre by 2021 by 2026 by 2031 by 2036Ashby de la Zouch -665 103 740 1,342 Coalville 1,571 2,458 3,193 3,888 Castle Donington 356 441 511 578Ibstock -241 -157 -87 -21 Kegworth 92 124 150 175 Measham -161 -114 -76 -39Other NW Leicestershire 196 332 445 551 Total 1,149 3,187 4,877 6,473
Source: Table 12 in Appendix 2
Capacity for comparison goods floorspace 2.42 As in the RLCS 2019, existing comparison goods floorspace is estimated to be trading at
equilibrium in 2018 (i.e. satisfactory levels). Table 10, Appendix 3 assumes that the turnover of comparison floorspace will increase in real terms in the future, as recommended by Experian (Retail Planner Briefing Note 18 – October 2020).
2.43 Table 11 subtracts the turnover of existing floorspace from available expenditure to calculate the amount of surplus expenditure that may be available for further development and/or the reoccupation of vacant floorspace. Within the District, there is an available expenditure surplus of +£2.65 million comparison goods expenditure by 2021. This surplus will grow to +£6.41 million by 2026, +£15.74 million by 2031 and +£29.49 million by 2036.
2.44 The comparison goods expenditure surplus is converted into net comparison sales floorspace projections at Table 11, Appendix 3, adopting an average sales density of £6,000 per sq.m net in 2018, which is projected to grow in the future due to improved turnover efficiency. The figures are summarised in Table 2. below.
Table 2.2 Comparison goods floorspace projections (sq.m gross - cumulative)
Centre by 2021 by 2026 by 2031 by 2036 Ashby de la Zouch 269 553 1,191 1,962 Coalville 244 501 1,077 1,774Castle Donington 28 58 124 204 Ibstock 23 48 103 170 Kegworth 6 12 8 41Measham 19 39 84 139 Other NW Leicestershire 10 20 40 72 Total 599 1,231 2,647 4,361
Source: Table 11, Appendix 3
2.45 Surplus expenditure up to 2036 indicates that there is capacity for additional comparison goods floorspace in the District of 4,361 sq.m gross. The RLCS 2019 suggested a higher floorspace projection of 8,068 sq.m gross due to the higher expenditure growth and lower growth in turnover efficiency adopted at that time.
Capacity for food/beverage floorspace 2.46 Experian’s food and beverage expenditure per capita projections are shown in Table 2, Appendix
4. The total food and beverage expenditure in the study area is £129.86 million in 2018, as shown in Table 3, Appendix 4.

North West Leicestershire Retail Study : Update Report
Pg 8
2.47 Food and beverage expenditure per capita is expected to increase in real terms (excluding inflation) by 37.4% between 2018 and 2036. Accounting for population growth, total food and beverage expenditure within the study is expected to increase from £129.86 million in 2018 to £178.44 million by 2036.
2.48 Available food and beverage expenditure has been projected forward to 2021, 2026, 2031 and 2036 in Tables 6 to 9, Appendix 4, and summarised in Table 10. Available food and beverage expenditure to facilities within the District is expected to increase from £86.04 million in 2018 to £118.22 million by 2036.
2.49 For the purposes of this assessment, the existing food and beverage floorspace is estimated to be trading at equilibrium in 2018 (i.e. satisfactory levels). Table 12, Appendix 4 then assumes that the turnover of food and beverage facilities will increase in real terms in the future.
2.50 By 2021, there will be a food and beverage expenditure deficit of -£20.14 million, due to the short term reduction in expenditure causes by the Covid-19 crisis and other expected market conditions. This expenditure deficit implies an over-supply or surplus of floorspace at 2021. By 2026 expenditure and population growth will create a small expenditure surplus of £1.29 million in 2026, which will grow to £9.46 million by 2031 and £15.31 million by 2036. These expenditure projections have been converted into floorspace projections in Table 11, Appendix 4, adopting an average sales density of £5,000 per sq. m gross, which is projected to grow by 1% in the future due to improved turnover efficiency. The results are summarised in Table 2.3 below.
Table 2.3 Food and beverage floorspace projections (sq.m gross - cumulative)
Centre Additional Floorspace (sq.m gross) By 2021 By 2026 By 2031 By 2036
Ashby de la Zouch -1,702 128 724 1,114 Coalville -1,000 75 425 655 Castle Donington -243 18 103 159 Ibstock -142 11 61 93 Kegworth -92 7 39 60 Measham -133 10 57 87 Other -596 45 254 390 Total -3,910 293 1,663 2,560
Source: Table 11, Appendix 4
2.51 Surplus expenditure up to 2036 indicates that there is capacity for additional food/beverage floorspace in the District of 2,560 sq.m gross. The RLCS 2019 suggested a marginally lower floorspace projection of 2,059 sq.m gross, due to the lower population growth suggested by the ONS’s 2014 based SNPP projections.

North West Leicestershire Retail Study : Update Report
Pg 9
3.0 Accommodating growth Introduction
3.1 The revised National Planning Policy Framework (NPPF) indicates development plans should allocate a range of suitable sites in town centres to meet the scale and type of development likely to be needed, looking at least ten years ahead. Meeting anticipated needs for retail, leisure, office and other main town centre uses over this period should not be compromised by limited site availability.
Accommodating growth and floorspace projections 3.2 Tables 3.1, 3.2 and 3.3 below summarise the floorspace projections by broad location up to
2026, 2031 and 2036. The distribution of floorspace is based on the existing market shares and expenditure patterns.
Table 3.1 Summary of floorspace projections up to 2026 (sq.m gross)
Convenience Comparison Food/beverage Total Ashby de la Zouch 103 553 128 784 Coalville 2,458 501 75 3,034Other NW Leicestershire 625 177 90 892 Total 3,187 1,231 293 4,710
Table 3.2 Summary of floorspace projections up to 2031 (sq.m gross)
Convenience Comparison Food/beverage Total Ashby de la Zouch 740 1,191 724 2,655 Coalville 3,193 1,077 425 4,695 Other NW Leicestershire 944 379 514 1,837 Total 4,877 2,647 1,663 9,187
Table 3.3 Summary of floorspace projections up to 2036 (sq.m gross)
Convenience Comparison Food/beverage Total Ashby de la Zouch 1,342 1,962 1,114 4,418 Coalville 3,888 1,774 655 6,317 Other NW Leicestershire 1,243 625 791 2,659Total 6,473 4,361 2,560 13,394
Source: Table 12 in Appendix 1, Table 11 in Appendix 2 and Table 11 Appendix 3.
3.3 As indicated in the RLCS 2019, the existing stock of premises should help to accommodate projected growth. The retail capacity analysis in this report assumes that existing retail and food/beverage floorspace can, on average, increase its turnover to sales floorspace densities, particularly if retail businesses can maintain recent growth in on-line sales through stores. In addition to the growth in sales densities, vacant floorspace should help to accommodate residual future growth and not all of the projections in Tables 3.1 to 3.3 will require the development of new floorspace.
3.4 In 2018 there were 49 vacant shop units within the District’s main centres, which equated to an overall vacancy rate of 8.8%, lower than the Goad national average of 11.3% at that time. It is possible that the vacancy rate will increase in the short term as a result of Covid-19, reflecting a short term over-supply of floorspace. The longer term floorspace projections at 2026 and

North West Leicestershire Retail Study : Update Report
Pg 10
beyond assume the reoccupation of this potential short term uplift in vacant space. Longer term growth could result in a further reduction in vacant floorspace i.e. below pre-Covid 2018 levels.
3.5 The RLCS 2019 assumed that up to half of the pre-Covid vacant floorspace could be reoccupied and that re-occupied vacant space to accommodate up to 3,550 sq.m gross, broken down as follows:
• Ashby de la Zouch town centre - 750 sq.m gross
• Coalville town centre - 2,400 sq.m gross
• Other local centres - 400 sq.m gross
3.6 The amount of vacant floorspace in Coalville will have increased significantly due to the closure of the Co-op store at Bridge Road. If this store is re-occupied for retail use then the above figure for Coalville could increase to 5,100 sq.m gross.
3.7 If this reduction in vacant units can be achieved, over and above a return to pre-Covid vacancy levels, then the overall retail and food/beverage floorspace 2026 projection for the District as a whole could be accommodated (about 4,700 sq.m gross). This implies there is no pressing need to identify major new allocations for retail and food/beverage development in the short to medium term. The long term projection to 2036 would reduce from about 13,400 sq.m gross to about 7,150 sq.m gross.
3.8 The updated combined floorspace projection for North West Leicestershire (13,394 sq.m gross at 2036) is marginally higher than the RLCS 2019 projection (11,974 sq.m gross at 2036) but the latter did not take account of the closure of the Coop store in Coalville. The mix of floorspace required has changed significantly, with a much higher requirement for convenience goods floorspace and conversely a lower requirement for comparison goods floorspace.
3.9 Some new convenience goods shopping may be required to serve new residential developments in the form of local/ neighbourhood centres, rather than new uses focused in existing town centres. Some of the projected food/beverage floorspace will also be provided in these neighbourhood centres.
Development opportunities 3.10 The RLCS 2019 reviewed potential development opportunities within Ashby de la Zouch and
Coalville town centres. In total 9 potential development sites were identified, with a theoretical capacity to accommodate 38,000 sq.m gross of retail and food/beverage floorspace.
3.11 In Ashby de la Zouch, the development sites identified could accommodate 14,000 sq. m gross. As suggested in the RLCS 2019, these opportunity sites, together with the occupation vacant units could accommodate more than three times the floorspace capacity up to 2036.
3.12 In Coalville, the development sites identified could accommodate 24,000 sq. m gross of Class A1 to A5 uses. These opportunity sites, together with the occupation vacant units (up to 5,100 sq.m gross) could accommodate nearly five times the projected floorspace capacity up to 2036 (6,317 sq.m gross).

North West Leicestershire Retail Study : Update Report
Pg 11
4.0 Policy review Introduction
4.1 The RLCS 2019 included a planning policy analysis of relevant adopted policies within the Local Plan – November 2017. This analysis has been revisited in the light of the findings of this update. An appraisal of the implications for the following policies and supporting text has been undertaken:
• Policy S1 (economic development needs to relating to retail floorspace);
• Policy Ec8 (the hierarchy of centres and retail capacity);
• Policy Ec9 (impact test and thresholds);
• Policy Ec10 (primary shopping area, non-shopping uses and protecting A1 uses);
• Policy Ec11 (controlling takeaway uses); and
• Policies Ec12 (protecting local centres).
4.2 The appraisal of these policies takes account changes to the NPPF and PPG in February 2019, the likely short term implications of the Covid-19 crisis and the fundamental changes to the UCO.
National policy and other changes 4.3 The RLCS 2019 was based on the guidance set out in the NPPF published by the Department for
Communities and Local Government in July 2018. The revised NPPF was replaced by an amended version in February 2019 but there were no changes to town centre or retail related guidance. The revised NPPF indicates planning policies should (para. 85):
a define a network and hierarchy of town centres and promote their long-term vitality and viability – by allowing them to grow and diversify in a way that can respond to rapid changes in the retail and leisure industries, allows a suitable mix of uses (including housing) and reflects their distinctive characters;
b define the extent of town centres and primary shopping areas, and make clear the range of uses permitted in such locations, as part of a positive strategy for the future of each centre;
c retain and enhance existing markets and, where appropriate, re-introduce or create new ones;
d allocate a range of suitable sites in town centres to meet the scale and type of development likely to be needed, looking at least ten years ahead. Meeting anticipated needs for retail, leisure, office and other main town centre uses over this period should not be compromised by limited site availability, so town centre boundaries should be kept under review where necessary;
e where suitable and viable town centre sites are not available for main town centre uses, allocate appropriate edge of centre sites that are well connected to the town centre. If sufficient edge of centre sites cannot be identified, policies should explain how identified needs can be met in other accessible locations that are well connected to the town centre; and
f recognise that residential development often plays an important role in ensuring the vitality of centres and encourage residential development on appropriate sites.

North West Leicestershire Retail Study : Update Report
Pg 12
4.4 The rapid changes that are affecting the retail sector and town centres, are acknowledged and reflected in the revised NPPF. It recognises that diversification is key to the long-term vitality and viability of town centres, to ‘respond to rapid changes in the retail and leisure industries.’ Accordingly, planning policies should clarify ‘the range of uses permitted in such locations, as part of a positive strategy for the future of each centre’.
4.5 The RLCS noted that a balanced mix of uses is required in town centres. The appropriate balance between retail and other town centre activity has been hotly debated in recent years, as town centres increasingly need to compete with on-line shopping. Online shopping is likely to grow faster than previously expected due to shifts in customer behaviour accelerated by the Covid-19 crisis. The need for a better mix of uses within town centre will become increasingly important. A broader mix of uses should extend activity throughout the daytime and into the evenings.
4.6 On 1 September 2020, the Use Classes Order (UCO) was significantly amended. Changes to town centre use classes now allow far greater flexibility for uses to change within town centres without the need to obtain planning permission. The UCO has significant implications for shop frontage planning policies, restricting the ability of local planning authorities to control the mix of uses and retain specific uses previously protected e.g. Class A1 retail. Temporary changes to permitted changes of use up to at least July 2021 will provide further flexibility.
4.7 In relation to main town centre uses, as defined in the NPPF Annex 2 glossary, the UCO changes provide for three new use classes:
• Class E (Commercial, business and service);
• Class F.1 (Learning and non-residential institutions); and
• Class F.2 (Local community).
4.8 The UCO changes now combine: Shops (A1), financial/professional services (A2), cafés/restaurants (A3), indoor sports/fitness (D2 part), medical health facilities (D1 part), creche/nurseries and office/business uses (B1) into the new single Use Class E. The new Class E includes some uses that are not defined as ‘main town centre uses” within the NPPF e.g. medical services and some light industrial uses.
4.9 Other changes potentially introduce more restrictions rather than flexibility. Partly in response to the impact of the Covid-19 crisis, there is added protection against the loss of learning, non-residential and community facilities, including museums public halls, sports facilities and local shops. These uses are now included in new Classes F1 and F2. Class F.2 also includes small isolated shops (at least 1 kilometre from a similar shop) selling essential goods including food.
4.10 Other potential ‘bad neighbour’ town centre uses have been placed in the list of Sui Generis uses, with no permitted changes of use e.g. pubs/bars (A4), takeaways (A5), cinemas and live music venues. The inclusion of these uses as Sui Generis appears to have a dual function i.e. controlling potential ‘bad neighbour’ uses such as pub/bars and takeaways, whilst protecting against the loss of other cultural facilities such as cinemas and music venues, most vulnerable to the impacts of Covid-19.
4.11 The previous distinction between Class A3, A4 and A5 uses will now become more critical, with Class A3 uses now having more flexibility in the new Class E, but more limited flexibility for Class A4 and A5 uses. Many Class A3 restaurants have offered a takeaway service during the Covid-19 crisis and the categorisation of bar/restaurants has always been arguable and will be a matter of fact and degree on a case by case basis. The Council will need to re-categorise existing uses within the primary shopping area to reflect the new UCO before appropriate policy options can be considered.

North West Leicestershire Retail Study : Update Report
Pg 13
4.12 The potential implications of permitted changes in use outside town centres may also have unintended consequences. In theory large out-of-centre B1 office buildings or D2 commercial leisure uses, with no restrictive conditions, could be converted to retail use without planning permission or an assessment of the impact on the town centre or application of the sequential test. Allowing retail uses to occupy out-of-centre buildings could run counter to the objective of maintaining and enhancing town centres. This change could have implications for the effectiveness of retail impact and sequential tests policies.
Meeting needs over the plan period 4.13 The North West Leicestershire Local Plan (NWLLP) was adopted in November 2017. It is widely
accepted that long-term projections have inherent uncertainties. In response to these uncertainties, the revised NPPF indicates that local planning authorities are no longer required to allocate sites to meet the need for town centre uses over the full plan period. The need for new town centre uses should still be accommodated over a minimum ten-year period, which reflects the complexities in bringing forward town centre development sites. Identifying sites to meet needs for ten years or the full plan period is no longer a critical issue in North West Leicestershire District because the updated long term floorspace projections are much lower.
4.14 In line with the Government’s economic growth agenda, a positive approach to meeting community needs is still required. The NPPF’s presumption in favour of sustainable development (para. 11) remains. For plan-making this means that:
• plans should positively seek opportunities to meet the development needs of their area, and be sufficiently flexible to adapt to rapid change; and
• policies should, as a minimum, provide for objectively assessed needs for housing and other uses, as well as any needs that cannot be met within neighbouring areas.
4.15 The development plan must include strategic policies to address priorities for the development and use of land in its area. Strategic policies should set out the pattern, scale and quality of development, and make sufficient provision for employment, retail, leisure and other commercial development. Strategic policies should provide a clear strategy for bringing sufficient land forward, and at a sufficient rate, to address objectively assessed needs over the plan period. This should include planning for and allocating sufficient sites to deliver the strategic priorities of the area (para. 21).
4.16 The preparation and review of all policies should be underpinned by relevant and up-to-date evidence. This should be adequate and proportionate, focused tightly on supporting and justifying the policies concerned, accounting for relevant market signals (para. 31).
4.17 NWLLP Policy S1 includes references to economic development needs and retail floorspace. It states that provision will be made for 7,300 sq.m for shopping purposes. Supporting text (paragraph 5.11) indicates this 7,300 sq.m figure relates to comparison retail floorspace up to 2031, based on a 2014 retail capacity study. No additional need for convenience retail fl0orspace was identified.
4.18 The updated floorspace projections suggest a more balanced mix of comparison and convenience goods retail and food/beverage floorspace is required. Policy S1 could be amended to reflect the combined convenience, comparison and food/beverage floorspace projections. Future policy would benefit from a more detailed breakdown of required floorspace across the District and over the plan period as a whole, for example as shown in Table 4.1 below.

North West Leicestershire Retail Study : Update Report
Pg 14
Table 4.1 Retail and food/beverage floorspace projections up to 2036 (sq.m gross)
Convenience Comparison Food/beverage Total Ashby de la Zouch 1,300 2,000 1,100 4,400 Coalville 3,900 1,800 700 6,400Other NW Leicestershire 1,200 600 800 2,600 Total 6,400 4,400 2,600 13,400
4.19 Policy could refer to these floorspace projections being met through the re-occupation of vacant floorspace, particularly in the short term, and new developments in the longer term, taking account of the sequential test.
4.20 Despite the changes to the UCO, future policies can still refer to separate retail and food/beverage floorspace projections, which do not need to be merged with other uses in Class E, such as office and leisure uses. Historically, development plans have included separate floorspace projections for comparison and convenience goods retail although they both fell within Class A1, along with other non-retail services.
4.21 Under the old system, there were permitted development rights for all food and beverage uses to change to Class A1. In a similar way, retail and restaurant/café uses now fall into one new Class E, whilst pubs/bars and takeaways are Sui Generis with no permitted changes. The wording of policy/supporting text referring to use classes A1 etc (e.g. Ec8 and Ec10) should be amended to refer to retail and food/beverage activities rather than use classes.
4.22 The Council can still impose conditions on new development that restrict changes within the new Class E, in the same way comparison, convenience retail floorspace and the sale of specific types of goods have been controlled via conditions for many years. The floorspace projections in this study and retail impact assessments should help to determine when these types of conditions are necessary and appropriate.
Retail hierarchy 4.23 In accordance with the revised NPPF, the NWLLP defines the hierarchy of centres in Policy Ec8,
which helps to ensure new town uses are focused within these centres. Policy Ec8 could provide a clearer indication that a key objective is to maintain the vitality and viability of the centres identified within the hierarchy. Based on the scale of facilities available within each settlement and the retail floorspace projections in this update study, the retail hierarchy as set out in Policy Ec8 remains appropriate and sound.
Impact test and thresholds 4.24 The revised NPPF/PPG still indicate that where authorities decide not to set out specific
floorspace thresholds in local development plans, national policy requires impact assessments to be submitted for retail and leisure developments over 2,500 sq.m gross.
4.25 Retail and leisure uses previously related to use classes A1 to A5 and D2 leisure uses. Changes to the UCO may lead to confusion, at least until the NPPF is amended to reflect the UCO changes. For example, not all uses within the new Class E are retail or leisure uses, requiring an impact assessment i.e. offices and medical uses.
4.26 NWLLP Policy Ec9 sets out the approach to development outside defined centres. The policy wording refers to ‘retail, leisure and office development’ which is not entirely consistent with the NPPF. As indicated above and in the RLCS 2019, the NPPF indicates impact assessments are only required for retail and leisure uses, rather than all main town centre uses. For example, impact assessments are not required for office and hotel developments. Bearing in mind the
North West Leicestershire Retail Study : Update Report
Pg 15
potential for confusion arising from the UCO changes and for consistency with the NPPF, future policy relating to the impact test should continue to refer to retail and leisure uses rather than the new UCO classes.
4.27 As indicated in the RLCS 2019, the NPPF minimum threshold of 2,500 sq.m gross continues to be an inappropriate blanket threshold across North West Leicestershire District, because this scale of development would represent a significant proportion of the overall retail projections for parts of the District. The RLCS indicated the impact thresholds as set out in Policy Ec9 remain appropriate. The adoption of lower thresholds in Ashby de la Zouch and Coalville (1,000 sq.m gross) and in other smaller centres (500 sq.m gross) are endorsed by the updated floorspace capacity projections and recent market conditions.
Town centre boundary and primary shopping area 4.28 The RLCS reviewed the designation of primary shopping areas and town centre boundaries in
North West Leicestershire District. These designations remain important when applying the sequential test, i.e. to direct retail, leisure and other town centre uses to sustainable locations and determine whether a retail/leisure impact assessment is required.
4.29 The revised NPPF still indicates that the first preference for retail uses should be the primary shopping area. The first preference for other town centre uses, such as commercial leisure and office uses, is normally the wider defined town centre, which usually includes the primary shopping area and other parts of the town centre.
4.30 The validity of this approach is now questionable with the merger of retail with many other main town centre uses into the new Class E. For example, a proposed leisure use within Class E will satisfy the sequential approach if it is located within the town centre boundary but outside the primary shopping area. This proposed leisure use can subsequently change to retail use without planning permission. With the introduction of Class E, the effectiveness of a separate primary shopping area for sequential test purposes is unclear.
4.31 The next Local Plan should define centre boundaries on the proposals map. The centre boundaries should provide sufficient clarification in relation to the need for an impact and sequential assessment. If retained, the primary shopping area should only relate to Policy Ec10 as reviewed below.
Appropriate mix of uses 4.32 The revised NPPF does not refer to restrictive policies within designated shopping frontage. The
aim of the revised NPPF appears to create more flexibility and encourage positive strategies for town centres. The RLCS reviewed adopted Policy Ec10 seeking to control non-shopping uses. Four broad policy approaches that could be adopted in the District were set out in the RLCS, as follows:
1 strengthening Ec10 to provide more control over the loss of retail uses i.e. extending primary shopping area and/or introducing more rigid policy criteria;
2 retaining the current approach in Ec10;
3 relaxing Ec10 to allow a more flexible approach to enable more non-retail uses; or
4 a laissez-faire approach that does not seek to protect retail and town centre uses, on the basis that the market will determine the appropriate mix of uses.
4.33 After considering the advantages and disadvantages of these four approaches, the RLCS recommended Option 2.
North West Leicestershire Retail Study : Update Report
Pg 16
4.34 In light of likely future market trends, the revised retail floorspace capacity projections, changes to the UCO described earlier, Option 1 is an unsound and unimplementable approach. The UCO changes prevent a more restrictive approach, recognising that the introduction of Article 4 directions can only remove permitted GPDO changes of uses but not movement within the same use class i.e. new Class E. The continuation of the current adopted policy approach (Option 2) will also be hampered by the UCO changes. As a result of these recent changes, Options 3 and 4 now appear to be the most likely approaches the Council should consider.
4.35 Policy Ec10 could be amended to refer to Class E uses rather than shops (class A1) being “the predominant ground floor uses within the town and local centres”. To counter balance this reduced control on the mix of uses, the reference to the primary shopping areas could be removed. The revised policy would protect the loss of Class E uses across the town centre as a whole rather than just the primary shopping area. The development of other main town centre uses not within Class E would then still be considered against the other Ec10 criteria e.g. Sui Generis uses such as takeaways, pubs, bars and bookmakers. These criteria could still refer to the “shopping element”, “retail character” of the town centre and the “over-concentration of non-shop uses”. This approach will provide more flexibility but will still offer some control rather than the laissez-faire option.
4.36 Policy Ec12 (Local Centres) considers that planning permission will only be granted for the loss of shopping and other main town centre uses within the defined local centre if the premises have been vacant for at least 6 months with evidence of marketing and other factors relating to:
• an appropriate balance between main town centre and non-main town centre uses;
• the contribution the unit makes to the function of the centre in terms of its size and location within the centre;
• the nature and characteristics of the proposed use and the type and characteristics of other uses within proximity of the application site; and
• the impact of the proposal on the shopping and service character and function of the local centre.
4.37 These objectives are still valid and the approach in Policy Ec12 still appears to be robust and appropriate. The changes to the UCO do not appear to undermine the implementation of Policy Ec12, although as indicated earlier, there are some uses not previously considered to be main town centre uses that are now included in the new Class E.
4.38 Policy Ec11 relates to hot food takeaways (previously Class A5). This use is now Sui Generis following the UCO changes. The changes to the UCO do not undermine the implementation of Policy Ec11. The objectives relating to the impact on amenity, traffic, safety and the health of local residents remain valid considerations.

North West Leicestershire Retail Study : Update Report
Pg 17
5.0 Conclusions and recommendations Accommodating growth
5.1 This updated study indicates the projected capacity for retail and food/beverage floorspace has changed since the RLCS 2019 was prepared. The revised projections suggest a more balanced mix of comparison and convenience goods retail and food/beverage floorspace is required up to 2036 totalling 13,400 sq.m gross. Future policy should indicate this floorspace projection can be accommodated through the re-occupation of vacant floorspace in the short-term and new development in the longer term (after 2026).
Other policy options 5.2 Based on the scale of facilities available within each settlement and the retail floorspace
projections in this update, the retail hierarchy as set out in NWLLP Policy Ec8 remains appropriate and sound. However, Policy Ec8 could indicate the key objective is to maintain the vitality and viability of the centres identified within the hierarchy.
5.3 Policy Ec9 refers to the impact of ‘retail, leisure and office development’. The NPPF indicates impact assessments are only required for retail and leisure uses, rather than all main town centre uses. Future policy relating to the impact test should continue to refer to retail and leisure uses rather than the new UCO classes. The lower impact thresholds in Policy Ec9 remain appropriate and are endorsed by the updated floorspace capacity projections and recent market conditions.
5.4 The next Local Plan should continue to define centre boundaries on the proposals map, which should provide sufficient clarification in relation to the need for an impact and sequential assessment.
5.5 Policy Ec10 could be amended to refer to Class E uses rather than shops (class A1) being “the predominant ground floor uses within the town and local centres” and the areas protected could be extended by removing the primary shopping areas. This approach will provide more flexibility but will still offer some degree of control.
5.6 The objectives of Policies Ec11 and Ec12 are still robust and appropriate. The changes to the UCO do not significantly undermine the implementation of these policies.


North West Leicestershire Retail Study: Appendix 1 Convenience goods capacity
Appendix 1 Convenience goods capacity

North West Leicestershire Retail Study: Appendix 1 Convenience goods capacity
Table 1 - Study area population
Zone 2018 2021 2026 2031 2036Zone 1 - Castle Donington & Kegworth 13,012 13,684 14,706 15,626 16,450Zone 2 - North of Coalville 11,792 12,401 13,327 14,161 14,907Zone 3 - Ashby de la Zouch 19,705 20,722 22,270 23,663 24,911Zone 4 - Measham 10,864 11,425 12,278 13,046 13,734Zone 5 - Ibstock 11,405 11,994 12,890 13,696 14,418Zone 6 - Coalville 21,505 22,615 24,304 25,825 27,187Zone 7 - Whitwick 13,843 14,558 15,645 16,624 17,500Total 102,126 107,399 115,420 122,641 129,108
Sources: Experian 2018
North West Leicestershire District - Office of National Statistics 2018 SNPP projections
Table 2 - Convenience goods expenditure per person per annum (£)
Zone 2018 2021 2026 2031 2036Zone 1 - Castle Donington & Kegworth 2,302 2,259 2,266 2,261 2,262Zone 2 - North of Coalville 2,473 2,427 2,435 2,429 2,431Zone 3 - Ashby de la Zouch 2,344 2,301 2,308 2,302 2,304Zone 4 - Measham 2,318 2,275 2,282 2,277 2,278Zone 5 - Ibstock 2,307 2,264 2,271 2,266 2,267Zone 6 - Coalville 2,248 2,207 2,213 2,208 2,209Zone 7 - Whitwick 2,200 2,159 2,166 2,161 2,162
Sources:
Experian Local Expenditure 2018 (2018 prices) and Retail Planner Briefing Note 18 (October 2020)
Excludes Special Forms of Trading based on Experian adjusted national average for non-retail businesses
Table 3 - Total convenience goods expenditure (£m)
Zone 2018 2021 2026 2031 2036Zone 1 - Castle Donington & Kegworth 29.95 30.92 33.33 35.33 37.22Zone 2 - North of Coalville 29.17 30.10 32.45 34.40 36.24Zone 3 - Ashby de la Zouch 46.20 47.68 51.40 54.48 57.40Zone 4 - Measham 25.19 26.00 28.02 29.71 31.29Zone 5 - Ibstock 26.31 27.16 29.27 31.03 32.69Zone 6 - Coalville 48.35 49.90 53.79 57.02 60.07Zone 7 - Whitwick 30.46 31.43 33.89 35.92 37.84Study Area Total 235.62 243.19 262.15 277.88 292.73
Source: Tables 1 and 2

North West Leicestershire Retail Study: Appendix 1 Convenience goods capacity
Table 4 - Base year 2018 convenience goods market shares (%)
Store/Location Zone 1 Zone 2 Zone 3 Zone 4 Zone 5 Zone 6 Zone 7 Inflow
Main CentresCo-op, Derby Road, Ashby de la Zouch 0.0% 0.0% 11.9% 2.2% 1.7% 0.0% 1.6% 10.0%Co-op, Market Street, Ashby de la Zouch 0.0% 0.3% 7.0% 0.6% 0.3% 0.0% 0.6% 10.0%Tesco Extra, Resolution Road, Ashby de la Zouch 1.8% 27.9% 30.8% 20.9% 19.5% 7.9% 8.2% 10.0%Aldi, Dents Road, Ashby de la Zouch 3.4% 6.8% 13.5% 13.4% 12.5% 0.9% 0.4% 10.0%Marks & Spencer Foodhall, Smithy Road, Ashby de la Zouch 0.0% 1.1% 5.1% 1.4% 1.2% 0.9% 0.2% 10.0%Other - Ashby de la Zouch 0.0% 0.4% 2.8% 0.4% 0.0% 0.0% 0.0% 10.0%
Asda, Ashby Road, Coalville 0.0% 0.5% 0.0% 0.3% 2.0% 7.6% 0.7% 10.0%Co-op, Bridge Road, Coalville 0.0% 2.5% 0.0% 0.0% 0.6% 8.7% 0.3% 10.0%Co-op, Cropston Drive, Greenhill, Coalville 0.0% 0.4% 0.0% 0.0% 0.0% 0.7% 3.4% 10.0%Home Bargains, Belvoir Shopping Centre, Coalville 0.0% 1.5% 0.0% 0.0% 0.0% 2.4% 0.7% 10.0%Aldi, Thornborough Road, Coalville 0.0% 12.3% 0.0% 1.4% 13.4% 17.3% 22.1% 10.0%Co-op, Meadlow Lane, Coalville 0.0% 0.5% 0.0% 0.0% 0.0% 1.7% 4.2% 10.0%Lidl, Thornborough Road, Coalville 0.3% 5.1% 0.4% 0.7% 4.7% 6.7% 7.7% 10.0%Morrisons, Whitwick Road, Coalville 0.3% 14.5% 0.2% 2.3% 17.0% 30.2% 34.2% 10.0%Other - Coalville 0.0% 1.9% 0.0% 0.0% 0.0% 2.6% 1.0% 10.0%
Co-op, Borough Street, Castle Donington 9.5% 0.0% 0.0% 0.0% 0.0% 0.0% 0.0% 5.0%Co-op, Station Road, Castle Donington 12.1% 0.7% 0.0% 0.0% 0.0% 0.0% 0.0% 5.0%Premier, Huntington Drive, Castle Donington 4.2% 0.0% 0.0% 0.0% 0.0% 0.0% 0.0% 5.0%Other - Castle Donington 1.2% 0.0% 0.3% 0.0% 0.0% 0.0% 0.0% 5.0%
Co-op, Ashby Road, Ibstock 0.0% 0.0% 0.0% 2.9% 23.4% 2.8% 0.0% 5.0%Other - Ibstock 0.0% 0.0% 0.0% 0.0% 0.3% 0.0% 0.0% 5.0%
Co-op, Market Place, Kegworth 10.3% 0.2% 0.0% 0.0% 0.0% 0.0% 0.0% 5.0%
Co-op, High Street, Measham 0.0% 0.0% 0.0% 10.0% 0.0% 0.0% 0.0% 5.0%Tesco Express, High Street, Measham 0.0% 0.0% 0.4% 7.6% 0.0% 0.0% 0.0% 5.0%
Other North West LeicestershireLocal shops, Donisthorpe 0.0% 0.0% 0.0% 0.9% 0.0% 0.0% 0.0% 5.0%Londis, Whitehill Road, Ellistown 0.0% 0.0% 0.0% 0.0% 0.0% 1.5% 0.0% 5.0%McColls, Central Road, Hugglescote 0.0% 0.0% 0.0% 0.0% 0.0% 4.3% 0.0% 5.0%Local shops, Moira 0.0% 0.4% 1.4% 0.0% 0.0% 0.0% 0.0% 5.0%Local shops, Packington 0.0% 0.0% 0.0% 0.0% 0.9% 0.0% 0.0% 5.0%Local shops, Ravenstone 0.0% 0.0% 0.0% 0.0% 0.2% 0.0% 0.0% 5.0%Co-op, High Street, Swadlincote 0.0% 0.0% 0.0% 0.4% 0.0% 0.0% 0.0% 5.0%Co-op, Shortheath Road, Swadlincote 0.0% 0.0% 3.7% 2.5% 0.0% 0.0% 0.0% 5.0%Co-op, The Green, Thrigstone 0.0% 8.1% 0.0% 0.0% 0.0% 0.0% 0.7% 5.0%Local shops, Long Whatton 0.9% 0.0% 0.0% 0.0% 0.0% 0.0% 0.0% 5.0%Co-op, Market Place, Whitwick 0.0% 2.8% 0.0% 0.0% 0.0% 0.5% 8.2% 5.0%Local shops, Whitwick 0.0% 0.4% 0.0% 0.0% 0.0% 0.0% 1.4% 5.0%North West Leicestershire District Total 44.0% 88.3% 77.5% 67.9% 97.7% 96.7% 95.6% -ElsewhereLoughborough 24.2% 3.6% 0.3% 0.0% 0.2% 1.3% 2.3% n/aLong Eaton 23.0% 0.3% 1.1% 0.2% 0.0% 0.0% 0.0% n/aHinckley 0.0% 0.0% 0.0% 0.5% 0.2% 0.5% 0.3% n/aLichfield 0.0% 0.0% 0.0% 0.4% 0.0% 0.0% 0.0% n/aAtherston 0.4% 0.0% 0.0% 0.3% 0.0% 0.0% 0.0% n/aSwadlincote 0.5% 3.7% 18.0% 24.5% 1.1% 0.0% 0.0% n/aLeicester 0.2% 1.2% 0.0% 0.1% 0.0% 1.3% 1.4% n/aTamworth 0.0% 1.5% 1.7% 4.2% 0.8% 0.0% 0.1% n/aOther 7.7% 1.4% 1.4% 1.9% 0.0% 0.2% 0.3% n/aElsewhere Total 56.0% 11.7% 22.5% 32.1% 2.3% 3.3% 4.4% -TOTAL 100.0% 100.0% 100.0% 100.0% 100.0% 100.0% 100.0% -
NEMS Household Survey July 2018 (weighted results)

North West Leicestershire Retail Study: Appendix 1 Convenience goods capacity
Table 5 - Base year 2018 convenience goods expenditure patterns (£M)
Location Zone 1 Zone 2 Zone 3 Zone 4 Zone 5 Zone 6 Zone 7 Inflow TotalExpenditure 2018 29.95 29.17 46.20 25.19 26.31 48.35 30.46 235.62Main CentresCo-op, Derby Road, Ashby de la Zouch 0.00 0.00 5.50 0.55 0.45 0.00 0.49 0.78 7.76Co-op, Market Street, Ashby de la Zouch 0.00 0.09 3.23 0.15 0.08 0.00 0.18 0.41 4.15Tesco Extra, Resolution Road, Ashby de la Zouch 0.54 8.14 14.23 5.26 5.13 3.82 2.50 4.40 44.02Aldi, Dents Road, Ashby de la Zouch 1.02 1.98 6.24 3.38 3.29 0.44 0.12 1.83 18.29Marks & Spencer Foodhall, Smithy Road, Ashby de la Zouch 0.00 0.32 2.36 0.35 0.32 0.44 0.06 0.43 4.27Other - Ashby de la Zouch 0.00 0.12 1.29 0.10 0.00 0.00 0.00 0.17 1.68
Asda, Ashby Road, Coalville 0.00 0.15 0.00 0.08 0.53 3.67 0.21 0.52 5.15Co-op, Bridge Road, Coalville 0.00 0.73 0.00 0.00 0.16 4.21 0.09 0.58 5.76Co-op, Cropston Drive, Greenhill, Coalville 0.00 0.12 0.00 0.00 0.00 0.34 1.04 0.17 1.66Home Bargains, Belvoir Shopping Centre, Coalville 0.00 0.44 0.00 0.00 0.00 1.16 0.21 0.20 2.01Aldi, Thornborough Road, Coalville 0.00 3.59 0.00 0.35 3.53 8.36 6.73 2.51 25.07Co-op, Meadlow Lane, Coalville 0.00 0.15 0.00 0.00 0.00 0.82 1.28 0.25 2.50Lidl, Thornborough Road, Coalville 0.09 1.49 0.18 0.18 1.24 3.24 2.35 0.97 9.73Morrisons, Whitwick Road, Coalville 0.09 4.23 0.09 0.58 4.47 14.60 10.42 3.83 38.31Other - Coalville 0.00 0.55 0.00 0.00 0.00 1.26 0.30 0.24 2.35
Co-op, Borough Street, Castle Donington 2.85 0.00 0.00 0.00 0.00 0.00 0.00 0.15 3.00Co-op, Station Road, Castle Donington 3.62 0.20 0.00 0.00 0.00 0.00 0.00 0.20 4.03Premier, Huntington Drive, Castle Donington 1.26 0.00 0.00 0.00 0.00 0.00 0.00 0.07 1.32Other - Castle Donington 0.36 0.00 0.14 0.00 0.00 0.00 0.00 0.03 0.52
Co-op, Ashby Road, Ibstock 0.00 0.00 0.00 0.73 6.16 1.35 0.00 0.43 8.67Other - Ibstock 0.00 0.00 0.00 0.00 0.08 0.00 0.00 0.00 0.08
Co-op, Market Place, Kegworth 3.09 0.06 0.00 0.00 0.00 0.00 0.00 0.17 3.31
Co-op, High Street, Measham 0.00 0.00 0.00 2.52 0.00 0.00 0.00 0.13 2.65Tesco Express, High Street, Measham 0.00 0.00 0.18 1.91 0.00 0.00 0.00 0.11 2.21
Other North West LeicestershireLocal shops, Donisthorpe 0.00 0.00 0.00 0.23 0.00 0.00 0.00 0.01 0.24Londis, Whitehill Road, Ellistown 0.00 0.00 0.00 0.00 0.00 0.73 0.00 0.04 0.76McColls, Central Road, Hugglescote 0.00 0.00 0.00 0.00 0.00 2.08 0.00 0.11 2.19Local shops, Moira 0.00 0.12 0.65 0.00 0.00 0.00 0.00 0.04 0.80Local shops, Packington 0.00 0.00 0.00 0.00 0.24 0.00 0.00 0.01 0.25Local shops, Ravenstone 0.00 0.00 0.00 0.00 0.05 0.00 0.00 0.00 0.06Co-op, High Street, Swadlincote 0.00 0.00 0.00 0.10 0.00 0.00 0.00 0.01 0.11Co-op, Shortheath Road, Swadlincote 0.00 0.00 1.71 0.63 0.00 0.00 0.00 0.12 2.46Co-op, The Green, Thrigstone 0.00 2.36 0.00 0.00 0.00 0.00 0.21 0.14 2.71Local shops, Long Whatton 0.27 0.00 0.00 0.00 0.00 0.00 0.00 0.01 0.28Co-op, Market Place, Whitwick 0.00 0.82 0.00 0.00 0.00 0.24 2.50 0.19 3.74Local shops, Whitwick 0.00 0.12 0.00 0.00 0.00 0.00 0.43 0.03 0.57North West Leicestershire District Total 13.18 25.75 35.80 17.10 25.70 46.75 29.12 19.27 212.68ElsewhereLoughborough 7.25 1.05 0.14 0.00 0.05 0.63 0.70 n/a 9.82Long Eaton 6.89 0.09 0.51 0.05 0.00 0.00 0.00 n/a 7.54Hinckley 0.00 0.00 0.00 0.13 0.05 0.24 0.09 n/a 0.51Lichfield 0.00 0.00 0.00 0.10 0.00 0.00 0.00 n/a 0.10Atherston 0.12 0.00 0.00 0.08 0.00 0.00 0.00 n/a 0.20Swadlincote 0.15 1.08 8.32 6.17 0.29 0.00 0.00 n/a 16.00Leicester 0.06 0.35 0.00 0.03 0.00 0.63 0.43 n/a 1.49Tamworth 0.00 0.44 0.79 1.06 0.21 0.00 0.03 n/a 2.52Other 2.31 0.41 0.65 0.48 0.00 0.10 0.09 n/a 4.03Elsewhere Total 16.77 3.41 10.39 8.09 0.61 1.60 1.34 n/a 42.21TOTAL 29.95 29.17 46.20 25.19 26.31 48.35 30.46 19.27 254.89
Source: Tables 3 and 4

North West Leicestershire Retail Study: Appendix 1 Convenience goods capacity
Table 6 - Future 2021 convenience goods expenditure patterns (£M)
Location Zone 1 Zone 2 Zone 3 Zone 4 Zone 5 Zone 6 Zone 7 Inflow TotalExpenditure 2021 30.92 30.10 47.68 26.00 27.16 49.90 31.43 243.19Main CentresAshby de la Zouch 1.61 10.99 33.90 10.11 9.56 4.84 3.46 8.27 82.74
Coalville 0.19 11.80 0.29 1.22 10.24 38.87 23.36 9.55 95.51
Castle Donington 8.35 0.21 0.14 0.00 0.00 0.00 0.00 0.46 9.16
Ibstock 0.00 0.00 0.00 0.75 6.44 1.40 0.00 0.45 9.04
Co-op, Market Place, Kegworth 3.18 0.06 0.00 0.00 0.00 0.00 0.00 0.17 3.42
Measham 0.00 0.00 0.19 4.58 0.00 0.00 0.00 0.25 5.02
Other NW Leicestershire 0.28 3.52 2.43 0.99 0.30 3.14 3.24 0.73 14.63North West Leicestershire District Total 13.60 26.58 36.95 17.65 26.53 48.25 30.05 19.89 219.51
Elsewhere 17.31 3.52 10.73 8.34 0.62 1.65 1.38 n/a 43.56
TOTAL 30.92 30.10 47.68 26.00 27.16 49.90 31.43 19.89 263.08
Source: Tables 3 and 4
Table 7 - Future 2026 convenience goods expenditure patterns (£M)
Location Zone 1 Zone 2 Zone 3 Zone 4 Zone 5 Zone 6 Zone 7 Inflow TotalExpenditure 2026 33.33 32.45 51.40 28.02 29.27 53.79 33.89 262.15Main CentresAshby de la Zouch 1.73 11.84 36.54 10.90 10.30 5.22 3.73 8.92 89.19
Coalville 0.20 12.72 0.31 1.32 11.04 41.90 25.18 10.30 102.96
Castle Donington 9.00 0.23 0.15 0.00 0.00 0.00 0.00 0.49 9.87
Ibstock 0.00 0.00 0.00 0.81 6.94 1.51 0.00 0.49 9.74
Co-op, Market Place, Kegworth 3.43 0.06 0.00 0.00 0.00 0.00 0.00 0.18 3.68
Measham 0.00 0.00 0.21 4.93 0.00 0.00 0.00 0.27 5.41
Other NW Leicestershire 0.30 3.80 2.62 1.06 0.32 3.39 3.49 0.79 15.77North West Leicestershire District Total 14.66 28.65 39.83 19.03 28.60 52.02 32.39 21.44 236.63
Elsewhere 18.66 3.80 11.56 9.00 0.67 1.78 1.49 n/a 46.96
TOTAL 33.33 32.45 51.40 28.02 29.27 53.79 33.89 21.44 283.59
Source: Tables 3 and 4

North West Leicestershire Retail Study: Appendix 1 Convenience goods capacity
Table 8 - Future 2031 convenience goods expenditure patterns (£M)
Location Zone 1 Zone 2 Zone 3 Zone 4 Zone 5 Zone 6 Zone 7 Inflow TotalExpenditure 2031 35.33 34.40 54.48 29.71 31.03 57.02 35.92 277.88Main CentresAshby de la Zouch 1.84 12.55 38.74 11.56 10.92 5.53 3.95 9.45 94.54
Coalville 0.21 13.48 0.33 1.40 11.70 44.42 26.69 10.91 109.14
Castle Donington 9.54 0.24 0.16 0.00 0.00 0.00 0.00 0.52 10.47
Ibstock 0.00 0.00 0.00 0.86 7.35 1.60 0.00 0.52 10.33
Co-op, Market Place, Kegworth 3.64 0.07 0.00 0.00 0.00 0.00 0.00 0.20 3.90
Measham 0.00 0.00 0.22 5.23 0.00 0.00 0.00 0.29 5.73
Other NW Leicestershire 0.32 4.02 2.78 1.13 0.34 3.59 3.70 0.84 16.72North West Leicestershire District Total 15.54 30.37 42.22 20.17 30.32 55.14 34.34 22.73 250.83
Elsewhere 19.78 4.02 12.26 9.54 0.71 1.88 1.58 n/a 49.78
TOTAL 35.33 34.40 54.48 29.71 31.03 57.02 35.92 22.73 300.60
Source: Tables 3 and 4
Table 9 - Future 2036 convenience goods expenditure patterns (£M)
Location Zone 1 Zone 2 Zone 3 Zone 4 Zone 5 Zone 6 Zone 7 Inflow TotalExpenditure 2036 37.22 36.24 57.40 31.29 32.69 60.07 37.84 292.73Main CentresAshby de la Zouch 1.94 13.23 40.81 12.17 11.51 5.83 4.16 9.96 99.60
Coalville 0.22 14.20 0.34 1.47 12.32 46.79 28.11 11.50 114.97
Castle Donington 10.05 0.25 0.17 0.00 0.00 0.00 0.00 0.55 11.03
Ibstock 0.00 0.00 0.00 0.91 7.75 1.68 0.00 0.54 10.88
Co-op, Market Place, Kegworth 3.83 0.07 0.00 0.00 0.00 0.00 0.00 0.21 4.11
Measham 0.00 0.00 0.23 5.51 0.00 0.00 0.00 0.30 6.04
Other NW Leicestershire 0.33 4.24 2.93 1.19 0.36 3.78 3.90 0.88 17.61North West Leicestershire District Total 16.38 32.00 44.48 21.25 31.94 58.09 36.17 23.94 264.24
Elsewhere 20.84 4.24 12.91 10.05 0.75 1.98 1.66 n/a 52.44
TOTAL 37.22 36.24 57.40 31.29 32.69 60.07 37.84 23.94 316.67
Source: Tables 3 and 4

North West Leicestershire Retail Study: Appendix 1 Convenience goods capacity
Table 10 - Convenience goods facilities in North West Leicestershire - Main settlements and stores (2018 prices)
Store/Area Sales floorspace (sq.m net)
Convenience goods floorspace (%)
Convenience goods floorspace (sq.m
net)
Turnover density(£ per sq.m)
Total Turnover
(£m)Co-op, Derby Road, Ashby-de-la-Zouch 1,168 85% 993 £11,171 £11.09Co-op, Market Street, Ashby-de-la-Zouch 158 95% 150 £11,171 £1.68Aldi, Dents Road, Ashby-de-la-Zouch 842 85% 716 £10,542 £7.54Marks & Spencer Foodhall, Ashby de la Zouch 706 100% 706 £10,313 £7.28Tesco Extra, Resolution Road, Ashby-de-la-Zouch 6,966 60% 4,180 £13,236 £55.32B&M Homestore, Ashby Gateway, Ashby-de-la-Zouch 1,406 20% 281 £4,031 £1.13Other - Ashby de la Zouch 750 95% 713 £6,000 £4.28Ashby-de-la-Zouch Total 11,996 7,738 £88.32Asda, Ashby Road, Coalville 793 90% 714 £13,618 £9.72Co-op, Bridge Road, Coalville (closed 2020) 1,804 85% 1,533 £11,171 £17.13Co-op, Cropston Drive, Greenhill, Coalville 253 95% 240 £11,171 £2.68Home Bargains, Belvoir Shopping Centre, Coalville 1,096 20% 219 £3,835 £0.84Iceland, Bridge Road, Coalville 229 98% 224 £6,645 £1.49Aldi, Thornborough Road, Coalville 1,082 85% 920 £10,542 £9.70Co-op, Meadow Lane, Coalville 177 95% 168 £11,171 £1.88Lidl, Thornborough Road, Coalville 1,104 85% 938 £10,542 £9.89Morrisons, Whitwick Road, Coalville 4,118 70% 2,883 £12,342 £35.58Spar, London Road, Coalville 200 95% 190 £8,206 £1.56B&M Homestore, Whitwick Road, Coalville 2,629 20% 526 £4,031 £2.12Other - Coalville 750 95% 713 £6,000 £4.28Coalville Total 14,235 9,268 £96.86Co-op, Borough Street, Castle Donington 71 95% 67 £11,171 £0.75Co-op, Station Road, Castle Donington 335 95% 318 £11,171 £3.56Premier, Huntington Drive, Castle Donington 200 95% 190 £8,000 £1.52Other - Castle Donington 60 95% 57 £6,000 £0.34Castle Donington Total 666 633 £6.17Co-op, Ashby Road, Ibstock 1,032 90% 929 £11,171 £10.38Other - Ibstock 120 95% 114 £6,000 £0.68Ibstock Total 1,152 1,043 £11.06Co-op, Market Place, Kegworth 233 95% 221 £11,171 £2.47Other - Kegworth 30 95% 29 £6,000 £0.17Kegworth Total 263 250 £2.64Co-op, High Street, Measham 230 95% 219 £11,171 £2.44Tesco Express, High Street, Measham 258 95% 245 £13,236 £3.24Other - Measham 120 95% 114 £6,000 £0.68Measham Total 608 578 £6.37Co-op, Shortheath Road, Swadlincote 335 95% 318 £11,171 £3.56Co-op, The Green, Thringstone 273 95% 259 £11,171 £2.90Londis, Whitehill Road, Ellistown 200 95% 190 £6,000 £1.14Budgens, Bardon Road 130 95% 124 £8,354 £1.03McColls, Central Road, Hugglescote 132 95% 125 £6,418 £0.80Co-op, Market Place, Whitwick 335 95% 318 £11,171 £3.56Other Total 1,405 1,335 £12.98Total 30,325 20,844 £224.41
Co-op, Hugglescote, Coalville (opened 2020) 243 95% 231 £11,171 £2.58
Source: Experian Goad Plan May 2017, VOA and ORC Storepoint 2020 and Global Data 2019
North West Leicestershire Retail Study: Appendix 1 Convenience goods capacity
Table 11 - Summary of convenience goods expenditure 2018 to 2036 (£M)
2018 2021 2026 2031 2036Available expenditureAshby de la Zouch 80.16 82.74 89.19 94.54 99.60Coalville 92.54 95.51 102.96 109.14 114.97Castle Donington 8.87 9.16 9.87 10.47 11.03Ibstock 8.76 9.04 9.74 10.33 10.88Kegworth 3.31 3.42 3.68 3.90 4.11Measham 4.86 5.02 5.41 5.73 6.04Other 14.18 14.63 15.77 16.72 17.61Total 212.68 219.51 236.63 250.83 264.24Turnover of existing facilitiesAshby de la Zouch 88.32 88.32 88.32 88.32 88.32Coalville* 96.86 82.31 82.31 82.31 82.31Castle Donington 6.17 6.17 6.17 6.17 6.17Ibstock 11.06 11.06 11.06 11.06 11.06Kegworth 2.64 2.64 2.64 2.64 2.64Measham 6.37 6.37 6.37 6.37 6.37Other 12.98 12.98 12.98 12.98 12.98Total 224.41 209.86 209.86 209.86 209.86Surplus/Deficit expenditure £mAshby de la Zouch -8.16 -5.58 0.87 6.22 11.27Coalville -4.33 13.20 20.65 26.82 32.66Castle Donington 2.70 2.99 3.70 4.30 4.85Ibstock -2.30 -2.02 -1.32 -0.73 -0.18Kegworth 0.67 0.77 1.04 1.26 1.47Measham -1.51 -1.35 -0.96 -0.64 -0.33Other 1.19 1.65 2.79 3.73 4.63Total -11.73 9.65 26.77 40.96 54.37
Source: Tables 5 to 10 *closue and opening of new smaller Co-op at 2021

North West Leicestershire Retail Study: Appendix 1 Convenience goods capacity
Table 12 - Convenience goods floorspace capacity
Area 2021 2026 2031 2036
Turnover Density New Floorspace (£ per sq.m) £12,000 £12,000 £12,000 £12,000
Sales Floorspace Projection (sq.m net)
Ashby de la Zouch -465 72 518 940Coalville 1,100 1,721 2,235 2,722
Castle Donington 249 309 358 405
Ibstock -168 -110 -61 -15Kegworth 64 87 105 122
Measham -113 -80 -53 -27Other 137 232 311 386
Total 804 2,231 3,414 4,531Floorspace Projection (sq.m gross)
Ashby de la Zouch -665 103 740 1,342Coalville 1,571 2,458 3,193 3,888
Castle Donington 356 441 511 578Ibstock -241 -157 -87 -21
Kegworth 92 124 150 175Measham -161 -114 -76 -39Other 196 332 445 551
Total 1,149 3,187 4,877 6,473
Source: Table 11


North West Leicestershire Retail Study: Appendix 2 Comparison goods capacity
Appendix 2 Comparison goods capacity
North West Leicestershire Retail Study: Appendix 2 Comparison goods capacity
Table 1 - Study area population
Zone 2018 2021 2026 2031 2036Zone 1 - Castle Donington & Kegworth 13,012 13,684 14,706 15,626 16,450Zone 2 - North of Coalville 11,792 12,401 13,327 14,161 14,907Zone 3 - Ashby de la Zouch 19,705 20,722 22,270 23,663 24,911Zone 4 - Measham 10,864 11,425 12,278 13,046 13,734Zone 5 - Ibstock 11,405 11,994 12,890 13,696 14,418Zone 6 - Coalville 21,505 22,615 24,304 25,825 27,187Zone 7 - Whitwick 13,843 14,558 15,645 16,624 17,500Total 102,126 107,399 115,420 122,641 129,108
Sources: Experian 2018
North West Leicestershire District - Office of National Statistics 2018 SNPP projections
Table 2 - Comparison goods expenditure per person per annum (£)
Zone 2018 2021 2026 2031 2036Zone 1 - Castle Donington & Kegworth 3,514 3,357 3,752 4,217 4,798Zone 2 - North of Coalville 3,562 3,403 3,802 4,273 4,862Zone 3 - Ashby de la Zouch 3,604 3,443 3,848 4,324 4,920Zone 4 - Measham 3,330 3,182 3,555 3,996 4,547Zone 5 - Ibstock 3,395 3,244 3,625 4,074 4,635Zone 6 - Coalville 3,238 3,093 3,457 3,885 4,421Zone 7 - Whitwick 2,905 2,775 3,101 3,485 3,965
Sources:
Experian Local Expenditure 2018 (2018 prices) and Retail Planner Briefing Note 18 (October 2020)
Excludes Special Forms of Trading based on Experian adjusted national average for non-retail businesses
Table 3 - Total comparison goods expenditure (£m)
Zone 2018 2021 2026 2031 2036Zone 1 - Castle Donington & Kegworth 45.73 45.94 55.17 65.89 78.92Zone 2 - North of Coalville 42.00 42.19 50.67 60.52 72.49Zone 3 - Ashby de la Zouch 71.02 71.35 85.69 102.33 122.57Zone 4 - Measham 36.18 36.35 43.65 52.13 62.44Zone 5 - Ibstock 38.72 38.90 46.72 55.79 66.83Zone 6 - Coalville 69.64 69.96 84.02 100.33 120.18Zone 7 - Whitwick 40.21 40.39 48.51 57.93 69.39Study Area Total 343.50 345.09 414.43 494.92 592.82
Source: Tables 1 and 2

North West Leicestershire Retail Study: Appendix 2 Comparison goods capacity
Table 4 - Base year 2018 comparison goods market shares (%)
Location Zone 1 Zone 2 Zone 3 Zone 4 Zone 5 Zone 6 Zone 7 InflowMain CentresAshby de la Zouch 1.5% 16.0% 39.5% 18.6% 15.3% 5.3% 4.2% 10.0%
Coalville 0.0% 13.9% 1.7% 3.5% 16.9% 33.3% 25.7% 10.0%
Castle Donington 11.7% 0.7% 0.2% 0.0% 0.0% 0.0% 0.2% 5.0%
Ibstock 0.0% 0.6% 0.3% 0.9% 8.1% 1.1% 0.5% 5.0%
Kegworth 2.5% 0.1% 0.0% 0.0% 0.0% 0.0% 0.0% 5.0%
Measham 0.0% 0.0% 0.8% 6.0% 1.1% 0.9% 0.5% 5.0%
Other North West LeicestershireHugglescote 0.0% 0.0% 0.0% 0.0% 0.1% 0.3% 0.1% 5.0%Isley Walton 0.0% 0.0% 0.0% 0.0% 0.0% 0.0% 0.0% 5.0%Long Whatton 0.6% 0.0% 0.0% 0.0% 0.0% 0.0% 0.0% 5.0%Moira 0.0% 0.0% 0.0% 0.0% 0.2% 0.1% 0.0% 5.0%Packington 0.0% 0.0% 0.0% 0.0% 0.0% 0.0% 0.0% 5.0%Ravenstone 0.0% 0.1% 0.0% 0.0% 0.1% 0.0% 0.0% 5.0%Thrigstone 0.0% 0.1% 0.0% 0.0% 0.0% 0.0% 0.0% 5.0%Whitwick 0.0% 0.9% 0.0% 0.0% 0.0% 0.2% 1.8% 5.0%North West Leicestershire District Total 16.3% 32.4% 42.5% 29.0% 41.8% 41.2% 33.0% n/aElsewhereBurton-on-Trent 0.4% 1.6% 8.8% 14.2% 3.4% 2.2% 1.7% n/aDerby 21.9% 9.3% 4.4% 3.9% 2.9% 0.3% 0.2% n/aLeicester 1.8% 12.1% 6.6% 5.7% 23.7% 20.0% 17.5% n/aFosse Shopping Park, Leicester 1.1% 11.6% 2.2% 2.1% 7.8% 11.8% 13.6% n/aLoughborough 23.2% 17.2% 1.9% 0.5% 7.1% 12.0% 22.9% n/aNottingham 12.1% 2.3% 5.2% 1.6% 1.3% 1.4% 0.7% n/aTamworth Town Centre 0.0% 3.0% 13.2% 23.9% 6.1% 1.9% 1.0% n/aOther 23.2% 10.5% 15.2% 19.1% 5.9% 9.2% 9.4% n/aElsewhere Total 83.7% 67.6% 57.5% 71.0% 58.2% 58.8% 67.0% n/aTOTAL 100.0% 100.0% 100.0% 100.0% 100.0% 100.0% 100.0% n/a
Source: NEMS Household Survey July 2018 (weighted results)

North West Leicestershire Retail Study: Appendix 2 Comparison goods capacity
Table 5 - BaseyYear 2018 comparison goods expenditure patterns (£M)
Location Zone 1 Zone 2 Zone 3 Zone 4 Zone 5 Zone 6 Zone 7 Inflow TotalExpenditure 2018 45.73 42.00 71.02 36.18 38.72 69.64 40.21 343.50Main CentresAshby de la Zouch 0.69 6.72 28.05 6.73 5.92 3.69 1.69 5.94 59.44
Coalville 0.00 5.84 1.21 1.27 6.54 23.19 10.33 5.38 53.75
Castle Donington 5.35 0.29 0.14 0.00 0.00 0.00 0.08 0.31 6.18
Ibstock 0.00 0.25 0.21 0.33 3.14 0.77 0.20 0.26 5.15
Kegworth 1.14 0.04 0.00 0.00 0.00 0.00 0.00 0.06 1.25
Measham 0.00 0.00 0.57 2.17 0.43 0.63 0.20 0.21 4.20
Other North West LeicestershireHugglescote 0.00 0.00 0.00 0.00 0.04 0.21 0.04 0.02 0.30Isley Walton 0.00 0.00 0.00 0.00 0.00 0.00 0.00 0.00 0.00Long Whatton 0.27 0.00 0.00 0.00 0.00 0.00 0.00 0.01 0.29Moira 0.00 0.00 0.00 0.00 0.08 0.07 0.00 0.01 0.15Packington 0.00 0.00 0.00 0.00 0.00 0.00 0.00 0.00 0.00Ravenstone 0.00 0.04 0.00 0.00 0.04 0.00 0.00 0.00 0.08Thrigstone 0.00 0.04 0.00 0.00 0.00 0.00 0.00 0.00 0.04Whitwick 0.00 0.38 0.00 0.00 0.00 0.14 0.72 0.07 1.31North West Leicestershire Total 7.45 13.61 30.18 10.49 16.19 28.69 13.27 12.27 132.15ElsewhereBurton-on-Trent 0.18 0.67 6.25 5.14 1.32 1.53 0.68 n/a 15.77Derby 10.01 3.91 3.12 1.41 1.12 0.21 0.08 n/a 19.87Leicester 0.82 5.08 4.69 2.06 9.18 13.93 7.04 n/a 42.80Fosse Shopping Park, Leicester 0.50 4.87 1.56 0.76 3.02 8.22 5.47 n/a 24.40Loughborough 10.61 7.22 1.35 0.18 2.75 8.36 9.21 n/a 39.68Nottingham 5.53 0.97 3.69 0.58 0.50 0.97 0.28 n/a 12.53Tamworth Town Centre 0.00 1.26 9.37 8.65 2.36 1.32 0.40 n/a 23.37Other 10.61 4.41 10.80 6.91 2.28 6.41 3.78 n/a 45.20Other Total 38.28 28.39 40.84 25.69 22.54 40.95 26.94 n/a 223.62TOTAL 45.73 42.00 71.02 36.18 38.72 69.64 40.21 12.27 355.77
Source: Tables 3 and 4

North West Leicestershire Retail Study: Appendix 2 Comparison goods capacity
Table 6 - Future 2021 comparison goods expenditure patterns (£M)
Location Zone 1 Zone 2 Zone 3 Zone 4 Zone 5 Zone 6 Zone 7 Inflow TotalExpenditure 2021 45.94 42.19 71.35 36.35 38.90 69.96 40.39 345.09Main CentresAshby de la Zouch 0.69 6.75 28.18 6.76 5.95 3.71 1.70 5.97 59.71
Coalville 0.00 5.87 1.21 1.27 6.57 23.30 10.38 5.40 54.00
Castle Donington 5.38 0.30 0.14 0.00 0.00 0.00 0.08 0.31 6.20
Ibstock 0.00 0.25 0.21 0.33 3.15 0.77 0.20 0.26 5.18
Kegworth 1.15 0.04 0.00 0.00 0.00 0.00 0.00 0.06 1.25
Measham 0.00 0.00 0.57 2.18 0.43 0.63 0.20 0.21 4.22
Other North West LeicestershireHugglescote 0.00 0.00 0.00 0.00 0.04 0.21 0.04 0.02 0.30Isley Walton 0.00 0.00 0.00 0.00 0.00 0.00 0.00 0.00 0.00Long Whatton 0.28 0.00 0.00 0.00 0.00 0.00 0.00 0.01 0.29Moira 0.00 0.00 0.00 0.00 0.08 0.07 0.00 0.01 0.16Packington 0.00 0.00 0.00 0.00 0.00 0.00 0.00 0.00 0.00Ravenstone 0.00 0.04 0.00 0.00 0.04 0.00 0.00 0.00 0.09Thrigstone 0.00 0.04 0.00 0.00 0.00 0.00 0.00 0.00 0.04Whitwick 0.00 0.38 0.00 0.00 0.00 0.14 0.73 0.07 1.31North West Leicestershire Total 7.49 13.67 30.32 10.54 16.26 28.82 13.33 12.32 132.76ElsewhereBurton-on-Trent 0.18 0.68 6.28 5.16 1.32 1.54 0.69 n/a 15.85Derby 10.06 3.92 3.14 1.42 1.13 0.21 0.08 n/a 19.96Leicester 0.83 5.11 4.71 2.07 9.22 13.99 7.07 n/a 42.99Fosse Shopping Park, Leicester 0.51 4.89 1.57 0.76 3.03 8.26 5.49 n/a 24.52Loughborough 10.66 7.26 1.36 0.18 2.76 8.39 9.25 n/a 39.86Nottingham 5.56 0.97 3.71 0.58 0.51 0.98 0.28 n/a 12.59Tamworth Town Centre 0.00 1.27 9.42 8.69 2.37 1.33 0.40 n/a 23.48Other 10.66 4.43 10.85 6.94 2.30 6.44 3.80 n/a 45.40Other Total 38.45 28.52 41.03 25.81 22.64 41.14 27.06 n/a 224.65TOTAL 45.94 42.19 71.35 36.35 38.90 69.96 40.39 12.32 357.41
Source: Tables 3 and 4

North West Leicestershire Retail Study: Appendix 2 Comparison goods capacity
Table 7 - Future 2026 comparison goods expenditure patterns (£M)
Location Zone 1 Zone 2 Zone 3 Zone 4 Zone 5 Zone 6 Zone 7 Inflow TotalExpenditure 2026 55.17 50.67 85.69 43.65 46.72 84.02 48.51 414.43Main CentresAshby de la Zouch 0.83 8.11 33.85 8.12 7.15 4.45 2.04 7.17 71.71
Coalville 0.00 7.04 1.46 1.53 7.90 27.98 12.47 6.49 64.85
Castle Donington 6.46 0.35 0.17 0.00 0.00 0.00 0.10 0.37 7.45
Ibstock 0.00 0.30 0.26 0.39 3.78 0.92 0.24 0.31 6.22
Kegworth 1.38 0.05 0.00 0.00 0.00 0.00 0.00 0.08 1.51
Measham 0.00 0.00 0.69 2.62 0.51 0.76 0.24 0.25 5.07
Other North West LeicestershireHugglescote 0.00 0.00 0.00 0.00 0.05 0.25 0.05 0.02 0.37Isley Walton 0.00 0.00 0.00 0.00 0.00 0.00 0.00 0.00 0.00Long Whatton 0.33 0.00 0.00 0.00 0.00 0.00 0.00 0.02 0.35Moira 0.00 0.00 0.00 0.00 0.09 0.08 0.00 0.01 0.19Packington 0.00 0.00 0.00 0.00 0.00 0.00 0.00 0.00 0.00Ravenstone 0.00 0.05 0.00 0.00 0.05 0.00 0.00 0.01 0.10Thrigstone 0.00 0.05 0.00 0.00 0.00 0.00 0.00 0.00 0.05Whitwick 0.00 0.46 0.00 0.00 0.00 0.17 0.87 0.08 1.58North West Leicestershire Total 8.99 16.42 36.42 12.66 19.53 34.61 16.01 14.80 159.44ElsewhereBurton-on-Trent 0.22 0.81 7.54 6.20 1.59 1.85 0.82 n/a 19.03Derby 12.08 4.71 3.77 1.70 1.35 0.25 0.10 n/a 23.97Leicester 0.99 6.13 5.66 2.49 11.07 16.80 8.49 n/a 51.63Fosse Shopping Park, Leicester 0.61 5.88 1.89 0.92 3.64 9.91 6.60 n/a 29.44Loughborough 12.80 8.72 1.63 0.22 3.32 10.08 11.11 n/a 47.87Nottingham 6.68 1.17 4.46 0.70 0.61 1.18 0.34 n/a 15.12Tamworth Town Centre 0.00 1.52 11.31 10.43 2.85 1.60 0.49 n/a 28.20Other 12.80 5.32 13.02 8.34 2.76 7.73 4.56 n/a 54.53Other Total 46.18 34.26 49.27 30.99 27.19 49.40 32.50 n/a 269.79TOTAL 55.17 50.67 85.69 43.65 46.72 84.02 48.51 14.80 429.23
Source: Tables 3 and 4

North West Leicestershire Retail Study: Appendix 2 Comparison goods capacity
Table 8 - Future 2031 comparison goods expenditure patterns (£M)
Location Zone 1 Zone 2 Zone 3 Zone 4 Zone 5 Zone 6 Zone 7 Inflow TotalExpenditure 2031 65.89 60.52 102.33 52.13 55.79 100.33 57.93 494.92Main CentresAshby de la Zouch 0.99 9.68 40.42 9.70 8.54 5.32 2.43 8.56 85.64
Coalville 0.00 8.41 1.74 1.82 9.43 33.41 14.89 7.74 77.45
Castle Donington 7.71 0.42 0.20 0.00 0.00 0.00 0.12 0.44 8.90
Ibstock 0.00 0.36 0.31 0.47 4.52 1.10 0.29 0.37 7.42
Kegworth 1.65 0.06 0.00 0.00 0.00 0.00 0.00 0.09 1.80
Measham 0.00 0.00 0.82 3.13 0.61 0.90 0.29 0.30 6.06
Other North West LeicestershireHugglescote 0.00 0.00 0.00 0.00 0.06 0.30 0.06 0.02 0.44Isley Walton 0.00 0.00 0.00 0.00 0.00 0.00 0.00 0.00 0.00Long Whatton 0.40 0.00 0.00 0.00 0.00 0.00 0.00 0.02 0.42Moira 0.00 0.00 0.00 0.00 0.11 0.10 0.00 0.01 0.22Packington 0.00 0.00 0.00 0.00 0.00 0.00 0.00 0.00 0.00Ravenstone 0.00 0.06 0.00 0.00 0.06 0.00 0.00 0.01 0.12Thrigstone 0.00 0.06 0.00 0.00 0.00 0.00 0.00 0.00 0.06Whitwick 0.00 0.54 0.00 0.00 0.00 0.20 1.04 0.09 1.88North West Leicestershire Total 10.74 19.61 43.49 15.12 23.32 41.34 19.12 17.67 190.41ElsewhereBurton-on-Trent 0.26 0.97 9.00 7.40 1.90 2.21 0.98 n/a 22.73Derby 14.43 5.63 4.50 2.03 1.62 0.30 0.12 n/a 28.63Leicester 1.19 7.32 6.75 2.97 13.22 20.07 10.14 n/a 61.66Fosse Shopping Park, Leicester 0.72 7.02 2.25 1.09 4.35 11.84 7.88 n/a 35.16Loughborough 15.29 10.41 1.94 0.26 3.96 12.04 13.27 n/a 57.17Nottingham 7.97 1.39 5.32 0.83 0.73 1.40 0.41 n/a 18.05Tamworth Town Centre 0.00 1.82 13.51 12.46 3.40 1.91 0.58 n/a 33.67Other 15.29 6.35 15.55 9.96 3.29 9.23 5.45 n/a 65.12Other Total 55.15 40.91 58.84 37.01 32.47 59.00 38.81 n/a 322.19TOTAL 65.89 60.52 102.33 52.13 55.79 100.33 57.93 17.67 512.60
Source: Tables 3 and 4
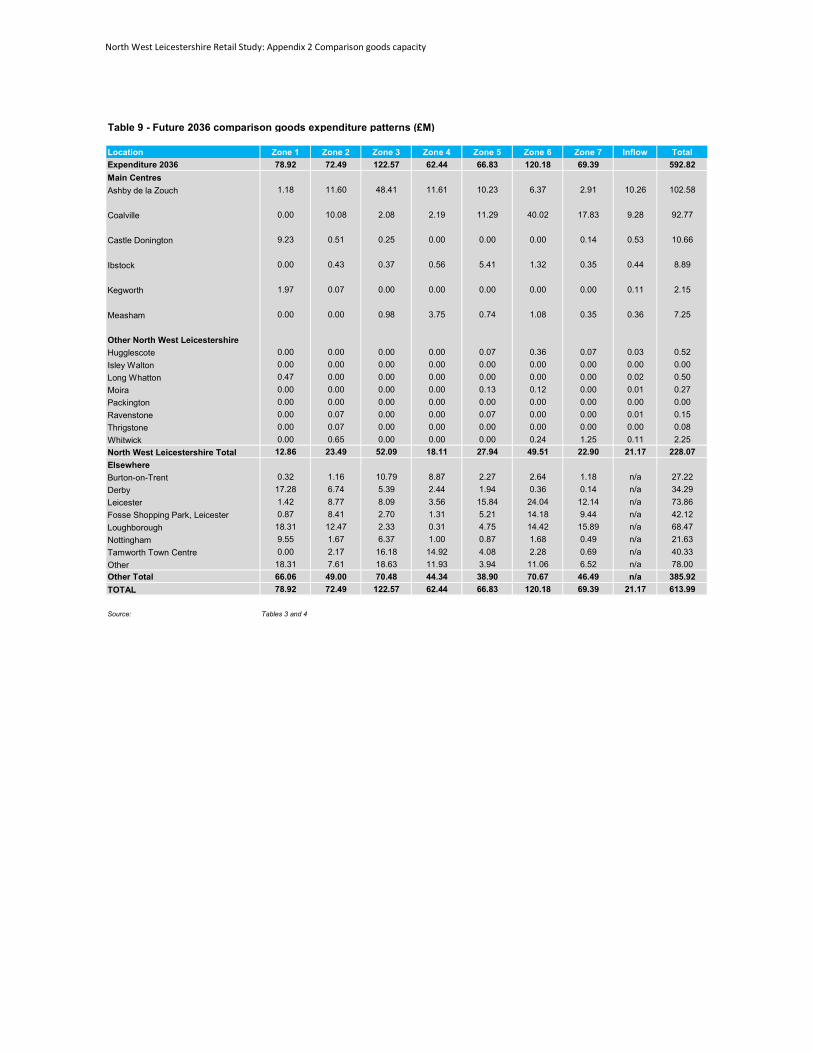
North West Leicestershire Retail Study: Appendix 2 Comparison goods capacity
Table 9 - Future 2036 comparison goods expenditure patterns (£M)
Location Zone 1 Zone 2 Zone 3 Zone 4 Zone 5 Zone 6 Zone 7 Inflow TotalExpenditure 2036 78.92 72.49 122.57 62.44 66.83 120.18 69.39 592.82Main CentresAshby de la Zouch 1.18 11.60 48.41 11.61 10.23 6.37 2.91 10.26 102.58
Coalville 0.00 10.08 2.08 2.19 11.29 40.02 17.83 9.28 92.77
Castle Donington 9.23 0.51 0.25 0.00 0.00 0.00 0.14 0.53 10.66
Ibstock 0.00 0.43 0.37 0.56 5.41 1.32 0.35 0.44 8.89
Kegworth 1.97 0.07 0.00 0.00 0.00 0.00 0.00 0.11 2.15
Measham 0.00 0.00 0.98 3.75 0.74 1.08 0.35 0.36 7.25
Other North West LeicestershireHugglescote 0.00 0.00 0.00 0.00 0.07 0.36 0.07 0.03 0.52Isley Walton 0.00 0.00 0.00 0.00 0.00 0.00 0.00 0.00 0.00Long Whatton 0.47 0.00 0.00 0.00 0.00 0.00 0.00 0.02 0.50Moira 0.00 0.00 0.00 0.00 0.13 0.12 0.00 0.01 0.27Packington 0.00 0.00 0.00 0.00 0.00 0.00 0.00 0.00 0.00Ravenstone 0.00 0.07 0.00 0.00 0.07 0.00 0.00 0.01 0.15Thrigstone 0.00 0.07 0.00 0.00 0.00 0.00 0.00 0.00 0.08Whitwick 0.00 0.65 0.00 0.00 0.00 0.24 1.25 0.11 2.25North West Leicestershire Total 12.86 23.49 52.09 18.11 27.94 49.51 22.90 21.17 228.07ElsewhereBurton-on-Trent 0.32 1.16 10.79 8.87 2.27 2.64 1.18 n/a 27.22Derby 17.28 6.74 5.39 2.44 1.94 0.36 0.14 n/a 34.29Leicester 1.42 8.77 8.09 3.56 15.84 24.04 12.14 n/a 73.86Fosse Shopping Park, Leicester 0.87 8.41 2.70 1.31 5.21 14.18 9.44 n/a 42.12Loughborough 18.31 12.47 2.33 0.31 4.75 14.42 15.89 n/a 68.47Nottingham 9.55 1.67 6.37 1.00 0.87 1.68 0.49 n/a 21.63Tamworth Town Centre 0.00 2.17 16.18 14.92 4.08 2.28 0.69 n/a 40.33Other 18.31 7.61 18.63 11.93 3.94 11.06 6.52 n/a 78.00Other Total 66.06 49.00 70.48 44.34 38.90 70.67 46.49 n/a 385.92TOTAL 78.92 72.49 122.57 62.44 66.83 120.18 69.39 21.17 613.99
Source: Tables 3 and 4

North West Leicestershire Retail Study: Appendix 2 Comparison goods capacity
Table 10 - Summary of comparison goods expenditure 2018 to 2036 (£M)
Area 2018 2021 2026 2031 2036Available expenditureAshby de la Zouch 59.44 59.71 71.71 85.64 102.58
Coalville 53.75 54.00 64.85 77.45 92.77
Castle Donington 6.18 6.20 7.45 8.90 10.66
Ibstock 5.15 5.18 6.22 7.42 8.89
Kegworth 1.25 1.25 1.51 1.80 2.15
Measham 4.20 4.22 5.07 6.06 7.25
Other 2.18 2.19 2.63 3.14 3.77Total 132.15 132.76 159.44 190.41 228.07Projected turnover of existing facilitiesAshby de la Zouch 59.44 58.52 68.83 78.56 89.31
Coalville 53.75 52.92 62.25 71.04 80.77
Castle Donington 6.18 6.08 7.15 8.16 9.28
Ibstock 5.15 5.07 5.97 6.81 7.74
Kegworth 1.25 1.23 1.44 1.65 1.87
Measham 4.20 4.14 4.87 5.55 6.32
Other 2.18 2.15 2.53 2.88 3.28Total 132.15 130.11 153.03 174.66 198.58Surplus Expenditure (£m)Ashby de la Zouch 0.00 1.19 2.88 7.08 13.26
Coalville 0.00 1.08 2.61 6.40 12.00
Castle Donington 0.00 0.12 0.30 0.74 1.38
Ibstock 0.00 0.10 0.25 0.61 1.15
Kegworth 0.00 0.03 0.06 0.15 0.28
Measham 0.00 0.08 0.20 0.50 0.94
Other 0.00 0.04 0.11 0.26 0.49Total 0.00 2.65 6.41 15.74 29.49
Source: Tables 5 to 9

North West Leicestershire Retail Study: Appendix 2 Comparison goods capacity
Table 11 - North West Leicestershire comparison goods floorspace capacity
2018 2021 2026 2031 2036Turnover Density New Floorspace (£ per sq.m) £6,000 £5,907 £6,948 £7,930 £9,016Floorspace Projection (sq.m net)Ashby de la Zouch 0 202 415 893 1,471
Coalville 0 183 375 808 1,330
Castle Donington 0 21 43 93 153
Ibstock 0 18 36 77 128
Kegworth 0 4 9 19 31
Measham 0 14 29 63 104
Other 0 7 15 33 54Total 0 449 923 1,985 3,271Floorspace Projection (sq.m gross)Ashby de la Zouch 0 269 553 1,191 1,962
Coalville 0 244 501 1,077 1,774
Castle Donington 0 28 58 124 204
Ibstock 0 23 48 103 170
Kegworth 0 6 12 25 41
Measham 0 19 39 84 139
Other 0 10 20 44 72Total 0 599 1,231 2,647 4,361
Source: Table 10

North West Leicestershire Retail Study: Appendix 3 Food/beverage capacity
Appendix 3 Food/beverage capacity

North West Leicestershire Retail Study: Appendix 3 Food/beverage capacity
Table 1 - Study area population
Zone 2018 2021 2026 2031 2036Zone 1 - Castle Donington & Kegworth 13,012 13,684 14,706 15,626 16,450Zone 2 - North of Coalville 11,792 12,401 13,327 14,161 14,907Zone 3 - Ashby de la Zouch 19,705 20,722 22,270 23,663 24,911Zone 4 - Measham 10,864 11,425 12,278 13,046 13,734Zone 5 - Ibstock 11,405 11,994 12,890 13,696 14,418Zone 6 - Coalville 21,505 22,615 24,304 25,825 27,187Zone 7 - Whitwick 13,843 14,558 15,645 16,624 17,500Total 102,126 107,399 115,420 122,641 129,108
Sources: Experian 2018
North West Leicestershire District - Office of National Statistics 2018 SNPP projections
Table 2 - Food and beverage expenditure per person per annum (£)
Zone 2018 2021 2026 2031 2036Zone 1 - Castle Donington & Kegworth 1,355 1,026 1,320 1,408 1,473Zone 2 - North of Coalville 1,368 1,036 1,333 1,422 1,487Zone 3 - Ashby de la Zouch 1,351 1,023 1,316 1,404 1,468Zone 4 - Measham 1,225 927 1,194 1,273 1,331Zone 5 - Ibstock 1,276 966 1,243 1,326 1,387Zone 6 - Coalville 1,236 936 1,204 1,285 1,343Zone 7 - Whitwick 1,086 822 1,058 1,129 1,180
Sources:
Experian Local Expenditure 2018 (2018 prices) and Retail Planner Briefing Note 18 (October 2020)
Table 3 - Total food and beverage expenditure (£m)
Zone 2018 2021 2026 2031 2036
Zone 1 - Castle Donington & Kegworth 17.63 14.04 19.42 22.01 24.23Zone 2 - North of Coalville 16.13 12.84 17.77 20.13 22.17Zone 3 - Ashby de la Zouch 26.62 21.20 29.32 33.23 36.58Zone 4 - Measham 13.31 10.60 14.66 16.61 18.29Zone 5 - Ibstock 14.55 11.59 16.03 18.16 20.00Zone 6 - Coalville 26.58 21.16 29.27 33.17 36.52Zone 7 - Whitwick 15.03 11.97 16.56 18.76 20.66Study Area Total 129.86 103.39 143.01 162.07 178.44
Source: Tables 1 and 2
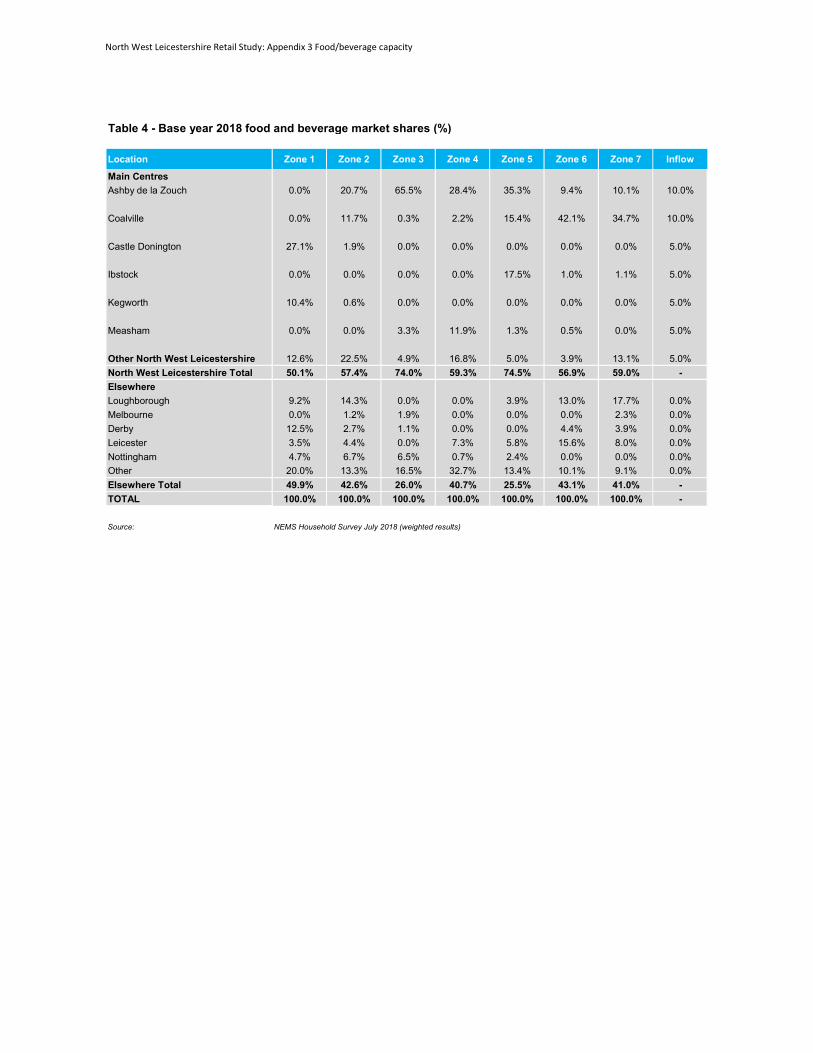
North West Leicestershire Retail Study: Appendix 3 Food/beverage capacity
Table 4 - Base year 2018 food and beverage market shares (%)
Location Zone 1 Zone 2 Zone 3 Zone 4 Zone 5 Zone 6 Zone 7 Inflow
Main CentresAshby de la Zouch 0.0% 20.7% 65.5% 28.4% 35.3% 9.4% 10.1% 10.0%
Coalville 0.0% 11.7% 0.3% 2.2% 15.4% 42.1% 34.7% 10.0%
Castle Donington 27.1% 1.9% 0.0% 0.0% 0.0% 0.0% 0.0% 5.0%
Ibstock 0.0% 0.0% 0.0% 0.0% 17.5% 1.0% 1.1% 5.0%
Kegworth 10.4% 0.6% 0.0% 0.0% 0.0% 0.0% 0.0% 5.0%
Measham 0.0% 0.0% 3.3% 11.9% 1.3% 0.5% 0.0% 5.0%
Other North West Leicestershire 12.6% 22.5% 4.9% 16.8% 5.0% 3.9% 13.1% 5.0%North West Leicestershire Total 50.1% 57.4% 74.0% 59.3% 74.5% 56.9% 59.0% -ElsewhereLoughborough 9.2% 14.3% 0.0% 0.0% 3.9% 13.0% 17.7% 0.0%Melbourne 0.0% 1.2% 1.9% 0.0% 0.0% 0.0% 2.3% 0.0%Derby 12.5% 2.7% 1.1% 0.0% 0.0% 4.4% 3.9% 0.0%Leicester 3.5% 4.4% 0.0% 7.3% 5.8% 15.6% 8.0% 0.0%Nottingham 4.7% 6.7% 6.5% 0.7% 2.4% 0.0% 0.0% 0.0%Other 20.0% 13.3% 16.5% 32.7% 13.4% 10.1% 9.1% 0.0%Elsewhere Total 49.9% 42.6% 26.0% 40.7% 25.5% 43.1% 41.0% -TOTAL 100.0% 100.0% 100.0% 100.0% 100.0% 100.0% 100.0% -
Source: NEMS Household Survey July 2018 (weighted results)

North West Leicestershire Retail Study: Appendix 3 Food/beverage capacity
Table 5 - Base year 2018 food and beverage expenditure patterns (£M)
Location Zone 1 Zone 2 Zone 3 Zone 4 Zone 5 Zone 6 Zone 7 Inflow TotalExpenditure 2018 17.63 16.13 26.62 13.31 14.55 26.58 15.03 129.86Main CentresAshby de la Zouch 0.00 3.34 17.44 3.78 5.14 2.50 1.52 3.75 37.46
Coalville 0.00 1.89 0.08 0.29 2.24 11.19 5.22 1.10 22.01
Castle Donington 4.78 0.31 0.00 0.00 0.00 0.00 0.00 0.27 5.35
Ibstock 0.00 0.00 0.00 0.00 2.55 0.27 0.17 0.16 3.13
Kegworth 1.83 0.10 0.00 0.00 0.00 0.00 0.00 0.10 2.03
Measham 0.00 0.00 0.88 1.58 0.19 0.13 0.00 0.15 2.93
Other North West Leicestershire 2.22 3.63 1.30 2.24 0.73 1.04 1.97 0.00 13.13North West Leicestershire Total 8.83 9.26 19.70 7.89 10.84 15.12 8.87 5.52 86.04ElsewhereLoughborough 1.62 2.31 0.00 0.00 0.57 3.46 2.66 n/a 10.61Melbourne 0.00 0.19 0.51 0.00 0.00 0.00 0.35 n/a 1.05Derby 2.20 0.44 0.29 0.00 0.00 1.17 0.59 n/a 4.69Leicester 0.62 0.71 0.00 0.97 0.84 4.15 1.20 n/a 8.49Nottingham 0.83 1.08 1.73 0.09 0.35 0.00 0.00 n/a 4.08Other 3.53 2.15 4.39 4.35 1.95 2.68 1.37 n/a 20.42Elsewhere Total 8.80 6.87 6.92 5.42 3.71 11.46 6.16 n/a 49.34TOTAL 17.63 16.13 26.62 13.31 14.55 26.58 15.03 n/a 135.38
Source: Tables 3 and 4
Table 6 - Future 2021 food and beverage expenditure patterns (£M)
Location Zone 1 Zone 2 Zone 3 Zone 4 Zone 5 Zone 6 Zone 7 Inflow TotalExpenditure 2021 14.04 12.84 21.20 10.60 11.59 21.16 11.97 103.39Main CentresAshby de la Zouch 0.00 2.66 13.88 3.01 4.09 1.99 1.21 2.98 29.82
Coalville 0.00 1.50 0.06 0.23 1.78 8.91 4.15 0.88 17.52
Castle Donington 3.80 0.24 0.00 0.00 0.00 0.00 0.00 0.21 4.26
Ibstock 0.00 0.00 0.00 0.00 2.03 0.21 0.13 0.12 2.50
Kegworth 1.46 0.08 0.00 0.00 0.00 0.00 0.00 0.08 1.62
Measham 0.00 0.00 0.70 1.26 0.15 0.11 0.00 0.12 2.33
Other North West Leicestershire 1.77 2.89 1.04 1.78 0.58 0.83 1.57 0.00 10.45North West Leicestershire Total 7.03 7.37 15.69 6.28 8.63 12.04 7.06 4.39 68.50ElsewhereLoughborough 1.29 1.84 0.00 0.00 0.45 2.75 2.12 n/a 8.45Melbourne 0.00 0.15 0.40 0.00 0.00 0.00 0.28 n/a 0.83Derby 1.75 0.35 0.23 0.00 0.00 0.93 0.47 n/a 3.73Leicester 0.49 0.57 0.00 0.77 0.67 3.30 0.96 n/a 6.76Nottingham 0.66 0.86 1.38 0.07 0.28 0.00 0.00 n/a 3.25Other 2.81 1.71 3.50 3.46 1.55 2.14 1.09 n/a 16.26Elsewhere Total 7.00 5.47 5.51 4.31 2.95 9.12 4.91 n/a 39.28TOTAL 14.04 12.84 21.20 10.60 11.59 21.16 11.97 n/a 107.79
Source: Tables 3 and 4

North West Leicestershire Retail Study: Appendix 3 Food/beverage capacity
Table 7 - Future 2026 food and beverage expenditure patterns (£M)
Location Zone 1 Zone 2 Zone 3 Zone 4 Zone 5 Zone 6 Zone 7 Inflow TotalExpenditure 2026 19.42 17.77 29.32 14.66 16.03 29.27 16.56 143.01Main CentresAshby de la Zouch 0.00 3.68 19.20 4.16 5.66 2.75 1.67 4.12 41.25
Coalville 0.00 2.08 0.09 0.32 2.47 12.32 5.75 1.21 24.24
Castle Donington 5.26 0.34 0.00 0.00 0.00 0.00 0.00 0.29 5.89
Ibstock 0.00 0.00 0.00 0.00 2.80 0.29 0.18 0.17 3.45
Kegworth 2.02 0.11 0.00 0.00 0.00 0.00 0.00 0.11 2.24
Measham 0.00 0.00 0.97 1.74 0.21 0.15 0.00 0.16 3.23
Other North West Leicestershire 2.45 4.00 1.44 2.46 0.80 1.14 2.17 0.00 14.45North West Leicestershire Total 9.73 10.20 21.70 8.69 11.94 16.66 9.77 6.08 94.75ElsewhereLoughborough 1.79 2.54 0.00 0.00 0.63 3.81 2.93 n/a 11.69Melbourne 0.00 0.21 0.56 0.00 0.00 0.00 0.38 n/a 1.15Derby 2.43 0.48 0.32 0.00 0.00 1.29 0.65 n/a 5.16Leicester 0.68 0.78 0.00 1.07 0.93 4.57 1.32 n/a 9.35Nottingham 0.91 1.19 1.91 0.10 0.38 0.00 0.00 n/a 4.50Other 3.88 2.36 4.84 4.79 2.15 2.96 1.51 n/a 22.49Elsewhere Total 9.69 7.57 7.62 5.97 4.09 12.62 6.79 n/a 54.34TOTAL 19.42 17.77 29.32 14.66 16.03 29.27 16.56 n/a 149.09
Source: Tables 3 and 4
Table 8 - Future 2031 food and beverage expenditure patterns (£M)
Location Zone 1 Zone 2 Zone 3 Zone 4 Zone 5 Zone 6 Zone 7 Inflow TotalExpenditure 2031 22.01 20.13 33.23 16.61 18.16 33.17 18.76 162.07Main CentresAshby de la Zouch 0.00 4.17 21.76 4.72 6.41 3.12 1.90 4.67 46.75
Coalville 0.00 2.36 0.10 0.37 2.80 13.97 6.51 1.37 27.47
Castle Donington 5.96 0.38 0.00 0.00 0.00 0.00 0.00 0.33 6.68
Ibstock 0.00 0.00 0.00 0.00 3.18 0.33 0.21 0.20 3.91
Kegworth 2.29 0.12 0.00 0.00 0.00 0.00 0.00 0.13 2.54
Measham 0.00 0.00 1.10 1.98 0.24 0.17 0.00 0.18 3.66
Other North West Leicestershire 2.77 4.53 1.63 2.79 0.91 1.29 2.46 0.00 16.38North West Leicestershire Total 11.02 11.56 24.59 9.85 13.53 18.88 11.07 6.89 107.38ElsewhereLoughborough 2.02 2.88 0.00 0.00 0.71 4.31 3.32 n/a 13.25Melbourne 0.00 0.24 0.63 0.00 0.00 0.00 0.43 n/a 1.30Derby 2.75 0.54 0.37 0.00 0.00 1.46 0.73 n/a 5.85Leicester 0.77 0.89 0.00 1.21 1.05 5.18 1.50 n/a 10.60Nottingham 1.03 1.35 2.16 0.12 0.44 0.00 0.00 n/a 5.10Other 4.40 2.68 5.48 5.43 2.43 3.35 1.71 n/a 25.48Elsewhere Total 10.98 8.58 8.64 6.76 4.63 14.30 7.69 n/a 61.58TOTAL 22.01 20.13 33.23 16.61 18.16 33.17 18.76 n/a 168.96
Source: Tables 3 and 4
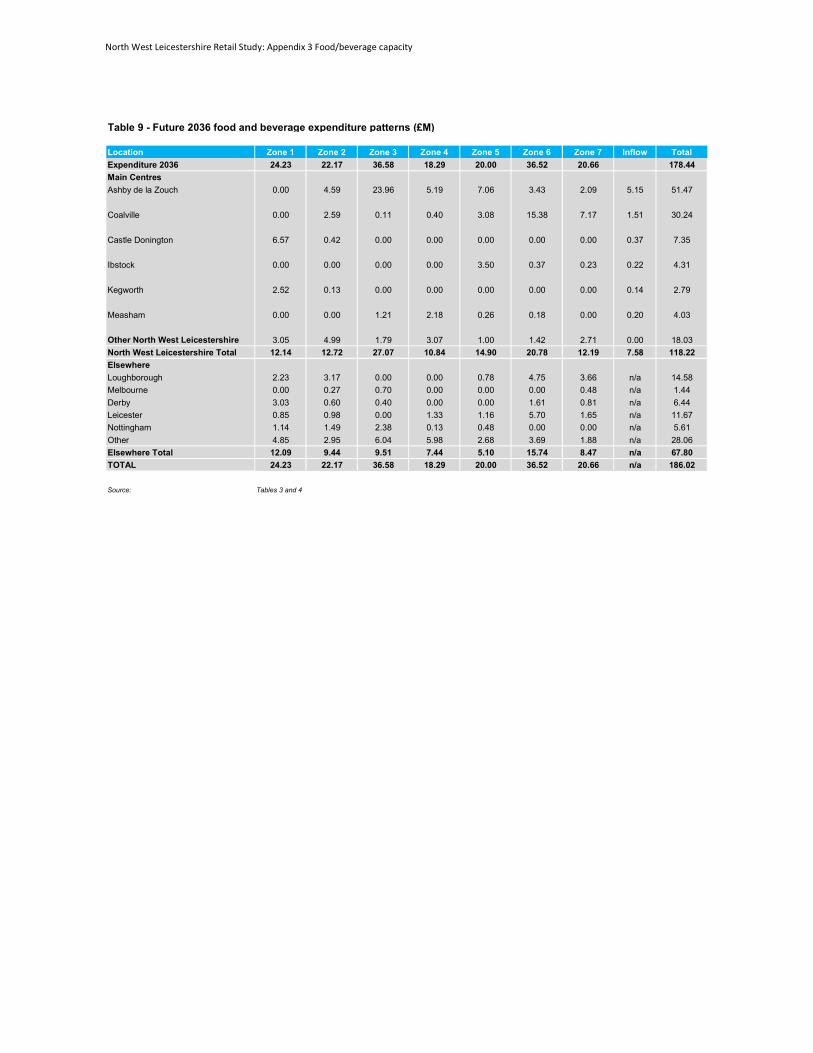
North West Leicestershire Retail Study: Appendix 3 Food/beverage capacity
Table 9 - Future 2036 food and beverage expenditure patterns (£M)
Location Zone 1 Zone 2 Zone 3 Zone 4 Zone 5 Zone 6 Zone 7 Inflow TotalExpenditure 2036 24.23 22.17 36.58 18.29 20.00 36.52 20.66 178.44Main CentresAshby de la Zouch 0.00 4.59 23.96 5.19 7.06 3.43 2.09 5.15 51.47
Coalville 0.00 2.59 0.11 0.40 3.08 15.38 7.17 1.51 30.24
Castle Donington 6.57 0.42 0.00 0.00 0.00 0.00 0.00 0.37 7.35
Ibstock 0.00 0.00 0.00 0.00 3.50 0.37 0.23 0.22 4.31
Kegworth 2.52 0.13 0.00 0.00 0.00 0.00 0.00 0.14 2.79
Measham 0.00 0.00 1.21 2.18 0.26 0.18 0.00 0.20 4.03
Other North West Leicestershire 3.05 4.99 1.79 3.07 1.00 1.42 2.71 0.00 18.03North West Leicestershire Total 12.14 12.72 27.07 10.84 14.90 20.78 12.19 7.58 118.22ElsewhereLoughborough 2.23 3.17 0.00 0.00 0.78 4.75 3.66 n/a 14.58Melbourne 0.00 0.27 0.70 0.00 0.00 0.00 0.48 n/a 1.44Derby 3.03 0.60 0.40 0.00 0.00 1.61 0.81 n/a 6.44Leicester 0.85 0.98 0.00 1.33 1.16 5.70 1.65 n/a 11.67Nottingham 1.14 1.49 2.38 0.13 0.48 0.00 0.00 n/a 5.61Other 4.85 2.95 6.04 5.98 2.68 3.69 1.88 n/a 28.06Elsewhere Total 12.09 9.44 9.51 7.44 5.10 15.74 8.47 n/a 67.80TOTAL 24.23 22.17 36.58 18.29 20.00 36.52 20.66 n/a 186.02
Source: Tables 3 and 4

North West Leicestershire Retail Study: Appendix 3 Food/beverage capacity
Table 10 - Summary of food and beverage expenditure 2018 to 2036 (£M)
Area 2018 2021 2026 2031 2036Available expenditureAshby de la Zouch 37.46 29.82 41.25 46.75 51.47
Coalville 22.01 17.52 24.24 27.47 30.24
Castle Donington 5.35 4.26 5.89 6.68 7.35
Ibstock 3.13 2.50 3.45 3.91 4.31
Kegworth 2.03 1.62 2.24 2.54 2.79
Measham 2.93 2.33 3.23 3.66 4.03
Other 13.13 10.45 14.45 16.38 18.03Total 86.04 68.50 94.75 107.38 118.22Turnover of existing facilitiesAshby de la Zouch 37.46 38.59 40.56 42.63 44.80
Coalville 22.01 22.68 23.83 25.05 26.33
Castle Donington 5.35 5.51 5.80 6.09 6.40
Ibstock 3.13 3.23 3.39 3.57 3.75
Kegworth 2.03 2.09 2.20 2.31 2.43
Measham 2.93 3.02 3.17 3.34 3.51
Other 13.13 13.52 14.21 14.94 15.70Total 86.04 88.65 93.17 97.92 102.91
Source: Table 6 to 9

North West Leicestershire Retail Study: Appendix 3 Food/beverage capacity
Table 11: Food and beverage floorspace capacity
2018 2021 2026 2031 2036Surplus Expenditure (£m)Ashby de la Zouch 0.00 -8.77 0.69 4.12 6.66
Coalville 0.00 -5.15 0.41 2.42 3.92
Castle Donington 0.00 -1.25 0.10 0.59 0.95
Ibstock 0.00 -0.73 0.06 0.34 0.56
Kegworth 0.00 -0.48 0.04 0.22 0.36
Measham 0.00 -0.69 0.05 0.32 0.52
Other 0.00 -3.07 0.24 1.44 2.34Total 0.00 -20.14 1.59 9.46 15.31Turnover Density New Floorspace (£ per sq.m) £5,000 £5,152 £5,414 £5,690 £5,981
Floorspace Projection (sq.m gross)Ashby de la Zouch 0 -1,702 128 724 1,114
Coalville 0 -1,000 75 425 655
Castle Donington 0 -243 18 103 159
Ibstock 0 -142 11 61 93
Kegworth 0 -92 7 39 60
Measham 0 -133 10 57 87
Other 0 -596 45 254 390Total 0 -3,910 293 1,663 2,560
Source: Table 11