North Coast demersal scalefish resource harvest strategy ... · North Coast demersal scalefish...
41
North Coast demersal scalefish resource harvest strategy 2017 – 2021 Version 1.0 Fisheries Management Paper No. 285 November 2017
Transcript of North Coast demersal scalefish resource harvest strategy ... · North Coast demersal scalefish...

North Coast demersal scalefish resource harvest strategy
2017 – 2021 Version 1.0
Fisheries Management Paper No. 285
November 2017

ii Fisheries Management Paper No. 285
Important disclaimer The Chief Executive Officer of the Department of Primary Industries and Regional Development and the State of Western Australia accept no liability whatsoever by reason of negligence or otherwise arising from the use or release of this information or any part of it. Department of Primary Industries and Regional Development Gordon Stephenson House 140 William Street PERTH WA 6000 Telephone: (08) 6551 4444 Website: dpird.wa.gov.au ABN: 18 951 343 745 ISSN: 0819-4327 Copyright © Department of Primary Industries and Regional Development, 2017.
3996/17

Fisheries Management Paper No. 285 iii
TABLE OF CONTENTS LIST OF ACRONYMS ............................................................................................................. V
1 INTRODUCTION ................................................................................................................... 1
1.1 Review Process .................................................................................................................. 1
2 SCOPE ..................................................................................................................................... 1
2.1 Environmental Context ...................................................................................................... 4
2.2 Indicator Species ................................................................................................................ 4
2.3 Other Retained (non-indicator) Species in the Resource ................................................... 5
2.4 Fishing Activities ............................................................................................................... 5
2.4.1 Governance................................................................................................................... 5
2.4.2 Commercial Fishing ..................................................................................................... 6
2.4.3 Recreational Fishing ..................................................................................................... 6
2.4.4 Customary Fishing ....................................................................................................... 7
2.5 Catch-Share Allocations .................................................................................................... 7
3 HARVEST STRATEGY ......................................................................................................... 7
3.1 Long-Term Objectives ....................................................................................................... 8
3.1.1 Ecological Sustainability .............................................................................................. 8
3.1.2 Economic & Social Benefits ........................................................................................ 8
3.2 Operational Objectives ....................................................................................................... 8
3.3 Overview of Management Approach ................................................................................. 9
3.4 Overview of Harvest Strategy Procedures ......................................................................... 9
3.5 Resource Status - Performance Indicators, Reference Levels & Control Rules .............. 11
3.5.1 Identifying Performance Indicators & Reference Levels ........................................... 12
3.5.2 Application of Harvest Control Rules ........................................................................ 13
3.6 Annual Fishery Performance & Annual Tolerance Levels .............................................. 22
3.6.1 Annual Catch Tolerance Levels ................................................................................. 22
3.6.2 Unacceptable Performance Review Timelines .......................................................... 22
3.7 Monitoring and Assessment Procedures .......................................................................... 23
3.7.1 Information and Monitoring ....................................................................................... 23
3.7.2 Assessment Procedures .............................................................................................. 24
3.7.3 Reports and Publications ............................................................................................ 26
4 MANAGEMENT MEASURES AND IMPLEMENTATION .............................................. 26

iv Fisheries Management Paper No. 285
4.1 Implementing Changes to the Management Arrangements ............................................. 28
4.1.1 Consultation ............................................................................................................... 29
4.2 Compliance and Enforcement .......................................................................................... 30
4.2.1 Operational Compliance Plans ................................................................................... 31
5 REFERENCES ...................................................................................................................... 33

Fisheries Management Paper No. 285 v
LIST OF ACRONYMS
AFMA Australian Fisheries Management Authority
ALC Automatic Location Communicator
ARMA Aquatic Resources Management Bill 2016
DPIRD Department of Primary Industries and Regional Development
CAES Catch and Effort Statistics
EBFM Ecosystem Based Fisheries Management
EPBC Act Environment Protection and Biodiversity Conservation Act 1999
ERA Ecological Risk Assessment
ESD Ecologically Sustainable Development
ETP Endangered, Threatened and Protected (species)
FRMA Fish Resources Management Act 1994 FRMR Fish Resources Management Regulations 1995 HCR Harvest Control Rule
ITE Individual Transferable Effort
IFM Integrated Fisheries Management
MLL Minimum Legal Length
MOU Memorandum of Understanding
MSC Marine Stewardship Council
MSY Maximum Sustainable Yield
NDSMF Northern Demersal Scalefish Managed Fishery
OCP Operational Compliance Plan
PFTIMF Pilbara Fish Trawl (Interim) Managed Fishery
PLF Pilbara Line Fishery
PTMF Pilbara Trap Managed Fishery
RFBL Recreational Fishing from Boat Licence
SPR Spawning Potential Ratio
VMS Vessel Monitoring System
WA Western Australia
WAFIC Western Australian Fishing Industry Council

vi Fisheries Management Paper No. 285

Fisheries Management Paper No. 285 1
1 INTRODUCTION
Harvest strategies for aquatic resources managed by the Western Australian Department of Primary Industries and Regional Development (DPIRD) Fisheries Division (Fisheries) are formal documents that are prepared based on a formal policy (Department of Fisheries 2015a) to support decision-making processes and ensure these processes are consistent with the principles of Ecologically Sustainable Development (ESD; Fletcher 2002) and Ecosystem Based Fisheries Management (EBFM; Fletcher et al. 2010). The objectives of ESD are reflected in the objects of the Fish Resources Management Act 1994 (FRMA), Section 3, and the Aquatic Resources Management Act 2016 (ARMA), Clause 9, which will replace the FRMA once enacted.
The publication of these strategies is intended to make the decision-making considerations and processes for the management of specified aquatic resources publicly transparent and provide a basis for informed dialogue on management actions with resource users and other stakeholders (Department of Fisheries 2015a).
These strategies provide guidance for decision-makers, but do not derogate from or limit the exercise of discretion required for independent decision-making under the FRMA by either the Minister for Fisheries, the Director General of DPIRD (as Chief Executive Officer) or other delegated decision-makers in order to meet the objects of the FRMA.
Harvest strategies make explicit the objectives, performance indicators, reference levels and harvest control rules for each defined ecological asset taken into consideration by Fisheries when preparing advice for the Minister for Fisheries (Department of Fisheries 2015a). They also indicate the scope of management actions required in relation to the status of each resource in order to meet the specific long- and short-term management objectives and the broader goals of ESD and EBFM. Finally, they specifically outline the expected performance of the fisheries that access each resource.
1.1 Review Process
The Western Australian harvest strategy policy (Department of Fisheries 2015a) recognises that fisheries change over time and that a review period should be built into each harvest strategy to ensure that it remains relevant. This harvest strategy will remain in place for a period of five (5) years, after which time it will be fully reviewed; however, given that this is the first harvest strategy for this resource, this document may be subject to review and amended as appropriate within this five year period.
2 SCOPE
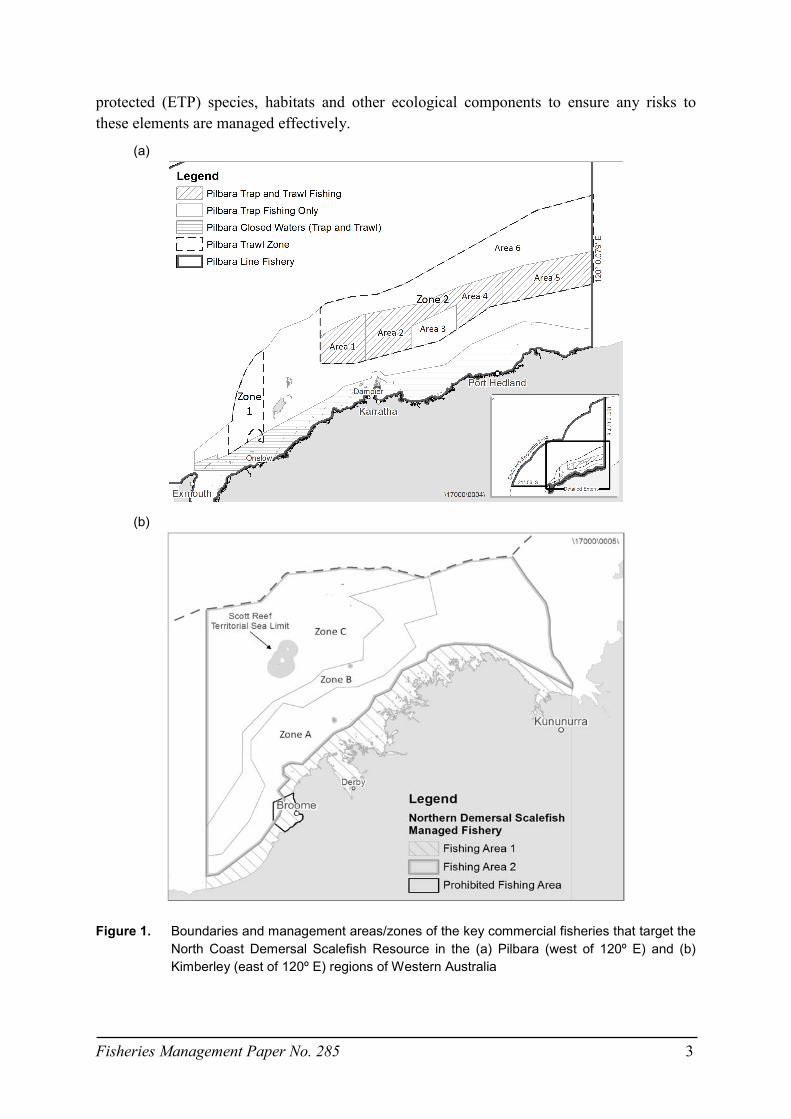
This harvest strategy relates to the North Coast Demersal Scalefish Resource of Western Australia and the fishing activities that impact this resource. The overall resource comprises approximately 60 demersal scalefish species that inhabit the tropical waters of the North Coast Bioregion. Based on the stock units considered for management, the resource is separated into two main areas; the Pilbara and the Kimberley (west and east of 120º E,

2 Fisheries Management Paper No. 285
respectively, see Figure 1). The species are targeted, to varying degrees, by a number of commercial, recreational (including charter) and customary fisheries that operate within these regions. In the Pilbara, the key commercial fisheries that target the resource include the Pilbara Trap Managed Fishery (PTMF), the Pilbara Fish Trawl (Interim) Managed Fishery (PFTIMF) and the Pilbara Line Fishery (PLF). The main commercial fishery in the Kimberley that targets the resource is the Northern Demersal Scalefish Managed Fishery (NDSMF), which primarily operates using traps but also permits line fishing.
Monitoring and assessment of the demersal scalefish resource in the Pilbara and Kimberley is based on identification and sustainability evaluation of indicator species for each region (Department of Fisheries 2011). Indicator species are determined using a risk-based approach that calculates the ‘sustainability risk’ of the stocks (based on the inherent vulnerability and the current risk to the wild stock) and the current or likely future ‘management risk’ of the species / stock to the community (measured as a combination of the current management information requirements, and their economic and social values). The status of these fished stocks is subsequently used as a robust indicator of the sustainability status and risks within the suite of inshore demersal scalefish exploited in that region. In accordance with this approach, the focus of this harvest strategy is on the target stocks of the three indicator species for the Pilbara region — red emperor, bluespotted emperor, and Rankin cod — and the two indicator species for the Kimberley region — red emperor and goldband snapper. Periodic assessments of selected non-indicator species are also undertaken to validate the indicator species approach and ensure that the status of other retained species remains at acceptable levels.
This harvest strategy has been developed in line with Fisheries’ over-arching Harvest Strategy Policy for Aquatic Resources (Department of Fisheries 2015a) which is consistent with relevant national policies / strategies (ESD Steering Committee 1992), guidelines (e.g. Sloan et al. 2014) and international best practice (Fletcher et al. 2016). It also sets out and summarises matters relevant to independent third-party certification assessment of the PTMF and NDSMF against the Marine Stewardship Council (MSC) standard for sustainable fishing and should be read in conjunction with other documentation relevant to this assessment.
The use of indicator species as the basis for developing harvest strategies of an entire resource has facilitated the successful management of multi-species fisheries in WA including the West Coast Demersal Scalefish Resource for over a decade (e.g. Wise et al., 2007). The precautionary element of this approach means that the status of only one indicator species needs to breach a threshold or limit level reference for the entire suite of species covered by that indicator species to be deemed to have breached this level. Therefore, to enable recovery of an overfished species often requires an overall reduction in fishing intensity across the entire resource.
In in addition to considering fishing impacts from all fishing activities on the retained species, this harvest strategy also covers impacts on bycatch1, endangered, threatened and
1 Bycatch is described as the part of the catch which is returned to the sea (usually referred to as non-retained or discarded) either because it has no commercial value or because legislative requirements preclude it being retained.
Fisheries Management Paper No. 285 3
protected (ETP) species, habitats and other ecological components to ensure any risks to these elements are managed effectively.
(a)
(b)
Figure 1. Boundaries and management areas/zones of the key commercial fisheries that target the North Coast Demersal Scalefish Resource in the (a) Pilbara (west of 120º E) and (b) Kimberley (east of 120º E) regions of Western Australia

4 Fisheries Management Paper No. 285
As the MSC assessment of the two trap fisheries (PTMF and NDSMF) has been a key driver in formalising this initial version of the harvest strategy, impacts on the ecological components other than the retained species from non-trap fisheries, namely the PFTIMF, the PLF and Area 1 of the NDSMF (where only line fishing is permitted), are not within the scope of this document. It is anticipated that future versions may be expanded to include these impacts where relevant.
This document has been developed via a consultative process with industry members and has been approved by Fisheries and the Minister for Fisheries.
2.1 Environmental Context
The North Coast Demersal Scalefish Resource includes species that inhabit inshore shelf waters (20-250 m depth) and offshore waters (greater than 250 m depth) in the North Coast Bioregion of Western Australia, which extends from just south of Onslow (114° 50’ E) to the Northern Territory border. This bioregion has a unique combination of features that distinguish it from other marine regions around Australia, including the wide continental shelf, very high tidal regimes, high cyclone frequency, unique current systems, warm oligotrophic surface waters and unique geomorphological features (Brewer et al. 2007).
The North Coast Bioregion exhibits monsoonal climatic patterns, with a pronounced cyclone season between December and March. During this time, the northern Kimberley region experiences a wet season with large influxes of run-off, and the Pilbara is subject to sporadic and intense storms. Ocean temperatures range between 22° C and 33° C, with localised higher temperatures in coastal waters, particularly along the Pilbara coastline (Fletcher and Santoro 2015).
2.2 Indicator Species
The four indicator species selected for assessing the suite of demersal scalefish in the Pilbara and Kimberley are two species of tropical snapper (family Lutjanidae), one species of emperor (family Lethrinidae), and one species of cod (family Epinephelidae) (Table 1). Species from these three families comprise the majority of the catch numerically and by weight of the approximately 60 species that make up the resource.
The indicator species have been identified as having a high combined sustainability and management risk score and are thus vulnerable to fishing and possess a high value to both fishers and the community. These indicator species include two relatively long-lived and slow-growing species, red emperor and goldband snapper, and two moderately long-lived and faster-growing species, Rankin cod and bluespotted emperor. Rankin cod is a protogynous hermaphrodite, with individuals first maturing as females and subsequently changing sex to males. Despite the life history characteristics of bluespotted emperor inferring relatively high population productivity, it has a limited geographic range that is endemic to north-western Australia with the majority of its abundance centred in the western Pilbara. All indicator species exhibit limited adult movement and stocks are consequently assessed and managed separately in the Pilbara and Kimberley.

Fisheries Management Paper No. 285 5
Table 1. Indicator species for the North Coast Demersal Scalefish Resource
Region Species Family
Pilbara / Kimberley Red emperor (Lutjanus sebae) Lutjanidae
Pilbara Rankin cod (Epinephelus multinotatus) Epinephelidae
Pilbara Bluespotted emperor (Lethrinus punctulatus) Lethrinidae
Kimberley Goldband snapper (Pristipomoides multidens) Lutjanidae
2.3 Other Retained (non-indicator) Species in the Resource
For other retained species, annual risk (including vulnerability) assessments are undertaken to identify if there have been any substantial changes, particularly in the catches of these species, relative to historical levels. If an increase in risk is identified, a review is triggered to investigate the reasons for the variation. If the increase in risk is considered significant a higher level of monitoring and assessment of the species is necessary (e.g. collection of an age sample to allow for estimation of fishing mortality and/or some other proxy for biomass of the stock).
2.4 Fishing Activities
2.4.1 Governance
The North Coast Demersal Scalefish Resource is targeted by commercial, recreational (including charter) and customary fishing sectors. These fishing sectors are managed by Fisheries under the following legislation:
• Fish Resources Management Act 1994 (FRMA, will be replaced by the ARMA once enacted);
• Fish Resources Management Regulations 1995 (FRMR);
• FRMA Part 6 — Pilbara Trap Managed Fishery Management Plan 1992, Pilbara Fish Trawl (Interim) Managed Fishery Management Plan 1997 and Northern Demersal Scalefish Managed Fishery Management Plan 2000; and
• FRMA Section 43 Order — Prohibition on Commercial Fishing for Demersal Scalefish (Pilbara Area) Order 1997, Prohibition on Fishing by Line from Fishing Boats (Pilbara Waters) Order 2006 and Notice Prohibition on Line Fishing (Metal in Lines and Traces) Order 2008.
Fishers must also comply with the requirements of (but not limited to):
• The Commonwealth Environment Protection and Biodiversity Conservation Act 1999 (EPBC Act);
• Marine Safety (Domestic Commercial Vessel) National Law Act 2012;
• Western Australian Marine Act 1982;

6 Fisheries Management Paper No. 285
• Western Australian Wildlife Conservation Act 1950; and
• Western Australian Conservation and Land Management Act 1984.
2.4.2 Commercial Fishing
Demersal scalefish species in north-western Australian shelf waters were initially targeted by foreign fish trawl fleets operating in the Pilbara and Kimberley during the 1970s and 1980s, with catches peaking at more than 20,000 t (Moran et al. 1988; Nowara and Newman 2001). Foreign fishing ceased in these waters in 1990, with more recent domestic catches of demersal scalefish species much lower, peaking in 1996 at over 4,000 tonnes.
In the Pilbara, the three commercial fisheries that currently land the majority of demersal scalefish catches include the PFTIMF, the PTMF and the PLF. Collectively, these fisheries are primarily managed through input controls, including effort (time) allocations, gear restrictions and spatial closures. Minimum legal lengths (MLLs) are also in place for some fish species. The two full-time vessels currently operating in the PFTIMF land the largest component of the demersal scalefish catch in the Pilbara (and North Coast Bioregion), which has averaged ~1,200 tonnes for the past five years. In comparison, annual demersal scalefish catches by the PTMF have remained around 400 tonnes since the early 2000s, and those by the PLF have ranged between 40 and 260 tonnes during this same period.
In the Kimberley, while commercial operators in the NDSMF are permitted to fish using handlines, droplines and fish traps, since 2002 it has essentially been a trap-based fishery. Effort (time) allocations and spatial zones are the primary management measures in the NDSMF. Annual demersal scalefish catches by this fishery have remained relatively stable at ~1,000-1,200 tonnes since 2008.
Negligible catches of the suite of demersal scalefish can be retained by other commercial fisheries that operate in the shallower nearshore waters of north-western Australia, including a nearshore gillnet fishery, prawn trawl fisheries, and a trolling fishery for pelagic finfish. There is little overlap in the catch from these fisheries and those described above.
2.4.3 Recreational Fishing
Recreational (and charter) fishing activities on this resource are mostly line-based fishing from boats. Fishing effort is concentrated in nearshore areas around key population centres (e.g. Dampier, Karratha, Port Hedland and Broome), however, a number of charter operators in the region offer fishing expeditions to offshore islands and reefs such as the Montebello Islands and the Rowley Shoals. The peak in recreational fishing activity occurs during the dry season (April-October).
The most recent state-wide survey of boat-based recreational fishing in Western Australia (Ryan et al. 2015) reported an estimated catch of 48-68 tonnes for the ten most common demersal species in the North Coast Bioregion in 2013/14. However, there is very little overlap in the spatial distribution of fishing effort between recreational and commercial fishers targeting demersal scalefish, as the latter operates in deeper and more offshore waters.

Fisheries Management Paper No. 285 7
The reported charter catches of demersal scalefish in the Pilbara region was estimated to be 18.7 t and in the Kimberley region was estimated to be 11.5 t in 2014 (Newman et al. in prep.).
2.4.4 Customary Fishing
Traditional exploitation of the demersal scalefish resource in the North Coast Bioregion is mainly limited to the shallower nearshore areas of the Kimberley region in proximity to major population centres (i.e. Broome, Derby, Wyndham and Kununurra) and the approximately 20 Aboriginal communities distributed along this part of the coastline. Although there is no quantitative information available on the customary catch of demersal scalefish in this region, there are currently no concerns regarding the quantity taken or method of capture by traditional users.
The only available estimates of indigenous catches of demersal scalefish in northern Western Australia are from the 2000/01 National Recreational and Indigenous Fishing Survey (Henry and Lyle 2000), with small catches of emperors, tropical snappers, cods and gropers recorded (~ 30,000 harvested fish).
2.5 Catch-Share Allocations
The North Coast Demersal Scalefish Resource in Western Australia is fished by commercial, recreational and customary sectors without any explicit catch share allocation between sectors. A formal sectoral allocation process (designated as Integrated Fisheries Management, IFM, in Western Australia) to define and assign long-term sectoral shares of the permitted catch of the resource has not yet been undertaken (Department of Fisheries 2009).
3 HARVEST STRATEGY
This harvest strategy is structured to describe, hierarchically:
1) the high-level, long-term objectives of management (Section 3.1);
2) the short-term, operational objectives (Section 3.2); and
3) how these translate into the management approach used for this fishery (Section 3.3).
This is followed by a more detailed description of:
4) the harvest strategy procedures (Section 3.4);
5) the processes for managing stock status (Section 3.5);
6) fishery performance (Section 3.6); and
7) the specific monitoring and assessment procedures used to ascertain if objectives are
being met (Section 3.7).

8 Fisheries Management Paper No. 285
3.1 Long-Term Objectives
In addition to ensuring the biological sustainability of all captured aquatic resources (through the use of the indicator species approach), this harvest strategy includes broader ecological objectives for each ecosystem component relevant to the trap fisheries currently undergoing MSC full assessment, as well as social and economic objectives for each fishing sector as a whole. It is important to note that the social and economic objectives are applied within the context of ESD.
3.1.1 Ecological Sustainability
1) To maintain spawning stock biomass of each retained species above BMSY to maintain high productivity and ensure the main factor affecting recruitment is the environment;
2) To ensure fishing impacts do not result in serious or irreversible harm2 to bycatch species populations;
3) To ensure fishing impacts do not result in serious or irreversible harm to endangered, threatened and protected (ETP) species populations;
4) To ensure the effects of fishing do not result in serious or irreversible harm to habitat structure and function; and
5) To ensure the effects of fishing do not result in serious or irreversible harm to ecosystem structure and function.
3.1.2 Economic & Social Benefits
1) To provide flexible opportunities to ensure fishers can maintain or enhance their livelihood, within the constraints of ecological sustainability; and
2) To provide fishing participants with reasonable opportunities to maximise cultural, recreational and lifestyle benefits of fishing, within the constraints of ecological sustainability.
3.2 Operational Objectives
Long-term management objectives are typically operationalised as short-term (e.g. annual or periodic) fishery-specific objectives through one or more performance indicators that can be measured and assessed against pre-defined reference levels so as to ascertain actual performance. Thus, within the context of the long-term objectives provided above, each fishery (commercial and recreational) has operational objectives to maintain each resource / component above the threshold level (and, where relevant, close to the target range or level), or rebuild the resource if it has fallen below the threshold or the limit levels.
2 Serious or irreversible harm relates to a change caused by the fishery that fundamentally alters the capacity of the component to maintain its function or to recover from the impact.

Fisheries Management Paper No. 285 9
3.3 Overview of Management Approach
Management of the North Coast Demersal Scalefish Resource in Western Australia is based on a constant exploitation approach, where the annual catch varies in proportion to variations in stock abundance.
In line with this management approach, the main commercial fisheries that target this resource are managed primarily using input controls in the form of limited entry, gear restrictions and spatial and temporal closures. In the PFTIMF, PTMF and NDSMF, annual fishing effort is controlled through Individual Transferable Effort (ITE) unit entitlements, monitored by a satellite-based vessel monitoring system (VMS). The effort capacity in the NDSMF is set annually for each of the three zones of the fishery to achieve a notional target total allowable catch. The nine licensees that comprise the PLF are excepted from a line-fishing prohibition order for a specified five-month block period within a year. All commercial fishers must also comply with the MLLs in place for some fish species.
Recreational and charter fishing for demersal scalefish in the North Coast Bioregion is managed using a mix of input and output controls, including bag limits, possession limits and MLLs. Recreational fishers operating from a boat are required to hold a current Recreational Fishing from Boat Licence (RFBL). Unlicensed fishers on boats can fish if at least one other person on board has an RFBL, provided the total catch of everyone on board stays within the bag limits of the licenced fisher(s). Charter operators are required to hold a Fishing Tour Operators Licence.
The decision-making process required to ensure the objectives are being met is framed around a series of linked procedures within the operational part of this harvest strategy.
3.4 Overview of Harvest Strategy Procedures
The procedures used within this harvest strategy involve two interrelated decision-making processes (see Figure 2 and Figure 3). The first is the formal resource-level review process that, for the North Coast Demersal Scalefish Resource, will be undertaken every 3 - 5 years. This assesses the current status of the resource against defined (target, threshold and limit) reference levels to determine the risks associated with each operational objective and therefore whether the current Harvest Control Rules (HCRs) and their associated management arrangements are still appropriate. If the status falls outside the target reference level/range, HCRs are triggered and management adjustments/measures implemented to return the resource status back to the target range.
The second process involves an annual, fishery-level review. This determines whether the current catch/effort by each of the relevant sectors is consistent with the levels defined (or expected) by the current HCRs and the status of the resource (i.e. the resource-level review process). If the annual catch, effort and/or catch rate for one or more species/sectors falls outside of an annual tolerance range and cannot be adequately explained the performance is termed ‘Unacceptable’. This result would generate a review that may lead to management adjustments, or the need for a re-assessment of the resource status and determine whether the

10 Fisheries Management Paper No. 285
current HCRs and their associated management arrangements are still appropriate. These are described in detail in the following sections.
Figure 2. Decision tree for regular review of resource status (Source: Department of Fisheries
2015a). ‘New arrangements' can include any activity associated with management process. * Not all operational objectives have target levels. ** The primary sustainability objective must be met.

Fisheries Management Paper No. 285 11
Figure 3. Decision tree for regular review of fishery status –based on allowable catch/effort
tolerance levels and any sectoral allocation decisions (Source: Department of Fisheries 2015a)
3.5 Resource Status - Performance Indicators, Reference Levels & Control Rules
To determine the resource status for demersal scalefish in the North Coast Bioregion, suitable indicators have been selected to describe performance in relation to each management objective, with a set of reference levels established to separate acceptable from unacceptable performance. Where relevant, these levels include:
• A target level or range (i.e. where you want the indicator to be);
• A threshold level at BMSY (i.e. you review your position); and
• A limit level (i.e. where you do not want the indicator to be and below which there is a significantly increased risk of recruitment impairment).
Based on where the indicators sit in relation to each of their performance levels, control rules define what specific management actions should occur.

12 Fisheries Management Paper No. 285
3.5.1 Identifying Performance Indicators & Reference Levels
3.5.1.1 Retained species (Indicator Species & Monitored Non-Indicator Species)
The primary performance indicator used to evaluate the stock status of indicator species and non-indicator species in the North Coast Bioregion is spawning biomass (B) or an appropriate proxy (see Table 2). For each stock, the performance indicator is estimated periodically (at least every 5 years) and compared to associated reference levels (BTarget, BThreshold and BLimit) that are consistent with those used by Fisheries in other similar assessments and are based on internationally accepted benchmarks for moderate to long-lived fish species (Caddy and Mahon 1995; Gabriel and Mace 1999; Mace 2001; Wise et al. 2007).
The life history characteristics for the indicator species for this fishery are commensurate with a steepness (of the stock recruitment relationship) of around 0.75. Preliminary investigations into the relationship between virgin biomass (B0) and BMSY for stocks with a range of steepness values around this level (0.6 to 1.0) indicates BMSY is likely to be close to B30 (30% of unfished biomass) (N. Hall, unpublished). Accordingly, the B30 threshold level used for this fishery corresponds to BMSY. By extension the B40 target and B20 limit levels correspond to 1.33BMSY and 0.67 BMSY, respectively, levels that are somewhat more conservative than the target and limit of 1.2 BMSY and 0.5 BMSY, respectively, suggested in the Fisheries’ Harvest Strategy Policy.
In line with the ecological objectives of this harvest strategy, the reference levels and control rules act to maintain stocks of all retained species above BMSY, with management action triggered should they drop below this level. Any stock size above the B30 threshold is therefore consistent with meeting the objectives for biological sustainability. Maintaining the stock at or above the B30 threshold is also sufficient to meet the stock status requirements as defined for purposes of certification under the Marine Stewardship Council’s standard for sustainability. Note that while being above the BMSY threshold meets the objectives of this harvest strategy, setting a specific target level for this fishery (i.e. one that is > BMSY) is not feasible due to natural variability in the sizes of fish populations. Rather, a target range has been set between B30 and B40. Within this range there would generally be no need to adjust management settings. However, if stock size exceeds B40 then there may be a need to review management settings to ensure other objectives are being met.
For the non-indicator species, additional risk-based reference levels have also been set to differentiate acceptable fishery impacts from unacceptable fishery impacts (see below).

Fisheries Management Paper No. 285 13
Table 2. Performance indicators and associated reference levels used to evaluate the status of indicator species and non-indicator species in the North Coast Bioregion. The threshold level is based on achieving BMSY.
Performance Indicator
Reference Levels
Target
Threshold (BMSY)
Limit
Spawning biomass (B) B40 B30 B20
Spawning potential ratio (SPR) SPR40 SPR30 SPR20
3.5.1.2 Risk Assessments
Other ecological assets incorporated in this harvest strategy include bycatch and ETP species, habitats and ecosystem processes. As explained in Section 2, only impacts of trap fishing on these ecological components are currently assessed within this harvest strategy. Reference levels used to monitor the performance of the PTMF and NDSMF against management objectives relating to these assets have been set to differentiate acceptable fishery impacts from unacceptable fishery impacts according to the risk levels defined in Fletcher (2012, 2015).
3.5.1.3 Economic & Social Benefits
In line with the principles of ESD, this harvest strategy also includes objectives for the economic and social benefits of fishing. These objectives relate to the provision of opportunities to ensure (1) commercial fishers can maintain / enhance their livelihood and (2) that all fishers can maximise cultural, recreational and / or lifestyle benefits of fishing. It is important to note that management actions relating to these objectives are applied within the constraints of ecological sustainability and while having regards to the objectives of other sectors.
The economic and social objectives do not currently have explicit performance measures within this harvest strategy. Rather, it is through formal consultation processes that regulatory impediments to maintaining or enhancing economic return, and maximising social benefits of fishing, are discussed. Where possible, and in due consideration of ecological sustainability, fisheries management arrangements can be adjusted or reformed to help meet these objectives.
Once suitable and measurable indicators for monitoring performance against the economic and social objectives have been identified, these will be included in future revisions of this harvest strategy.
3.5.2 Application of Harvest Control Rules
For each performance indicator and reference level there needs to be accompanying guidance that leads to management decisions and actions. Harvest Control Rules (HCRs) are the key part of the harvest strategy for directing what management decisions need to be made

14 Fisheries Management Paper No. 285
regarding meeting sustainability objectives. Due to the inherent complexities of fisheries management HCRs need to strike an appropriate balance. The HCRs cannot be overly explicit as this could hinder effective management; neither can they be overly vague, which could put the decision-making process at risk. When a threshold or limit reference level is breached, management responses are likely to vary depending on the extent and circumstances related to the variation. A review of management arrangements is triggered if evaluation against the operational objectives indicates the potential need for a management response (i.e. when the threshold level is breached). This allows for a precautionary approach to management, with potential issues recognised and addressed in a timely manner prior to the following fishing season. Examples of potential management responses for the commercial fishery include, setting a new capacity for the fishery, or restricting effort spatially or temporally (such as a seasonal closure); or additional gear restrictions. Examples for the recreational fishery may include reducing bag or boat limits, or introducing spatial or temporal closures. The ability to, and timeframe for, implementing these changes depends on the legal instrument under which the management measure occurs. Further information on the management measures in place for these fisheries is provided in Section 4.
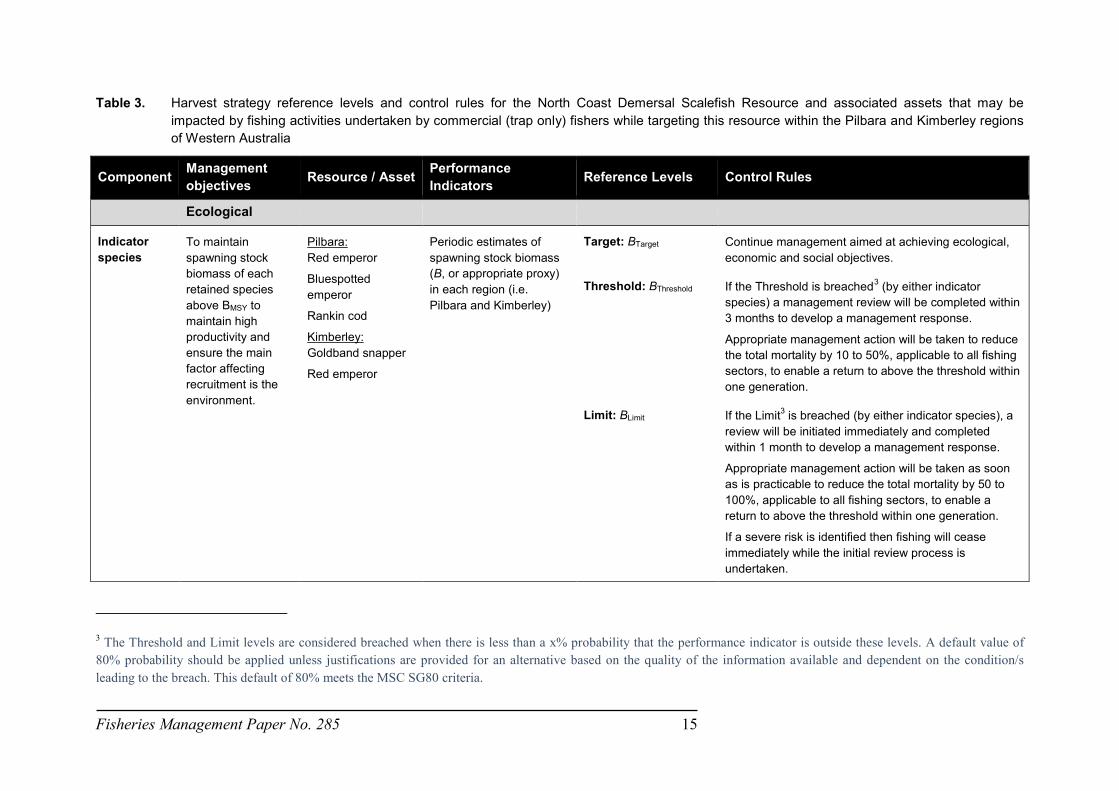
The management objectives, performance indicators, reference levels and control rules for the resource is provided in Table 3. Figure 4 (a-d) graphically illustrates how these rules are intended to apply to the indicator species.
Fisheries Management Paper No. 285 15
Table 3. Harvest strategy reference levels and control rules for the North Coast Demersal Scalefish Resource and associated assets that may be impacted by fishing activities undertaken by commercial (trap only) fishers while targeting this resource within the Pilbara and Kimberley regions of Western Australia
Component Management objectives Resource / Asset Performance
Indicators Reference Levels Control Rules
Ecological
Indicator species
To maintain spawning stock biomass of each retained species above BMSY to maintain high productivity and ensure the main factor affecting recruitment is the environment.
Pilbara: Red emperor
Bluespotted emperor
Rankin cod
Kimberley: Goldband snapper
Red emperor
Periodic estimates of spawning stock biomass (B, or appropriate proxy) in each region (i.e. Pilbara and Kimberley)
Target: BTarget Continue management aimed at achieving ecological, economic and social objectives.
Threshold: BThreshold If the Threshold is breached3 (by either indicator species) a management review will be completed within 3 months to develop a management response.
Appropriate management action will be taken to reduce the total mortality by 10 to 50%, applicable to all fishing sectors, to enable a return to above the threshold within one generation.
Limit: BLimit If the Limit3 is breached (by either indicator species), a review will be initiated immediately and completed within 1 month to develop a management response.
Appropriate management action will be taken as soon as is practicable to reduce the total mortality by 50 to 100%, applicable to all fishing sectors, to enable a return to above the threshold within one generation.
If a severe risk is identified then fishing will cease immediately while the initial review process is undertaken.
3 The Threshold and Limit levels are considered breached when there is less than a x% probability that the performance indicator is outside these levels. A default value of 80% probability should be applied unless justifications are provided for an alternative based on the quality of the information available and dependent on the condition/s leading to the breach. This default of 80% meets the MSC SG80 criteria.

16 Fisheries Management Paper No. 285
Component Management objectives Resource / Asset Performance
Indicators Reference Levels Control Rules
Retained non-indicator species
To maintain spawning stock biomass of each retained species above BMSY to maintain high productivity and ensure the main factor affecting recruitment is the environment.
Non-indicator species (additional monitoring may be periodically undertaken to facilitate an age-based assessment)
1. Annual risk (vulnerability) assessments incorporating current management arrangements, catch levels, species information and available research
2. Estimate of spawning stock biomass (B, or appropriate proxy) if risk is >moderate
Target: BTarget; and
Fishing impacts expected to generate an acceptable risk level, e.g. moderate risk or lower.
Continue management aimed at achieving ecological, eco objectives.
Threshold: BThreshold; and
Fishing impacts are considered to generate an undesirable level of risk to any species’ populations, i.e. high risk.
If the Threshold is breached a management review will be completed within 3 months to develop a management response.
Appropriate management action will be taken to reduce the total mortality by 10 to 50%, applicable to all fishing sectors, to enable a return to above the threshold within one generation.
Limit: BLimit; and
Fishing impacts are considered to generate an unacceptable level of risk to any species’ populations, i.e. severe risk.
If the Limit is breached, a review will be initiated immediately and completed within 1 month to develop a management response.
Appropriate management action will be taken as soon as is practicable to reduce the total mortality by 50 to 100%, applicable to all fishing sectors, to enable a return to above the threshold within one generation.
If a severe risk is identified then fishing will cease immediately while the initial review process is undertaken.

Fisheries Management Paper No. 285 17
Component Management objectives Resource / Asset Performance
Indicators Reference Levels Control Rules
Bycatch (discarded, non- Endangered, threatened and protected species)
To ensure fishing impacts do not result in serious or irreversible harm to bycatch species populations.
All bycatch species4 Periodic risk assessments incorporating current management arrangements, catch levels, species information and available research
Target: Fishing impacts expected to generate an acceptable risk level to bycatch species’ populations, e.g. moderate risk or lower.
Continue management aimed at achieving ecological, economic and social objectives.
Threshold: Fishing impacts are considered to generate an undesirable level of risk to any bycatch species’ populations, i.e. high risk.
A review is completed within three months to investigate the options to reduce the risk. Appropriate management action will be taken to reduce risk to an acceptable level before the next season.
Limit: Fishing impacts are considered to generate an unacceptable level of risk to any bycatch species’ populations, i.e. severe risk.
A review is completed within one month to investigate the options to reduce the risk. Appropriate management action will be undertaken to reduce the risk to an acceptable level as soon as is practicable.
4 Note that only the impacts of trap fishing on ecological assets other than the retained species are currently assessed within this harvest strategy (see Section 2).

18 Fisheries Management Paper No. 285
Component Management objectives Resource / Asset Performance
Indicators Reference Levels Control Rules
Endangered, threatened and protected (ETP) species
To ensure fishing impacts do not result in serious or irreversible harm to endangered, threatened and protected (ETP) species populations.
All ETP species5 Periodic risk assessments incorporating current management arrangements, number of reported interactions, species information and available research
Target: Fishing impacts expected to generate an acceptable risk level to ETP species’ populations, i.e. moderate risk or lower.
Continue management aimed at achieving ecological, economic and social objectives.
Threshold: Fishing impacts are considered to generate an undesirable level of risk to any ETP species’ populations, i.e. high risk.
A review is completed within three months to investigate the options to reduce the risk. Appropriate management action will be taken to reduce risk to an acceptable level before the next season.
Limit: Fishing impacts are considered to generate an unacceptable level of risk to any ETP species’ populations, i.e. severe risk.
A review is completed within one month to investigate the options to reduce the risk. Appropriate management action will be undertaken to reduce the risk to an acceptable level as soon as is practicable.
5 Note that only the impacts of trap fishing on ecological assets other than the retained species are currently assessed within this harvest strategy (see Section 2).

Fisheries Management Paper No. 285 19
Component Management objectives Resource / Asset Performance
Indicators Reference Levels Control Rules
Habitats To ensure the effects of fishing do not result in serious or irreversible harm to habitat structure and function
All habitats6 Periodic risk assessments incorporating current management arrangements, extent of fishing activities, habitat distribution and available research.
Target: Fishing impacts are considered to generate an acceptable level of risk to all benthic habitats, i.e. moderate risk or lower.
Continue management aimed at achieving ecological, economic and social objectives.
Threshold: Fishing impacts are considered to generate an undesirable level of risk to any benthic habitats, i.e. high risk.
A review is completed within three months to investigate the options to reduce the risk. Appropriate management action will be taken to reduce risk to an acceptable level before the next season.
Limit: Fishing impacts are considered to generate an unacceptable level of risk to any benthic habitats, i.e. severe risk.
A review is completed within one month to investigate the options to reduce the risk. Appropriate management action will be undertaken to reduce the risk to an acceptable level as soon as is practicable.
6 Note that only the impacts of trap fishing on ecological assets other than the retained species are currently assessed within this harvest strategy (see Section 2).

20 Fisheries Management Paper No. 285
Component Management objectives Resource / Asset Performance Indicators Reference Levels Control Rules
Ecosystem To ensure the effects of fishing do not result in serious or irreversible harm to ecological processes
Trophic interactions7
Periodic risk assessments incorporating current management arrangements, catch levels, extent of fishing activities, ecosystem information and available research.
Target: Fishing impacts are considered to generate an acceptable level of risk to ecological processes within the ecosystem, i.e. moderate risk or lower.
Continue management aimed at achieving ecological, economic and social objectives.
Threshold: Fishing impacts are considered to generate an undesirable level of risk to any ecological processes within the ecosystem, i.e. high risk.
A review is completed within three months to investigate the options to reduce the risk. Appropriate management action will be taken to reduce risk to an acceptable level before the next season.
Limit: Fishing impacts are considered to generate an unacceptable level of risk to any ecological processes within the ecosystem, i.e. severe risk.
A review is completed within one month to investigate the options to reduce the risk. Appropriate management action will be undertaken to reduce the risk to an acceptable level as soon as is practicable.
7 Note that only the impacts of trap fishing on ecological assets other than the retained species are currently assessed within this harvest strategy (see Section 2).

Fisheries Management Paper No. 285 21
Figure 4. Graphical illustration of harvest control rules for indicator species under hypothetical
biomass trajectories:
a) Spawning biomass fluctuating above Target range. Ecological objective met, Target level exceeded. An increase in catch may be considered.
b) Spawning biomass fluctuating between Threshold and Target. Ecological objective met, continue management to maintain biomass above Threshold.
c) Spawning biomass below Threshold. Ecological objective not met, reduce fishing mortality by an agreed level (in the range of 10-50%) to rebuild spawning biomass to above Threshold within one generation.
d) Spawning biomass below Limit. Ecological objective not met, reduce fishing mortality by an agreed level (50-100%) to rebuild spawning biomass to above Threshold within one generation.
B40
B30
B20
B40
B30
B20
B40
B30
B20
B40
B30
B20
A
Spa
wni
ng B
iom
ass
Time
B
C D
Biomass Target
Threshold (BMSY) Limit

22 Fisheries Management Paper No. 285
3.6 Annual Fishery Performance & Annual Tolerance Levels
Defining annual tolerance levels provides a formal but efficient basis to annually evaluate the effectiveness of current management arrangements in delivering the levels of catch (or effort for quota-managed fisheries), specified by harvest control rules and where relevant, any sectoral allocation decisions (Fletcher et al. 2016). If the annual catch and effort remains within the ‘tolerance range’ (based on historical variations in recruitment and/or fishing operations) the fishery is considered to be operating ‘acceptably’ with no need to review the management settings. Where the annual catch or effort falls outside of this range and this cannot be adequately explained (e.g. clear environmental or market induced impacts), this will result in a review of the risks which may lead to management settings, adjustments, further review of the cause and potentially a revision of the tolerance levels.
3.6.1 Annual Catch Tolerance Levels
For the North Coast Demersal Scalefish Resource, the current catch tolerance ranges used to assess annual fishery performance based on the current stock status and control rules have been calculated from each fishery’s maximum and minimum catches between 2008 and 2015 including an additional 10% (of minimum catch) to generate the tolerance range (Table 3). If the status of the resource changes such that the control rules trigger additional management adjustments, the tolerance range for each of these fisheries must also be adjusted accordingly.
Table 4. Annual catch tolerance ranges (in tonnes, t) for each of the State-managed commercial fisheries that target the North Coast Demersal Scalefish Resource
Fishery Catch tolerance range
PFTIMF 940 – 1416 t
PTMF 241 – 537 t
PLF 36 – 127 t
NDSMF 903 – 1332 t
3.6.2 Unacceptable Performance Review Timelines
The catch and catch rate tolerance levels are reviewed annually and published in the Status report of the Fisheries and Aquatic Resources of Western Australia : the State of the Fisheries and Aquatic Resource Report and DPIRD’s Annual report to the WA Parliament (see Section 3.7.3). Where one or more unacceptable performance levels have been identified, a review is completed within a time period relevant to the level of risk:
1) If there is a low likelihood that the resource is below the limit (and therefore possibly below the threshold) then a management review is completed within 6 months and outcomes implemented as soon as is practicable.

Fisheries Management Paper No. 285 23
2) If there is a moderate likelihood that the resource is below the limit (and therefore likely to be below the threshold) then a management review is completed within 3 months and outcomes implemented as soon as is practicable.
3) If there is a high likelihood that the resource is below the limit then all fishing should cease while the management review is undertaken.
3.7 Monitoring and Assessment Procedures
3.7.1 Information and Monitoring
3.7.1.1 Commercial Catch and Effort Information
Information on fishing effort (e.g. days fished, numbers of traps used, hours trawled etc.) and retained species catches (kg) by the commercial fisheries in the Pilbara and Kimberley regions is available from monthly catch and effort returns, daily logbooks, processor unloads, and historical estimates of foreign fishing fleet catches. The statutory reporting requirements have changed through time and differ between the different fisheries targeting demersal scalefish, with a generic return for all fisheries in Western Australia currently in development. Although early catches were often reported by fishers as groups of species, the majority of catches are now recorded at the species level where possible.
VMS was introduced in the PFTIMF and the NDSMF in 1998, and in the PTMF in 2000, to monitor effort levels and ensure compliance with management arrangements (see Section 4.2.1.2).
The available catch and effort data are used to calculate catch rates that are used together with the estimated total catches of indicator species as inputs into their stock assessments (see below).
3.7.1.2 Recreational Catch and Effort Information
Estimates of recreational fishing effort and demersal scalefish catches on the north-western coast of Western Australia are available from recreational fishing surveys undertaken by the Department, including a creel survey of both shore- and boat-based recreational fishing in the Pilbara and western Kimberley in 1999/2000 (Williamson et al. 2006).
More recently, a biennial survey of boat-based recreational fishing focused on providing a broader-scale and integrated system involving several survey methods has been used to survey boat-based recreational fishers in Western Australia (Ryan et al. 2013). Two state-wide recreational fishing surveys have been completed to date using this methodology, in 2011/12 (Ryan et al. 2013) and 2013/14 (Ryan et al. 2015). Results of a third survey should be available in 2017.
Information on charter vessel catches and effort has been routinely collected since 2001, when a licensing framework and compulsory logbook system was implemented.

24 Fisheries Management Paper No. 285
The recreational, charter and commercial catch estimates are synthesised into the stock assessments of each indicator species.
3.7.1.3 Fishery-Dependent and Fishery-Independent Catch Sampling
Otoliths are extracted from samples of fish for the purpose of estimating ages to inform assessments of each indicator species. In the Pilbara, these samples are predominantly collected using fishery-dependent sampling, whereby fishers label boxes of non-size graded fish with catch information (i.e. date and management area). This catch information is validated against VMS pollings and the fish from these boxes are sampled at markets using a rapid lateral extraction method (see Wakefield et al. 2016). Representative samples of fish are collected from all trap fishing vessels throughout all months of the year and for each management area fished.
In the Kimberley, due to on-board size grading of goldband snapper by commercial fishers, fishery-independent catch sampling is undertaken using commercial vessels. The sampling program is generally undertaken in October of the required sampling year, with a total of nine fixed sampling sites and a further five random sites sampled in Zone B of the NDSMF. The random sites were introduced in order to increase sampling representativeness across the fishery. Where practicable, a minimum of 50 red emperor and 50 goldband snapper otoliths are collected at each site. Fishing by selected industry vessel commences as close as is practicable to the starting locations for each site, with vessels undertaking normal commercial fishing operations at each site. This ensures that samples are collected over the geographic extent of Zone B of the fishery and are thus considered to be spatially representative. The aim is to collect in excess of 500 otoliths of each indicator species. It is anticipated that these collections will be undertaken every 4-5 years, unless required earlier for a specific management need.
3.7.2 Assessment Procedures
The different methods used by Fisheries to assess the status of aquatic resources in WA have been categorised into five broad levels, ranging from relatively simple analysis of annual catch levels and catch rates, through to the application of more sophisticated analyses and models that involve estimation of fishing mortality and biomass (Fletcher and Santoro 2015). Irrespective of the types of assessment methodologies used, all stock assessments undertaken by Fisheries take a risk-based, weight of evidence approach that considers all of the available (fishery-dependent and fishery-independent) information (Fletcher 2015, Wise et al. in prep).
3.7.2.1 Indicator Species
The stock status of three indicator species in the Pilbara (red emperor, bluespotted emperor and Rankin cod) and the two indicator species in the Kimberley (goldband snapper and red emperor) is primarily assessed based on estimates of spawning stock biomass relative to internationally accepted reference points (Table 2). Spawning biomass is estimated periodically (at least every 5 years) for each indicator species’ stock using an age- and sex-structured, integrated assessment model that is fitted to available time series of total catches,

Fisheries Management Paper No. 285 25
catch rates (index of abundance) and age composition data in each management area of the Pilbara and Kimberley fisheries. The model takes into account the major features relevant to the biology of the species, including sex-specific growth characteristics, the lengths and ages at which individuals mature or change sex, and the selectivity characteristics of the fishing gear used to catch these species.
3.7.2.2 Non-Indicator Species
In the absence of direct estimates of spawning stock biomass, the stock status of monitored non-indicator species in the Pilbara and Kimberley is assessed primarily based on estimated proxies for biomass, e.g. spawning potential ratio (SPR; Goodyear 1993) and / or fishing mortality from catch curve and per-recruit analyses. The estimates are periodically compared to specified reference point (Table 2) to determine the status of each stock.
3.7.2.3 Risk Assessments
Fisheries uses a risk-based EBFM framework to assess the impacts of fishing on all parts of the marine environment, including the sustainability risks of retained species, bycatch, ETP species, habitats and the ecosystem. The MSC assessment of PTMF and NDSMF has led to the development of a periodic risk assessment process, which is used to prioritise research, data collection, monitoring needs and management actions for these fisheries and to ensure that trap-fishing activities in the North Coast Bioregion are managed both sustainably and efficiently.
In June 2016, an ecological risk assessment (ERA) workshop was held to assess the impacts of commercial trap fishing in north-western Western Australia. The workshop participants included representatives from the fishing industry, the Australian Fisheries Management Authority (AFMA), Murdoch University and the Department of Fisheries. The risk assessment framework applied during the workshop was based on the global standard for risk assessment and risk management (AS/NZS ISO 31000), which has been adopted for use in a fisheries context (see Fletcher et al. 2002).
Four aspects were considered for the risk assessment: ecological sustainability, community well-being, external factors and governance (note only ecological sustainability is currently considered as part of this harvest strategy). The potential effects of the PTMF and NDSMF on retained species, bycatch, ETP species, habitat and ecosystem processes were mostly scored as negligible, low or medium (i.e. acceptable) risk. The only exception was goldband snapper in the Kimberley region that was scored as high risk, however, management measures have already been taken in the NDSMF to reduce the risk to this species and it is expected that the risk level will be reduced to acceptable levels over the next few years.
Future risk assessments will be undertaken periodically (every 3 – 5 years) to reassess any current or new issues that may arise in the fishery. Risk assessments can be undertaken more frequently if there are significant changes identified in fishery operations or management activities or controls that are likely to result in a change to previously assessed risk levels.

26 Fisheries Management Paper No. 285
3.7.3 Reports and Publications
Information on the current status of Western Australian fisheries and aquatic resources is reported annually in the Status Reports of the Fisheries and Aquatic Resources of Western Australia: the State of the Fisheries (e.g. Fletcher and Santoro 2015). Other comprehensive information on fisheries management and the findings and recommendations from research and monitoring activities are also regularly compiled and published in a number of publically-available documents8, including:
• DPIRD’s Annual Report to Parliament;
• The Research, Monitoring, Assessment and Development Plan (e.g. Department of Fisheries 2015b); and
• Fisheries Research Reports, Fisheries Management Papers, Fisheries Occasional Publications, and peer-reviewed scientific journal articles. Examples include:
- Fisheries Research Report No. 231: Relative efficiency of fishing gears and investigation of resource availability in tropical demersal scalefish fisheries (Newman et al. 2012);
- Fisheries Occasional Publication No. 120: Northern Demersal Scalefish Management Fishery: an operator’s guide to the management arrangements 2015, Version 1.0 (Department of Fisheries 2015c); and
- Newman et al. (2011): Assessment of potential impacts of trap usage and ghost fishing on the Northern Demersal Scalefish Fishery.
4 MANAGEMENT MEASURES AND IMPLEMENTATION
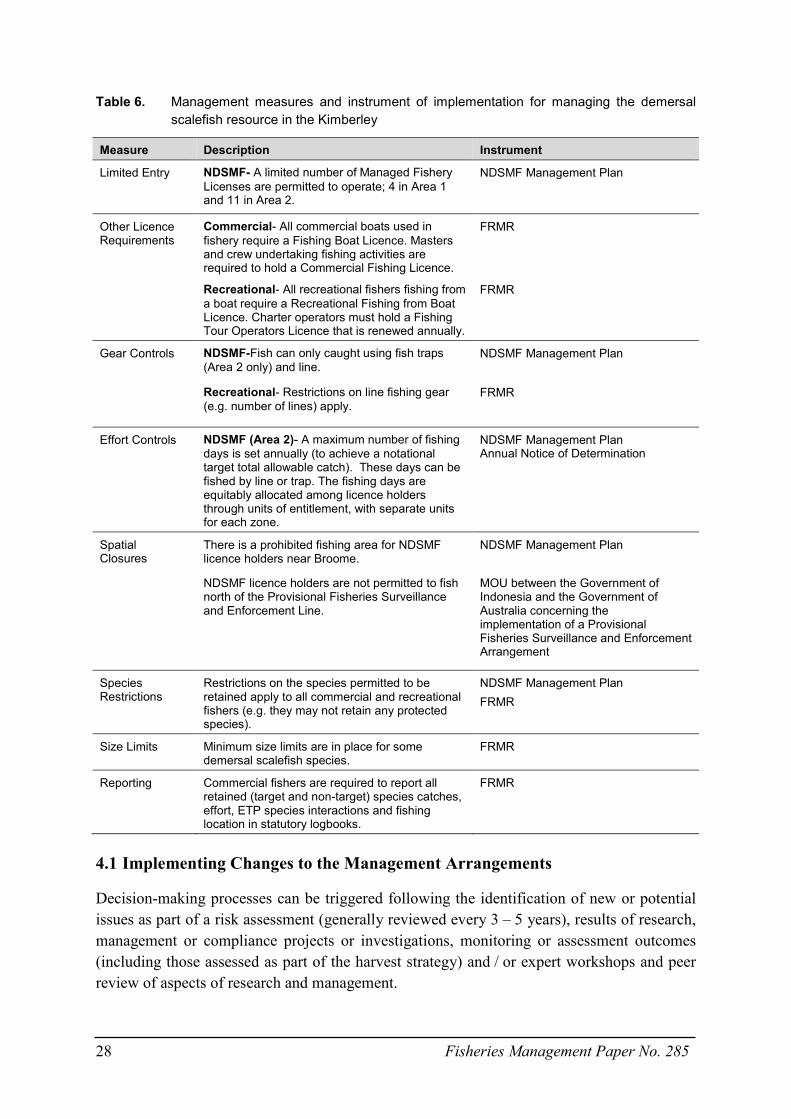
There are a number of management measures in place for managing the demersal scalefish resource in the Pilbara (Table 5) and Kimberley (Table 6). These measures can be amended as needed to ensure the management objectives are achieved; however, these do not preclude the consideration of other options.
8 Departmental reports are available at http://www.fish.wa.gov.au/About-Us/Publications/Pages/default.aspx

Fisheries Management Paper No. 285 27
Table 5. Management measures and instrument of implementation for managing the demersal scalefish resource in the Pilbara
Measure Description Instrument
Limited Entry PFTIMF- A limited number of Managed Fishery Permits (11) are able to operate.
PFTIMF Management Plan (Clause 9)
PTMF- A limited number of Managed Fishery Licenses (6) are permitted to operate.
PTMF Management Plan (Clause 6)
PFL- 9 Fishing Boat Licence (FBL) holders are excepted from an order and have the relevant condition on the FBL to undertake commercial line fishing in the Pilbara.
Prohibition on Fishing by Line from Fishing Boats (Pilbara Waters) Order 2006
Other Licence Requirements
Commercial- All commercial boats used in fishery require a Fishing Boat Licence. Masters and crew undertaking fishing activities are required to hold a Commercial Fishing Licence.
FRMR
Recreational- All recreational fishers fishing from a boat require a Recreational Fishing from Boat Licence. Charter operators must hold a Fishing Tour Operators Licence that is renewed annually.
FRMR
Gear Controls PFTIMF- Fish can only be caught using a trawl net.
PFTIMF Management Plan (Clause 11)
PTMF-Fish can only be caught using fish traps. PTMF Management Plan (Clause 4)
PFL-Fish can only be caught using line. Prohibition on Fishing by Line from Fishing Boats (Pilbara Waters) Order 2006
Recreational- Restrictions on line fishing gear (e.g. number of lines) apply.
FRMR
Effort Controls PFTIMF- A maximum number of fish trawl hours is set within the Management Plan and is allocated among licence holders through units of entitlement.
PFTIMF Management Plan
PTMF- A maximum number of trap days is set annually and is allocated among licence holders through units of entitlement.
PTMF Management Plan and Annual Notice of Determination
Temporal Restrictions
PLF- Fishing by FBL holders is restricted to an annual 5 month period.
FBL condition
Spatial Closures
All commercial fishing for demersal scalefish is prohibited in Area 3 of the Pilbara.
Prohibition on Commercial Fishing for Demersal Scalefish (Pilbara Area) Order 1997
Some inshore and offshore areas of the Pilbara are also closed to commercial fishing.
PFTIMF and PTMF Management Plans
Species Restrictions
Restrictions on the species permitted to be retained apply to all commercial and recreational fishers (e.g. they may not retain any protected species).
PFTIMF and PTMF Management Plans FRMR
Size Limits Minimum legal lengths are in place for some demersal scalefish species.
FRMR
Reporting Commercial fishers are required to report all retained (target and non-target) species catches, effort, ETP species interactions and fishing location in statutory logbooks.
FRMR
28 Fisheries Management Paper No. 285
Table 6. Management measures and instrument of implementation for managing the demersal scalefish resource in the Kimberley
Measure Description Instrument
Limited Entry NDSMF- A limited number of Managed Fishery Licenses are permitted to operate; 4 in Area 1 and 11 in Area 2.
NDSMF Management Plan
Other Licence Requirements
Commercial- All commercial boats used in fishery require a Fishing Boat Licence. Masters and crew undertaking fishing activities are required to hold a Commercial Fishing Licence.
FRMR
Recreational- All recreational fishers fishing from a boat require a Recreational Fishing from Boat Licence. Charter operators must hold a Fishing Tour Operators Licence that is renewed annually.
FRMR
Gear Controls NDSMF-Fish can only caught using fish traps (Area 2 only) and line.
NDSMF Management Plan
Recreational- Restrictions on line fishing gear (e.g. number of lines) apply.
FRMR
Effort Controls NDSMF (Area 2)- A maximum number of fishing days is set annually (to achieve a notational target total allowable catch). These days can be fished by line or trap. The fishing days are equitably allocated among licence holders through units of entitlement, with separate units for each zone.
NDSMF Management Plan Annual Notice of Determination
Spatial Closures
There is a prohibited fishing area for NDSMF licence holders near Broome.
NDSMF Management Plan
NDSMF licence holders are not permitted to fish north of the Provisional Fisheries Surveillance and Enforcement Line.
MOU between the Government of Indonesia and the Government of Australia concerning the implementation of a Provisional Fisheries Surveillance and Enforcement Arrangement
Species Restrictions
Restrictions on the species permitted to be retained apply to all commercial and recreational fishers (e.g. they may not retain any protected species).
NDSMF Management Plan FRMR
Size Limits Minimum size limits are in place for some demersal scalefish species.
FRMR
Reporting Commercial fishers are required to report all retained (target and non-target) species catches, effort, ETP species interactions and fishing location in statutory logbooks.
FRMR
4.1 Implementing Changes to the Management Arrangements
Decision-making processes can be triggered following the identification of new or potential issues as part of a risk assessment (generally reviewed every 3 – 5 years), results of research, management or compliance projects or investigations, monitoring or assessment outcomes (including those assessed as part of the harvest strategy) and / or expert workshops and peer review of aspects of research and management.

Fisheries Management Paper No. 285 29
There are two main processes for making decisions about the implementation of management measures and strategies for the demersal scalefish fisheries in the Pilbara and Kimberley:
• Periodic decision-making processes that may result in measures to meet the short-term fishery objectives (driven by the control rules) and
• Longer-term decision-making processes that result in new measures and / or strategies to achieve the long-term fishery objectives (i.e. changes to the management system).
However, if there is an urgent issue, consultation with stakeholders may be undertaken to discuss the issue and determine appropriate management action, as needed.
4.1.1 Consultation
Management changes are generally given effect through amendments to legislation, such as the commercial fishery management plan, Regulations and Orders. These changes require the approval of the Minister for Fisheries. In making decisions relevant to fisheries, the Minister for Fisheries may choose to receive advice from any source, but has indicated that:
1) Fisheries is the primary source of management advice; and
2) Peak Bodies (Western Australian Fishing Industry Council [WAFIC] and Recfishwest) are the primary source of industry advice and representation.
Under a service level agreement (SLA), the Peak Bodies are funded by Government to undertake their representation / advisory and consultation roles.
Commercial Sector Consultation
Under its SLA with Fisheries, WAFIC has been contracted to conduct statutory consultation related to fisheries management plans and the facilitation of management meetings for licensed fisheries.
The FRMA requires the Minister to consult with affected parties when changes to a Part 6 management plan are being considered. In the case of the PFTIMF, PTMF and NDSMF, this includes all licence holders. Management Meetings between Fisheries, WAFIC and licence holders are generally held annually and are used as the main forum to consult with stakeholders and licence holders on the management of the fisheries. During these meetings, Fisheries’ staff (research, management and compliance), licence holders and WAFIC discuss current and future management issues that may have arisen during the previous fishing season and any proposed changes to the management plan. Follow-up meetings may be held as required.
Fisheries also consults directly with industry, where relevant, on specific management and operational issues.
4.1.1.1.1 Annual Capacity Setting and Review Process
Each year prior to 1 December, the annual capacity (in days) for the PTMF and Area 2 of the NDSMF must be determined by the Director General of DPIRD or a delegate. Prior to

30 Fisheries Management Paper No. 285
making a determination of the number of fishing days for the following year, there is a requirement to consult with licence holders and consider the advice of the Fisheries Executive Director of Research, which is based on the results of monitoring and research of the resource. Once the determination is made, notification is provided to licensees and WAFIC in writing, through the publication of a Notice of Determination9 in the Government Gazette, and through licence renewals and season arrangements for the following year.
The capacity of the PFTIMF (in trawl hours) is contained in the management plan and does not change unless the plan is amended by the Minister for Fisheries. The capacity for the PFTIMF is reviewed each year in consultation with permit holders, in the context considering the Pilbara demersal scalefish stock status.
The capacity of the PLF is set at 5 calendar months of permitted fishing for each of the nine Fishing Boat Licences excepted from the section 43 general prohibition on commercial line fishing in Pilbara waters.
4.1.1.2 Recreational Sector Consultation
Under the SLA with Recfishwest, Fisheries is required to consult with Recfishwest as the recognised peak body for recreational fishing in Western Australia. Recfishwest is required to engage and consult with recreational fishers as necessary in order to meet its obligations.
4.1.1.3 Consultation with Other Groups
Consultation with non-fisher stakeholders including Government agencies, conservation sector Non-Government Organisations, customary fishers, statutory advisory committees and other affected / interested parties is undertaken by Fisheries in accordance with the recently finalised departmental Stakeholder Engagement Guideline (Department of Fisheries 2016). Fisheries’ approach to stakeholder engagement is based on a framework designed to assist with selecting the appropriate level of engagement for different stakeholder groups and includes collaborating with and involving key stakeholders, seeking input from interested parties through a public consultation process and keeping all parties fully informed through the provision of balanced, objective and accurate information. Key fishery-specific documents such as harvest strategies, recovery plans and bycatch action plans are subjected to both formal key stakeholder consultation and public consultation processes.
4.2 Compliance and Enforcement
The primary objectives of Fisheries regarding compliance is to 1) encourage voluntary compliance through education, awareness and consultation activities, and 2) provide effective deterrence for non-compliance through a penalty based system.
9 http://www.slp.wa.gov.au/statutes/subsiduary.nsf/Fisheriesexec?openpage

Fisheries Management Paper No. 285 31
4.2.1 Operational Compliance Plans
Management arrangements are enforced under Operational Compliance Plans (OCPs), with separate OCP’s developed for each of the major fisheries in the region (PFTIMF, PTMF and NDSMF). Each OCP is informed and underpinned by a compliance risk assessment conducted for each fishery. The overarching objectives of each OCP are:
• To provide clear and un-ambiguous direction and guidance to Fisheries and Marine Officers for the yearly delivery of compliance in the fishery;
• To protect the environmental values of fisheries, while providing fair and sustainable access to their commercial and social values;
• To encourage voluntary compliance through education, awareness and consultation activities; and
• To provide processes which ensure that the fisheries are commercially viable in the international market yet environmentally sustainable in the local context.
The OCP is reviewed every 1-2 years.
4.2.1.1 Compliance Strategies for the PFTIMF, PTMF and NDSMF
Compliance strategies and activities that are used in the fishery include:
• land and sea patrols;
• inspections of demersal scalefish at wholesale and retail outlets;
• inspection in port;
• at-sea inspection of fishing boats;
• aerial surveillance;
• undertaking covert operations and observations;
• monitoring of entitlement and vessel movements via VMS; and
• intelligence gathering and investigations.
Inspections may involve:
• inspection of all compartments on board the vessels;
• inspection of all authorizations;
• inspection of associated paperwork;
• inspections of fishing gear; and
• inspection of catch on board the boat.

32 Fisheries Management Paper No. 285
4.2.1.2 Vessel Monitoring System
VMS was introduced to the PFTIMF and NDSMF in 1998 and the PTMF in 2000 to allow real time monitoring of the commercial fleet. VMS helps to ensure fishers are working in their designated fishing areas and are within their effort entitlement allocations.
Vessels operating within a fishery requiring VMS are fitted with an automatic location communicator (ALC), which is used to track the location of a boat by transmitting information such as the geographical position, course and speed of the boat. Information from the ALC is submitted to the department via satellite to the Fisheries’ Marine Operations Centre in Fremantle. The information is processed by specialised software designed to receive, analyse, display and record position reports and messaging via satellites.
Data from the VMS is used to:
• monitor effort entitlements, area and seasonal closures;
• detect incidents;
• provide intelligence and evidence for investigations;
• inform research and management of the fisheries; and
• provide assistance to safety and rescue organisations.

Fisheries Management Paper No. 285 33
5 REFERENCES
Brewer, D., Lyne, V., Skewes, T. and Rothlisberg, P. (2007). Trophic systems of the North West Marine Region. Department of the Environment and Water Resources. CSIRO, Cleveland.
Caddy, J. and Mahon, R. (1995). Reference points for fisheries management. FAO Fisheries Technical Paper 347. FAO, Rome, 84 pp.
Department of Fisheries (2009). Integrated Fisheries Management - Government Policy. Department of Fisheries, Western Australia.
Department of Fisheries (2011). Resource Assessment Framework (RAF) for finfish resources in Western Australia. Fisheries Occasional Publication No. 85. Department of Fisheries, Western Australia.
Department of Fisheries (2015a). Harvest Strategy Policy and Operational Guidelines for the Aquatic Resources of Western Australia. Fisheries Management Paper No. 271. Department of Fisheries, Western Australia.
Department of Fisheries (2015b). Research, Monitoring, Assessment and Development Plan 2015–2020. Fisheries Occasional Publication No. 122. Department of Fisheries, Western Australia.
Department of Fisheries (2015c). Northern Demersal Scalefish Management Fishery: an operator’s guide to the management arrangements 2015, Version 1.0. Fisheries Occasional Publication No. 120. Department of Fisheries, Western Australia.
Department of Fisheries (2016). Guideline for stakeholder engagement on aquatic resource management-related processes. Fisheries Occasional Publication No. 131. Department of Fisheries, Western Australia.
ESD Steering Committee (1992). National Strategy for Ecologically Sustainable Development. Endorsed by the Council of Australian Governments, December 1992. ISBN0 644 27253 8.
Fletcher, W.J. (2002). Policy for the implementation of ecologically sustainable development for fisheries and aquaculture within Western Australia. Fisheries Management Paper No. 157. Department of Fisheries, Western Australia.
Fletcher, W.J. (2012). National Application of Sustainability Indicators for Australian Fisheries; Part 2: Ecosystem-based frameworks for aquaculture, multi-fishery and international applications. FRDC Report on Project No. 2000/145. Fisheries Research Report No. 235. Department of Fisheries, Western Australia, 60 pp.
Fletcher, W.J. (2015). Review and refinement of an existing qualitative risk assessment method for application within an ecosystem-based management framework. ICES Journal of Marine Science 72: 1043-1056.
Fletcher, W.J. and Santoro, K. (eds.) (2015). Status Reports of the Fisheries and Aquatic Resources of Western Australia 2014/15: State of the Fisheries. Department of Fisheries, Western Australia.

34 Fisheries Management Paper No. 285
Fletcher, W., Chesson, J., Sainsbury, K., Fisher, M., Hundloe, T. and Whitworth, B. (2002). Reporting on Ecologically Sustainable Development: A “how to guide” for fisheries in Australia. Canberra, Australia, 120 pp.
Fletcher, W.J., Shaw, J., Metcalf, S.J. and Gaughan, D.J. (2010). An Ecosystem Based Fisheries Management framework: the efficient, regional-level planning tool for management agencies. Marine Policy 34: 1226-1238.
Fletcher, W.J., Wise, B.S., Joll, L.M., Hall, N.G., Fisher, E.A., Harry, A.V., Fairclough, D.V., Gaughan, D.J., Travaille, K., Molony, B.W. and Kangas, M. (2016). Refinements to harvest strategies to enable effective implementation of Ecosystem Based Fisheries Management for the multi-sector, multi-species fisheries of Western Australia. Fisheries Research. http://dx.doi.org/10.1016/j.fishres.2016.04.014
Gabriel, W.L. and Mace, P.M. (1999). A review of biological reference points in the context of the precautionary approach. NOAA Technical Memo NMFS-F/SPO-40, pp. 34-45.
Goodyear, C.P. (1993). Spawning stock biomass per recruit in fisheries management: foundation and current use. In S.J. Smith, J.J. Hunt and D. Rivard [ed.] Risk evaluation and biological reference points for fisheries management. Canadian Special Publications in Fisheries and Aquatic Science, 120.
Henry, G.W. and Lyle, J.M. (eds.) (2000) The National Recreational and Indigenous Fishing Survey. FRD Project No. 99/158. Australian Government Department of Agriculture, Fisheries and Forestry, Canberra.
Mace, P.M. (2001). A new role for MSY in single-species and ecosystem approaches to fisheries stock assessment and management. Fish and Fisheries, 2(1), pp.2-32.
Moran, M., Jenke, J., Burton, C., and Clark, D. (1988). The Western Australian trap and line fishery on the North West Shelf. FIRTA Report 86/28. WA Marine Research Laboratories, 79 pp.
Newman, S.J., Skepper, C.L., Mitsopoulos, G.E.A., Wakefield, C.B., Meeuwig, J.J. and Harvey, E.S. (2011). Assessment of the potential impacts of trap usage and ghost fishing on the Northern Demersal Scalefish Fishery. Reviews in Fisheries Science 19: 74-84.
Newman, S.J., Harvey, E.S., Rome, B.M., McLean, D.L. and Skepper, C.L. (2012). Relative efficiency of fishing gears and investigation of resource availability in tropical demersal scalefish fisheries. Final Report FRDC Project No. 2006/031. Fisheries Research Report No. 231. Department of Fisheries, Western Australia.
Newman, S.J., et al. (in prep.). Resource Assessment Report: North Coast Demersal Scalefish Resource. Fisheries Research Report No. XXX. Marine Stewardship Council Report Series No. X. Department of Fisheries, Western Australia.
Nowara, G.B. and Newman, S.J. (2001). A history of foreign fishing activities and fishery-independent surveys of the demersal finfish resources in the Kimberley region of Western Australia. Fisheries Research Report No. 125. Department of Fisheries, Western Australia, 84 pp.

Fisheries Management Paper No. 285 35
Ryan, K.L., Wise, B.S., Hall, N.G., Pollock, K.H., Sulin, E.H. and Gaughan, D.J. (2013). An integrated system to survey boat-based recreational fishing in Western Australia 2011/12. Fisheries Research Report No. 249. Department of Fisheries, Western Australia.
Ryan, K.L., Hall, N.G., Lai, E.K., Smallwood, C.B., Taylor, S.M. and Wise, B.S. (2015). Statewide survey of boat-based recreational fishing in Western Australia 2013/14. Fisheries Research Report No. 268. Department of Fisheries, Western Australia.
Sloan, S.R., Smith, A.D.M., Gardner, C., Crosthwaite, K., Triantafillos, L., Jeffries, B. and Kimber, N. (2014). National Guidelines to Develop Fishery Harvest Strategies. FRDC Report – Project 2010/061. Primary Industries and Regions, Adelaide, South Australia.
Wakefield, C.B., Boddington, D.K. and Newman, S.J. (2016). Rapid lateral extraction of otoliths that maintains the integrity of fish product to improve access to catches and reduce potential sampling biases. The Open Fish Science Journal 9(1).
Williamson, P.C., Sumner, N.R. and Malseed, B.E. (2006). A 12-month survey of recreational fishing in the Pilbara region of WA during 1999-2000. Fisheries Research Report No. 153. Department of Fisheries, Western Australia.
Wise, B.S., St John, J. and Lenanton, R. (eds.) (2007). Spatial scales of exploitation among populations of demersal scalefish: Implications for management. Part 1: Stock status of the key indicator species for the demersal scalefish fishery in the West Coast Bioregion. FRDC Final Report on Project No. 2003/052. Fisheries Research Report No. 163. Department of Fisheries, Western Australia, 130 pp.
Wise et al. (in prep). A risk-based, weight of evidence approach to improve transparency and robustness of fishery stock assessment outcomes.