North Carolina Reading Comprehension · PDF fileNorth Carolina Reading Comprehension Tests...
77
North Carolina Reading Comprehension Tests Technical Report Grade 3 Reading Comprehension Pretest End-of-Grade Reading Comprehension Tests April 21, 2009
Transcript of North Carolina Reading Comprehension · PDF fileNorth Carolina Reading Comprehension Tests...

North Carolina Reading Comprehension Tests
Technical Report
Grade 3 Reading Comprehension Pretest End-of-Grade Reading Comprehension Tests
April 21, 2009

In compliance with federal laws, NC Public Schools administers all state-operated educational programs, employment activities and admissions without discrimination because of race, religion, national or ethnic origin, color, age, military service, disability, or gender, except where exemption is appropriate and allowed by law. Inquiries or complaints should be directed to:
Dr. Rebecca Garland, Chief Academic Officer Academic Services and Instructional Support
6368 Mail Service Center Raleigh, NC 27699-6368
Telephone (919) 807-3200; fax (919) 807-4065

3
Table of Contents Chapter One: Introduction ......................................................................................... 6
1.1 Universal Participation ......................................................................................................................6 1.2 The North Carolina Statewide Testing Program ............................................................................6 1.3 The North Carolina End-of-Grade Reading Comprehension Tests .............................................8
Chapter Two: Test Development ............................................................................... 9 2.1 The Curriculum Connection .............................................................................................................9 2.2 Test Specifications ............................................................................................................................ 10 2.3 Selecting and Training Item Writers ............................................................................................. 10 2.4 Item Writing ..................................................................................................................................... 10 2.5 Reviewing Items for Field Testing .................................................................................................. 12 2.6 Assembling Field Test Forms .......................................................................................................... 13 2.7 Sampling Procedures ....................................................................................................................... 13 2.8 Item Analysis and Selection ............................................................................................................ 14 2.9 Classical Measurement Analyses .................................................................................................... 14 2.10 Item Response Theory Analyses ................................................................................................... 14 2.11 Three-Parameter Logistic Model (3PL) ....................................................................................... 16 2.12 Differential Item Functioning ....................................................................................................... 17 2.13 Criteria for Inclusion in Item Pools ............................................................................................. 19 2.14 Item Parameter Estimates ............................................................................................................. 19 2.15 Bias Review Committee ................................................................................................................. 20 2.16 Operational Test Construction ..................................................................................................... 20 2.17 Setting the Target p-value for Operational Tests ....................................................................... 21 2.18 Setting the Test Administration Time .......................................................................................... 21 2.19 Reviewing Assembled Operational Tests ..................................................................................... 22
Chapter Three: Test Administration ........................................................................ 23 3.1 Training for Administrators ........................................................................................................... 23 3.2 Preparation for Test Administration ............................................................................................. 23 3.3 Test Security and Handling Materials ........................................................................................... 23 3.4 Student Participation ....................................................................................................................... 24 3.5 Alternate Assessments ..................................................................................................................... 24 3.6 Testing Accommodations ................................................................................................................ 24 3.7 Students with Limited English Proficiency ................................................................................... 25 3.8 Medical Exclusions .......................................................................................................................... 25

4
3.9 Reporting Student Scores ................................................................................................................ 25 3.10 Confidentiality of Student Test Scores ......................................................................................... 25
Chapter Four: Scaling and Standard Setting ............................................................ 27 4.1 Conversion of Test Scores ............................................................................................................... 27 4.2 Constructing a Developmental Scale .............................................................................................. 27 4.3 Contrasting Groups Standard Setting Process and Results ......................................................... 29 4.4 Bookmark Standard Setting Process and Results ......................................................................... 31 4.5 Achievement Level Descriptors ...................................................................................................... 34 4.5 Achievement Level Trends .............................................................................................................. 34 4.6 Percentile Ranking ........................................................................................................................... 35
Chapter Five: Reports .............................................................................................. 37 5.1 Reporting by Student ....................................................................................................................... 37 5.2 Reporting by School ......................................................................................................................... 38 5.3 Reporting by the State ..................................................................................................................... 38
Chapter Six: Descriptive Statistics and Reliability .................................................. 39 6.1 Scale Score Frequency Distributions ............................................................................................. 39 6.2 Reliability of the North Carolina Reading Tests ........................................................................... 43 6.3 Internal Consistency of the North Carolina Reading Tests ......................................................... 43 6.4 Standard Error of Measurement .................................................................................................... 44 6.5 Equivalency of Test Forms .............................................................................................................. 52
Chapter Seven: Validity ........................................................................................... 59 7.1 Content Validity ............................................................................................................................... 59 7.2 Instructional Validity ...................................................................................................................... 60 7.3 Criterion-Related Validity .............................................................................................................. 61
Chapter Eight: Quality Control Procedures ............................................................. 63 8.1 Quality Control Prior to Test Administration .............................................................................. 63 8.2 Quality Control in Data Preparation and Test Administration .................................................. 63 8.3 Quality Control in Data Input ........................................................................................................ 63 8.4 Quality Control of Test Scores ....................................................................................................... 64 8.5 Quality Control in Reporting .......................................................................................................... 64
Definition of Terms ................................................................................................. 65
References ................................................................................................................ 68
Appendix A: Item Development Guidelines ........................................................... 69

5
Appendix B: SBE-Adopted Achievement Level Descriptors ................................. 71

6
Chapter One: Introduction The General Assembly believes that all children can learn. It is the intent of the General Assembly that the mission of the public school community is to challenge with high expectations each child to learn, to achieve, and to fulfill his or her potential (G.S. 115C-105.20a).
With that mission as its guide, the State Board of Education implemented the ABCs Accountability Program at grades K–8 effective with the 1996–1997 school year and grades 9–12 effective during the 1997–1998 school year to test students’ mastery of basic skills (reading, writing, and mathematics). The ABCs Accountability Program was developed under the Public School Laws mandating local participation in the program, the design of annual academic achievement standards, and the development of student academic achievement standards. 1.1 Universal Participation
The School-Based Management and Accountability Program shall be based upon an accountability, recognition, assistance, and intervention process in order to hold each school and the school’s personnel accountable for improved student performance in the school (G.S. 115C-105.21c).
Schools are held accountable for students’ learning by reporting student performance results on North Carolina (NC) tests. Students’ scores are compiled each year and released in a report card. Schools are then recognized for the performance of their students. Schools that consistently do not make adequate progress may receive intervention from the state.
In April 1999, the State Board of Education unanimously approved Statewide Student Accountability Standards. These standards provide four Gateway Standards for student performance at grades 3, 5, 8, and 11. Students in the 3rd, 5th, and 8th grades are required to demonstrate grade-level performance in reading, writing (5th and 8th grades only), and mathematics in order to be promoted to the next grade. The law regarding student academic performance states:
The State Board of Education shall develop a plan to create rigorous student academic performance standards for kindergarten through eighth grade and student academic standards for courses in grades 9-12. The performance standards shall align, whenever possible, with the student academic performance standards developed for the National Assessment of Educational Progress (NAEP). The plan also shall include clear and understandable methods of reporting individual student academic performance to parents (G.S 115C-105.40).
1.2 The North Carolina Statewide Testing Program The NC Statewide Testing Program was designed to measure the extent to which students satisfy academic performance requirements. Tests developed by the NC Department of Public Instruction’s Test Development Section, when properly administered and interpreted, provide reliable and valid information that enables:
• students to know the extent to which they have mastered expected knowledge and skills and how they compare to others;

7
• parents to know if their children are acquiring the knowledge and skills needed to succeed in a highly competitive job market;
• teachers to know if their students have mastered grade-level knowledge and skills in the curriculum and, if not, what weaknesses need to be addressed;
• community leaders and lawmakers to know if students in NC schools are improving their performance over time;
• citizens to assess the performance of the public schools (NC Testing Code of Ethics, 2000).
The NC Statewide Testing Program was initiated in response to legislation passed by the NC General Assembly. The following selection from Public School Laws (1994) describes the legislation. Public School Law 115C-174.10 states the following purposes of the NC Statewide Testing Program:
(1) to assure that all high school graduates possess the…skills and knowledge thought necessary to function as a member of society;
(2) to provide a means of identifying strengths and weaknesses in the education process; and (3) to establish additional means for making the education system accountable to the public
for results.
Tests included in the NC Statewide Testing Program are designed for use as federal, state, and local indicators of student performance. Interpretation of test scores in the NC Statewide Testing Program provides information about a student’s performance on the test in percentiles, scale scores, and achievement levels. Percentiles provide an indicator of how a child performs relative to other children who took the test in the norming year, or the first year the test was administered. Percentiles range from 1 to 99. A percentile rank of 69 indicates that a child performed equal to or better than 69% of the children who took the test during the norming year. Scale scores are derived from a raw score or “number right” score for the test. Each test has a translation table that provides a scale score for each raw test score. Scale scores are reported alongside achievement levels, which are predetermined academic achievement standards. The four achievement levels for the NC Statewide Testing Program are given below:
Level I: Students performing at this level do not have sufficient mastery of knowledge and skills in this subject area to be successful at the next grade level. Level II: Students performing at this level demonstrate inconsistent mastery of knowledge and skills in the subject area and are minimally prepared to be successful at the next grade level. Level III: Students performing at this level consistently demonstrate mastery of the grade level subject matter and skills and are well prepared for the next grade. Level IV: Students performing at this level consistently perform in a superior manner clearly beyond that required to be proficient at grade-level work.
The NC End-of-Grade (EOG) Tests include multiple-choice assessments of reading comprehension and mathematics at grades 3 through 8. The NC End-of-Course (EOC) Tests

8
include multiple-choice assessments in English I, Algebra I, Geometry, and Algebra II. In addition, the NC Statewide Testing Program includes science EOC tests (Biology, Chemistry, Physical Science, and Physics), social studies EOC tests (Civics and Economics and U.S. History), writing assessments in grades 4, 7, and 10, the NC Test of Computer Skills, the NC Competency Test, and alternate assessments (NCCLAS, NCEXTEND2, and NCEXTEND1). The NC EOG Reading Comprehension Tests are used to monitor growth and student performance against absolute standards (performance composite) for school accountability. A student’s EOG scores from the prior grade are used to determine his or her entering level of knowledge and skills and to determine the amount of growth during one school year. Beginning in 1996, a student’s growth at grade 3 was determined by comparing the grade 3 EOG score with a grade 3 pretest administered during the first three weeks of the school year. The Student Accountability Standards, approved by the State Board of Education (SBE), established Level III (of those achievement levels listed above) as the standard for each grade level (SBE Policy HSP-N-002). 1.3 The North Carolina End-of-Grade Reading Comprehension Tests In 2004, the State Board of Education adopted a new curriculum for English Language Arts. In response to that curriculum shift, a revised measure of accountability for students’ mastery of English Language Arts was designed. These tests include the Grade 3 Reading Pretest and the End-of-Grade (EOG) Reading Comprehension Tests at grades 3 through 8. The purpose of this document is to provide an overview and technical documentation specifically for the NC Reading Tests. Chapter One provides an overview of the NC Reading Tests. Chapter Two describes the test development process. Chapter Three outlines the test administration. Chapter Four describes the construction of the developmental scale, the scoring of the tests, and the standard setting process. Chapter Five provides an outline of reporting of test results. Chapters Six and Seven provide the technical properties of the tests such as descriptive statistics from the first operational year, reliability indices, and evidence of validity. Chapter Eight is an overview of quality control procedures.

9
Chapter Two: Test Development In June 2003, the State Board of Education codified the process used in developing all multiple-choice tests in the NC Statewide Testing Program. The development of tests for the NC Statewide Testing Program follows a prescribed sequence of events. A flow chart of those events is found in Figure 1. Figure 1: Flow Chart of the NC Test Development Process
Curriculum Adoption Step 7 Review Item Tryout Statistics
Step 14b Conduct Bias Reviews
Step 1a Develop Test Specifications (Blueprint)
Step 8b Develop New Items
Step 15 Assemble Equivalent and Parallel Forms
Step 2b Develop Test Items
Step 9b Review Items for Field Test
Step 16b Review Assembled Test
Step 3b Review Items for Tryouts
Step 10 Assemble Field Test Forms
Step 17 Final Review of Test
Step 4 Assemble Item Tryout Forms
Step 11b Review Field Test Forms
Step 18ab Administer Test as Pilot
Step 5b Review Item Tryout Forms
Step 12b Administer Field Test
Step 19 Score Test
Step 6b Administer Item Tryouts
Step 13 Review Field Test Statistics
Step 20ab Establish Standards
aActivities done only at implementation of new curriculum bActivities involving NC teachers Phase 1 (step 1) requires 4 months Phase 2 (steps 2-7) requires 12 months Phase 3 (steps 8-14) requires 20 months Phase 4 (steps 15-20) requires 4 months for EOC and 9 months for EOG Phase 5 (step 21) requires 4 months Phase 6 (step 22) requires 1 month TOTAL 44-49 months NOTES: Whenever possible, item tryouts should precede field-testing items. Professional development opportunities are integral and ongoing to the curriculum and test development process.
Step 21b Administer Test as Fully Operational Step 22 Report Test Results
2.1 The Curriculum Connection Testing of NC students’ reading comprehension skills relative to the English Language Arts competency goals and objectives in the NC Standard Course of Study (NCSCS) is one component of the NC Statewide Testing Program. Students are tested in English Language Arts at the end-of-grades 3 through 8 and at the end of the English I course. The NC EOG Tests of Reading Comprehension are developed directly around the objectives found in the NCSCS. While some objectives can be measured readily by multiple-choice questions and are assessed by the tests, other objectives address the skills and background knowledge that are needed to do well on the tests but are not easily measured in a multiple-choice format.

10
2.2 Test Specifications Delineating the purpose of a test must come before the test design. A clear statement of purpose provides the overall framework for test specifications, test blueprint, item development, tryout, and review. A clear statement of test purpose also contributes significantly to appropriate test use in practical contexts (Millman & Greene, 1993). The tests in the NC Statewide Testing Program are designed in alignment with the NCSCS. Test specifications for the NC reading tests are developed to cover a wide range of literary styles and that provide students with authentic reading selections. Test specifications are generally designed to include the following:
(1) percentage of questions from higher or lower thinking skills and classification of each test question into level of difficulty
(2) number of reading selections by genre Test blueprints, specific layouts or “road maps” to ensure the parallel construction of multiple test forms, were developed from the test specifications. These blueprints identify the exact numbers of items from each objective that are used in the creation of the test forms. At the objective level, the tests are comprised of items that are a random domain sample from the superordinate goal, and as such there may be more than one layout. However, at the goal level and in terms of the relative emphasis of the objective coverage, all test blueprints conform to the test specifications. 2.3 Selecting and Training Item Writers Once the test specifications were outlined for the NC EOG and EOC Tests of Reading Comprehension, NC educators were recruited and trained to write new items for the state tests. Diversity among the item writers and their knowledge of the current NCSCS was addressed during recruitment. The purpose of using NC educators to develop items is to ensure instructional validity of the items. Item writers received a packet of materials designed from the English Language Arts curriculum, which included information on content and procedural guidelines as well as information on stem and foil development. The item writing guidelines are included in Appendix A. The items developed during the training were evaluated by content specialists, who then provided feedback to the item writers on the quality of their items. 2.4 Item Writing Using the NCSCS as the foundation, a test blueprint was developed to outline the average number of selections and items per selection for each goal. From these test blueprints, test specifications were generally designed to include the following:
(1) Percentage of questions from higher or lower thinking skills and classification of each test question by level of difficulty;
(2) Percentage of item types such as graphs, charts, diagrams, political cartoons, analogies, and other specialized constraints;
(3) Percentage of test questions that measure a specific goal or objective; and (4) Percentage or number of types of reading selections (e.g., literary vs. nonliterary
selections, etc.)

11
Items on the NC EOG and EOC Tests of Reading Comprehension were developed by NC item writers using the framing categories of both “level of difficulty” and “thinking skill level.” The purpose of the categories in the development of items was to ensure a balance of items across difficulty as well as a balance of items across the different cognitive levels of learning in the NC EOG and EOC Tests of Mathematics. Items were classified into three levels of difficulty: easy, medium, and hard. Easy items are those items that, in the opinion of the item writer, can be answered correctly by approximately 70% of the examinees. Medium items are those items that can be answered correctly by 50% to 60% of the examinees. Difficult items are those items that can be answered correctly by approximately 20% to 30% of the examinees. These targets were used for guiding item writing to ensure an adequate range of difficulty. Another consideration for item development is the classification of items by “thinking skill level” or the cognitive skills that an examinee must use to solve a problem or answer a test question. Thinking skill levels are based on Marzano’s Dimensions of Thinking (1988). In addition to its use in framing achievement tests, it is also a practical framework for curriculum development, instruction, and staff development. Thinking skills begin with the basic skill of “information-gathering” and move to more complex thinking skills such as integration and evaluation. A visual representation of the framework is provided in Figure 2. Figure 2: Adapted from Robert Marzano Dimensions of Thinking (1988)
Content Area Knowledge
Metacognition Critical and Creative Thinking
Thinking Processes: Concept Formation Principle Formation
Comprehending Problem-solving Decision-making
Research Composing
Oral Discourse
Core Thinking Skills Categories:
Focusing Information-gathering
Remembering Organizing Analyzing Generating Integrating Evaluating
Dimensions of Thinking

12
2.5 Reviewing Items for Field Testing To ensure that an item was developed to NCSCS standards, each item went through a detailed review process prior to being placed on a field test. This review is represented by Step 9 on the Test Development Flow Chart (Figure 1). A new group of North Carolina educators was recruited to review items. Once items had been through an educator review, test development staff members, with input from curriculum specialists, reviewed each item. Items were also reviewed by educators and/or staff familiar with the needs of students with disabilities and limited English proficiency. Each item was reviewed by NC educators prior to being placed on a field test. Once items were reviewed by educators, test development staff members, with input from curriculum specialists, reviewed each item. Items were also reviewed by educators and/or staff members who are familiar with the needs of students with disabilities and students with limited English proficiency. The criteria used by the review team to evaluate each test item included the following:
(1) Conceptual criteria: • objective match (curricular appropriateness) • thinking skill match • fair representation • lack of bias • clear statement • single problem • one best answer • common context in foils • each foil credible
(2) Language criteria: • age appropriateness • correct punctuation • spelling and grammar • lack of excess words • no stem/foil clues • no negative in foils
(3) Format criteria: • logical order of foils • familiar presentation style, print size, and type • correct mechanics and appearance • equal length foils
(4) Diagram/Graphic criteria: • necessary • clean • relevant • unbiased
The detailed review of items prior to field testing helps prevent the loss of items due to quality issues.

13
2.6 Assembling Field Test Forms When developing tests for the NC Statewide Testing Program, items written for each grade were assembled into forms for field testing. The forms were organized according to the test specifications set forth for the operational tests. Additional teachers reviewed the assembled forms for clarity, correctness, potential bias, and curricular appropriateness. The following table provides a breakdown of the number of forms and the average number of items per form for the field test. Table 1: Number of forms and the average number of items per form of the field test
Grade (Administration Year) Number of Forms Average Number of
Items per Form 3 Pre (Fall 2007) 10 40 3 (Spring 2007) 10 59 4 (Spring 2007) 10 58 5 (Spring 2007) 10 57 6 (Spring 2007) 10 63 7 (Spring 2007) 10 64 8 (Spring 2007) 11 63
2.7 Sampling Procedures Reading selections and items for the test were field-tested using a randomly selected sample of students at each grade. The resulting sample was checked to determine its level of representation relative to the target population of students. Table 2 provides a breakdown of the field test sample. Sampling for stand-alone field testing of the North Carolina Tests is typically accomplished using stratified random sampling of schools with the goal being a selection of students that is representative of the entire student population in North Carolina. Stratifying variables include:
• gender • ethnicity • region of the state • free/reduced lunch • students with disabilities • students with limited English proficiency • previous year’s test scores
Table 2 shows the demographic characteristics of the sample for the stand-alone field tests of the Edition 1 EOG science tests. Beginning with the first operational version of the science tests, field test items are embedded within each form to supplement the item pools. Embedded field test items are grouped into sections. Experimental sections are placed in operational forms, and the operational forms are spiraled within a classroom to obtain a randomly equivalent group of examinees on each form. This results in a demographic distribution nearly identical to that of the full population.

14
Table 2: 2007 Field test sample characteristics 3 Pre 3 4 5 6 7 8
N 109,145 21,110 27,757 21,388 21,931 22,971 19,034 Percent of Students Tested Male 50.67 50.34 50.20 50.64 50.41 50.77 50.21 Female 49.33 49.66 49.80 49.36 49.59 49.23 49.79 Asian American 2.21 2.44 2.31 2.53 2.05 2.07 2.55
Black 26.65 28.36 28.08 27.27 30.01 29.50 30.35 Hispanic 11.36 10.63 10.22 10.02 9.11 8.79 7.54 American Indian 1.51 1.32 1.25 1.41 1.19 2.02 1.85
Multi-racial 4.09 3.78 4.00 4.00 3.72 3.53 3.38
White 54.19 53.48 54.15 54.77 53.92 54.08 54.34 LEP 7.57 7.35 6.89 6.57 6.10 5.58 4.53
2.8 Item Analysis and Selection Field testing provides important data for determining whether an item will be retained for use on an operational NC EOG Reading Comprehension Tests. The NC Statewide Testing Program uses both classical measurement analysis and item response theory analyses to determine if an item has sound psychometric properties. These analyses provide information that assists NC Statewide Testing Program staff and consultants in determining the extent to which an item can accurately measure a student’s level of achievement. Field-test data for the NC Reading Tests were analyzed by the NCDPI psychometric staff. Item statistics and description information were then printed on the item record for each item. Item records contained: a copy of the item as it was field-tested; the statistical, descriptive, and historical information for an item; any comments by reviewers; and curricular and psychometric notations. 2.9 Classical Measurement Analyses For each item, the p-value (the proportion of examinees answering an item correctly) and the point-biserial correlation between the item score and the total test score were computed using SAS. In addition, frequency distributions of the response choices were tabulated. While the p-value is an important statistic and is one component used in determining the selection of an item, the NC Statewide Testing Program used item response theory (IRT) parameters to assess the psychometric appropriateness of the NC EOG and EOC Tests of Reading Comprehension. 2.10 Item Response Theory Analyses Many factors determine the appropriateness of using IRT to analyze a specific set of data which include the content of the test, the nature of the population taking the test, and the conditions under which the test is taken. Item response theory is, with increasing frequency, being used with achievement level testing. “The reason for this may be the desire for item statistics to be independent of a particular group and for scores describing examinee proficiency to be independent of test difficulty, and for the need to assess reliability of tests without the tests being

15
strictly parallel” (Hambleton, Swaminathan, & Rogers, 1991, p. 148). The invariance of item parameters and the invariance of ability parameters make IRT analyses ideal for achievement testing. Regardless of the distribution of the sample, the parameter estimates will be linearly related to the parameters estimated with some other sample drawn from the same population. IRT allows the comparison of two students’ ability estimates even though they may have taken different items. An important characteristic of item response theory is the item-level focus. IRT makes a statement about the relationship between the probability of answering an item correctly and the student’s ability or level of achievement. The relationship between an examinee’s item performance and the set of traits underlying item performance can be described by a monotonically increasing function called an item characteristic curve (ICC). This function specifies that as the level of the trait increases, the probability of a correct response to an item increases. The following figure shows an item characteristic curve for a typical 4-option multiple-choice item. To provide additional information about item performance, the North Carolina Testing Program also uses IRT statistics to determine whether an item should be included on the test. IRT is being used with increasing frequency for large-scale achievement testing. “The reason for this may be the desire for item statistics to be independent of a particular group and for scores describing examinee proficiency to be independent of test difficulty, and for the need to assess reliability of tests without the tests being strictly parallel” (Hambleton, 1983, p. 148). IRT meets these needs and provides two additional advantages: the invariance of item parameters and the invariance of ability parameters. Regardless of the distribution of the sample, the parameter estimates will be linearly related to the parameters estimated with some other sample drawn from the same population. IRT allows the comparison of two students’ ability estimates even though they may have taken different items. An important characteristic of IRT is item-level orientation. IRT makes a statement about the relationship between the probability of answering an item correctly and the student’s ability or the student’s level of achievement. The relationship between a student’s item performance and the set of traits underlying item performance can be described by a monotonically increasing function called an Item Characteristic Curve (ICC). This function specifies that as the level of the trait increases, the probability of a correct response to an item increases. The following figure shows the ICC for a typical 4-option multiple-choice item.

16
Figure 3: Typical ICC
Three Parameter Model
0.0
0.1
0.2
0.3
0.4
0.5
0.6
0.7
0.8
0.9
1.0
-3.0 -2.5 -2.0 -1.5 -1.0 -0.5 0.0 0.5 1.0 1.5 2.0 2.5
Abil i ty
Prob
abili
ty o
f a C
orre
ct R
espo
nse
2.11 Three-Parameter Logistic Model (3PL) The three-parameter logistic model (3PL) of item response theory, the model used in generating EOG statistics, takes into account the difficulty of the item and the ability of the examinee. An examinee’s probability of answering a given item correctly depends on the examinee’s ability and the characteristics of the item. The 3PL model has three assumptions:
(1) unidimensionality—only one ability is assessed by the set of items (for example, a spelling test only assesses a student’s ability to spell);
(2) local independence—when abilities influencing test performance are held constant, an examinee’s responses to any pair of items are statistically independent (conditional independence, i.e., the only reason an examinee scores similarly on several items is because of his or her ability, not because the items are correlated); and
(3) the ICC specified below reflects the true relationship among the unobservable variable (ability) and the observable variable (item response).
The formula for the three-parameter logistic model is:
( )
( )( ) (1 )1
i i
i i
Da b
i i i Da beP c c
e
θ
θθ−
−= + −+
Pi(θ)-- is the probability that a randomly chosen examinee with ability θ answers item i correctly (this is an S-shaped curve with values between 0 and 1 over the ability scale)
a-- the slope or the discrimination power of the item (the slope of a typical item is 1.00)
b-- the threshold or the point on the ability scale where the probability of a correct response is 50% (the threshold of a typical item is 0.00)

17
c-- the asymptote or the proportion of the examinees who got the item correct, but did poorly on the overall test (the asymptote of a typical 4-choice item is 0.25)
d-- is a scaling factor, 1.7, to make the logistic function as close as possible to the normal ogive function (Hambleton, 1984).
The IRT parameter estimates for each item were computed using the BILOG-MG computer program (Zimowski, Muraki, Mislevy, & Bock, 2002) using the default Bayesian prior distributions for the item parameters [a~lognormal(0, 0.5), b~N(0,2), and c~Beta(6,16)]. 2.12 Differential Item Functioning It is important to know the extent to which an item on a test performs differently for different students. Differential item functioning (DIF) examines the relationship between the score on an item and group membership while controlling for ability. The Mantel-Haenszel procedure quantifies DIF by examining (j 2 x 2) contingency tables, where j is the number of different levels of ability actually achieved by the examinees (actual total scores received on the test). The focal group is the group of interest and the reference group serves as a basis for comparison (Camilli & Shepherd, 1994; Dorans & Holland, 1993). For example, females might serve as the focal group and males might serve as the reference group to determine if an item is biased toward or against females. The Mantel-Haenszel (MH) chi-square statistic tests the hypothesis that a linear association exists between the score on an item and group membership. The chi-squared distribution has one degree of freedom (df) and is determined where r2 is the Pearson correlation coefficient between the item score and group membership. The MH Log Odds Ratio statistic was used to determine the direction of DIF. This measure was obtained by combining the odds ratios across levels with the formula for weighted averages (Camilli & Shepherd, 1994). For this statistic, the null hypothesis of no relationship between score and group membership, or that the odds of getting the item correct are equal for the two groups, is not rejected when the odds ratio equals 1. For odds ratios greater than 1, the interpretation is that an individual at score level j of the reference group has a greater chance of answering the item correctly than an individual at score level j of the focal group. Conversely, for odds ratios less than 1, the interpretation is that an individual at score level j of the focal group has a greater chance of answering the item correctly than an individual at score level j of the reference group. The Breslow-Day Test is used to test whether the odds ratios from the j levels of the score are all equal. When the null hypothesis is true, the statistic is distributed approximately as a chi square with j-1 degrees of freedom (SAS Institute, 1985). It is important to know the extent to which an item on a test performs differently for different students. As a third component of the item analysis, differential item functioning (DIF) analyses examine the relationship between the score on an item and group membership, while controlling for ability, to determine if an item may be behaving differently for a particular gender or ethnic group. While the presence or absence of true bias is a qualitative decision, based on the content

18
of the item and the curriculum context within which it appears, DIF can be used to quantitatively identify items that should be subjected to further scrutiny. In developing the North Carolina Science tests, the North Carolina Testing Program staff used the Mantel-Haenszel procedure to examine DIF by examining j 2 × 2 contingency tables, where j is the number of different levels of ability actually achieved by the examinees (actual total scores received on the test). The focal group is the focus of interest, and the reference group serves as a basis for comparison for the focal group (Dorans & Holland, 1993; Camilli & Shepherd, 1994). For example, females might serve as the focal group and males might serve as the reference group to determine if an item may be biased towards or against females. The Mantel-Haenszel (MH) chi-square statistic (only used for 2 × 2 tables) tests the alternative hypothesis that a linear association exists between the row variable (score on the item) and the column variable (group membership). The χ2 distribution has one degree of freedom (df) and its significance is determined by the correlation between the row variable and the column variable (SAS Institute, 1985). The MH Log Odds Ratio statistic in SAS was used to determine the direction of DIF. This measure was obtained by combining the odds ratios (aj) across levels with the formula for weighted averages (Camilli & Shepherd, 1994, p. 110). For the Mantel-Haenszel statistic, the null hypothesis is that there is no relationship between score and group membership: the odds of getting the item correct are equal for the two groups. The null hypothesis was not rejected when the odds ratio equaled 1. For odds ratios greater than 1, the interpretation was that an individual at score level j of the Reference Group had a greater chance of answering the item correctly than an individual at score level j of the focal group. Conversely, for odds ratios less than 1, the interpretation was that an individual at score level j of the focal group had a greater chance of answering the item correctly than an individual at score level j of the reference group. The Breslow-Day Test was used to test whether the odds ratios from the j levels of the score were all equal. When the null hypothesis was true, the statistic was distributed approximately as a chi-square with j–1 degrees of freedom (SAS Institute, 1985). The ethnic (Black / White) and gender (Male / Female) bias flags were determined by examining the significance levels of items from several forms and identifying a typical point on the continuum of odds ratios that was statistically significant at the α = 0.05 level. EXPERT REVIEW All items, statistics, and comments were reviewed by curriculum specialists and testing consultants. Items found to be inappropriate for curricular or psychometric reasons were deleted. In addition, items flagged for exhibiting ethnic or gender DIF were then reviewed by a bias review committee. Differential item functioning is a purely statistical judgment without regard to the actual content of the item; the determination of actual bias is a qualitative judgment based on the content of the item. The bias review committee members, selected because of their knowledge of the curriculum area and their diversity, evaluated test items with a DIF flag using the following questions:
(1) Does the item contain language that is not commonly used statewide or has different connotations in different parts of the state or in different cultural or gender groups?

19
(2) Does the item contain any local references that are not a part of the statewide curriculum?
(3) Does the item portray anyone in a stereotypical manner? (These could include activities, occupations, or emotions.)
(4) Does the item contain any demeaning or offensive materials? (5) Does the item have offensive, stereotyping, derogatory, or proselytizing religious
references? (6) Does the item assume that all students come from the same socioeconomic background?
(e.g., a suburban home with two-car garage) (7) Does the artwork adequately reflect the diversity of the student population? (8) Are there other bias or sensitivity concerns?
An answer of yes to any of these questions resulted in the unique item production number being recorded on an item bias sheet along with the nature of the bias or sensitivity. Items that were consistently identified as exhibiting bias or sensitivity were flagged for further review by NCDPI curriculum specialists. Items that were flagged by the bias review committee were then reviewed by NCDPI curriculum specialists. If these experts found the items measured content that was expected to be mastered by all students, the item was retained for test development. Items that were determined by both review committees to exhibit true bias were deleted from the item pool. 2.13 Criteria for Inclusion in Item Pools Items were flagged as exhibiting psychometric problems or DIF due to ethnicity/race or gender according to the following criteria:
• Slope (a parameter) less than 0.60, • Asymptote (c parameter) greater than 0.40, • Ethnic DIF - Log odds ratio greater than 1.5 (favored whites) or less than 0.67 (favored
blacks), and • Gender DIF - Log odds ratio greater than 1.5 (favored females) or less than 0.67 (favored
males). The ethnic and gender DIF were determined by examining the significance levels of items from several forms and identifying a typical point on the continuum of odds ratios that was statistically significant at the α = 0.05 level. Because the tests were to be used to evaluate the implementation of the curriculum, items were not flagged on the basis of the difficulty of the item (threshold). Final average item pool parameter estimates for each of the NC Reading Tests are provided below. 2.14 Item Parameter Estimates All items, statistics, and comments were reviewed by curriculum specialists and testing consultants, and items found to be inappropriate for curricular or psychometric reasons were deleted. In addition, items flagged for exhibiting ethnic or gender DIF were then reviewed by a bias review team. Table 3: Average item pool parameter estimates

20
Grade IRT Parameters P-value DIF (Odds Ratio)
Threshold (b) Slope (a) Asymptot
e (c) Ethnic Gender
3 Pre 0.267 0.991 0.174 0.558 1.024 1.005 3 -0.208 1.036 0.208 0.654 1.080 1.007 4 -0.156 1.016 0.216 0.647 1.083 1.009 5 -0.257 0.937 0.217 0.662 1.079 1.004 6 -0.192 0.981 0.217 0.656 1.087 1.002 7 0.056 0.941 0.214 0.613 1.074 1.010 8 0.085 0.975 0.216 0.602 1.075 1.003
2.15 Bias Review Committee The bias review team members, selected because of their knowledge of the curriculum area and their diversity, evaluated the items using the following questions as guidelines:
(1) Does the item contain language that is not commonly used statewide or has different connotations in different parts of the state or in different cultural or gender groups?
(2) Does the item contain any local references that are not a part of the statewide curriculum?
(3) Does the item portray anyone in a stereotypical manner? (These could include activities, occupations, or emotions.)
(4) Does the item contain any demeaning or offensive materials? (5) Does the item have offensive, stereotyping, derogatory, or proselytizing religious
references? (6) Does the item assume that all students come from the same socioeconomic background
(e.g., a suburban home with two-car garage)? (7) Does the artwork adequately reflect the diversity of the student population? (8) Are there other bias or sensitivity concerns? An answer of “yes” to any of the questions
resulted in the unique five-digit item number being recorded on an item bias sheet along with the nature of the bias.
Items that were flagged by the bias review committee were then reviewed by curriculum specialists. If curriculum found the items measured content expected to be mastered by all students, the item was retained for test development. Items consistently identified as exhibiting bias by both review committees were deleted from the item pool. 2.16 Operational Test Construction Once a sufficient number of items were developed for the item pools, operational tests were constructed. Initially, items were selected based on the test blueprint such that three unique forms could be created. For NC EOG Reading Comprehension Tests, three operational forms were assembled from items that were found to be psychometrically sound. The final item pool was based on approval by the (1) NCDPI Division of Instructional Services for curriculum purposes; and (2) NCDPI Division of Accountability Services/NC Testing Program for psychometrically sound item performance. The forms for each grade and course were developed according to test specifications outlined during the initial phase of test development and the average p-value for each form was equivalent to the average p-value for the item pool.

21
2.17 Setting the Target p-value for Operational Tests The p-value is a measure of the difficulty of an item that ranges from 0 to 1 and represents the proportion of examinees that answer an item correctly. So an item with a p-value of 0.75 was correctly endorsed by 75% of the students who took the item during the field test, and one might expect that roughly 75 of the 100 examinees will answer it correctly when the item is put on an operational test. An easy item has a p-value that is high—that means that a large proportion of the examinees got the item right during the field test. A difficult item has a low p-value, meaning that few examinees endorsed the item correctly during field-testing. The NCDPI psychometric staff must choose a target p-value for each operational test prior to assembling the tests. Ideally, the average p-value of a test would be 0.625, which is the theoretical average of a student getting 100% correct on the test and a student scoring a “chance” performance (25% for a 4-foil multiple-choice test). That is, (100 + 25/2). The target is chosen by first looking at the distribution of the p-values for a particular item pool. While the goal is to set the target as close to 0.625 as possible, it is often the case that the target p-value is set between the ideal 0.625 and the average p-value of the item pool. The average p-value of the item pool and the p-value of assembled forms are provided below for comparison. Table 4: Comparison of p-values
Grade p-Value of Item Pool
p-Value of Assembled Forms
3 Pre 0.558 0.532 3 0.654 0.664 4 0.647 0.663 5 0.662 0.643 6 0.656 0.651 7 0.613 0.670 8 0.602 0.650
2.18 Setting the Test Administration Time Other important considerations in the construction of the NC Reading Comprehension tests were the number of items to be included on the test and the time necessary to complete testing. When assembling operational tests, the NCDPI psychometric staff reviewed field test timing data. They determined the amount of time necessary for 98% of the students to complete the test. These data were then compared to the amount of time needed to complete previous operational administrations. In some cases it was necessary to reduce the number of items slightly so that test administration time was reasonable and comparable to previous years’ test administrations. For operational tests, the resulting total number of items for each grade/subject area is provided below. Table 5: Number of items per test and time allotted by grade
Grade Number of
Operational Items/Total Items
Approximate Time Allotted/Maximum Time
Allowed (in minutes) 3 Pre 31/38 85/180
3 50/58 140/240 4 50/58 140/240

22
5 50/58 140/240 6 56/62 140/240 7 56/62 140/240 8 56/62 140/240
2.19 Reviewing Assembled Operational Tests Once forms were assembled to meet test specifications, target p-values, and item parameter targets, ten to fifteen subject area teachers and curriculum supervisors then reviewed the assembled forms. Each group of subject area teachers and curriculum supervisors worked independently of the test developers. The criteria for evaluating each group of forms included the following:
• Curricular validity—Content of the test forms should reflect the goals and objectives of the NC Standard Course of Study for the subject;
• Instructional validity—Content of test forms should reflect the goals and objectives taught in NC schools;
• Item quality—Items should be clearly and concisely written, and the vocabulary should be appropriate to the target age level;
• Test/item bias—Content of the test forms should be balanced in relation to ethnicity, gender, socioeconomic status, and geographic district of the state; and
• Each item should have one and only one best answer that is right; however, the distractors should appear plausible for someone who has not achieved mastery of the representative objective (one best answer).
Reviewers were instructed to take the tests (circling the correct responses in the booklet) and to provide comments and feedback next to each item. After reviewing all three forms in the set, each reviewer independently completed the survey asking for his or her opinion as to how well the tests met the criteria listed above. During the last part of the session, the group discussed the tests and made comments as a group. The ratings and comments were aggregated for review by the NCDPI curriculum specialists and testing consultants. Test development staff members, with input from curriculum staff and content experts, and editors conducted the final content and grammar check for each test form.

23
Chapter Three: Test Administration The NC Grade 3 Reading Comprehension Pretest, which measures grade 2 competencies in reading comprehension, is a multiple-choice test administered to all students in grade 3 within the first three weeks of the school year. The pretest allows schools to establish benchmarks to compare individual and group scale scores and achievement levels with the results from the regular EOG test administered in the spring. In addition, a comparison of the results from the pretest and the results from the regular grade 3 EOG test administration allows schools to measure growth in achievement in reading comprehension at the third grade for the ABCs accountability program. The pretest is not designed to make student placement or diagnostic decisions. The NC EOG Reading Comprehension Tests are administered to students in grades 3 through 8 as part of the statewide assessment program. The standard for grade-level proficiency is a test score at Achievement Level III or above on both reading comprehension and mathematics tests. 3.1 Training for Administrators The NC Statewide Testing Program uses a train-the-trainer model to prepare test administrators to administer NC tests. Regional accountability coordinators (RACs) receive training in test administration from the NCDPI Testing Policy and Operations staff at regularly scheduled monthly training sessions. Subsequently, the RACs provide training on conducting a proper test administration to local education agency (LEA) test coordinators. LEA test coordinators provide training to school test coordinators. The training includes information on the test administrators’ responsibilities, proctors’ responsibilities, preparing students for testing, eligibility for testing, policies for testing students with special needs (students with disabilities and students with limited English proficiency), test security (storing, inventorying, and returning test materials), and the NC Testing Code of Ethics. 3.2 Preparation for Test Administration School test coordinators must be accessible to test administrators and proctors during the administration of secure state tests. The school test coordinator is responsible for monitoring test administrations within the building and responding to situations that may arise during test administrations. Only employees of the school system are permitted to administer secure state tests. Test administrators are school personnel who have professional training in education and the state testing program. Test administrators may not modify, change, alter, or tamper with student responses on the answer sheets or test books. Test administrators are to thoroughly read the Test Administrator’s Manual prior to actual test administration; discuss with students the purpose of the test; and read and study the codified NC Testing Code of Ethics. 3.3 Test Security and Handling Materials Compromised secure tests result in compromised test scores. To prevent contamination of test scores, the NCDPI maintains test security before, during, and after test administration at both the school system level and the individual school. School systems are also mandated to provide a secure area for storing tests. The Administrative Procedures Act 16 NCAC 6D .0302 states, in part, that
school systems shall (1) account to the department (NCDPI) for all tests received; (2) provide a locked storage area for all tests received; (3) prohibit the reproduction of all

24
or any part of the tests; and (4) prohibit their employees from disclosing the content of or discussing with students or others specific items contained in the tests. Secure test materials may only be stored at each individual school for a short period prior to and after the test administration. Every effort must be made to minimize school personnel access to secure state tests prior to and after each test administration.
At the individual school, the principal shall account for all test materials received. As established by APA 16 NCAC 6D .0306, the principal shall store test materials in a secure locked area except when in use. The principal shall establish a procedure to have test materials distributed immediately prior to each test administration. After each test administration, the building level coordinator shall collect, count, and return all test materials to the secure, locked storage area. Any discrepancies are to be reported to the school system test coordinator immediately and a report must be filed with the regional accountability coordinator. 3.4 Student Participation The Administrative Procedures Act 16 NCAC 6D. 0301 requires that all public school students in enrolled grades for which the SBE adopts a test, including every child with disabilities, shall participate in the testing program unless excluded from testing as provided by 16 NCC 6G.0305(g). 3.5 Alternate Assessments The NC Statewide Testing Program currently offers the NC Checklist of Academic Standards (NCCLAS), the NCEXTEND2, and the NCEXTEND1 as alternate assessments for the NC EOG Reading Comprehension Tests (grades 3–8). The NCCLAS is an alternate assessment with grade-level achievement standards. The NCEXTEND2 is an alternate assessment with modified achievement standards. The NCEXTEND1 is an alternate assessment with alternate achievement standards. Both the NCCLAS and the NCEXTEND2 measure competencies in the NCSCS. The NCEXTEND1 measures competencies in the NCSCS Extended Content Standards. The Individualized Education Program (IEP) team determines if a student is eligible to participate in the alternate assessments. In instances where students have limited English proficiency, specific eligibility requirements must be met for participation in the NCCLAS. 3.6 Testing Accommodations On a case-by-case basis where appropriate documentation exists, students with disabilities and students with limited English proficiency may receive testing accommodations. The need for accommodations must be documented in a current IEP, Section 504 Plan, or appropriate LEP documentation. The accommodations must be used routinely during the student’s instructional program or similar classroom assessments. For information regarding appropriate testing procedures, test administrators who provide accommodations for students with disabilities must refer to the most recent publication of the Testing Students with Disabilities document and any published supplements or updates. The publication is available through the local school system or at www.ncpublicshools.org/accountability/policies/tswd. Test administrators must be trained in the use of the specified accommodations by the school system test coordinator, or designee, prior to the test administration.

25
3.7 Students with Limited English Proficiency Per HSP-C-005, students identified as limited English proficient shall be included in the statewide testing program. Students identified as limited English proficient that have been assessed on the state-identified English language proficiency tests (State Board of Education policy HSP-A-011) and scored below Intermediate High in reading may participate in the State-designated alternate assessment for up to two years (24 months) in U.S. schools. For more information on participation for LEP students, visit www.ncpublicschools.com/accountability/policy/slep.
3.8 Medical Exclusions In some rare cases, students may be excused from the required state tests. The process for requesting special exceptions based on significant medical emergencies and/or conditions is as follows:
For requests that involve significant medical emergencies and/or conditions, the LEA superintendent or charter school director is required to submit a justification statement that explains why the emergency and/or condition prevents participation in the respective test administration during the testing window and the subsequent makeup period. The request must include the name of the student, the name of the school, the LEA code, and the name of the test(s) for which the exception is being requested. Medical documents are not included in the request to the NCDPI. The request is to be based on information housed at the central office. The student’s records must remain confidential. Requests must be submitted prior to the end of the makeup period for the respective test(s). Requests are to be submitted for consideration by the LEA superintendent or charter.
3.9 Reporting Student Scores According to APA 16 NCAC 6D .0302 schools systems shall, at the beginning of the school year, provide information to students and parents or guardians advising them of the district-wide and state-mandated tests that students will be required to take during the school year. In addition, school systems shall provide information to students and parents or guardians to advise them of the dates the tests will be administered and how the results from the tests will be used. Also, information provided to parents about the tests shall include whether the State Board of Education or local board of education requires the test. School systems shall report scores resulting from the administration of the district-wide and state-mandated tests to students and parents or guardians along with available score interpretation information within 30 days from the generation of the score at the school system level or receipt of the score and interpretive documentation from the NCDPI. 3.10 Confidentiality of Student Test Scores State Board of Education policy states that “any written material containing the identifiable scores of individual students on tests taken pursuant to these rules shall not be disseminated or otherwise made available to the public by any member of the State Board of Education, any employee of the State Board of Education, the State Superintendent of Public Instruction, any employee of the NC Department of Public Instruction, any member of a local board of education, any employee of a local board of education, or any other person, except as permitted

26
under the provisions of the Family Educational Rights and Privacy Act of 1974, 20 U.S.C. § 1232g.”

27
Chapter Four: Scaling and Standard Setting The NC EOG and EOC Tests of Reading Comprehension scores are reported as scale scores, achievement levels, and percentiles. There are several advantages to using scale scores:
• Scale scores on pretests or released test forms can be related to scale scores used on secure test forms administered at the end of the course;
• Scale scores can be used to compare the results of tests that measure the same content area but are composed of items presented in different formats; and
• Scale scores can be used to minimize differences among various forms of the tests. 4.1 Conversion of Test Scores Each student’s score is determined by calculating the number of items he or she answered correctly and then converting the sum to a developmental scale score. The program SCALE SCORE (developed by the L.L. Thurstone Psychometric Laboratory at the University of North Carolina at Chapel Hill) is used to convert summed scores (total number of items answered correctly) to scale scores using the three item response theory parameters (threshold, slope, and asymptote) for each item. Because different items are used on each form of the test, unique score conversion tables are produced for each form of the test for each grade or subject area. For example, at grade 3 there are three EOG Reading Comprehension Test forms; therefore, three scale score conversion tables are used in the scanning and reporting program. In addition to producing scaled scores, the program also computes the standard error of measurement associated with each score. 4.2 Constructing a Developmental Scale Following changes in curriculum specifications for reading, third edition tests were designed for the EOG Reading Comprehension Tests. As a result of these changes, new developmental scales were constructed for the third edition tests to provide a continuous measure of academic progress among NC students. The new developmental scale was then linked to the second edition scale. The basis of a developmental scale is the specification of means and standard deviations for scores on that scale for each grade level. In the case of the North Carolina EOG Reading Comprehension Tests, the grade levels ranged from the Pretest—Grade 3 (administered in the fall to students in the third grade) through grade 8. The data from which the scale score means are derived make use of special experimental sections, called linking sections, which were administered to students in adjacent grades. A test section used operationally at the 5th grade would have been embedded into the 6th-grade EOG Reading Comprehension Test in one of the experimental locations; the linking items would not count toward the 6th-grade students’ scores. It is important to note that no single test version had both its experimental sections populated by off-grade linking material and that the links only extended up, not down, e.g., 6th-grade students may have been administered 5th-grade items, but the 6th-grade students would not have been administered 7th-grade items. The difference in performance between grades on these linking items was used to estimate the difference in proficiency among grades. The third edition of the North Carolina End-of-Grade Tests of Mathematics used IRT to compute these estimates following procedures described by Williams, Pommerich, and Thissen (1998). Table 6 shows the population means and standard deviations derived from the Spring 2006 item calibration for the North Carolina End-of-Grade Tests of Mathematics. Unlike previous editions of the NC EOG

28
Math Tests, the off-grade linking sections were embedded into operational test forms, rather than spiraled in to the stand-alone field test mix. The values for the developmental scale shown in Table 6 are based on IRT estimates of differences between adjacent-grade means and ratios of adjacent-grade standard deviations. BILOG-MG software version 3.0 (Zimowski, Muraki, Mislevy, & Bock, 2002) was used. In BILOG-MG, the lower grade was considered the reference group and thus its population mean and standard deviation were set to 0 and 1, respectively. The values of the mean (μ) and standard deviation (σ) of the higher grade are estimated making use of the item response data and the three-parameter logistic IRT model (Thissen & Orlando, 2001). Table 7 shows the average difference between adjacent-grade means (μ) in units of the standard deviation of the lower grade and ratios between adjacent-grade standard deviations (σ) derived from the Spring 2006 item calibration for the North Carolina End-of-Grade Tests of Mathematics. The values in Table 7 are converted into the final scale, shown in Table 6, by setting the average scale score at grade 5 to be 350.0 with a standard deviation of 10.0 and then computing the values for the other grades such that the differences between the means for adjacent grades, in units of the standard deviation of the lower grade, are the same as those shown in Table 6.
Grade Pair Average Mean Differences
Average Standard Deviation Ratios
Mean p-value Differences for Linking Items
3 - 4 0.523 0.858 0.110 4 - 5 0.445 0.927 0.084 5 - 6 0.286 1.012 0.056 6 - 7 0.274 0.967 0.054 7 - 8 0.277 0.970 0.049
The table below shows the population means and standard deviations derived from the Spring 2008 item calibration for the third edition NC EOG Reading Comprehension Tests, as well as a comparison of the second-edition and third-edition population means and standard deviations. Note that the third-edition mean begins with a 3 to distinguish it from the second-edition scale. Table 6: Comparison of population means and standard deviations for second and third editions
Second Edition Third Edition
Grade Mean Standard Deviation Mean Standard
Deviation 3 Pre 236.66 11.03 326.62 13.48
3 245.21 10.15 338.65 12.57 4 250.00 10.01 345.25 10.79 5 253.92 9.61 349.98 10.00 6 255.57 10.41 352.87 10.12 7 256.74 10.96 355.63 9.79 8 259.35 11.13 358.36 9.49
The descriptive statistics shown above for each grade level provide the basis for the calculation of Stocking-Lord-based equating functions between the score-scales for the second and third

29
editions of the reading test. More information will be available in November 2008 regarding the link between the two editions of the reading comprehension tests. 4.3 Contrasting Groups Standard Setting Process and Results For tests developed under the NC Statewide Testing Program, standard setting or the process of determining cut scores for the different achievement levels is typically accomplished through the use of contrasting groups. Contrasting groups is an examinee-based method of standard setting, which involves the categorization of students into various achievement levels by expert judges who are knowledgeable of students’ achievement in various domains outside of the testing situation and then comparing these judgments to students’ actual scores. For the NC EOG Reading Comprehension Tests, NC teachers were considered to be expert judges under the rationale that teachers were able to make informed judgments about students’ achievement because they had observed the breadth and depth of the students’ work during the school year. Approximately 95% of the students in each grade who participated in field testing were categorized into one of four achievement levels, with the remainder categorized as “not a clear example of any of the achievement levels.” This provided a proportional measure of the students expected to score in each of the four achievement levels. Cut scores are the scores at which one achievement level ends and the next achievement level begins. In contrasting-groups standard setting, scores from each grade would be distributed from lowest to highest. This distribution would then be used to set cut scores. For example, if a grade had 100,000 scale scores and those scores were distributed from lowest to highest, one would count up 8,220 (8.22%) scores from the bottom and then locate the cut-off score between Level I and Level II. Counting up the next 24,960 scores would provide the cut-off between Levels II and III. Counting up the next 43,600 scores would provide the cut-off between Levels III and IV. It should be noted that to avoid an inflation of children categorized as Level IV, the percentage categorized as “No Clear Category” are removed from the cut score calculations. This process occurred at each grade for the NC EOG Reading Comprehension Tests. Since the administration of the first edition (1992) and the re-norming year (1998), the proportions of students in Level I have continued to decrease and the proportions of students in Levels III and IV have continued to increase. For example, from 1999 to 2000, 2% fewer children were in Level I than the year before. From 2000 to 2001 there were 1.8% fewer children in Level I than from 1999 to 2000. To continue this trend, it was anticipated that a similar percentage of fewer children would be in Level I from 2001 to 2002. Rather than develop new standards for the second edition of the NC EOG Tests of Reading comprehension, which would disrupt the continuous measure of academic progress for students, the standards for the second edition were established by maintaining the historical trends mentioned above while making use of the equated scales. In contrast, a NC SBE mandate in 2006 set the expectation that cut scores on the third edition NC EOG Reading Comprehension Tests would be more rigorous. The typical process of analyzing teacher judgments regarding student achievement produced the results for contrasting groups shown in the table below.

30
Table 7: Percentages of contrasting-groups classifications
Level I Level II Level III Level IV Percent Proficient
Grade 3 Pretest Contrasting Groups % 5.64 22.41 52.27 19.68 71.95 Score Ranges ≤ 305 306-316 317-339 ≥340 Approx Raw Score 0-6 7-11 12-23 24-31 Grade 3 Contrasting Groups % 4.65 20.64 50.02 24.72 74.74 Score Ranges ≤ 317 318-330 331-347 ≥ 348 Approx Raw Score 0–14 15–25 26–42 43–50 Grade 4 Contrasting Groups % 3.97 19.35 47.85 28.83 76.68 Score Ranges ≤ 326 327-337 338-351 ≥ 352 Approx Raw Score 0–14 16–25 24–41 42–50 Grade 5 Contrasting Groups % 3.38 16.54 46.78 33.34 80.12 Score Ranges ≤ 332 333-341 342-354 ≥ 355 Approx Raw Score 0–14 15–23 24–37 38–50 Grade 6 Contrasting Groups % 2.99 17.11 46.70 33.19 79.89 Score Ranges ≤ 334 335-344 345-357 ≥ 358 Approx Raw Score 0–14 15–24 25–40 41–53 Grade 7 Contrasting Groups % 3.72 18.82 45.76 31.70 77.46 Score Ranges ≤ 338 339-348 349-360 ≥ 361 Approx Raw Score 0–16 17–27 28–41 42–53 Grade 8 Contrasting Groups % 3.21 16.28 42.42 38.10 80.52 Score Ranges ≤ 341 342-350 351-361 ≥ 362 Approx Raw Score 0–15 16–25 26–38 39–53
The contrasting groups results mirror the percent proficient observed in the state over the past several years. As mentioned previously, the percentage of students scoring proficient has continuously increased over the years. Much dialogue occurred internal to the NCDPI regarding the possible reasons behind the contrasting groups results. Because the contrasting groups results often result from hastily answered survey questions from which teachers have little information

31
to base decisions on, the NCDPI always supplements this method with a test-based method of standard setting, typically the Bookmark Method. 4.4 Bookmark Standard Setting Process and Results The standard setting workshop for the North Carolina EOG Reading assessments was conducted September 3–5, 2008, in Raleigh, NC. There were two goals of this workshop. The first goal was to produce a set of recommended achievement level descriptors that provided a summary of the expected knowledge, skills, and abilities of students with each achievement level. The second goal was to elicit recommended cut scores that define the expected performance for students within each achievement level. The recommended range of cut scores is based on the Bookmark Method (Lewis, Green, Mitzel, Baum, & Patz, 1996). The Bookmark Method uses expert judges to examine items on the test and estimate how a typical student on the border between two levels of proficiency will likely perform on that item. Items are ordered from least difficult to most difficult and compiled into a booklet. Item difficulties, used to order the items, were estimated from the operational test administrations conducted during the spring of 2008 using a three-parameter model for multiple-choice items with guessing factored out. The NCDPI selected multiple-choice items for each grade level from multiple forms of the test that represented a range of the item difficulty spectrum that were located at the point where students had a 0.67 probability of success on the item. This response probability (RP) criterion is consistent with recommendations by Huynh (1998, 2006). The process began with grade-level panels working together to establish agreed upon distinctions between achievement levels. Specifically, each panelist was asked to create a list of the expected knowledge, skills, and abilities of the target students based on the achievement level descriptors. In this study, the target students were defined as “Barely Level II,” “Barely Level III,” and “Barely Level IV.” The grade-level facilitators led the panelists through a process whereby they combined their lists to create one panel list of the expected knowledge, skills, and abilities for each target student. The final descriptions of the target students were recorded on a document along with the achievement level descriptors. Transcribed copies of this document were provided for each panelist for their reference throughout the standard setting process. Panelists then took their respective examination without the answer key. This exposed panelists to the range of content and item difficulty found in the item bank. After all panelists had taken the test independently, they discussed the test items within their groups and focused on identifying what knowledge, skills, and abilities were required to answer each item and what made each item more difficult than the previous. The next step in the process was for panelists to place their first found of bookmarks. Using the target student descriptors as a reference point, each panelist began with the easiest item and moved through the booklet until the panelist found the place where the barely level III student would likely (with at least a two-thirds probability) answer the collection of items up to that point correct. The panelist placed a bookmark at the point that distinguishes between Level III and Level II students. This process was repeated for the other two target students (Barely Level

32
II, Barely Level IV). Panelists then shared and discussed their bookmark placements within their groups. After having seen and discussed the information, panelists made their second round bookmark placement. The feedback from the second round included the median bookmark placement for each table, the panel median, the equivalent scale score, and the impact if the median bookmark placements were used (percent of students within each achievement level). Each group leader summarized the discussion their group had regarding the expectations for performance for each target student. After this discussion, panelists were asked to make a third and final round of bookmark placements. The cut score recommendations are based on the third round bookmark placements. A given cut score is determined for each panelist by translating the median ordered item booklet page number into the corresponding theta location and finding the associated scale score value. The final activity for all panelists was the completion of an evaluation form designed to measure the level confidence in the standard setting activities and their cut score recommendations. Table 8 below presents the results from the final round of bookmark placements along with the impact data. The final step in the standard setting workshop was for the group leaders across grade levels to discuss the round 3 results of the standard setting as part of the vertical moderation activity. As a collection, the group leaders were presented with the information presented in Table 8. This discussion centered around the expectation of vertical articulation of cut scores when a vertical scale underlies the measurement construct. Figure 4 presents the cut scores and average performance across grades as a graphic presentation of the vertical articulation of performance and cut scores. Table 8: Percentages of bookmark classifications
Level
I Level
II Level
III Level
IV Percent
Proficient
Grade 3 Pretest Bookmark % 41.70 28.77 20.92 8.61 29.53 Score Ranges ≤ 323 324-334 335-345 ≥ 346 Approx Raw Score 0-14 15-20 21-26 27-31 Grade 3 Bookmark % 25.26 19.08 36.19 19347 56.00 Score Ranges ≤ 330 331-337 338-349 ≥ 350 Approx Raw Score 0–25 26–33 34–43 44–50 Grade 4 Bookmark % 15.86 23.51 38.70 21.93 61.00 Score Ranges ≤ 334 335-342 343-353 ≥ 354 Approx Raw Score 0–22 23–31 32–42 43–50 Grade 5 Bookmark % 17.46 25.66 42.99 13.93 57.00

33
Score Ranges ≤ 340 341-348 349-360 ≥ 361 Approx Raw Score 0–22 23–31 32–43 44–50 Grade 6 Bookmark % 20.11 19.29 41.07 19.53 61.00 Score Ranges ≤ 344 345-350 351-361 ≥ 362 Approx Raw Score 0–24 25–31 32–44 45–53 Grade 7 Bookmark % 20.21 27.24 28.10 23.94 52.00 Score Ranges ≤ 347 348-355 356-362 ≥ 363 Approx Raw Score 0–26 27–37 38–43 44–53 Grade 8 Bookmark % 17.20 27.68 44.27 10.86 55.00 Score Ranges ≤ 349 350-357 358-369 ≥ 370 Approx Raw Score 0–24 25–33 34–46 47–53
Figure 4: Vertical articulation of cut scores overlaid onto average performance
310
320
330
340
350
360
370
380
3 4 5 6 7 8
Mean Scale Score Level II Level III Level IV
The achievement level score ranges adopted by the SBE per policy HSP-C-018 for the NC Reading Comprehension Tests are provided below. Table 9: SBE Policy HSP-C-018

34
Grade Level I Level II Level III Level IV 3 Pre ≤ 323 324-334 335-345 ≥ 346
3 ≤ 330 331-337 338-349 ≥ 350 4 ≤ 334 335-342 343-353 ≥ 354 5 ≤ 340 341-348 349-360 ≥ 361 6 ≤ 344 345-350 351-360 ≥ 362 7 ≤ 347 348-355 356-362 ≥ 363 8 ≤ 349 350-357 358-369 ≥ 370
4.5 Achievement Level Descriptors The four achievement levels in the NC Student Accountability System are operationally defined below. These represent the general knowledge and skill set expected of a student performing at each level. Specific achievement level descriptors aligned to each grade are presented in Appendix B. Table 10: SBE Policy HSP-N-002
4.5 Achievement Level Trends The percentage of students in each of the achievement levels is provided below by grade. A star indicates each new edition of the reading test. Table 11: Achievement level trends for Grade 3 Pretest
3 Pre 2000 2001 2002* 2003 2004 2005 2006 2007 2008*Level I 9.1 8.2 7.5 7.4 7.1 7.3 6.4 6.3 41.70Level II 21.1 20.6 19.7 19.7 18.8 18.5 16.7 18.7 28.77Level III 41.3 42.7 42.7 43.9 43.8 43.1 42.9 42.0 20.92Level IV 28.5 28.5 30.1 29.0 30.3 31.1 34.0 33.0 8.61
Table 12: Achievement level trends for Grade 3
Grade 3 2000 2001 2002 2003* 2004 2005 2006 2007 2008*Level I 6.2 5.7 4.2 3.9 3.7 3.3 2.7 2.7 25.3 Level II 19.4 17.9 16.0 13.5 12.9 13.3 12.4 13.0 19.1 Level III 38.0 38.4 38.8 37.1 36.9 36.9 36.8 37.6 36.2
Achievement Levels for the North Carolina Statewide Testing Program Level I Students performing at this level do not have sufficient mastery of
knowledge and skills in this subject area to be successful at the next grade level.
Level II Students performing at this level demonstrate inconsistent mastery of knowledge and skills that are fundamental in this subject area and that are minimally sufficient to be successful at the next grade level.
Level III Students performing at this level consistently demonstrate mastery of grade level subject matter and skills and are well prepared for the next grade level.
Level IV Students performing at this level consistently perform in a superior manner clearly beyond that required to be proficient at grade level work.

35
Level IV 36.4 38.0 41.0 45.5 46.5 46.5 48.2 46.2 19.5 Table 13: Achievement level trends for Grade 4
Grade 4 2000 2001 2002 2003* 2004 2005 2006 2007 2008*Level I 7.0 6.1 4.7 4.2 4.2 3.8 3.5 2.7 15.9 Level II 21.0 19.4 18.2 12.0 12.1 12.7 11.1 9.7 23.5 Level III 42.3 43.2 44.7 41.9 41.9 41.6 39.6 39.7 38.7 Level IV 29.7 31.3 32.4 41.8 41.8 41.9 45.8 47.9 21.9
Table 14: Achievement level trends for Grade 5
Grade 5 2000 2001 2002 2003* 2004 2005 2006 2007 2008*Level I 4.4 3.4 2.7 1.8 1.8 1.4 1.3 1.2 17.5 Level II 16.6 13.9 12.8 9.5 38.7 8.5 8.2 7.1 25.7 Level III 41.0 43.2 44.5 45.0 45.2 45.5 47.0 44.8 43.0 Level IV 38.1 39.4 40.0 43.7 44.3 44.6 43.5 46.9 14.0
Table 15: Achievement level trends for Grade 6
Grade 6 2000 2001 2002 2003* 2004 2005 2006 2007 2008*Level I 4.1 3.3 2.2 1.7 3.8 3.0 2.8 2.4 20.1 Level II 14.9 13.8 11.4 8.2 15.4 14.8 14.1 13.2 19.3 Level III 38.1 40.5 39.2 34.5 50.7 51.6 51.8 51.5 41.1 Level IV 42.9 42.4 47.2 55.6 30.1 30.6 31.3 33.0 19.5
Table 16: Achievement level trends for Grade 7
Grade 7 2000 2001 2002 2003* 2004 2005 2006 2007 2008*Level I 4.5 3.2 2.7 2.9 3.1 2.9 2.3 2.1 20.2 Level II 14.8 15.5 14.0 13.3 11.0 11.0 9.6 9.4 27.2 Level III 35.1 33.3 32.4 31.1 41.1 41.5 41.8 42.2 28.1 Level IV 45.6 48.0 50.9 52.7 44.7 44.6 46.3 46.3 23.9
Table 17: Achievement level trends for Grade 8
Grade 8 2000 2001 2002 2003 2004 2005 2006 2007 2008*Level I 4.8 5.3 4.2 4.5 2.3 1.9 1.7 1.3 17.2 Level II 14.6 15.2 13.5 11.3 9.0 9.2 9.7 8.9 27.7 Level III 36.5 36.8 35.7 34.1 41.7 42.6 43.4 42.9 44.3 Level IV 44.1 42.7 46.6 50.1 46.9 46.4 45.1 46.9 10.9
4.6 Percentile Ranking The percentile rank for each scale score is the percentage of scores less than or equal to that score. If the percentile formula is applied to the frequency distribution of scores for grade three reading, then a score of 340 would have a percentile rank of 54. Fifty-four percent of students scored at or below a score of 340. The percentile rank provides information about a student’s score on a test relative to

36
other students in the norming year. The percentile ranks for the scores on the NC EOG Tests of Reading Comprehension were calculated based on the 2008 administration of the tests.

37
Chapter Five: Reports The NC Statewide Testing Program provides reports at the student level, school level, and state level. The NC Testing Code of Ethics dictates that educators use test scores and reports appropriately. This means that educators recognize that a test score is only one piece of information and must be interpreted together with other scores and indicators. Score reports are generated at the local level to depict achievement for individual students, classrooms, schools, and local education agencies (LEAs). Test data help educators understand educational patterns and practices. Data analysis of test scores for decision-making purposes should be based upon dissagregation of data by student demographics and other student variables as well as an examination of grading practices in relation to test scores, growth trends, and goal summaries for state-mandated tests. Demographic data are reported on variables such as free/reduced lunch status, LEP status, migrant status, Title I status, disability status, and parents’ levels of education. The results are reported in aggregate at the state level usually at the end of June of each year. The NCDPI uses these data for school accountability and to satisfy other federal requirements such as Adequate Yearly Progress (AYP). 5.1 Reporting by Student The state provides scoring equipment in each school system so that administrators can score all state-required multiple-choice tests. This scoring generally takes place within two weeks after testing so the individual score report can be given to the student and parent before the end of the school year. Each student in grades 3–8 who takes the EOG tests is given a “Parent/Teacher Report.” This single sheet provides information on that student’s performance on the reading and mathematics tests. A flyer titled, “Understanding the Individual Student Report,” is provided with each “Parent/Teacher Report.” This publication offers information for understanding student scores as well as suggestions on what parents and teachers can do to help students in the areas of reading and mathematics. The student report also shows how that student’s performance compared to the average scores for the school, the school system and the state. A four-level achievement scale is used for the tests (as stated in SBE Policy HSP-N-002):
(a) “Level I” shall mean that the student fails to achieve at a basic level. Students performing at this level do not have sufficient mastery of knowledge and skills in this subject area to be successful at the next grade level.
(b) “Level II” shall mean that the student achieves at a basic level. Students performing at this level demonstrate inconsistent mastery of knowledge and skills in this subject area and are minimally prepared to be successful at the next grade level.
(c) “Level III” shall mean that the student achieves at a proficient level. Students performing at this level consistently demonstrate mastery of grade level subject matter and skills and are well prepared for the next grade level.

38
(d) “Level IV” shall mean that the student achieves at an advanced level. Students performing at this level consistently perform in a superior manner clearly beyond that required to be proficient at grade level work.
Students achieving at Level III or Level IV are considered to be at or above grade level. Achievement Level III is the level students must score to be considered proficient and to pass to the next grade under state Student Accountability Standards for grades 3, 5, and 8. 5.2 Reporting by School Since 1997, the student performance on EOG tests for each elementary and middle school has been released by the state through the ABCs School Accountability system. For each school, parents and others can see the actual performance for groups of students at the school in reading, mathematics, and writing; the percentage of students tested; whether the school met or exceeded goals that were set for it; and the status designated by the state. Some schools that do not meet their goals and that have low numbers of students performing at grade level receive help from the state. Other schools, where goals have been reached or exceeded, receive bonuses for the certified staff and teacher assistants in that school. Local school systems received their first results under No Child Left Behind (NCLB) in July 2003. Under NCLB, each school is evaluated according to whether or not it met Adequate Yearly Progress (AYP). AYP is not only a goal for the school overall, but also for each subgroup of students in the school. Every subgroup must meet its goal for the school to meet AYP. AYP is only one part of the state’s ABCs accountability model. Complete ABCs results are released each September and show how much growth students in every school made as well as the overall percentage of students who are proficient. The ABCs report is available on the Department of Public Instruction Web site at http://abcs.ncpublicschools.org/abcs/. School principals also can provide information about the ABCs report to parents. 5.3 Reporting by the State The NCDPI reports information on student performance in various ways. The NC Report Cards provide information about K–12 public schools (including charter and alternative schools) at the school, system, and state level. Each report card includes a school or district profile and information about student performance, safe schools, access to technology, and teacher quality. As a participating state in the National Assessment of Educational Progress (NAEP), NC student performance is included in annual reports released nationally on selected subjects. The state also releases state and local SAT scores each summer.

39
Chapter Six: Descriptive Statistics and Reliability The third edition of the NC EOG Reading Comprehension Tests was administered for the first time in the spring 2008. Descriptive statistics for the first operational year are provided below along with population demographics. Table 18: Descriptive statistics by grade for the first operational administration of the NC Reading Comprehension Tests
Grade N Mean Standard Deviation
3 Pre 110,932 326.62 13.48 3 110,942 338.65 12.57 4 107,061 345.25 10.79 5 105,398 349.98 10.00 6 103,625 352.87 10.12 7 105,188 355.63 9.79 8 106,561 358.36 9.49
Table 19: Population demographics for the first operational administration of the NC Reading Comprehension Tests
Grade (%)
Subgroup 3Pre 3 4 5 6 7 8 Male 50.86 50.34 50.45 50.36 50.56 50.94 50.53 Female 49.14 49.66 49.55 49.64 49.44 49.06 49.47 Asian 2.51 2.29 2.39 2.46 2.37 2.20 2.27 African American 26.37 26.75 26.23 26.96 27.29 28.15 29.04
Hispanic 12.02 11.19 10.60 9.97 9.74 9.06 8.44 American Indian 1.55 1.44 1.46 1.37 1.46 1.39 1.42
Multiracial 4.58 4.29 3.98 3.77 3.49 3.23 2.88 White 52.97 54.03 55.35 55.46 55.66 55.97 55.95
6.1 Scale Score Frequency Distributions The following illustrations present the frequency distributions of the developmental scale scores from the first operational administration of the third edition NC EOG Reading Comprehension Tests. The frequency distributions are not smooth because of the conversion from raw scores to scales scores. Due to rounding in the conversion process, sometimes two raw scores in the middle of the distribution convert to the same scale score resulting in the appearance of a “spike” in that particular scale score. Figure 5: 2009 Grade 3 Pretest Reading Frequency Distribution

40
Figure 6: 2008 Grade 3 Reading Frequency Distribution
Frequency Distribution
0
500
1000
1500
2000
2500
3000
3500
4000
4500
302
305
308
311
314
317
320
323
326
329
332
335
338
341
344
347
350
353
357
362
367
Scale Score
Freq
uenc
y
Figure 7: 2008 Grade 4 Reading Frequency Distribution

41
Frequency Distribution
0
500
1000
1500
2000
2500
3000
3500
4000
4500
313
317
320
323
326
329
332
335
338
341
344
347
350
353
356
359
362
366
Scale Score
Freq
uenc
y
Figure 8: 2008 Grade 5 Reading Frequency Distribution
Frequency Distribution
0
500
1000
1500
2000
2500
3000
3500
4000
4500
5000
5500
319
322
325
328
331
334
337
340
343
346
349
352
355
358
361
364
367
370
374
Scale Score
Freq
uenc
y
Figure 9: 2008 Grade 6 Reading Frequency Distribution
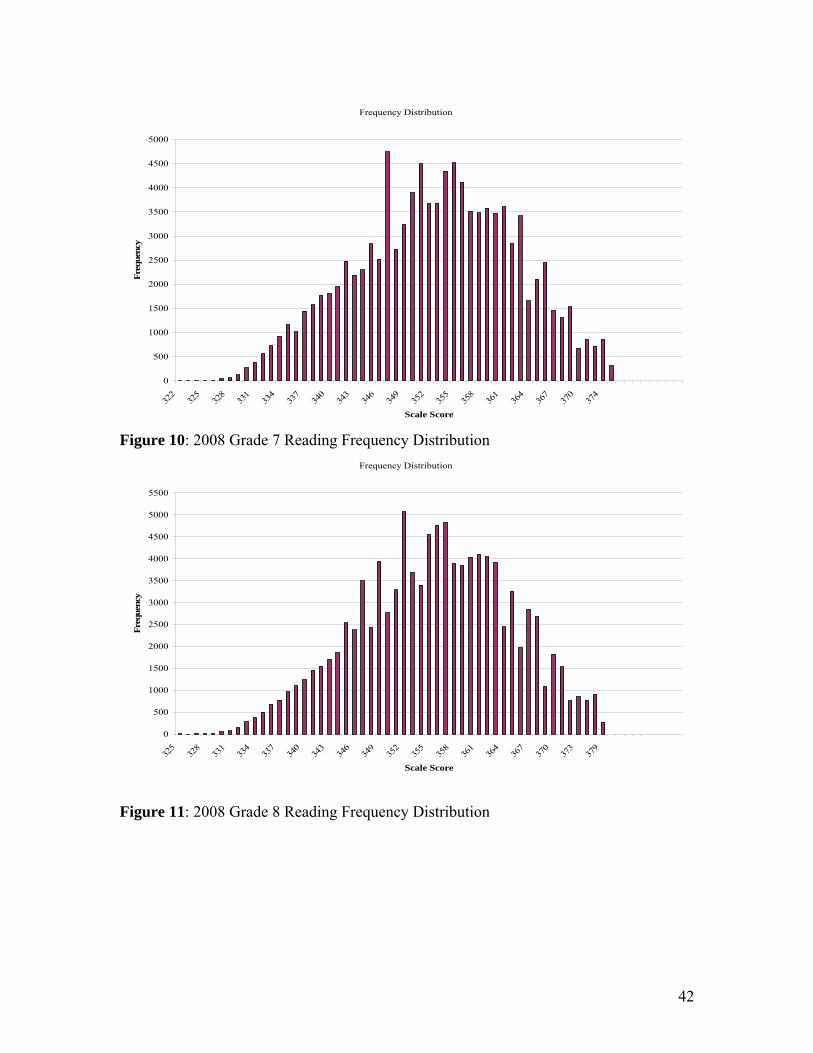
42
Frequency Distribution
0
500
1000
1500
2000
2500
3000
3500
4000
4500
5000
322
325
328
331
334
337
340
343
346
349
352
355
358
361
364
367
370
374
Scale Score
Freq
uenc
y
Figure 10: 2008 Grade 7 Reading Frequency Distribution
Frequency Distribution
0
500
1000
1500
2000
2500
3000
3500
4000
4500
5000
5500
325
328
331
334
337
340
343
346
349
352
355
358
361
364
367
370
373
379
Scale Score
Freq
uenc
y
Figure 11: 2008 Grade 8 Reading Frequency Distribution

43
Frequency Distribution
0
500
1000
1500
2000
2500
3000
3500
4000
4500
5000
5500
327
330
333
336
339
342
345
348
351
354
357
360
363
366
369
372
375
378
381
384
Scale Score
Freq
uenc
y
6.2 Reliability of the North Carolina Reading Tests Reliability refers to the consistency of a measure when the testing procedure is repeated on a population of individuals or groups. Three broad categories of reliability coefficients are recognized as appropriate indices for establishing reliability in tests: (a) coefficients derived from the administration of parallel forms in independent testing sessions (alternate-form coefficients); (b) coefficients obtained by administration of the same instrument on separate occasions (test-retest coefficients); and (c) coefficients based on the relationships among scores derived from individual items or subsets of the items within a test, all data accruing from a single administration of the test (internal consistency coefficients). The internal consistency coefficient is the statistic used to quantify reliability for the NC EOG Reading Comprehension Tests. 6.3 Internal Consistency of the North Carolina Reading Tests Internal-consistency reliability estimates examine the extent to which items on a test are related. One procedure for determining the internal consistency of a test is coefficient alpha (α). Coefficient alpha sets an upper limit for reliability of test scores constructed in terms of the domain sampling model. The formula for coefficient alpha is (Traub, 1994):
where rxx = Coefficient alpha N = Number of items constituting the instrument S2 = Variance of the summated scale scores Σs 2
i = The sum of the variances of the individual items that constitute the scale
S2 - xx
N r N — 1 S2=∑s2

44
If any use is to be made of the information from a test, then test scores must be reliable. The NC Statewide Testing Program follows industry standards and maintains a reliability coefficient of at least 0.85 on multiple-choice tests. The following table presents the coefficient alpha indices averaged across forms by grade. Table 20: Average reliability indices
Grade Coefficient Alpha 3 Pre 0.875
3 0.925 4 0.912 5 0.900 6 0.914 7 0.908 8 0.897
As noted above, the NC EOG Reading Comprehension Tests are highly reliable as a whole. In addition, it is important to note that this high degree of reliability extends across gender and ethnicity. Although results are not displayed here, critical examination of reliability by primary language and disability disaggregation also reveals high reliability coefficients. The following tables provide a breakdown of coefficient alphas by grade and group for the tests given operationally during the most recent year the form was given. Table 21: Reliability indexes averaged across forms
Grade Females Males 3 Pre 0.873 0.873
3 0.923 0.927 4 0.908 0.916 5 0.896 0.903 6 0.910 0.916 7 0.904 0.911 8 0.893 0.901
Table 22: Reliability indexes averaged across forms for most recent operational year
Grade Asian Black Hispanic American Indian Multi White
3 Pre 0.885 0.828 0.813 0.839 0.865 0.878 3 0.926 0.906 0.909 0.911 0.917 0.918 4 0.916 0.887 0.894 0.896 0.905 0.904 5 0.906 0.873 0.882 0.876 0.892 0.891 6 0.921 0.888 0.896 0.897 0.906 0.907 7 0.910 0.884 0.896 0.897 0.901 0.900 8 0.903 0.866 0.891 0.881 0.883 0.885
6.4 Standard Error of Measurement The information provided by the standard error of measurement for a given score is important because it assists in determining the accuracy of an examinee’s obtained score. It allows a

45
probabilistic statement to be made about an individual’s test score. For example, if a score of 100 has an SEM of plus or minus 2, then one can conclude that a student obtained a score of 100, which is accurate within plus or minus 2 points with a 68% confidence. In other words, a 68% confidence interval for a score of 100 is 98–102. If that student were to be retested, his or her score would be expected to be in the range of 98–102 about 68% of the time. The standard error of measurement ranges for scores on the NC EOG Reading Comprehension Tests are provided below. For students with scores within two standard deviations of the mean (95% of the students), standard errors are typically 3 to 4 points. Students with scores that fall outside of two standard deviations (above the 97.5 percentile and below the 2.5 percentile) have standard errors of measurement of approximately 5 to 6 points. This is typical as scores become more extreme due to less measurement precision associated with those extreme scores. Table 23: Ranges of standard error of measurement for scale scores by grade.
Grade Standard Error of Measurement (Range)
3 Pre 4-8 3 3-6 4 3-6 5 3-5 6 3-5 7 3-5 8 3-5
In addition to the standard error of measurement as defined through classical test theory, the standard error of measurement as assessed through IRT was also evaluated as evidence of the reliability of the NC EOG Reading Comprehension Tests. Whereas the classical definition of standard error of measurement presumes the standard error is the same regardless of where the student falls on score level, the IRT definition does not make this assumption. The IRT-based standard error curves are presented in the following figures. These are presented on a (0, 1) on the x-axis representing the θ estimates for examinees.

46
Figure 12: SEMs Grade 3 Reading Pretest

47
Figure 13: SEMs Grade 3 Reading

48
Figure 14: SEMs Grade 4 Reading

49
Figure 15: SEMs Grade 5 Reading

50
Figure 16: SEMs Grade 6 Reading

51
Figure 17: SEMs Grade 7 Reading

52
Figure 18: SEMs Grade 8 Reading
6.5 Equivalency of Test Forms NC administers multiple forms of each test per testing cycle. This serves several purposes. First, it allows NC to fully test the breadth and depth of each curriculum. The curricula are extremely rich and administering a single form that fully addressed each competency would be prohibitively long. Additionally, the use of multiple forms reduces the incidence of one student copying from the test of another student. The tests are parallel in terms of content coverage at the goal level. That is, each form of the EOG Reading Comprehension Test contains approximately the same number of items from each curriculum goal as every other form. The tests are pre-equated based on field test statistics and are equivalent at the total test score level. However, they are not equivalent at the goal or objective level as each goal contains a random domain sampling of items in order to ensure content coverage. In addition, because authentic selections are used, there is some variability in the number and types of questions that are asked for each selection since not all selections lend themselves to the same type of question. The graphs below illustrate the equivalency of the tests by presenting the test characteristic curves for each form at each grade. The test characteristic curve represents the sum of all the item characteristic curves and should be as similar as possible for equivalent forms. Figures 19–25 present the test characteristic curves for the NC EOG Reading Comprehension Tests. Figure 19: Test Characteristic Curves Grade 3 Reading Pretest

53
Figure 20: Test Characteristic Curves Grade 3 Reading

54
Figure 21: Test Characteristic Curves Grade 4 Reading

55
Figure 22: Test Characteristic Curves Grade 5 Reading

56
Figure 23: Test Characteristic Curves Grade 6 Reading

57
Figure 24: Test Characteristic Curves Grade 7 Reading
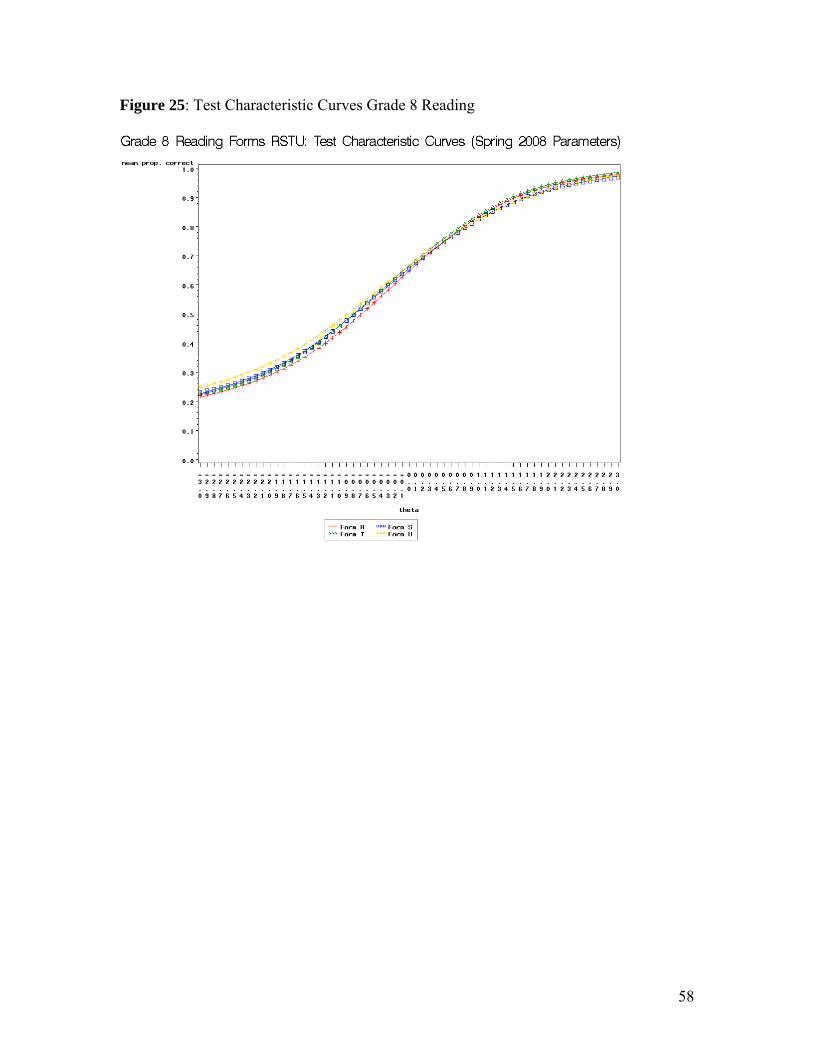
58
Figure 25: Test Characteristic Curves Grade 8 Reading

59
Chapter Seven: Validity Validity refers to the degree to which evidence and theory support the interpretation of test scores. Validity provides a check on how well a test fulfills its function. For all forms of test development, validity is an issue to be addressed from the first stage of development through analysis and reporting of scores. The process of validation involves accumulating evidence to provide a sound scientific basis for the proposed test score interpretations. Validation, when possible, should include several types of evidence and the quality of the evidence is of primary importance (AERA, APA, NCME, 1995). For the NC EOG Reading Comprehension Tests, evidence of validity is provided through content relevance, response processes, relationship of test scores to other external variables, and maintaining consistency in the testing environment. 7.1 Content Validity Evidence of content validity begins with an explicit statement of the constructs or concepts being measured by the proposed test. Interpretation of test scores refers to constructs or concepts the test is proposed to measure. All items developed for the EOG are done so to measure the goals and objectives as specified in the NCSCS with particular focus on assessing students’ ability to process information and engage in higher order thinking. The tables below provide the major goals measured by each of the NC EOG Reading Comprehension Tests and the percentage of items by each goal. Table 24: Grade 3 Reading Goal Specifications
Grade 3 Average Number of Items per Form
Average Percentage of Items Per Form
Goal 1 3.33 6.66 Goal 2 34.67 69.34 Goal 3 12.00 24.00 Totals 50 100.00
Table 25: Grade 4 Reading Goal Specifications
Grade 4 Average Number of Items per Form
Average Percentage of Items Per Form
Goal 1 2.33 4.66 Goal 2 33.00 66.00 Goal 3 14.67 29.34 Totals 50 100
Table 26: Grade 5 Reading Goal Specifications
Grade 5 Average Number of Items per Form
Average Percentage of Items Per Form
Goal 1 3.67 7.34 Goal 2 31.67 63.34 Goal 3 14.67 29.34 Totals 50 100
Table 27: Grade 6 Reading Goal Specifications

60
Grade 6 Average Number of Items per Form
Average Percentage of Items Per Form
Goal 1 4.33 7.73 Goal 2 10.33 18.45 Goal 3 3.00 5.36 Goal 4 5.33 9.52 Goal 5 26.00 46.43 Goal 6 4.00 7.14 Totals 56 100%
Table 28: Grade 7 Reading Goal Specifications
Grade 7 Average Number of Items per Form
Average Percentage of Items Per Form
Goal 1 4.33 7.73 Goal 2 10.66 19.04 Goal 3 2.67 4.77 Goal 4 7.33 13.09 Goal 5 25.00 44.64 Goal 6 3.00 5.36 Totals 56 100%
Table 29: Grade 8 Reading Goal Specifications
Grade 8 Average Number of Items per Form
Average Percentage of Items Per Form
Goal 1 3.25 5.80 Goal 2 10.75 19.20 Goal 3 2.00 3.57 Goal 4 10.00 17.86 Goal 5 23.25 41.52 Goal 6 3.75 6.70 Totals 56 100%
Content validity is further evidenced through the item development process. As previously discussed in section 2.4, the items are written by NC teachers familiar with the content standards. Items are also reviewed by additional teachers to ensure alignment to the content standards. Additionally, items are also approved by internal staff, including content test development staff and curriculum representatives, prior to placement on a test. The tests are further reviewed by both teachers and internal consultants for content coverage, to ensure that the tests are reflective not just of the curriculum but are also reflective of what is taught in the classroom. 7.2 Instructional Validity As a part of the test development process, the NCDPI routinely administers questionnaires to teachers in order to evaluate the validity and appropriateness of the NC EOG Reading Comprehension Tests. At the form review level, teachers are asked to respond to the following questions. In addition to the specific questions below, they are also asked to provide any

61
additional comments they feel are necessary. These comments are reviewed and evaluated during the test development process to ensure the appropriateness of the assembled operational forms. Overall, the comments were positive across grades; however, in instances where concerns were raised, additional scrutiny by TD staff was given to ensure appropriateness. The process for reviewing comments involves Test Development content staff and psychometricians wherein every comment is reviewed and every item for which a comment has been made is reviewed.
(1) If the content of these forms DOES NOT reflect the goals and objectives of the curriculum as outlined on the list of objectives, please explain.
(2) If the content of these forms DOES NOT reflect the goals and objectives of the curriculum as it is taught in your school or school system, please explain.
(3) If the content of these forms IS NOT balanced in relation to ethnicity, race, sex, socioeconomic status, or limited English proficiency, please explain.
7.3 Criterion-Related Validity Analysis of the relationship between test scores and variables external to the test provide another important source of validity evidence. External variables may include measures of some criteria that the test is expected to predict, as well as relationships to other tests hypothesized to measure the same constructs. Criterion-related validity of a test indicates the effectiveness of a test in predicting an individual’s behavior in a specific situation. The criterion for evaluating the performance of a test can be measured at the same time (concurrent validity) or at some later time (predictive validity). For the NC EOG Reading Comprehension Tests, teachers’ judgments of student achievement, expected grade, and test score all serve as sources of evidence of concurrent validity. The Pearson correlation coefficient is used to provide a measure of association between the scale score and those variables listed above. The correlation coefficients for the NC EOG Reading Comprehension Tests range from 0.50 to 0.69, indicating a moderate to strong correlation between scale scores and external variables. Table 30: Validity correlations Variables 3 Pre 3 4 5 6 7 8 Predicted Grade by Raw Score 0.66 0.63 0.61 0.56 0.52 0.50
Predicted Achievement by Raw Score 0.69 0.68 0.67 0.66 0.63 0.64
The variables used in the tables above are as follows:
• Teacher Judgment of Achievement: Teachers were asked, for each student participating in the test, to evaluate the student’s absolute ability, external to the test, based on their knowledge of their students’ achievement. The categories that teachers could use correspond to the achievement level descriptors mentioned previously on page 27.
• Expected Grade: Teachers were also asked to provide for each student the letter grade that they anticipated each student would receive at the end of the grade or course.
• Raw Score: The raw score obtained by each examinee.

62
The NCDPI found moderate to strong correlations between scores in reading and variables such as teachers’ judgment of student achievement and expected grade. The NCDPI also found generally low correlations among these scores and variables external to the test such as gender, limited English proficiency, and disability for grades 3 through 8. The correlations between scores and gender or limited English proficient were less extreme than ± 0.10, and most of the correlations between scores and disability status were less extreme than ± 0.30. None of these relationships approached the levels recorded for the selected measures of concurrent validity. These generalizations held across the full range of forms administered by the NCDPI for all the grades and subject areas.

63
Chapter Eight: Quality Control Procedures Quality control procedures for the NC Statewide Testing Program are implemented throughout all stages of testing. This includes quality control for test development, test administration, score analysis, and reporting. 8.1 Quality Control Prior to Test Administration Once test forms have been assembled, they are reviewed by a panel of subject experts. Once the review panel has approved a test form, test forms are then configured to go through the printing process. Printers send a proof form back to the NCDPI Test Development staff to review and adjust if necessary. Once all test answer sheets and booklets are printed, the test project manager conducts a spot check of test booklets to ensure that all test pages are included and test items are in order. 8.2 Quality Control in Data Preparation and Test Administration Student background information must be coded before testing begins. The school system may elect to either: (1) precode the answer sheets, (2) direct the test administrator to code the Student Background Information, or (3) direct the students to code the Student Background Information. The school system may elect to precode some or all of the Student Background Information on SIDE 1 of the printed multiple-choice answer sheet. The precoded responses come from the schools’ electronic SIMS/NC WISE database. Precoded answer sheets provide schools with the opportunity to correct or update information in the SIMS/NC WISE database. In such cases, the test administrator ensures that the precoded information is accurate. The test administrator must know what information will be precoded on the student answer sheets to prepare for the test administration. Directions for instructing students to check the accuracy of these responses are located in test administrator manuals. All corrections for precoded responses are provided to a person designated by the school system test coordinator to make such corrections. The students and the test administrator must not change, alter, or erase precoding on students’ answer sheets. To ensure that all students participate in the required tests and to eliminate duplications, students, regardless of whether they take the multiple-choice test or an alternate assessment, are required to complete the Student Background Information on the answer sheets. When tests and answer sheets are received by the local schools, they are kept in a locked, secure location. Class rosters are reviewed for accuracy by the test administrator to ensure that students receive their answer sheets. During test administration at the school level, proctors and test administrators circulate throughout the test facility (typically a classroom) to ensure that students are using the bubble sheets correctly. Once students have completed their tests, answer sheets are reviewed and, where appropriate, cleaned by local test coordinators (removal of stray marks, etc.). 8.3 Quality Control in Data Input All answer sheets are sent from individual schools to the Local Test Coordinator, where they are scanned in a secure facility. The use of a scanner provides the opportunity to program in a number of quality control mechanisms to ensure that errors overlooked in the manual check of data are identified and resolved. For example, if the answer sheet is unreadable by the scanner, the scanner stops the scan process until the error is resolved. In addition, if a student bubbles in

64
two answers for the same question, the scan records the student’s answer as a (*) indicating that the student has answered twice. 8.4 Quality Control of Test Scores Once all tests are scanned, they are sent through a secure system to the Regional Accountability Coordinators who check to ensure that all schools in all LEAs have completed and returned student test scores. The Regional Accountability Coordinators also conduct a spot check of data and then send the data through a secure server to the NCDPI. Data are then imported into a file and cleaned. When a portion of the data is in, the NCDPI runs an answer-key-check program to flag areas where answer keys may need additional scrutiny. In addition, as data come into the NCDPI, staff import and clean data to ensure that individual student files are complete. 8.5 Quality Control in Reporting Scores can only be reported at the school level after the NCDPI issues a certification statement. This is to ensure that school-, district-, and state-level quality control procedures have been employed. The certification statement is issued by the NCDPI Division of Accountability. The following certification statement is an example: “The department hereby certifies the accuracy of the data from the NC end-of-course tests for Fall 2004 provided that all the NCDPI-directed test administration guidelines, rules, procedures, and policies have been followed at the district and schools in conducting proper test administrations and in the generation of the data. The LEAs may generate the required reports for the end-of-course tests as this completes the certification process for the EOC tests for the Fall 2004 semester.”

65
Definition of Terms The terms below are defined by their application in this document and their common uses in the NC Statewide Testing Program. Some of the terms refer to complex statistical procedures used in the process of test development. In an effort to avoid the use of excessive technical jargon, definitions have been simplified; however, they should not be considered exhaustive. Accommodations Changes made in the format or administration of the test to
provide options to test takers who are unable to take the original test under standard test conditions.
Achievement Levels Descriptions of a test taker’s competency in a particular area of knowledge or skill, usually defined as ordered categories on a continuum classified by broad ranges of performance.
Asymptote An item statistic that describes the proportion of examinees that endorsed a question correctly but did poorly on the overall test. Asymptote for a typical four choice item is 0.20 but can vary somewhat by test. (For math it is generally 0.15 and for social studies it is generally 0.22).
Biserial correlation The relationship between an item score (right or wrong) and a total test score.
Common Curriculum
Objectives that are unchanged between the old and new curricula.
Cut Scores A specific point on a score scale, such that scores at or above that point are interpreted or acted upon differently from scores below that point.
Dimensionality The extent to which a test item measures more than one ability.
Embedded test model
Using an operational test to field test new items or sections. The new items or sections are “embedded” into the new test and appear to examinees as being indistinguishable from the operational test.
Equivalent Forms Statistically insignificant differences between forms (i.e., the red form is not harder).

66
Field Test A collection of items to approximate how a test form will work. Statistics produced will be used in interpreting item behavior/performance and allow for the calibration of item parameters used in equating tests.
Foil counts Number of examinees that endorse each foil (e.g. number who answer “A,” number who answer “B,” etc.).
Item Response Theory
A method of test item analysis that takes into account the ability of the examinee and determines characteristics of the item relative to other items in the test. The NCDPI uses the 3-parameter model, which provides slope, threshold, and asymptote.
Item Tryout A collection of a limited number of items of a new type, a new format, or a new curriculum. Only a few forms are assembled to determine the performance of new items and not all objectives are tested.
Mantel-Haenszel A statistical procedure that examines the differential item functioning (DIF) or the relationship between a score on an item and the different groups answering the item (e.g. gender, race). This procedure is used to examine individual items for bias.
Operational Test Test is administered statewide with uniform procedures and full reporting of scores, and stakes for examinees and schools.
p-value Difficulty of an item defined by using the proportion of examinees who answered an item correctly.
Parallel Forms Covers the same curricular material as other forms
Percentile The score on a test below which a given percentage of scores fall.
Pilot Test Test is administered as if it were “the real thing” but has limited associated reporting or stakes for examinees or schools.
Raw score The unadjusted score on a test determined by counting the number of correct answers.
Scale score A score to which raw scores are converted by numerical transformation. Scale scores allow for comparison of different forms of the test using the same scale.

67
Slope The ability of a test item to distinguish between examinees of high and low ability.
Standard error of measurement
The standard deviation of an individual’s observed scores usually estimated from group data.
Test Blueprint The testing plan, which includes numbers of items from each objective to appear on test and arrangement of objectives.
Threshold The point on the ability scale where the probability of a correct response is fifty percent. Threshold for an item of average difficulty is 0.00.
WINSCAN Program
Proprietary computer program that contains the test answer keys and files necessary to scan and score state multiple-choice tests. Student scores and local reports can be generated immediately using the program.

68
References Camilli, G. & Shepard, L. A. (1994). Methods for Identifying Biased Test Items. Thousand
Oaks, CA: Sage Publications, Inc. Dorans, N. J. & Holland, P. W. (1993). DIF Detection and description: Mantel-Haenszel and
standardization. In P.W. Holland and H. Wainer (Eds.), Differential Item Functioning (pp 35–66). Hillsdale, NJ: Lawrence Erlbaum.
Hambleton, R. K. & Swaminathan, H. (1984). Item Response Theory: Principles and Applications. Kluwer-Nijhoff Publishing.
Hambleton, R. K., Swaminathan, H., & Rogers, H. J. (1991). Fundamentals of Item Response Theory. Newbury Park, CA: Sage Publications, Inc.
Huynh, H. (1998). On score locations of binary and partial credit items and their applications to item mapping and criterion-referenced interpretation. Journal of Educational and Behavioral Statistics, 23(19), 35–56.
Huynh, H. (2006). A Clarification on the Response Probability Criterion RP67 for Standard Settings Based on Bookmark and Item Mapping. Educational Measurement: Issues and Practice, 25(2), pp. 19–20.
Lewis, D. M., Mitzel, H. C., & Green, D. R. (1996, June) Standard setting: A bookmark approach. In D. R. Green (Chair), IRT-based standard-setting procedures utilizing behavioral anchoring. Symposium conducted at the Council of Chief State School Officers National Conference on Large-Scale Assessment, Phoenix, AZ.
Marzano, R. J., Brandt, R. S., Hughes, C. S., Jones, B. F., Presseisen, B. Z., Stuart, C., & Suhor, C. (1988). Dimensions of Thinking. Alexandria, VA: Association for Supervision and Curriculum Development.
Thissen, D., & Orlando, M. (2001). Item response theory for items scored in two categories. In D. Thissen & H. Wainer (Eds), Test Scoring (pp. 73–140). Hillsdale, NJ: Lawrence Erlbaum Associates.
Traub, R. E. (1994). Reliability for the social sciences: Theory and applications. Thousand Oaks, CA: Sage Publications, Inc.
Zimowski, M. F., Muraki, E., Mislevy, R. J., & Bock, R. D. (2002). BILOG-MG 3.0: Item analysis and test scoring with binary logistic models for multiple groups [computer program]. Mooresville, IN: Scientific Software International.

69
Appendix A: Item Development Guidelines Content Guidelines
1. Items must be based on the goals and objectives outlined in the North Carolina Standard Course of Study in Reading Comprehension and written at the appropriate grade level.
2. To the extent possible, each item written should measure a single concept, principle, procedure, or competency.
3. Write items that measure important or significant material instead of trivial material. 4. Keep the testing vocabulary consistent with the expected grade level of students
tested. 5. Avoid writing stems based on opinions. 6. Emphasize higher-level thinking skills using the taxonomy provided by the NCDPI.
Procedural Guidelines
7. Use the best answer format. 8. Avoid writing complex multiple-choice items. 9. Format the items vertically, not horizontally. 10. Avoid errors of grammar, abbreviations, punctuation, and spelling. 11. Minimize student reading time. 12. Avoid tricky or misleading items. 13. Avoid the use of contractions. 14. Avoid the use of first or second person.
Stem Construction Guidelines
15. Items are to be written in the question format. 16. Ensure that the directions written in the stems are clear and that the wording lets the
students know exactly what is being tested. 17. Avoid excessive verbiage when writing the item stems. 18. Word the stems positively, avoiding any negative phrasing. The use of negatives
such as NOT and EXCEPT is to be avoided. 19. Write the items so that the central idea and the phrasing are included in the stem
instead of the foils. 20. Place the interrogative as close to the item foils as possible.
General Foil Development
21. Each item must contain four foils (A, B, C, D). 22. Order the answer choices in a logical order. Numbers should be listed in ascending
or descending order. 23. Each item should contain foils that are independent and not overlapping. 24. All foils in an item should be homogeneous in content and length. 25. Do not use the following as foils: all of the above, none of the above, I don’t know. 26. Word the foils positively, avoiding any negative phrasing. The use of negatives such
as NOT and EXCEPT is to be avoided. 27. Avoid providing clues to the correct response. Avoid writing items with phrases in
the stem (slang associations) that are repeated in the foils.

70
28. Also avoid including ridiculous options. 29. Avoid grammatical clues to the correct answer. 30. Avoid specific determiners since they are so extreme that they are seldom the correct
response. To the extent possible, specific determiners such as ALWAYS, NEVER, TOTALLY, and ABSOLUTELY should not be used when writing items. Qualifiers such as best, most likely, approximately, etc. should be bold and italic.
31. The correct response for items written should be evenly balanced among the response options. For a 4-option multiple-choice item, each correct response should be located at each option position about 25% of the time.
32. Items should contain one and only one best (correct) answer.
Distractor Development 33. Use plausible distractors. The best (correct) answer must clearly be the best (correct)
answer and the incorrect responses must clearly be inferior to the best (correct) answer. No distractor should be obviously wrong.
34. To the extent possible, use the common errors made by students as distractors. Give your reasoning for incorrect choices on the back of the item spec sheet.
35. Technically written phrases may be used, where appropriate, as plausible distractors. 36. True phrases that do not correctly respond to the stem may be used as plausible
distractors where appropriate. 37. The use of humor should be avoided.

71
Appendix B: SBE-Adopted Achievement Level Descriptors Grade 3 Achievement Level I Students performing at this level do not have sufficient mastery of knowledge and skills in this subject area to be successful at the next grade level. Students performing at Level I typically show minimal use of decoding and comprehension skills required in the North Carolina Standard Course of Study at grade three. Students can identify characters and setting. These students read a variety of short and repetitive texts. Students at this level have limited vocabulary. Achievement Level II Students performing at this level demonstrate inconsistent mastery of knowledge and skills that are fundamental in this subject area and that are minimally sufficient to be successful at the next grade level. Students performing at Level II can apply limited enabling strategies and skills to read and comprehend some texts, including fiction, nonfiction, poetry, and drama as required in the North Carolina Standard Course of Study at grade three. Students read and demonstrate literal comprehension of some third grade genres. Students are able to identify literary elements, such as characters, setting, problem, and main events. They use basic word identification strategies. They can draw simple conclusions and identify sequence of events in a variety of texts. They are developing the ability to use story structure and text organization. Achievement Level III Students performing at this level consistently demonstrate mastery of grade level subject matter and skills and are well prepared for the next grade level. Students performing at Level III demonstrate grade-level reading comprehension skills as required in the North Carolina Standard Course of Study at grade three. Students are developing fluency as they read and comprehend a variety of third grade genres, such as fiction, nonfiction, poetry, and drama. Students interpret and analyze text by utilizing skills and strategies such as summarizing, making inferences and predictions, drawing conclusions, determining main idea, and making connections. They also use text features and text structures to comprehend. Students analyze characters, identify problems, determine the meaning of unfamiliar words, and develop an expanded vocabulary. Achievement Level IV Students performing at this level consistently perform in a superior manner clearly beyond that required to be proficient at grade level work. Students performing at Level IV demonstrate an independent application of the reading comprehension skills required in the North Carolina Standard Course of Study at grade three. Students at this level read with fluency and comprehend a variety of third grade genres, such as fiction, nonfiction, poetry, and drama. Students analyze and integrate information to infer, draw

72
conclusions, determine author’s purpose, and generalize. Students independently compare and contrast elements within and between texts. They also analyze the effect of figurative language, author’s craft, and literary elements. Grade 4 Achievement Level I Students performing at this level do not have sufficient mastery of knowledge and skills in this subject area to be successful at the next grade level. Students performing at Level I can apply minimal enabling strategies and skills to read and comprehend some texts as required in the North Carolina Standard Course of Study at grade four. These students can use basic word strategies, text features, and structure to assist them in reading and comprehending text and identifying genre. Students can identify basic, explicit details and elements of a selection. Achievement Level II Students performing at this level demonstrate inconsistent mastery of knowledge and skills that are fundamental in this subject area and that are minimally sufficient to be successful at the next grade level. Students performing at Level II can apply limited enabling strategies and skills to read and comprehend some texts, including fiction, nonfiction, poetry, and drama, as required in the North Carolina Standard Course of Study at grade four. Students can identify an explicitly stated main idea, relevant information, story sequence, and basic story structure and elements. In addition, they can interpret simple dialogue and character actions, connect text to self, follow two-step directions, form simple questions from text, draw simple conclusions, and use basic word-identification strategies. Achievement Level III Students performing at this level consistently demonstrate mastery of grade level subject matter and skills and are well prepared for the next grade level. Students performing at Level III can apply a combination of enabling strategies and skills to read and comprehend a variety of texts, including fiction, nonfiction, poetry, and drama, as required in the North Carolina Standard Course of Study at grade four. This includes making generalizations, connections, inferences and relevant predictions; analyzing characters; identifying problems and solutions, main idea, and supporting details; drawing conclusions; summarizing; comparing and contrasting; and determining the meaning of unfamiliar words and author’s purpose. Students are able to use information from multiple sources such as charts, graphs, and maps and can interpret information that is not explicitly stated in the text to determine theme, mood, main idea, and word choice. Achievement Level IV Students performing at this level consistently perform in a superior manner clearly beyond that required to be proficient at grade level work.

73
Students performing at Level IV demonstrate a highly proficient application of a combination of enabling strategies and skills to read and comprehend a variety of texts, including fiction, nonfiction, poetry, and drama as required in the North Carolina Standard Course of Study at grade four. Students can critically analyze, integrate, and evaluate information from multiple sources to generate connections and formulate and apply new ideas. They can interpret author’s implicit and explicit purpose and information from multiple perspectives. Grade 5 Achievement Level I Students performing at this level do not have sufficient mastery of knowledge and skills in this subject area to be successful at the next grade level. Students performing at Level I demonstrate minimal reading comprehension skills as required in the North Carolina Standard Course of Study at grade five. Students show evidence of some literal comprehension of limited fifth-grade texts. Typically students make simple predictions and simple concrete connections between texts with common themes. Students may be able to identify genre, main idea, and simple details. Students apply minimal strategies and skills to increase fluency and build background knowledge. Achievement Level II Students performing at this level demonstrate inconsistent mastery of knowledge and skills that are fundamental in this subject area and that are minimally sufficient to be successful at the next grade level. Students performing at Level II can apply limited enabling strategies and skills to read and comprehend some texts, such as fiction, nonfiction, poetry, and drama as required in the North Carolina Standard Course of Study at grade five. Students typically show evidence of literal comprehension of a limited variety of fifth-grade texts. Students apply basic knowledge of text structure to locate information for specific purposes. They typically draw simple conclusions, make basic inferences, identify sequence of events, identify basic story elements, and recognize information in a limited variety of texts. Students demonstrate basic strategies to assist in vocabulary and comprehension development. Achievement Level III Students performing at this level consistently demonstrate mastery of grade level subject matter and skills and are well prepared for the next grade level. Students performing at achievement llevel III demonstrate a proficient application of the reading comprehension skills required in the North Carolina Standard Course of Study at grade five. Students comprehend a variety of fifth-grade texts, such as fiction, nonfiction, poetry, and drama. Students typically apply comprehension strategies such as making predictions, drawing on personal understanding, extending vocabulary, evaluating inferences, analyzing content, and making connections within text. They also utilize a variety of metacognitive strategies to monitor comprehension, such as skimming, scanning, questioning, paraphrasing, and summarizing. Students are able to integrate main idea and details to further their understanding. Students are able to reference text to support conclusions. Students typically evaluate inferences and

74
conclusions. Students can recognize media techniques such as bias, propaganda, and stereotyping. Achievement Level IV Students performing at this level consistently perform in a superior manner clearly beyond that required to be proficient at grade level work. Students at Level IV demonstrate a highly proficient understanding of grade-level skills and comprehension as required in the North Carolina Standard Course of Study at grade five. Students comprehend a greater variety of fifth-grade texts, such as fiction, nonfiction, poetry, and drama. Students achieve a higher level of comprehension by predicting, questioning, evaluating, analyzing, justifying, integrating, critiquing, and making judgments about elements of text. They also identify elements of fiction and nonfiction by referencing the text for author’s choice of words, plot development, figurative language, and tone. Students make multiple connections within and between texts by recognizing similarities and differences based on a common theme or message. Students are also able to cite supporting evidence when evaluating such elements as character, plot, and theme. Grade 6 Achievement Level I Students performing at this level do not have sufficient mastery of knowledge and skills in this subject area to be successful at the next grade level. Students performing at Level I demonstrate a minimal understanding of the reading comprehension skills required in the North Carolina Standard Course of Study at grade six. Students possess some knowledge of a variety of sixth-grade-level texts, such as fiction, literary and informational nonfiction, poetry, and drama. Students may identify main idea, make basic predictions, and locate information that is directly stated in the text. Students are extending vocabulary knowledge. Achievement Level II Students performing at this level demonstrate inconsistent mastery of knowledge and skills that are fundamental in this subject area and that are minimally sufficient to be successful at the next grade level. Students performing at Level II demonstrate a limited understanding and are beginning to apply the reading comprehension skills required in the North Carolina Standard Course of Study at grade six. Students comprehend a variety of sixth-grade texts, such as fiction, literary and informational nonfiction, poetry, and drama, at the literal level. Students identify main idea, make simple inferences, draw conclusions, and make predictions. Students are beginning to determine author’s purpose and use information from text for comprehension. Students compare, contrast, and make limited connections to text. They have some understanding of literary elements. Achievement Level III

75
Students performing at this level consistently demonstrate mastery of grade level subject matter and skills and are well prepared for the next grade level. Students performing at Level III demonstrate a proficient application of the reading comprehension skills required in the North Carolina Standard Course of Study at grade six. Students comprehend a variety of sixth- grade texts, such as fiction, literary and informational nonfiction, poetry, and drama. Students infer, analyze, integrate, evaluate, draw conclusions, determine author’s purpose, and examine underlying assumptions. Students make connections within and between texts. They also analyze the effects of literary devices and author’s craft. Achievement Level IV Students performing at this level consistently perform in a superior manner clearly beyond that required to be proficient at grade level work. Students performing at Level IV demonstrate a highly proficient application of the reading comprehension skills required in the North Carolina Standard Course of Study at grade six. Students thoroughly comprehend a variety of sixth-grade-level texts, such as fiction, literary and informational nonfiction, poetry, and drama. Students use analytical, integrative, and evaluative skills in examining texts to make connections and to evaluate the effects of literary devices and author’s craft. Grade 7 Achievement Level I Students performing at this level do not have sufficient mastery of knowledge and skills in this subject area to be successful at the next grade level. Students performing at Level I demonstrate minimal reading comprehension skills as required in the North Carolina Standard Course of Study at grade seven. With support, these students show minimal understanding of grade-level text features and organizational structures; are able to determine main idea of basic texts; can locate apparent details; and can identify characters, setting, and basic literary elements. Students demonstrate limited vocabulary, decoding, and fluency, which restrict independent reading comprehension. Achievement Level II Students performing at this level demonstrate inconsistent mastery of knowledge and skills that are fundamental in this subject area and that are minimally sufficient to be successful at the next grade level. Students performing at Level II demonstrate a limited understanding and are beginning to apply the reading comprehension skills required in the North Carolina Standard Course of Study at grade seven. Students at this level apply appropriate reading strategies, such as making connections within text to show evidence of literal understanding of grade-level material. They identify vocabulary using context clues or prompts. Students identify main idea, supporting details, literary elements/devices, and author’s purpose, and draw limited inferences and conclusions. They compare and contrast information using prior knowledge.

76
Achievement Level III Students performing at this level consistently demonstrate mastery of grade level subject matter and skills and are well prepared for the next grade level. Students performing at Level III demonstrate grade-level reading comprehension skills as required in the North Carolina Standard Course of Study at grade seven. Students at this level apply knowledge of language structure to demonstrate comprehension and vocabulary proficiency. They distinguish between implied main idea and details to determine the importance of information. Students analyze the effect of figurative language, author’s craft, and literary elements in a variety of texts. They infer, synthesize, draw conclusions, determine author’s purpose, summarize, and make connections to related topics. They recognize and respond to argumentative organizational structure. In informational texts, students recognize bias and propaganda as well as compare and contrast related concepts and ideas. Achievement Level IV Students performing at this level consistently perform in a superior manner clearly beyond that required to be proficient at grade level work. Students performing at Level IV demonstrate an advanced application of the reading comprehension skills required in the North Carolina Standard Course of Study at grade seven. Students utilize knowledge of language structure within the text as well as generate new meaning based on text. They demonstrate highly proficient application in evaluating argument, author’s purpose, craft, stance, bias, hidden message, and propaganda. They summarize and synthesize information from multiple sources. These students compare and contrast concepts and ideas and draw conclusions from reading text with regard to global implications. Grade 8 Achievement Level I Students performing at this level do not have sufficient mastery of knowledge and skills in this subject area to be successful at the next grade level. Students performing at Level I demonstrate limited decoding and fluency, which restricts independent reading comprehension as described in the North Carolina Standard Course of Study at grade eight. Achievement Level II Students performing at this level demonstrate inconsistent mastery of knowledge and skills that are fundamental in this subject area and that are minimally sufficient to be successful at the next grade level. Students performing at Level II demonstrate a limited understanding and are beginning to apply the reading comprehension skills required in the North Carolina Standard Course of Study at grade eight. Students make general predictions, summarize information, generate literal and inferential questions and ideas, cite sources used, identify problems and solutions, and determine the accuracy of information. They have difficulty refining understanding and use of argument and possess a limited understanding of author’s purpose. They recognize literary elements and

77
genres and have a limited use of context clues to identify and define unknown words. Students recognize some figurative language, dialogue, flashback, allusion, irony, and symbolism. Achievement Level III Students performing at this level consistently demonstrate mastery of grade level subject matter and skills and are well prepared for the next grade level. Students performing at Level III demonstrate mastery of reading comprehension outlined in the North Carolina Standard Course of Study at grade eight. Students make inferences and predictions, summarize information, generate questions and ideas, cite sources used, evaluate problems and solutions, and determine importance and accuracy of information. These students evaluate the effect of bias and emotional factors and identify effectiveness of tone, style, and use of language. They accurately evaluate print and nonprint materials. Students interpret literary elements, genres, figurative language, dialogue, flashback, allusion, irony, and symbolism. They use context clues to identify and define unknown words and compare and contrast related concepts. Achievement Level IV Students performing at this level consistently perform in a superior manner clearly beyond that required to be proficient at grade level work. Students performing at Level IV demonstrate a highly proficient application of reading comprehension skills required in the North Carolina Standard Course of Study at grade eight. Students make inferences and predictions, summarize information, generate questions and ideas, cite sources used, evaluate problems and solutions, and determine importance of accuracy of information. These students evaluate the impact of bias and emotional factors and identify effectiveness of tone, style, and use of language. Students interpret literary elements, genres, figurative language, dialogue, flashback, allusion, irony, and symbolism. They use context clues to identify and define unknown words.