NORTH ATLANTIC CLIMATE VARIABILITY: PHENOMENA, …paoc.mit.edu/paoc/papers/atlantic.pdf · john...
38
INTERNATIONAL JOURNAL OF CLIMATOLOGY Int. J. Climatol. 21: 1863–1898 (2001) REVIEW NORTH ATLANTIC CLIMATE VARIABILITY: PHENOMENA, IMPACTS AND MECHANISMS JOHN MARSHALL a, *, YOCHANAN KUSHNIR b , DAVID BATTISTI c , PING CHANG d , ARNAUD CZAJA a , ROBERT DICKSON e , JAMES HURRELL f , MICHAEL McCARTNEY g , R. SARAVANAN f and MARTIN VISBECK b a Massachusetts Institute of Technology, Cambridge, MA, USA b Lamont -Doherty Earth Obseratory of Columbia Uniersity, Palisades, NY, USA c Uniersity of Washington, Seattle, WA, USA d Texas A&M, College Station, TX, USA e MAFF, Lowestoft, Suffolk, UK f National Center for Atmospheric Research, Boulder, CO, USA g Woods Hole Oceanographic Institution, Woods Hole, MA, USA Receied 1 Noember 2000 Reised 18 May 2001 Accepted 21 May 2001 ABSTRACT Variability of the North Atlantic Oscillation and the Tropical Atlantic dominate the climate of the North Atlantic sector, the underlying ocean and surrounding continents on interannual to decadal time scales. Here we review these phenomena, their climatic impacts and our present state of understanding of their underlying cause. Copyright © 2001 Royal Meteorological Society. KEY WORDS: interannual time scale; North Atlantic Oscillation; climate variability DOI: 10.1002/joc.693 1. INTRODUCTION Studies of North Atlantic climate variability have become a central focal point of climate research for the next decade. Scientists in both Europe and the US are planning co-ordinated observational, modelling and theoretical efforts focused on Atlantic Climate Variability as central elements to CLIVAR. We anticipate a major advancement of our current understanding of Atlantic Climate Variability, setting the stage for prototype predictability systems. In this article we review the nature, impacts and possible mechanisms of climate variability in the North Atlantic, and set out the framework that is being developed for advancing our understanding of their cause. As described in Section 2, climate variability in the North Atlantic sector comprises three primary, but interrelated phenomena: (I) Tropical Atlantic Variability (TAV): a covarying fluctuation of tropical Atlantic sea surface temperature (SST) and trade winds straddling the Intertropical Convergence Zone (ITCZ) (II) North Atlantic Oscillation (NAO): a fluctuation in sea level pressure difference between the Icelandic Low and the Azores High; part of the Northern Hemisphere annular mode, the Arctic Oscillation (AO) * Correspondence to: Department of Earth, Atmospheric and Planetary Sciences, Massachusetts Institute of Technology, Room 54-1526, Massachusetts, USA; e-mail: [email protected] Copyright © 2001 Royal Meteorological Society
-
Upload
truongkiet -
Category
Documents
-
view
216 -
download
0
Transcript of NORTH ATLANTIC CLIMATE VARIABILITY: PHENOMENA, …paoc.mit.edu/paoc/papers/atlantic.pdf · john...
INTERNATIONAL JOURNAL OF CLIMATOLOGY
Int. J. Climatol. 21: 1863–1898 (2001)
REVIEW
NORTH ATLANTIC CLIMATE VARIABILITY: PHENOMENA,IMPACTS AND MECHANISMS
JOHN MARSHALLa,*, YOCHANAN KUSHNIRb, DAVID BATTISTIc, PING CHANGd, ARNAUD CZAJAa,ROBERT DICKSONe, JAMES HURRELLf, MICHAEL McCARTNEYg, R. SARAVANANf and MARTIN VISBECKb
a Massachusetts Institute of Technology, Cambridge, MA, USAb Lamont-Doherty Earth Obser�atory of Columbia Uni�ersity, Palisades, NY, USA
c Uni�ersity of Washington, Seattle, WA, USAd Texas A&M, College Station, TX, USA
e MAFF, Lowestoft, Suffolk, UKf National Center for Atmospheric Research, Boulder, CO, USA
g Woods Hole Oceanographic Institution, Woods Hole, MA, USA
Recei�ed 1 No�ember 2000Re�ised 18 May 2001
Accepted 21 May 2001
ABSTRACT
Variability of the North Atlantic Oscillation and the Tropical Atlantic dominate the climate of the North Atlanticsector, the underlying ocean and surrounding continents on interannual to decadal time scales. Here we review thesephenomena, their climatic impacts and our present state of understanding of their underlying cause. Copyright© 2001 Royal Meteorological Society.
KEY WORDS: interannual time scale; North Atlantic Oscillation; climate variability
DOI: 10.1002/joc.693
1. INTRODUCTION
Studies of North Atlantic climate variability have become a central focal point of climate research for thenext decade. Scientists in both Europe and the US are planning co-ordinated observational, modelling andtheoretical efforts focused on Atlantic Climate Variability as central elements to CLIVAR. We anticipatea major advancement of our current understanding of Atlantic Climate Variability, setting the stage forprototype predictability systems. In this article we review the nature, impacts and possible mechanisms ofclimate variability in the North Atlantic, and set out the framework that is being developed for advancingour understanding of their cause.
As described in Section 2, climate variability in the North Atlantic sector comprises three primary, butinterrelated phenomena:
(I) Tropical Atlantic Variability (TAV):a covarying fluctuation of tropical Atlantic sea surface temperature (SST) and trade winds straddlingthe Intertropical Convergence Zone (ITCZ)
(II) North Atlantic Oscillation (NAO):a fluctuation in sea level pressure difference between the Icelandic Low and the Azores High; partof the Northern Hemisphere annular mode, the Arctic Oscillation (AO)
* Correspondence to: Department of Earth, Atmospheric and Planetary Sciences, Massachusetts Institute of Technology, Room54-1526, Massachusetts, USA; e-mail: [email protected]
Copyright © 2001 Royal Meteorological Society

J. MARSHALL ET AL.1864
(III) Atlantic Meridional Overturning Circulation (MOC):fluctuations in the Atlantic’s thermohaline circulation that may play a role in abrupt climatechange.
In the tropics, low-frequency climate variability in countries surrounding the tropical Atlanticappears to be closely related to TAV through tropical Atlantic SST fluctuations. Variability in therainfall of northeast Brazil correlates strongly with anomalies in the cross-equatorial SSTgradient—see Section 3. Rainfall in subtropical West Africa also displays considerable dependence onthe interhemispheric SST gradient. Furthermore, Atlantic equatorial SST anomalies appear to have asignificant impact on anomalous rainfalls in the Guinea coastal region—see Table I.
In mid-latitudes, the leading mode of variability over the Atlantic region, the NAO, is profoundlylinked to the leading mode of variability of the whole Northern Hemisphere circulation, the annularmode or Arctic Oscillation (AO). This suggests that Atlantic effects are more far-reaching andsignificant than previously thought. As we shall see, the NAO/AO has a climate significance thatrivals the Pacific El Nino–Southern Oscillation (ENSO). The NAO exerts a dominant influence ontemperatures, precipitation and storms, fisheries and ecosystems of the Atlantic sector and surroundingcontinents (see Table I). It is the major factor controlling air–sea interactions over the Atlantic andmodulates the site and intensity of the sinking branch of the ocean’s overturning circulation, theMOC. The NAO also seems to play a central role in real or perceived anthropogenic climate change.Understanding of the NAO and its time dependence appear central to three of the main questions inthe global change debate: has the climate warmed, and if so why and how? In the North Atlantic, theMOC accounts for most of the oceanic heat transport and is a major player in maintaining thepole–equator temperature gradient. The possibility of a significant weakening of the MOC underglobal warming scenarios is a feature of coupled Global Climate Models (GCMs). This idea remainscontentious. Yet because of its large potential impact, the possibility that increased fresh-water inputand atmospheric high-latitude temperature anomalies could suppress the MOC must be takenseriously.
We argue here that the NAO, TAV and MOC are intimately connected on a wide range of timescales and should therefore be considered together. As described in Section 4, several new advanceshave been made in our understanding of the mechanisms that underlie these modes of variability. Itappears that on interannual-to-decadal time scales, TAV and NAO may be interrelated. The NAOmay provide an important extratropical forcing exciting tropical Atlantic variability. And the TAVmay feedback on the NAO at interannual-to-decadal time scales by rearranging the HadleyCirculation. In mid-latitudes, shifts in the wind stress patterns and air–sea heat fluxes orchestrated bythe NAO can lead to anomalous wind-driven gyres, thermohaline circulation and associated heattransport, thus impacting the MOC. Within the tropics, local air–sea feedback may be an importantcontributing factor in enhancing power in the cross-equatorial SST gradient and covarying pattern oftrade winds, tropical SSTs and rainfall. On interannual time scales, the Pacific ENSO exerts aninfluence on the tropical western Atlantic and the Atlantic can influence the eastern equatorial Pacifictoo. Thus, ‘remote’ influences from the Pacific ENSO may also provide another major source ofexternal forcing to excite Atlantic variability.
Finally, in Section 5 we discuss the prospects for predictability in the Atlantic sector and whatneeds to be done—both observationally and theoretically— to further our understanding and bring tofruition prototype predictability systems.
Before going on it should be emphasized that, to retain a manageable length, a number ofimportant topics are not reviewed in depth. We have chosen to emphasize tropical/mid-latitudeprocesses in the Northern Hemisphere. The link with the Arctic and atmosphere–ocean– iceinteractions is not thoroughly reviewed, and much more could have been written on the role of theMOC in abrupt climate change. Nevertheless, we attempt to draw together in a comprehensible waymany of the important strands and processes that play a role in the highly complex set of interactionsthat make up climate variability in the North Atlantic sector.
Copyright © 2001 Royal Meteorological Society Int. J. Climatol. 21: 1863–1898 (2001)
AT
LA
NT
ICC
LIM
AT
EV
AR
IAB
ILIT
Y1865
Copyright
©2001
Royal
Meteorological
SocietyInt.
J.C
limatol.
21:1863
–1898
(2001)
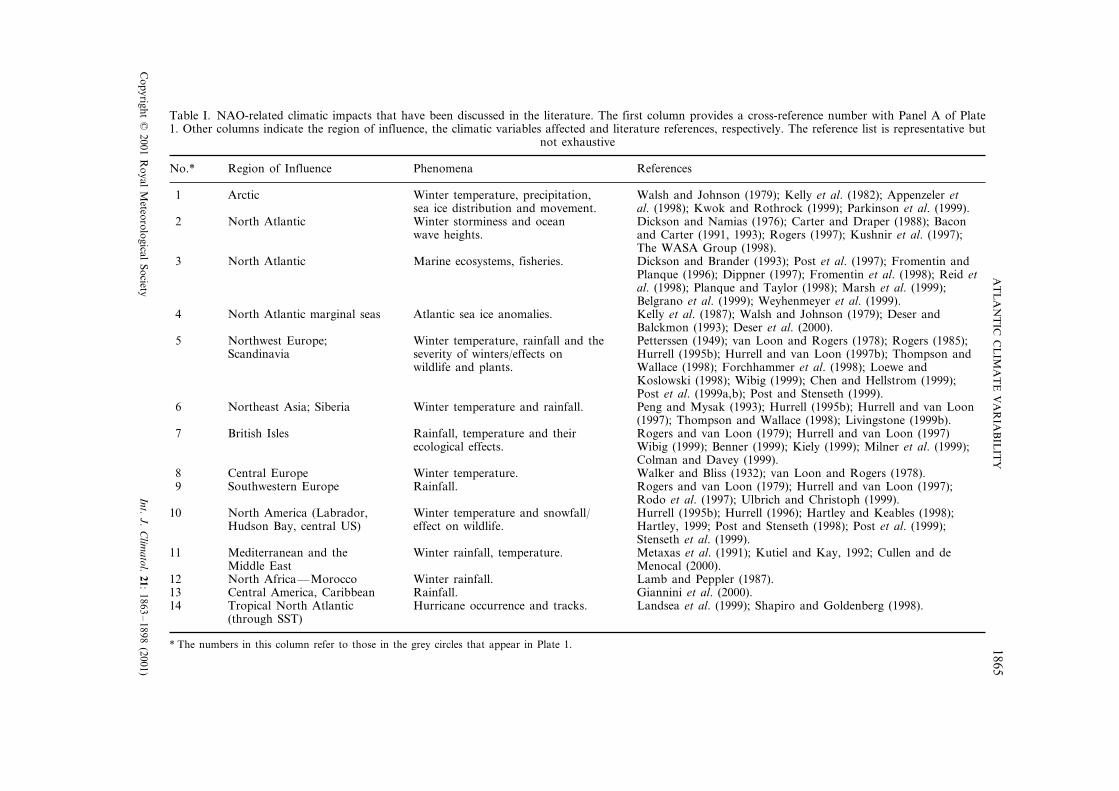
Table I. NAO-related climatic impacts that have been discussed in the literature. The first column provides a cross-reference number with Panel A of Plate1. Other columns indicate the region of influence, the climatic variables affected and literature references, respectively. The reference list is representative but
not exhaustive
No.* Region of Influence Phenomena References
Arctic1 Walsh and Johnson (1979); Kelly et al. (1982); Appenzeler etWinter temperature, precipitation,al. (1998); Kwok and Rothrock (1999); Parkinson et al. (1999).sea ice distribution and movement.Dickson and Namias (1976); Carter and Draper (1988); BaconNorth Atlantic Winter storminess and ocean2
wave heights. and Carter (1991, 1993); Rogers (1997); Kushnir et al. (1997);The WASA Group (1998).
North Atlantic3 Dickson and Brander (1993); Post et al. (1997); Fromentin andMarine ecosystems, fisheries.Planque (1996); Dippner (1997); Fromentin et al. (1998); Reid etal. (1998); Planque and Taylor (1998); Marsh et al. (1999);Belgrano et al. (1999); Weyhenmeyer et al. (1999).
North Atlantic marginal seas Atlantic sea ice anomalies. Kelly et al. (1987); Walsh and Johnson (1979); Deser and4Balckmon (1993); Deser et al. (2000).Petterssen (1949); van Loon and Rogers (1978); Rogers (1985);Winter temperature, rainfall and the5 Northwest Europe;
severity of winters/effects on Hurrell (1995b); Hurrell and van Loon (1997b); Thompson andScandinaviaWallace (1998); Forchhammer et al. (1998); Loewe andwildlife and plants.Koslowski (1998); Wibig (1999); Chen and Hellstrom (1999);Post et al. (1999a,b); Post and Stenseth (1999).Peng and Mysak (1993); Hurrell (1995b); Hurrell and van LoonNortheast Asia; Siberia6 Winter temperature and rainfall.(1997); Thompson and Wallace (1998); Livingstone (1999b).
Rainfall, temperature and their Rogers and van Loon (1979); Hurrell and van Loon (1997)7 British IslesWibig (1999); Benner (1999); Kiely (1999); Milner et al. (1999);ecological effects.Colman and Davey (1999).Walker and Bliss (1932); van Loon and Rogers (1978).Central Europe Winter temperature.8Rogers and van Loon (1979); Hurrell and van Loon (1997);9 Southwestern Europe Rainfall.Rodo et al. (1997); Ulbrich and Christoph (1999).
Winter temperature and snowfall/ Hurrell (1995b); Hurrell (1996); Hartley and Keables (1998);North America (Labrador,10effect on wildlife.Hudson Bay, central US) Hartley, 1999; Post and Stenseth (1998); Post et al. (1999);
Stenseth et al. (1999).11 Mediterranean and the Winter rainfall, temperature. Metaxas et al. (1991); Kutiel and Kay, 1992; Cullen and de
Menocal (2000).Middle EastLamb and Peppler (1987).12 Winter rainfall.North Africa—Morocco
13 Central America, Caribbean Rainfall. Giannini et al. (2000).Tropical North Atlantic Landsea et al. (1999); Shapiro and Goldenberg (1998).14 Hurricane occurrence and tracks.(through SST)
* The numbers in this column refer to those in the grey circles that appear in Plate 1.

J. MARSHALL ET AL.1866
2. THE PHENOMENOLOGY OF ATLANTIC CLIMATE VARIABILITY
2.1. The North Atlantic Oscillation
More than two centuries ago missionaries noticed that year-to-year fluctuation in wintertime airtemperatures on both sides of Iceland were often out of phase with one another—see van Loon andRogers (1978) for historical references. When temperatures are below normal over Greenland, they areabove normal in Scandinavia, and vice versa. Simultaneously, coherent fluctuations in temperatures,rainfall and sea level pressure were documented, reaching eastwards to central Europe, southwards tosubtropical West Africa and westwards to North America. This mode of climate variability is now knownas the North Atlantic Oscillation (NAO), a name first cited by Walker (1924; see also Rogers, 1984). Itis now firmly established that its fluctuations influence climate from North America to Siberia and fromthe Arctic Ocean to the equator and perhaps beyond.
2.1.1. Spatial pattern. The NAO (Figure 1) can be best discerned when time-averaged (monthly or,preferably, seasonal) atmospheric fields are analysed (Esbensen, 1984; Kushnir and Wallace, 1989),although it is also evident in daily data. Walker and Bliss (1932) described the NAO as ‘expressing thetendency for pressure to be low near Iceland in winter when it is high near the Azores and south westEurope’ and vice versa. Indeed its manifestation at sea level is a dipole roughly overlapping the IcelandicLow and the Azores High (see, e.g. van Loon and Rogers, 1978; Hurrell, 1995a). At different phases ofthe NAO, the strength and direction of the storm tracks shift, the intensity and path of storms beingmodulated by the time-averaged flow (Rogers, 1990).
Figure 1. (a) Regression map of Northern Hemisphere SLP anomalies in winter (December–March 1958–1998) onto the firstprincipal component of SLP anomalies over the North Atlantic sector (20°–70°N/100°W–20°E). (b) Time series of Hurrell’s NAOindex (thin curve) and the first principal component of SLP (thick curve). Both time series are normalized by their standard
deviation. The SLP data are taken from the NCEP–NCAR reanalysis
Copyright © 2001 Royal Meteorological Society Int. J. Climatol. 21: 1863–1898 (2001)
ATLANTIC CLIMATE VARIABILITY 1867
The NAO appears to be part of a hemispheric mode of variability. Thompson and Wallace (1998) andThompson et al. (2000a,b) discuss the concept of the ‘Arctic Oscillation’ (AO), or Northern Hemisphere‘annular mode’, which they defined as the leading empirical orthogonal function (EOF) of wintertimemonthly mean Northern Hemisphere sea level pressure (SLP). Wallace (2000) argues that the NAO andAO represent a single phenomenon viewed through two paradigms (but see the discussions in Deser, 2000and Ambaum et al., 2001). The NAO may be viewed as the regional expression of the AO. The AO maybe thought of as the leading wintertime hemispheric low-frequency mode of variability of SLP, while theNAO is the leading mode in the Atlantic basin. Maps of the two modes are nearly indistinguishable(except for the Pacific region). In this review, where the emphasis is on Atlantic Climate Variability, weuse NAO unless a distinction needs to be made.
In contrast to the climatological mean flow over the North Atlantic, the NAO/AO has a pronounced‘equivalent barotropic’ structure (vertical phase lines; Wallace and Gutzler, 1981; Kushnir and Wallace,1989) and increases in amplitude with height in rough proportion to the strength of the mean zonal wind,coupling the troposphere with the stratosphere (Perlwitz and Graf, 1995).
Figure 2(a) shows the regression of SST on the NAO index during winter. It reveals a tri-polarpattern—a cold subpolar region, warmth in mid-latitudes and a cold region between the equator and30°N. This is also the leading pattern of SST variability during winter. Its emergence is consistent with thespatial form of the anomalous surface fluxes associated with the NAO pattern, as pointed out by Cayan(1992a,b); see Figure 2(b). It appears that the strength of the correlation between the NAO and SSTincreases when the NAO index leads SST, indicating that SST is responding to atmospheric forcing onmonthly to seasonal time scales (Frankignoul, 1985; Battisti et al., 1995; Delworth, 1996; Hall andManabe, 1997).
2.1.2. Temporal characteristics. The NAO is most pronounced in amplitude and areal coverage duringwinter (December–March) when it accounts for some 37% of the monthly time series of December,January, February (DJF) 500 hPa height variability over the Atlantic (Wallace and Gutzler, 1981;Esbensen, 1984; Barnston and Livezey, 1987; Kushnir and Wallace, 1989; Wallace, 1996; Cayan 1992a).The NAO is the only mode found in all seasons (Barnston and Livezey, 1987; Clinet and Martin, 1992)and Rogers (1990) showed that it accounts for the largest amount of interannual variability in monthlyNorth Atlantic SLP in all but 4 months of the year. The second mode of variability— the East Atlantic(EA) pattern—explains some 19% of monthly DJF 500 hPa variability over the Atlantic. Feldstein (2000)finds that the NAO and PNA explain roughly equivalent fractions—18%—of the seasonal hemispheric300 hPa height field variability.
The NAO is often defined by an index of normalized, time-averaged pressure differences betweenstations representing its two centres of action, such as the Azores and Iceland (Rogers, 1984; Hurrell,1995a). Such a simple index clearly cannot take account of the possibility that the centres of the actualpattern may not overlap with these locations, nor can it accurately capture the seasonal variations in theNAO (Barnston and Livezey, 1987). However, there is a key advantage to the use of such an indexbecause the existing weather records allow it to be extended back in time to at least 1864. When the indexis correlated or regressed with gridded surface pressure data, the resulting north–south dipole patterndefines the spatial pattern of the NAO.
The winter NAO index, defined as the difference between the normalized mean SLP in the Azores andIceland, is shown in Figure 1(b) since 1864. Positive values indicate stronger-than-usual westerly winds. Itis evident from Figure 1(b) that the NAO index has exhibited considerable variability over the past 100years. From the turn of the century until about 1930 (with the exception of the 1916–1919 winters), theNAO was high and so stronger-than-usual winds carried the moderating influence of the ocean overEurope contributing to the higher-than-normal European temperatures during this period (e.g. Rogers,1985). From the early 1940s until the early 1970s, the NAO index exhibited a downward trend, andcorresponded to a period in which European wintertime temperatures were frequently lower than normal(van Loon and Williams, 1976; see also Plate 1a). A sharp increase has occurred over the past 25 years.Since 1980, the NAO has remained in a strongly positive phase, and displayed an upward trend (but may
Copyright © 2001 Royal Meteorological Society Int. J. Climatol. 21: 1863–1898 (2001)

J. MARSHALL ET AL.1868
Figure 2. Regression maps of (a) SST (CI=0.1 K, negative dashed), (b) surface turbulent heat flux (latent+sensible, CI=5Wm−2, dashed out of the ocean) and (c) surface wind stress curl (CI=2×10⁻³ Pa m−1, dashed for anticyclonic) anomalies ontothe NAO index shown in Figure 1(b). The thick black line is the zero wind curl line of the climatological winds. The SST and windstress curl data come from the NCEP–NCAR reanalysis, while the surface heat flux anomalies come from Da Silva et al. (1994).
A linear trend was removed to all datasets prior to computing the linear regressions
now be abating), so that at the turn of the 20th century winters have exhibited the most pronouncedpositive indices ever recorded (with the notable exception of 1996). This situation contributed much to theobserved warming in Northern Hemisphere surface temperatures over the past two decades (Hurrell,1995a, 1996; Wallace et al., 1995; and Section 3). The increased AO during the past 30 years (Thompsonand Wallace, 1998) also corresponds to a stronger polar vortex, coinciding with a depletion ofstratospheric ozone levels above the polar cap.
Copyright © 2001 Royal Meteorological Society Int. J. Climatol. 21: 1863–1898 (2001)
ATLANTIC CLIMATE VARIABILITY 1869
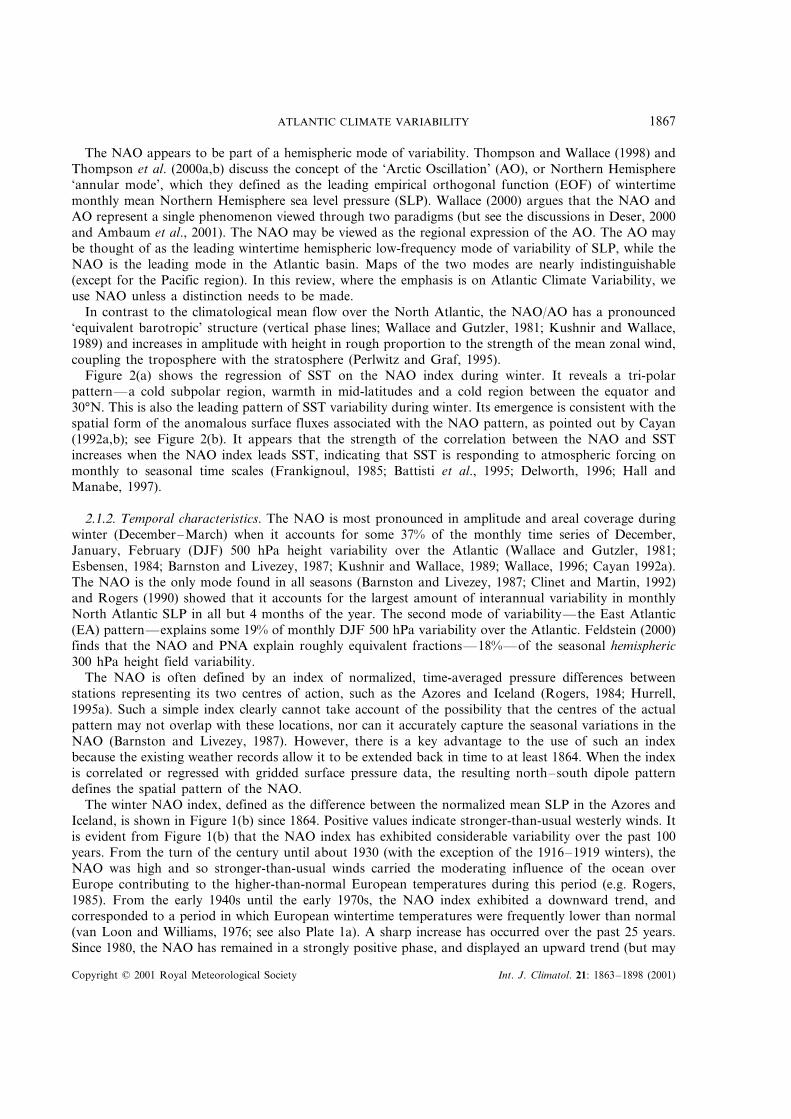
The spectrum of the wintertime NAO index (Figure 3) is slightly red, with power increasing with period.As discussed in Wunsch (1999) and Stephenson et al. (2000)—see also Deser and Blackmon (1993)— theindex shows enhanced power in some frequency bands, although not large enough to be statisticallysignificant. The slight maximum with a period between 2 and 3 years is most noticeable in NorthernHemisphere mid-latitude SST, although the mechanism behind this peak remains uncertain (Stephensonet al., 2000 who discuss the 2–3 year variability in the Northern Hemisphere SLP). When the NAO indexis taken as the first principal component of SLP anomalies over the Atlantic sector (Figure 3, thick curve),similar spectral features are found. Note, however, that principal component analysis, by taking intoaccount many more observations, reduces the noise inherent in station land data. At high frequencies, itspower spectrum has a larger slope than that based on Hurrell’s index.
Paleoclimate indicators, such as tree rings and ocean sediments, have been used as proxies for the NAOand can be extended back several hundred years. These suggest that the NAO is robust and has remainedcoherent for at least 1000 years and has been coherent over long periods of the 700-year stable isotoperecord from the GISP-2 ice core from central Greenland (Barlow et al., 1993; White et al., 1997). Similarevidence emerges from the tree ring data (Cook et al., 1998). Wanner (personal communication, 1998)
Figure 3. Power spectra of (linearly detrended) SLP and SST indices, estimated using the multi-taper method. (a) NAO index fromHurrell (thin curve) and from a principal component analysis of winter SLP anomalies (December–March, 1958–1998) over theNorth Atlantic sector (20°–70°N/100°W–20°E) from the NCEP–NCAR reanalysis (thick curve). (b) Indices of cross-Gulf Stream�TGS (black continuous line), cross-equatorial �TEQ (black dashed line) and tripole SST anomalies (grey line). The indices are �TGS
the difference between SST averaged over [40°–55°N/60°–40°W and 25°–35°N/80°–60°W] (late winter-February–April), and �TEQ
[5°–20°N/40°–20°W and 15°–5°S/15°W–5°E] (all calendar months). The SST tripole index is defined as the first principalcomponent of winter (December–March) SST anomalies over the North Atlantic (20°–70°N). All SST data are from Kaplan et al.
(1998). For all spectra, the 95% contour interval is shown by the vertical line, and the number of tapers has been set to K=7
Copyright © 2001 Royal Meteorological Society Int. J. Climatol. 21: 1863–1898 (2001)
J. MARSHALL ET AL.1870
reconstructs the NAO from proxy and documentary sources and hypothesizes that decadal-scale coldrelapses during the Late Maunder Minimum (1675–1715) were related to successive negative NAO events.
2.1.3. Co�arying patterns in SST and the interior ocean. There are clear indications that the NorthAtlantic ocean varies significantly with the NAO above. The leading pattern of SST variability in theNorth Atlantic— the tripole plotted in Figure 2(a)— is a direct response of the ocean to the anomalousair–sea fluxes derived by the NAO shown in Figure 2(b). Because the NAO is most active fromDecember–March, the SST tripole is most energetic in late winter (it needs roughly 1 month to integratethe NAO forcing). As shown in Watanabe and Kimoto (2000a), the tripole persists longer (for about ayear) than would be expected from local damping due to air–sea interaction (which yields a decay scaleof �3 months—see Frankignoul et al., 1998). This is related in part to the formation of the upperseasonal thermocline in summer, which reduces the damping of SST anomalies formed during theprevious winter, and to their subsequent re-entrainment into the mixed layer the following winter (theso-called re-emergence mechanism discussed in Section 4.1.2—see, e.g. Alexander and Deser, 1995). Thetripole pattern has a red spectrum—see Figure 3(b)— that is broadly consistent with the statistical modelof Hasselman (1976), which invokes the thermal inertia of the mixed layer as a reddening mechanism. Onenotes, however, a hint of increased power in the decadal band (but at a slightly longer period than thatseen in the NAO index, see Figure 3(a)) and increased power at the longest time scales, as was found inHurrell’s NAO index.
Deser and Blackmon (1993) present spectra of EOFs of SST, marine air temperature, SLP and surfacewinds that show an increase in variance near the decadal band. Indeed, elements of the tripole showpronounced decadal signatures. Czaja and Marshall (2001), using a long historical record of SST data,define an SST index, �TGS=TN−TS, the difference between the SST in boxes to the north and south ofthe separated Gulf Stream— this index is closely associated with the ‘Dipole mode’ of Deser andBlackmon (1993). It is here in the vicinity of strong western boundary currents and recirculation that wemight expect to see a signature of ocean circulation imprint itself on SST. Indeed, the spectrum of �TGS
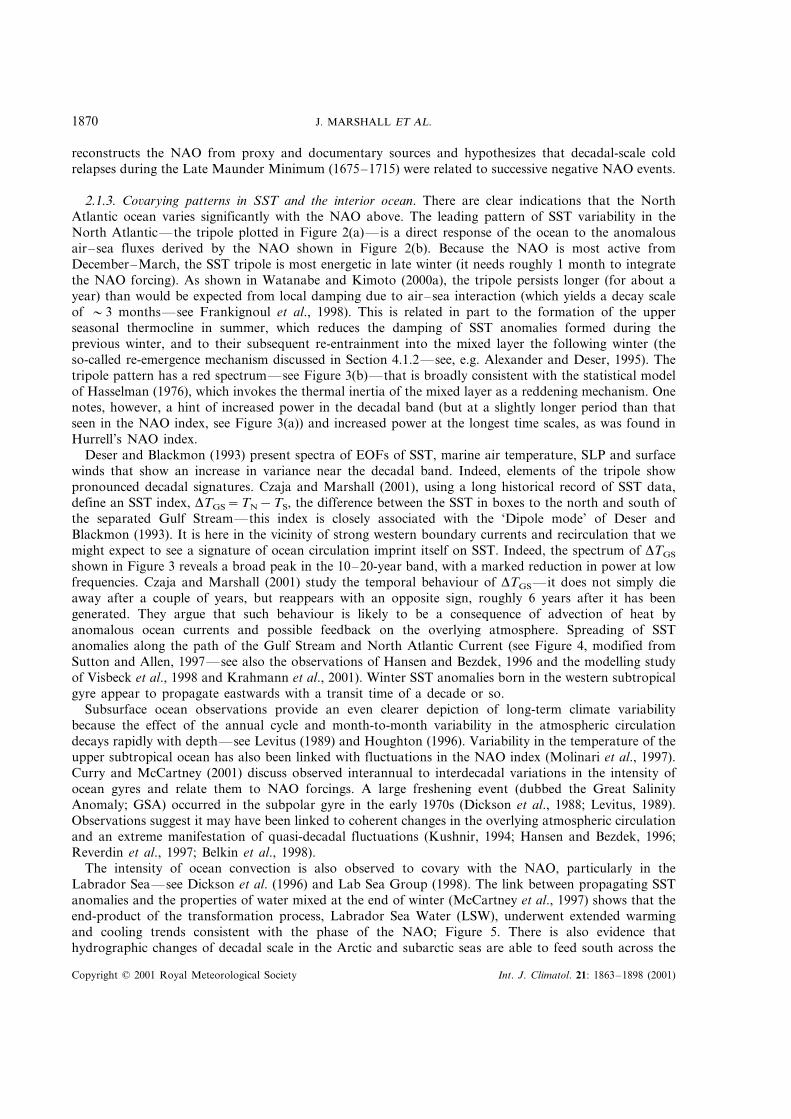
shown in Figure 3 reveals a broad peak in the 10–20-year band, with a marked reduction in power at lowfrequencies. Czaja and Marshall (2001) study the temporal behaviour of �TGS— it does not simply dieaway after a couple of years, but reappears with an opposite sign, roughly 6 years after it has beengenerated. They argue that such behaviour is likely to be a consequence of advection of heat byanomalous ocean currents and possible feedback on the overlying atmosphere. Spreading of SSTanomalies along the path of the Gulf Stream and North Atlantic Current (see Figure 4, modified fromSutton and Allen, 1997—see also the observations of Hansen and Bezdek, 1996 and the modelling studyof Visbeck et al., 1998 and Krahmann et al., 2001). Winter SST anomalies born in the western subtropicalgyre appear to propagate eastwards with a transit time of a decade or so.
Subsurface ocean observations provide an even clearer depiction of long-term climate variabilitybecause the effect of the annual cycle and month-to-month variability in the atmospheric circulationdecays rapidly with depth—see Levitus (1989) and Houghton (1996). Variability in the temperature of theupper subtropical ocean has also been linked with fluctuations in the NAO index (Molinari et al., 1997).Curry and McCartney (2001) discuss observed interannual to interdecadal variations in the intensity ofocean gyres and relate them to NAO forcings. A large freshening event (dubbed the Great SalinityAnomaly; GSA) occurred in the subpolar gyre in the early 1970s (Dickson et al., 1988; Levitus, 1989).Observations suggest it may have been linked to coherent changes in the overlying atmospheric circulationand an extreme manifestation of quasi-decadal fluctuations (Kushnir, 1994; Hansen and Bezdek, 1996;Reverdin et al., 1997; Belkin et al., 1998).
The intensity of ocean convection is also observed to covary with the NAO, particularly in theLabrador Sea—see Dickson et al. (1996) and Lab Sea Group (1998). The link between propagating SSTanomalies and the properties of water mixed at the end of winter (McCartney et al., 1997) shows that theend-product of the transformation process, Labrador Sea Water (LSW), underwent extended warmingand cooling trends consistent with the phase of the NAO; Figure 5. There is also evidence thathydrographic changes of decadal scale in the Arctic and subarctic seas are able to feed south across the
Copyright © 2001 Royal Meteorological Society Int. J. Climatol. 21: 1863–1898 (2001)
ATLANTIC CLIMATE VARIABILITY 1871
Figure 4. Left panel: pathways of interannual propagation of SST anomalies along the North Atlantic Current. Sutton and Allen(1997) find that it takes 12–14 years to travel from 0 to 7500 km, yielding an average speed of 1.7 cm s−1. Right panel: Hovmollerdiagram of winter SST anomalies as a function of time and position along the pathway marked on the left panel. The contourinterval is 0.5°C and negative values are shaded. Modified from Sutton and Allen (1997), reproduced with permission of Nature
deep northern overflows to cause hydrographic changes in the deep and abyssal layers of the LabradorSea—see Dickson et al. (2001). These variations appear to be large and long sustained.
2.2. Tropical Atlantic �ariability
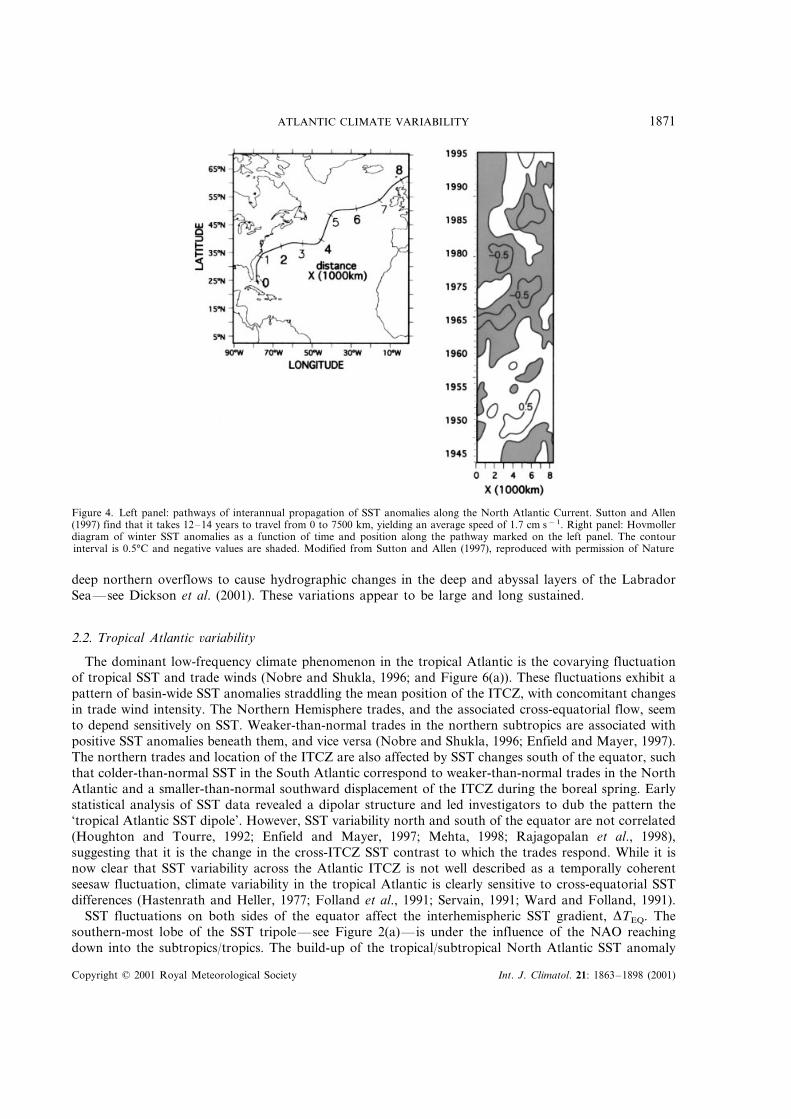
The dominant low-frequency climate phenomenon in the tropical Atlantic is the covarying fluctuationof tropical SST and trade winds (Nobre and Shukla, 1996; and Figure 6(a)). These fluctuations exhibit apattern of basin-wide SST anomalies straddling the mean position of the ITCZ, with concomitant changesin trade wind intensity. The Northern Hemisphere trades, and the associated cross-equatorial flow, seemto depend sensitively on SST. Weaker-than-normal trades in the northern subtropics are associated withpositive SST anomalies beneath them, and vice versa (Nobre and Shukla, 1996; Enfield and Mayer, 1997).The northern trades and location of the ITCZ are also affected by SST changes south of the equator, suchthat colder-than-normal SST in the South Atlantic correspond to weaker-than-normal trades in the NorthAtlantic and a smaller-than-normal southward displacement of the ITCZ during the boreal spring. Earlystatistical analysis of SST data revealed a dipolar structure and led investigators to dub the pattern the‘tropical Atlantic SST dipole’. However, SST variability north and south of the equator are not correlated(Houghton and Tourre, 1992; Enfield and Mayer, 1997; Mehta, 1998; Rajagopalan et al., 1998),suggesting that it is the change in the cross-ITCZ SST contrast to which the trades respond. While it isnow clear that SST variability across the Atlantic ITCZ is not well described as a temporally coherentseesaw fluctuation, climate variability in the tropical Atlantic is clearly sensitive to cross-equatorial SSTdifferences (Hastenrath and Heller, 1977; Folland et al., 1991; Servain, 1991; Ward and Folland, 1991).
SST fluctuations on both sides of the equator affect the interhemispheric SST gradient, �TEQ. Thesouthern-most lobe of the SST tripole—see Figure 2(a)— is under the influence of the NAO reachingdown into the subtropics/tropics. The build-up of the tropical/subtropical North Atlantic SST anomaly
Copyright © 2001 Royal Meteorological Society Int. J. Climatol. 21: 1863–1898 (2001)

J. MARSHALL ET AL.1872
Figure 5. Time history of (top) the temperature of LSW, plotted along with the NAO index-shaded (middle) salinity in the LabradorSea and (bottom) thickness of LSW core. (Figure from p. 21 from McCartney MS, Curry RG, Bezdex HF. 1997. North Atlantic’stransformation pipeline chills and redistributes subtropical water. Oceanus 39: 19–23. Reproduced by permission of WHOI.) As theNAO has strengthened, LSW has become colder, fresher and more voluminous. We also observe much interannual variability
superimposed on the trend
lags behind the local change in the wind circulation by a month or two (Nobre and Shukla, 1996), slightlyshorter than the lag between the atmosphere and ocean in mid-latitudes (Frankignoul, 1985). As the SSTanomaly builds up, the Northern Hemisphere trades adjust. Considerable SST fluctuations also occur inthe subtropics of the Southern Hemisphere (Venegas et al., 1997). Their nature is not entirely resolved, butthey appear to be linked to the interannual variability in the South Atlantic subtropical high.
The time series of the joint SST and wind pattern (Figure 6(b)) clearly contain long-term componentsand noticeable imprints of decadal variability. The spectrum of the cross-equatorial SST gradient, �TEQ,shows somewhat enhanced power on time scales of 10–20 years—see Figure 3—but not markedly so.
A mode of variability similar to the Pacific ENSO has also been identified in the tropical Atlantic Ocean(Covey and Hastenrath, 1978; Philander, 1986; Zebiak, 1993; Carton and Huang, 1994). Although theyare much weaker than their Pacific counterparts, the Atlantic equatorial SST anomalies can, for example,have an effect on rainfall in the Gulf of Guinea (Wagner and da Silva, 1994). As in the Pacific, equatorialwaves and remote wind forcing play a significant role in the generation of SST anomalies at the interannualtime scale (Hirst and Hastenrath, 1983; McCreary et al., 1984). These perturbations in equatorial windsand SST are not as dominant as their Pacific counterparts, apparently because the Atlantic basin is muchnarrower than the Pacific, and do not appear to be consistently sustained (Zebiak, 1993). However, theydo exert some influence over the adjacent landmasses.
2.2.1. The relation between NAO and TAV. There exists a strong link between tropical climate variabilityand the NAO. Changes in trade winds, governed by fluctuations in the strength and location of the AzoresHigh, impact SST beneath them through associated surface heat exchanges and entrainment at the bottomof the ocean mixed layer. Thus the SST tripole and interhemispheric SST gradients share common SSTanomalies between the equator and �30°N. Consistent with the NAO impacting the northern subtropicalAtlantic, the interannual variability of SST shown in Figure 6(a) is strongest in March–May (Nobre andShukla, 1996), lagging by 1–2 months the most active NAO season (January–March).
Copyright © 2001 Royal Meteorological Society Int. J. Climatol. 21: 1863–1898 (2001)
ATLANTIC CLIMATE VARIABILITY 1873
Figure 6. The dominant pattern of tropical Atlantic variability revealed by a joint EOF analysis of surface wind stress and SSTmonthly anomalies, September 1963–August 1987. Spatial structures of the first EOF mode and the associated time coefficients areillustrated in (a) and (b), respectively. Contours represent SST loading values, interval of 0.1°C. Vectors depict wind stress loadings.The unit vector represents an easterly wind stress anomaly of 1.0 dyn cm−2. The time coefficients have been normalized by their
own standard deviations. From Nobre and Shukla (1996), reproduced by permission of the American Meteorological Society
The tropical atmosphere, and especially its surface cross-equatorial flow, is sensitive to changes ininterhemispheric SST gradients (see Chiang et al., 2001). The NAO may also be influenced by subtropicalSST anomalies. Deque and Servain (1989) discuss teleconnections between the tropical Atlantic and SSTand mid-latitude geopotential height anomalies. Sutton et al. (2000) show that there is a significant modelresponse to the tripole SST pattern of Figure 2(a), and argue that it is the subtropical SST anomalies thatare the most important, although the response to component parts of the tripole do not appear to beadditive. It has even been suggested (Rajagopalan et al., 1998; Tourre et al., 1999) that there is a linkbetween the NAO and tropical SST in the South Atlantic.
2.3. Meridional o�erturning circulation
The meridional overturning circulation of the ocean plays a key role in poleward transport of waterproperties, such as heat and freshwater, carbon and nutrients. In concert with meridional atmosphericfluxes, ocean transports balance the earth’s global heat and hydrologic budgets. At 25°N, the AtlanticOcean carries some 1.2 PW of heat northwards: approximately 60% of the net poleward ocean flux and30% of the total flux by ocean and atmosphere at this latitude (Hall and Bryden, 1982). This polewardheat flux is intimately associated with the watermass transformations that take place as thermoclinewaters move north and are ultimately converted by air–sea interaction into cold North Atlantic DeepWater (NADW).
The NAO, because it is the controlling factor in variability of air–sea and ice/freshwater fluxes betweenthe Arctic and the north Atlantic—see Coachman and Aagaard (1988), Roach et al. (1995) and
Copyright © 2001 Royal Meteorological Society Int. J. Climatol. 21: 1863–1898 (2001)

J. MARSHALL ET AL.1874
Weingartner et al. (1998)— is a primary modulator of the water mass transformation process, and perhapsthe strength of the MOC and hence variability in ocean heat transport. In particular it orchestratesconvection in the Greenland Sea and particularly the Labrador Sea—see Lab Sea Group, 1998. The highnorthern latitudes and the ocean fluxes that connect them to adjacent seas are plainly not the onlyconstituent parts of the problem. The MOC is driven globally by up-welling, down-welling and a strongcomponent of upper-ocean wind-forcing. Fluctuations in any one of these components might affect thestrength of the MOC (see, for example, Toggweiler and Samuels, 1995 for the role of the Southern Oceanwind field, or Latif et al., 2000 for the role of the tropics in re-establishing the MOC under greenhousewarming conditions; see also Cane and Clement, 1999). Nonetheless buoyancy loss in the northern highlatitudes, largely controlled by the NAO/AO, is still of a fundamental importance.
3. IMPACTS
The phenomena outlined above have major impacts on the populations and environment of the Atlanticsector, as summarized in Plate 1, Table I and references therein (note that not all references listed in Plate1 and Table I are explicitly mentioned in the text). We now review these climatic consequences in moredetail.
3.1. North Atlantic Oscillation
3.1.1. Temperature and global warming. The NAO exerts a dominant influence on the wintertimetemperatures of the Northern Hemisphere (see Plate 1, created using the NAO index of Hurrell,1995a,b—a similar pattern of temperature correlation is obtained using the AO index; see Thompson andWallace, 1998). Surface air temperature and SST in wide regions across the North Atlantic basin, ineastern North America, the Arctic, Eurasia and the Mediterranean, are significantly correlated with NAOvariability. Changes in temperature over land—see, e.g. Benner, 1999— (and related changes in rainfalland storminess, see below) are of serious consequence to a wide range of human activities.
Changes of more than 1°C in the DJF-averaged surface temperature are associated with a one standarddeviation change in the NAO index over the northwest Atlantic and extend from northern Europe acrossmuch of Eurasia (Hurrell, 1995b; Hurrell and van Loon, 1997, see Plate 1(a) and Figure 7). Temperaturechanges over Northern Africa, the Middle East and the southeast US are also notable. Of particularinterest is the contribution of NAO variability to the recent trend in global/hemispheric mean wintertimetemperature. Hurrell (1996) demonstrated that both NAO and ENSO are linearly related to this climatetrend, with NAO dominating a larger land area than ENSO. Thompson and Wallace (1998) and Wallaceet al. (1998) also show that an index of the AO (see Section 2.1) is strongly correlated to the temperaturetrend over Eurasia.
3.1.2. Precipitation and storms. Changes in mean circulation patterns over the North Atlantic areaccompanied by pronounced shifts in the storm tracks and associated synoptic eddy activity. These affectthe transport and convergence of atmospheric moisture and can be directly tied to changes in regionalwintertime precipitation (Figure 8, see also Rogers and van Loon, 1979; Bradley et al., 1987; Lamb andPeppler, 1987; Hurrell, 1995b; Beniston, 1997; Appenzeller et al., 1998). Drier-than-normal conditionsoccur during high NAO index winters over much of central and southern Europe, the northernMediterranean countries, and west North Africa. At the same time, wetter-than-normal conditions occurfrom Iceland through to Scandinavia. Over North America the effect of the NAO on precipitation is notstrong. However, an out of phase relationship between the NAO index and snowfall over New Englandwas found in a recent study by Hartley and Keables (1998). Signals in eastern North Americanprecipitation and runoff also show a relation to the NAO (Perreault et al., 1999), which could impact thedevelopment of water management rules in water resource systems.
The NAO-related changes in precipitation patterns have directly affected many European economies,largely because of the long stretch of consecutive winters in which the NAO continued to intensify in the
Copyright © 2001 Royal Meteorological Society Int. J. Climatol. 21: 1863–1898 (2001)

Copyright
©2001
Royal
Meteorological
SocietyInt.
J.C
limatol.
21(15)(2001)
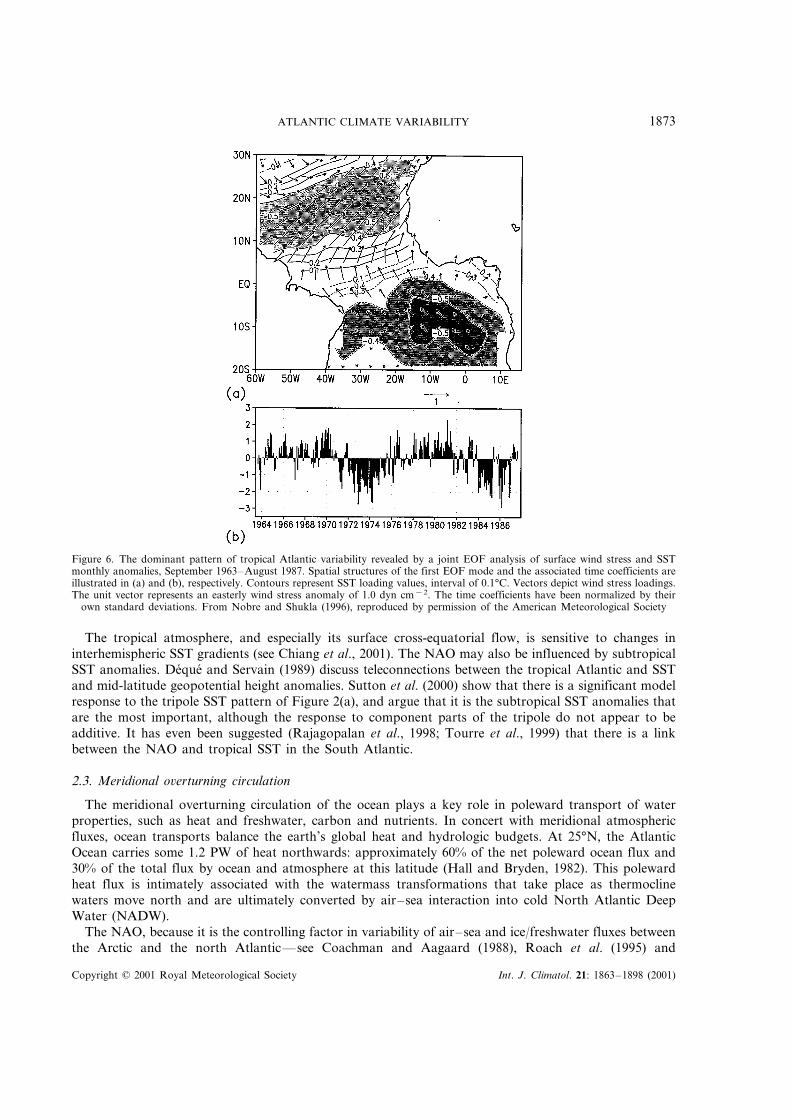
Plate 1. Impacts of Atlantic climate variability. (a) shows the correlation between the December–March NAO index (Hurrell, 1995b) and global surface temperature. SST is usedover the oceans, and station air temperature over land. SST is taken from Kaplan et al. (1998) and station data are from NOAA/NCDA/GHCN (Vose et al., 1992; Petersonand Vose, 1997). Numbers in grey circles refer to the entries in Table I (see left column). (b) shows the correlation between an index of the tropical Atlantic cross equatorialSST gradient (also known as the TDI, see Chang et al., 1997) and rainfall (over land) and SST (over the oceans). SST data are taken from Kaplan et al. (1998) and rainfallfrom NOAA/NCDC/GHCN station data. All anomalies are annual (i.e. calculated from the difference between annual averages derived from monthly data and the long-term
annual mean climatology)
Copyright
©2001
Royal
Meteorological
SocietyInt.
J.C
limatol.
21(15)(2001)
Plate 1 (Continued)
ATLANTIC CLIMATE VARIABILITY 1875
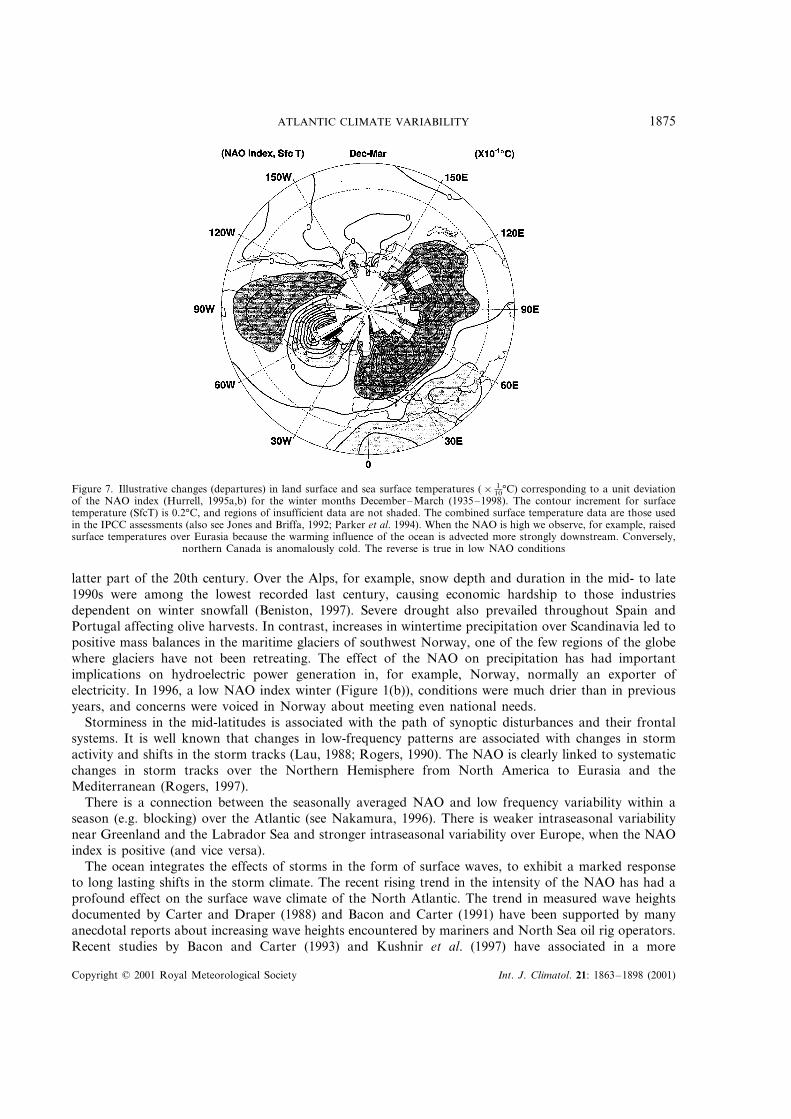
Figure 7. Illustrative changes (departures) in land surface and sea surface temperatures (× 110°C) corresponding to a unit deviation
of the NAO index (Hurrell, 1995a,b) for the winter months December–March (1935–1998). The contour increment for surfacetemperature (SfcT) is 0.2°C, and regions of insufficient data are not shaded. The combined surface temperature data are those usedin the IPCC assessments (also see Jones and Briffa, 1992; Parker et al. 1994). When the NAO is high we observe, for example, raisedsurface temperatures over Eurasia because the warming influence of the ocean is advected more strongly downstream. Conversely,
northern Canada is anomalously cold. The reverse is true in low NAO conditions
latter part of the 20th century. Over the Alps, for example, snow depth and duration in the mid- to late1990s were among the lowest recorded last century, causing economic hardship to those industriesdependent on winter snowfall (Beniston, 1997). Severe drought also prevailed throughout Spain andPortugal affecting olive harvests. In contrast, increases in wintertime precipitation over Scandinavia led topositive mass balances in the maritime glaciers of southwest Norway, one of the few regions of the globewhere glaciers have not been retreating. The effect of the NAO on precipitation has had importantimplications on hydroelectric power generation in, for example, Norway, normally an exporter ofelectricity. In 1996, a low NAO index winter (Figure 1(b)), conditions were much drier than in previousyears, and concerns were voiced in Norway about meeting even national needs.
Storminess in the mid-latitudes is associated with the path of synoptic disturbances and their frontalsystems. It is well known that changes in low-frequency patterns are associated with changes in stormactivity and shifts in the storm tracks (Lau, 1988; Rogers, 1990). The NAO is clearly linked to systematicchanges in storm tracks over the Northern Hemisphere from North America to Eurasia and theMediterranean (Rogers, 1997).
There is a connection between the seasonally averaged NAO and low frequency variability within aseason (e.g. blocking) over the Atlantic (see Nakamura, 1996). There is weaker intraseasonal variabilitynear Greenland and the Labrador Sea and stronger intraseasonal variability over Europe, when the NAOindex is positive (and vice versa).
The ocean integrates the effects of storms in the form of surface waves, to exhibit a marked responseto long lasting shifts in the storm climate. The recent rising trend in the intensity of the NAO has had aprofound effect on the surface wave climate of the North Atlantic. The trend in measured wave heightsdocumented by Carter and Draper (1988) and Bacon and Carter (1991) have been supported by manyanecdotal reports about increasing wave heights encountered by mariners and North Sea oil rig operators.Recent studies by Bacon and Carter (1993) and Kushnir et al. (1997) have associated in a more
Copyright © 2001 Royal Meteorological Society Int. J. Climatol. 21: 1863–1898 (2001)
J. MARSHALL ET AL.1876
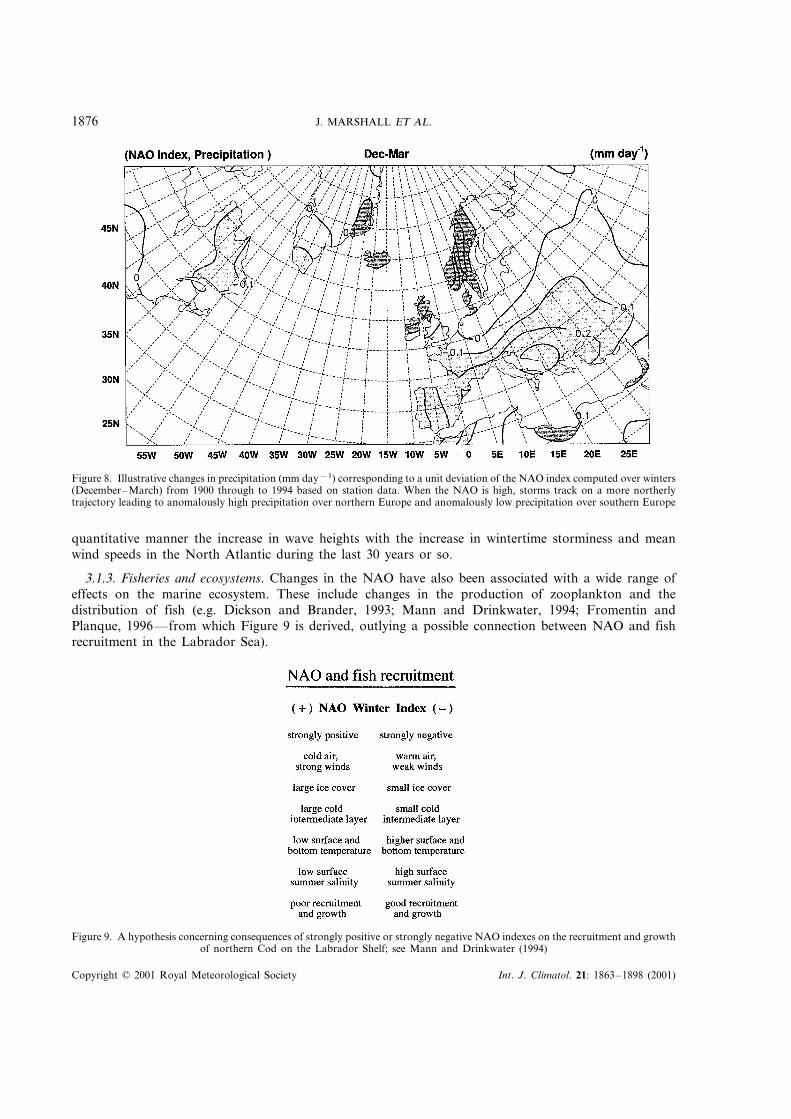
Figure 8. Illustrative changes in precipitation (mm day−1) corresponding to a unit deviation of the NAO index computed over winters(December–March) from 1900 through to 1994 based on station data. When the NAO is high, storms track on a more northerlytrajectory leading to anomalously high precipitation over northern Europe and anomalously low precipitation over southern Europe
quantitative manner the increase in wave heights with the increase in wintertime storminess and meanwind speeds in the North Atlantic during the last 30 years or so.
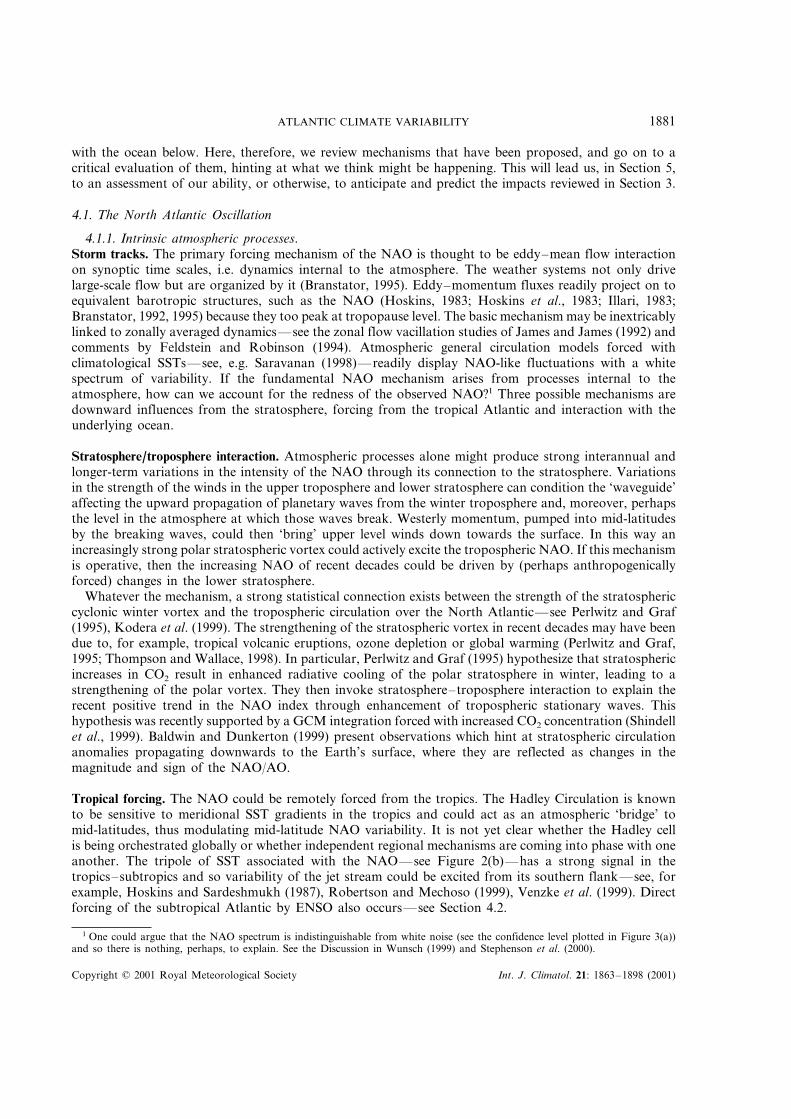
3.1.3. Fisheries and ecosystems. Changes in the NAO have also been associated with a wide range ofeffects on the marine ecosystem. These include changes in the production of zooplankton and thedistribution of fish (e.g. Dickson and Brander, 1993; Mann and Drinkwater, 1994; Fromentin andPlanque, 1996— from which Figure 9 is derived, outlying a possible connection between NAO and fishrecruitment in the Labrador Sea).
Figure 9. A hypothesis concerning consequences of strongly positive or strongly negative NAO indexes on the recruitment and growthof northern Cod on the Labrador Shelf; see Mann and Drinkwater (1994)
Copyright © 2001 Royal Meteorological Society Int. J. Climatol. 21: 1863–1898 (2001)
ATLANTIC CLIMATE VARIABILITY 1877
Evidence has also recently emerged that the NAO influences temporal and spatial variability in timingof plant growth in Scandinavia: the length of the plant growth season varied by 20 days between extremesof the NAO index (Post et al., 1997). Through effects on vegetation and climatic conditions, the NAO wasfurthermore observed to influence several aspects of life history and ecology of terrestrial, largemammalian herbivores, including phenotypic variation, fecundity, demographic trends and populationdynamical processes (Post et al., 1997). Influences of the NAO are evident among five species of ungulatesin populations in Greenland, Canada, the US, the UK, Norway and Finland.
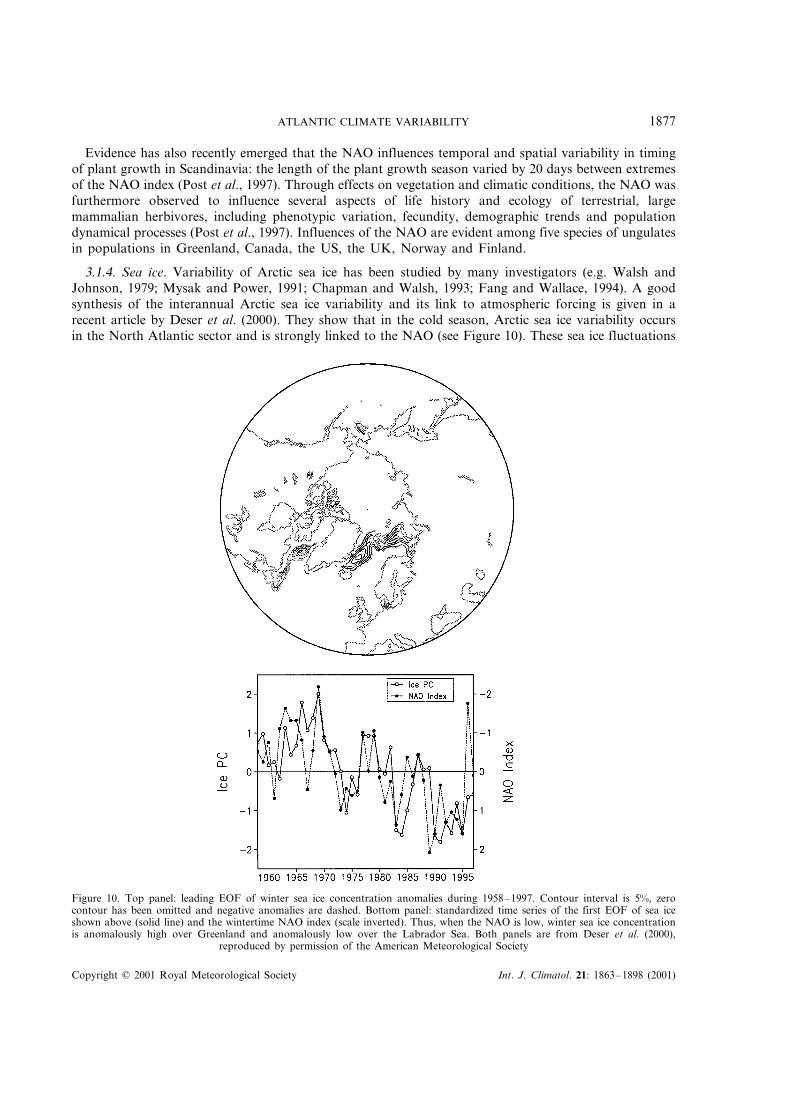
3.1.4. Sea ice. Variability of Arctic sea ice has been studied by many investigators (e.g. Walsh andJohnson, 1979; Mysak and Power, 1991; Chapman and Walsh, 1993; Fang and Wallace, 1994). A goodsynthesis of the interannual Arctic sea ice variability and its link to atmospheric forcing is given in arecent article by Deser et al. (2000). They show that in the cold season, Arctic sea ice variability occursin the North Atlantic sector and is strongly linked to the NAO (see Figure 10). These sea ice fluctuations
Figure 10. Top panel: leading EOF of winter sea ice concentration anomalies during 1958–1997. Contour interval is 5%, zerocontour has been omitted and negative anomalies are dashed. Bottom panel: standardized time series of the first EOF of sea iceshown above (solid line) and the wintertime NAO index (scale inverted). Thus, when the NAO is low, winter sea ice concentrationis anomalously high over Greenland and anomalously low over the Labrador Sea. Both panels are from Deser et al. (2000),
reproduced by permission of the American Meteorological Society
Copyright © 2001 Royal Meteorological Society Int. J. Climatol. 21: 1863–1898 (2001)

J. MARSHALL ET AL.1878
display a seesaw pattern in ice extent between the Labrador and Greenland Seas: when wintertime SLPis lower than normal over the North Atlantic, the Labrador Sea ice boundary tends to extend furthersouth in spring (the season of maximum sea ice extent) and the Greenland Sea ice boundary stays northof its climatological extent.
3.2. Tropical Atlantic �ariability
3.2.1. Rainfall and droughts. Although sea surface temperature anomalies in the tropical Atlantic areweaker than those associated with the Pacific El Nino, they are thought to play a role in sometimesdisastrous climate hazards over the Americas and Africa. In the tropical Atlantic, rainfall is governed bythe annual migration of the subtropical high pressure cells on both sides of the equator and the changesin their strength, as well as the north–south swings of the ITCZ. Many of the continental regionsbordering the tropical Atlantic experience a sharp seasonal contrast in rainfall in which half the year iswet and the other half is dry. Some have abundant rainfall, while others are semiarid. It is in thesesemiarid regions that a delay in seasonal rainfall or a significant drop in its total amount can bring serioushardship; for example, subSaharan Africa (the Sahel, 15°W–15°E, 15–20°N) with its boreal summerrainfall, and the northeast corner of Brazil (Nordeste, 35°–45°W, 2°–10°S), where it rains in the borealwinter. There has been much study of the dynamics of climate anomalies in these two regions. Hastenrathand collaborators (Hastenrath and Heller, 1977; Hastenrath, 1978; Moura and Shukla, 1981; Hastenrathet al., 1984; Ward and Folland, 1991; Hastenrath and Greischar, 1993; Nobre and Shukla, 1996) foundthat the tropical Atlantic SST distribution and associated anomalies in SLP and wind are leading factorsin determining the anomalies in seasonal Nordeste rainfall. These same climatic factors were also foundto be strongly linked with rainfall anomalies over the Sahel and western tropical Africa (Lamb, 1978;Hastenrath et al., 1984; Folland et al., 1986; 1991) and over the Caribbean/Central American sector(Enfield and Elfaro, 1999; Giannini et al., 2000).
Rainfall anomalies in the Nordeste display a wide range of time scales with clear decadal components(Figure 11(top)). Such long time scales are clearly present in the Sahel rainfall time series (Figure11(bottom)). The correlation between seasonal rainfall in the Nordeste and tropical Atlantic rainfallindicates an out of phase relationship between SST anomalies in the ocean regions underlying theNorthern and Southern Hemisphere trade wind region, respectively (Hastenrath and Heller, 1977; Mouraand Shukla, 1981). Dry Nordeste years tend to occur when SSTs north of the equator are higher thannormal and SSTs south of the equator are less than normal (see also Wagner, 1996; Carton, 1997).Rainfall in subtropical West Africa is more complex but also displays considerable dependence on asimilar out of phase variation of SST in the tropical Atlantic (Lamb, 1978; Lough, 1986; Lamb andPeppler, 1987). It rains more when Northern Hemisphere subtropical SST anomalies are positive, andSouthern Hemisphere SST anomalies are negative. Recent attempts to understand the dynamics of thisasymmetric SST distribution are described in Carton et al. (1996), Nobre and Shukla (1996) and Changet al. (1997)—see Section 4.2.
3.2.2. Hurricanes. Interannual variability of the seasonal frequency of Atlantic hurricanes is related to,amongst other factors, the sign and amplitude of the SST anomaly in the subtropics. Moreover, Gray(1990) suggests that tropical cyclone intensity is correlated with the multi-decadal fluctuation of NorthAtlantic SST (cf. Kushnir, 1994). Gray, making inferences using empirical methods, anticipates a returnto a stormier tropical climate, similar to that of the 1950s, when the North Atlantic finally recovers fromits recent cold phase. Such an increase would threaten the densely populated coastal regions in the Gulfof Mexico and the North American Atlantic seaboard, which have developed markedly during therelatively benign 1970s and 1980s.
3.3. MOC and abrupt climate change
Air–sea interaction over the Atlantic—both fluxes and sea ice extent— is orchestrated by theNAO/AO, and so secular shifts between high index and low index states play a role in and can be affected
Copyright © 2001 Royal Meteorological Society Int. J. Climatol. 21: 1863–1898 (2001)

ATLANTIC CLIMATE VARIABILITY 1879
Figure 11. Northeast Brazil rainfall index (top panel) is calculated from data for Fortaleza (3.7°S, 38.5°W) and Quixeramobim(5.3°S, 39.3°W) Brazil as obtained from the NCAR World Monthly Surface Station Climatology. The Sahel series is based on anaverage of annual standardized anomalies from 14 stations within the region 8°–20°N and 20°W–10°E obtained from the NCAR
World Monthly Surface Station Climatology
by abrupt transitions of the MOC. The role of the Atlantic in a world of increasing CO2 emission has beenthe focus of much recent attention. Models suggest that under greenhouse warming, the atmosphere maymove to a state in which the NAO/AO is anomalously high. Most (but not all—see Gent, 2001) projectionsof greenhouse gas-induced climate change anticipate a weakening of the MOC in the North Atlantic inresponse to increased freshening and warming in the subpolar seas—see Rahmstorf (1999), Rahmstorf andGanopolski (1999) and Delworth and Dixon (2000). Since the overflow and descent of cold, dense watersacross the Greenland–Scotland Ridge is a principal means by which the deep ocean is ventilated andrenewed, the suggestion is that a reduction in upper-ocean density at high northern latitudes will weakenthe MOC. If this were to occur, northern Europe and the northeastern American continent would rapidlycool.
Palaeoclimate records show that massive and abrupt climate change has occurred in the NorthernHemisphere, especially during and just after the last Ice Age—see Broecker and Denton (1989), Broecker(1997, 2000) and Marotzke (2000)—with MOC change as a plausible driver. Both paleoclimate recordsand models suggest that the changes in the strength of the MOC may occur rapidly, in a few decades.
In the admittedly short modern records of ocean variability, there is growing evidence that hydrographicchanges of decadal scale in the Arctic and subarctic seas are able to feed south across the deep northernoverflows to cause hydrographic changes in the deep and abyssal layers of the Labrador Sea (Dickson RR,Yashayaev I, Meincke J, Turrell B, Dye S, Holfort J. 2001. Rapid freshening of the deep North Atlanticover the past four decades. Nature, submitted). These variations are large and long sustained.
Copyright © 2001 Royal Meteorological Society Int. J. Climatol. 21: 1863–1898 (2001)

J. MARSHALL ET AL.1880
Unfortunately, our models do not yet adequately deal with many of the mechanisms believed to controlthe MOC, and our observations cannot yet supply many of the numbers they need. One can thusjustifiably question the accuracy of model projections. However, because the paleo record suggests thatthe strength of the MOC has been very different in past climates, and the effects would be so dramatic,a collapse of the MOC must be taken seriously even if the chance of it happening were to be small.
4. EMERGING HYPOTHESES
Climate variability over the North Atlantic involves interaction between the troposphere, thestratosphere, the underlying ocean, adjacent land masses, the arctic to the north, the tropics to thesouth and remote forcing from the Pacific. Elements of the jigsaw puzzle are presented schematicallyin Figure 12. The Atlantic basin is rather small and comes under the influence of all these processes.Despite this complexity, it is clear that the NAO is the key and primary source of variability forNorth Atlantic climate on many time scales. It reaches from the tropics to the arctic, extends high upin the stratosphere and through its effect on air–sea fluxes, is a major source of variability in SST,ocean gyres and MOC. Variability in the off-equatorial tropical Atlantic is, to a significant degree,energized by the NAO (together with remote forcing from the Pacific ENSO). The confined east–westextent of the tropical Atlantic is not conducive to strong ENSO-like coupled modes that dominatevariability in the Pacific, but coupled interactions may exist.
There is not yet a consensus about the relative contribution of proposed mechanisms on Atlanticclimate variability—whether it be interaction with the stratosphere, tropical influences or interaction
Figure 12. A schematic of TAV � NAO�MOC interactions. The NAO, reaching down into the tropics and up to high latitudes,is an important source of variability for TAV and the MOC. In turn, the TAV through its influence on tropical/subtropical SSTscan feedback on the NAO through the Hadley circulation. The MOC, a major contributor to meridional heat transport, can alsoaffect the magnitude of the pole–equator temperature gradient over the Atlantic sector, the strength of the mid-latitude jet streamand hence the NAO. Extending high up into the stratosphere, the NAO may also influence, and be influenced by, the strength andposition of the polar stratospheric vortex. The strength of the coupling between the NAO and the stratosphere above and the ocean
below is not yet clear
Copyright © 2001 Royal Meteorological Society Int. J. Climatol. 21: 1863–1898 (2001)
ATLANTIC CLIMATE VARIABILITY 1881
with the ocean below. Here, therefore, we review mechanisms that have been proposed, and go on to acritical evaluation of them, hinting at what we think might be happening. This will lead us, in Section 5,to an assessment of our ability, or otherwise, to anticipate and predict the impacts reviewed in Section 3.
4.1. The North Atlantic Oscillation
4.1.1. Intrinsic atmospheric processes.Storm tracks. The primary forcing mechanism of the NAO is thought to be eddy–mean flow interactionon synoptic time scales, i.e. dynamics internal to the atmosphere. The weather systems not only drivelarge-scale flow but are organized by it (Branstator, 1995). Eddy–momentum fluxes readily project on toequivalent barotropic structures, such as the NAO (Hoskins, 1983; Hoskins et al., 1983; Illari, 1983;Branstator, 1992, 1995) because they too peak at tropopause level. The basic mechanism may be inextricablylinked to zonally averaged dynamics—see the zonal flow vacillation studies of James and James (1992) andcomments by Feldstein and Robinson (1994). Atmospheric general circulation models forced withclimatological SSTs—see, e.g. Saravanan (1998)—readily display NAO-like fluctuations with a whitespectrum of variability. If the fundamental NAO mechanism arises from processes internal to theatmosphere, how can we account for the redness of the observed NAO?1 Three possible mechanisms aredownward influences from the stratosphere, forcing from the tropical Atlantic and interaction with theunderlying ocean.
Stratosphere/troposphere interaction. Atmospheric processes alone might produce strong interannual andlonger-term variations in the intensity of the NAO through its connection to the stratosphere. Variationsin the strength of the winds in the upper troposphere and lower stratosphere can condition the ‘waveguide’affecting the upward propagation of planetary waves from the winter troposphere and, moreover, perhapsthe level in the atmosphere at which those waves break. Westerly momentum, pumped into mid-latitudesby the breaking waves, could then ‘bring’ upper level winds down towards the surface. In this way anincreasingly strong polar stratospheric vortex could actively excite the tropospheric NAO. If this mechanismis operative, then the increasing NAO of recent decades could be driven by (perhaps anthropogenicallyforced) changes in the lower stratosphere.
Whatever the mechanism, a strong statistical connection exists between the strength of the stratosphericcyclonic winter vortex and the tropospheric circulation over the North Atlantic—see Perlwitz and Graf(1995), Kodera et al. (1999). The strengthening of the stratospheric vortex in recent decades may have beendue to, for example, tropical volcanic eruptions, ozone depletion or global warming (Perlwitz and Graf,1995; Thompson and Wallace, 1998). In particular, Perlwitz and Graf (1995) hypothesize that stratosphericincreases in CO2 result in enhanced radiative cooling of the polar stratosphere in winter, leading to astrengthening of the polar vortex. They then invoke stratosphere– troposphere interaction to explain therecent positive trend in the NAO index through enhancement of tropospheric stationary waves. Thishypothesis was recently supported by a GCM integration forced with increased CO2 concentration (Shindellet al., 1999). Baldwin and Dunkerton (1999) present observations which hint at stratospheric circulationanomalies propagating downwards to the Earth’s surface, where they are reflected as changes in themagnitude and sign of the NAO/AO.
Tropical forcing. The NAO could be remotely forced from the tropics. The Hadley Circulation is knownto be sensitive to meridional SST gradients in the tropics and could act as an atmospheric ‘bridge’ tomid-latitudes, thus modulating mid-latitude NAO variability. It is not yet clear whether the Hadley cellis being orchestrated globally or whether independent regional mechanisms are coming into phase with oneanother. The tripole of SST associated with the NAO—see Figure 2(b)—has a strong signal in thetropics–subtropics and so variability of the jet stream could be excited from its southern flank—see, forexample, Hoskins and Sardeshmukh (1987), Robertson and Mechoso (1999), Venzke et al. (1999). Directforcing of the subtropical Atlantic by ENSO also occurs—see Section 4.2.
1 One could argue that the NAO spectrum is indistinguishable from white noise (see the confidence level plotted in Figure 3(a))and so there is nothing, perhaps, to explain. See the Discussion in Wunsch (1999) and Stephenson et al. (2000).
Copyright © 2001 Royal Meteorological Society Int. J. Climatol. 21: 1863–1898 (2001)

J. MARSHALL ET AL.1882
4.1.2. Interaction with the ocean.Ocean mixed layer. An elegant model of how a mode of atmospheric variability like the NAO and theocean mixed layer might interact was provided by Barsugli and Battisti (1998), building on the model ofFrankignoul and Hasselmann (1977). They argue that on seasonal time scales, when the ocean mixed layeris in thermal equilibrium with atmospheric forcing, the heat exchange at the atmosphere–ocean interfaceis reduced compared with the hypothetical case when SST is not allowed to vary in response to thermalforcing. This may act to reduce thermal damping of the NAO, and according to Barsugli and Battisti isthe primary effect of ocean–atmosphere coupling in the mid-latitudes. In this way thermal coupling withthe ocean mixed layer enhances the persistence and variance of modes of variability such as the NAO.
It is difficult to find direct evidence of this mechanism in the observations; one cannot deduce thetemporal characteristics of the NAO from observations in the absence of SST anomalies, and thus we donot have a reference. Nevertheless, there is evidence that a significant fraction of the winter NAO variance(about 25%) may be predicted from the preceding large scale SST pattern, suggesting an oceanic influence(Czaja and Frankignoul, 1999; in press). The SST pattern responsible for this forcing projects significantlyonto the SST tripole forced by the NAO, thus providing a mutual positive feedback. As noted in Section2.1.3, the SST tripole has a significant winter to winter persistence, possibly due to the re-emergencemechanism. This, combined with the positive feedback of SST on the NAO, could explain the observed1-year memory of the winter NAO.
There is a weak and often inconsistent response in atmospheric models to mid-latitude SST anomalies(Palmer and Sun, 1985; Kushnir and Held, 1996; Peng et al., 1997; Venzke et al., 1999), which is perhapsindicative of an ambiguous response of the atmosphere too. The mechanisms at work are discussed inPeng and Whitaker (1999) and Robinson (2000). Nevertheless, Rodwell et al. (1999) are able to excite anNAO-like response in the Hadley Centre model with an SST tripole forcing of the form, as shown inFigure 2. Moreover, they show that when observed (global) SSTs are used as a lower boundary condition,then the low-frequency component of modelled and observed NAOs track one another over a 50-yearperiod, if ensembles are combined. These results could be interpreted to suggest that if the ocean plays arole in setting SST, then its inherent predictability (see Section 5) might endow low-frequency aspects ofthe NAO with predictability too. Similar results, obtained with a different model, are reported by Mehtaet al. (2000).
Although the Rodwell et al. results are of great interest, they do not necessarily imply that the NAOhas predictability or that the ocean is behaving in anything other than a passive manner. Bretherton andBattisti (2000) show, using Barsugli and Battisti’s model, that the behaviour observed in the Rodwell etal. and Mehta et al. integrations can be understood in terms of a weak response of the mid-latitudeatmosphere to underlying SST without invoking a role for ocean circulation. These calculations and theirinterpretation for atmospheric predictability are also discussed in Czaja and Marshall (2000) who,however, do not discount a possible role for ocean air circulation.
Ocean circulation. We expect an imprint of the NAO on the ocean and covarying patterns of climatesignals in the two fluids, because
(I) Changes in the NAO are reflected in marked changes in surface stress, air–sea heat fluxes,freshwater fluxes and STT—see Section 2.1.3.
(II) The ocean acts as an integrator of the high-frequency forcing acting on it. If an SST anomaly is‘tied’ to a deep thermal anomaly, which is re-exposed each winter (Alexander and Deser, 1995;Alexander and Penland, 1996), then the SST anomaly can re-emerge year after year—a process thatis known as re-emergence—and so might have a greater ability to alter, through anomalous heatfluxes, the overlying atmosphere.
(III) The interior ocean has a selective memory for winter conditions— just when the NAO isstrongest—both in the subduction of winter conditions into the thermocline (Stommel, 1979;Marshall et al., 1993; Williams et al., 1995), and in the seasonal sequestering of winter conditionsfrom below the seasonal thermocline (Qiu and Huang, 1995).
Copyright © 2001 Royal Meteorological Society Int. J. Climatol. 21: 1863–1898 (2001)
ATLANTIC CLIMATE VARIABILITY 1883
Saravanan and McWilliams (1998) generalize the Hasselmann/Frankignoul model by taking intoaccount mean flow advection in the ocean, recognizing that although intrinsic atmospheric variabilityexhibits temporal incoherence, it has strong spatial coherence, which preferentially excites selectedfrequencies of oceanic variability through a spatial resonance. Frankignoul et al. (1997) invokes internalRossby wave dynamics to select a time scale. Thermohaline circulation may also play a role. For example,multi-decadal signals in the coupled model of Delworth et al. (1993) appear to be associated withvariations in the intensity of the thermohaline circulation and variability in the region of the GreenlandSea. Griffies and Tziperman (1995) attribute these modelled decadal fluctuations in the MOC to stochasticatmospheric forcing.
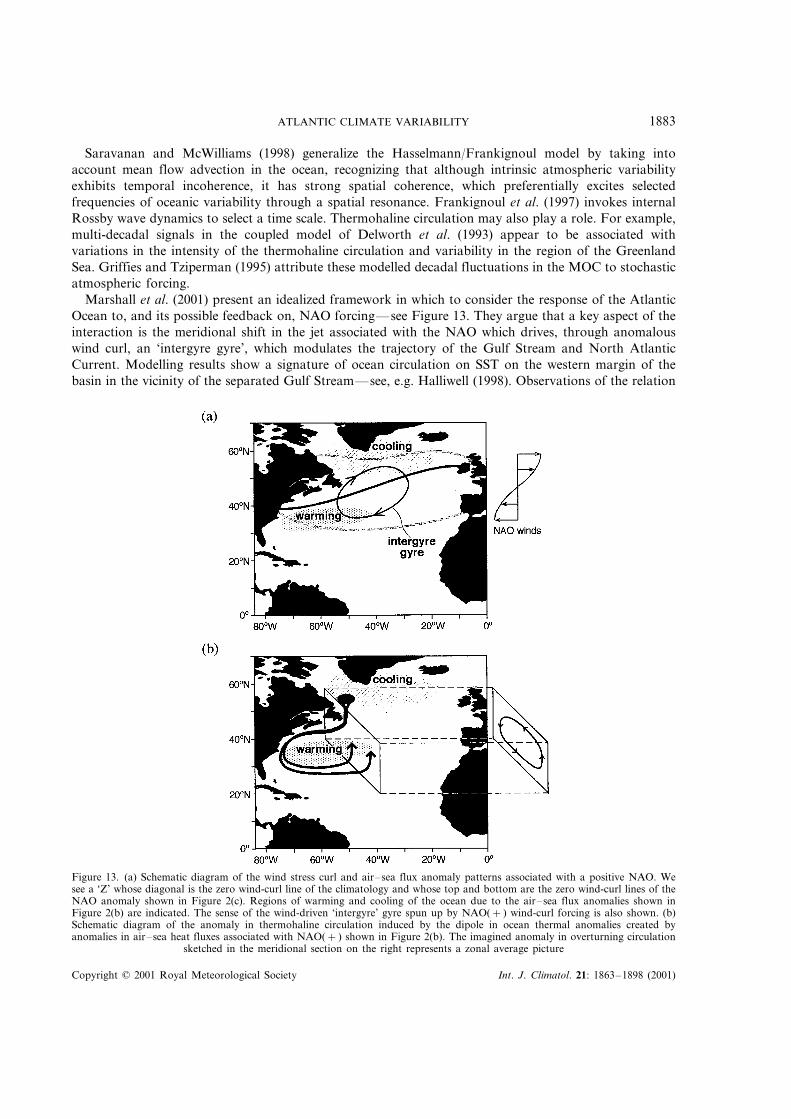
Marshall et al. (2001) present an idealized framework in which to consider the response of the AtlanticOcean to, and its possible feedback on, NAO forcing—see Figure 13. They argue that a key aspect of theinteraction is the meridional shift in the jet associated with the NAO which drives, through anomalouswind curl, an ‘intergyre gyre’, which modulates the trajectory of the Gulf Stream and North AtlanticCurrent. Modelling results show a signature of ocean circulation on SST on the western margin of thebasin in the vicinity of the separated Gulf Stream—see, e.g. Halliwell (1998). Observations of the relation
Figure 13. (a) Schematic diagram of the wind stress curl and air–sea flux anomaly patterns associated with a positive NAO. Wesee a ‘Z’ whose diagonal is the zero wind-curl line of the climatology and whose top and bottom are the zero wind-curl lines of theNAO anomaly shown in Figure 2(c). Regions of warming and cooling of the ocean due to the air–sea flux anomalies shown inFigure 2(b) are indicated. The sense of the wind-driven ‘intergyre’ gyre spun up by NAO(+ ) wind-curl forcing is also shown. (b)Schematic diagram of the anomaly in thermohaline circulation induced by the dipole in ocean thermal anomalies created byanomalies in air–sea heat fluxes associated with NAO(+ ) shown in Figure 2(b). The imagined anomaly in overturning circulation
sketched in the meridional section on the right represents a zonal average picture
Copyright © 2001 Royal Meteorological Society Int. J. Climatol. 21: 1863–1898 (2001)
J. MARSHALL ET AL.1884
between the latitude of Gulf Stream separation and the NAO are more equivocal: Taylor and Stephens(1998) and Frankignoul et al. (in press) find that observed shifts do indeed lag the NAO but only by �2years.
Buoyancy effects must also play a role: when the NAO is strong, cooling of the polar oceans isenhanced; see Figure 2(b). Should this cooling persist then one might expect the vigour of the MOC toincrease. Figure 13(b) also plots a schematic of the imagined anomaly in thermohaline circulation inducedby the NAO(+ ) buoyancy fluxes. Herbaut et al. (2001) and Eden and Willebrand (2001) study thepassive response of the Atlantic Ocean to NAO-like wind and buoyancy forcing and discuss the temporalevolution of gyres and MOC in GCMs.
4.1.3. Acti�e atmosphere–ocean coupling. To the extent that variations in gyres (and associatedinstabilities) and MOC can induce variations in ocean heat transport and thence SST, the reddenedspectrum of SST could then imprint itself back on the atmosphere, reddening its spectrum too. On verylong (millennial) time scales, the Atlantic Ocean is indeed an active player in the climate, being responsiblefor a significant poleward energy transport. On intermediate (decadal?) time scales, there may be a mutualcoupling between the two fluids. Atlantic decadal variability may thus, in part, reflect a coupledinteraction between ocean and atmosphere in the Atlantic, in which the low-frequency response of theocean to atmospheric forcing and its feedback on the atmospheric circulation result in low-frequencyoscillations. Ocean gyres and thermohaline circulation can both play a role.
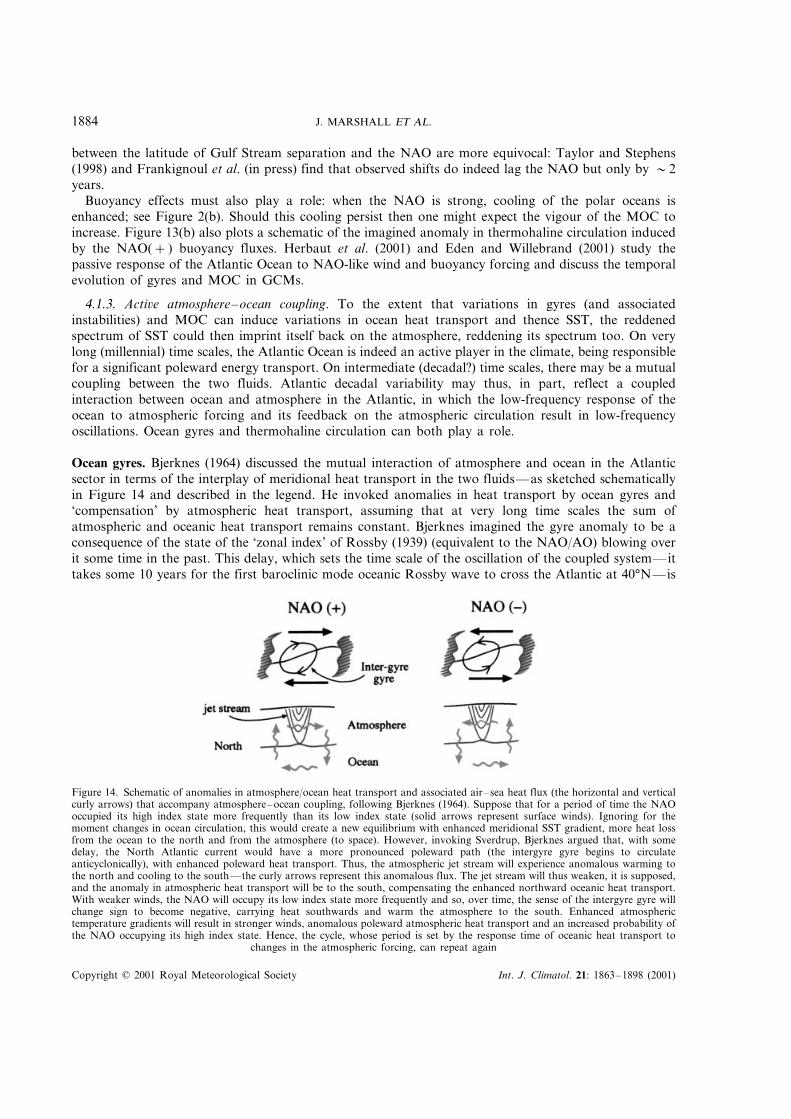
Ocean gyres. Bjerknes (1964) discussed the mutual interaction of atmosphere and ocean in the Atlanticsector in terms of the interplay of meridional heat transport in the two fluids—as sketched schematicallyin Figure 14 and described in the legend. He invoked anomalies in heat transport by ocean gyres and‘compensation’ by atmospheric heat transport, assuming that at very long time scales the sum ofatmospheric and oceanic heat transport remains constant. Bjerknes imagined the gyre anomaly to be aconsequence of the state of the ‘zonal index’ of Rossby (1939) (equivalent to the NAO/AO) blowing overit some time in the past. This delay, which sets the time scale of the oscillation of the coupled system— ittakes some 10 years for the first baroclinic mode oceanic Rossby wave to cross the Atlantic at 40°N— is
Figure 14. Schematic of anomalies in atmosphere/ocean heat transport and associated air–sea heat flux (the horizontal and verticalcurly arrows) that accompany atmosphere–ocean coupling, following Bjerknes (1964). Suppose that for a period of time the NAOoccupied its high index state more frequently than its low index state (solid arrows represent surface winds). Ignoring for themoment changes in ocean circulation, this would create a new equilibrium with enhanced meridional SST gradient, more heat lossfrom the ocean to the north and from the atmosphere (to space). However, invoking Sverdrup, Bjerknes argued that, with somedelay, the North Atlantic current would have a more pronounced poleward path (the intergyre gyre begins to circulateanticyclonically), with enhanced poleward heat transport. Thus, the atmospheric jet stream will experience anomalous warming tothe north and cooling to the south— the curly arrows represent this anomalous flux. The jet stream will thus weaken, it is supposed,and the anomaly in atmospheric heat transport will be to the south, compensating the enhanced northward oceanic heat transport.With weaker winds, the NAO will occupy its low index state more frequently and so, over time, the sense of the intergyre gyre willchange sign to become negative, carrying heat southwards and warm the atmosphere to the south. Enhanced atmospherictemperature gradients will result in stronger winds, anomalous poleward atmospheric heat transport and an increased probability ofthe NAO occupying its high index state. Hence, the cycle, whose period is set by the response time of oceanic heat transport to
changes in the atmospheric forcing, can repeat again
Copyright © 2001 Royal Meteorological Society Int. J. Climatol. 21: 1863–1898 (2001)
ATLANTIC CLIMATE VARIABILITY 1885
a crucial ingredient of theoretical models that couple ocean gyres with the atmospheric jet stream—seeLatif and Barnett (1994), Jin (1997), Weng and Neelin (1998), Cessi (2000), Goodman and Marshall(1999), Neelin and Weng (1999), Marshall et al. (2001).
There is an emerging body of theory and simulation that addresses intrinsic variability of thewind-driven ocean circulation and its effect on the position of the Gulf Stream axis and SSTanomalies—see, for example, Chang et al. (2001), Dewar (2001) and references therein. These studiessuggest that ocean gyres have internal oscillatory modes of variability that can affect SST and thence,through air–sea interaction, perhaps the overlying atmosphere.
It is not known at present whether a coupled interaction between ocean gyres and the atmosphere ispresent in the Atlantic— there are hints that it is active in some coupled ocean models, see Grotzner etal. (1998) and Timmerman et al. (1998). Czaja and Marshall (2001) present observations of enhancedpower in their Gulf Stream �TGS index and the Greenland–Iceland Low (GIL) in the 10–20-year band,and reduced power at low frequency (see Figure 3(b)). They suggest and develop simple illustrative modelsthat are associated with a coupled interaction between GIL, a sensitive indicator of the path of Atlanticstorms, and the difference in SST across the separated Gulf Stream.
Thermohaline circulation. On decadal time scales, variability could be governed by processes that modulatethe strength of the meridional circulation and its associated heat transport, and hence SST and thence theoverlying atmospheric circulation—see, e.g. Timmerman et al. (1998). For example, one might equallywell suppose that changes in thermohaline circulation—see Figure 13(b)—play a role in ocean heattransport analogous to that of changes in the strength of ocean gyres depicted in Figure 14. Dipoles inthermal anomalies generated by dipole NAO heat fluxes—see Figure 2(b)—can induce anomalies in theMOC and anomalies in its heat transport, as sketched in Figure 13(b). Thus, the curly arrows in Figure14 could also be thought to represent anomalous heat transport by thermohaline circulation induced byNAO forcing, as discussed in Marshall et al. (2001). The degree to which multi-decadal variability is purelyoceanic in nature, however, as suggested by Delworth et al. (1993), or part of a coupled mode isunclear—see Delworth and Greatbatch (2000), Selten et al. (1999), Hakkinen (2000).
Spall (1996) suggests that the southward propagation of LSW may have an impact on the stabilitycharacteristics of the western boundary current and influence the downstream intensity of the Gulf Stream,a region that is particularly important for air–sea interaction. This offers a mechanism by which thedeeper branches of the thermohaline circulation can impact, on relatively short time scales, SST and hencethe atmosphere. Curry et al. (1998) and Joyce et al. (2000) review observational evidence and develop asimple conceptual model of the delay between the transport of LSW at the Gulf Stream separation pointand its creation by convection in the Labrador Sea.
Delworth and Mann (2000) argue, and present evidence from coupled GCM experiments, thatvariations in the strength of the thermohaline circulation play a role in SST variability on multi-decadaltime scales (�70 years). On these long time scales, the tripole pattern of SST variability typical of theNorthern Hemisphere may give way to a basin-scale interhemispheric SST anomaly, as suggested byKushnir (1994; see also Schlesinger and Ramankutyy, 1994). Folland et al. (1986) noted multi-decadaltime scale variations in a similar pan-Atlantic SST pattern (dipolar across the equator) with connectionsto Sahel droughts.
4.2. Tropical Atlantic �ariability
Elements of proposed mechanisms responsible for tropical Atlantic variability are representedschematically in Figure 15.
4.2.1. Remote forcing.NAO. One very important remote source of excitation is the NAO reaching down into the tropics frommid-latitudes. A possible interpretation of the covarying fluctuations of SST and trade winds shown inFigure 6(a) is that it primarily reflects the subtropical aspect of the NAO (fluctuations in the strength andlocation of the Azores High). Indeed, the SST tripole forced by the NAO, Figure 2(a), and the SST pattern
Copyright © 2001 Royal Meteorological Society Int. J. Climatol. 21: 1863–1898 (2001)

J. MARSHALL ET AL.1886
Figure 15. SST anomalies north of the equator are subject to remote influence from the NAO itself and from ENSO-relatedvariability in the tropical Pacific. In response to a positive north–south SST difference anomaly, northward cross-equatorial windsshift the position of the ITCZ, act to reduce the northeasterly mean trade winds in the north and enhance the southeasterly tradesin the south. The resulting anomalous heat flux tends to reinforce the initial north–south SST difference, which in turn strengthensthe cross-equatorial wind anomalies. Negative feedbacks, perhaps due to horizontal heat transport by ocean currents, maycounteract the unstable air–sea interaction yielding a self-sustained oscillation. The resulting variability of the ITCZ could influence
the NAO to the north through rearranging the Hadley circulation
of Figure 6(a) are made up of common SST anomalies between the equator and 30°N. There is thus astrong coherence between the tripole and �TEQ in the decadal band (see their power spectrum in Figure3(b)). Xie and Tanimoto (1998) have incorporated this NAO forcing of the tropical Atlantic into a simplemodel, and have been able to reproduce the time evolution of the SST dipole over the past 50 years.
ENSO. The equatorial Pacific may influence the tropical Atlantic via communication along the equator,which modulates the intensity of the rising branch of the Hadley cell over Central and South America.The response is thought to be passive on ENSO time scales. Observational studies suggest that tropicalAtlantic SST and wind fields are regularly affected by Pacific ENSO on an interannual time scale(Hastenrath et al., 1987; Hameed et al., 1993; Nobre and Shukla, 1996; Enfield and Mayer, 1997). Inparticular, Enfield and Mayer (1997) show that the ENSO-induced Atlantic SST fluctuations lag theirPacific counterparts by 4–5 months. The origin of this lag is not clear, but Klein et al. (1999) argue thatthe El Nino warming signal is communicated to the tropical Atlantic via a reduction in surface latent heatflux associated with reduced trade winds. Recent analyses of two different GCMs (Saravanan and Chang,1999; Sutton et al., 2000) have successfully isolated the ENSO-related response of the tropical Atlantic intheir models.
4.2.2. Feedback processes o�er land. Feedback processes over land may play a role in the persistence ofanomalies in rainfall in sub-Saharan Africa and other regions. Charney (1975) and Charney et al. (1977)propose a ‘bio-geophysical feedback mechanism’ in which deterioration of the vegetation cover over landcan lead to a reduction of surface net radiation, which in turn enhances subsidence and reduces cloudinessand precipitation. The decreased rainfall would further diminish the vegetation cover. Courel et al. (1984)
Copyright © 2001 Royal Meteorological Society Int. J. Climatol. 21: 1863–1898 (2001)
ATLANTIC CLIMATE VARIABILITY 1887
present evidence of decreased albedo during the dry season of the Sahel, which is consistent with changesin plant cover. These land feedback processes need to be further examined in a fully coupled system.
4.2.3. Coupling with the ocean.Interhemispheric SST anomalies. Sutton et al. (2000) and Chang et al. (2000a) provide clear confirmationof the effect of tropical Atlantic SST anomalies on the atmospheric circulation in two different GCMs.They show that the increase in cross-equatorial SST gradient strongly affects the cross-equatoriallow-level tropospheric flow on the western side of the basin (see also the study of Chiang et al., 2001).When SST is warmer than normal in the northern tropics or cold in the south, there is a marked southerlywind anomaly along the Brazilian seaboard. This is accompanied by a northward shift in the ITCZ anda reduction in rainfall during the boreal spring season. This suggests that the circulation on both sides ofthe equator is related. However, the fundamental driver is the variability of the interhemispheric SSTgradient; the mechanism does not require that SST changes in each hemisphere to be simultaneous.
It has been hypothesized (Carton et al., 1996; Chang et al., 1997; Xie, 1999; Seager et al., 2000; Changet al., 2000b) that decadal variations of the interhemispheric SST gradient may stem from regionalocean–atmosphere interaction involving wind–evaporation–SST (WES) positive feedback: a reduction ofevaporation caused by a decrease in total wind speed. Carton et al. (1996) demonstrate that thewind-induced latent heat flux acts to enhance SST variability both north and south of the equator in thetropical Atlantic Ocean. Chang et al. (1997) further suggest that there is a mutual interaction between thewind-induced heat flux and SST. In response to a positive north–south anomaly in SST difference,northward cross-equatorial winds act to reduce the northeasterly mean trade winds in the north andenhance the southeasterly trades in the south. Invoking WES, they argue that anomalous heat flux tendsto reinforce the initial north–south SST difference, which in turn strengthens the cross-equatorial windanomalies. Negative feedbacks, perhaps due to horizontal heat transport by ocean currents and/oratmospheric radiative and turbulent energy fluxes, counteract the unstable air–sea interaction, yielding aself-sustained oscillation. Decadal time scales can be obtained but the period is highly sensitive to modelparameters.
Subtropical-tropical interactions. Gu and Philander (1997) hypothesize that exchange betweenextratropical and tropical water masses through thermocline ventilation can induce decadal changes in thedepth of the equatorial thermocline in the Pacific, which in turn can modify equatorial wave speeds andgive rise to decadal SST variability. Hansen and Bezdek (1996) presented observational evidence ofanomalous SST variability on decadal scales extending into the tropical Atlantic along the preferred pathof the subtropical gyre. Malanotte-Rizzoli et al. (2000) discuss and model water–mass pathways betweenthe subtropics and the tropics in the Atlantic. Shallow exchange windows from the northern subtropics(�30°N) are found and the important role of the seasonal cycle and its effect on the position of the ITCZhighlighted. It has even been suggested—see Yang (1999)— that on a decadal scale, TAV might be linkedto convection in the Labrador Sea. However, the full extent to which these tropical–extratropical oceanexchange processes affect Atlantic SST variability is unknown.
The Atlantic ENSO. The Atlantic ENSO mode appears to be stable (Zebiak, 1993) as anticipated fromdelayed oscillator theory (Battisti and Hirst, 1989). Hence, the Atlantic ENSO is likely to be forced byexternal stochastic forcing. Delecluse et al. (1994) suggest that the Pacific ENSO provides one possiblesource of external forcing for interannual SST variability in the eastern equatorial Atlantic. NAO forcingfrom the subtropics is another.
4.3. Critical e�aluation of mechanisms
It is clear that the NAO is a mode of variability internal to the atmosphere whose primary excitationmechanism is the interaction of the Atlantic jet stream with synoptic eddies. The NAO power spectrumhas increasing amounts of power at lower frequencies, a characteristic that is more noteworthy than localpeaks. This redness is unlikely to be a consequence of the internal dynamics of the NAO, and is suggestive
Copyright © 2001 Royal Meteorological Society Int. J. Climatol. 21: 1863–1898 (2001)
J. MARSHALL ET AL.1888
of an ‘external influence’. The most likely influences are the stratosphere, the underlying ocean and thetropics.
If the NAO is best thought of as a regional manifestation of a hemispheric phenomenon— theAO— then through its influence on the vertical/meridional propagation of planetary waves, it may besensitive to the strength of the stratospheric polar vortex. It is not yet clear how much ‘downward control’is going on (the stratospheric to tropospheric mass ratio is very low). Details of the mechanism and aquantification of its effect on the troposphere are still a subject of active research. But if the linkage issufficiently strong, the redness of the NAO spectrum could be a consequence of anthropogenicallyinduced changes in the stratosphere.
The underlying ocean is driven by stochastic-in-time but coherent-in-space air–sea flux variability thatreflects the spatial pattern of the NAO. It integrates over the temporal ‘noise’ of the forcing producing a‘red’ power spectrum in oceanic variables. Observations suggest that SST does have a small butdiscernible impact on the NAO, and so could play a role in the reddening of the NAO spectrum. Thissmall positive feedback is in agreement with modelling studies. It is difficult to isolate localized patternsof SST to which the atmosphere is most sensitive, but basin-wide SST patterns that resemble the SSTtripole itself seem to be involved with tropical/subtropical centres of action probably playing the majorrole. In middle to high latitudes persistence associated with the re-emergence of SST with the annual cycle,can, through its feedback on the overlying atmosphere, lead to some year-to-year persistence inatmospheric variables.
On seasonal to interannual time scales, the coupled system can be rather well described by stochasticclimate models appropriately modified to allow for (i) feedback between SST and air temperature, whichleads to reduced thermal damping and (ii) enhanced persistence via the re-emergence process.
On longer time scales, however, the ocean—via wind and thermohaline circulation—can modulate SSTvariability in the vicinity of the separated Gulf Stream on the western margin of the basin, whereadvection by ocean currents is particularly strong. The ocean could imprint itself back on the atmosphereon longer time scales, thus reddening atmospheric variability; this might be called ‘passive coupling’ inthat it does not involve active coupled dynamics. In this way the ocean can modulate the amplitude andphase of the NAO on decadal time scales, but it can do so without ‘active dynamical coupledatmosphere–ocean modes’. We do not exclude the possible existence of active coupled modes, but it maynot be necessary to invoke them.
It seems likely that the MOC of the ocean can support damped modes of internal variability that canbe excited by stochastic atmospheric forcing whose primary source is the NAO. Abrupt shifts of the MOCoccur in models (and as suggested by the paleo record, perhaps in nature too), which could plausibly leadto shifts in the secular trends of the NAO and thence TAV.
In the tropical Atlantic, there does not appear to be a single dominant mechanism controllingvariability. The atmosphere in the tropical Atlantic is responsive to changes in SST, and particularly thecross-equatorial gradient. A primary source of variability appears to be external forcing from the NAOand ENSO, whose effect can be enhanced through, for example, the WES mechanism. What is unclear isif the interaction involves interhemispheric, or single-hemisphere SST gradients, and to what extent oceandynamics play a role. Along the equator local interactions seem to be important, but its predictability andinfluence outside the region remains undetermined.
5. DISCUSSION AND PROSPECTS FOR PREDICTABILITY
5.1. Predictability
Climate predictability in the North Atlantic region can be divided into two types:
1. Atmospheric predictability: prediction of the statistical properties of meteorological variables thataffect human life directly, such as the surface air temperature and precipitation over land.
Copyright © 2001 Royal Meteorological Society Int. J. Climatol. 21: 1863–1898 (2001)
ATLANTIC CLIMATE VARIABILITY 1889
2. Oceanic predictability: prediction of the state of the North Atlantic Ocean, including surfaceproperties such as the SST, and also the subsurface temperature, salinity, and current structure.
Although the two types of predictability are closely related, it is useful to distinguish between them.They involve very different processes and time scales and have different uses. Atmospheric predictabilitycan only be addressed in a statistical sense, since the deterministic predictability limit is of the order of aweek. Since oceanic time scales are much longer, one could conceivably make deterministic predictions forthe ocean on decadal time scales.
The social utility of atmospheric predictions is clear. Oceanic predictability, as discussed below, is oftena prerequisite for long-term atmospheric predictability. However, it can also be of intrinsic value in itself.The most direct application is, of course, to fisheries and marine ecosystems. There are also more indirectapplications. Much effort has been put into simulating the mean state of the ocean using oceanic orcoupled GCMs. However, one of the primary uses of GCMs is to simulate climate variability. Predictingthe distributions of dynamical oceanic variables and biogeochemical tracers on interannual to decadaltime scales using GCMs, and then testing these predictions using observations, can be a very good wayto test the GCMs. Certainly tests of this sort would be essential before one can put more trust intopredictions of, for example, ‘thermohaline collapse’ from coarse resolution ocean GCMs.
Since atmospheric processes have very short memory, to carry out atmospheric prediction on longerthan seasonal time scales, one needs to invoke some kind of memory in the boundary conditions. Thismemory most likely resides in the ocean in the form of SST anomalies, and therefore oceanicpredictability is often a necessary condition for atmospheric predictability (unless the memory happens toreside in some other component of the climate system, such as sea ice or the land surface). Observationalstudies of Atlantic variability have shown there are indeed long-lived SST anomalies with coherent spatialstructure in the mid-latitudes (Deser and Blackmon, 1993; Kushnir, 1994; Czaja and Marshall, 2001) andin the tropics (Carton et al., 1996).
Another necessary condition for atmospheric predictability is that there be a coherent response in theatmospheric flow to SST anomalies. Most atmospheric GCM studies find a rather weak response tomid-latitude SST anomalies, when compared with internal atmospheric variability (Kushnir and Held,1996; Blade, 1997; Lau, 1997; Saravanan, 1998). Although this could be a deficiency of the currentgeneration of GCMs, it could also turn out to be a property of the real climate system. A coherentatmospheric response to SST anomalies in the tropical Atlantic could also provide atmosphericpredictability. Although the local effects of tropical Atlantic SST anomalies are fairly well established,their remote effects have only begun to be addressed. Observations, however, suggest that there is somepredictability in the early winter NAO—see Czaja and Frankignoul (1999). As discussed in Czaja andFrankignoul (in press), the signal is mainly from mid-latitudes but there is a competing forcing from thetropics.
It is often argued that the weak and often inconsistent response of current atmospheric GCMs tomid-latitude SST anomalies is perhaps the biggest stumbling block to progress in using numerical modelsto study atmospheric predictability. It should be noted, however, that the relevance to the coupledproblem of prescribing a fixed SST (implying an infinite heat capacity) and seeking a response is open toquestion—see Sutton and Mathieu (in press). Ideally, to quantify the atmospheric predictability, oneneeds to address the coupled problem with higher resolution models using better physicalparameterizations. While our GCMs are being improved, statistical and empirical models of atmosphericpredictability could be employed.
Some AGCMs—see, e.g. Rodwell et al. (1999) and Mehta et al. (2000)—show modest skill inreproducing aspects of the observed NAO behaviour, especially its interdecadal fluctuations when forcedwith the time history of observed, global SSTs and sea ice concentrations over the past 50 years or so.However, as discussed previously, these integrations can be understood in terms of a weak response of themid-latitude atmosphere to underlying SST without invoking a role for ocean circulation.
Oceanic predictability, unlike atmospheric predictability, does not require memory to reside in theboundary conditions, since oceanic processes can easily supply the memory. One can have predictability
Copyright © 2001 Royal Meteorological Society Int. J. Climatol. 21: 1863–1898 (2001)
J. MARSHALL ET AL.1890
in the deep ocean even if there is no atmospheric predictability at all. Indeed, modelling work by Griffiesand Bryan (1997) suggests that the North Atlantic Ocean may have predictability on the order of a decadeor longer. All that is required is the presence of spatially and temporally coherent oceanic variability oninterannual and longer time scales. This variability could be generated through several differentmechanisms. A plausible scenario is that there are damped modes of oceanic variability that are excitedby stochastic atmospheric forcing (Griffies and Tziperman, 1995; Saravanan and McWilliams, 1997;Delworth and Greatbatch, 2000; Marshall et al., 2001).
5.2. Outlook
Scientists in Europe and the US are planning a major research program focusing on Atlantic climatevariability in the context of CLIVAR, an international climate research program. The major elements ofthis program are designed to investigate simultaneously the ocean–atmosphere– land– ice interactionsassociated with three major climate phenomena reviewed here: the NAO, TAV and MOC.
It is proposed to pursue a balanced approach between observations, modelling and theory as well asdiagnostic studies, to understand better the primary climate phenomena, their interactions and thepotential for predictability. This will be achieved by implementing a network of sustained observations,which will serve as the backbone for diagnostic studies and coupled data assimilation. Initialobservational activities will cover the Atlantic with a focus on the sector north of 30°S, and include thegateways to the Arctic Ocean.
A series of shorter term regionally focused experiments are planned, which will be imbedded within thesustained observing network to allow in-depth understanding of particular regions and/or key processes.Historical and proxy datasets will be enhanced and oceanographic and atmospheric reanalyses conducted.It is hoped that the program will lead to (i) an Atlantic sector component of a global climate observingsystem that will be able to constrain coupled climate models; (ii) improved coupled climate models thatare able to simulate the observed climate variability of the last few decades and, hence, will be the basisfor future climate predictions on seasonal to multi-decadal time scales; and (iii) collect comprehensivedatasets of observed and/or analysed fields that form the basis for Atlantic climate variability studies.
The main objectives of the program are to:
� Describe and model coupled atmosphere–ocean– land interactions in the Atlantic sector, quantify theirinfluences on the regional and global climate system, and determine their predictability.
� Assemble quantitative historical, proxy and real time datasets that may be used to test, improve andinitialize models of coupled Atlantic climate variability.
� Investigate the sensitivity of the MOC to changes in surface forcing and assess the likelihood of abruptclimate change.
ACKNOWLEDGEMENTS
We acknowledge conversations with countless colleagues at numerous meetings over the past years thathave brought into focus the fascinating and challenging problems of climate variability in the AtlanticSector. This work would not have been possible without the generous support of our funding agencies,NOAA, NSF and NASA.
REFERENCES
Alexander MA, Deser C. 1995. A mechanism for the recurrence of wintertime midlatitude SST anomalies. Journal of PhysicalOceanography 25: 122–137.
Alexander MA, Penland C. 1996. Variability in a mixed layer driven by stochastic atmospheric forcing. Journal of Climate 9:2424–2442.
Ambaum MH, Hoskins BJ, Stephenson D. 2001. Arctic Oscillation or North Atlantic Oscillation. Journal of Climate 14(16):3495–3507.
Appenzeller C, Schwander J, Sommer S, Stocker TF. 1998. The North Atlantic Oscillation and its imprint on precipitation and iceaccumulation in Greenland. Geophysics Research Letters 25: 1939–1942.
Copyright © 2001 Royal Meteorological Society Int. J. Climatol. 21: 1863–1898 (2001)
ATLANTIC CLIMATE VARIABILITY 1891
Bacon S, Carter JT. 1993. A connection between mean wave height and atmospheric pressure gradient in the North Atlantic.International Journal of Climatology 13: 423–436.
Bacon S, Carter DJ. 1991. Wave climate changes in the North Atlantic and North Sea. International Journal of Climatology 11:545–558.
Baldwin MP, Dunkerton TT. 1999. Propagation of the Arctic Oscillation from the stratosphere to the troposphere. Journal ofGeophysics Research 104: 30937–30946.
Barlow LK, White JWC, Barry RG, Rogers JC, Grootes PM. 1993. The North-Atlantic Oscillation signature in deuterium anddeuterium excess signals in the Greenland ice-sheet project—2 Ice core, 1840–1970. Geophysics Research Letters 20: 2901–2904.
Barnston A, Livezey RE. 1987. Classification, seasonality and persistence of low-frequency circulation patterns. Monthly WeatherRe�iew 115: 1083–1126.
Barsugli JJ, Battisti DS. 1998. The basic effects of atmosphere-ocean thermal coupling on middle-latitude variability. Journal ofAtmospheric Science 55: 477–493.
Battisti DS, Hirst AC. 1989. Interannual variability in the tropical atmosphere/ocean system: influence of the basic state, oceangeometry and non-linearity. Journal of Atmospheric Science 46: 1687–1712.
Battisti DS, Bhatt US, Alexander MA. 1995. A modeling study of the interannual variability of the North Atlantic Ocean. Journalof Climate 8: 3067–3083.
Belgrano A, Lindahl O, Hernroth B. 1999. North Atlantic Oscillation primary productivity and toxic phytoplankton in the GullmarFjord, Sweden (1985–1996). Proceedings of the Royal Society of London (Series B—Biological Sciences) 266: 425–430.
Belkin IM, Levitus S, Antonov J, Malmberg SA. 1998. Great Salinity Anomalies’ in the North Atlantic. Progress in Oceanography41: 1–68.
Beniston M. 1997. Variations of snow depth and duration in the Swiss Alps over the last 50 years: links to changes in large-scaleclimatic forcings. Climatic Change 36: 281–300.
Benner TC. 1999. Central England temperatures: long-term variability and teleconnections. International Journal of Climatology 19:391–403.
Bjerknes J. 1964. Atlantic air–sea interaction. In Ad�ances in Geophysics, vol. 10, Landberg HE, van Mieghem J (eds). AcademicPress: New York; 1–82.
Blade I. 1997. The influence of midlatitude ocean–atmosphere coupling on the low-frequency variability of a GCM.1. No tropicalSST forcing. Journal of Climate 10: 2087–2106.
Bradley RS, Diaz HF, Eischeid JK, Jones PD, Kelley PM, Goodes CM. 1987. Precipitation fluctuations over the NorthernHemisphere land areas since the mid-19th century. Science 237: 171–175.
Branstator G. 1995. Organization of storm track anomalies by recurring low frequency circulation anomalies. Journal of AtmosphericScience 52: 207–226.
Branstator G. 1992. The maintenance of low-frequency atmospheric anomalies. Journal of Atmospheric Science 49: 629–648.Bretherton CS, Battisti DS. 2000. An interpretation of the results from AGCMs forced by the time history of the observed SST
distribution. Geophysics Research Letters 27: 767–770.Broecker WS. 1997. Thermohaline circulation, the Achilles heel of our climate system: will man-made CO2 upset the current
balance? Science 278: 1582–1588.Broecker WS. 2000. Was a change in thermohaline circulation responsible for the Little Ice Age? Proceedings of the National
Academy of Science (USA) 97: 1339–1342.Broecker WS, Denton GH. 1989. The role of ocean–atmosphere reorganizations in glacial cycles. Geochimistry Cosmochimistry Acta
53: 2465–2501.Cane M, Clement AC. 1999. A role for the tropical Pacific coupled ocean-atmosphere system on Milankovitch and millennial
timescales. Part II: global impacts. In Mechanisms of Global Climate Change at Millennial Time Scales. Geophysical Monograph112, Clarke PU, Webb RS, Keigwin LD (eds). AGU: Washington, DC; 373–383.
Carter DJT, Draper L. 1988. Has the north-east Atlantic become rougher? Nature 332: 494.Carton JA. 1997. Climatology—see-saw sea. Nature 385: 487–489.Carton JA, Huang B. 1994. Warm events in the tropical Atlantic. Journal of Physical Oceanography 24: 888–893.Carton JA, Cao XH, Giese BS, da Silva AM. 1996. Decadal and interannual SST variability in the tropical Atlantic Ocean. Journal
of Physical Oceanography 26: 1165–1175.Cayan DR. 1992a. Latent and sensible heat-flux anomalies over the northern oceans— the connection to monthly atmospheric
circulation. Journal of Climate 5: 354–369.Cayan DR. 1992b. Latent and sensible heat-flux anomalies over the northern oceans—driving the sea-surface temperature. Journal
of Physical Oceanography 22: 859–881.Cessi P. 2000. Thermal feedback on wind stress as a contributing cause of climate variability. Journal of Climate 13(1): 232–244.Chang K-I, Ghil M, Ide K, Lai C-CA. 2001. Transition to aperiodic variability in a wind-driven double-gyre circulation model.
Journal of Physical Oceanography 31: 1260–1286.Chang P, Ji L, Li H. 1997. A decadal climate variation in the tropical Atlantic Ocean from thermodynamic air–sea interactions.
Nature 385: 516–518.Chang P, Saravanan R, Ji L, Hegerl GC. 2000a. The effect of local sea surface temperatures on atmospheric circulation over the
tropical Atlantic sector. Journal of Climate 13(13): 2195–2216.Chang P, Ji L, Saravanan R. 2000b. A hybrid coupled model study of tropical Atlantic variability. Journal of Climate 14(3):
361–390.Chapman WL, Walsh JE. 1993. Recent variations of sea ice and air-temperature in high-latitudes. Bulletin of the American
Meteorological Society 74: 33–47.Charney JG. 1975. Dynamics of deserts and drought in the Sahel. Quarterly Journal of the Royal Meteorological Society 101:
193–202.Charney JG, Stone PH, Quirk WJ. 1977. Drought in the Sahara: a biogeophysical feedback mechanism. Science 187: 434–435.
Copyright © 2001 Royal Meteorological Society Int. J. Climatol. 21: 1863–1898 (2001)

J. MARSHALL ET AL.1892
Chen DL, Hellstrom C. 1999. The influence of the North Atlantic Oscillation on the regional temperature variability in Sweden:spatial and temporal variations. Tellus 51: 505–516.
Chiang JCH, Zebiak SE, Cane MA. 2001. Relative roles of elevated heating and surface temperature gradients in driving anomaloussurface winds over tropical oceans. Journal of Atmospheric Science 58: 1371–1394.
Clinet S, Martin S. 1992. 700-hPa Geopotential height anomalies from a statistical analysis of the French Hemis Data Set.International Journal of Climatology 12: 229–256.
Coachman LK, Aagaard K. 1988. Transports through Bering Strait: annual and interannual variability. Journal of GeophysicalResearch 93: 15535–15539.
Colman A, Davey M. 1999. Prediction of summer temperature, rainfall and pressure in Europe from preceding winter NorthAtlantic ocean temperature. International Journal of Climatology 19: 513–536.
Cook ER, D’Arrigo RD, Briffa KR. 1998. A reconstruction of the North Atlantic Oscillation using tree-ring chronologies fromNorth America and Europe. The Holocene 8(1): 9–17.
Courel MF, Kandel RS, Rasool SI. 1984. Surface albedo and the Sahel drought. Nature 307: 528–538.Covey DL, Hastenrath S. 1978. Pacific El Nino phenomenon and Atlantic circulation. Monthly Weather Re�iew 106: 1280–1287.Cullen HM, de Menocal PB. 2000. North Atlantic influence on Tigris–Euphrates streamflow. International Journal of Climatology
20: 853–863.Curry RG, McCartney MS. 2001. Ocean gyre circulation changes associated with the North Atlantic Oscillation. Journal of Physical
Oceanography 31: 3374–3400.Curry RG, McCartney MS, Joyce TM. 1998. Oceanic transport of subpolar climate signals to mid-depth subtropical waters. Nature
391: 575–577.Czaja A, Frankignoul C. In press. Observed impact of Atlantic SST and anomalies on the North Atlantic Oscillation. Journal of
Climate.Czaja A, Marshall J. 2001. Observations of Atmosphere Ocean coupling in the North Atlantic. Quarterly Journal of the Royal
Meteorological Society 127: 1893–1916.Czaja A, Marshall J. 2000. On the interpretation of AGCMs response to prescribed time-varying SST anomalies. Geophysics
Research Letters 27: 1927–1930.Czaja A, Frankignoul C. 1999. Influence of the North Atlantic SST anomalies on the atmospheric circulation. Geophysics Research
Letters 26: 2969–2972.Da Silva A, Young AC, Levitus S. 1994. Atlas of Surface Marine Data, Volume 1: Algorithms and Procedures. US Department of
Commerce: Washington, DC. NOAA Atlas NESDIS 6.Delecluse P, Servain J, Levy C, Arpe K, Bengtsson L. 1994. On the connection between the 1984 Atlantic warm event and the
1982–83 ENSO. Tellus 46A: 448–464.Deque M, Servain J. 1989. Teleconnections between tropical Atlantic sea surface temperature and midlatitude 50 kPa heights during
1964–1986. Journal of Climate 2: 929–944.Delworth TL. 1996. North Atlantic interannual variability in a coupled ocean–atmosphere model. Journal of Climate 9: 2356–2375.Delworth TL, Dixon KW. 2000. Implications of the recent trend in the Arctic/North Atlantic Oscillation for the North Atlantic
thermohaline circulation. Journal of Climate 13: 3721–3727.Delworth TL, Mann ME. 2000. Observed and simulated multidecadal variability in the Northern Hemisphere. Climate Dynamics 16:
661–676.Delworth TL, Greatbatch RJ. 2000. Multidecadal thermohaline circulation variability driven by atmospheric surface flux forcing.
Journal of Climate 13: 1481–1495.Delworth TL, Manabe S, Stouffer RJ. 1993. Interdecadal variations of the thermohaline circulation in a coupled ocean-atmosphere
model. Journal of Climate 6: 1993–2011.Deser C. 2000. On the teleconnectivity of the Arctic Oscillation. Geophysics Research Letters 27: 779–782.Deser C, Blackmon ML. 1993. Surface climate variations over the North Atlantic Ocean during winter: 1900–1989. Journal of
Climate 6: 1743–1753.Deser C, Walsh JE, Timlin MS. 2000. Arctic sea ice variability in the context of recent wintertime atmospheric circulation trends.
Journal of Climate 13: 617–633.Dewar WK. 2001. On ocean dynamics in midlatitude climate. Journal of Climate 14: 4380–4397.Dickson RR, Brander KM. 1993. Effect of changing windfield on cod stocks of the North Atlantic. Fishing and Oceanography 2:
124–153.Dickson RR, Namias J. 1976. North American influence on the circulation and climate of the North Atlantic Sector. Monthly
Weather Re�iew 104: 1255–1265.Dickson R, Lazier J, Meincke J, Rhines P, Swift J. 1996. Long-term co-ordinated changes in the convective activity of the North
Atlantic. Progress in Oceanography 38: 241–295.Dickson RR, Meincke J, Malmberg SA, Lee AJ. 1988. The great salinity anomaly in the northern North Atlantic 1968–1982.
Progress in Oceanography 20: 103–151.Dippner JW. 1997. Recruitment success of different fish stocks in the North Sea in relation to climate variability. Deutsche
Hydrographische Zeitschrift 49: 277–293.Eden C, Willebrand J. 2001. Mechanism of interannual to decadal variability of the North Atlantic circulation. Journal of Climate
14: 2226–2280.Enfield DB, Elfaro EJ. 1999. The dependence of Caribbean rainfall on the interaction of the tropical Atlantic and Pacific oceans.
Journal of Climate 12: 2093–2103.Enfield DB, Mayer DA. 1997. Tropical Atlantic sea surface temperature variability and its relation to El Nino Southern Oscillation.
Journal of Geophysical Research—Oceans 102: 929–945.Esbensen SK. 1984. A comparison of intermonthly and interannual teleconnections in the 700 mb geopotential height field during
the Northern Hemisphere winter. Monthly Weather Re�iew 112: 2016–2032.Fang ZF, Wallace JM. 1994. Arctic sea-ice variability on a timescale of weeks and its relation to atmospheric forcing. Journal of
Climate 7: 1897–1914.
Copyright © 2001 Royal Meteorological Society Int. J. Climatol. 21: 1863–1898 (2001)

ATLANTIC CLIMATE VARIABILITY 1893
Feldstein SB. 2000. The timescale, power spectra, and climate noise properties of teleconnection patterns. Journal of Climate 13:4430–4440.
Feldstein SB, Robinson WA. 1994. Comments on ‘Spatial structure of ultra-low frequency variability of the flow in a simpleatmospheric circulation model’. Quarterly Journal of the Royal Meteorological Society 120: 739–745.
Folland CK, Owen JA, Ward NM, Coleman AW. 1991. Prediction of seasonal rainfall in the Sahel region using empirical anddynamical methods. Journal of Forecasting 10: 21–56.
Folland CK, Palmer TN, Parker DE. 1986. Sahel rainfall and worldwide sea temperatures, 1901–85. Nature 320: 602–607.Forchhammer MC, Stenseth NC, Post E, Langvatn R. 1998. Population dynamics of Norwegian red deer: density-dependence and
climatic variation. Proceedings of the Royal Society of London (Series B—Biological Sciences) 265: 341–350.Frankignoul C. 1985. Sea surface temperature anomalies, planetary waves and air–sea feedback in the middle latitudes. Re�iews in
Geophysics 23: 357–390.Frankignoul C, de Coetlogon G, Joyce TM, Dong S. In press. Gulf Stream variability and ocean–atmosphere interaction. Journal
of Physical Oceanography.Frankignoul C, Hasselmann K. 1977. Stochastic climate models, part II: application to sea-surface temperature variability and
thermocline variability. Tellus 29: 289–305.Frankignoul C, Czaja A, L’Heveder B. 1998. Air–sea feedback in the North Atlantic and surface boundary conditions for ocean
models. Journal of Climate 11: 2310–2324.Frankignoul C, Muller P, Zorita E. 1997. A simple model of the decadal response of the ocean to stochastic wind forcing. Journal
of Physical Oceanography 27: 1533–1546.Fromentin JM, Planque B. 1996. Calanus and environment in the eastern North Atlantic. 2. Influence of the North Atlantic
Oscillation on C-finmarchicus and C-helgolandicus. Marine Ecology—Progress Series 134: 111–118.Fromentin JM, Stenseth NC, Gjosaeter J, Johannessen T, Planque B. 1998. Long-term fluctuations in cod and pollack along the
Norwegian Skagerrak coast. Marine Ecology—Progress Series 162: 265–278.Gent PR. 2001. Will the North Atlantic Ocean thermohaline circulation weaken during the 21st century? Geophysics Research
Letters 28: 1023–1026.Giannini A, Kushnir Y, Cane MA. 2000. Interannual variability of Caribbean rainfall, ENSO and the Atlantic Ocean. Journal of
Climate 13: 297–311.Goodman J, Marshall J. 1999. A model of decadal middle-latitude atmosphere-ocean coupled modes. Journal of Climate 12:
621–641.Gray WM. 1990. Strong association between west African rainfall and US landfall of intense hurricanes. Science 249: 1251–1256.Griffies SM, Bryan K. 1997. Predictability of North Atlantic multi-decadal climate variability. Science 275: 181–184.Griffies SM, Tziperman E. 1995. A linear thermohaline oscillator driven by stochastic atmospheric forcing. Journal of Climate 8:
2440–2453.Grotzner A, Latif M, Barnett TP. 1998. A decadal climate cycle in the North Atlantic Ocean as simulated by the ECHO coupled
GCM. Journal of Climate 11: 831–847.Gu DF, Philander SGH. 1997. Interdecadal climate fluctuations that depend on exchanges between the tropics and extratropics.
Science 275: 805–807.Hakkinen S. 2000. Decadal air–sea interaction in the North Atlantic based on observations and modeling results. Journal of Climate
13: 1195–1219.Hall MM, Bryden HL. 1982. Direct estimates and mechanisms of ocean heat transport. Deep Sea Research 29: 339–359.Hall A, Manabe S. 1997. Can local linear stochastic theory explain sea surface temperature and salinity variability? Climate
Dynamics 13: 167–180.Halliwell G. 1998. Simulation of North Atlantic decadal/multidecadal winter SST anomalies driven by basin-scale atmospheric
circulation anomalies. Journal of Physical Oceanography 28: 5–21.Hameed S, Sperber KR, Meinster A. 1993. Teleconnections of the Southern Oscillation in the tropical Atlantic sector in the OSU
coupled ocean–atmosphere GCM. Journal of Climate 6: 487–498.Hansen DV, Bezdek H. 1996. On the nature of decadal anomalies in North Atlantic sea surface temperature. Journal of Geophysics
Research 101: 8749–8758.Hartley S. 1999. Winter Atlantic climate and snowfall in the south and central Appalachians. Physical Geography 20: 1–13.Hartley S, Keables MJ. 1998. Synoptic associations of winter climate and snowfall variability in New England, USA, 1950–1992.
International Journal of Climatology 18: 281–298.Hasselman K. 1976. Stochastic climate models. Part I: theory. Tellus 28: 289–305.Hastenrath S. 1978. On modes of tropical circulation and climate anomalies. Journal of Atmospheric Science 35: 2222–2231.Hastenrath S, Greischar L. 1993. Circulation mechanisms related to Northeast Brazil rainfall anomalies. Journal of Geophysical
Research—Atmospheres 98: 5093–5102.Hastenrath S, Heller L. 1977. Dynamics of climatic hazards in Northeast Brazil. Quarterly Journal of the Royal Meteorological
Society 103: 77–92.Hastenrath S, Castro LC, Acietuno P. 1987. The Southern Oscillation in the tropical Atlantic Sector. Contributions to Atmospheric
Physics 60: 447–463.Hastenrath S, Wu M-C, Chu P-S. 1984. Towards the monitoring and prediction of north-east Brazil droughts. Quarterly Journal of
the Royal Meteorological Society 110: 411–425.Herbaut C, Sirven J, Czaja A. 2001. An idealized model study of the mass and heat transports between the subpolar and subtropical
gyres. Journal of Physical Oceanography 31: 2903–2916.Hirst A, Hastenrath S. 1983. Atmosphere–ocean mechanism of climate anomalies in the Angola-tropical Atlantic sector. Journal of
Physical Oceanography 13: 1146–1157.Horel JD, Wallace MJ. 1981. Planetary scale phenomenon associated with the southern oscillation. Monthly Weather Re�iew 109:
813–829.
Copyright © 2001 Royal Meteorological Society Int. J. Climatol. 21: 1863–1898 (2001)
J. MARSHALL ET AL.1894
Hoskins BJ. 1983. Modeling of the transient eddies and their feedback on the mean flow. In Large-Scale Dynamical Processes in theAtmosphere, Hoskins B, Pearce R (eds). Academic Press: New York; 169–198.
Hoskins BJ, Sardeshmukh PD. 1987. A diagnostic study of the dynamics of the Northern-Hemisphere winter of 1985–86. QuarterlyJournal of Royal Meteorological Society 113: 759–778.
Hoskins B, Karoly D. 1981. The steady linear response of a spherical atmosphere to thermal and orographic forcing. Journal ofAtmospheric Science 38: 1179–1196.
Hoskins BJ, James IN, White GH. 1983. The shape, propagation and mean-flow interaction of large-scale weather systems. Journalof Atmospheric Science 40: 1595–1612.
Houghton RW. 1996. Subsurface quasi-decadal fluctuations in the North Atlantic. Journal of Climate 9: 1363–1373.Houghton RW, Tourre YM. 1992. Characteristic low-frequency sea surface temperature fluctuations in the tropical Atlantic. Journal
of Climate 5: 765–771.Hurrell JW. 1995a. Transient eddy forcing of the rotational flow during northern winter. Journal of Atmospheric Science 52:
2286–2301.Hurrell JW. 1995b. Decadal trends in the North-Atlantic Oscillation: regional temperatures and precipitation. Science 269: 676–679.Hurrell JW. 1996. Influence of variations in extratropical wintertime teleconnections on Northern Hemisphere temperature.
Geophysics Research Letters 23: 665–668.Hurrell JW, van Loon H. 1997. Decadal variations in climate associated with the north Atlantic oscillation. Climatic Change 36:
301–326.Illari LC. 1983. A diagnostic study of the potential vorticity in a warm blocking anticyclone. Journal of Atmospheric Science 41:
3518–3526.James IN, James PM. 1992. Spatial structure of ultra-low frequency variability of the flow in a simple atmospheric circulation
model. Quarterly Journal of the Royal Meteorological Society 118: 1211–1233.Jin F-F. 1997. A theory of interdecadal climate variability of the north Pacific ocean–atmosphere system. Journal of Climate 10:
324–338.Jones PD, Briffa KR. 1992. Global surface air temperature variations over the twentieth century. Part I: spatial, temporal and
seasonal details. Holocene 2: 174–188.Joyce TM, Deser C, Spall MA. 2000. The relation between decadal variability of Subtropical Mode Water and the North Atlantic
Oscillation. Journal of Climate 13: 2550–2569.Kaplan A, Cane MA, Kushnir Y, Clement AC, Blumenthal MB, Rajagopalan B. 1998. Analyses of global sea surface temperature
1856–1991. Journal of Geophysics Research 103: 18567–18589.Kelly PM, Goodess CM, Cherry BSG. 1987. The interpretation of the Icelandic sea ice record. Journal of Geophysics Research 92:
10835–10843.Kelly PM, Jones PD, Sear CB, Cherry BSG, Tavakol RK. 1982. Variations in surface air temperature: Part 2. Arctic regions,
1881–1980. Monthly Weather Re�iew 110: 71–83.Kiely G. 1999. Climate change in Ireland from precipitation and streamflow observations. Ad�ances in Water Resources 23:
141–151.Klein SA, Soden BJ, Lau N-C. 1999. Remote sea surface temperature variations during ENSO: evidence for a tropical atmospheric
bridge. Journal of Climate 12: 917–932.Kodera K, Koide H, Yoshimira H. 1999. Northern hemisphere winter circulation associated with the North Atlantic Oscillation and
the stratospheric polar night jet. Geophysics Research Letters 26: 443–446.Krahmann G, Visbeck M, Reverdin G. 2001. Formation and propagation of temperature anomalies along the North Atlantic
Current. Journal of Physical Oceanography 31: 1287–1303.Kushnir Y. 1994. Interdecadal variations in North-Atlantic sea-surface temperature and associated atmospheric conditions. Journal
of Climate 7: 141–157.Kushnir Y, Held I. 1996. Equilibrium atmospheric response to North Atlantic SST anomalies. Journal of Climate 9: 1208–1220.Kushnir Y, Wallace JM. 1989. Low-frequency variability in the Northern Hemisphere winter-geographical-distribution, structure
and time-scale dependence. Journal of Atmospheric Science 46: 3122–3142.Kushnir Y, Cardone VJ, Greenwood JG, Cane M. 1997. On the recent increase in North Atlantic wave heights. Journal of Climate
10: 2107–2113.Kutiel H, Kay PA. 1992. Recent variations in 700 hpa geopotential heights in summer over Europe and the Middle-East, and their
influence on other meteorological factors. Theories and Applications in Climatology 46: 99–108.Kwok R, Rothrock DA. 1999. Variability of Fram Strait ice flux and North Atlantic Oscillation. Journal of Geophysics Research
104: 5177–5189.Lab Sea Group. 1998. The Labrador Sea Deep Convection Experiment. Bulletin of the American Meteorological Society 79:
2033–2058.Lamb PJ. 1978. Case studies of tropical Atlantic surface circulation patterns during recent sub-Saharan weather anomalies; 1967 and
1968. Monthly Weather Re�iew 106: 282–291.Lamb PJ, Peppler RA. 1987. North Atlantic oscillation: concept and an application. Bulletin of the American Meteorological Society
68: 1218–1225.Landsea CW, Pielke RA, Mestas-Nunez A, Knaff JA. 1999. Atlantic basin hurricanes: Indices of climatic changes. Climatic Change
42: 89–129.Latif M, Barnett TP. 1994. Causes of decadal climate variability in the North Pacific/North Atlantic sector. Science 266: 634–637.Latif M, Roeckner E, Mikolajewicz U, Voss R. 2000. Tropical stabilization of the thermohaline circulation in a greenhouse warming
simulation. Journal of Climate 13(11): 1809–1813.Lau NC. 1997. Interactions between the global SST anomalies and the midlatitude atmospheric circulation. Bulletin of the American
Meteorological Society 78: 21–33.Lau NC. 1988. Variability of the observed midlatitude storm tracks in relation to low-frequency changes in the circulation pattern.
Journal of Atmospheric Science 45: 2718–2743.
Copyright © 2001 Royal Meteorological Society Int. J. Climatol. 21: 1863–1898 (2001)
ATLANTIC CLIMATE VARIABILITY 1895
Levitus S. 1989. Interpentadal variability of temperature and salinity at intermediate depths of the North Atlantic Ocean, 1970–1974versus 1955–1959. Journal of Geophysics Research 94: 6091–6131.
Livingstone DM. 1999. Ice break-up on southern Lake Baikal and its relationship to local and regional air temperatures in Siberiaand to the North Atlantic Oscillation. Limnology and Oceanography 44: 1486–1497.
Loewe P, Koslowski G. 1998. The Western Baltic sea ice season in terms of a mass-related severity index 1879–1992— (II). Spectralcharacteristics and associations with the NAO, QBO, and solar cycle. Tellus 50: 219–241.
Lough JM. 1986. Tropical Atlantic sea surface temperature and rainfall variations in Subsaharan Africa. Monthly Weather Re�iews114: 561–570.
Malanotte-Rizzoli P, Hedstrom K, Arango H, Haidvogel DB. 2000. Water mass pathways between the subtropical and tropicalocean in a climatological simulation of the North Atlantic ocean circulation. Dynamics of Atmospheres and Oceans 32: 331–371.
Mann KH, Drinkwater KF. 1994. Environmental influences on fish and shellfish production in the northwest Atlantic. E�ironmentalRe�iews 2: 16–32.
Marotzke J. 2000. Abrupt climate change and thermocline circulation: mechanisms and predictability. Proceedings of the NationalAcademy of Sceinces 97: 1347–1350.
Marsh R, Petrie B, Weidman CR, Dickson RR, Loder JW, Hannah CG, Frank K, Drinkwater K. 1999. The 1882 tilefish kill—acold event in shelf waters off the north-eastern United States? Fisheries and Oceanography 8: 39–49.
Marshall J, Molteni F. 1993. Toward a dynamical understanding of planetary-scale flow regimes. Journal of Atmospheric Science 50:1792–1818.
Marshall J, Johnson H, Goodman J. 2001. A study of the interaction of the North Atlantic Oscillation with ocean circulation.Journal of Climate 14: 1399–1421.
Marshall J, Nurser AJG, Williams RG. 1993. Inferring the subduction rate and period over the north Atlantic. Journal of PhysicalOceaongraphy, , 7 23: 1315–1329.
McCreary JP, Picaut J, Moore D. 1984. Effects of remote annual forcing in the eastern tropical Atlantic ocean. Journal of MarineResearch 42: 45–81.
Mehta VM. 1998. Variability of the tropical ocean surface temperatures at decadal–multidecadal timescales. Part I: the AtlanticOcean. Journal of Climate 11: 2351–2375.
Mehta VM, Suarez MJ, Manganello JV, Delworth TL. 2000. Oceanic influence on the North Atlantic Oscillation and associatedNorthern Hemisphere climate variations: 1959–1993. Geophysical Research Letters 27(1): 121–124.
Metaxas DA, Bartzokas A, Vitsas A. 1991. Temperature fluctuations in the Mediterranean area during the last 120 years.International Journal of Climatology 11: 897–908.
Milner JM, Elston DA, Albon SD. 1999. Estimating the contributions of population density and climatic fluctuations to interannualvariation in survival of Soay sheep. Journal of Animal Ecology 68: 1235–1247.
Molinari RL, Mayer DA, Festa JF, Bezdek HF. 1997. Multiyear variability in the near-surface temperature structure of themidlatitude western North Atlantic Ocean. Journal of Geophysical Research—Oceans 102: 3267–3278.
Moura AD, Shukla J. 1981. On the dynamics of droughts in Northeast Brazil—observations, theory and numerical experimentswith a general-circulation model. Journal of Atmospheric Science 38: 2653–2675.
Mysak LA, Power SB. 1991. Greenland Sea ice and salinity anomalies and interdecadal climate variability. Climatology Bulletin 25:81–91.
Nakamura H. 1996. Year-to-year and interdecadal variability in the activity of intraseasonal fluctuations in the NorthernHemisphere wintertime circulation. Theoretical and Applied Climatology 55: 19–32.
Neelin JD, Weng W. 1999. Analytical prototypes for ocean-atmosphere interaction at midlatitudes. Part I: coupled feedbacks as asea surface temperature dependent stochastic process. Journal of Climate 12(3): 697–721.
Nobre P, Shukla J. 1996. Variations of sea surface temperature, wind stress, and rainfall over the tropical Atlantic and SouthAmerica. Journal of Climate 9: 2464–2479.
Palmer TN, Sun Z. 1985. A modeling and observational study of the relationship between sea-surface temperature anomalies in thenorth-west Atlantic and the atmospheric general circulation. Quarterly Journal of the Royal Meteorological Society 111: 947–975.
Parker DE, Jones PD, Folland CK, Bevan A. 1994. Interdecadal changes of surface temperatures since the late 19th century. Journalof Geophysics Research 99: 14373–14399.
Parkinson CL, Cavalieri DJ, Gloersen P, Zwally HJ, Comiso JC. 1999. Arctic sea ice extents, areas, and trends, 1978–1996. Journalof Geophysics Research 104: 20837–20856.
Peng S, Whitaker JS. 1999. Mechanisms determining the atmospheric response to middle-latitude SST anomalies. Journal of Climate12: 1393–1408.
Peng S, Mysak LA. 1993. A teleconnectin study of interannual sea surface temperature fluctuations in the northern North Atlanticand precipitation and runoff over western Siberia. Journal of Climate 6: 876–885.
Peng S, Robinson WA, Hoerling MP. 1997. The modeled atmospheric response to middle-latitude SST anomalies and itsdependence on background circulation states. Journal of Climate 10: 971–987.
Perlwitz J, Graf HF. 1995. The statistical connection between tropospheric and stratospheric circulation of theNorthern-Hemisphere in winter. Journal of Climate 8: 2281–2295.
Perreault L, Hache M, Slivitzky M, Bobee B. 1999. Detection of changes in precipitation and runoff over eastern Canada and USusing a Bayesian approach. Stochastic En�ironmental Research and Risk Assessment 13: 201–216.
Peterson TC, Vose RS. 1997. An overview of the Global Historical Climatology Network temperature data base. Bulletin of theAmerican Meteorological Society 78: 2837–2849.
Petterssen S. 1949. Changes in the general circulation associated with the recent climatic variation. Geographical Annals 31: 212–221.Philander SGH. 1986. Unusual conditions in the tropical Atlantic ocean in 1984. Nature 322: 236–238.Planque B, Taylor AH. 1998. Long-term changes in zooplankton and the climate of the North Atlantic. Ices Journal of Marine
Science 55: 644–654.
Copyright © 2001 Royal Meteorological Society Int. J. Climatol. 21: 1863–1898 (2001)
J. MARSHALL ET AL.1896
Post E, Stenseth NC. 1999. Climatic variability, plant phenology, and northern ungulates. Ecology 80: 1322–1339.Post E, Stenseth NC. 1998. Large-scale climatic fluctuation and population dynamics of moose and white-tailed deer. Journal of
Animal Ecology 67: 537–543.Post E, Stenseth NC, Langvatn R, Fromentin JM. 1997. Global climate change and phenotypic variation among red deer cohorts.
Proceedings of the Royal Society of London (Series B—Biological Sciences) 264: 1317–1324.Post E, Forchhammer MC, Stenseth NC, Langvatn R. 1999a. Extrinsic modification of vertebrate sex ratios by climatic variation.
American Naturalist 154: 194–204.Post E, Peterson RO, Stenseth NC, McLaren BE. 1999b. Ecosystem consequences of wolf behavioural response to climate. Nature
401: 905–907.Qiu B, Huang RX. 1995. Ventilation of the North Atlantic and North Pacific: subduction versus obduction. Journal of Physical
Oceanography 25: 2374–2390.Rahmstorf S. 1999. Shifting seas in the greenhouse? Nature 399: 523–524.Rahmstorf S, Ganopolski A. 1999. Long-term global warming scenarios computed with an efficient coupled climate model. Climatic
Change 43: 353–367.Rajagopalan B, Kushnir Y, Tourre YM. 1998. Observed decadal midlatitude and tropical Atlantic climate variability. Geophysics
Research Letters 25: 3967–3970.Reid PC, Planque B, Edwards M. 1998. Is observed variability in the long-term results of the Continuous Plankton Recorder survey
a response to climate change? Fisheries and Oceanography 7: 282–288.Reverdin G, Cayan D, Kushnir Y. 1997. Decadal variability of the hydrography in the upper northern North Atlantic in 1948–1990.
Journal of Geophysics Research 102: 8505–8531.Roach AT, Aagaard K, Pease CH, Salo SA, Weingartner T, Pavlov V, Kulakov M. 1995. Direct measurements of transport and
water properties through the Bering Strait. Journal of Geophysics Research 100: 18443–18457.Robertson AW, Mechoso CR. 1999. Interannual and interdecadal variability of the south Atlantic convergence zone. Monthly
Weather Re�iew 128(8): 2947–2957.Robinson WA. 2000. Review of WETS— the workshop on extra-tropical SST anomalies. Bulletin of the American Meteorological
Society 81: 567–577.Rodo X, Baert E, Comin FA. 1997. Variations in seasonal rainfall in southern Europe during the present century: relationships with
the North Atlantic Oscillation and the El Nino Southern Oscillation. Climate Dynamics 13: 275–284.Rodwell MJ, Rowell DP, Folland CK. 1999. Oceanic forcing of the wintertime North Atlantic Oscillation and European climate.
Nature 398: 320–323.Rogers JC. 1997. North Atlantic storm track variability and its association to the north Atlantic oscillation and climate variability
of northern Europe. Journal of Climate 10: 1635–1647.Rogers JC. 1990. Patterns of low-frequency monthly sea level pressure variability (1899–1986) and associated wave cyclone
frequencies. Journal of Climate 3: 1364–1379.Rogers JC. 1985. Atmospheric circulation changes associated with the warming over the northern North Atlantic in the 1920s.
Journal of Climate and Applied Meteorology 24: 1303–1310.Rogers JC. 1984. The association between the North-Atlantic Oscillation and the Southern Oscillation in the Northern Hemisphere.
Monthly Weather Re�iew 112: 1999–2015.Rogers JC, van Loon H. 1979. The seesaw in winter temperatures between Greenland and northern Europe. Part II: some oceanic
and atmospheric effects in middle and high latitudes. Monthly Weather Re�iew 107: 509–519.Rossby C-G. 1939. Relation between variations in the intensity of the zonal circulation of the atmosphere and the displacements of
the semi-permanent centers of action. Journal of Marine Research 2: 38–55.Saravanan R. 1998. Atmospheric low frequency variability and its relationship to middle-latitude SST variability: studies with the
NCAR Climate System Model. Journal of Climate 11: 1386–1404.Saravanan R, Chang P. 1999. Interactions between tropical Atlantic variability and El Nino–Southern Oscillation. Journal of
Climate 13: 2177–2194.Saravanan R, McWilliams JC. 1998. Advective ocean–atmosphere interaction: an analytical stochastic model with implications for
decadal variability. Journal of Climate 11: 165–188.Saravanan R, McWilliams JC. 1997. Stochasticity and spatial resonance in interdecadal climate fluctuations. Journal of Climate 10:
2299–2320.Schlesinger ME, Ramankutyy N. 1994. An oscillation in the global climate system of period 65–70 years. Nature 376: 723–726.Seager R, Kushnir Y, Chang P, Naik N, Miller J, Hazeleger W. 2001. Looking for the role of the ocean in tropical Atlantic decadal
climate variability. Journal of Climate 14: 638–655.Seager R, Kushnir Y, Visbeck M, Naik N, Miller J, Krahmann G, Cullen H. 2000. Causes of Atlantic Ocean climate variability
between 1958 and 1998. Journal of Climate 13: 2845–2862.Selten FM, Haarsma RJ, Opsteegh JD. 1999. On the mechanism of North Atlantic decadal variability. Journal of Climate 12:
1956–1973.Servain J. 1991. Simple climatic indices for the tropical Atlantic Ocean and some applications. Journal of Geophysics Research 96:
15137–15146.Shapiro LJ, Goldenberg SB. 1998. Atlantic sea surface temperatures and tropical cyclone formation. Journal of Climate 11: 578–590.Shindell DT, Miller RL, Schmidt GA, Pandolfo L. 1999. Simulation of recent northern winter climate trends by greenhouse-gas
forcing. Nature 399: 452–455.Spall MA. 1996. Dynamics of the Gulf Stream/Deep Western Boundary Current crossover. Part II: low frequency internal
oscillations. Journal of Physical Oceanography 10: 2170–2182.Stenseth NC, Chan KS, Tong H, Boonstra R, Boutin S, Krebs CJ, Post E, O’Donoghue M, Yoccoz NG, Forchhammer MC,
Hurrell JW. 1999. Common dynamic structure of Canada lynx populations within three climatic regions. Science 285: 1071–1073.Stephenson DB, Pavan V, Bojariu R. 2000. Is the North Atlantic Oscillation a random walk? International Journal of Climatology
20: 1–18.
Copyright © 2001 Royal Meteorological Society Int. J. Climatol. 21: 1863–1898 (2001)

ATLANTIC CLIMATE VARIABILITY 1897
Stommel H. 1979. Determination of water-mass properties of water pumped dowm from the Ekman layer to the geostrophic flowbelow. Proceedings of the National Academy of Science US 76: 3051–3055.
Sutton RT, Allen MR. 1997. Decadal predictability of North Atlantic sea surface temperature and climate. Nature 388: 563–567.Sutton RT, Jewson SP, Rowell DP. 2000. The elements of climate variability in the tropical Atlantic region. Journal of Climate
13(18): 3261–3284.Sutton R, Mathieu PP. In press. Response of the atmosphere–ocean mixed layer system to anomalous ocean heat flux convergence.
Quarterly Journal of the Royal Meteorological Society.Sverdrup H. 1947. Wind-driven current in a baroclinic ocean; with application to the equatorial currents in the eastern Pacific.
Proceedings of the National Academy of Science, USA 33: 318–326.Taylor AH, Stephens JA. 1998. The North Atlantic Oscillation and the latitude of the Gulf Stream. Tellus 50A: 134–142.The WASA Group. 1998. Changing waves and storms in the northeast Atlantic? Bulletin of the American Meteorological Society 79:
741–760.Thompson DWJ, Wallace JM. 1998. The Arctic Oscillation signature in the wintertime geopotential height and temperature fields.
Geophysics Research Letters 25: 1297–1300.Thompson DWJ, Wallace JM, Hegerl GC. 2000a. Annular modes in the extratropical circulation: part I: month to month
variability. Journal of Climate 13: 1000–1016.Thompson DWJ, Wallace JM, Hegerl GC. 2000b. Annular modes in the extratropical circulation: part II: trends. Journal of Climate
13: 1018–1036.Timmerman A, Latif M, Voss R, Grotzner A. 1998. Northern Hemispheric Interdecadal Variability: a coupled air-sea mode. Journal
of Climate 11: 1906–1931.Toggweiler JR, Samuels B. 1995. Effect of Drake Passage on the global thermohaline circulation. Deep-Sea Research 42: 477–500.Tourre YM, Rajagopalan B, Kushnir Y. 1999. Dominant patterns of climate variability in the Atlantic Ocean during the last 136
years. Journal of Climate 12: 2285–2299.Ulbrich U, Christoph M. 1999. A shift of the NAO and increasing storm track activity over Europe due to anthropogenic
greenhouse gas forcing. Climate Dynamics 15: 551–559.van Loon H, Rogers JC. 1978. Seesaw in winter temperatures between Greenland and Northern Europe. 1. General description.
Monthly Weather Re�iews 106: 296–310.van Loon H, Williams J. 1976. Connection between trends of mean temperature and circulation at surface. 1. Winter. Monthly
Weather Re�iews 104: 365–380.Venegas SA, Mysak LA, Straub DN. 1997. Atmosphere–ocean coupled variability in the South Atlantic. Journal of Climate 10:
2904–2920.Venzke S, Allen MR, Sutton RT, Rowell DP. 1999. The atmospheric response over the North Atlantic to decadal changes in sea
surface temperature. Journal of Climate 12: 2562–2584.Visbeck M, Cullen H, Krahmann G, Naik N. 1998. An ocean model’s response to North Atlantic Oscillation-like wind forcing.
Geophysics Research Letters 25: 4521–4524.Vose RS, Schmoyer RL, Steurer PM, Peterson TC, Heim R, Karl TR, Eischeid J. 1992. The Global Historical Climatology
Network: long-term monthly temperature, precipitation, sea level pressure, and station pressure data. ORNL/CDIAC-53,NDP-041, Carbon Dioxide Information Analysis Center, Oak Ridge National Laboratory, Oak Ridge, TN.
Wagner RG, da Silva A. 1994. Surface conditions associated with anomalous rainfall in the Guinea coastal region. InternationalJournal of Climatology 14: 179–199.
Wagner RG. 1996. Mechanisms controlling variability of the interhemispheric sea surface temperature gradient in the tropicalAtlantic. Journal of Climate 9: 2010–2019.
Walker GT, Bliss EW. 1932. World Weather V. Memos of the Royal Meteorological Society 4: 53–84.Walker GT. 1924. Correlations in seasonal variations of weather IX. Memoirs India: Meteorological Department 24: 687–692.Wallace JM. 2000. North Atlantic Oscillation/annular model: two paradigms-one phenomena. Quarterly Journal of the Royal
Meteorological Society 126: 791–805.Wallace JM. 1996. Observed climatic variability: spatial structure. In Decadal Climate Variability, Anderson DLT, Willebrand J
(eds). Springer: Berlin; 31–81.Wallace JM, Gutzler DS. 1981. Teleconnections in the geopotential height field during the Northern Hemisphere winter. Monthly
Weather Re�iews 109: 784–812.Wallace JM, Rasmusson EM, Mitchell TP, Kousky VE, Sarachik ES, von Storch H. 1998. The structure and evolution of
ENSO-related climate variability in the tropical Pacific: Lessons from TOGA. Journal of Geophysical Research—Oceans 103:14241–14259.
Wallace JM, Zhang Y, Renwick JA. 1995. Dynamic contribution to hemispheric mean temperature trends. Science 270: 780–783.Walsh JE, Johnson CM. 1979. An analysis of Arctic sea ice fluctuations, 1953–77. Journal of Physical Oceanography 9: 580–591.Ward MN, Folland CK. 1991. Prediction of seasonal rainfall in the north Nordeste of Brazil using eigenvectors of sea-surface
temperature. International Journal of Climatology 11: 711–743.Watanabe M, Kimoto M. 2000a. On the persistence of decadal SST anomalies in the North Atlantic. Journal of Climate 13:
3017–3028.Watanabe M, Kimoto M. 2000b. Atmosphere–ocean thermal coupling in the North Atlantic: a positive feedback. Quarterly Journal
of the Royal Meteorological Society 126: 3343–3369.Weingartner TJ, Cavalieri DJ, Aagaard K, Sasaki Y. 1998. Circulation, dense water formation, and outflow on the northeast
Chukchi shelf. Journal of Geophysics Research 103: 7647–7661.Weng W, Neelin JD. 1998. On the role of ocean–atmosphere interaction in middle-latitude interdecadal variability. Geophysics
Research Letters 25: 167–170.Weyhenmeyer GA, Blenckner T, Pettersson K. 1999. Changes of the plankton spring outburst related to the North Atlantic
Oscillation. Limnology and Oceanography 44: 1788–1792.
Copyright © 2001 Royal Meteorological Society Int. J. Climatol. 21: 1863–1898 (2001)
J. MARSHALL ET AL.1898
White JWC, Barlow LK, Fisher D, Grootes P, Jouzel J, Johnsen SJ, Stuiver M, Clausen H. 1997. The climate signal in the stableisotopes of snow from Summit, Greenland: results of comparisons with modern climate observations. Journal of GeophysicalResearch—Oceans 102: 26425–26439.
Wibig J. 1999. Precipitation in Europe in relation to circulation patterns at the 500 hPa level. International Journal of Climatology19: 253–269.
Williams RG, Spall MA, Marshall J. 1995. Does Stommel’s mixed-layer ‘Demon’ work? Journal of Physical Oceaongraphy 25:3089–3102.
Wunsch C. 1999. The interpretation of short climate records, with comments on the North Atlantic Oscillation and SouthernOscillations. Bulletin of the American Meteorological Society 80: 245–255.
Xie SP, Tanimoto Y. 1998. A pan-Atlantic decadal climate oscillation. Geophysics Research Letters 25: 2185–2188.Xie SP. 1999. A dynamic ocean–atmosphere model of the tropical Atlantic decadal variability. Journal of Climate 12: 64–70.Yang J. 1999. A linkage between decadal climate variations in the Labrador Sea and the tropical Atlantic ocean. Geophysics
Research Letters 26: 1023–1026.Zebiak SE. 1993. Air–sea interaction in the equatorial Atlantic region. Journal of Climate 6: 1567–1568.
Copyright © 2001 Royal Meteorological Society Int. J. Climatol. 21: 1863–1898 (2001)