NORTH ASIAN INTERNATIONAL North Asian International ... · NORTH ASIAN INTERNATIONAL RESEARCH...
18
Volume 2, Issue 1 January 2016 ISSN NO: 2454 - 2326 North Asian International Research Journal Consortium North Asian International Research Journal Of Multidisciplinary Chief Editor Dr. Nisar Hussain Malik Publisher Associate Editor Dr. Bilal Ahmad Malik Dr.Nagendra Mani Trapathi Honorary Dr.Ashak Hussain Malik
Transcript of NORTH ASIAN INTERNATIONAL North Asian International ... · NORTH ASIAN INTERNATIONAL RESEARCH...

ORIGINAL ARTICLE NORTH ASIAN INTERNATIONAL
RESEARCH JOURNAL CONSORTIUM
North Asian International Journal of Banking and Finance
Chief Editor Dr. Nisar Hussain Malik
Publisher Associate Editor
Dr. Bilal Ahmad Malik Dr.Nagendra Mani Trapathi Honorary Dr. Ashak Hussain Malik
Volume 2, Issue 1 January 2016 ISSN NO: 2454 - 2326
North Asian International Research Journal Consortium
North Asian International Research Journal
Of
Multidisciplinary
Chief Editor
Dr. Nisar Hussain Malik
Publisher Associate Editor
Dr. Bilal Ahmad Malik Dr.Nagendra Mani Trapathi
Honorary Dr.Ashak Hussain Malik

North Asian International Research Journal of Multidisciplinary ISSN: 2454 - 2326 Vol. 2, Issue 1 January 2016
North Asian International research Journal consortium www.nairjc.com 2
Welcome to NAIRJC ISSN NO: 2454 - 2326 North Asian International Research Journal is a multidisciplinary research journal, published monthly in English, Hindi,
Urdu all research papers submitted to the journal will be double-blind peer reviewed referred by members of the editorial
board. Readers will include investigator in Universities, Research Institutes Government and Industry with research interest
in the general subjects
Editorial Board J.Anil Kumar
Head Geography University
of Thirvanathpuram
Sanjuket Das
Head Economics Samplpur University Adgaonkar Ganesh
Dept. of Commerce, B.S.A.U
Aruganbad
Kiran Mishra
Dept. of Engligh,Ranchi University,
Jharkhand
Somanath Reddy
Dept. of Social Work, Gulbarga
University.
Rajpal Choudhary
Dept. Govt. Engg. College Bikaner
Rajasthan
R.D. Sharma
Head Commerce & Management Jammu
University
R.P. Pandday
Head Education Dr. C.V.Raman
University
Moinuddin Khan
Dept. of Botany SinghaniyaUniversity
Rajasthan.
Manish Mishra
Dept. of Engg, United College
Ald.UPTU Lucknow
K.M Bhandarkar
Praful Patel College of Education,
Gondia
Ravi Kumar Pandey
Director, H.I.M.T, Allahabad
Tihar Pandit
Dept. of Environmental Science,
University of Kashmir.
Simnani
Dept. of Political Science, Govt. Degree
College Pulwama, University of
Kashmir.
Ashok D. Wagh
Head PG. Dept. of Accountancy,
B.N.N.College, Bhiwandi, Thane,
Maharashtra. Neelam Yaday
Head Exam. Mat.K..M .Patel College
Thakurli (E), Thane, Maharashtra
Nisar Hussain
Dept. of Medicine A.I. Medical College
(U.P) Kanpur University
M.C.P. Singh Head Information Technology Dr C.V.
Rama University
Ashak Husssain
Head Pol-Science G.B, PG College Ald.
Kanpur University
Khagendra Nath Sethi
Head Dept. of History Sambalpur
University.
Rama Singh
Dept. of Political Science A.K.D College,
Ald.University of Allahabad
Address: - Dr. Ashak Hussain Malik House No. 221 Gangoo, Pulwama, Jammu and Kashmir, India -
192301, Cell: 09086405302, 09906662570, Ph. No: 01933-212815,
Email: [email protected], [email protected] Website: www.nairjc.com
North Asian International Research Journal of Multidisciplinary ISSN: 2454 - 2326 Vol. 2, Issue 1 January 2016
North Asian International research Journal consortium www.nairjc.com 3
INDUSTRIAL CLUSTERS AND COMPETITIVENESS IN THE NIGERIAN
MANUFACTURING SECTOR1
LOUIS N. CHETE
Senior Research Fellow, Nigerian Institute of Social and Economic Research (NISER), Ibadan, Nigeria
FOLUSO M. ADEYINKA2
Senior Research Fellow Nigerian Institute of Social and Economic Research (NISER), Ibadan, Nigeria
OLORUNFEMI O. OGUNDELE
Senior Research Fellow Nigerian Institute of Social and Economic Research (NISER), Ibadan, Nigeria
ABSTRACT
This study investigated the benefits of industrial cluster in the Nigerian manufacturing sector, using the
World Bank Investment Climate Survey of Nigeria based on 2,387 firms in sub-sectors of the
manufacturing sector Applying the stochastic production function approach, an efficiency index for each
firm is derived from which average technical efficiency for firms located in both export and non-export
processing zones are computed. The results show that firms clustered in export- processing zones attract
comparatively more general and skilled labour than firms located outside the clusters and offer better
compensation to their employees, however they seem to incur more costs on average on overheads such as
electricity, fuel, water, transportation and communication services. Significantly, technical efficiency was
low for both categories of firms. Location of firms in export processing zones thus show significant but
perverse (negative) effects on the level of technical efficiency of firms.
KEYWORDS: Cluster; Manufacturing; Competitiveness; Firms; Nigeria
1This paper is one of the outputs of the author‘s inputs into ―Learning to Compete‖ (L2C), a collaborative project of the Africa Growth
Initiative at The Brookings Institution, the United Nations University World Institute for Development Economics Research (UNU-
WIDER), and the African Development Bank. We are grateful to Carol Newman for her comments on this paper. 2 Corresponding author.

North Asian International Research Journal of Multidisciplinary ISSN: 2454 - 2326 Vol. 2, Issue 1 January 2016
North Asian International research Journal consortium www.nairjc.com 4
1. INTRODUCTION
Cluster development has emerged as an important new direction in economic policy, and a coordinated and
efficient way to promote economic growth, prioritize major investments and deliver infrastructure. Typically, an
industry cluster strategy is driven by the notion that firms agglomerated in clusters potentially perform better than
their counterparts located out of cluster owing to benefits from networking, knowledge sharing and human capital
mobility (Madsen, Smith and Dilling-Hansen (2002). There is growing evidence that clustering helps small firms
to surmount growth impediments and compete in world markets (Nadvi and Schmitz, 1999) This happens in three
specific ways (Mccormick, 1999). First, clustering spurs collective efficiency which fosters firms' competitive
advantage; second, it facilitates growth in little incremental steps; and third, clustering eases response to
opportunities and crises.
Apparently, persuaded by the manifest benefits of the cluster approach, Nigeria‘s recent policy directions and
plans have favoured the development of clusters and use of economic zones3 to drive growth in several key
sectors, including agriculture and industry and the overall economy. This policy direction was also influenced by
the relatively successful outcomes of traditional clusters in Nigeria notably, Nnewi automotive cluster and Otigba
Computer Village cluster, both characterized by significant inter-firm linkages and collaborative action. The
former is especially significant reaching back to the 1980s and surviving some of the most turbulent periods of
Nigeria economic and political history.
This paper provides answers to the following research questions. Do manufacturing firms cluster? Why
clustering observed and what are the benefits of clustering? Does clustering yield productivity improvements for
firms/sectors, and if so what are the characteristics of clusters that work best? How is knowledge transmitted
within clusters? How can industrial policy be framed to promote clustering where it makes sense to do so?
2. OVERVIEW OF THE NIGERIAN MANUFACTURING SECTOR
Nigeria manufacturing accounts for less than 5 per cent of overall output growth in the economy - a distant shot
from the 30-35% share required to fulfill the country‘s aspiration of becoming one of the twenty most developed
economies in the world. The sector has been stunted by a rash of growth inhibiting factors including appalling
physical infrastructure, especially meager and erratic power supply, high cost of funds, abysmal access to finance,
multiple taxation and low domestic patronage.
3 This is in sharp contrast to policies that attempt to foster more dispersion of economic activities in order to reduce regional
inequalities popular in much of the 1960s and 1970s.
North Asian International Research Journal of Multidisciplinary ISSN: 2454 - 2326 Vol. 2, Issue 1 January 2016
North Asian International research Journal consortium www.nairjc.com 5
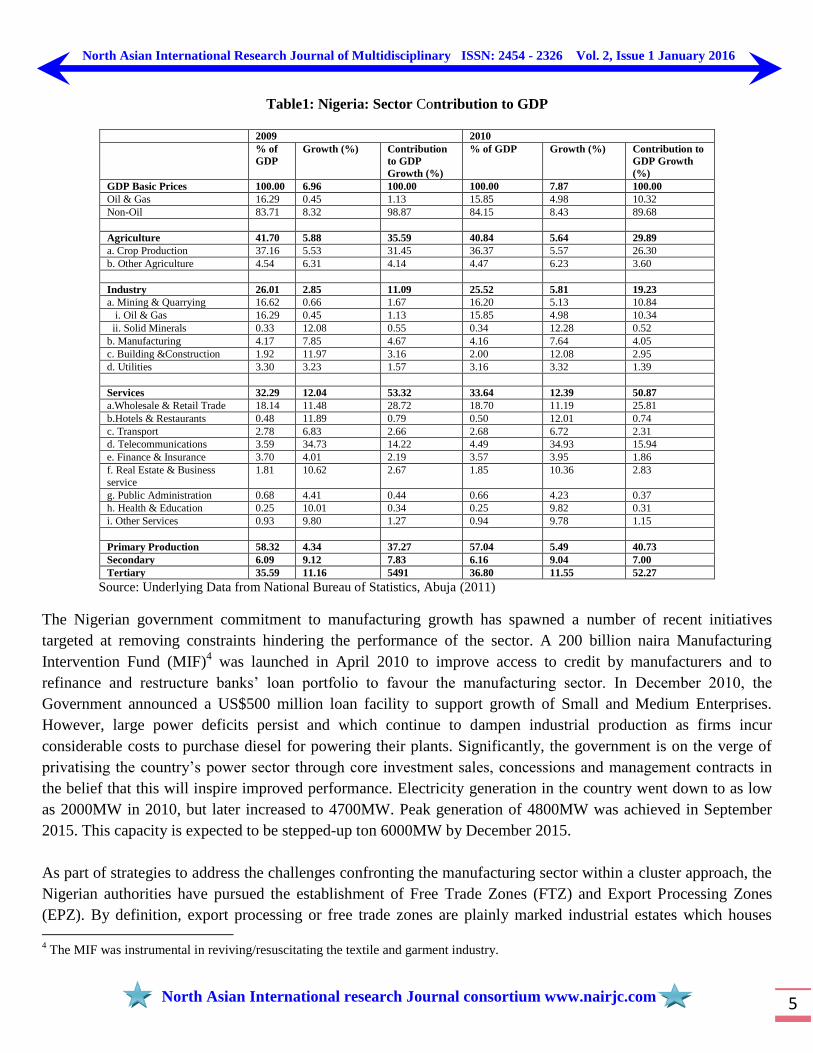
Table1: Nigeria: Sector Contribution to GDP
2009 2010
% of
GDP
Growth (%) Contribution
to GDP
Growth (%)
% of GDP Growth (%) Contribution to
GDP Growth
(%)
GDP Basic Prices 100.00 6.96 100.00 100.00 7.87 100.00
Oil & Gas 16.29 0.45 1.13 15.85 4.98 10.32
Non-Oil 83.71 8.32 98.87 84.15 8.43 89.68
Agriculture 41.70 5.88 35.59 40.84 5.64 29.89
a. Crop Production 37.16 5.53 31.45 36.37 5.57 26.30
b. Other Agriculture 4.54 6.31 4.14 4.47 6.23 3.60
Industry 26.01 2.85 11.09 25.52 5.81 19.23
a. Mining & Quarrying 16.62 0.66 1.67 16.20 5.13 10.84
i. Oil & Gas 16.29 0.45 1.13 15.85 4.98 10.34
ii. Solid Minerals 0.33 12.08 0.55 0.34 12.28 0.52
b. Manufacturing 4.17 7.85 4.67 4.16 7.64 4.05
c. Building &Construction 1.92 11.97 3.16 2.00 12.08 2.95
d. Utilities 3.30 3.23 1.57 3.16 3.32 1.39
Services 32.29 12.04 53.32 33.64 12.39 50.87
a.Wholesale & Retail Trade 18.14 11.48 28.72 18.70 11.19 25.81
b.Hotels & Restaurants 0.48 11.89 0.79 0.50 12.01 0.74
c. Transport 2.78 6.83 2.66 2.68 6.72 2.31
d. Telecommunications 3.59 34.73 14.22 4.49 34.93 15.94
e. Finance & Insurance 3.70 4.01 2.19 3.57 3.95 1.86
f. Real Estate & Business
service
1.81 10.62 2.67 1.85 10.36 2.83
g. Public Administration 0.68 4.41 0.44 0.66 4.23 0.37
h. Health & Education 0.25 10.01 0.34 0.25 9.82 0.31
i. Other Services 0.93 9.80 1.27 0.94 9.78 1.15
Primary Production 58.32 4.34 37.27 57.04 5.49 40.73
Secondary 6.09 9.12 7.83 6.16 9.04 7.00
Tertiary 35.59 11.16 5491 36.80 11.55 52.27
Source: Underlying Data from National Bureau of Statistics, Abuja (2011)
The Nigerian government commitment to manufacturing growth has spawned a number of recent initiatives
targeted at removing constraints hindering the performance of the sector. A 200 billion naira Manufacturing
Intervention Fund (MIF)4 was launched in April 2010 to improve access to credit by manufacturers and to
refinance and restructure banks‘ loan portfolio to favour the manufacturing sector. In December 2010, the
Government announced a US$500 million loan facility to support growth of Small and Medium Enterprises.
However, large power deficits persist and which continue to dampen industrial production as firms incur
considerable costs to purchase diesel for powering their plants. Significantly, the government is on the verge of
privatising the country‘s power sector through core investment sales, concessions and management contracts in
the belief that this will inspire improved performance. Electricity generation in the country went down to as low
as 2000MW in 2010, but later increased to 4700MW. Peak generation of 4800MW was achieved in September
2015. This capacity is expected to be stepped-up ton 6000MW by December 2015.
As part of strategies to address the challenges confronting the manufacturing sector within a cluster approach, the
Nigerian authorities have pursued the establishment of Free Trade Zones (FTZ) and Export Processing Zones
(EPZ). By definition, export processing or free trade zones are plainly marked industrial estates which houses 4 The MIF was instrumental in reviving/resuscitating the textile and garment industry.
North Asian International Research Journal of Multidisciplinary ISSN: 2454 - 2326 Vol. 2, Issue 1 January 2016
North Asian International research Journal consortium www.nairjc.com 6
manufacturing activities targeted predominantly for the export market. In principle, FTZs offer simplified
business environment with clear-cut operational guidelines free from bureaucratic bottlenecks and obstructive
trade barriers. They are expected to provide excellent industrial facilities and security such as serviced plots, pre-
built factory buildings, constant and regular electricity and water supply, good telecommunications system and
specialised security arrangements. In principle, enterprises sited in these industrial clusters enjoy greater benefits
and are exposed to lesser shocks than enterprises located elsewhere which place them in pole position to chase the
country‘s targets of industrial transformation and export growth.
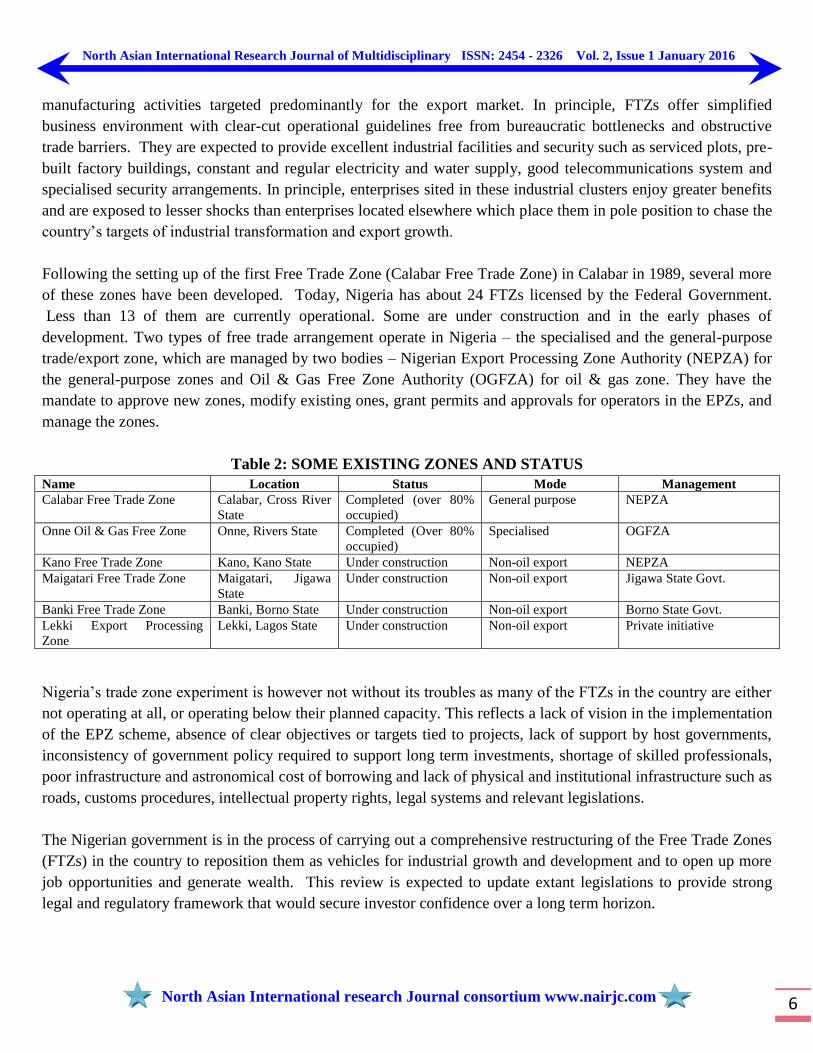
Following the setting up of the first Free Trade Zone (Calabar Free Trade Zone) in Calabar in 1989, several more
of these zones have been developed. Today, Nigeria has about 24 FTZs licensed by the Federal Government.
Less than 13 of them are currently operational. Some are under construction and in the early phases of
development. Two types of free trade arrangement operate in Nigeria – the specialised and the general-purpose
trade/export zone, which are managed by two bodies – Nigerian Export Processing Zone Authority (NEPZA) for
the general-purpose zones and Oil & Gas Free Zone Authority (OGFZA) for oil & gas zone. They have the
mandate to approve new zones, modify existing ones, grant permits and approvals for operators in the EPZs, and
manage the zones.
Table 2: SOME EXISTING ZONES AND STATUS
Name Location Status Mode Management
Calabar Free Trade Zone Calabar, Cross River
State
Completed (over 80%
occupied)
General purpose NEPZA
Onne Oil & Gas Free Zone Onne, Rivers State Completed (Over 80%
occupied)
Specialised OGFZA
Kano Free Trade Zone Kano, Kano State Under construction Non-oil export NEPZA
Maigatari Free Trade Zone Maigatari, Jigawa
State
Under construction Non-oil export Jigawa State Govt.
Banki Free Trade Zone Banki, Borno State Under construction Non-oil export Borno State Govt.
Lekki Export Processing
Zone
Lekki, Lagos State Under construction Non-oil export Private initiative
Nigeria‘s trade zone experiment is however not without its troubles as many of the FTZs in the country are either
not operating at all, or operating below their planned capacity. This reflects a lack of vision in the implementation
of the EPZ scheme, absence of clear objectives or targets tied to projects, lack of support by host governments,
inconsistency of government policy required to support long term investments, shortage of skilled professionals,
poor infrastructure and astronomical cost of borrowing and lack of physical and institutional infrastructure such as
roads, customs procedures, intellectual property rights, legal systems and relevant legislations.
The Nigerian government is in the process of carrying out a comprehensive restructuring of the Free Trade Zones
(FTZs) in the country to reposition them as vehicles for industrial growth and development and to open up more
job opportunities and generate wealth. This review is expected to update extant legislations to provide strong
legal and regulatory framework that would secure investor confidence over a long term horizon.
North Asian International Research Journal of Multidisciplinary ISSN: 2454 - 2326 Vol. 2, Issue 1 January 2016
North Asian International research Journal consortium www.nairjc.com 7
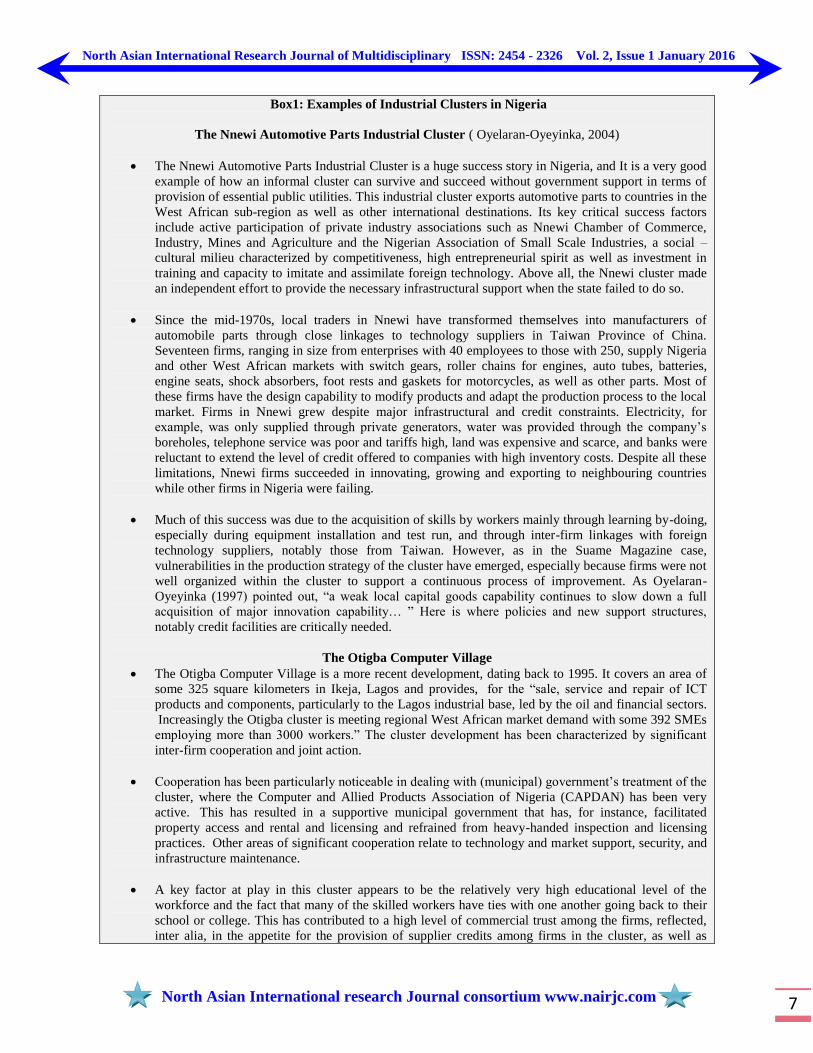
Box1: Examples of Industrial Clusters in Nigeria
The Nnewi Automotive Parts Industrial Cluster ( Oyelaran-Oyeyinka, 2004)
The Nnewi Automotive Parts Industrial Cluster is a huge success story in Nigeria, and It is a very good
example of how an informal cluster can survive and succeed without government support in terms of
provision of essential public utilities. This industrial cluster exports automotive parts to countries in the
West African sub-region as well as other international destinations. Its key critical success factors
include active participation of private industry associations such as Nnewi Chamber of Commerce,
Industry, Mines and Agriculture and the Nigerian Association of Small Scale Industries, a social –
cultural milieu characterized by competitiveness, high entrepreneurial spirit as well as investment in
training and capacity to imitate and assimilate foreign technology. Above all, the Nnewi cluster made
an independent effort to provide the necessary infrastructural support when the state failed to do so.
Since the mid-1970s, local traders in Nnewi have transformed themselves into manufacturers of
automobile parts through close linkages to technology suppliers in Taiwan Province of China.
Seventeen firms, ranging in size from enterprises with 40 employees to those with 250, supply Nigeria
and other West African markets with switch gears, roller chains for engines, auto tubes, batteries,
engine seats, shock absorbers, foot rests and gaskets for motorcycles, as well as other parts. Most of
these firms have the design capability to modify products and adapt the production process to the local
market. Firms in Nnewi grew despite major infrastructural and credit constraints. Electricity, for
example, was only supplied through private generators, water was provided through the company‘s
boreholes, telephone service was poor and tariffs high, land was expensive and scarce, and banks were
reluctant to extend the level of credit offered to companies with high inventory costs. Despite all these
limitations, Nnewi firms succeeded in innovating, growing and exporting to neighbouring countries
while other firms in Nigeria were failing.
Much of this success was due to the acquisition of skills by workers mainly through learning by-doing,
especially during equipment installation and test run, and through inter-firm linkages with foreign
technology suppliers, notably those from Taiwan. However, as in the Suame Magazine case,
vulnerabilities in the production strategy of the cluster have emerged, especially because firms were not
well organized within the cluster to support a continuous process of improvement. As Oyelaran-
Oyeyinka (1997) pointed out, ―a weak local capital goods capability continues to slow down a full
acquisition of major innovation capability… ‖ Here is where policies and new support structures,
notably credit facilities are critically needed.
The Otigba Computer Village
The Otigba Computer Village is a more recent development, dating back to 1995. It covers an area of
some 325 square kilometers in Ikeja, Lagos and provides, for the ―sale, service and repair of ICT
products and components, particularly to the Lagos industrial base, led by the oil and financial sectors.
Increasingly the Otigba cluster is meeting regional West African market demand with some 392 SMEs
employing more than 3000 workers.‖ The cluster development has been characterized by significant
inter-firm cooperation and joint action.
Cooperation has been particularly noticeable in dealing with (municipal) government‘s treatment of the
cluster, where the Computer and Allied Products Association of Nigeria (CAPDAN) has been very
active. This has resulted in a supportive municipal government that has, for instance, facilitated
property access and rental and licensing and refrained from heavy-handed inspection and licensing
practices. Other areas of significant cooperation relate to technology and market support, security, and
infrastructure maintenance.
A key factor at play in this cluster appears to be the relatively very high educational level of the
workforce and the fact that many of the skilled workers have ties with one another going back to their
school or college. This has contributed to a high level of commercial trust among the firms, reflected,
inter alia, in the appetite for the provision of supplier credits among firms in the cluster, as well as
North Asian International Research Journal of Multidisciplinary ISSN: 2454 - 2326 Vol. 2, Issue 1 January 2016
North Asian International research Journal consortium www.nairjc.com 8
know-how exchange and joint warehousing. Given the cluster‘s dependence on imported inputs (63.5
percent), the quality of trade facilitation services is an important determinant of cluster
competitiveness.
Government policy in support of the industry includes the standard package of duty rebate and tax
holidays. There is also a preferential public procurement policy in place directing government
ministries, departments, and agencies (a group of public agencies widely referred to in Nigeria by the
acronym MDAs) to source IT products domestically.
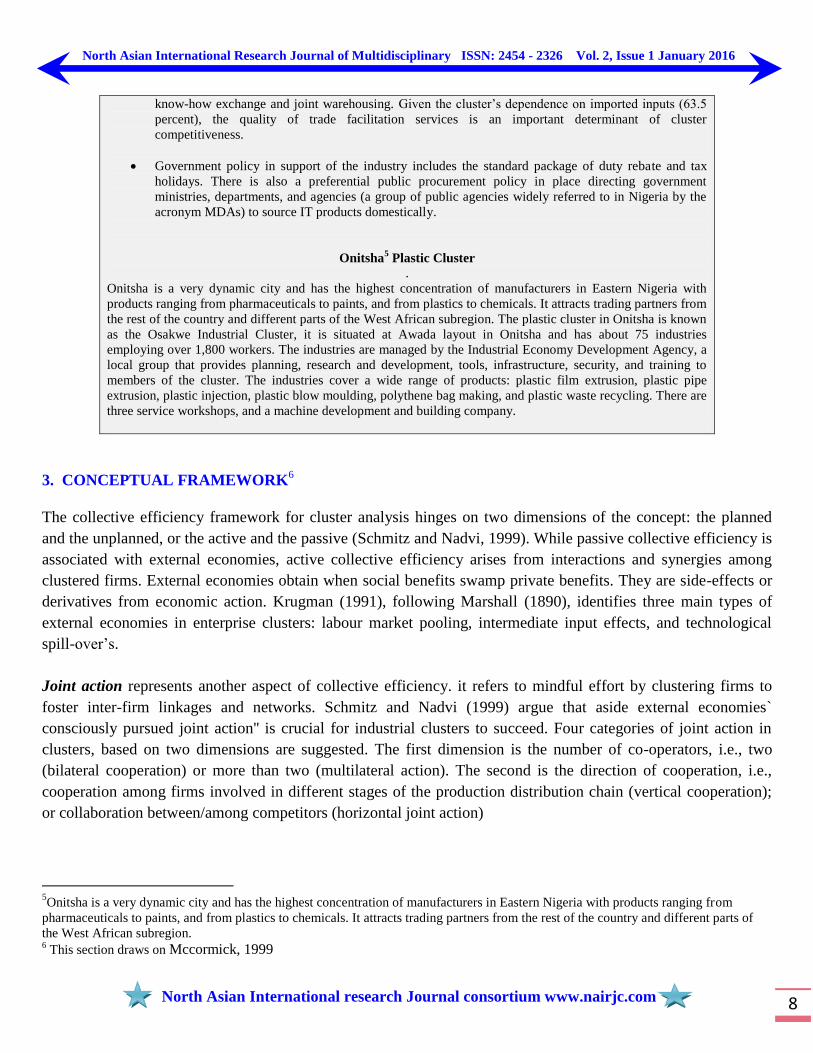
Onitsha5 Plastic Cluster
.
Onitsha is a very dynamic city and has the highest concentration of manufacturers in Eastern Nigeria with
products ranging from pharmaceuticals to paints, and from plastics to chemicals. It attracts trading partners from
the rest of the country and different parts of the West African subregion. The plastic cluster in Onitsha is known
as the Osakwe Industrial Cluster, it is situated at Awada layout in Onitsha and has about 75 industries
employing over 1,800 workers. The industries are managed by the Industrial Economy Development Agency, a
local group that provides planning, research and development, tools, infrastructure, security, and training to
members of the cluster. The industries cover a wide range of products: plastic film extrusion, plastic pipe
extrusion, plastic injection, plastic blow moulding, polythene bag making, and plastic waste recycling. There are
three service workshops, and a machine development and building company.
3. CONCEPTUAL FRAMEWORK6
The collective efficiency framework for cluster analysis hinges on two dimensions of the concept: the planned
and the unplanned, or the active and the passive (Schmitz and Nadvi, 1999). While passive collective efficiency is
associated with external economies, active collective efficiency arises from interactions and synergies among
clustered firms. External economies obtain when social benefits swamp private benefits. They are side-effects or
derivatives from economic action. Krugman (1991), following Marshall (1890), identifies three main types of
external economies in enterprise clusters: labour market pooling, intermediate input effects, and technological
spill-over‘s.
Joint action represents another aspect of collective efficiency. it refers to mindful effort by clustering firms to
foster inter-firm linkages and networks. Schmitz and Nadvi (1999) argue that aside external economies`
consciously pursued joint action'' is crucial for industrial clusters to succeed. Four categories of joint action in
clusters, based on two dimensions are suggested. The first dimension is the number of co-operators, i.e., two
(bilateral cooperation) or more than two (multilateral action). The second is the direction of cooperation, i.e.,
cooperation among firms involved in different stages of the production distribution chain (vertical cooperation);
or collaboration between/among competitors (horizontal joint action)
5Onitsha is a very dynamic city and has the highest concentration of manufacturers in Eastern Nigeria with products ranging from
pharmaceuticals to paints, and from plastics to chemicals. It attracts trading partners from the rest of the country and different parts of
the West African subregion. 6 This section draws on Mccormick, 1999
North Asian International Research Journal of Multidisciplinary ISSN: 2454 - 2326 Vol. 2, Issue 1 January 2016
North Asian International research Journal consortium www.nairjc.com 9
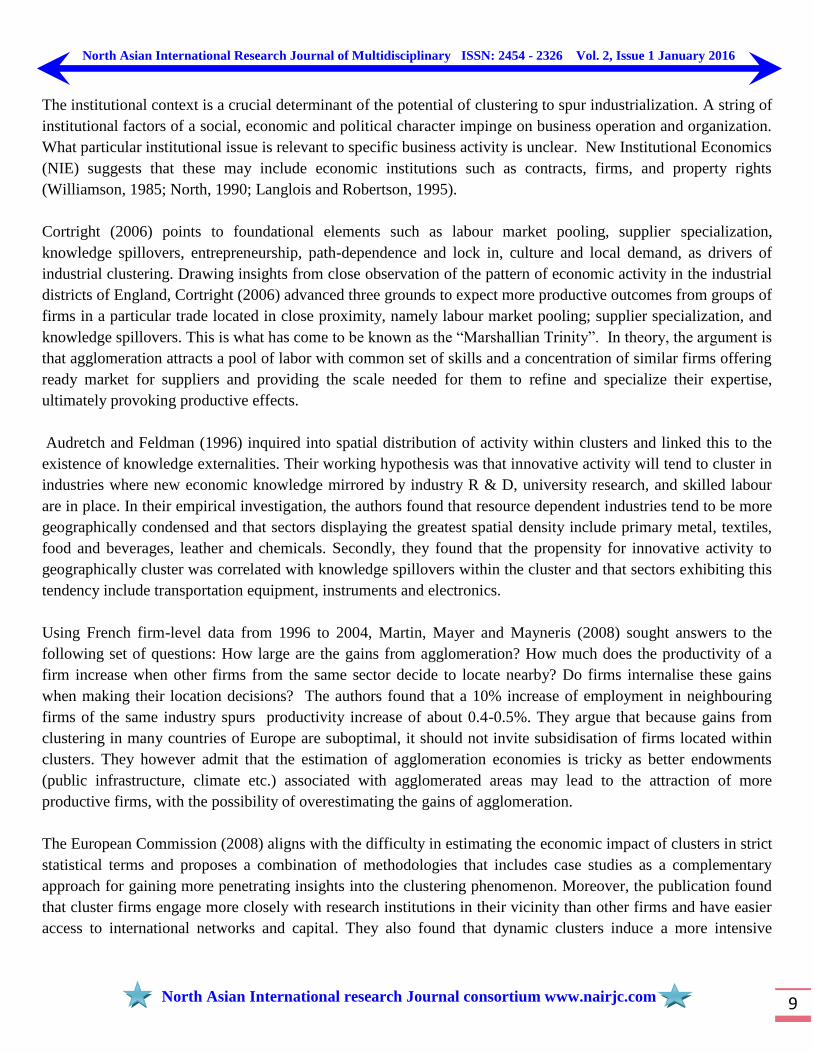
The institutional context is a crucial determinant of the potential of clustering to spur industrialization. A string of
institutional factors of a social, economic and political character impinge on business operation and organization.
What particular institutional issue is relevant to specific business activity is unclear. New Institutional Economics
(NIE) suggests that these may include economic institutions such as contracts, firms, and property rights
(Williamson, 1985; North, 1990; Langlois and Robertson, 1995).
Cortright (2006) points to foundational elements such as labour market pooling, supplier specialization,
knowledge spillovers, entrepreneurship, path-dependence and lock in, culture and local demand, as drivers of
industrial clustering. Drawing insights from close observation of the pattern of economic activity in the industrial
districts of England, Cortright (2006) advanced three grounds to expect more productive outcomes from groups of
firms in a particular trade located in close proximity, namely labour market pooling; supplier specialization, and
knowledge spillovers. This is what has come to be known as the ―Marshallian Trinity‖. In theory, the argument is
that agglomeration attracts a pool of labor with common set of skills and a concentration of similar firms offering
ready market for suppliers and providing the scale needed for them to refine and specialize their expertise,
ultimately provoking productive effects.
Audretch and Feldman (1996) inquired into spatial distribution of activity within clusters and linked this to the
existence of knowledge externalities. Their working hypothesis was that innovative activity will tend to cluster in
industries where new economic knowledge mirrored by industry R & D, university research, and skilled labour
are in place. In their empirical investigation, the authors found that resource dependent industries tend to be more
geographically condensed and that sectors displaying the greatest spatial density include primary metal, textiles,
food and beverages, leather and chemicals. Secondly, they found that the propensity for innovative activity to
geographically cluster was correlated with knowledge spillovers within the cluster and that sectors exhibiting this
tendency include transportation equipment, instruments and electronics.
Using French firm-level data from 1996 to 2004, Martin, Mayer and Mayneris (2008) sought answers to the
following set of questions: How large are the gains from agglomeration? How much does the productivity of a
firm increase when other firms from the same sector decide to locate nearby? Do firms internalise these gains
when making their location decisions? The authors found that a 10% increase of employment in neighbouring
firms of the same industry spurs productivity increase of about 0.4-0.5%. They argue that because gains from
clustering in many countries of Europe are suboptimal, it should not invite subsidisation of firms located within
clusters. They however admit that the estimation of agglomeration economies is tricky as better endowments
(public infrastructure, climate etc.) associated with agglomerated areas may lead to the attraction of more
productive firms, with the possibility of overestimating the gains of agglomeration.
The European Commission (2008) aligns with the difficulty in estimating the economic impact of clusters in strict
statistical terms and proposes a combination of methodologies that includes case studies as a complementary
approach for gaining more penetrating insights into the clustering phenomenon. Moreover, the publication found
that cluster firms engage more closely with research institutions in their vicinity than other firms and have easier
access to international networks and capital. They also found that dynamic clusters induce a more intensive
North Asian International Research Journal of Multidisciplinary ISSN: 2454 - 2326 Vol. 2, Issue 1 January 2016
North Asian International research Journal consortium www.nairjc.com 10
personal exchange between firms higher than in non-clustered locations. In their view, such ―crosspollination‖ of
ideas and innovation underpinned the success of the Silicon Valley model. Similarly, they attributed the success
of the Stockholm ICT cluster to higher rates of inter-firm labour mobility compared to the rest of the labour
market and higher rates of intra-firm mobility relative to comparable private-sector enterprises.
Porter‗s (2003) study of US clusters, confirms that economic development gauged by average wages and
employment growth is higher in US regions with high proportion of their workforce located in ―strong‖ clusters.
Corroboratively, Wennberg & Lindqvist (2008) found that firm level clustered firms created more jobs, made
higher tax payments, and paid higher wages to employees. The study also established that location in a cluster
impinges positively on the chances of survival of new firms.
While endorsing the potential of clustering to engender greater innovativeness, employment and growth
especially in the first years of existence, Brenner and Gildner (2006) surmise that the positive association
between local clusters and economic performance may ebb over time, although will remain visible, on average, in
local clusters lasting for more than 50 years. Importantly, the study affirms that ―old‖ clusters have long term
positive impact on employment, income and the local start-up rate only, and negative repercussions in regard to
involvement of a region in new technologies; suggesting that clusters have to innovate and adapt to new contexts
and challenges.
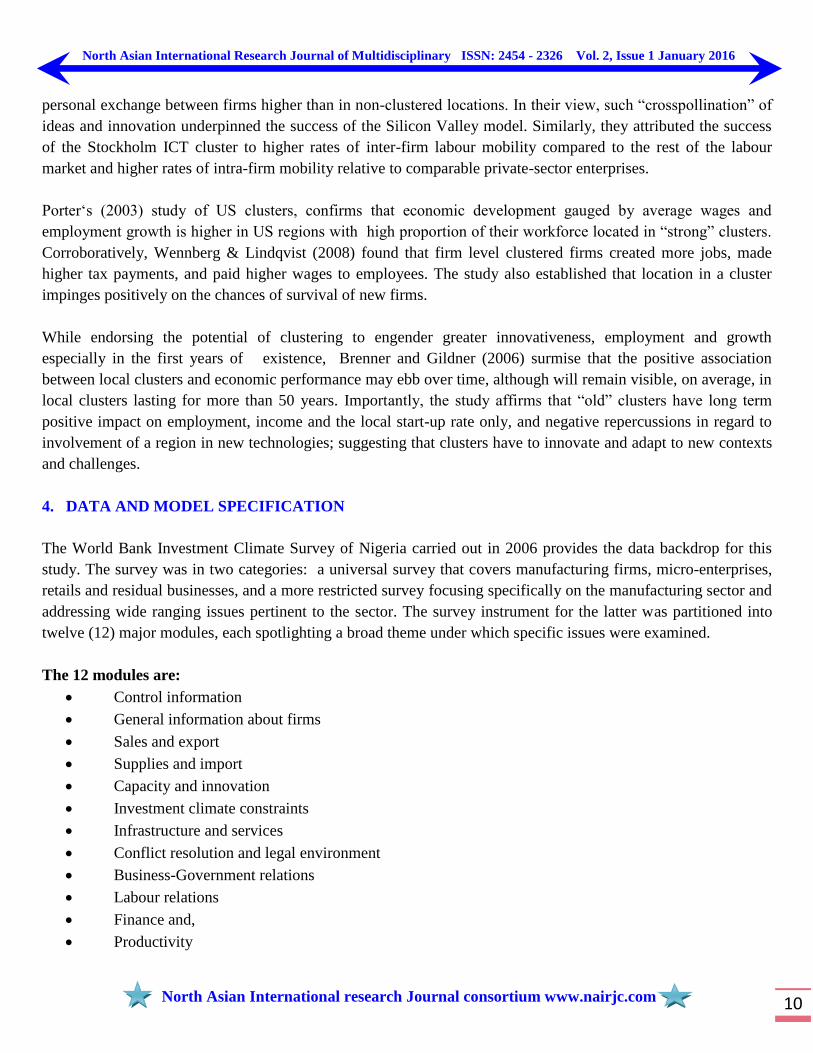
4. DATA AND MODEL SPECIFICATION
The World Bank Investment Climate Survey of Nigeria carried out in 2006 provides the data backdrop for this
study. The survey was in two categories: a universal survey that covers manufacturing firms, micro-enterprises,
retails and residual businesses, and a more restricted survey focusing specifically on the manufacturing sector and
addressing wide ranging issues pertinent to the sector. The survey instrument for the latter was partitioned into
twelve (12) major modules, each spotlighting a broad theme under which specific issues were examined.
The 12 modules are:
Control information
General information about firms
Sales and export
Supplies and import
Capacity and innovation
Investment climate constraints
Infrastructure and services
Conflict resolution and legal environment
Business-Government relations
Labour relations
Finance and,
Productivity

North Asian International Research Journal of Multidisciplinary ISSN: 2454 - 2326 Vol. 2, Issue 1 January 2016
North Asian International research Journal consortium www.nairjc.com 11
Overall, 2,387 firms were surveyed, 43 per cent of which falls within the 10 sub-sectoral classification of the
manufacturing sector viz., food, garments, textile, machinery and equipment, chemicals, electronics, non-metallic
minerals, wood products and furniture, metal and metal products and other manufacturing. 12 per cent of the
surveyed firms were located in the export processing zone.
We assume a transcendental logarithmic production function expressed in non linear form. The advantage of a
trans-log production function over the log-linear form is that it is much more general (it has a flexible functional
form permitting the partial elasticities of substitution between inputs to vary). We therefore specify the stochastic
production frontier model as follows:
)1..(............................................................
))(()()( 3
2
2
2
12413210
it
ititititititit InLInKInLInKXXInLInKInY
Yit is value added or output of firm i at time t. The value added was estimated by subtracting the cost of
intermediate raw materials and goods from the total annual sales. K is capital which was estimated by subtracting
total annual depreciation cost from the total cost of rental of land/building, equipment and furniture. While L is
labor inputs were representing the total number of employees or total annual cost of labor including wages,
salaries and bonuses and social payments. X1 is ratio of technical workers to total production workers; this
differentiates skilled and unskilled workers. X2 measures average annual capacity utilization of firms. The error
term captures the random effects and technical inefficiency, i.e. ititit uv . itv
is the usual random disturbance
value say due to changes in investment climate and it is assumed to be independent and identically distributed;
),0( 2
vN , while itu
are random variables that represent firm-specific effects that reflect firm efficiency and
management skills and according to Battese and Coelli (1992), they are assumed to be independent and
identically distributed and non-negative truncations of the ),( 2N distribution. They are modeled as;
iiitit tTtuuu ,exp( ………………………………………. (2)
where is unknown scalar parameter representing rate of change of technical efficiency, and itu is the technical
inefficiency effect of the ith
firm in the last year of the data set. The random variable itu can either increase at a
decreasing rate ( 0 ), decrease at an increasing rate ( 0 ) or remain constant ( 0 ) which is a special case
for a time-invariant model. )(i is the time function or periods involved from which observations for the ith
firm
are obtained.
The trans-log parameterization of the stochastic frontier model allows for neutral total product hence enabling
estimation of returns to scale. We note that total product is neutral if i is equal to zero such that the production
North Asian International Research Journal of Multidisciplinary ISSN: 2454 - 2326 Vol. 2, Issue 1 January 2016
North Asian International research Journal consortium www.nairjc.com 12
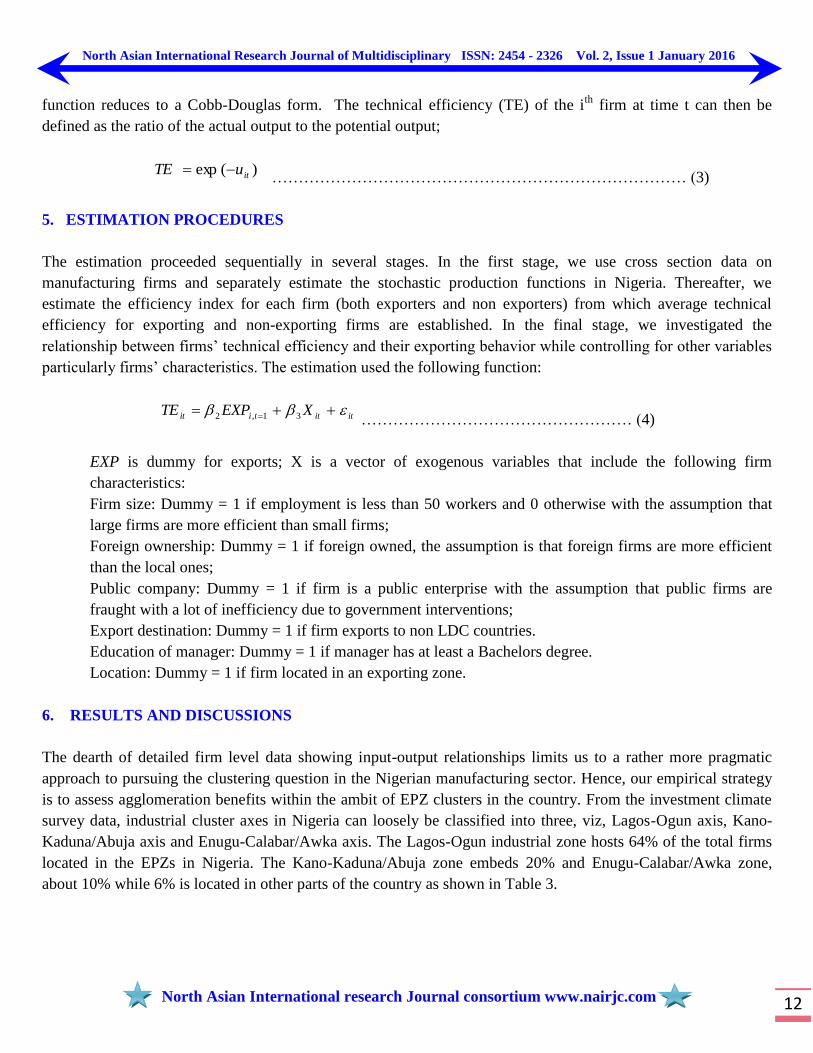
function reduces to a Cobb-Douglas form. The technical efficiency (TE) of the ith
firm at time t can then be
defined as the ratio of the actual output to the potential output;
)(exp ituTE …………………………………………………………………… (3)
5. ESTIMATION PROCEDURES
The estimation proceeded sequentially in several stages. In the first stage, we use cross section data on
manufacturing firms and separately estimate the stochastic production functions in Nigeria. Thereafter, we
estimate the efficiency index for each firm (both exporters and non exporters) from which average technical
efficiency for exporting and non-exporting firms are established. In the final stage, we investigated the
relationship between firms‘ technical efficiency and their exporting behavior while controlling for other variables
particularly firms‘ characteristics. The estimation used the following function:
itittiit XEXPTE 31,2 …………………………………………… (4)
EXP is dummy for exports; X is a vector of exogenous variables that include the following firm
characteristics:
Firm size: Dummy = 1 if employment is less than 50 workers and 0 otherwise with the assumption that
large firms are more efficient than small firms;
Foreign ownership: Dummy = 1 if foreign owned, the assumption is that foreign firms are more efficient
than the local ones;
Public company: Dummy = 1 if firm is a public enterprise with the assumption that public firms are
fraught with a lot of inefficiency due to government interventions;
Export destination: Dummy = 1 if firm exports to non LDC countries.
Education of manager: Dummy = 1 if manager has at least a Bachelors degree.
Location: Dummy = 1 if firm located in an exporting zone.
6. RESULTS AND DISCUSSIONS
The dearth of detailed firm level data showing input-output relationships limits us to a rather more pragmatic
approach to pursuing the clustering question in the Nigerian manufacturing sector. Hence, our empirical strategy
is to assess agglomeration benefits within the ambit of EPZ clusters in the country. From the investment climate
survey data, industrial cluster axes in Nigeria can loosely be classified into three, viz, Lagos-Ogun axis, Kano-
Kaduna/Abuja axis and Enugu-Calabar/Awka axis. The Lagos-Ogun industrial zone hosts 64% of the total firms
located in the EPZs in Nigeria. The Kano-Kaduna/Abuja zone embeds 20% and Enugu-Calabar/Awka zone,
about 10% while 6% is located in other parts of the country as shown in Table 3.
North Asian International Research Journal of Multidisciplinary ISSN: 2454 - 2326 Vol. 2, Issue 1 January 2016
North Asian International research Journal consortium www.nairjc.com 13
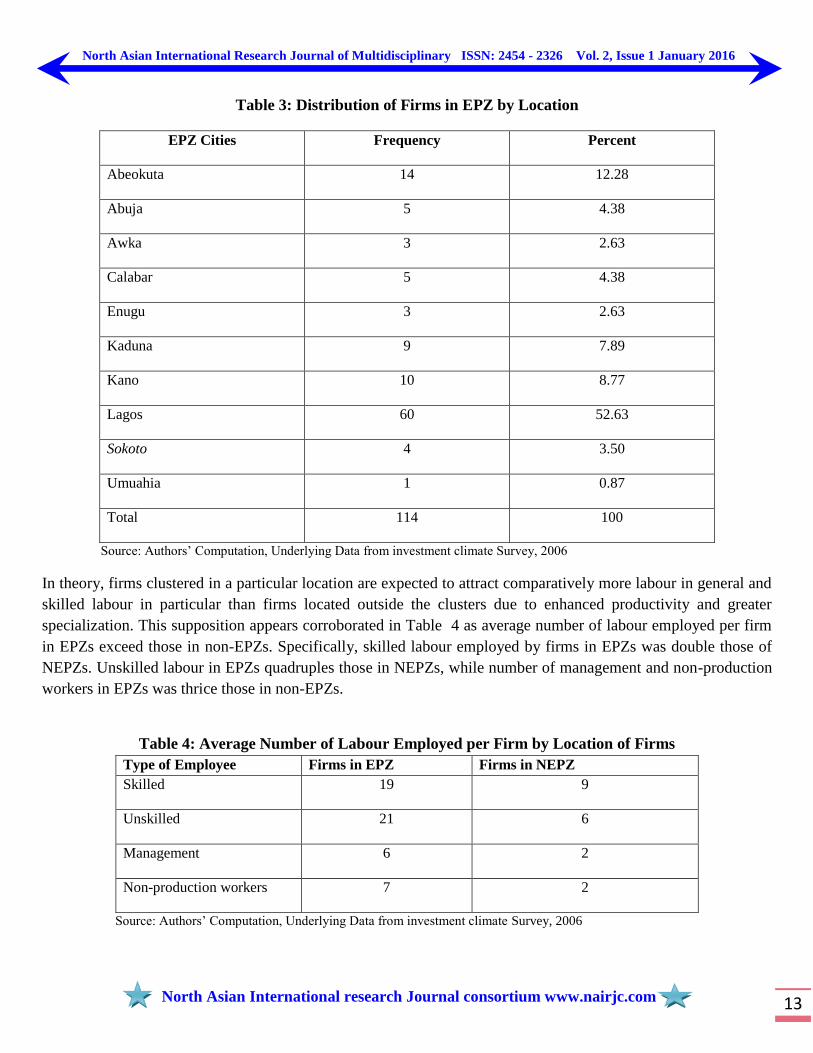
Table 3: Distribution of Firms in EPZ by Location
EPZ Cities Frequency Percent
Abeokuta 14 12.28
Abuja 5 4.38
Awka 3 2.63
Calabar 5 4.38
Enugu 3 2.63
Kaduna 9 7.89
Kano 10 8.77
Lagos 60 52.63
Sokoto 4 3.50
Umuahia 1 0.87
Total 114 100
Source: Authors‘ Computation, Underlying Data from investment climate Survey, 2006
In theory, firms clustered in a particular location are expected to attract comparatively more labour in general and
skilled labour in particular than firms located outside the clusters due to enhanced productivity and greater
specialization. This supposition appears corroborated in Table 4 as average number of labour employed per firm
in EPZs exceed those in non-EPZs. Specifically, skilled labour employed by firms in EPZs was double those of
NEPZs. Unskilled labour in EPZs quadruples those in NEPZs, while number of management and non-production
workers in EPZs was thrice those in non-EPZs.
Table 4: Average Number of Labour Employed per Firm by Location of Firms
Type of Employee Firms in EPZ Firms in NEPZ
Skilled 19 9
Unskilled 21 6
Management 6 2
Non-production workers 7 2
Source: Authors‘ Computation, Underlying Data from investment climate Survey, 2006
North Asian International Research Journal of Multidisciplinary ISSN: 2454 - 2326 Vol. 2, Issue 1 January 2016
North Asian International research Journal consortium www.nairjc.com 14
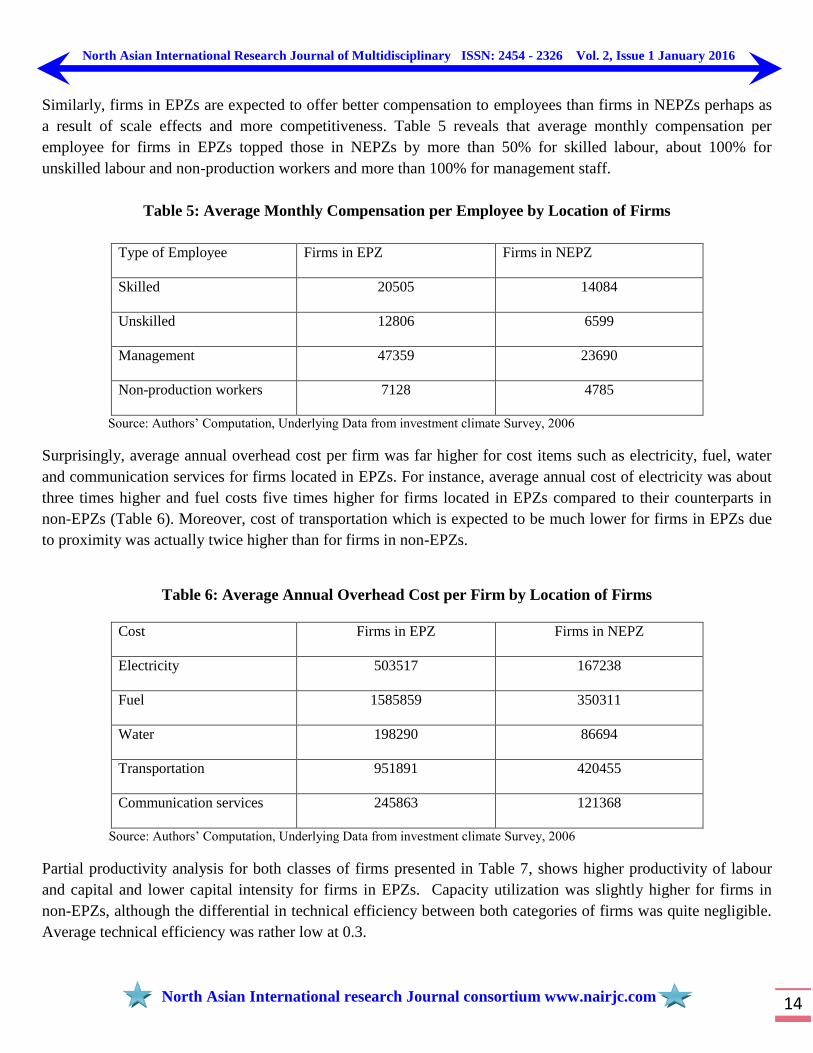
Similarly, firms in EPZs are expected to offer better compensation to employees than firms in NEPZs perhaps as
a result of scale effects and more competitiveness. Table 5 reveals that average monthly compensation per
employee for firms in EPZs topped those in NEPZs by more than 50% for skilled labour, about 100% for
unskilled labour and non-production workers and more than 100% for management staff.
Table 5: Average Monthly Compensation per Employee by Location of Firms
Type of Employee Firms in EPZ Firms in NEPZ
Skilled 20505 14084
Unskilled 12806 6599
Management 47359 23690
Non-production workers 7128 4785
Source: Authors‘ Computation, Underlying Data from investment climate Survey, 2006
Surprisingly, average annual overhead cost per firm was far higher for cost items such as electricity, fuel, water
and communication services for firms located in EPZs. For instance, average annual cost of electricity was about
three times higher and fuel costs five times higher for firms located in EPZs compared to their counterparts in
non-EPZs (Table 6). Moreover, cost of transportation which is expected to be much lower for firms in EPZs due
to proximity was actually twice higher than for firms in non-EPZs.
Table 6: Average Annual Overhead Cost per Firm by Location of Firms
Cost Firms in EPZ Firms in NEPZ
Electricity 503517 167238
Fuel 1585859 350311
Water 198290 86694
Transportation 951891 420455
Communication services 245863 121368
Source: Authors‘ Computation, Underlying Data from investment climate Survey, 2006
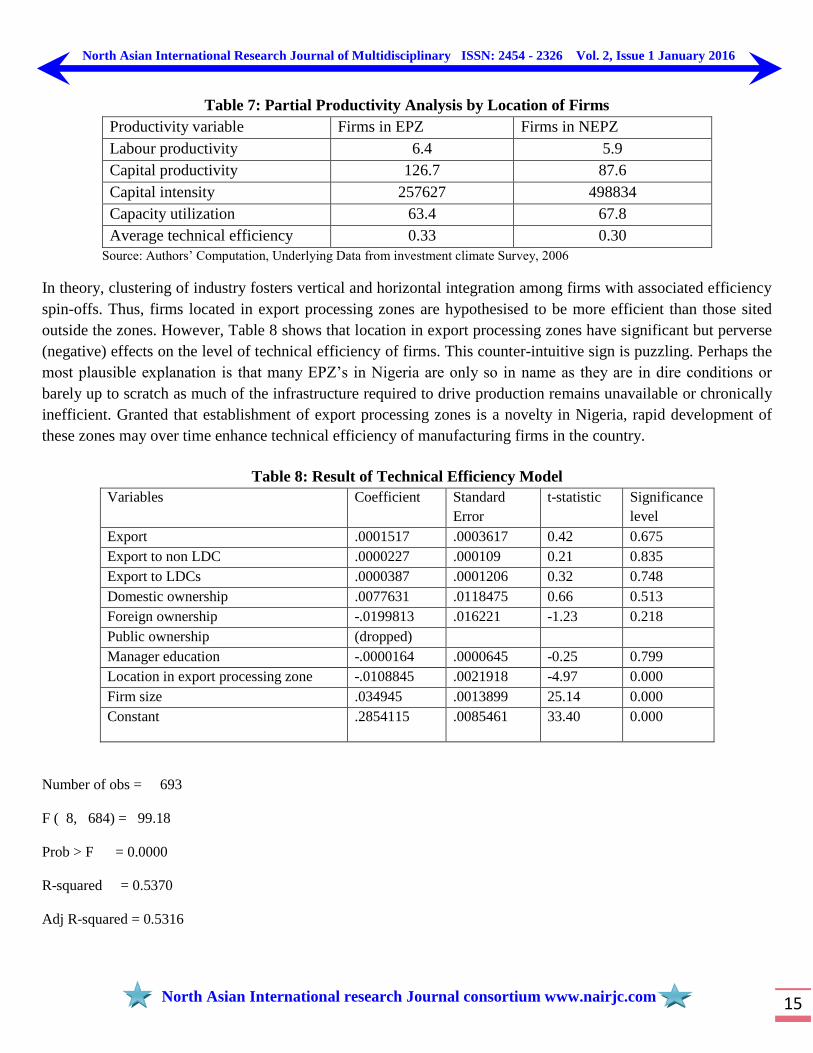
Partial productivity analysis for both classes of firms presented in Table 7, shows higher productivity of labour
and capital and lower capital intensity for firms in EPZs. Capacity utilization was slightly higher for firms in
non-EPZs, although the differential in technical efficiency between both categories of firms was quite negligible.
Average technical efficiency was rather low at 0.3.
North Asian International Research Journal of Multidisciplinary ISSN: 2454 - 2326 Vol. 2, Issue 1 January 2016
North Asian International research Journal consortium www.nairjc.com 15
Table 7: Partial Productivity Analysis by Location of Firms
Productivity variable Firms in EPZ Firms in NEPZ
Labour productivity 6.4 5.9
Capital productivity 126.7 87.6
Capital intensity 257627 498834
Capacity utilization 63.4 67.8
Average technical efficiency 0.33 0.30
Source: Authors‘ Computation, Underlying Data from investment climate Survey, 2006
In theory, clustering of industry fosters vertical and horizontal integration among firms with associated efficiency
spin-offs. Thus, firms located in export processing zones are hypothesised to be more efficient than those sited
outside the zones. However, Table 8 shows that location in export processing zones have significant but perverse
(negative) effects on the level of technical efficiency of firms. This counter-intuitive sign is puzzling. Perhaps the
most plausible explanation is that many EPZ‘s in Nigeria are only so in name as they are in dire conditions or
barely up to scratch as much of the infrastructure required to drive production remains unavailable or chronically
inefficient. Granted that establishment of export processing zones is a novelty in Nigeria, rapid development of
these zones may over time enhance technical efficiency of manufacturing firms in the country.
Table 8: Result of Technical Efficiency Model
Variables Coefficient Standard
Error
t-statistic Significance
level
Export .0001517 .0003617 0.42 0.675
Export to non LDC .0000227 .000109 0.21 0.835
Export to LDCs .0000387 .0001206 0.32 0.748
Domestic ownership .0077631 .0118475 0.66 0.513
Foreign ownership -.0199813 .016221 -1.23 0.218
Public ownership (dropped)
Manager education -.0000164 .0000645 -0.25 0.799
Location in export processing zone -.0108845 .0021918 -4.97 0.000
Firm size .034945 .0013899 25.14 0.000
Constant .2854115 .0085461 33.40 0.000
Number of obs = 693
F ( 8, 684) = 99.18
Prob > F = 0.0000
R-squared = 0.5370
Adj R-squared = 0.5316
North Asian International Research Journal of Multidisciplinary ISSN: 2454 - 2326 Vol. 2, Issue 1 January 2016
North Asian International research Journal consortium www.nairjc.com 16
7. CONCLUSION
Cluster development has emerged as an important new direction in economic policy, and a coordinated and
efficient way to promote economic growth, prioritize major investments and deliver infrastructure. For a troubled
manufacturing sector such as Nigeria‘s, clustering may provide a remedy to the myriad constraints to
industrialization. Consequently, this study investigated potential benefits of agglomeration for the Nigerian
manufacturing sector. The results of our empirical analysis were mixed. While firms clustered in EPZs attract
comparatively more general and skilled labour than firms located outside the clusters and offer better
compensation to their employees, they incurred more costs on average on overheads such as electricity, fuel,
water, transportation and communication services. Significantly, technical efficiency was low (and differential
negligible) for both categories of firms. Finally, locations of firms in export processing zones have significant but
perverse (negative) effects on the level of technical efficiency of firms.
REFERENCES
Audretch D. B and M. P Feldman (1996) R & D Spillovers and the Geography of Innovations and
Production. American Economic Review. Vol.86, no3 pp 630-640
Cortright J (2006) Making Sense of Clusters: Regional Competitiveness and Economic Development. A
Discussion paper prepared for the Brookings Institute Metropolitan Policy Program
European Commission (2008) The Concept of Clusters and Cluster Policies and their Role for
Competitiveness and Innovation: Main Statistical Results and Lessons Learned Luxembourg: Office for
Official Publications of the European Communities — 78 pp. ISBN 978-92-79-09838-3
Krugman P (1991). Increasing Returns and Economic Geography. Journal of Political Economy. Vol 99
No.3 pp xxx
Langlois R. N and P.L Robertson (1995). Firms, Markets and Economic Change. A dynamic theory of
building institutions. Routeledge.185pp
Martin P. Mayer T and F. Mayneris (2008) Natural clusters: Why policies promoting agglomeration are
unnecessary. Available at http://www.voxeu.org/index.php
Madsen V, E V Smith and M Dilling-Hansen (2002)Do R & D Investments affect Export Performance.
Centre for Industrial Economics (CIE) Discussion Papers. University of Copenhagen .Department of
Economics.
Marshall A (1890) Principles of Economics. Vol 1 Macmillan and Company. 754 pp
McCormick, D., 1999 African Enterprise Clusters and Industrialization: Theory and Reality, World
Development Vol. 27, No. 9, pp 1531-1551
Schmitz, H and Nadvi, K (1999): ―Clustering and Industrialization: Introduction. World \development .
Vol 27. No. 9pp 1503-1514
National Bureau of Statistics (2011) review of the Nigerian economy in 2011 and economic outlook for
2012-2015
North D (1990). Institutions, Institutional Change and Economic Performance. Cambridge. Cambrigde
University Press.152pp

North Asian International Research Journal of Multidisciplinary ISSN: 2454 - 2326 Vol. 2, Issue 1 January 2016
North Asian International research Journal consortium www.nairjc.com 17
Oyelaran-Oyeyinka,B (2004) Networking Technical Change and Industrialization: The Case of Small and
Medium Firms in Nigeria. ATPS SPECIAL PAPER SERIES No. 20 African Technology Policy Studies
Network, Nairobi, Kenya. ISBN: 9966-916-09-1
Porter, M. E. (2003) The Economic Performance of Regions. Regional Studies, 37(6-7): 549-578
Williamson, O.E (1985). The Economic Institutions of Capitalism: Firms and Markets. New York. Free
Press, 450pp

North Asian International Research Journal of Multidisciplinary ISSN: 2454 - 2326 Vol. 2, Issue 1 January 2016
North Asian International research Journal consortium www.nairjc.com 18
Publish Research Article
Dear Sir/Mam,
We invite unpublished Research Paper,Summary of Research
Project,Theses,Books and Book Review for publication.
Address:- Dr. Ashak Hussain Malik House No-221, Gangoo Pulwama - 192301
Jammu & Kashmir, India
Cell: 09086405302, 09906662570, Ph No: 01933212815
Email: [email protected], [email protected]
Website: www.nairjc.com