NORTH AMERICAN ORIENTED STRAND BOARD INDUSTRY …
52
NORTH AMERICAN ORIENTED STRAND BOARD INDUSTRY REVIEW Prepared for: Manitoba Clean Environment Commission 305-155 Carlton St. Winnipeg, MB R3C 3H8 Prepared by: SENES Consultants Limited 121 Granton Drive, Unit 12 Richmond Hill, Ontario L4B 3N4 June 2009 Printed on Recycled Paper Containing Post-Consumer Fibre
Transcript of NORTH AMERICAN ORIENTED STRAND BOARD INDUSTRY …

NORTH AMERICAN ORIENTED STRAND BOARD INDUSTRY REVIEW
Prepared for:
Manitoba Clean Environment Commission 305-155 Carlton St.
Winnipeg, MB R3C 3H8
Prepared by:
SENES Consultants Limited 121 Granton Drive, Unit 12
Richmond Hill, Ontario L4B 3N4
June 2009
Printed on Recycled Paper Containing Post-Consumer Fibre

NORTH AMERICAN ORIENTED STRAND BOARD
INDUSTRY REVIEW
Prepared for:
Manitoba Clean Environment Commission 305-155 Carlton St.
Winnipeg, MB R3C 3H8
Prepared by:
SENES Consultants Limited 121 Granton Drive, Unit 12
Richmond Hill, Ontario L4B 3N4
Prepared by:
________________________ _________________________ Kim Theobald, B.Sc. Malcolm Smith, P.Eng
Environmental Scientist Senior Environmental Engineer
Reviewed by:
________________________ James W.S. Young, Ph.D., P.Eng. Senior Air Quality Specialist
June 2009
Printed on Recycled Paper Containing Post-Consumer Fibre

Review of the OSB Industry in North America - Manitoba Clean Environment Commission (CEC)
34947 - FINAL – June 2009 SENES Consultants Limited i
TABLE OF CONTENTS Page No.
EXECUTIVE SUMMARY ...........................................................................................................1
1.0 INTRODUCTION ...............................................................................................................2
2.0 STUDY OBJECTIVES AND METHODOLOGY..............................................................3 2.1 Pollution Control Technologies ...............................................................................3 2.2 Regulatory Review...................................................................................................3
3.0 OSB PROCESS DESCRIPTION AND EMISSIONS.........................................................5 3.1 OSB Process Description.........................................................................................5
3.1.1 Log Preparation............................................................................................6 3.1.2 Drying ..........................................................................................................6 3.1.3 Blending.......................................................................................................7 3.1.4 Pressing........................................................................................................7 3.1.5 Finishing Operations....................................................................................8
3.2 Factors Affecting VOC and HAP Emissions...........................................................8 3.2.1 Dryers...........................................................................................................9 3.2.2 Presses........................................................................................................11
3.3 Canadian NPRI Database.......................................................................................11
4.0 CONTROL TECHNOLOGIES .........................................................................................13 4.1 Wet Electrostatic Precipitators...............................................................................13 4.2 Regenerative Thermal Oxidizers ...........................................................................14 4.3 Regenerative Catalytic Oxidizers ..........................................................................17 4.4 Biofiltration............................................................................................................19 4.5 Other Control Technologies...................................................................................20 4.6 Pollution Prevention...............................................................................................20
5.0 REGULATORY REVIEW................................................................................................22 5.1 Canada....................................................................................................................22 5.2 United States ..........................................................................................................24
5.2.1 U.S. EPA MACT Floor..............................................................................25 5.2.2 State Regulations .......................................................................................27
5.3 Comparing General Canadian and United States Approaches ..............................28 5.4 Current Control Practices at OSB Facilities ..........................................................28
5.4.1 Canada........................................................................................................28 5.4.2 United States ..............................................................................................28
6.0 CONCLUSIONS................................................................................................................30
7.0 REFERENCES ..................................................................................................................31
8.0 GLOSSARY AND ABBREVIATIONS............................................................................33

Review of the OSB Industry in North America - Manitoba Clean Environment Commission (CEC)
34947 - FINAL – June 2009 SENES Consultants Limited ii
LIST OF TABLES Page No.
Table 3-1 US EPA AP-42 OSB Dryer Emission Factors................................................... 10 Table 4-1 Example of WESP Capital and Operating Costs ............................................... 14 Table 4-2 Typical RTO Capital and Operating Costs ........................................................ 17 Table 4-3 Typical RCO Capital and Operating Costs........................................................ 18 Table 5-1 Characteristics of Provincial Permitting Systems.............................................. 23 Table 5-2 Estimated USA Nationwide Change in HAP, THC and Criteria Air Pollutants
from OSB Compliance with MACT Standards ................................................. 27 Table 5-3 Estimated USA Nationwide Energy Impacts from OSB Compliance with
MACT Standards ............................................................................................... 27
LIST OF FIGURES Page No.
Figure 3-1 Simplified Process Flow Diagram for an OSB Facility....................................... 5 Figure 4-1 Schematic of a Regenerative Thermal Oxidizer ................................................ 15 Figure 4-2 A Simple Biofiltration System........................................................................... 19

Review of the OSB Industry in North America - Manitoba Clean Environment Commission (CEC)
34947 - FINAL – June 2009 SENES Consultants Limited 1
EXECUTIVE SUMMARY
This report reviews the oriented strand board (OSB) industry in Canada and the United States, focusing on how emissions from OSB facilities are managed with current control technologies, and how air pollutants relevant to the OSB industry are regulated through government initiatives.
OSB is a structural panel made from thin wood strands cut from whole softwood and/or hardwood logs. The strands are dried to a low moisture content and are subsequently blended with a resin before being formed into a 3 to 5 layer mat. The mat is constructed so that each layer of strands is oriented perpendicular to an adjacent layer hence the name “oriented strand board”. The mat is hot pressed to activate the resin which binds the wood strands together to form a solid wood panel. The physical and mechanical properties of OSB make it suitable for a wide range of construction applications similar to those of softwood plywood including roof and wall sheathing, subflooring and underlayment.
There are three (3) primary sources of pollutant emissions to the atmosphere from the OSB manufacturing process: (1) combustion emissions (i.e., combustion of wood, natural gas or other fuel oil); (2) emissions driven off by drying the wood, releasing to atmosphere naturally occurring materials in the wood; and, (3) emissions associated with resins used to bind the wood strands together. Pollutant emissions can be managed using add-on control technologies, with the type of control technology used depending upon the type of pollutant as well as the type of equipment in the OSB manufacturing process. The most common control technologies used in North America’s OSB industry include wet electrostatic precipitators (WESPs) to control particulate emissions and regenerative thermal oxidizers (RTOs), regenerative catalytic oxidizers (RCOs) or biofilters to control volatile organic compound (VOC) and hazardous air pollutant (HAP) emissions.
RTOs and RCOs are incineration type control technologies, typically generating heat through the combustion of natural gas, which results in the generation of greenhouse gases (GhGs). However, according to published emission factors, the primary source of GhG emissions from the OSB industry is through the combustion of residual wood products used to provide heat for drying and pressing operations.
The costs to operate emissions control equipment can be a large portion of the overall OSB manufacturing cost. Currently (2009), the OSB industry is experiencing the effects of the economic slow down, with government and industry contacts indicating many plants are closing due to a decrease in the North American demand for the product.
In general, Canadian provinces regulate air pollutants emitted from the OSB manufacturing sector through ground-level ambient air concentration limits. In contrast, the United States uses a control-based approach to regulate OSB HAP emissions where a level of control is specified. State authorities may also regulate HAP and non-HAP emissions in much the same way that Canadian provinces do.

Review of the OSB Industry in North America - Manitoba Clean Environment Commission (CEC)
34947 - FINAL – June 2009 SENES Consultants Limited 2
1.0 INTRODUCTION
The Clean Environment Commission (CEC) is an arm’s-length provincial agency established under The Environment Act of Manitoba. The Commission encourages and facilitates public involvement in environmental matters and offers advice and recommendations to the Minister of Conservation with respect to environmental issues, project approvals, and environmental licences. Its mandate is exercised through public hearings, investigations and mediation. SENES Consultants Limited (SENES) was retained by the Manitoba Clean Environment Commission to provide an overview of the oriented strand board (OSB) industry in North America. This report reviews the OSB industry in Canada and the United States, focusing on how emissions from OSB facilities are managed with current control technologies, and how air pollutants relevant to the OSB industry are regulated through government initiatives. This review was completed by speaking with both industry and government representatives in Canada and the United States in addition to undertaking a review of available literature. The report begins by outlining the study objectives and methodology used in detail. An overview of the OSB manufacturing process is then provided, highlighting the sources of emissions and which pollutants are emitted from each source. A review of current control technologies used for managing VOCs, HAPs and PM emissions is also presented, which discusses the effectiveness, control efficiencies and costs of each technology. Finally, a regulatory review is provided, which compares the standards, criteria, guidelines and objectives in place in Canada and the United States for air pollutants relevant to the OSB industry.

Review of the OSB Industry in North America - Manitoba Clean Environment Commission (CEC)
34947 - FINAL – June 2009 SENES Consultants Limited 3
2.0 STUDY OBJECTIVES AND METHODOLOGY
The primary objectives of this report are (1) to conduct a review of air pollution control technologies currently used at OSB plants in Canada and the United States, and (2) to conduct a review of the regulations governing emissions to the atmosphere from the OSB industry.
2.1 POLLUTION CONTROL TECHNOLOGIES
This report reviews current air pollution control technologies at North American OSB facilities, including an evaluation of each control technology’s effectiveness, efficiency, capital cost, and operation & maintenance costs. Information was gathered from two primary sources: (1) published documents, and (2) phone conversations with industry experts. Information sources are referenced within the text and summarized in Section 9.0 References. Technical reports prepared by the United States Environmental Protection Agency (U.S. EPA) (AP-42 Section 10.6.1), Industry Canada (Wood-Based Panel Products Technology Roadmap) and other published technical documents and literature were used to develop a description of the OSB manufacturing process and common pollutant control technologies used at North American plants. To assess the effectiveness, efficiencies and costs of each air pollution abatement technology, several manufacturer and industry representatives were contacted, including:
� Derrick Web, Biotherm; � Jeff Kudronowicz, Anguil Environmental Systems; � Gilles Brunette, FPInnovations, Foritek Division; and, � Mike Hill, Applied Contaminant Control Ltd.
2.2 REGULATORY REVIEW
This report also reviews the regulations governing emissions to the atmosphere from OSB facilities in Canada and the United States. Specifically, a review of the standards, criteria, guidelines and objectives addressing emissions of volatile organic compounds (VOCs), hazardous air pollutants (HAPs), greenhouse gases (GhGs), particulate matter (PM, PM10 and PM2.5), oxides of nitrogen (NOx), phenol, formaldehyde, benzene and methane diphenyl diisocyanate (MDI). Furthermore, federal, provincial and state regulations were reviewed to develop a jurisdictional comparison of air quality standards, criteria, guidelines and objectives for these pollutants.

Review of the OSB Industry in North America - Manitoba Clean Environment Commission (CEC)
34947 - FINAL – June 2009 SENES Consultants Limited 4
To review the environmental regulations governing the OSB industry, government and industry representatives in Canada and the United States were contacted, including:
� James Eatkins, Environment Canada, Department of Forestry, Agriculture and Aquaculture;
� Elizabeth Palma, U.S. EPA Office of Air Quality; and, � Roger Cook, Director of Environment, Forest Products Association of Canada (FPAC).
An effort was also made to contact government representatives in the provinces of Ontario, British Columbia and Alberta, however this was unsuccessful.

Review of the OSB Industry in North America - Manitoba Clean Environment Commission (CEC)
34947 - FINAL – June 2009 SENES Consultants Limited 5
3.0 OSB PROCESS DESCRIPTION AND EMISSIONS
OSB is a structural wood panel made from long thin softwood or hardwood strands cut from whole logs. In Canada and the United States softwoods include coniferous species such as pine, fur and spruce; hardwoods are usually deciduous species such as aspen and birch.
Wooden strands are blended with a resin and formed into a 3 to 5 layer mat with each layer of strands oriented perpendicular to the adjacent layer. This type of orientation makes the panel more flexible while still providing adequate strength. The mat is hot pressed to activate the resin and bind the wood strands together to form a solid board. The physical and mechanical properties of OSB make it suitable for a wide range of construction applications similar to those of softwood plywood including roof and wall sheathing, subflooring and underlayment.
The following sections describe the typical manufacturing processes at an OSB facility. Sources of atmospheric emissions are identified and the expected contaminants from each manufacturing step are outlined.
3.1 OSB PROCESS DESCRIPTION
Adapted from U.S. EPA AP-42 Section 10.6.1, Figure 3-1 shows a simplified process flow diagram of an OSB facility and highlights the sources of emissions. Each of these processes is described in some detail in the sections that follow.
Figure 3-1 Simplified Process Flow Diagram for an OSB Facility
Adapted from US EPA AP42 Section 10.6.1
Particulate, Negligible VOCs
Particulate, NOx, CO, CO2
VOC, HAP
Particulate, NOx, CO,
VOC, HAP
Log Preparation
Resins (PF or MDI), Wax, Additives
Particulate, THC, VOC
THC, VOC, HAP
Drying
Blending
Pressing
Finishing

Review of the OSB Industry in North America - Manitoba Clean Environment Commission (CEC)
34947 - FINAL – June 2009 SENES Consultants Limited 6
3.1.1 Log Preparation
The OSB manufacturing process begins with removing the bark (i.e., debarking) from whole logs. During the debarking process logs may also be cut to lengths of approximately 2.5 m. After debarking, a piece of equipment called a flaker cuts the logs into long, thin strands roughly 3.5 cm wide, 7 to 15 cm long and 0.07 cm thick. During winter operations in northern plants, logs are put into hot ponds (18 to 43oC) to thaw prior to the flaking process. The strands are then passed through screens to remove any bits of sawdust and to sort the strands between ‘surface’ and ‘core’ material quality. Surface and core materials are the strands which will be used to construct the core and surface layers of the final OSB product. Log debarking, flaking and screening are all sources of particulate matter (PM) emissions in the form of sawdust and wood particles. PM emissions are also broken down to smaller size fractions: particulate matter less than 10 microns in diameter (PM10) and particulate matter less than 2.5 microns in diameter (PM2.5). PM10 is also known as inhalable particulate because it can settle in the bronchi of the lungs and PM2.5 is often referred to as respirable particulate because it can penetrate into the gas exchange regions of the lungs. Fugitive emissions of particulate matter may also arise from on-site vehicle activities and wind-blown dust originating from uncovered bark or wood fines (i.e., sawdust) storage piles. Dust from the bark and fines piles can be controlled by using enclosures or by spraying piles with water, which helps to prevent wind from picking up and dispersing the particulate.
3.1.2 Drying
The drying process reduces the moisture content of the wood strands from approximately 60% down to about 5%, which allows for the addition of extra moisture from resins and other additives further on in the production process. The most commonly used dryer in the OSB industry is the triple-pass rotary drum dryer, which circulates incoming wood strands as they dry and allows the material to pass through the dryer three times prior to exiting. Single-pass rotary dryers may also be used which only allow the incoming wood strands to pass through the dryer once. Rotary dryers are typically direct-fired using wood residue left over from plant operations. Natural gas or oil fired rotary dryers are less commonly used. The inlet temperature of a rotary dryer will range from 540oC to 870oC. Conveyor dryers are an alternative type of dryer used in the OSB industry. Wood strands entering a conveyor dryer are simply dried as the strands are carried through on a conveyor. Conveyor dryers are usually indirectly fired and have lower inlet temperatures than rotary dryers (approximately 160oC).

Review of the OSB Industry in North America - Manitoba Clean Environment Commission (CEC)
34947 - FINAL – June 2009 SENES Consultants Limited 7
Dryers are one of the primary sources of air pollutant emissions in the OSB manufacturing process. Emissions from the combustion of wood products (or natural gas or oil) are generated during the heating process, and volatile compounds naturally occurring in wood are emitted when the strands are heated in the drying process and released as volatile organic compounds (VOCs) and hazardous air pollutants (HAPs). Combustion emissions will depend on the type of fuel used to operate the dryer, but are generally comprised of particulate matter (PM), oxides of nitrogen (NOx), carbon dioxide (CO2) and carbon monoxide (CO). Condensable PM and some VOCs will leave the dryer stack as vapour, but will quickly condense at ambient air temperatures to form a visible blue haze. These compounds are primarily derived from the wood itself, and their form and abundance will therefore depend on the wood species in addition to the dryer inlet temperature, fuel used, time of year, time between logging and processing, and duration of wet strand storage.
3.1.3 Blending
After drying, fines are removed from the strands and the remaining material is separated by size and weight. The dried strands are then conveyed to the blender where they are mixed with resins, wax and other additives including catalysts to speed up the curing process. OSB facilities typically have two blenders, one for strands which will be used as the surface of the wood panel, and one for strands which will be used as the core of the wood panel. Resins used in the surface strand blender are typically liquid or powder phenol-formaldehyde (PF), and resins used in the core strand blender are either PF or diphenyl methane diisocyanate (MDI) based. There is some documentation of MDI resins used as both a surface and core resin, but this practice is not common. MDI is growing in popularity because it cures at a lower temperature and faster than PF (U.S. EPA, 2000). Emissions from blending activities include the vapourization of VOCs and HAPs which arise directly from the resins. These emissions are much lower than from drying and pressing activities.
3.1.4 Pressing
Following blending, the strands are conveyed to a former where they are mechanically oriented as they fall onto a screen below, such that each layer of strands is perpendicular to one another. A mat consisting of 3 to 5 layers of strands is formed. The mat is trimmed prior to pressing.

Review of the OSB Industry in North America - Manitoba Clean Environment Commission (CEC)
34947 - FINAL – June 2009 SENES Consultants Limited 8
Presses apply heat and pressure to the mat to activate the resin and bond the strands into a solid board. The heat required for hot pressing is typically provided by steam generated from a boiler that burns residual wood waste. Hot water or hot oil can also be used to transfer heat to the press, and natural gas or oil can be used to generate heat within the boiler. The OSB boards are usually stacked while still hot to allow the resin to cure better. Presses are another of the primary sources of air pollutant emissions in the OSB manufacturing process, emitting combustion products during heat generation as well as VOCs and HAPs during the pressing process. Emissions from hot presses depend highly on the resin type and the amount of resin used. When the press opens vapours are released, which are comprised of resin compounds including formaldehyde and phenol from PF resins or MDI from MDI resins. Emissions are generally released into the pressing area and are expelled from the building through general ventilation exhaust; however, if emissions are controlled, the press is often enclosed and directed to a control device. Formaldehyde emissions depend on the amount of excess formaldehyde in the resin, board thickness, press temperature, press cycle time and catalyst application rates. In general, emissions from pressing operations depend on wood species and wood moisture content, wax and catalyst application rates, and press conditions.
3.1.5 Finishing Operations
Solid boards are trimmed to the appropriate dimensions and finished as necessary prior to packing/shipping. Trimming operations result in PM emissions. OSB edges may also be painted, but because water-based coatings are typically used, little VOC emissions result from this finishing step. Fugitive PM emissions can arise from wind-blown sawdust storage piles or from shipping vehicles driving on unpaved roads. These emissions can be controlled by watering.
3.2 FACTORS AFFECTING VOC AND HAP EMISSIONS
As discussed above, VOCs and HAPs are emitted primarily from the dryers and presses. The following sections discuss some of the factors affecting VOC and HAP emissions from drying and pressing processes.

Review of the OSB Industry in North America - Manitoba Clean Environment Commission (CEC)
34947 - FINAL – June 2009 SENES Consultants Limited 9
3.2.1 Dryers
There are several factors that can affect the level of VOC and HAP emissions from dryers. Some of these factors include the inlet temperature of the dryer and the type of wood species used. Additional factors include the final moisture content of the wood strands, the amount of fines present in the incoming strand material and the type of dryer used. As discussed in Section 3.1.2 above, VOCs and HAPs are generated from the heating of wood at high temperatures. Higher dryer inlet temperatures will result in larger emissions of VOCs and HAPs because more compounds are volatilized at higher temperatures. This effect has been demonstrated in two studies, NCASI (1999) and Otwell et al. (2000). Emissions are also affected by the moisture content that wood strands are dried to. As the wood initially dries, evaporative cooling from the loss of water prevents the temperature of the wood from rising. When the moisture content becomes lower, the temperature of the wood increases and decomposition of the wood tissue begins, thereby releasing VOCs and HAPs naturally occurring in the wood. Otwell et al. (2000) showed that tissue decomposition is associated with specific moisture contents and that by increasing the final moisture content of the wood from 2% to 5%, total VOC emissions were reduced by 60%. Moreover, the amount of fines present in the incoming wood strands is an important factor affecting emissions as fines are easily burned off in the dryer, thereby producing VOC and HAP emissions. As a result, it is important to effectively remove the fines from the strands prior to them entering the dryer. The most commonly used dryer type is the rotary dryer. It rotates incoming material which is tumbled as it dries. A triple-pass rotary dryer allows the material to pass through the equipment three times before exiting, whereas a single-pass dryer only allows the material to pass through once. As a result, it has been demonstrated that single-pass dryers will produce approximately two to three times less PM emissions compared to triple-pass dryers due to decreased agitation of the wood strands (O’Connor, 2006). Both triple- and single-pass rotary dryers operate at approximately the same temperatures, so VOC and HAP emission levels are comparable (Gilles Brunette, personal communication, 2 June 2009). In contrast, conveyor dryers operate at much lower temperatures and do not tumble incoming materials (see Section 3.1.2) and accordingly will produce less VOC and HAP emissions in addition to lower particulate emissions (O’Connor, 2006). Unlike rotary dryers, conveyor dryers require a long space to be located due to the increased amount of time required for the strands to reach the desired moisture content. Furthermore, conveyors are a newer drying technology and some required refinements have been reported. For example, there is a reported tendency for fine particles to become deposited on the conveyor itself (IC, 1998), which can result in fines being burned off and therefore increasing VOC and
Review of the OSB Industry in North America - Manitoba Clean Environment Commission (CEC)
34947 - FINAL – June 2009 SENES Consultants Limited 10
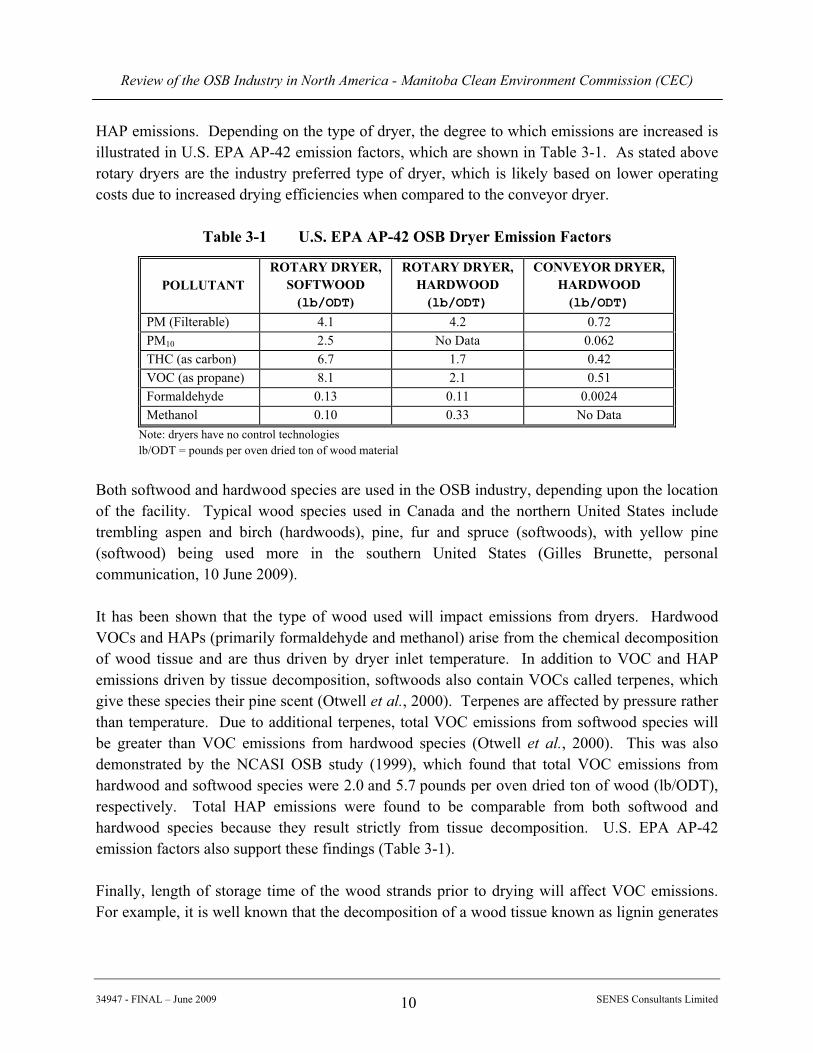
HAP emissions. Depending on the type of dryer, the degree to which emissions are increased is illustrated in U.S. EPA AP-42 emission factors, which are shown in Table 3-1. As stated above rotary dryers are the industry preferred type of dryer, which is likely based on lower operating costs due to increased drying efficiencies when compared to the conveyor dryer.
Table 3-1 U.S. EPA AP-42 OSB Dryer Emission Factors
POLLUTANT ROTARY DRYER,
SOFTWOOD (lb/ODT)
ROTARY DRYER, HARDWOOD
(lb/ODT)
CONVEYOR DRYER, HARDWOOD
(lb/ODT) PM (Filterable) 4.1 4.2 0.72 PM10 2.5 No Data 0.062 THC (as carbon) 6.7 1.7 0.42 VOC (as propane) 8.1 2.1 0.51 Formaldehyde 0.13 0.11 0.0024 Methanol 0.10 0.33 No Data
Note: dryers have no control technologies lb/ODT = pounds per oven dried ton of wood material
Both softwood and hardwood species are used in the OSB industry, depending upon the location of the facility. Typical wood species used in Canada and the northern United States include trembling aspen and birch (hardwoods), pine, fur and spruce (softwoods), with yellow pine (softwood) being used more in the southern United States (Gilles Brunette, personal communication, 10 June 2009). It has been shown that the type of wood used will impact emissions from dryers. Hardwood VOCs and HAPs (primarily formaldehyde and methanol) arise from the chemical decomposition of wood tissue and are thus driven by dryer inlet temperature. In addition to VOC and HAP emissions driven by tissue decomposition, softwoods also contain VOCs called terpenes, which give these species their pine scent (Otwell et al., 2000). Terpenes are affected by pressure rather than temperature. Due to additional terpenes, total VOC emissions from softwood species will be greater than VOC emissions from hardwood species (Otwell et al., 2000). This was also demonstrated by the NCASI OSB study (1999), which found that total VOC emissions from hardwood and softwood species were 2.0 and 5.7 pounds per oven dried ton of wood (lb/ODT), respectively. Total HAP emissions were found to be comparable from both softwood and hardwood species because they result strictly from tissue decomposition. U.S. EPA AP-42 emission factors also support these findings (Table 3-1). Finally, length of storage time of the wood strands prior to drying will affect VOC emissions. For example, it is well known that the decomposition of a wood tissue known as lignin generates

Review of the OSB Industry in North America - Manitoba Clean Environment Commission (CEC)
34947 - FINAL – June 2009 SENES Consultants Limited 11
formaldehyde. Thus, if the wood is stored for longer periods of time, more decomposition of the wood tissue will occur, thereby releasing more formaldehyde.
3.2.2 Presses
The main factors affecting VOC and HAP emissions from presses include the type of wood species and the type and amount of resin used. Wood species will affect the emissions from a press in the same way dryer emissions are affected. For example, NCASI (1999) found that total VOC emissions from presses were greater for softwoods than hardwoods, but that HAP emissions were not significantly different between softwoods and hardwoods. Additionally, the type and amount of resin used will greatly influence the amount of VOCs and HAPs emitted from presses. As previously mentioned, the main resin types include powder or liquid phenol-formaldehyde (PF) and dimethyl methane diisocyanate (MDI), which can be used separately or in combination with each other. Using PF resins will increase the amount of formaldehyde and phenol emitted. Also, a board made using PF requires the strands to be dried to lower moisture contents (4 to 8%) (Gilles Brunette, personal communication, 2 June 2009). As previously discussed lower moisture contents will increase dryer VOC and HAP emissions. As a result, the use of PF will indirectly increase dryer emissions due to such low, specific moisture requirements. MDI resins will directly increase the emission of MDI, but tends to be more forgiving to varying moisture contents, therefore often resulting in fewer dryer emissions. However, MDI is more expensive than PF and also requires special handling and storage practices and is not always favoured as a result. Which resin is used will ultimately depend on the final product being manufactured. MDI based OSB is more expensive, more resistant to water and typically used in flooring applications, whereas PF based OSB is less expensive and typically used in wall sheeting applications (Gilles Brunette, personal communication, 2 June 2009).
3.3 CANADIAN NPRI DATABASE
In Canada, OSB facilities are required to report contaminant atmospheric emissions on an annual basis if certain criteria and emission thresholds are met. The means for compiling this information is the through National Pollutant Release Inventory (NPRI), which is a Canadian Environmental Protection Act (CEPA) mandated program designed to track Canadian emissions, releases and transfers of hazardous / priority substances. To gain perspective on the type and amount of air pollutants released by the Canadian OSB industry, the 2007 NPRI database was consulted. Canadian OSB facilities report their emissions

Review of the OSB Industry in North America - Manitoba Clean Environment Commission (CEC)
34947 - FINAL – June 2009 SENES Consultants Limited 12
under the Canadian Standard Industrial Classification (SIC) code 2593. Using this SIC code as a search criterion, 21 OSB facilities were identified. However, based on discussions with Environment Canada there are approximately 30 OSB facilities in Canada, with some facilities currently not operating (James Eakins, personal communication, 27 May 2009). Further discussions with pollution control equipment suppliers also indicates more OSB facilities are closing due to a decrease in the North American demand for product (Mike Hill, personal communication, 12 June 2009). According to 2007 NPRI data, a comparison of the OSB industry against all other Canadian industries combined indicates that the OSB industry contributes most significantly to the overall Canadian acrolein (71%), dimethyl methane diisocyanate (MDI) (43%), formaldehyde (37%) and acetaldehyde (21%) atmospheric emissions. Other air pollutants such as total VOCs, benzene, phenol, particulate matter, nitrogen oxides and carbon monoxide are all less than 5% of Canada’s total emissions for each pollutant. Detailed emissions tables are provided in Appendix A. To determine the amount of greenhouse gases emitted from the Canadian OSB industry, Canada’s Greenhouse Gas Inventory was consulted. Only facilities which emit greater than 100,000 tonnes of CO2 equivalents are required to report to this database. It was found that no OSB facilities in Canada were required to report to the greenhouse gas inventory in 2007.

Review of the OSB Industry in North America - Manitoba Clean Environment Commission (CEC)
34947 - FINAL – June 2009 SENES Consultants Limited 13
4.0 CONTROL TECHNOLOGIES
Pollutant emissions from the OSB manufacturing process can be managed using add-on control technologies. The type of control technology used will depend on the type of pollutant as well as the type of equipment used in the OSB manufacturing process. To control particulate matter emissions, devices such as multi-cyclones (multiclones), wet scrubbers, electrified filter beds (EFBs) and wet electrostatic precipitators (WESPs) can be used. To control VOC and HAP emissions from OSB operations, incineration-based technologies such as regenerative thermal oxidizers (RTOs) and regenerative catalytic oxidizers (RCOs) may be used, or biological controls such as biofilters may be used to control some VOC and HAP emissions.
The following sections provide a general description of the most common types of control technologies currently in use in the North American OSB industry. A discussion of each technology’s effectiveness, control efficiency and cost is presented. A brief discussion of pollution prevention strategies for reducing the amount of VOCs or HAPs being emitted in the first place is also provided.
4.1 WET ELECTROSTATIC PRECIPITATORS
An electrostatic precipitator (ESP) is a device which primarily controls particulate based contaminants (PM, PM2.5 and PM10). It removes particulates from exhaust gases using the force of an electrostatic charge. An electric charge is given to incoming particles, which are then forced to collect on the walls of the ESP by a central electrode which continuously generates an electrical field (U.S. EPA, 2003a).
A wet electrostatic precipitator (WESP) is simply a dry ESP equipped with a pre-quench zone that cools and saturates incoming air. It is effective at controlling the sticky and condensable particulate emissions from OSB dryers. Particulate removal efficiencies typically range from 90 to 99% for older WESP technologies (U.S. EPA 2003a; U.S. EPA, 2000), while newer WESP technologies have efficiencies in the range of 99 to 99.9% (U.S. EPA, 2003a).
Some fractions of water soluble HAPs such as formaldehyde and methanol are also removed in the pre-quench zone of a WESP. However, the ability of a WESP to remove water soluble HAPs decreases at the water becomes saturated with these compounds. In a study by NCASI (1999), it was concluded that the average VOC removal efficiency in WESPs was only 3.3% and, therefore, was not considered effective in controlling VOCs. The ability of WESPs to remove VOCs can also be considered a disadvantage because VOC contaminated wastewater is generated and must be properly disposed. As treatment options, some facilities have opted to use this wastewater in on-site boilers, as make-up water in hot ponds or as a spray to control fugitive road dust and particulate emissions from bark and wood fines storage piles (U.S. EPA, 2002).

Review of the OSB Industry in North America - Manitoba Clean Environment Commission (CEC)
34947 - FINAL – June 2009 SENES Consultants Limited 14
The typical capital and operating costs of a commonly used type of WESP are outlined in Table 4-1. Costs are expressed as 2009 Canadian dollars per standard cubic feet per minute (scfm), which have been converted from 2002 U.S. dollars based on an average exchange rate from 2002 ($1.57 based on Canada Revenue Agency data) and a rate of inflation from 2002 to 2009 (14.5% based on Bank of Canada data).
Table 4-1 Example of WESP Capital and Operating Costs
WESP TYPE CAPITAL
COST OPERATING &
MAINTENANCEANNUAL
COST
Wire-Pipe Type $72 to $360 per scfm
$11 to $18 per scfm, annually
$22 to $83 per scfm, annually
costs are expressed as 2009 $CAN scfm = standard cubic feet per minute Source: U.S. EPA, 2003. Air Pollution Control Technology Fact Sheet: Wet ESP - Wire Pipe Type
The unit scfm expresses the volumetric flow rate of gas the control equipment is processing. In OSB applications, control equipment for dryers have an average flow rate of 45,000 scfm and for presses have an average flow rate of 80,000 scfm (based on U.S. EPA background data for AP-42 Section 10.6.1). These flow rates are considered to be higher than average for RTOs in other industries (to provide perspective, a large 20ft x 20ft x 10ft living room is 4,000 ft2, therefore a 45,000 scfm flow rate would change the air in this room over 11 times every minute). The required flow rate is generally based on the size of the manufacturing equipment to be controlled, where a small vacuum is established around the equipment to pull any pollutant emissions from the indoor plant environment (to which the worker would be exposure) to the pollution control equipment. Based on AP-42 background data a typical 80,000 scfm OSB press RTO corresponds to a production rate of approximately 1,500 4 ft by 8 ft sheets of OSB per hour. Although, the background data also indicates that the ratio of RTO sizing to production rate fluctuates significantly.
4.2 REGENERATIVE THERMAL OXIDIZERS
Regenerative thermal oxidizers (RTOs) are an incineration-based control technology effective at removing VOCs, HAPs and combustible particulate matter from dryer and press exhausts. This type of control is suited for dryers and presses having exhaust flow rates between 2,000 and 500,000 scfm and VOC/HAP concentrations less than 1,800 ppm (Moretti, 2002) and are therefore suitable to control OSB dryer and press emissions. RTOs destroy VOCs and HAPs by oxidizing them at very high temperatures. Emissions from RTOs include products of combustion (NOx, CO, PM and CO2). If a dryer is direct-fired, a RTO will also remove the large

Review of the OSB Industry in North America - Manitoba Clean Environment Commission (CEC)
34947 - FINAL – June 2009 SENES Consultants Limited 15
amounts of CO present in the dryer’s exhaust by oxidizing it to CO2. A simplified diagram of a RTO is shown in Figure 4-1.
Figure 4-1 Schematic of a Regenerative Thermal Oxidizer
Source: U.S. EPA, 2000
Exhaust gases from a dryer or press enter the RTO and pass over a hot ceramic bed, which heats the exhaust gases to the required ignition temperature (typically 788oC to 871oC, but can be up to 1100oC) (U.S. EPA, 2003a; U.S. EPA, 2002). Higher temperatures allow for better destruction of the pollutants. If the desired RTO combustion chamber temperature is not attainable using only the inlet pollutants as fuel, auxiliary fuels such as natural gas are burned to achieve the required temperature. The inlet pollutants are combusted and residual heat from this reaction is absorbed by a second ceramic bed. When the first ceramic bed becomes depleted of its heat, the flow in the RTO is reversed so that heat can now be extracted from the second ceramic bed. Heat recovery is typically 95% (U.S. EPA, 2002). Efficient heat recovery makes the thermal oxidation process “regenerative” and as a result allows for less auxiliary fuel usage. A problem often observed in RTOs is the build-up of particulate matter or salts in the ceramic media. Particulates entering the media can be heated above their melting points and will adhere to the ceramic beds, which can restrict air flow and cause pressure drops through the RTO. With dryers and presses a WESP or other particulate control device is commonly installed upstream of the RTO to remove particulate matter and salts from the incoming air stream (Jeff Kudronowicz, personal communication, 28 May 2009; U.S. EPA, 2000). RTO performance tests on dryers and presses conducted by the U.S. EPA (2000) showed that control efficiencies averaged 90% and ranged from 51 to 99.8% for formaldehyde, 78 to 99.7%

Review of the OSB Industry in North America - Manitoba Clean Environment Commission (CEC)
34947 - FINAL – June 2009 SENES Consultants Limited 16
for methanol and 90 to 99.9% for VOCs. The lower end of the ranges for formaldehyde and methanol represent conditions where contaminant inlet concentrations are less than approximately 100 ppm. A technical report by NCASI (1999) also presented an evaluation of RTO efficiencies installed on dryers and presses. The resulting control efficiencies ranged from 64 to greater than 94% for formaldehyde; 50 to greater than 93% for methanol and 80 to greater than 99% for VOCs. RTOs can also reduce particulate emissions, with the U.S. EPA (2000) concluding that RTO PM10 control efficiency was on average 80%. In addition to destroying air pollutants, RTOs can also directly and indirectly generate air pollutants. Since RTO inlet air streams from dryers and presses are often dilute (mostly nitrogen and oxygen in the air), nitrogen is oxidized to NOx within the hot combustion chamber of a RTO. If auxiliary fuel is required, additional NOx will also be formed in the burner. The lower the RTO inlet VOC concentration the more auxiliary fuel is required. It should be noted that VOC emission concentrations from dryers and presses are low; therefore, for OSB manufacturing applications RTOs consume relatively large amounts of auxiliary fuel. Engineered low NOx burners or natural gas injection (NGI) are methods to reduce NOx emissions. NGI is a technique which can be used to increase the hydrocarbon concentration (i.e., the injection of natural gas) in dilute air streams which will help to sustain combustion within the RTO combustion chamber without the use of the burner. As a result little to no auxiliary fuel will be required and less NOx will be formed (U.S. EPA, 2000). When operating a RTO, CO2 and CO are also created in addition to NOx. Again, these compounds are created from the destruction of VOCs and HAPs but they are also formed when auxiliary fuel (typically natural gas) is burned. For example, AP-42 emission factors suggest that approximately 20% more CO2 is generated from using an RTO to control a direct, wood-fired rotary dryer. The primary source of GhG emissions from the OSB industry is through the combustion of residual wood products used to provide heat for drying and pressing operations. RTOs also require substantial amounts of power to operate which will indirectly increase NOx, CO2 and CO as well as SO2 emissions from power generating facilities (Sauer et al., 2002); however, these emissions will vary depending upon the source of the electricity. For example, there would be no CO2 emitted if electricity was purchased solely from a hydroelectric generating station. In theory, an electric RTO could eliminate the use of auxiliary fuel as well as the associated secondary air impacts provided electricity is purchased from a clean energy source. However, electric RTOs cannot effectively sustain the required temperatures to
Review of the OSB Industry in North America - Manitoba Clean Environment Commission (CEC)
34947 - FINAL – June 2009 SENES Consultants Limited 17
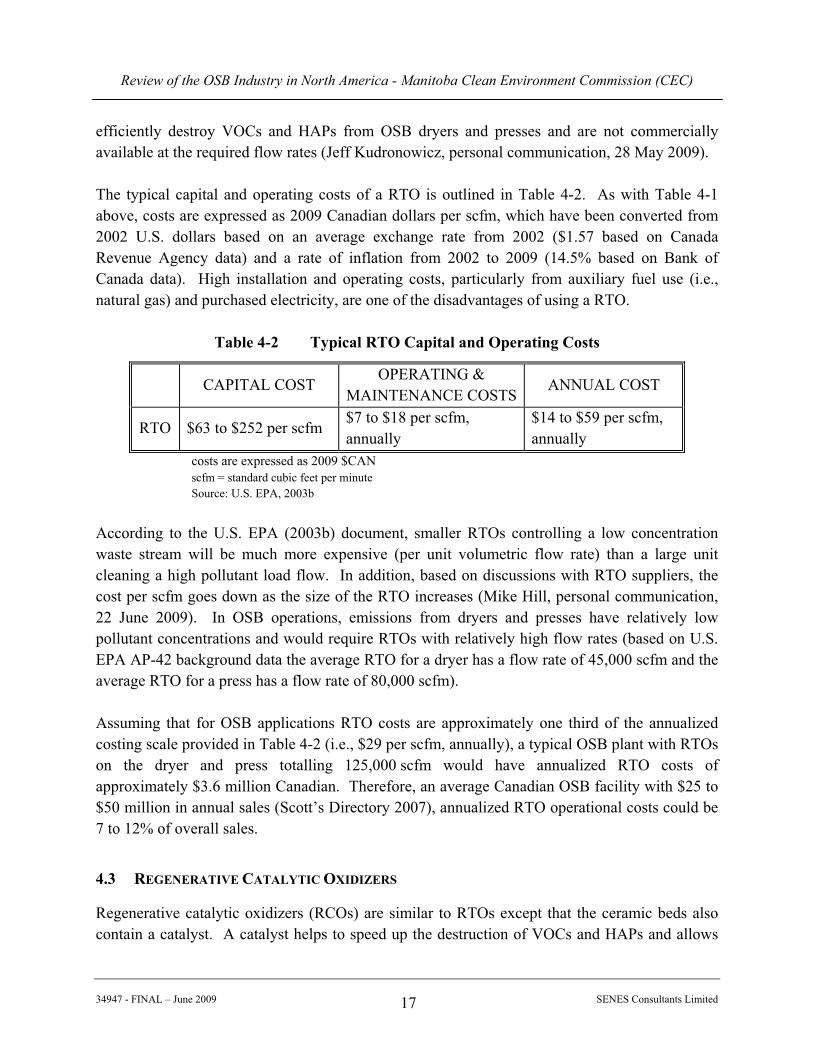
efficiently destroy VOCs and HAPs from OSB dryers and presses and are not commercially available at the required flow rates (Jeff Kudronowicz, personal communication, 28 May 2009). The typical capital and operating costs of a RTO is outlined in Table 4-2. As with Table 4-1 above, costs are expressed as 2009 Canadian dollars per scfm, which have been converted from 2002 U.S. dollars based on an average exchange rate from 2002 ($1.57 based on Canada Revenue Agency data) and a rate of inflation from 2002 to 2009 (14.5% based on Bank of Canada data). High installation and operating costs, particularly from auxiliary fuel use (i.e., natural gas) and purchased electricity, are one of the disadvantages of using a RTO.
Table 4-2 Typical RTO Capital and Operating Costs
CAPITAL COST
OPERATING & MAINTENANCE COSTS
ANNUAL COST
RTO $63 to $252 per scfm $7 to $18 per scfm, annually
$14 to $59 per scfm, annually
costs are expressed as 2009 $CAN scfm = standard cubic feet per minute Source: U.S. EPA, 2003b
According to the U.S. EPA (2003b) document, smaller RTOs controlling a low concentration waste stream will be much more expensive (per unit volumetric flow rate) than a large unit cleaning a high pollutant load flow. In addition, based on discussions with RTO suppliers, the cost per scfm goes down as the size of the RTO increases (Mike Hill, personal communication, 22 June 2009). In OSB operations, emissions from dryers and presses have relatively low pollutant concentrations and would require RTOs with relatively high flow rates (based on U.S. EPA AP-42 background data the average RTO for a dryer has a flow rate of 45,000 scfm and the average RTO for a press has a flow rate of 80,000 scfm). Assuming that for OSB applications RTO costs are approximately one third of the annualized costing scale provided in Table 4-2 (i.e., $29 per scfm, annually), a typical OSB plant with RTOs on the dryer and press totalling 125,000 scfm would have annualized RTO costs of approximately $3.6 million Canadian. Therefore, an average Canadian OSB facility with $25 to $50 million in annual sales (Scott’s Directory 2007), annualized RTO operational costs could be 7 to 12% of overall sales.
4.3 REGENERATIVE CATALYTIC OXIDIZERS
Regenerative catalytic oxidizers (RCOs) are similar to RTOs except that the ceramic beds also contain a catalyst. A catalyst helps to speed up the destruction of VOCs and HAPs and allows

Review of the OSB Industry in North America - Manitoba Clean Environment Commission (CEC)
34947 - FINAL – June 2009 SENES Consultants Limited 18
for a lower reaction temperature (approximately 316oC to 538oC) (U.S. EPA, 2002). This is the main advantage of a RCO, since lower temperatures will require less auxiliary fuel use and thus lower NOx emissions. Typical catalyst materials include precious metals such as platinum or oxidized metallic elements such as manganese dioxide. Catalysts have a finite lifetime in terms of activity. They can also become deactivated by compounds containing heavy metals, sulphur or phosphorous as well as particulate matter or resinous material which may accumulate on the surface of the catalyst (U.S. EPA, 2000). RCOs are effective at controlling VOCs, HAPs and CO. Control efficiencies typically observed in RCOs are at least 90% for VOCs. Control efficiencies for methanol and formaldehyde are also typically 90% provided methanol and formaldehyde inlet concentrations are high enough (U.S. EPA, 2000). As with RTOs, formaldehyde and methanol are not as effectively destroyed at concentrations lower than 100 ppm. Platinum catalysts can also destroy CO, but efficiencies are not known (U.S. EPA, 2003b). Catalyst media are very costly in comparison to ceramic media alone. As such, RCOs have higher maintenance and overall costs in comparison to RTOs; however, RTOs have higher operating costs due to larger amounts of auxiliary fuel usage. Typical costs associated with operating a RCO are outline in Table 4-3. As with Tables 4-1 and 4-2 above, costs are expressed as 2009 Canadian dollars per scfm, which have been converted from 2002 U.S. dollars based on an average exchange rate from 2002 ($1.57 based on Canada Revenue Agency data) and a rate of inflation from 2002 to 2009 (14.5% based on Bank of Canada data).
Table 4-3 Typical RCO Capital and Operating Costs
CAPITAL COST
OPERATING & MAINTENANCE COSTS
ANNUAL COST
RCO $63 to $252 per scfm $11 to $36 per scfm, annually
$20 to $76 per scfm, annually
costs are expressed as 2009 $CAN scfm = standard cubic feet per minute Source: U.S. EPA, 2003b
Following a similar approach to that outlined for RTOs above, the estimated annualized cost to control emissions from the dryer and press with RCOs would be approximately $4.8 million Canadian, and could be greater than 12% of sales for a Canadian facility.

Review of the OSB Industry in North America - Manitoba Clean Environment Commission (CEC)
34947 - FINAL – June 2009 SENES Consultants Limited 19
4.4 BIOFILTRATION
A biofilter is a control technology that uses microorganisms to decompose organic and inorganic pollutants present in the manufacturing equipment exhaust. A biofiltration system consists of a vacuum, a humidification system, and the biofilter. A simple schematic is provided in Figure 4-2.
Figure 4-2 A Simple Biofiltration System
Source: U.S. EPA, 2000
A vacuum system transports the exhaust from the manufacturing equipment through a humidification system where the air becomes cooled and saturated with moisture. Pre-humidification also helps to remove excess particulate matter. The air is then drawn into the plenum (the space below the packing media) to distribute the gases evenly before being forced upward through the moist packing media (i.e., the biofilm). Common packing media used includes bark, wood chips or synthetic materials which are inoculated with microorganisms. This media bed is usually 1 to 2 metres deep. Once in the biofilm, the microorganisms begin to decompose pollutants and convert them to CO2, water and salts. Specific moisture content, temperature, pH, and adequate nutrients are all required to maintain the health and activity of the organisms. Biofiltration systems are most effective at controlling VOCs and HAPs in low concentrations (less than 1,000 ppm) from manufacturing equipment with flow rates less than 100,000 scfm (Moretti, 2002; U.S. EPA, 2000). The outlet temperatures of dryers are often too hot for microorganisms to withstand therefore incoming air must be cooled prior to entering the biofilter (U.S. EPA, 2003c). Additionally, the air stream also contains large amounts of particulate matter so a control mechanism such as a WESP may also have to be installed upstream of a biofilter (Derrick Web, personal communication, 25 May 2009; U.S. EPA 2003c). For these reasons, biofilters are used primarily to control emissions from presses.

Review of the OSB Industry in North America - Manitoba Clean Environment Commission (CEC)
34947 - FINAL – June 2009 SENES Consultants Limited 20
Microorganisms most effectively consume compounds which are water soluble. Therefore, biofilters are effective at removing pollutants such as acrolein, formaldehyde, methanol, and phenol. Less water soluble VOCs like terpenes from softwoods are not as effectively removed. Consequently, the typical control efficiency of a biofilter is 90 to 95% for HAPs and approximately 75% for VOCs (Derrick Web, personal communication, 25 May 2009). In comparison, the U.S. EPA (2000) reported typical control efficiencies of 97 to 98% for formaldehyde, 79 to 98% for methanol and 73 to 90% for VOCs. In a study by NCASI (1999), the efficiency of one biofilter controlling emissions from an OSB press was found to be greater than 95% for formaldehyde, 77% for methanol, and 80% for VOCs. Unlike incineration-based controls, biofilters do not require the use of natural gas to operate, but do require some electricity to operate fans/blowers. As such, no NOx, CO or CO2 is produced from the combustion of natural gas and fewer secondary air pollutants from purchased power are generated when compared to RTOs and RCOs. However, a disadvantage of the biofilter is its large footprint. The larger the flow rate and concentration of the incoming exhaust to be controlled, the larger the biofilter will have to be. For example, a 220,000 scfm biofiltration system installed to control emissions from a press at an OSB facility located in Oklahoma was 150 feet (50 m) long, 75 feet (23 m) wide, and 35 feet (11 m) tall (Bio-Reaction Industries). In addition, a biofiltration system produces approximately 750 to 1500 gallons of wastewater per week which must be disposed of properly by the facility (Boswell, 2002). An 80,000 scfm biofilter would cost approximately $1.6 to $2 million installed, with a 45,000 scfm biofilter costing between $1 and $1.2 million installed (Mike Hill, personal communication, 22 June 2009). However, operating costs are much lower since no natural gas is used and there is less power consumption. Maintenance costs are comparable to RCOs and RTOs. Due to the less frequent use of biofilters to control emissions from dryers and presses, estimating annualized costs was not possible.
4.5 OTHER CONTROL TECHNOLOGIES
In addition to the technologies discussed above, there are several other technologies which may be used to control emissions from dryers and presses, especially for particulate matter emissions. To control particulate matter emissions from OSB equipment, devices such as multi-cyclones, electrified filter beds and wet scrubbers may be used. They may be used alone, or in conjunction with a WESP, a RTO or both (U.S. EPA, 2000).
4.6 POLLUTION PREVENTION
Pollution prevention includes techniques which help to decrease the quantity of pollutants being emitted from manufacturing equipment. The factors which affect emissions as discussed in

Review of the OSB Industry in North America - Manitoba Clean Environment Commission (CEC)
34947 - FINAL – June 2009 SENES Consultants Limited 21
Section 3.2 can be used to determine how emissions may be reduced from the manufacturing process.
Typically the choice of wood species is determined by what is grown in the area surrounding an OSB facility, and changing to a species with fewer emissions (i.e., hardwoods) is generally not feasible. It is also not always feasible to change the type of resin used as a means of controlling VOC and HAP emissions because the type of resin used is determined by the type of products being manufactured.
Pollutant emissions can be reduced through dryer selection. Conveyor dryers operate at lower temperatures and will reduce VOC and HAP emissions compared to rotary dryers. Also, using a single-pass rotary dryer instead of a triple-pass rotary dryer will help to reduce PM and PM10 emissions. As stated in Section 3.2.1, it has been demonstrated that single-pass dryers will produce approximately two to three times less PM emissions than triple-pass dryers due to decreased agitation of the wood strands (O’Connor, 2006). Screening out fines is also important for reducing not only PM emissions, but for reducing the amount of VOCs and HAPs emitted when the fines are burned in the dryer.
Allowing a higher final moisture content in the wood strands exiting the dryer may also reduce the formation of VOCs and HAPs. However, as stated in Section 3.2.1 above, moisture content may not be possible to change since specific moisture requirements may be required for the final products.

Review of the OSB Industry in North America - Manitoba Clean Environment Commission (CEC)
34947 - FINAL – June 2009 SENES Consultants Limited 22
5.0 REGULATORY REVIEW
The following sections provide an overview of the air quality standards, criteria, guidelines and objectives in place in both Canada and the United States for air pollutants relevant to the OSB industry. In general, Canadian provinces regulate air pollutants through ground-level ambient air concentration limits. In contrast, the United States uses a control-based approach to regulate OSB hazardous air pollutant emissions where a level of control is specified. State authorities may also regulate HAP and non-HAP emissions in much the same way that Canadian provinces do. Further detail about how OSB air pollutants are regulated in Canada and the U.S. is provided below.
5.1 CANADA
In Canada, air quality regulations are established primarily at the provincial level, and air quality standards, criteria, guidelines and objectives are most often based on time-averaged ground-level ambient air concentrations. Government agencies typically establish acceptable contaminant concentrations in air based on health, odour, vegetation, soiling, visibility, corrosion or other effects. Most provinces only have levels established for a group of pollutants called Criteria Air Contaminants (CACs) which include pollutants such as NOx, CO, and PM. Ontario and Quebec currently have the most comprehensive lists of ground-level ambient air quality criteria (AAQC) which include most VOCs and HAPs of concern to the OSB industry in addition to the CACs. Alberta also has guidelines in place for most HAPs of concern. The only other provinces with HAP guidelines include British Columbia (formaldehyde) and Manitoba (formaldehyde, phenol, and MDI). National ambient air quality objectives have been or are currently being developed by the Canadian Council of Ministers of the Environment (CCME) for contaminants such as particulate matter and benzene. For instance, the Canada Wide Standard (CWS) for PM2.5 is 30 μg/m3 over a 24 hour averaging period. Each jurisdiction (i.e., province), except Quebec, was required to submit an implementation plan to the CCME outlining the actions taken to achieve the standard for PM2.5 by the 2010 target date. Ontario and Newfoundland also have Point of Impingement (POI) guidelines which are used as limits in the permit approval process for individual manufacturing plants. Both the national and provincial ambient air quality criteria are outlined in detail in Appendix B. All jurisdictions use procedures that are slightly different from each other but have the same common elements – review of pollution effects literature, review of what other juridictions have set as a standard and some assessment of the economic implications of a particular level or standard. Usually a scientific panel is established which looks at all of the data and makes a recommendation to government on the level of standard and its implications to

Review of the OSB Industry in North America - Manitoba Clean Environment Commission (CEC)
34947 - FINAL – June 2009 SENES Consultants Limited 23
public health, the environment and the economy. Government then passes either a law or establishes a regulation under an existing law. In addition to concentration-based criteria, the provinces have their own permitting or approval systems in place. In general, provincial permits will contain ambient air concentration limits and/or stack emission limits, monitoring requirements, and operating and maintenance requirements. In contrast, permits in Saskatchewan limit emissions on the basis of control technology and not stack or ambient concentration limits (IC, 1998). Stack emission limits are often developed on an individual basis and will depend on the type of control technology used, whereas ambient levels are set considering the impact of concentration levels on humans and other sensitive receptors. Ambient pollutant levels resulting from a facilities operations are typically estimated using computer air dispersion models, which mathematically simulate how the atmosphere will disperse (dilute) stack or fugitive pollutant releases. The model predicted pollutant concentrations are then compared to applicable ambient criteria set on the basis of protecting health or the environment. Stack emission limits are connected to ambient levels by meteorology such that a given emission from a stack will produce a specific concentration of that pollutant at the receptor location. If control is accomplished by a stack emission limit, the maximum concentration, under the worst meteorological condition, will be achieved. Alternatively if control is accomplished by setting a concentration at the receptor, the emissions can be variable depending on the weather conditions and the limit can still be met. Using a stack limit has the advantage of fixing the total emission. Appendix C outlines the emission limits imposed upon some OSB facilities in different provinces, and Table 5-1 provides a general outline of each provincial permitting system.
Table 5-1 Characteristics of Provincial Permitting Systems
BC AB SK MB ON QC NB NS NF
Permit Type Permit Approval Permit License Approval Certificat
d’autorisation Approval Approval Approval
Amendment or permit required for process changes?
Y Y Y Y Y Y Y Y Y
Expiry date None None 5 yr None None 5 yr 5 yr 10 yr 5 yr Public comments considered (Y/N)?
Y Y Unknown Y Y N Y N Y
AAQC Considered (Y/N)?
Y Y N Y Y Y Y Y Y

Review of the OSB Industry in North America - Manitoba Clean Environment Commission (CEC)
34947 - FINAL – June 2009 SENES Consultants Limited 24
BC AB SK MB ON QC NB NS NF Stack emission limits imposed (Y/N)?
Y Y N Y Not typically,
but can be Y Y Y Y
Relevant contaminants which are regulated
NOx,
CO, PM,
HCHO, opacity
NOx, CO, PM, opacity
Permits based on control
technology
NOx, CO, PM,
VOCs/ HAPs
NOx , CO, PM,
VOCs/HAPs
NOx, CO, PM,
VOCs/HAPs
NOx, CO PM
NOx, CO PM
NOx, CO PM
Notes: AAQC = Ambient Air Quality Criteria Source: Adapted from NCASI (2008) with additional information obtained from IC (1998).
The province of Ontario has very recently released for stakeholder comments a proposed sector-based approach to managing air pollution in the forest products sector (EBR #010-6589 - posted June 10, 2009). The proposed approach focuses on the contaminant acrolein. Essentially the approach proposes technical standards for facilities if they will not be able to meet a new acrolein POI criterion, which is scheduled to be implemented on February 1st, 2010. For the OSB industry, the proposed technical standards are based on record keeping requirements, good engineering practices and pollution prevention, specifically setting limits on dryer inlet temperatures and exhaust moisture and recirculation requirements. The lower dryer inlet temperatures will reduce all VOC and HAP emissions, and based on the inlet temperatures for current dryer technologies it appears that conveyor type dryers will be required to meet the proposed temperature limits.
5.2 UNITED STATES
In the United States, the EPA must establish National Emissions Standards for Hazardous Air Pollutants (NESHAPs) under the Clean Air Act. The NESHAPs are based on the maximum achievable level of emission control, otherwise known as the Maximum Achievable Control Technology (MACT). The MACT floor is the minimum control level established for the NESHAP. In general, this type of rule imposes emissions standards which are typically met by means of add-on control devices. Additionally, individual states have developed standards which regulate some VOCs and HAPs as well as criteria air pollutants such as particulate matter, NOx and CO. This is achieved by enforcing stack emission limits or permitting systems similar to those in place in Canada. There are currently no federal regulations which impose standards on criteria air pollutants. Both the federal MACT rule and examples of state regulations applicable to the OSB industry are summarized below.

Review of the OSB Industry in North America - Manitoba Clean Environment Commission (CEC)
34947 - FINAL – June 2009 SENES Consultants Limited 25
5.2.1 U.S. EPA MACT Floor
In 2004, the U.S. EPA finalized the national emission standards for hazardous air pollutants (NESHAPs) under the Clean Air Act for the plywood and composite wood products (PCWP) industry which encompasses the OSB industry. The standards apply to any new or existing facility which is estimated to emit 25 tons of total HAPs per year or 10 tons per year of any single HAP. These amounts are for total facility-wide emissions, not just emissions from manufacturing equipment. The final rule defines total HAPs as being the sum of six compounds including acetaldehyde, acrolein, formaldehyde, methanol, phenol and propionaldehyde. Although other organic HAPs from PCWP industry manufacturing equipment have been detected in one or more emission tests, many of these compounds occur infrequently. For example, the U.S. EPA determined that 87% of all benzene test results for uncontrolled process units were below the test method detection limit (MDL). It was also estimated that benzene only accounts for 0.2% of total HAP emissions from all PCWP facilities. The compounds included in the definition of total HAPs make up about 96% of total HAPs emitted from PCWP facilities (U.S. EPA 2004a). Under the Clean Air Act, MACT floor standards are based on the level of emission reduction achieved by the best-performing 12% of existing sources in the PCWP industry. To determine the level of achievable emission reduction, control technology performance data was reviewed which focused on total hydrocarbons (THCs), methanol, and formaldehyde reduction because these pollutants are the most prevalent and most frequently tested (Hanks et al., 2003). THC is not a HAP, but in general, control technologies effective at reducing THCs are effective at reducing HAPs. From their review, the U.S. EPA concluded that control levels achieved by incineration-based controls (RTOs and RCOs) and biofilters should be the basis for the MACT standards. It should be noted that the U.S. EPA does not require the installation of these control technologies, but rather will require control levels comparable to those achieved by such technologies (Hanks et al., 2003). The detailed compliance options set out by the final MACT Rule are presented in Appendix D. Each facility must choose one of the three compliance options for each piece of manufacturing equipment regulated under the final MACT Rule and must also follow the operating requirements specified under each compliance option. For OSB facilities, equipment which must comply with the MACT Rule includes rotary strand dryers, conveyor strand dryers, presses and board coolers. If a facility chooses to follow the Production-Based Compliance Option (PBCO), they must demonstrate (without the use of any add-on control technology) that emissions from OSB process units do not exceed the HAP emission limits outlined in Appendix D.

Review of the OSB Industry in North America - Manitoba Clean Environment Commission (CEC)
34947 - FINAL – June 2009 SENES Consultants Limited 26
By selecting the Add-on Control Technology Option (ACTO), a facility must then comply with one of the six additional control options for each piece of manufacturing equipment, unless for example, dryers and presses are exhausted through the same stack. The control options are:
� Reduce methanol by 90% or achieve emissions less than 1 ppm; � Reduce formaldehyde by 90% or achieve emissions less than 1 ppm; or � Reduce THC (i.e., VOC) by 90% or achieve emissions less than 20 ppm.
As mentioned previously, add-on control systems which are effectively able to control THC will be capable of effectively controlling HAP emissions. The Emissions Averaging Control Option (EACO) is only available to existing facilities. This third option allows a facility to control process units not required under the final MACT Rule and in doing so, can acquire a pollution credit. Debits are acquired by not controlling required equipment. Credits must equal or exceed debits. Other specifications of this and the preceding compliance options are outlined in the final MACT Rule available at http://www.epa.gov/ttn/atw/plypart/plywoodpg.html. The expected environmental and energy impacts resulting from all plywood and composite wood products facilities complying with the MACT Rule are presented in the Background Information Document for the Proposed PCWP NESHAP (U.S. EPA, 2000). In completing this analysis, it was assumed that all facilities would choose to install a RTO or a WESP combined with a RTO as their method of compliance. The analysis represents a worst-case scenario because RTOs result in greater energy use and greater environmental impacts than either a RCO or a biofilter would. Tables 5-2 and 5-3 outline the expected U.S. nationwide changes in HAP, criteria air pollutants, and energy use from the installation of RTOs and WESPs at all OSB facilities. Total HAPs and THCs are reduced as they are effectively destroyed by the RTO. Primary changes in criteria air pollutants from the operation of RTOs include an increase in NOx, a decrease in CO, and a decrease in PM10. Secondary air impacts are a result of the increased amount of energy required to operate RTOs (Table 5-2). An increase in NOx, CO, PM10 and sulphur dioxide (SO2) will result. Although not specified in this analysis, the increase in energy requirements will result in an increase in the amount of carbon dioxide (CO2) generated by using a RTO. This was discussed previously in Section 4.2.

Review of the OSB Industry in North America - Manitoba Clean Environment Commission (CEC)
34947 - FINAL – June 2009 SENES Consultants Limited 27
Table 5-2 Estimated U.S. Nationwide Change in HAP, THC and Criteria Air Pollutants from OSB Compliance with MACT Standards
TOTAL HAP REDUCTION
THC REDUCTION
CRITERIA AIR POLLUTANTS
(tonnes/year)
SECONDARY AIR IMPACTS (tonnes/year)
% % NOx CO PM10 NOx CO PM10 SO2 OSB 79 67 +798 -3979 -2009 +415 +14 +21 +829
Source: Adapted from the U.S. EPA Background Information Document for the PCWP NESHAP (2000).
Table 5-3 Estimated U.S. Nationwide Energy Impacts from OSB Compliance with MACT Standards
RTO NG CONSUMPTION
RTO ELECTRICITY CONSUMPTION
WESP ELECTRICITY CONSUMPTION
(Billion BTU/yr) (GWh/yr) (GWh/yr) OSB 269 129 19
Source: Adapted from the U.S. EPA Background Information Document for the PCWP NESHAP (2000). BTU = British Thermal Units GWh = Gigawatt Hours
Although some environmental and energy impacts were analyzed by the U.S. EPA, they did not have to be considered when developing the MACT floor. For example, the additional greenhouse gases (i.e., CO2) produced from the operation of RTOs did not have to be considered when examining HAP control levels achievable by the plywood and composite wood products industry. Under the United States Clean Air Act, only the control of HAP is relevant to the MACT floor. Although this was met with some opposition, the Clean Air Act eliminates any consideration of the life-cycle impacts of control technologies such as the emission of greenhouse gases. However, as discussed with Beth Palma of the U.S. EPA, consideration of life-cycle impacts such as increased greenhouse gases will likely be considered in the near future upon review of the MACT control standards. A review is required 8 years following a rule’s inception (i.e., 2012).
5.2.2 State Regulations
Prior to the federal MACT Rule, some states had already developed standards which regulated air pollutants common to the OSB industry. Moreover, air pollutants not regulated by the MACT Rule such as NOx and particulate matter are only regulated at the state or local levels. Individual states impose stack emission limits or use permitting systems similar to those in place in Canada. For example, a state permit for an OSB facility in Maine limits MDI emissions to 0.01 grams per second from a press stack. Additional stack limits imposed upon the Maine OSB facility and two other state facilities are provided in Appendix C.

Review of the OSB Industry in North America - Manitoba Clean Environment Commission (CEC)
34947 - FINAL – June 2009 SENES Consultants Limited 28
5.3 COMPARING GENERAL CANADIAN AND UNITED STATES APPROACHES
As stated above, in general Canadian provinces regulate air pollutants through ground-level ambient air concentration limits. In contrast, the United States uses a control-based approach to regulate air pollutant emissions where a level of control is specified based on available control technologies. The Canadian approach is more flexible and looks at each facility individually. A facility emitting pollutants from the middle of a large property will have lower property line concentrations than the same facility with a smaller property, which is a result of more time for pollutants to travel and disperse prior to reaching the facility property line where criteria limits are typically applied. This approach can lead to a greater mass of pollutants released to the local atmosphere, but also is more science based and considers the specific environmental impacts at each site. The Canadian approach is also more labour intensive, where air quality impact assessments are prepared for each site and reviewed by Ministries of Environment. The United States approach is less flexible and takes more of a ‘one size fits all’ approach. In general, more pollutant control equipment will be used; however, this equipment also consumes energy, which can result in greater GhG emissions through natural gas combustion at the site and/or through the generation of electricity.
5.4 CURRENT CONTROL PRACTICES AT OSB FACILITIES
5.4.1 Canada
Through discussions with government and industry representatives in Canada, it was determined that most OSB facilities control PM emissions from dryers using either WESPs or wet scrubbers. Only one facility in Canada controls VOCs and HAPs by using three RTOs to control emissions from dryers and presses. Finally, there are two facilities which use a conveyor dryer instead of a rotary dryer, which will help to minimize dryer VOC and PM emissions; however one of these facilities is currently inactive (Gilles Brunette, personal communication, 2 June 2009).
5.4.2 United States
Prior to the U.S. EPA enforcing the MACT Rule in 2004 several facilities in the U.S. already had control devices installed on manufacturing equipment as a means of complying with state or local requirements (Beth Palma, personal communication, 9 June 2009). As of the year 2000, the U.S. EPA reported that there were a total of 125 dryers used in the OSB industry and all were

Review of the OSB Industry in North America - Manitoba Clean Environment Commission (CEC)
34947 - FINAL – June 2009 SENES Consultants Limited 29
controlled in some way. 60% of the dryers used RTOs to control VOC and HAP emissions and 68% of these RTOs also had a WESP installed upstream. 64% of the dryers used WESPs either alone or in combination with other control technologies to control particulate matter emissions. Out of 39 OSB presses, 20 used add-on control technologies. Of these 20 presses, 75% used a RTO. There were two presses which used a biofilter to control emissions. It was predicted by the U.S. EPA (2000) that 23 OSB facilities would be impacted by the new MACT standards. An official survey has yet to be completed by the U.S. EPA to determine what compliance options facilities have chosen as a means to comply with the MACT Rule. It is thought that most plywood and composite wood products facilities have chosen to install RTOs, but that several facilities in the northwest have opted to install biofilters. It is suspected that biofilters are more popular in the northwest for two reasons: 1) there may have been state and local opposition to installing RTOs in the northwest because they emit large amounts of greenhouse gases and 2) it may be easier to cool hot exhaust emissions from manufacturing equipment since ambient air temperatures are lower in the northwest and would allow biofilters to better tolerate dryer and press exhaust temperatures. Further information is expected to be recovered by the U.S. EPA in the near future. (Beth Palma, personal communication, 26 May 2009).

Review of the OSB Industry in North America - Manitoba Clean Environment Commission (CEC)
34947 - FINAL – June 2009 SENES Consultants Limited 30
6.0 CONCLUSIONS
There are three (3) primary sources of pollutant emissions to the atmosphere from the OSB manufacturing process: (1) combustion emissions (i.e., combustion of wood, natural gas or other fuel oil); (2) emissions driven off by drying the wood, releasing to atmosphere naturally occurring materials in the wood; and, (3) emissions associated with the resins used to bind the wood strands together. Pollutant emissions can be managed using add-on control technologies, with the type of control technology used depending on the type of pollutant as well as the type of equipment used in the OSB manufacturing process. The most common control technologies used in the North American OSB industry include wet electrostatic precipitators (WESPs) to control particulate emissions and regenerative thermal oxidizers (RTOs), regenerative catalytic oxidizers (RCOs) or biofilters to control volatile organic compound (VOC) and hazardous air pollutant (HAP) emissions.
RTOs and RCOs are incineration type control technologies, typically generating heat through the combustion of natural gas, which results in the generation of greenhouse gases (GhGs). However, according to published emission factors, the primary source of GhG emissions from the OSB industry is through the combustion of residual wood wastes used to provide heat for drying and pressing operations.
The costs to operate emissions control equipment can be a large portion (10%) of the overall OSB manufacturing cost. Currently (2009), the OSB industry is experiencing the effects of the economic slow down, with government and industry contacts indicating many plants are closing due to a decrease in the North American demand for product.
In general, Canadian provinces regulate air pollutants emitted from the OSB manufacturing process through ground-level ambient air concentration limits. In contrast, the United States uses a control-based approach to regulate OSB HAP emissions where a level of control is specified. State authorities may also regulate HAP and non-HAP emissions in much the same way that Canadian provinces do.

Review of the OSB Industry in North America - Manitoba Clean Environment Commission (CEC)
34947 - FINAL – June 2009 SENES Consultants Limited 31
7.0 REFERENCES
Bio-Reaction Industries, Date Unknown. Bio-oxidation Press Emissions Control for the J.M. Huber OSB Mill Broken Bow, Oklahoma. Available online: < http://www.bioreaction.com/userfiles/files/papers/PanelWorld.pdf> [28 May 2009]
Boswell, J., 2002. Understanding the Capabilities of Bio-Oxidation. Chemical Engineering
Progress Magazine, 100(12): 48-53. Hanks, K., Nicholson, B., and K. Parrish, 2003. Determination of MACT floors and MACT for
the Final Plywood and Composite Wood Products Industry NESHAP. Memorandum to Mary Tom Kissell, U.S. EPA, December 15.
Industry Canada (IC), 1998. Wood Based Panel Products Technology Roadmap. Canadian
Forest Industries, Research, Technology and Innovation. Available on line at <http://www.ic.gc.ca/eic/site/fi-if.nsf/eng/oc01501.html> [20 May 2009].
Moretti, E.C., 2002. Reduce VOC and HAP Emissions. Chemical Engineering
Progress Magazine, 98(6): 30-40. National Council for Air and Stream Improvement (NCASI), 2008. Wood Products Air Quality
Technical Information Document. Special Report No. 08-01, May. National Council for Air and Stream Improvement (NCASI), 1999. Volatile Organic Compound
Emissions from Wood Products Manufacturing Facilities, Part V – Oriented Strand Board. Technical Bulletin No. 772, January. O’Connor, B., 2006. PM10 and PM2.5 Emissions from Oriented Strand Board Wafer Dryers
Using a Dilution Tunnel Sampler. Forest Products Society 2006 Drying Conference. Available online: <http://www.forestprod.org/drying06oconnor.pdf> [2 June 2009].
Ontario EBR #010-6589 - posted June 10, 2009, Proposed Sector-Based Approach to Managing
Air Pollution in the Forest Products Sector Under O. Regulation 419/05, Chapter 2 of “Sector-Based Technical Standards to Manage Air Pollution”: Proposed Forest Products Sector Technical Standard.
Otwell, L.P., Hittmeier, M.E., Hooda, U., Yan, H., Su, W., and S. Banjeree, 2000. HAPs
Released from Wood Drying. Environmental Science and Technology, 34 (11): 2280–2283.
Sauer, B., Franklin, W., Miner, R., Word, D., and B. Upton, 2002. Environmental Tradeoffs:
Life Cycle Approach to Evaluate the Burdens and Benefits of Emission Control Systems in the Wood Panel Industry. Forest Products Journal, 52(3): 51-58.

Review of the OSB Industry in North America - Manitoba Clean Environment Commission (CEC)
34947 - FINAL – June 2009 SENES Consultants Limited 32
United States Environmental Protection Agency (U.S. EPA), 2004a. NESHAP: Plywood and
Composite Wood Products; Effluent Limitations Guidelines and Standards for the Timber Products Point Source Category; List of Hazardous Air Pollutants, Lesser Quantity Designations, Source Category List; Final Rule. Federal Registrar 40 CFR Parts 63 and 429.
United States Environmental Protection Agency (U.S. EPA), 2004b. National Emission Standards for Hazardous Air Pollutants for Plywood and Composite Wood Products Background Information for Final Standards Summary of Public Comments and Responses. Office of Air Quality, Planning and Standards, NC.
United States Environmental Protection Agency (U.S. EPA), 2003a. Air Pollution Control
Technology Fact Sheet: Wet ESP - Wire Pipe Type. Available online: <http://www.epa.gov/ttn/catc/products.html#aptecfacts> [29 May 2009].
United States Environmental Protection Agency (U.S. EPA), 2003b. Air Pollution Control
Technology Fact Sheet: Regenerative Incinerator. Available online: <http://www.epa.gov/ttn/catc/products.html#aptecfacts> [29 May 2009].
United States Environmental Protection Agency (U.S. EPA), 2003c. Using Bioreactors to
Control Air Pollution. The Clean Air Technology Center, NC. United States Environmental Protection Agency (U.S. EPA), 2000. Background Information
Document for Proposed Plywood and Composite Wood Products NESHAP. Office of Air Quality, Planning and Standards, NC.
United States Environmental Protection Agency (U.S. EPA), 2002. AP-42 Section 10.6.1
Waferboard/Oriented Strandboard Manufacturing. Technology Transfer Network Clearinghouse for Inventories & Emissions Factors.

Review of the OSB Industry in North America - Manitoba Clean Environment Commission (CEC)
34947 - FINAL – June 2009 SENES Consultants Limited 33
8.0 GLOSSARY AND ABBREVIATIONS
Acrolein: is an organic chemical compound which is both unstable and toxic. It is used to manufacture other chemicals such as resins and polyurethane. Acrolein occurs naturally in wood.
Acetaldehyde: is an organic chemical compound with the chemical formula
CH3CHO. It occurs naturally in ripe fruit and other foods, and is produced by plants as a natural part of their metabolism, but it is also produced by combustion processes and by degradation of plastics.
Benzene: is an organic chemical compound which is carcinogenic and has the
chemical formula C6H6. It is commonly used as an intermediate in the manufacture of other chemicals and is also used as a gasoline additive but in very small quantities.
Carbon Monoxide (CO): is a product of incomplete combustion of hydrocarbon based fuels
(gasoline, wood, etc.) and is commonly emitted from vehicle tailpipes. It is a colourless, odourless, tasteless, and poisonous gas which may cause severe illness or even death in people.
CEPA: means Canadian Environmental Protection Act, which is an “Act
respecting pollution prevention and the protection of the environment and human health in order to contribute to sustainable development”.
CCME: means Canadian Council of Ministers of the Environment, which is
comprised of 14 environment ministers from the federal, provincial and territorial governments. The CCME serves as a forum for members to develop national environmental strategies and guidelines for areas such as air, soil, water and climate that each environment ministry across Canada can use.
CO2 equivalent (CO2-e): is a quantity that describes, for a given mixture of greenhouse gases,
the amount of CO2 that would have the same global warming potential (GWP) measured over a specified timeframe.
Criteria air Contaminants (CACs): is a group of air pollutants defined by Environment Canada which
includes sulphur oxides (SO2), nitrogen oxides (NOx), particulate matter (PM), volatile organic compounds (VOCs) and carbon monoxide (CO).
Review of the OSB Industry in North America - Manitoba Clean Environment Commission (CEC)
34947 - FINAL – June 2009 SENES Consultants Limited 34
Formaldehyde (HCHO): is an organic chemical compound with the chemical formula CH2O. It is an intermediate compound in the oxidation of methane (natural gas) as well as other organic compounds. It can be used to disinfect and preserve organic tissues.
Greenhouse Gas (GhG): is an atmospheric gas which effectively traps heat in earth’s lower
atmosphere. GhGs include carbon dioxide (CO2), methane (CH4), nitrous oxide (N2O) and compounds known as hydrofluorocarbons (HFCs) and water vapour.
Hazardous Air Pollutants (HAPs): are toxic pollutants defined by the U.S. Environmental Protection
Agency as being carcinogenic. There are 187 pollutants currently on the list of HAPs.
Hydrocarbons: are organic compounds made entirely of hydrogen and carbon. They
are a primary source of the world’s electricity and heat. For example, natural gas (CH4) is a hydrocarbon which can be combusted to form CO2, water and heat.
MACT: means Maximum Achievable Control Technology MDI: means Methane Diphenyl Diisocyanate (MDI) (CAS 101-68-8) is an
organic chemical compound which is primarily used for the production of polyurethane. It is also used as a resin is the manufacture of oriented strand board.
MDL: means Method Detection Limit. It is the lowest concentration at which
laboratory test methods can detect the presence of a chemical compound.
Methanol: is a toxic organic chemical with the chemical formula CH3OH. It is
the simplest alcohol and can be used as an antifreeze, a solvent or a fuel. Methanol can be naturally produced by bacteria but is destroyed in the atmosphere by sunlight.
NESHAP: means National Emissions Standards for Hazardous Air Pollutants.
These are standards set by the U.S. Environmental Protection Agency. Nitrogen Oxides (NOx): includes the gases nitrogen oxide (NO) and nitrogen dioxide (NO2). It
is formed from the combustion of fuel in a nitrogen rich atmosphere (note that ambient air is a nitrogen rich atmosphere). NO released from the combustion process quickly oxidizes to form NO2 in the atmosphere.

Review of the OSB Industry in North America - Manitoba Clean Environment Commission (CEC)
34947 - FINAL – June 2009 SENES Consultants Limited 35
Lb/ODT: means pounds per oven dried ton of wood material. This is an
emission factor unit for OSB facilities. PCWP: means Plywood and Composite Wood Products Industry. PF: is Phenol-Formaldehyde resin used in the manufacture of oriented
strand board. Phenol: is a toxic, organic compound with the chemical formula C6H5OH. It
can be produced naturally from the decomposition of organic matter. It may also be manufactured and is often used in synthetic resins.
Propionaldehyde: is an organic compound with the chemical formula CH3CH2CHO. It
may be used as an intermediate in the production of alkyd resins. Particulate Matter (PM): is airborne particulate in solid or liquid form. PM is subcategorized
into three main size fractions: total particulate matter (TPM), PM less than 10 microns in diameter (PM10) and PM less than 2.5 microns in diameter (PM2.5). PM can restrict visibility or at the smaller size fractions can have health impacts. PM10 is also known as inhalable particulate because it can settle in the bronchi of the lungs and PM2.5 is often referred to as respirable particulate because it can penetrate into the gas exchange regions of the lungs. Consequently, PM10 and PM2.5 can contribute to respiratory and cardiac illness such as asthma, bronchitis, emphysema and various heart diseases.
POI: means Point of impingement. A POI is any point on the ground or on
a receptor, such as a nearby building, located outside a facility's property boundaries at which the highest concentration of a contaminant caused by the emission of that contaminant from the facility is expected to occur.
PPM: means parts per million. A dimensionless unit used for measuring
small concentrations. It denotes 1 part in 1,000,000 parts. SCFM: means standard cubic feet per minute. A unit used to describe
volumetric flow rates corrected to a standardized set of atmospheric conditions which includes temperature, pressure, and relative humidity.
SIC: means Standard Industrial Classification, which is a system used to
classify companies and enterprises in Canada and the United States according to the activity(ies) in which they are engaged using a four-digit code.

Review of the OSB Industry in North America - Manitoba Clean Environment Commission (CEC)
34947 - FINAL – June 2009 SENES Consultants Limited 36
Sulphur dioxide (SO2): is a gas formed from sulphur contained in coal, oil and metal ores
during a combustion or a refining processes. THC: means Total hydrocarbons, which is the combined mass of measured
hydrocarbons. Volatile Organic Compounds (VOCs): are carbon containing gases and vapours (e.g. gasoline fumes) but
excluding carbon dioxide, carbon monoxide, methane and chlorofluorocarbons. VOCs are precursors to the formation of ground-level ozone and smog, as well as PM2.5 (Environment Canada definition).

Review of the OSB Industry in North America - Manitoba Clean Environment Commission (CEC)
34947 - FINAL – June 2009 SENES Consultants Limited
APPENDIX A
OSB INDUSTRY 2007 NPRI DATA

Review of the OSB Industry in North America - Manitoba Clean Environment Commission (CEC)
34947 - FINAL – June 2009 SENES Consultants Limited
Total OSB Industry Emissions Compared to Total Canadian Emissions
CAS Number Chemical Name OSB Industry
Emissions Total (tonnes)
All Industry Emissions
Total (tonnes)
% of Industry
Total 107-02-8 Acrolein 94 133 71% 101-68-8 Methylenebis(phenylisocyanate) (MDI) 7.3 17 43% 50-00-0 Formaldehyde 649 1,766 37% 75-07-0 Acetaldehyde 247 1,201 21% 67-56-1 Methanol 1101 15,150 7% 71-43-2 Benzene 35 719 5% NA - 09 Manganese (and its compounds) 4.8 154 3%
9016-87-9 Polymeric diphenylmethane diisocyanate 0.20 7.2 3% NA - M10 PM2.5 - Particulate Matter <= 2.5 Microns 1522 60,673 3% NA - M09 PM10 - Particulate Matter <= 10 Microns 2410 114,217 2% NA - M08 PM - Total Particulate Matter 3643 204,400 2% NA - M16 Volatile Organic Compounds (VOCs) 4067 264,705 2% 108-95-2 Phenol (and its salts) 9.0 878 1% 630-08-0 Carbon monoxide 8419 999,918 1%
11104-93-1 Oxides of nitrogen (expressed as NO2) 1491 830,996 0.2% NA - 03 Cadmium (and its compounds) 4.8 27,143 0.02%
NA - D/F Dioxins and furans - total 0.004 40 0.01% NA - 08 Lead (and its compounds) 12 255,697 0% NA - 02 Arsenic (and its compounds) 0 85,976 0% 118-74-1 Hexachlorobenzene 0 10,542 0% NA - 22 Phosphorus (total) 0 173 0%

Review of the OSB Industry in North America - Manitoba Clean Environment Commission (CEC)
34947 - FINAL – June 2009 SENES Consultants Limited
Total Provincial OSB Emissions Compared to Total Canadian Emissions
Province CAS Number Chemical Name
OSB Industry Emissions
Total (tonnes)
All Industry Emissions Total
(tonnes)
Provincial OSB % of
Total BC 101-68-8 Methylenebis(phenylisocyanate) (MDI) 6 17 36% AB 101-68-8 Methylenebis(phenylisocyanate) (MDI) 1 17 6% ON 101-68-8 Methylenebis(phenylisocyanate) (MDI) 0.2 17 1% QC 101-68-8 Methylenebis(phenylisocyanate) (MDI) 0.04 17 0.21% MB 101-68-8 Methylenebis(phenylisocyanate) (MDI) 0.006 17 0.04% ON 107-02-8 Acrolein 60 133 45% AB 107-02-8 Acrolein 34 133 26% AB 108-95-2 Phenol (and its salts) 7.7 879 0.88% ON 108-95-2 Phenol (and its salts) 1.3 879 0.15%
AB 11104-93-1 Oxides of nitrogen (expressed as NO2) 381 830,996 0.05%
QC 11104-93-1 Oxides of nitrogen (expressed as NO2) 338 830,996 0.04%
BC 11104-93-1 Oxides of nitrogen (expressed as NO2) 241 830,996 0.03%
ON 11104-93-1 Oxides of nitrogen (expressed as NO2) 223 830,996 0.03%
SK 11104-93-1 Oxides of nitrogen (expressed as NO2) 157 830,996 0.02%
MB 11104-93-1 Oxides of nitrogen (expressed as NO2) 151 830,996 0.02%
AB 118-74-1 Hexachlorobenzene 0 10,543 0% BC 118-74-1 Hexachlorobenzene 0 10,543 0% ON 118-74-1 Hexachlorobenzene 0 10,543 0% SK 118-74-1 Hexachlorobenzene 0 10,543 0% AB 50-00-0 Formaldehyde 275 1,766 16% QC 50-00-0 Formaldehyde 150 1,766 8% ON 50-00-0 Formaldehyde 108 1,766 6% BC 50-00-0 Formaldehyde 64 1,766 4% SK 50-00-0 Formaldehyde 47 1,766 3% NB 50-00-0 Formaldehyde 6.2 1,766 0.4% AB 630-08-0 Carbon monoxide 3140 999,918 0.31% ON 630-08-0 Carbon monoxide 2098 999,918 0.21% BC 630-08-0 Carbon monoxide 1378 999,918 0.14% QC 630-08-0 Carbon monoxide 1243 999,918 0.12% SK 630-08-0 Carbon monoxide 304 999,918 0.03% MB 630-08-0 Carbon monoxide 187 999,918 0.02% NB 630-08-0 Carbon monoxide 69 999,918 0.01% QC 67-56-1 Methanol 359 15,150 2% AB 67-56-1 Methanol 343 15,150 2% BC 67-56-1 Methanol 175 15,150 1% SK 67-56-1 Methanol 128 15,150 0.84% ON 67-56-1 Methanol 73 15,150 0.48%

Review of the OSB Industry in North America - Manitoba Clean Environment Commission (CEC)
34947 - FINAL – June 2009 SENES Consultants Limited
MB 67-56-1 Methanol 20 15,150 0.13% NB 67-56-1 Methanol 3.9 15,150 0.03% AB 71-43-2 Benzene 35 719 5% AB 75-07-0 Acetaldehyde 162 1,201 14% BC 75-07-0 Acetaldehyde 28 1,201 2% ON 75-07-0 Acetaldehyde 28 1,201 2% QC 75-07-0 Acetaldehyde 25 1,201 2% NB 75-07-0 Acetaldehyde 3.7 1,201 0.31%
AB 9016-87-9
Polymeric diphenylmethane diisocyanate 0.2 7.1 3%
SK NA - 02 Arsenic (and its compounds) 0 85,976 0% QC NA - 03 Cadmium (and its compounds) 2.3 27,143 0.01% AB NA - 03 Cadmium (and its compounds) 1 27,143 0.004% ON NA - 03 Cadmium (and its compounds) 1 27,143 0.004% SK NA - 03 Cadmium (and its compounds) 0.24 27,143 0.001% MB NA - 03 Cadmium (and its compounds) 0.18 27,143 0.001% BC NA - 03 Cadmium (and its compounds) 0.012 27,143 0% ON NA - 08 Lead (and its compounds) 8 255,697 0.003% AB NA - 08 Lead (and its compounds) 4 255,697 0.002% SK NA - 08 Lead (and its compounds) 0 255,697 0% ON NA - 09 Manganese (and its compounds) 4.8 154 3.10% MB NA - 22 Phosphorus (total) 0 173 0% QC NA - 22 Phosphorus (total) 0 173 0% ON NA - D/F Dioxins and furans - total 0.004 40 0.01% AB NA - D/F Dioxins and furans - total 0 40 0%
ON NA - M08 PM - Total Particulate Matter 1172 204,400 0.57%
AB NA - M08 PM - Total Particulate Matter 1106 204,400 0.54%
QC NA - M08 PM - Total Particulate Matter 710 204,400 0.35%
BC NA - M08 PM - Total Particulate Matter 405 204,400 0.20%
SK NA - M08 PM - Total Particulate Matter 225 204,400 0.11%
MB NA - M08 PM - Total Particulate Matter 25 204,400 0.01%
ON NA - M09
PM10 - Particulate Matter <= 10 Microns 1001 114,217 0.88%
AB NA - M09
PM10 - Particulate Matter <= 10 Microns 783 114,217 0.69%
QC NA - M09
PM10 - Particulate Matter <= 10 Microns 339 114,217 0.30%
SK NA - M09
PM10 - Particulate Matter <= 10 Microns 160 114,217 0.14%
BC NA - M09
PM10 - Particulate Matter <= 10 Microns 99 114,217 0.09%
MB NA - M09
PM10 - Particulate Matter <= 10 Microns 18 114,217 0.02%
NB NA - PM10 - Particulate Matter <= 10 11 114,217 0.01%
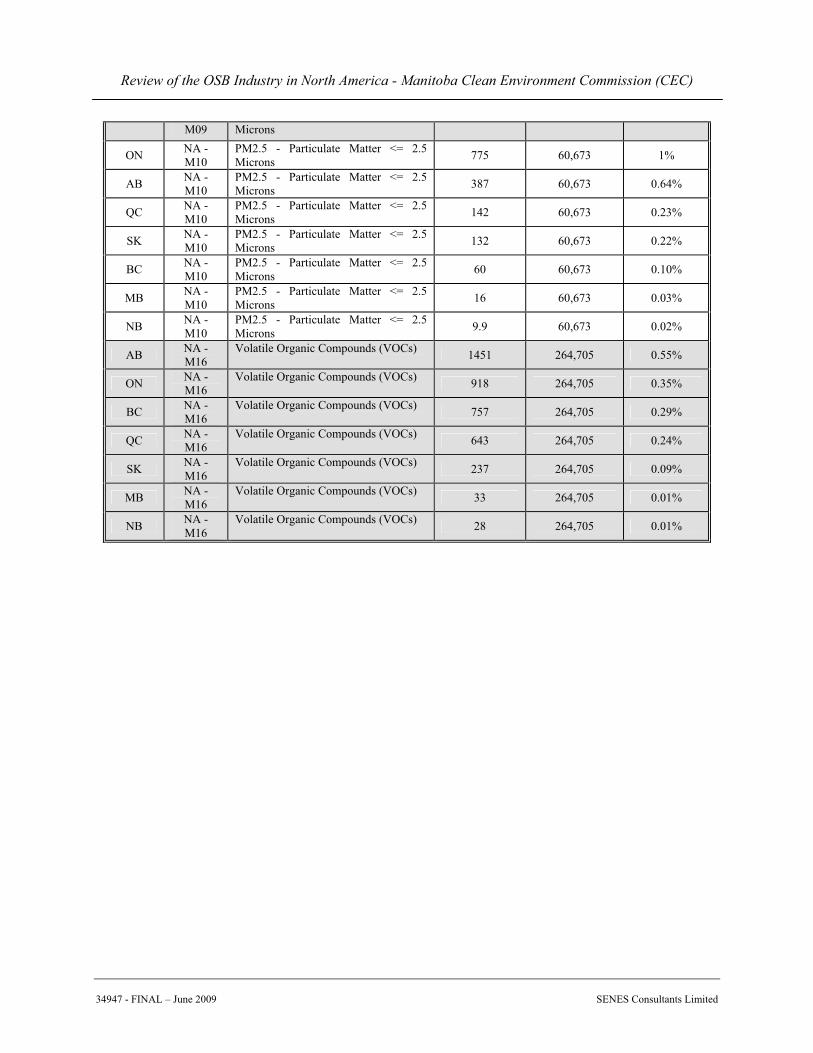
Review of the OSB Industry in North America - Manitoba Clean Environment Commission (CEC)
34947 - FINAL – June 2009 SENES Consultants Limited
M09 Microns
ON NA - M10
PM2.5 - Particulate Matter <= 2.5 Microns 775 60,673 1%
AB NA - M10
PM2.5 - Particulate Matter <= 2.5 Microns 387 60,673 0.64%
QC NA - M10
PM2.5 - Particulate Matter <= 2.5 Microns 142 60,673 0.23%
SK NA - M10
PM2.5 - Particulate Matter <= 2.5 Microns 132 60,673 0.22%
BC NA - M10
PM2.5 - Particulate Matter <= 2.5 Microns 60 60,673 0.10%
MB NA - M10
PM2.5 - Particulate Matter <= 2.5 Microns 16 60,673 0.03%
NB NA - M10
PM2.5 - Particulate Matter <= 2.5 Microns 9.9 60,673 0.02%
AB NA - M16
Volatile Organic Compounds (VOCs) 1451 264,705 0.55%
ON NA - M16
Volatile Organic Compounds (VOCs) 918 264,705 0.35%
BC NA - M16
Volatile Organic Compounds (VOCs) 757 264,705 0.29%
QC NA - M16
Volatile Organic Compounds (VOCs) 643 264,705 0.24%
SK NA - M16
Volatile Organic Compounds (VOCs) 237 264,705 0.09%
MB NA - M16
Volatile Organic Compounds (VOCs) 33 264,705 0.01%
NB NA - M16
Volatile Organic Compounds (VOCs) 28 264,705 0.01%

Review of the OSB Industry in North America - Manitoba Clean Environment Commission (CEC)
34947 - FINAL – June 2009 SENES Consultants Limited
APPENDIX B
AMBIENT AIR CRITERIA IN CANADA

Revi
ew o
f the
OSB
Indu
stry
in N
orth
Am
eric
a - M
anito
ba C
lean
Env
iron
men
t Com
mis
sion
(CEC
) 34
947
- FIN
AL
– Ju
ne 2
009
SEN
ES C
onsu
ltant
s Lim
ited
Am
bien
t Air
Qua
lity
Cri
teri
a fo
r C
onta
min
ants
Rel
evan
t to
the
OSB
Indu
stry
Pollu
tant
A
vera
ging
Pe
riod
(hr)
B
C1
AB
SK
M
B
ON
Q
C
NB
N
S N
F C
CM
E
Vol
atile
Org
anic
Com
poun
ds
Ace
tald
ehyd
e*
1 --
50
--
--
--
--
--
--
--
--
24
--
--
--
--
500
--
--
--
--
--
Acr
olei
n*
24
--
--
--
--
0.08
--
--
--
--
--
B
enze
ne*
1 --
30
--
--
--
--
--
--
--
--
Fo
rmal
dehy
de*
1 D
:60,
E: 3
70
65
--
60
--
28
--
--
--
--
24
--
--
--
--
65
--
--
--
--
--
M
etha
nol*
1
--
2600
--
--
--
28
000
--
--
--
--
24
--
--
--
--
40
00
--
--
--
--
--
MD
I*
1 --
0.
51
--
3 --
--
--
--
--
--
24
--
--
--
--
0.7
--
--
--
--
--
A
nnua
l --
--
--
--
--
0.
6
Ph
enol
* 1
--
100
--
--
--
--
--
--
--
--
24
--
--
--
--
30
--
--
--
--
--
Pr
opio
nald
ehyd
e*
10 m
in
--
--
--
--
10
--
--
--
--
--
Cri
teri
a A
ir C
onta
min
ants
NO
x 1
400-
1000
40
0 40
0 40
0 40
0 41
4 40
0 40
0 40
0 40
0-10
00
24
20
0-30
0 20
0 --
20
0 20
0 20
7 20
0
200
200-
300
CO
1
A: 1
4300
, B:
2800
0, C
: 350
00
1500
0 15
000
3500
0 36
200
34
3500
0 34
600
3500
0 15
-35
TPM
24
12
0-40
0 10
0 12
0 12
0 12
0 15
0 12
0 12
0 12
0 12
0-40
0PM
10
24
50
--
50
50
--
--
50
25
PM2.
5 24
30
--
30
30
30
--
--
25
30
All
conc
entra
tions
are
in u
nits
of μ
g/m
3 *H
azar
dous
Air
Pollu
tant
1 A
: Lev
el A
; B: L
evel
B; C
: Lev
el C
; D: A
ctio
n Le
vel;
E: E
piso
de L
evel

Review of the OSB Industry in North America - Manitoba Clean Environment Commission (CEC)
34947 - FNAL – June 2009 SENES Consultants Limited
APPENDIX C
EXAMPLES OF STACK EMISSION LIMITS IN CANADA AND THE U.S.

Revi
ew o
f the
OSB
Indu
stry
in N
orth
Am
eric
a - M
anito
ba C
lean
Env
iron
men
t Com
mis
sion
(CEC
) 34
947
- FIN
AL
– Ju
ne 2
009
SEN
ES C
onsu
ltant
s Lim
ited
Exa
mpl
e St
ack
Em
issi
on L
imits
from
Var
ious
Pro
vinc
es in
Can
ada
NB
M
B
AB
B
C
Wood
waste
Stack
Press
Vents
PQ
ON
Dryer
RTO
Press
RTO
Thermal
Oil ESP
Dryer
Cyclone
EFB
Press
Exhaust
Stack
Thermal
Oil
Stack
MDF
Emission
Guidelines
Parti
cula
te
200
mg/
m3
--
50 m
g/m
3 90
mg/
m3
5.14
g/s
2.
1 g/
s 2.
18 g
/s
0.10
g/k
g --
1.
1 g/
kg
120
mg/
m3
Form
alde
hyde
20
mg/
m3
20 m
g/m
3 --
--
0.
085
g/s
0.08
g/s
--
10
0 m
g/m
3 40
mg/
m3
--
300
g/t
prod
uct
CO
10
0 m
g/m
3 --
--
10
0 pp
m
--
--
--
--
--
--
--
NO
x 20
mg/
m3
--
--
--
6.5
g/s
0.9
g/s
5.3
g/s
--
--
--
--
SO2
100
mg/
m3
--
--
--
--
--
--
--
--
--
--
THC
--
--
--
10
0 pp
m
--
--
--
--
--
--
--
NM
HC
--
75
mg/
m3
--
--
--
--
--
--
--
--
--
Phen
ol
--
--
--
--
0.05
g/s
0.
7 g/
s --
--
--
--
--
V
OC
--
--
--
--
1.
1 g/
s 0.
28 g
/s
--
--
--
--
--
Ben
zene
--
--
--
--
0.
008
g/s
0.00
03
g/s
0.00
66 g
/s
25 m
g/m
3 --
--
--
MD
I --
--
--
--
--
0.
0141
g/
s 2.
18 g
/s
--
--
--
--
Notes:
NB
: A
n O
SB C
ertif
icat
e of
App
rova
l PQ
: Q
ualit
y of
the
Atm
osph
ere
Reg
ulat
ion
ON
: O
SB C
ertif
icat
e of
App
rova
l M
B:
An
OSB
Lic
ense
A
B:
An
OSB
App
rova
l B
C:
Prov
inci
al M
DF
Gui
delin
e
Sour
ce: I
C, 1
998

Review of the OSB Industry in North America - Manitoba Clean Environment Commission (CEC)
34947 - FINAL – June 2009 SENES Consultants Limited
Examples of Stack Emission Limits from 3 U.S. States
Texas Maine Contaminants (g/s) Press RTO Heat Energy
System Press RTO Dryer RTO and WESP
Heat Energy System
Washington
Particulate 0.14 0.72 1.55 1.97 0.93 0.23 g/m3 Formaldehyde 0.07 0.06 0.04 0.54 CO 0.94 3.45 1.04 12.57 NOx 0.05 6.48 2.57 3.34 0.25 SO2 0.001 0.50 0.06 0.09/2.6 0.06 1000 ppm THC NMHC Phenol 0.004 0.02 0.03 VOC 0.95 2.31 0.22 0.71 0.62 Benzene MDI 0.01
Notes: Texas: OSB Permit Main: OSB Permit Washington: 173-400 General Regulations for Air Pollution Sources
Source: IC, 1998

Review of the OSB Industry in North America - Manitoba Clean Environment Commission (CEC)
34947 - FINAL – June 2009 SENES Consultants Limited
APPENDIX D
U.S. EPA MACT STANDARDS

Review of the OSB Industry in North America - Manitoba Clean Environment Commission (CEC)
34947 - FINAL – June 2009 SENES Consultants Limited
NESHAPs as Required by the U.S. EPA MACT Floor
COMPLIANCE OPTION DESCRIPTION Production-Based Compliance Option (PBCO)
Process units have emission limits for total HAP in units of lb/103 ft2 or oven dried tons (ODT). Add-on controls cannot be used to meet this PCBO. See table below. Through the use of an add-on control system (e.g., a RTO), achieve one of the following options:
Pollutant Reduce by
OR achieve emissions �
Methanol 90 % 1 ppm2
…OR… Formaldehyde 90 % 1 ppm2
…OR…
Add-On Control System Option1
THC3 90% 20 ppm Emissions Averaging Option Existing (not new) facilities have the option of
complying by averaging among process units. Notes:
1 There must also be a capture device installed on presses and board coolers that meets the rule definition or a capture efficiency � 95 %. 2 Uncontrolled emissions entering the control device must be greater than or equal to 10 ppm. 3 THC measured as total carbon.
PCBO HAP Limits Applicable to OSB Facilities
PROCESS UNIT PBCO TOTAL HAP LIMIT
Press pre-dryers (at new affected sources only) 0.037 lb/MSF ½” Reconstituted wood product board coolers (at new affected sources only)
0.014 lb/MSF ¾”
Reconstituted wood product presses 0.30 lb/MSF ¾” Rotary strand dryers 0.18 lb/ODT
Notes: lb/MSF = pounds per 1000 square feet with a specified board thickness in inches lb/ODT = pounds per oven dried tons