normal occlusion: reference anthropometric face in ...
16
Page 1/16 Three-dimensional photographic analysis of the face in European adults from southern Spain with normal occlusion: reference anthropometric measurements María Luisa Menendez López-Mateos Universidad de Granada Javier Carreño Carreño Universidad Europea de Madrid Juan Carlos Palma Universidad Complutense de Madrid Facultad de Odontologia JOSE ANTONIO ALARCON ( [email protected] ) University of Granada https://orcid.org/0000-0003-3977-476X Cristina Menendez López-Mateos Universidad Complutense de Madrid Mario Menéndez-Núñez Universidad de Granada Research article Keywords: 3D Photography, Face, Soft tissues, Anthropometry, Morphometrics, Reference values Posted Date: July 18th, 2019 DOI: https://doi.org/10.21203/rs.2.11339/v1 License: This work is licensed under a Creative Commons Attribution 4.0 International License. Read Full License Version of Record: A version of this preprint was published on August 28th, 2019. See the published version at https://doi.org/10.1186/s12903-019-0898-y.
Transcript of normal occlusion: reference anthropometric face in ...

Page 1/16
Three-dimensional photographic analysis of theface in European adults from southern Spain withnormal occlusion: reference anthropometricmeasurementsMaría Luisa Menendez López-Mateos
Universidad de GranadaJavier Carreño Carreño
Universidad Europea de MadridJuan Carlos Palma
Universidad Complutense de Madrid Facultad de OdontologiaJOSE ANTONIO ALARCON ( [email protected] )
University of Granada https://orcid.org/0000-0003-3977-476XCristina Menendez López-Mateos
Universidad Complutense de MadridMario Menéndez-Núñez
Universidad de Granada
Research article
Keywords: 3D Photography, Face, Soft tissues, Anthropometry, Morphometrics, Reference values
Posted Date: July 18th, 2019
DOI: https://doi.org/10.21203/rs.2.11339/v1
License: This work is licensed under a Creative Commons Attribution 4.0 International License. Read Full License
Version of Record: A version of this preprint was published on August 28th, 2019. See the publishedversion at https://doi.org/10.1186/s12903-019-0898-y.

Page 2/16
AbstractBackground Recent non-invasive 3D photography method has been applied to facial analysis, offeringnumerous advantages in orthodontic. The purpose of this study was to analyze the faces of a sample ofhealthy European adults from southern Spain with normal occlusion in order to establish reference facialsoft tissue anthropometric parameters in this speci�c geographic-ethnic population, as well as to analyzesexual dimorphism. Methods A sample of 100 healthy adult volunteers consisting of 50 women (meanage, 22.92 ± 1.56 years) and 50 men (mean age, 22.37 ± 2.12 years) were enrolled in this study. Allparticipants had normal occlusion, skeletal Class I, mesofacial pattern, and healthy body mass index.Three-dimensional photographs of the faces were captured non-invasively using Planmeca ProMax 3DProFace®. Thirty landmarks related to the face, eyes, nose, and orolabial and chin areas were identi�ed.Results Male displayed higher values in all vertical and transversal dimensions, with the exception of thelower lip height. Larger differences between sexes were observed in face, mandible, and nose. Male alsohad higher values in the angular measurements which referred to the nose. No sex differences werefound in transverse upper lip prominence or transverse mandibular prominence. No differences werefound in the ratio measurements, with the exception of intercantal width/nasal width, which was higher inwomen than in men. Conclusions Reference anthropometric measurements of facial soft tissues havebeen established in European adults from southern Spain with normal occlusion. Signi�cant sexualdimorphism was found, with remarkable differences in size between sexes.
BackgroundAnalysis of both hard and soft facial tissues is used in orthodontic diagnoses. Until recently, classicalorthodontics considered the study of hard tissues and cephalometric measurements of upper and lowerjaws and the teeth as more relevant. These measurements have thus been the most used diagnostic toolsin orthodontics [1, 2]. Nevertheless, facial soft tissue morphology has gained increasing interest amongclinicians. In fact, currently, orthodontic and maxillofacial surgery diagnoses are not made without theinclusion of speci�c soft tissue measurements. In addition, lay people (patients and their friends andrelatives) asses the success of orthodontic and orthognatic surgery treatments based on perceived visualfacial changes [3]. Therefore, a complete three-dimensional (3D) assessment of facial soft tissue shape,size, and proportions should be included as a fundamental step in orthodontic diagnoses, assessment offacial deformities, maxillofacial surgery planning, and evaluation of treatment results [4].
Currently, detailed facial soft tissue examinations can be carried out using 3D radiographic techniques,such as computed tomography, or cone-beam computed tomography (CBCT), which is preferable due tothe use of lower radiation doses [5]. Anthropometric facial features can also be analyzed using non-invasive 3D X-ray-free systems, such as laser surface scanning, multi-image photogrammetry, stereo-photogrammetry, or recent 3D facial photography techniques. These new methods offer numerousadvantages, including speed of data collection, feasibility of data storage and handling, accuracy, andreliability [6-11].

Page 3/16
Reference normative values for speci�c races and ethnic groups have thus become absolutely necessary[12], as there are remarkable variations between different populations and groups [13]. The literature issparse in this �eld. Some studies have provided reference anthropometric facial data acquired usingstereo-photogrammetry or photography from Chinese [4], Korean [14], Malay [15], and Turkish [16] adults.No 3D facial data are available from southern European adult populations.
We used a recent non-invasive 3D photography method to analyze the faces of a sample of healthyEuropean adults from southern Spain with normal occlusion. The main aims were to establish standardsfor facial soft tissue anthropometric parameters in this speci�c geographic-ethnic population, as well asto analyze sexual dimorphism. We also compared our �ndings to morphological features of othersimilarly studied populations.
Subjects And MethodsA sample of 100 healthy adult volunteers consisting of 50 women (mean age, 22.92 ± 1.56 years) and 50men (mean age, 22.37 ± 2.12 years) were enrolled in this study. The inclusion criteria were as follows: 1)European ethnicity, speci�cally that from Granada in southern Spain. Information regarding race,ethnicity, and geographic origin was obtained using a self-administered questionnaire, which includedquestions regarding the participants and their parents and grandparents; 2) age between 20 and 30 years;3) normal occlusion classi�ed as skeletal Class I (based on ANB angle: 0-4°, as measured on a lateralcephalogram), mesofacial growth pattern (according to the Frankfort horizontal-to-mandibular planeangle: 20-28° on a lateral cephalogram), and dental angle Class I; 4) lip competence; and 5) healthy bodymass index (18-25 kg/m2). The exclusion criteria were 1) craniofacial anomalies; 2) previous or currentorthopedic, orthodontic, maxillofacial, or aesthetic surgery treatment; 3) nasal or facial dis�gurement,deformity, asymmetry, or surgery; 4) history of facial trauma; and 5) any type of cosmetic facial aestheticprocedure. The sample size was determined using the 3.1.2 version of PS: Power and Sample SizeCalculation® according to previously described methods [4, 17].
Participants volunteered for the study after a detailed explanation of the protocol and agreed toparticipate by signing an ethics committee-approved informed consent form.
Three-dimensional image capture, methods, and measurements
Three-dimensional photography of the faces was carried out using Planmeca ProMax 3D ProFace®(Planmeca USA, Inc.; Roselle, IL, USA), which produces a realistic 3D picture of the face (Fig 1).Photographs were recorded using the ProFace option, which requires no radiation. The system is basedon lasers that scan facial geometry and a few digital cameras, which capture texture and color. Thesensor components consist of two lights, a laser, two digital cameras, and two light-emitting diodes. Thespatial accuracy of this device is 0.03 mm (as reported by the manufacturer). The 3D photographs wereprocessed using Planmeca Romexis® software, which facilitated accurate and detailed operation.
Page 4/16
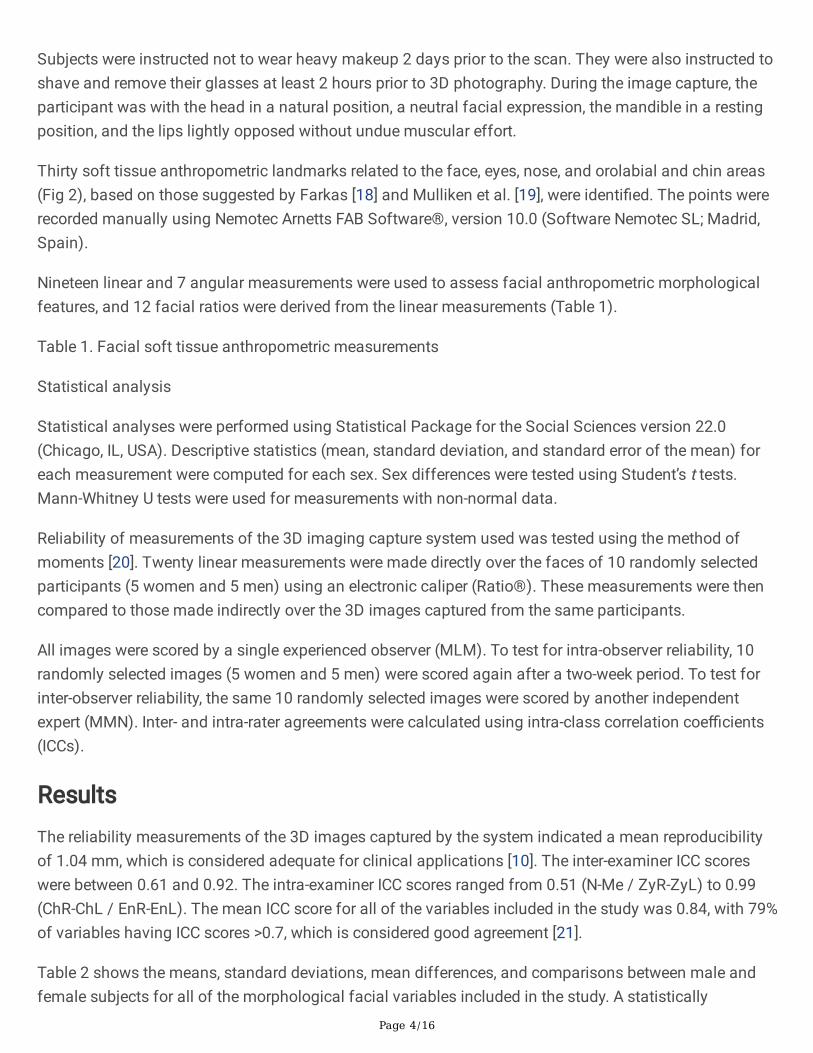
Subjects were instructed not to wear heavy makeup 2 days prior to the scan. They were also instructed toshave and remove their glasses at least 2 hours prior to 3D photography. During the image capture, theparticipant was with the head in a natural position, a neutral facial expression, the mandible in a restingposition, and the lips lightly opposed without undue muscular effort.
Thirty soft tissue anthropometric landmarks related to the face, eyes, nose, and orolabial and chin areas(Fig 2), based on those suggested by Farkas [18] and Mulliken et al. [19], were identi�ed. The points wererecorded manually using Nemotec Arnetts FAB Software®, version 10.0 (Software Nemotec SL; Madrid,Spain).
Nineteen linear and 7 angular measurements were used to assess facial anthropometric morphologicalfeatures, and 12 facial ratios were derived from the linear measurements (Table 1).
Table 1. Facial soft tissue anthropometric measurements
Statistical analysis
Statistical analyses were performed using Statistical Package for the Social Sciences version 22.0(Chicago, IL, USA). Descriptive statistics (mean, standard deviation, and standard error of the mean) foreach measurement were computed for each sex. Sex differences were tested using Student’s t tests.Mann-Whitney U tests were used for measurements with non-normal data.
Reliability of measurements of the 3D imaging capture system used was tested using the method ofmoments [20]. Twenty linear measurements were made directly over the faces of 10 randomly selectedparticipants (5 women and 5 men) using an electronic caliper (Ratio®). These measurements were thencompared to those made indirectly over the 3D images captured from the same participants.
All images were scored by a single experienced observer (MLM). To test for intra-observer reliability, 10randomly selected images (5 women and 5 men) were scored again after a two-week period. To test forinter-observer reliability, the same 10 randomly selected images were scored by another independentexpert (MMN). Inter- and intra-rater agreements were calculated using intra-class correlation coe�cients(ICCs).
ResultsThe reliability measurements of the 3D images captured by the system indicated a mean reproducibilityof 1.04 mm, which is considered adequate for clinical applications [10]. The inter-examiner ICC scoreswere between 0.61 and 0.92. The intra-examiner ICC scores ranged from 0.51 (N-Me / ZyR-ZyL) to 0.99(ChR-ChL / EnR-EnL). The mean ICC score for all of the variables included in the study was 0.84, with 79%of variables having ICC scores >0.7, which is considered good agreement [21].
Table 2 shows the means, standard deviations, mean differences, and comparisons between male andfemale subjects for all of the morphological facial variables included in the study. A statistically

Page 5/16
signi�cant difference was found between male and female subjects in 23 of our 38 measurements. Themost prominent differences between the sexes were observed in the measurements obtained from theface region.
Table 2. Means, standard deviations, mean differences, and p-values for facial morphologic valuedifferences between male and female subjects.
Face
The male subjects had longer and mostly wider faces than the women. The largest differences werefound in the transversal plane, mainly in middle facial width (134.97 ± 5.44 mm in men vs. 128.22 ± 6.37mm in women) and in facial width (114.42 ± 4.63 mm in men vs. 110.73 ± 5.06 mm in women) (p <0.001). Mandibles were also wider in men than in women, with higher values for mandible width (meandifference, 6.91 mm), and right (mean difference, 7.74 mm) and left (mean difference, 7.12 mm)mandibular body lengths.
Nose
All measurements (nose height, nasal bridge length, nasal width, and alar base root width) for the nosewere signi�cantly larger in men than in women. Larger differences were again found in the transversaldimension (nasal width and alar base root width), with wider noses in men than in women (meandifferences, 5.23 and 3.20 mm, respectively).
Ocular region
The 3 variables used to analyze the ocular region were larger in men than in women. We observedespecially large differences in biocular width (90.40 ± 4.68 mm vs. 86.58 ± 3.20 mm) and biorbitale width(76.06 ± 4.79 mm vs. 71.97 ± 4.62 mm).
Orolabial region
Vermilion height, mouth width, and philtrum width were signi�cantly larger in men than in women. Nostatistically signi�cant sex difference was found in lower lip height.
Chin
All evaluated chin measurements were signi�cantly larger in men than in women, with a large differencein chin height (39.07 ± 7.01 mm vs. 38.14 ± 3.68 mm).
Angular measurements
Signi�cant sex differences in angular measurements were found in the nose region (nasolabial angle,nasomental angle, and transverse nasal prominence) (p < 0.001). Transverse upper lip prominence andtransverse mandibular prominence were similar in both sexes.

Page 6/16
Ratio measurements
We found no signi�cant sex differences in ratio measurements, with the exception of the intercantalwidth to nasal width ratio, which was higher in women than in men (p < 0.01)
DiscussionIn spite of the recent increase in the relevance of soft tissue facial analysis, there is an absence ofreference values for some races, ethnicities, and geographic population groups. These data are requiredto determine deviations from standard measurements. We used a recent non-invasive 3D photographymethod to analyze the faces of a sample of healthy European adults with normal occlusion fromsouthern Spain. We established anthropometric facial soft tissue reference values for this speci�cgeographic-ethnic population. We also investigated differences between the sexes in this population.
We found clear sexual dimorphism, with statistically signi�cant differences between male and femalesubjects in most facial variables that were analyzed. The male subjects had higher values in all verticaland transversal dimensions, with the exception of lower lip height, which was similar in the two groups.The male subjects also had higher values in the angular measurements of the nose. No sex differenceswere found in transverse upper lip prominence or transverse mandibular prominence. Only onestatistically signi�cant sex difference was found in the ratio measurements (intercantal width/nasalwidth, which was higher in women than in men). The rest of the measured ratios were similar in bothsexes.
Planmeca ProFace™, which was used to capture facial soft tissue characteristics, is a unique 3D facialphoto option available for all of Planmeca’s 3D X-ray units. The upgraded unit produces a realistic 3Dphoto of the face in addition to performing maxillofacial radiography. Planmeca is the �rst manufacturerto introduce this type of product. One imaging session generates both a 3D photo and a CBCT volume, orif required, only a 3D photo, in which case no radiation is emitted. We used the latter option in the presentstudy. Three-dimensional photos are generated in one imaging session while the patient position, facialexpression, and muscle position remain unchanged. This leads to the production of images that areperfectly compatible (technical information provided on the company website:http://www.planmeca.com/Imaging/3D-imaging/Planmeca-ProFace/).The reliability of themeasurements produced by the 3D imaging capture system used was tested using the method ofmoments. Speci�cally, we compared the direct measurements (those made over the face of the patientusing an electronic caliper) with the same measurements made indirectly (over the 3D images capturedusing Planmeca ProMax 3D ProFace® [Planmeca USA, Inc.; Roselle, IL, USA]) using the same randomlyselected participants. The results indicated adequate reproducibility (mean, 1.04 mm) [10].
In our population, which consisted of European adults from southern Spain, prominent sex differenceswere observed in measurements of the face, mandible, and nose. These measurements were signi�cantlylarger in men than in women.

Page 7/16
In our study, the male subjects had longer and wider faces than the female subjects. Similar results werefound by Baik et al. in Korean adults [14] and by Ozdemir et al. in Turkish young adults [16]. Othman et al.also described longer faces in men than in women in a Malaysian population, although they did notinclude facial width measurements [15]. There are also differences between populations: Korean menhave slightly longer faces than Europeans from southern Spain (face height, N-Me, 121.42 ± 6.03 mm vs.120.40 ± 8.22 mm), while women from southern Spain have longer faces than Korean women (119.69 ±69 mm vs. 114.41 ± 5.89 mm). Sexual dimorphism in face height was more prominent in the Koreanpopulation [14]. Our results are not comparable with those obtained in Turkish [16] or Malaysian [15]populations. This is because, in those studies, the authors considered face height as the distance from Nto Gn, although they also found higher sexual dimorphism than we did. Sexual dimorphism has also beenreported in a Chinese population [4], although the different methodology used makes it di�cult tocompare the Chinese study to ours.
Mandible width and right and left mandibular body length were also signi�cantly larger in men than inwomen in our southern European sample. Similar results were found in Turkish and Korean adults, withwider mandibles in men than in women. Inter-group differences can be observed when comparingpopulations: Koreans men and women have the widest mandibles (measured from right to left gonion)(127.38 ± 7.43 mm in men and 118.01 ± 7.41 mm in women). They are followed by the Turkish (116.3 ±1.26 mm in men and 110.2 ± 1.65 mm in women) and the southern Europeans in our study, who had thesmallest mandible width (113.52 ± 6.23 mm in men and 107.58 ± 7.51 mm in women). These inter andintra-population differences in face and mandible size and shape may be attributed to several factors,including genetic or environmental factors, as suggested by paleo-anthropology studies [22-26].
In our study, all the measurements of the nose had larger values in men than in women. This wasespecially true of nasal width, which had a mean difference of 5.23 mm. Sexual dimorphism in nosedimensions had also been described in Malaysian adults. Malaysian men have generally longer and moreprominent noses. In addition, nose height and nasal bridge length are signi�cantly in Malaysian men(mean differences of 4.93 mm and 5.73 mm, respectively) [15]. Baik et al. [14] also found longer andmore prominent noses in men than in women. In contrast, Ozdemir et al. [16] did not �nd sexualdimorphism in the height of the nose, the length of the nasal bridge, or the nasal root width in Turkishadults. Our southern European population had narrower noses (nasal width: 36.62 ± 3.28 mm in men and31.15 ± 2.21 mm in women) than other racial and ethnic groups [14-16, 27-29]. In contrast, the noseheight was had higher values in our group (56.94 ± 4.45 mm in men and 56.17 ± 2.83 mm in women)than in Malaysian (54.13 ± 3.61 mm in men and 49.20 mm in women) [15], Chinese (50.15 ± 4.16 mm inmen and 46.93 ± 3.3 mm in women) [30], Turkish (51.9 ± 0.75 mm in men and 51.7 ± 0.58 mm in women)[16], and Korean (53.26 ± 3.46 mm in men and 48.4 ± 4.52 mm in women) [14] populations. Our resultswere similar to those found in white northern Italians (57.43 ± 3.93 mm in men and 54.07 ± 3.68 mm inwomen) [27]. A proposed explanation for sexual differences in nose dimensions is that men have higherdaily energy expenditure, greater respiratory air consumption, and different body composition [22, 31].

Page 8/16
Sexual dimorphism was also found in the ocular region in our population, with signi�cantly higher valuesin men than in women for all variables analyzed. Major differences were found in biocular width (meandifference, 4.83 mm) and biorbitale width (mean difference, 4.53 mm). In the study by Othman et al. [15],only biocular width (mean difference, 4.14 mm) was signi�cantly larger in Malay men than in Malaywomen. Although the main differences in biocular width were quite similar in both studies, the Malaysiansubjects had higher values for both men (96.19 ± 4.64 mm) and women (92.05 ± 3.22 mm) than thosefound in our southern European sample (90.40 ± 4.68 mm in men and 86.58 ± 3.20 mm in women). Nosexual dimorphism was found in a Korean population [14], although the linear distance ExR-ExL (what isreferred to as ’upper face width’) was even higher (106.75 ± 6.13 mm in men and 104.98 ± 5.47 mm inwomen) in that population. There are thus large differences in the ocular area between races and ethnicgroups.
All of the measurements in the orolabial were signi�cantly larger in men than in women, with theremarkable exception of lower lip height, which did not display a signi�cant sex difference. Similarly, nosexual dimorphism was found in the lower vermilion height in a Turkish population [16]. In our sample,philtrum width (10.62 ± 2.43 mm in men and 9.29 ± 1.95 mm in women) and mouth width (51.11 ± 4.77mm in men and 47.34 ± 3.65 mm in women) values were similar to those found by Othman et al. [15] inMalaysians (11.84 ± 1.90 mm in men and 10.40 ± 1.14 mm in women, and 50.83 ± 3.75 mm in men and48.00 ± 2.61 mm in women, respectively). The above authors, however, found smaller differences inmouth width between sexes (2.83 mm vs. 4.21 mm in our study). Turkish [16] and Korean [14] subjectshave wider philtrums in both sexes. The widest mouths are found in white northern Italians [27] (55.71 ±3.81 mm in men and 50.84 ± 3.83 mm in women). The narrowest mouths are found in Turks [16] (47.1 ±0.54 mm in men and 44 ± 0.31 mm in women).
Angular and ratio measurements are di�cult to compare among the published studies due to thedifferent methodologies and variables that have been considered. In our population, nasolabial,nasomental, and transverse nasal prominence angles were signi�cantly larger in men than in women. Incontrast, transverse upper lip prominence and transverse mandibular prominence did not show sexualdimorphism. Thus, there were signi�cant sex differences in the angular measurements of the nosebetween the sexes. Baik et al. [14] also did not �nd signi�cant sex differences in angular measurements,with the exception of the nasal frontal angle and the transverse nasal prominence, in a Koreanpopulation. Othman et al. [15] did not �nd clinically signi�cant differences between the sexes in angularand ratio measurements in Malaysians.
Among the ratio measurements in our study, only the intercantal width/nasal width ratio was signi�cantlydifferent between the sexes, with higher ratios in women (1.01 ± 0.11) than men (0.89 ± 0.13). In contrast,Baik et al. [14] found signi�cant sex differences in the ratio of anterior facial height to the interzygomaticdistance and that of forehead height to forehead width. However, the ratio of facial height to upper facialheight relative to mandibular width was similar in both sexes, which is consistent with our study. Theseresults suggest that there are larger differences in the sizes, rather than the shapes, of faces between menand women. The comparisons and differences with other populations reported in our study should be

Page 9/16
interpreted with caution due to the different systems used for facial evaluation, as well as in the differentvariables used to analyze anthropometric facial features.
Conclusions
Here we establish reference anthropometric measurements of facial soft tissues in European adults fromsouthern Spain with normal occlusion using non-invasive 3D photography. Most of the parameters hadsigni�cant sexual dimorphism. Men had higher values in all vertical and transversal dimensions, with theexception of lower lip height, which was similar in the two groups. The greatest differences betweensexes were observed in measurements obtained from the face, mandible, and nose, which weresigni�cantly larger in men than in women. However, only one statistically signi�cant sex difference wasfound in the ratio measurements (intercantal width/nasal width, which was higher in women than inmen).
Declarations SectionEthics approval and consent to participate
Approval for this cross-sectional study was obtained from the University of Granada Ethics Committee(reference number 319/CEIH/2017).
Consent for publication
Consent to publish individual person’s data (images) were obtained.
Availability of data and supporting materials
The datasets used and/or analyzed during the current study are available from the corresponding authoron reasonable request.
Funding
There was no funding for this research
Author Contributions
Conceptualization: MLMLM, JCC, JCPF, JAA, CML, and MMN. Data curation: LMLM, CML, and MMN.Formal analysis: MLMLM, JCC, JCPF, JAA, CML, and MMN. Investigation: MLMLM and MMN.Methodology: MLMLM, JCC, JCPF, JAA, CML,and MMN. Project administration: MLMLM and MMN.Resources: JCC, JCPF, JAA, and CML. Supervision: MLMLM and MMN. Validation: MLMLM, JCC, JCPF,JAA, CML, and MMN. Visualization: MLMLM, JCC, JCPF, and MMN. Writing original draft: MLMLM, JAA,and MMN. Writing review & editing: MLMLM, JCC, JCPF, JAA, CML, and MMN.
Acknowledgments

Page 10/16
The authors are grateful to Dr. Conchita Martín, for her contribution of the statiscal analysis.
References1. Ricketts RM. Perspectives in the clinical application of cephalometrics. The �rst �fty years. AngleOrthod. 1981;51:115-50.
2. Tzou CH, Frey M. Evolution of 3D surface imaging systems in facial plastic surgery. Facial Plast SurgClin North Am. 2011;19:591-602, vii.
3. Bishara SE, Cummins DM, Jorgensen GJ, Jakobsen JR. A computer assisted photogrammetricanalysis of soft tissue changes after orthodontic treatment. Part I: Methodology and reliability. Am JOrthod Dentofacial Orthop. 1995;107:633-9.
4. Dong Y, Zhao Y, Bai S, Wu G, Zhou L, Wang B. Three-dimensional anthropometric analysis of chinesefaces and its application in evaluating facial deformity. J Oral Maxillofac Surg. 2011;69:1195-206.
5. Karatas OH, Toy E. Three-dimensional imaging techniques: A literature review. Eur J Dent. 2014;8:132-40.
6. Deli R, Gioia ED, Galantucci LM, Percoco G. Accurate facial morphologic measurements using a 3-camera photogrammetric method. J Craniofac Surg. 2011;22:54-9.
7. Plooij JM, Maal TJ, Haers P, Borstlap WA, Kuijpers-Jagtman AM, Berge SJ. Digital three-dimensionalimage fusion processes for planning and evaluating orthodontics and orthognathic surgery. A systematicreview. Int J Oral Maxillofac Surg. 2011;40:341-52.
8. Gwilliam JR, Cunningham SJ, Hutton T. Reproducibility of soft tissue landmarks on three-dimensionalfacial scans. Eur J Orthod. 2006;28:408-15.
9. Othman SA, Ahmad R, Mericant AF, Jamaludin M. Reproducibility of facial soft tissue landmarks onfacial images captured on a 3D camera. Aust Orthod J. 2013;29:58-65.
10. Wong JY, Oh AK, Ohta E, Hunt AT, Rogers GF, Mulliken JB, et al. Validity and reliability of craniofacialanthropometric measurement of 3D digital photogrammetric images. Cleft Palate Craniofac J.2008;45:232-9.
11. Brons S, van Beusichem ME, Bronkhorst EM, Draaisma J, Berge SJ, Maal TJ, et al. Methods toquantify soft-tissue based facial growth and treatment outcomes in children: a systematic review. PLoSOne. 2012;7:e41898.
12. Liu Y, Kau CH, Pan F, Zhou H, Zhang Q, Zacharopoulos GV. A 3-dimensional anthropometric evaluationof facial morphology among Chinese and Greek population. J Craniofac Surg. 2013;24:e353-8.

Page 11/16
13. Farkas LG, Katic MJ, Forrest CR, Alt KW, Bagic I, Baltadjiev G, et al. International anthropometric studyof facial morphology in various ethnic groups/races. J Craniofac Surg. 2005;16:615-46.
14. Baik HS, Jeon JM, Lee HJ. Facial soft-tissue analysis of Korean adults with normal occlusion using a3-dimensional laser scanner. Am J Orthod Dentofacial Orthop. 2007;131:759-66.
15. Othman SA, Majawit LP, Wan Hassan WN, Wey MC, Mohd Razi R. Anthropometric Study of Three-Dimensional Facial Morphology in Malay Adults. PLoS One. 2016;11:e0164180.
16. Ozdemir ST, Sigirli D, Ercan I, Cankur NS. Photographic facial soft tissue analysis of healthy Turkishyoung adults: anthropometric measurements. Aesthetic Plast Surg. 2009;33:175-84.
17. Kau CH, Richmond S, Zhurov A, Ovsenik M, Taw�k W, Borbely P, et al. Use of 3-dimensional surfaceacquisition to study facial morphology in 5 populations. Am J Orthod Dentofacial Orthop. 2010;137:S56e1-9; discussion S-7.
18. Farkas LG. Anthropometry of the head and face. New York: Lippincott Raven Press; 1994.
19. Mulliken JB, Burvin R, Farkas LG. Repair of bilateral complete cleft lip: intraoperative nasolabialanthropometry. Plast Reconstr Surg. 2001;107:307-14.
20. Bowman KO, Shenton LR. "Estimator: Method of Moments". Encyclopedia of statistical sciences:Wiley 1998. p. 2092-8.
21. Landis JR, Koch GG. The measurement of observer agreement for categorical data. Biometrics.1977;33:159-74.
22. Bastir M, Godoy P, Rosas A. Common features of sexual dimorphism in the cranial airways ofdifferent human populations. Am J Phys Anthropol. 2011;146:414-22.
23. Rosas A, Bastir M, Alarcon JA, Kuroe K. Thin-plate spline analysis of the cranial base in African, Asianand European populations and its relationship with different malocclusions. Arch Oral Biol. 2008;53:826-34.
24. Rosas A, Bastir M. Thin-plate spline analysis of allometry and sexual dimorphism in the humancraniofacial complex. Am J Phys Anthropol. 2002;117:236-45.
25. Alarcon JA, Bastir M, Rosas A. Variation of mandibular sexual dimorphism across human facialpatterns. Homo. 2016;67:188-202.
26. Coquerelle M, Bookstein FL, Braga J, Halazonetis DJ, Weber GW, Mitteroecker P. Sexual dimorphism ofthe human mandible and its association with dental development. Am J Phys Anthropol. 2011;145:192-202.

Page 12/16
27. Ferrario VF, Sforza C, Serrao G. A three-dimensional quantitative analysis of lips in normal youngadults. Cleft Palate Craniofac J. 2000;37:48-54.
28. Porter JP, Olson KL. Anthropometric facial analysis of the African American woman. Arch Facial PlastSurg. 2001;3:191-7.
29. Porter JP. The average African American male face: an anthropometric analysis. Arch Facial PlastSurg. 2004;6:78-81.
30. Aung SC, Foo CL, Lee ST. Three dimensional laser scan assessment of the Oriental nose with a newclassi�cation of Oriental nasal types. Br J Plast Surg. 2000;53:109-16.
31. Holton NE, Yokley TR, Froehle AW, Southard TE. Ontogenetic scaling of the human nose in alongitudinal sample: implications for genus Homo facial evolution. Am J Phys Anthropol. 2014;153:52-60.
TablesTable 1.
Facial soft tissue anthropometric measurements

Page 13/16
Measurements Face (mm) Face height N-MeLower face height Sn-MeMiddle facial width Tr R- TrLFacial width ZyR- ZyLMandible width GoR- GoLRight mandibular body length GoR-MeLeft mandibular body length GoL-Me Nose (mm) Nose height N-SnNasal bridge length N-PrnNasal width AlR- AlLAlar base root width SbAlR- SbAl L Ocular (mm) Biocular width ExR- ExLIntercantal width EnR- EnLBiorbitale width OrR- OrL Orolabial (mm) Vermillion height Ls-LiMouth width ChR-ChLPhiltrum width CphR-CphLlower lip height Li-B Chin (mm) Chin height Li-Me B-Pg Pg-Me Angular measurements (°) Nasolabial angle G-N-PrnNasomental angle N-Prn-PgTransverse nasal prominence Zy R-Prn-ZyLTransverse upper lip prominence ChR-Ls-ChTransverse mandibular prominence GoR-Pg-GoL Ratio measurements Upper face height/mandibular width N-Sn / GoR-GoLLower face height/mandibular width Sn-Me / GoR-GoLAnterior face height/mandibular width N-Me/ GoR-GoLAnterior face height/facial width N-Me / ZyR-ZyLIntercantal width/nasal width EnR-EnL / AlR-AlLVermilion height/mouth width Ls-Li / ChR-ChLChin height/right mandibular body length Li-Me / GoR-MeChin height/left mandibular body length Li-Me / GoL-MeNose height/lower face height N-Sn / SnMeNose height/facial width N-Sn / ZyR-ZyLMouth width/intercantal width ChR-ChL / EnR-EnLMandible width/biocular width GoR-GoL / ExR-ExL
Table 2.

Page 14/16
Means, standard deviations, mean differences, and p-values for facial morphologic value differencesbetween male and female subjects.
Measurements Male Female Mean difference(95% CI)
p value Mean (SD) Mean (SD)Face (mm) Face height 120.40 (8.22) 119.69 (4.25) 3.48 (0.20; 6.75) 0.038*Lower face height 66.77 (8.05) 65.99 (4.22) 2.77 (-0.46; 6.00) 0.003**Middle facial width 134.97 (5.44) 128.22 (6.37) 9.04 (6.49; 11.60) 0.000***Facial width 114.42 (4.63) 110.73 (5.06) 7.39 (4.23; 10.55) 0.000***Mandible width 113.52 (6.23) 107.58 (7.51) 6.91 (2.80; 11.01) 0.001***Right mandibular body length 92.56 (13.33) 83.48 (7.45) 7.74 (1.78; 13.70) 0.002**Left mandibular body length 92.48 (13.96) 83.97 (6.89) 7.12 (1.05; 13.18) 0.008** Nose (mm) Nose height 56.94 (4.45) 56.17 (2.83) 1.58 (0.01; 3.15) 0.049*Nasal bridge length 48.35 (4.76) 47.56 (2.97) 1.97 (0.04; 3.52) 0.012*Nasal width 36.62 (3.28) 31.15 (2.21) 5.23 (3.97; 6.50) 0.000***Alar base root width 23.17 (6.07) 20.17 (3.85) 3.20 (1.25; 5.15) 0.002** Ocular (mm) Biocular width 90.40 (4.68) 86.58 (3.20) 4.83(3.14; 6.53) 0.000***Intercantal width 32.52 (4.52) 31.38 (2.78) 2.27 (0.56; 3.98 0.010**Biorbitale width 76.06 (4.79) 71.97 (4.62) 4.53 (2.60; 6.45) 0.000*** Orolabial (mm) Vermilion height 13.07 (3.75) 11.83 (2.45) 1.52 (0.34; 2.70) 0.040*Mouth width 51.11 (4.77) 47.34 (3.65) 4.21 (2.26; 6.17) 0.000***Philtrum width 10.62 (2.43) 9.29 (1.95) 1.73 (0.82; 2.64 0.000***lower lip height 20.25 (3.20) 19.32 (3.69) 1.95 (-1.19; 2.59) 0.695 Chin (mm) Chin height 39.07 (7.01) 38.14 (3.68) 2.06 (-0.82; 4.95) 0.004**B-Pg 6.61 (2.34) 5.69 (1.70) 1.57 (0.37; 2.76) 0.011*Pg-Me 12.91 (3.22) 12.08 (2.98) 1.77 (0.42; 3.11) 0.011* Angular measurements (°) Nasolabial angle 28.22 (4.32) 24.26 (4.30) 3.92 (1.89; 5.95) 0.000***Nasomental angle 30.77 (4.00) 28.62 (3.20) 1.94 (0.54; 3.35) 0.000***Transverse nasal prominence 43.82 (2.08) 41.64 (2.63) 2.76 (1.50; 4.01) 0.000***Transverse upper lip prominence 35.82 (8.71) 35.53 (3.49) 0.63 (-0.86; 2.08) 0.402Transverse mandibular prominence 50.62 (3.61) 49.91 (4.20) 1.22 (-0.41; 2.85 0.142 Ratio measurements Upper face height/mandibular width 0.50 (0.05) 0,53 (0.05) -0.02 (-0.05; 0.00) 0.081Lower face height/mandibular width 0.59 (0.08) 0.62 (0.06) -0.01 (-0.06; 0.03) 0.784Anterior face height/mandibular width 1,06 (0,09) 1.12 (0.09) -0.04 (-0.95; 0.01) 0.140Anterior face height/facial width 1.05 (0.08) 1.08 (0.05) -0.03 (-0.07; 0.00) 0.055Intercantal width/nasal width 0.89 (0.13) 1.01 (0.11) -0.08 (-0.14; -0.02) 0.008**Vermilion height/mouth width 0.26 (0.08) 0.25 (0.06) 0.01 (-0.01; 0.03) 0.424Chin height/right mandibular body length 0.42 (0.08) 0.45 (0.07) -0.02 (-0.07; 0.02) 0.207Chin height/left mandibular body length 0.43 (0.09) 0.46 (0.06) -0.02 (-0.06; 0.03) 0.332Nose height/lower face height 0.87 (0.18) 0.86 (0.08) 0.01 (-0.06; 0.07) 0.175Nose height/facial width 0.50 (0.05) 0.51 (0.03) -0.02 (-0.03; 0.00) 0.063Mouth width/intercantal width 1.59 (0.21) 1.52 (1.18) 0.01 (-0.11; 0.12) 0.859Mandible width/biocular width 1.26 (0.08) 1.24 (0.09) 0.15 (-0.03; 0.06) 0.541
*p < 0.05; **p < 0.01; ***p < 0.001

Page 15/16
Figures
Figure 1
Three-dimensional photography device

Page 16/16
Figure 2
Soft tissue landmarks. N (soft-tissue nasion); G (glabella); Prn (pronasale); Sn (subnasale); Ls (labralesuperius); Li (labrale inferius); B (soft-tissue B point); Pg (soft-tissue pogonion); Me (soft-tissue menton);En (endocanthion, R-Right and L-Left); Ex (exocanthion; R-Right and L-Left); Or (orbitale, R-Right and L-Left); Al (alare, R-Right and L-Left); SbAl (subalare, R-Right and L-Left); Cph (christa philtri, R-Right and L-Left) Ch (cheilion, R-Right and L-Left); Zy (zygomatic point, R-Right and L-Left); Go (soft-tissue gonion, R-Right and L-Left); and Tr (tragus, R-Right and L-Left).