Norio Usui, Transforming the Philippine Economy
34
ADB Econom ics Working Paper Series T ransforming the Philippine Economy: “Walking on Two Legs” Norio Usui No. 252 | March 2011
-
Upload
tina-clemente -
Category
Documents
-
view
226 -
download
0
Transcript of Norio Usui, Transforming the Philippine Economy
8/3/2019 Norio Usui, Transforming the Philippine Economy
http://slidepdf.com/reader/full/norio-usui-transforming-the-philippine-economy 1/34
ADB Economics Working Paper Series
Transforming the Philippine Economy:“Walking on Two Legs”
Norio Usui
No. 252 | March 2011

8/3/2019 Norio Usui, Transforming the Philippine Economy
http://slidepdf.com/reader/full/norio-usui-transforming-the-philippine-economy 2/34
8/3/2019 Norio Usui, Transforming the Philippine Economy
http://slidepdf.com/reader/full/norio-usui-transforming-the-philippine-economy 3/34
ADB Economics Working Paper Series No. 252
Transorming the Philippine Economy:
“Walking on Two Legs”
Norio Usui
March 2011
Norio Usui is Senior Country Economist in the Philippines Country Ofce, Asian Development Bank(ADB). The original paper was published in October 2010 as a Philippines Country Ofce Policy Notepresented in the plenary session of the 48th Annual Meeting of the Philippine Economic Society on 12
November 2010, and later at an ADB Brown Bag Seminar on 31 March 2011. The paper was preparedunder the overall guidance of Neeraj Jain, Country Director, Philippines Country Ofce. The author appreciates comments and suggestions by ADB’s Joao Farinha, Utsav Kumar, Maria Socorro Bautista,Muhammad Ehsan Khan, and Rowena Cham. The author accepts responsibility for any errors in the paper.

8/3/2019 Norio Usui, Transforming the Philippine Economy
http://slidepdf.com/reader/full/norio-usui-transforming-the-philippine-economy 4/34
Asian Development Bank6 ADB Avenue, Mandaluyong City1550 Metro Manila, Philippineswww.adb.org/economics
©2011 by Asian Development BankMarch 2011ISSN 1655-5252Publication Stock No. WPS113570
The views expressed in this paper are those of the author(s) and do notnecessarily reect the views or policiesof the Asian Development Bank.
The ADB Economics Working Paper Series is a forum for stimulating discussion and
eliciting feedback on ongoing and recently completed research and policy studies
undertaken by the Asian Development Bank (ADB) staff, consultants, or resource
persons. The series deals with key economic and development problems, particularly
those facing the Asia and Pacic region; as well as conceptual, analytical, or
methodological issues relating to project/program economic analysis, and statistical data
and measurement. The series aims to enhance the knowledge on Asia’s development
and policy challenges; strengthen analytical rigor and quality of ADB’s country partnership
strategies, and its subregional and country operations; and improve the quality and
availability of statistical data and development indicators for monitoring development
effectiveness.
The ADB Economics Working Paper Series is a quick-disseminating, informal publication
whose titles could subsequently be revised for publication as articles in professional
journals or chapters in books. The series is maintained by the Economics and Research
Department.
8/3/2019 Norio Usui, Transforming the Philippine Economy
http://slidepdf.com/reader/full/norio-usui-transforming-the-philippine-economy 5/34
Contents
Abstract v
I. Introduction—The Philippines’ Development Puzzle 1
II. Structural Transformation—Aggregate Productivity Growth 5
III. Structural Transformation—Evolution of the Product Space 11
IV. Service-Led Growth—Is the BPO Industry the Savior? 16
V. Concluding Remarks 20
Appendix 1: Labor Productivity, 1980–2007 22
Appendix 2: Labor Productivity—Manufacturing, 1980–2006 23
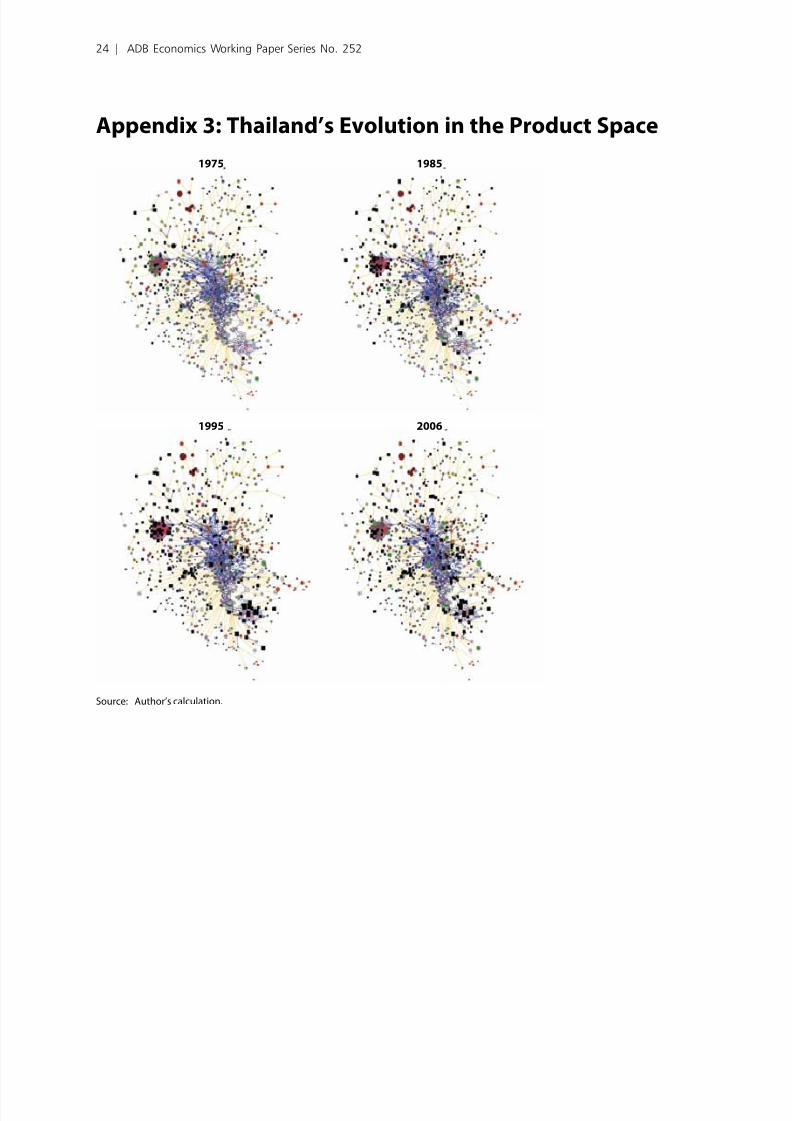
Appendix 3: Thailand’s Evolution in the Product Space 24
Selected References 25

8/3/2019 Norio Usui, Transforming the Philippine Economy
http://slidepdf.com/reader/full/norio-usui-transforming-the-philippine-economy 6/34
8/3/2019 Norio Usui, Transforming the Philippine Economy
http://slidepdf.com/reader/full/norio-usui-transforming-the-philippine-economy 7/34
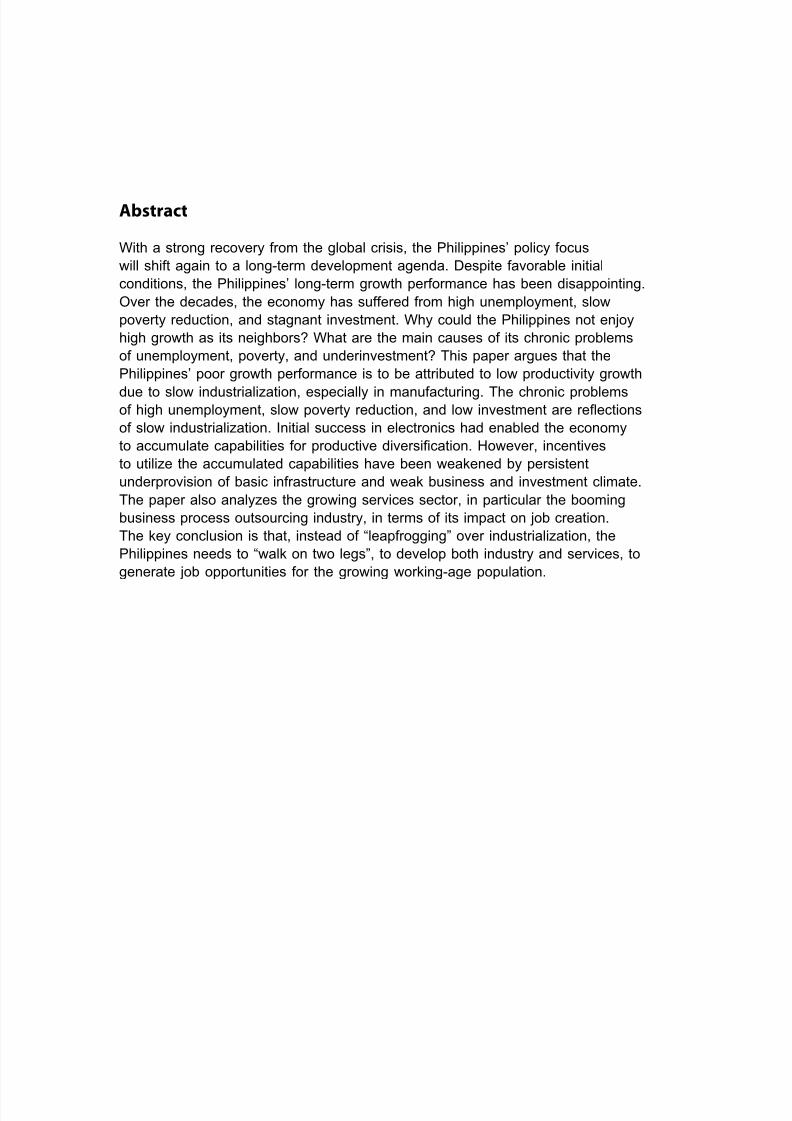
Abstract
With a strong recovery from the global crisis, the Philippines’ policy focus
will shift again to a long-term development agenda. Despite favorable initial
conditions, the Philippines’ long-term growth performance has been disappointing.
Over the decades, the economy has suffered from high unemployment, slow
poverty reduction, and stagnant investment. Why could the Philippines not enjoy
high growth as its neighbors? What are the main causes of its chronic problems
of unemployment, poverty, and underinvestment? This paper argues that the
Philippines’ poor growth performance is to be attributed to low productivity growth
due to slow industrialization, especially in manufacturing. The chronic problemsof high unemployment, slow poverty reduction, and low investment are reections
of slow industrialization. Initial success in electronics had enabled the economy
to accumulate capabilities for productive diversication. However, incentives
to utilize the accumulated capabilities have been weakened by persistent
underprovision of basic infrastructure and weak business and investment climate.
The paper also analyzes the growing services sector, in particular the booming
business process outsourcing industry, in terms of its impact on job creation.
The key conclusion is that, instead of “leapfrogging” over industrialization, the
Philippines needs to “walk on two legs”, to develop both industry and services, to
generate job opportunities for the growing working-age population.

8/3/2019 Norio Usui, Transforming the Philippine Economy
http://slidepdf.com/reader/full/norio-usui-transforming-the-philippine-economy 8/34

8/3/2019 Norio Usui, Transforming the Philippine Economy
http://slidepdf.com/reader/full/norio-usui-transforming-the-philippine-economy 9/34
I. IntroductionThe Philippines’ Development Puzzle
The Philippines is a major development puzzle. With one of the highest per capita
incomes in East Asia in the 1950s and 1960s, the country was an early leader with
a relatively advanced manufacturing sector and well-developed human capital. Yet
despite favorable initial conditions, the country’s long-term growth performance has been
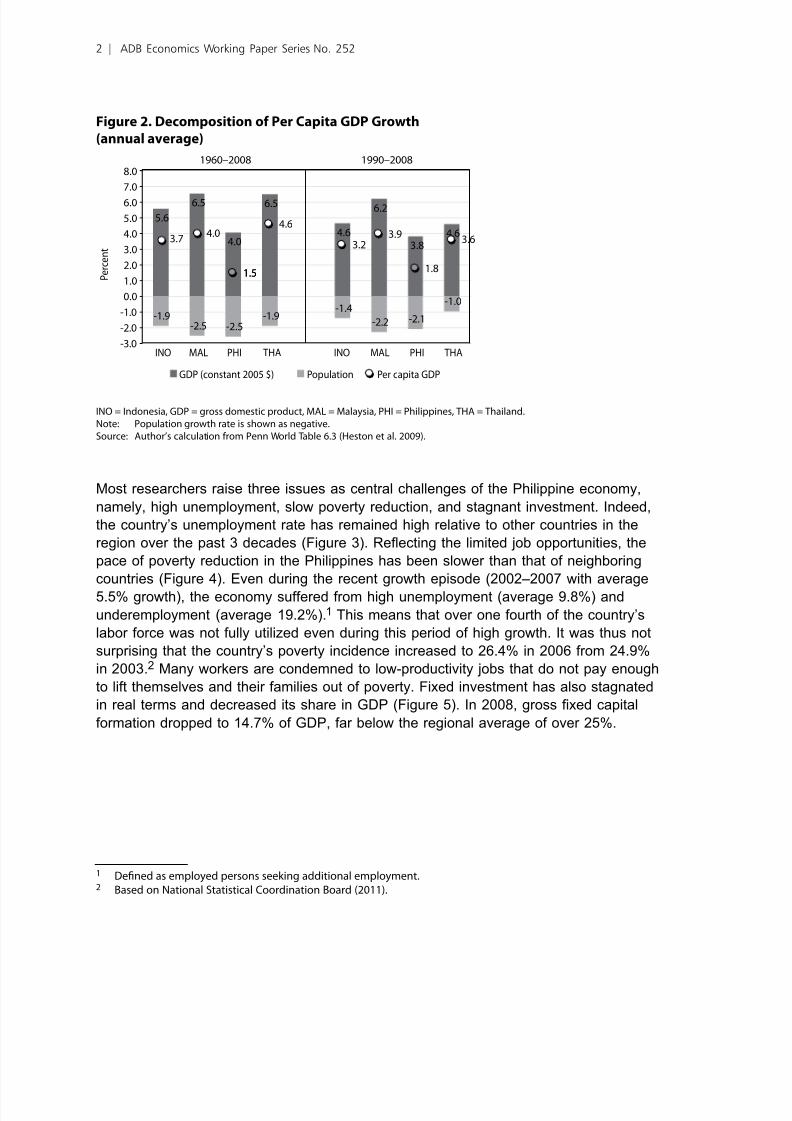
disappointing (Figure 1). Between 1960 and 2008, real gross domestic product (GDP)
grew at a rate of 4.0% per annum. With a relatively high population growth of 2.5%,
per capita GDP increased only by 1.5% (Figure 2). Over the same period, neighboring
economies in the Association of Southeast Asian Nations (ASEAN) such as Indonesia,
Malaysia, and Thailand (ASEAN-4) grew at a rate of around 4% in per capita term. Even
if focus is on the last 2 decades (1990–2008) during which a series of reforms made
the economy one of the most open to trade and capital inows, the overall story of the
Philippines’ lagged growth remains. By the end of the 1990s, the Philippines’ per capita
GDP has dropped to the bottom in the ASEAN-4, and now even the gap with Viet Nam
is narrowing. Contrary to popular belief, the Philippines’ high population growth is not
necessarily to blame, since other countries such as Malaysia had a similar population
growth over the period.
Figure 1: From the Top to the Bottom, 19502007(GDP per capita, constant 2005 $ prices)
0
2,000
4,000
6,000
8,000
10,000
12,000
14,000
16,000
18,000
1950 54 58 62 66 70 74 78 82 86 90 94 98 2002 06
Indonesia MalaysiaPhilippines ThailandViet Nam China, People’s Rep. of
GDP = gross domestic product.Source: Penn World Table 6.3 (Heston et al. 2009).
8/3/2019 Norio Usui, Transforming the Philippine Economy
http://slidepdf.com/reader/full/norio-usui-transforming-the-philippine-economy 10/34
Figure 2. Decomposition o Per Capita GDP Growth
(annual average)
5.6
6.5
4.0
6.5
4.6
6.2
3.8
4.6
-1.9
-2.5 -2.5
-1.9
3.74.0
1.5
4.6
3.9
1.8
3.63.2
-2.0
-1.0
0.0
1.0
2.0
3.0
4.0
5.0
6.0
7.0
THA INO MAL PHI THA
-1.4
-2.2 -2.1
-1.0
1.5
-3.0
8.0
INO MAL PHI
1960–2008 1990–2008
GDP (constant 2005 $) Population Per capita GDP
P e r c e n t
INO = Indonesia, GDP = gross domestic product, MAL = Malaysia, PHI = Philippines, THA = Thailand.Note: Population growth rate is shown as negative.Source: Author’s calculation rom Penn World Table 6.3 (Heston et al. 2009).
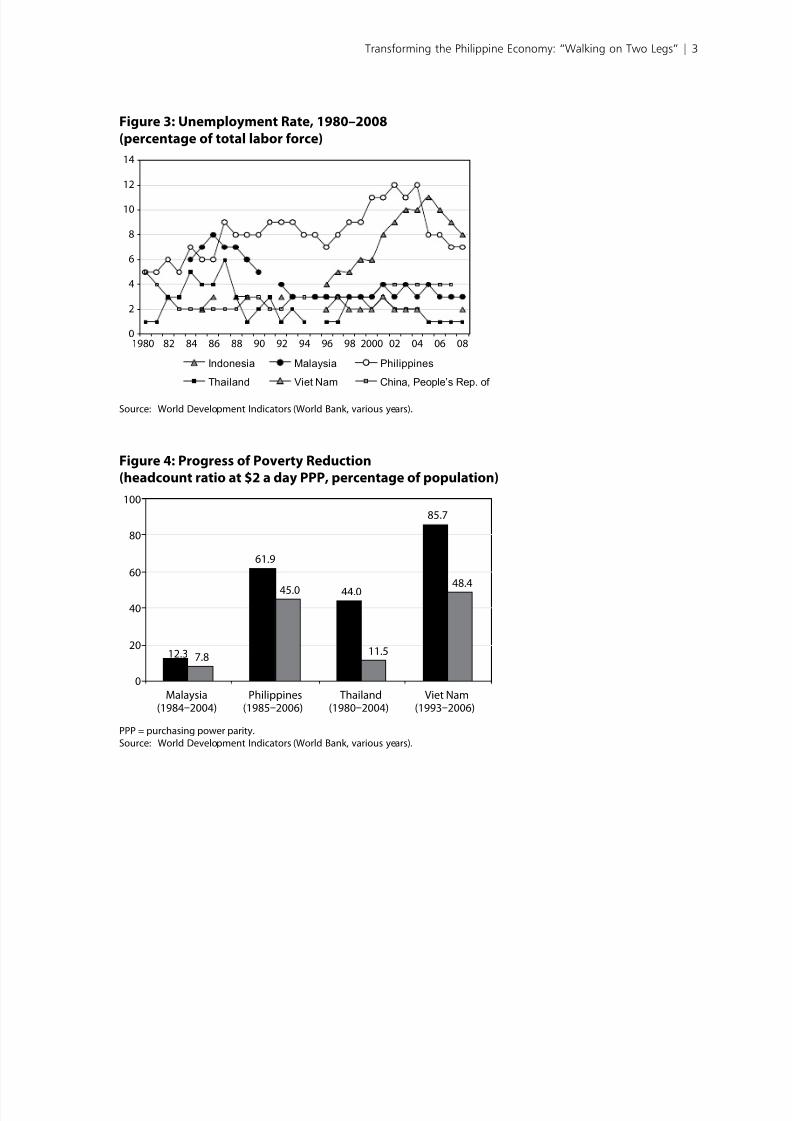
Most researchers raise three issues as central challenges of the Philippine economy,
namely, high unemployment, slow poverty reduction, and stagnant investment. Indeed,
the country’s unemployment rate has remained high relative to other countries in the
region over the past 3 decades (Figure 3). Reecting the limited job opportunities, the
pace of poverty reduction in the Philippines has been slower than that of neighboring
countries (Figure 4). Even during the recent growth episode (2002–2007 with average
5.5% growth), the economy suffered from high unemployment (average 9.8%) and
underemployment (average 19.2%).1 This means that over one fourth of the country’s
labor force was not fully utilized even during this period of high growth. It was thus not
surprising that the country’s poverty incidence increased to 26.4% in 2006 from 24.9%
in 2003.2 Many workers are condemned to low-productivity jobs that do not pay enough
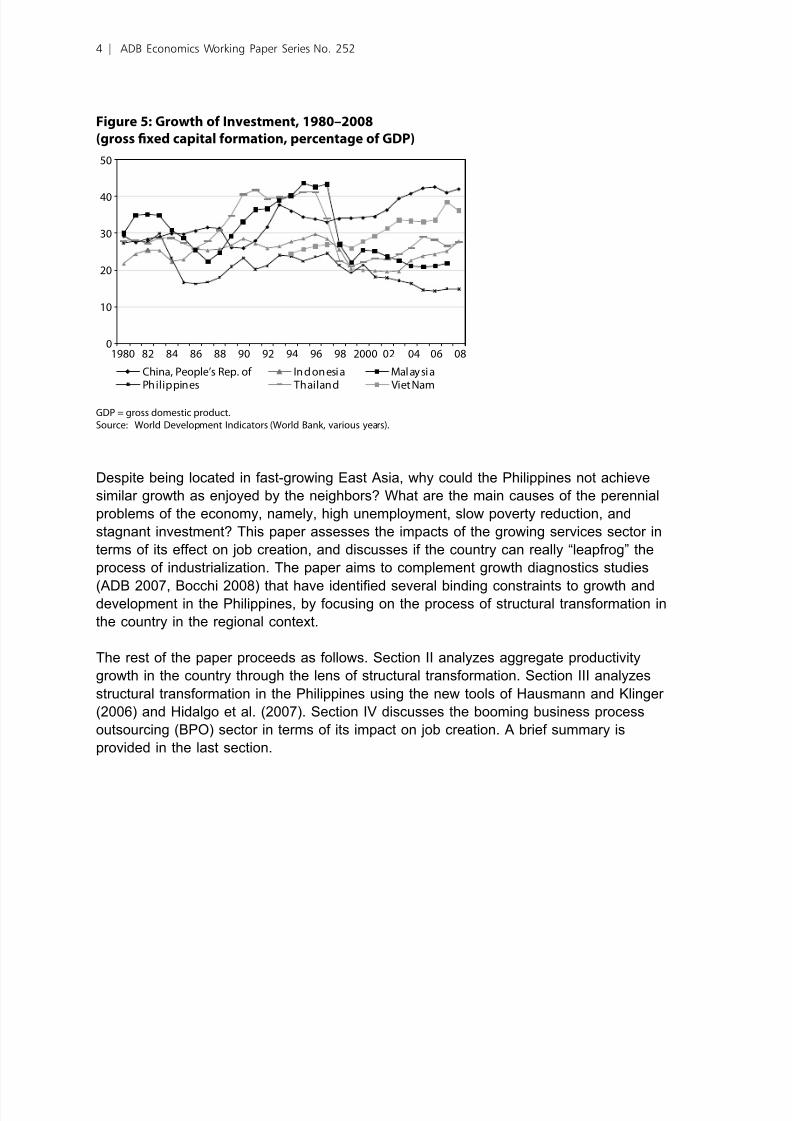
to lift themselves and their families out of poverty. Fixed investment has also stagnated
in real terms and decreased its share in GDP (Figure 5). In 2008, gross xed capital
formation dropped to 14.7% of GDP, far below the regional average of over 25%.
1 Dened as employed persons seeking additional employment.2 Based on National Statistical Coordination Board (2011).
2 | ADB Economics Working Paper Series No. 252
8/3/2019 Norio Usui, Transforming the Philippine Economy
http://slidepdf.com/reader/full/norio-usui-transforming-the-philippine-economy 11/34
Figure 3: Unemployment Rate, 19802008
(percentage o total labor orce)
0
2
4
6
8
10
12
14
1980 82 84 86 88 90 92 94 96 98 2000 02 04 06 08
Indonesia Malaysia Philippines
Thailand Viet Nam China, People’s Rep. of
Source: World Development Indicators (World Bank, various years).
Figure 4: Progress o Poverty Reduction(headcount ratio at $2 a day PPP, percentage o population)
61.9
44.0
85.7
7.8
45.0
11.5
48.4
12.3
0
20
40
60
80
100
Malaysia(19842004)
Philippines(19852006)
Thailand(19802004)
Viet Nam(19932006)
PPP = purchasing power parity.Source: World Development Indicators (World Bank, various years).
Transforming the Philippine Economy: “Walking on Two Legs” | 3
8/3/2019 Norio Usui, Transforming the Philippine Economy
http://slidepdf.com/reader/full/norio-usui-transforming-the-philippine-economy 12/34
Figure 5: Growth o Investment, 19802008
(gross fxed capital ormation, percentage o GDP)
0
10
20
30
40
50
1980 82 84 86 88 90 92 94 96 98 2000 02 04 06 08
China, People’s Rep. of Ind onesi a Mal ay si aPhilippines Thailand Viet Nam
GDP = gross domestic product.Source: World Development Indicators (World Bank, various years).
Despite being located in fast-growing East Asia, why could the Philippines not achieve
similar growth as enjoyed by the neighbors? What are the main causes of the perennial
problems of the economy, namely, high unemployment, slow poverty reduction, and
stagnant investment? This paper assesses the impacts of the growing services sector in
terms of its effect on job creation, and discusses if the country can really “leapfrog” the
process of industrialization. The paper aims to complement growth diagnostics studies
(ADB 2007, Bocchi 2008) that have identied several binding constraints to growth anddevelopment in the Philippines, by focusing on the process of structural transformation in
the country in the regional context.
The rest of the paper proceeds as follows. Section II analyzes aggregate productivity
growth in the country through the lens of structural transformation. Section III analyzes
structural transformation in the Philippines using the new tools of Hausmann and Klinger
(2006) and Hidalgo et al. (2007). Section IV discusses the booming business process
outsourcing (BPO) sector in terms of its impact on job creation. A brief summary is
provided in the last section.
4 | ADB Economics Working Paper Series No. 252

8/3/2019 Norio Usui, Transforming the Philippine Economy
http://slidepdf.com/reader/full/norio-usui-transforming-the-philippine-economy 13/34
II. Structural TransormationAggregate Productivity
Growth
The main growth engine of East Asian economies has been dynamic structuraltransformation. The growth miracle in East Asian countries started in the 1970s when
they shifted their development strategy toward export promotion and attracted foreign
direct investment. This process was accelerated in the 1980s when foreign rms actively
relocated their production bases across the region. Structural transformation in these
countries had three dimensions: rst, output shifted from low-productivity goods into
high-productivity ones, particularly manufacturing goods (Table 1); second, the labor
force moved from traditional activities in the primary sector to modern industry; and third,
the export basket diversied toward more sophisticated products. The industrial sector
has continually raised its productivity through product diversication and sophistication,
and has absorbed the labor force from low-productivity sectors. The dynamic structural
transformation both in production and employment structures has sustained growth andreduced poverty by creating afuent job opportunities.
Rodrik (2006) challenge the conventional view that structural transformation is a
passive process that can be developed automatically once economic fundamentals—
macroeconomic stability and well-functioning markets—are in place. He analyzes recent
empirical evidence and nds several new stylized facts that place industrial development
in the driving seat of growth and development. The new stylized facts he found include:
(i) economic development requires diversication, not specialization; (ii) rapidly growing
countries are those with large manufacturing sectors; (iii) growth acceleration is
associated with structural changes in the direction of manufacturing; (iv) countries that
promote exports of more sophisticated goods grow faster; and (v) some specializationpatterns are more conductive to others in promoting industrial upgrading. He emphasizes
the centrality of industrial development and structural change for achieving high and
sustained growth in the long term.
Transforming the Philippine Economy: “Walking on Two Legs” | 5

8/3/2019 Norio Usui, Transforming the Philippine Economy
http://slidepdf.com/reader/full/norio-usui-transforming-the-philippine-economy 14/34
Table 1: Structural Change, 19802007
Indonesia Malaysia Philippines Thailand
1980 2007 Change 1980 2007 Change 1980 2007 Change 1980 2007 Change
Output Structure (% o GDP)
Agriculture 24.0 13.7 -10.3 22.6 10.2 -12.4 25.1 14.2 -10.9 23.2 10.7 -12.6
Industry 41.7 46.8 5.1 41.0 47.7 6.7 38.8 31.6 -7.2 28.7 44.7 16.0
Manuacturing 13.0 27.1 14.1 21.6 28.0 6.4 25.7 22.0 -3.8 21.5 35.6 14.1
Services 34.3 39.5 5.1 36.3 42.0 5.7 36.1 54.2 18.1 48.1 44.6 -3.4
Employment Structure (% o total employment)
Agriculture 56.4 41.2 -15.2 37.2 14.8 -22.4 51.8 36.1 -15.7 70.8 41.7 -29.1
Industry 13.1 18.8 5.7 24.1 28.5 4.4 15.4 15.1 -0.3 10.3 20.7 10.4
Manuacturing 9.0 12.4 3.4 16.1 18.8 2.7 10.8 9.1 -1.7 7.9 15.1 7.1
Services 30.5 40.0 9.5 38.7 56.7 18.0 32.8 48.8 16.0 18.9 37.6 18.7
GDP = gross domestic product.Sources: World Development Indicators (World Bank, various years) and LABORSTA (International Labour Organisation, various
years).
In contrast, the Philippines’ industry sector has stagnated for years and even decreased
its share in GDP from 38% in 1980 to 32% in 2007. Labor force employed in the industry
has remained stagnant at around 15% over the same period. Trade liberalization in
the 1990s, and even in the recent high growth period, did not trigger a rising share of
industry, particularly manufacturing. As of 2007, the manufacturing sector accounts only
for 22% of GDP and less than 10% of employment. This is in marked contrast with
neighboring economies where the share of manufacturing has steadily increased both in
output and employment. In the Philippines, the decline in labor share of agriculture has
been entirely absorbed by the growing services sector, which accounts for over 54% of
GDP and employs 49% of total workers as of 2007. Reecting the structural changes in
the direction of services, which are less capital-intensive, the country’s xed investment
has decreased its share in GDP.
The growth of the services sector has accelerated since the mid-1990s when the
Philippines started enjoying high remittance inows (12% of GDP in 2008) and service
exports mainly through the BPO industry (3.2% of GDP). Despite stagnant investment,
the economy keeps growing thanks to strong private consumption backed by soaring
remittance inows. However, the booming services sector has not translated into higher
employment. Informal activities and emigration are the major outlets for underutilized
labor. Quality labor continues to seek job opportunities abroad or takes over relatively
low-wage and low-skill jobs. A serious mismatch between labor supply and demand
is observed, which includes educated maids, educated taxi drivers, and top university
graduates who work for contact centers. The deployment of overseas workers and high
underemployment mask the extent of domestic unemployment.
6 | ADB Economics Working Paper Series No. 252

8/3/2019 Norio Usui, Transforming the Philippine Economy
http://slidepdf.com/reader/full/norio-usui-transforming-the-philippine-economy 15/34
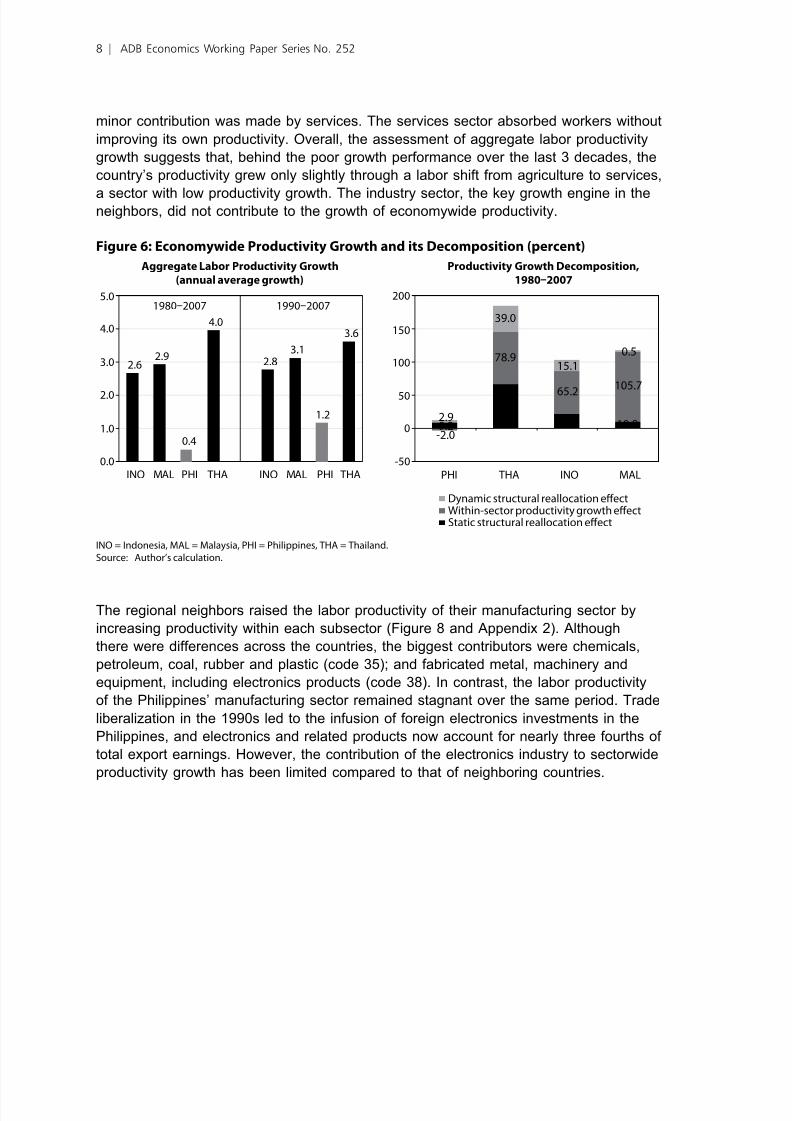
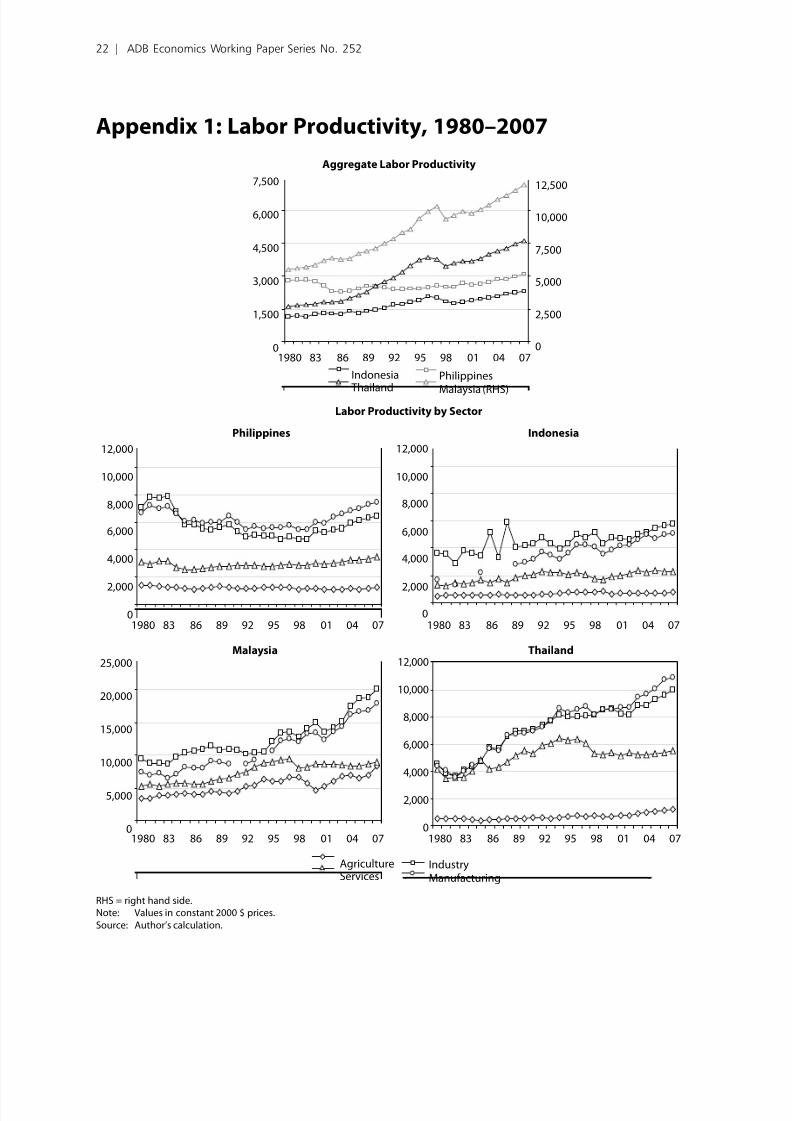
Economywide labor productivity growth is a key measure in capturing a country’s ability to
improve its standard of living over time. The Philippines’ lagged growth performance with
the neighbors is reected in a huge gap in aggregate labor productivity growth. Over 1980
and 2007, the Philippines’ aggregate labor productivity increased only by 10% (annual
average growth rate was only 0.4%), while Indonesia, Malaysia, and Thailand more thandoubled (Figure 6 and Appendix 1). What are major causes of this gap? A decomposition
of aggregate productivity growth provides a picture of how changes in sector productivity
and sectoral reallocation of labors affect aggregate productivity.3 Although the contribution
of the different components has been uneven, aggregate productivity of neighboring
economies was fueled by within-sector productivity growth, but also, quite importantly, by
the reallocation of workers from less to more productive sectors. The cross term (dynamic
structural transformation effect) was also positive since workers shifted toward sectors
that are growing productively. In the Philippines, all three components did not make any
signicant contributions to economywide productivity growth.
Sectoral decomposition of the aggregate productivity growth shows that industry, and, toa lesser extent, services, are two main engines of productivity growth in the neighboring
countries (Figure 7). Both sectors increased their own productivity and absorbed more
workers from agriculture, which led to the dramatic jump of aggregate productivity. In the
Philippines, sector productivity for all sectors has stagnated over 3 decades.4 Industry
and agriculture contributed negatively to aggregate productivity growth, and only a
3 Aggregate labor productivity growth can be decomposed into three components. The rst, “static structuralreallocation eect (SSRE)”, captures the changes in productivity associated with the reallocation o employment
rom low-productivity to high-productivity sectors. The second, “within-sector productivity growth eect(WSPGE)”, measures how much o the changes in aggregate productivity can be explained by the change in
labor productivity within an individual sector. The last term, “dynamic structural reallocation eect (DSTE)”, is an
accounting term that reconciles growth in the aggregate with the SSRE and WSPGE. The DSTE is calculated bymultiplying the change in each sector’s labor productivity times each sector’s change in employment share. It
is negative or any given sector i either the change in labor productivity or the change in employment shareis negative. It is positive or a sector i employment increases (decreases) in that sector and productivity is also
increasing (decreasing) in that sector; it is negative or a sector i employment increases (decreases) in that sector
and productivity decreases (increases) in that sector. I the three components are aggregated or each sector, wecan analyze each sector’s contribution to aggregate productivity growth. The decomposition can be written as:
dy y y
y s sT
T T i i i
i
1
0 00 1 01= ⋅ −( )
∑ Static strucctural reallocation effect (SSRE)
+ ⋅ −10
0 1
y s y
T i i y y i
i
0( )
∑ Within-sector productivity growwth effect (WSPGE)
+ −( ) ⋅ −( )
∑1
01 0 1 0
y s s y y
T i i i i
i
Dynamic structural reallocation effect (DSRE)
= ⋅ −( ) + ⋅ −( ) + −( ) ⋅ −10
0 1 0 0 1 0 1 0 1
y y s s s y y s s y y
T i i i i i i i i i i i
i
0( )
∑ Contribution by sector
where, i : sectors (agriculture, industry, services), 0: base year, 1: nal year, yT : aggregate labor productivity, yi :
labor productivity o sector i, and si : share o sector i in total employment.4 The stagnant productivity o Philippine agriculture also orms a striking contrast with neighboring countries
where increasing agricultural productivity enabled labor to shit to other sectors without decreasing agricultural
production. This may refect the ailures in agricultural policies including land reorm.
Transforming the Philippine Economy: “Walking on Two Legs” | 7
8/3/2019 Norio Usui, Transforming the Philippine Economy
http://slidepdf.com/reader/full/norio-usui-transforming-the-philippine-economy 16/34
minor contribution was made by services. The services sector absorbed workers without
improving its own productivity. Overall, the assessment of aggregate labor productivity
growth suggests that, behind the poor growth performance over the last 3 decades, the
country’s productivity grew only slightly through a labor shift from agriculture to services,
a sector with low productivity growth. The industry sector, the key growth engine in theneighbors, did not contribute to the growth of economywide productivity.
Figure 6: Economywide Productivity Growth and its Decomposition (percent)
Aggregate Labor Productivity Growth Productivity Growth Decomposition,(annual average growth) 1980–2007
2.62.9
0.4
4.0
2.83.1
1.2
3.6
0.0
1.0
2.0
3.0
4.0
5.0
INO MAL PHI THA INO MAL PHI THA
19802007 19902007
9.2
0.5
10.822.2
67.0
105.765.2
78.9
-2.0
15.1
39.0
2.9
-50
0
50
100
150
200
PHI THA INO MAL
Dynamic structural reallocation eectWithin-sector productivity growth eectStatic structural reallocation eect
INO = Indonesia, MAL = Malaysia, PHI = Philippines, THA = Thailand.Source: Author’s calculation.
The regional neighbors raised the labor productivity of their manufacturing sector by
increasing productivity within each subsector (Figure 8 and Appendix 2). Although
there were differences across the countries, the biggest contributors were chemicals,
petroleum, coal, rubber and plastic (code 35); and fabricated metal, machinery and
equipment, including electronics products (code 38). In contrast, the labor productivity
of the Philippines’ manufacturing sector remained stagnant over the same period. Trade
liberalization in the 1990s led to the infusion of foreign electronics investments in the
Philippines, and electronics and related products now account for nearly three fourths of
total export earnings. However, the contribution of the electronics industry to sectorwide
productivity growth has been limited compared to that of neighboring countries.
8 | ADB Economics Working Paper Series No. 252

8/3/2019 Norio Usui, Transforming the Philippine Economy
http://slidepdf.com/reader/full/norio-usui-transforming-the-philippine-economy 17/34
Figure 7: Sector Contribution to Economywide Productivity Growth, 1980–2007 (percent)
Philippines Indonesia
-7.6 -0.817.6
-3.3
4.0
0.1
-2.7
2.0
0.8
-50
-25
0
25
50
75
100
Agriculture Industry Services
-6.5
18.010.714.0
24.626.6
-3.8
10.68.3
-50
-25
0
25
50
75
100
Agriculture Industry Services
Malaysia Thailand
-13.6
7.516.9
33.2
46.6 25.9
-20.0
8.5
12.1
-50
-25
0
25
50
75
100
Agriculture Industry Services
-9.6
29.0
47.6
28.4
34.6
15.8
-11.7
35.015.7
-50
-25
0
25
50
75
100
Agriculture Industry Services
Dynamic structural reallocation eect
Within-sector productivity growth eectStatic structural reallocation eect
Source: Author’s calculation.
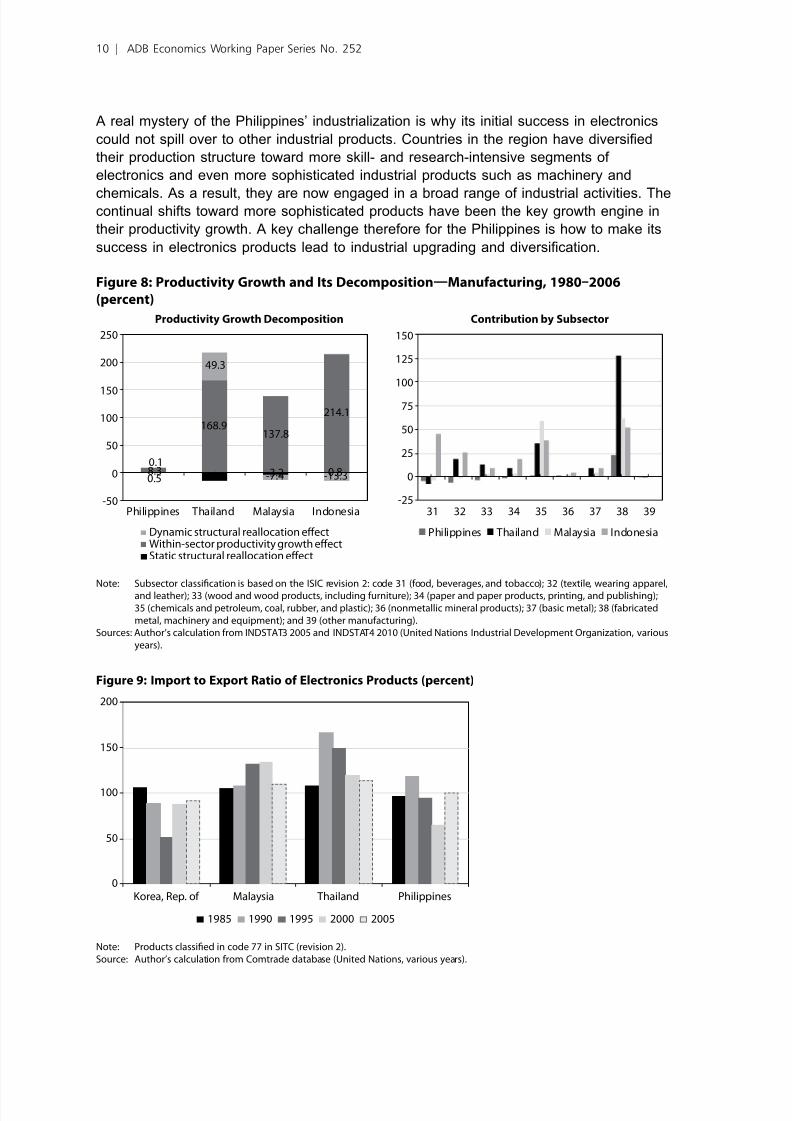
The Philippines’ electronics industry is concentrated in the lowest segment of the value
chain, assembly and testing (Reyes-Macasaquit 2009). Several studies show a negative
picture of high dependency on electronics exports by the focus on low value addition and
weak backward linkages with the rest of the economy. Indeed, electronics production
in the Philippines highly depends on imports, which suggests that simple assembly
dominates electronics production. However, at least judging from the data, there is no
clear evidence that the Philippines’ electronics industry has extremely high import content(Figure 9). Other countries in the region that initiated electronics production at an earlier
stage also have a high import ratio. A key difference with the Philippines is that they could
diversify their production structure toward a wider range of manufacturing products and
develop a large manufacturing sector.
Transforming the Philippine Economy: “Walking on Two Legs” | 9
8/3/2019 Norio Usui, Transforming the Philippine Economy
http://slidepdf.com/reader/full/norio-usui-transforming-the-philippine-economy 18/34
A real mystery of the Philippines’ industrialization is why its initial success in electronics
could not spill over to other industrial products. Countries in the region have diversied
their production structure toward more skill- and research-intensive segments of
electronics and even more sophisticated industrial products such as machinery and
chemicals. As a result, they are now engaged in a broad range of industrial activities. Thecontinual shifts toward more sophisticated products have been the key growth engine in
their productivity growth. A key challenge therefore for the Philippines is how to make its
success in electronics products lead to industrial upgrading and diversication.
Figure 8: Productivity Growth and Its Decomposition—Manuacturing, 1980–2006
(percent)
Productivity Growth Decomposition Contribution by Subsector
0.5 -13.7 -3.2 0.88.3
168.9137.8
214.1
0.1
49.3
-7.4 -13.3
-50
0
50
100
150
200
250
Philippines Thailand Malaysia Indonesia-25
0
25
50
75
100
125
150
31 32 33 34 35 36 37 38 39
Philippines Thailand Malaysia IndonesiaDynamic structural reallocation eectWithin-sector productivity growth eectStatic structural reallocation eect
Note: Subsector classication is based on the ISIC revision 2: code 31 (ood, beverages, and tobacco); 32 (textile, wearing apparel,and leather); 33 (wood and wood products, including urniture); 34 (paper and paper products, printing, and publishing);35 (chemicals and petroleum, coal, rubber, and plastic); 36 (nonmetallic mineral products); 37 (basic metal); 38 (abricatedmetal, machinery and equipment); and 39 (other manuacturing).
Sources: Author’s calculation rom INDSTAT3 2005 and INDSTAT4 2010 (United Nations Industrial Development Organization, variousyears).
Figure 9: Import to Export Ratio o Electronics Products (percent)
0
50
100
150
200
Korea, Rep. of Malaysia Thailand Philippines
1985 1990 1995 2000 2005
Note: Products classied in code 77 in SITC (revision 2).Source: Author’s calculation rom Comtrade database (United Nations, various years).
10 | ADB Economics Working Paper Series No. 252

8/3/2019 Norio Usui, Transforming the Philippine Economy
http://slidepdf.com/reader/full/norio-usui-transforming-the-philippine-economy 19/34
III. Structural TransormationEvolution o the
Product Space
Structural transformation has been the central issue of development. Lucas (1993, 263)mentions that “a growth miracle sustained for decades involves the continual introduction
of new goods, not merely continued learning on a xed set of goods.” Hausmann and
Klinger (2006) and Hidalgo et al. (2007) show that growth and development are the result
of structural transformation, and that, crucially, an economy grows with diversication of
its export basket toward sophisticated products. Imbs and Wacziarg (2003), on the other
hand, show that, as incomes increase, economies rst become less specialized and more
diversied and then, at high income levels, they tend to specialize. These arguments
conrm that “upgrading of export products through diversication” is the key for long-term
growth.
Hausmann and Klinger (2006) analyze the implication of export sophistication for economic growth. They nd that GDP per capita grows with the level of sophistication
of export baskets,5 and that export sophistication robustly predicts subsequent growth.
These ndings matter: the goods that developing countries export today do affect their
future growth. Figure 10 shows the level of sophistication of export baskets (EXPY) of the
Philippines and regional comparators. The Philippines has performed well on the EXPY
score since the late 1970s even compared with the neighbors. This corresponds to the
infusion of foreign electronics industries into the country. The country’s high concentration
on electronics and related products, which have relatively high PRODY scores, in its
export basket led to the increasing EXPY. However, the Philippines’ industrial sector
has stagnated and could not become the key growth engine for the last 3 decades. This
5 Following Hausmann and Klinger (2006), the level o sophistication o a country’s export baskets (EXPY) ismeasured in two steps. For each product, compute the weighted average o real per capita incomes (GDPPC, inconstant 2000 $) o the countries exporting that product with comparative advantage, where the weights are
Balassa’s revealed comparative advantage (RCA) index in that product o exporting countries. This index is called
PRODY, which gives us the income or productivity level associated with a product. The EXPY or a country is thencomputed as the weighted average o the PRODY o the country’s export basket, where the weights are the share
o each product in the country’s total exports.
PRODY (o product i ) and EXPY (o country C ) are dened as:
PRODY
xval
xval
xval
xval
i
ci
ci
i
ci
ci
i
c
=
∑
∑∑
×∑c
c GDPPC
where xval ci is the export value o product i by country C . Using trade data rom UN Comtrade and GDP per capita
data rom the World Bank's World Development Indicators, PRODYs are calculated or 773 products (dened in theSITC revision 2 at 4 digit aggregate level) or the period 2004–2006. The average PRODY rom 2004 to 2006 is then
used to construct the EXPY index.
EXPY xval
xval
PRODY c
ci
ci
i
i
i
= ×
∑∑
Transforming the Philippine Economy: “Walking on Two Legs” | 11

8/3/2019 Norio Usui, Transforming the Philippine Economy
http://slidepdf.com/reader/full/norio-usui-transforming-the-philippine-economy 20/34
nding contradicts with the argument that a country with a sophisticated export basket
can grow faster. To ll the gap, we need to analyze another key aspect of structural
transformation, product diversication.
Hausmann and Klinger (2006) examine the key determinants of product diversication.They argue that each product requires highly specic inputs, such as knowledge, physical
assets, intermediate inputs, labor training requirements, infrastructure, property rights,
regulatory requirements, and other public goods. But this specicity is relative. For
example, human, physical, and institutional capabilities for producing cotton trousers are
similar to those needed to produce cotton shirts; and signicantly different from those
needed to produce computer monitors. Cotton trousers and shirts may involve similar
capabilities, but trousers and computer monitors involve very different ones.6 Hidalgo et
al. (2007) apply network theory and develop the concept of “product space” to visualize
“distance” between products by their relative similarities in needed capabilities.
Figure 10: Level o Sophistication o Export Baskets (EXPY)
1960 65
Malaysia
Philippines
Thailand
Viet Nam
China, People’s Rep. of
70 75 80 85 90 95 2000 05 2010
12,000
10,000
8,000
6,000
2,000
E X P Y
♦
x
Source: Author’s calculation.
6 Hidalgo et al. (2007) capture this notion o similarity between a pair o products, called “proximity”, by observing
trade outcomes rather than by looking at physical similarities between products or their inputs. I every countrythat exports a product also exports another product, then these two products must involve similar capabilities. On
the other hand, i every country that exports a product does not export another product, then these two productsmust involve dierent capabilities. This led to the use o conditional probabilities to measure the similaritybetween the two products. “Proximity” is measured as the minimum between the probability that countries export
product i given that they already export product j; and the probability that countries export product j given thatthey already export product i . The reason or taking the minimum o the two probabilities is to create a symmetric
measure o distance or a pair o products. Formally, the proximity between products i and j is dened as:
ϕ ij i j j i P x x P x x = = =( ) = =( ){ }min | , | ,1 1 1 1
where x i =1 implies that, or every country C and commodity i , RCAci > 1.
12 | ADB Economics Working Paper Series No. 252

8/3/2019 Norio Usui, Transforming the Philippine Economy
http://slidepdf.com/reader/full/norio-usui-transforming-the-philippine-economy 21/34
The product space is shown in Figure 11. The different circles (nodes) represent
products, and the node size is proportional to world trade value. Colors represent different
product groups according to factor intensity. The colors of the lines that connect the
nodes represent the distance (proximity) between a pair of products.7 The product space
is highly heterogeneous: in the dense part (or the core part), many products, particularlymachinery, chemicals, and other capital-intensive products, are closely connected to each
other; while in the periphery, products such as natural resources and primary products
are only weakly connected to others. There are some groupings among the peripheral
products, such as petroleum products (the large red nodes on the upper left side of the
network), garments (the very dense cluster at the middle left), and raw materials (upper
right). The heterogeneity means that products in the core part involve capabilities that can
be redeployed to produce many other products, but those in the periphery cannot. Thus,
countries that have already established comparative advantage in a well-connected part
of the product space can move to other products with much more ease than those that
have export products in the periphery.
Figure 11: Product Space
Source: Hidalgo et al. (2007).
7 Red line shows the closest link, ollowed by dark blue, yellow, and light blue. Each product is connected to its
closest neighbor and to all others that are at distances that correspond to either red or dark blue lines.
Transforming the Philippine Economy: “Walking on Two Legs” | 13

8/3/2019 Norio Usui, Transforming the Philippine Economy
http://slidepdf.com/reader/full/norio-usui-transforming-the-philippine-economy 22/34
To visualize the degree of structural transformation of the Philippine economy, we
highlight, using black squares, the products in which the country has comparative
advantage in 1975, 1985, 1995, and 2006 (Figure 12). By 1975, the Philippines
had developed comparative advantage in most garment products in addition to the
traditional agricultural and forest products. In the following decade, the country acquiredcomparative advantage in a few electronics products by attracting foreign investors. The
country has continued to establish comparative advantage in more electronics products in
the next 2 decades. However, even in 2006, there were only a few new black squares in
the core area of the product space, which supports the previous argument that success in
electronics has not spilled over to more sophisticated industrial products. Since 1995, the
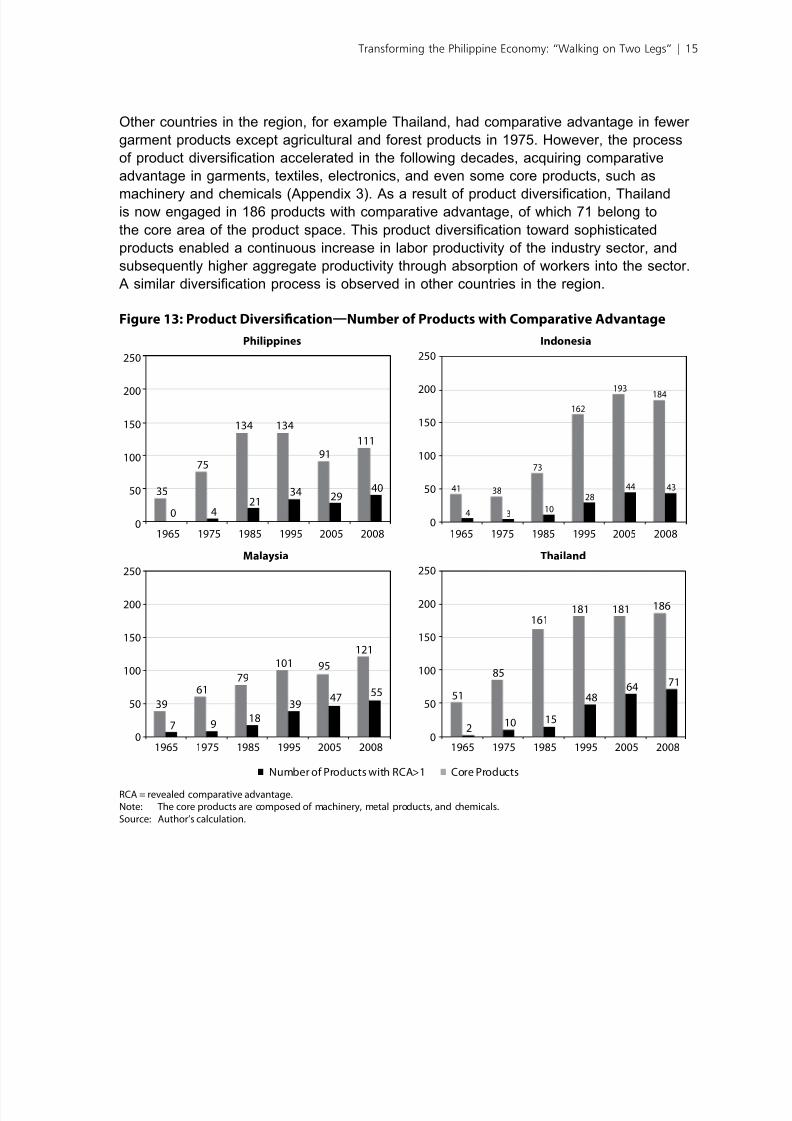
number of products with comparative advantage in the Philippines has decreased to 111
in 2008, of which the number of core products is limited to 40 (Figure 13).
Figure 12: The Philippines’ Evolution in the Product Space
1975 1985
1995 2006
Source: Author’s calculation.
14 | ADB Economics Working Paper Series No. 252
8/3/2019 Norio Usui, Transforming the Philippine Economy
http://slidepdf.com/reader/full/norio-usui-transforming-the-philippine-economy 23/34
Other countries in the region, for example Thailand, had comparative advantage in fewer
garment products except agricultural and forest products in 1975. However, the process
of product diversication accelerated in the following decades, acquiring comparative
advantage in garments, textiles, electronics, and even some core products, such as
machinery and chemicals (Appendix 3). As a result of product diversication, Thailandis now engaged in 186 products with comparative advantage, of which 71 belong to
the core area of the product space. This product diversication toward sophisticated
products enabled a continuous increase in labor productivity of the industry sector, and
subsequently higher aggregate productivity through absorption of workers into the sector.
A similar diversication process is observed in other countries in the region.
Figure 13: Product Diversifcation—Number o Products with Comparative Advantage
0
50
100
150
200
250
1965 1975 1985 1995 20082005
Number of Products with RCA>1 Core Products
0
50
100
150
200
250
1965 1975 1985 1995 20082005
0
50
100
150
200
250
1965 1975 1985 1995 200820050
50
100
150
200
250
1965 1975 1985 1995 20082005
Philippines Indonesia
Malaysia Thailand
35
75
134 134
91
111
0 421
3429
40
51
85
161
181 181 186
210 15
4864
71
41 38
73
162
193184
4 310
28
44 43
39
61
79
101 95
121
7 918
3947
55
RCA = revealed comparative advantage.Note: The core products are composed o machinery, metal products, and chemicals.Source: Author’s calculation.
Transforming the Philippine Economy: “Walking on Two Legs” | 15

8/3/2019 Norio Usui, Transforming the Philippine Economy
http://slidepdf.com/reader/full/norio-usui-transforming-the-philippine-economy 24/34

8/3/2019 Norio Usui, Transforming the Philippine Economy
http://slidepdf.com/reader/full/norio-usui-transforming-the-philippine-economy 25/34
Figure 14: Booming Business Process Outsourcing
5,288
0
1,000
2,000
3,000
4,000
5,000
6,000
2004 2005 2006 2007 20080.0
2.0
4.0
6.0
8.0
10.0
12.0
Other BPOsSoftware developmentAnimation TranscriptionContact centerPercent of total export of goods and services (RHS)
355,135
0
100,000
200,000
300,000
400,000
500,000
2004 2005 2006 2007 20080.0
0.2
0.4
0.6
0.8
1.0
Other BPOsSoftware developmentAnimation
TranscriptionContact centerPercent of total labor force (RHS)
Export ($ million) Employment (persons)
BPO = business process outsourcing, RHS = right hand side.Note: “Other BPOs” include backroom operations, data processing, database activities, online distribution o electronic content,
nancial and accounting services, and business and management consultancy services.Sources: Survey o IT and IT-enabled services (Bangko Sentral ng Pilipinas 2007 and 2008).
With the sharp increase in exports, the BPO industry has also contributed to job creation.
Total employment in the BPO industry reached to 0.36 million in 2008 from less than 0.1
million in 2004. Contact centers remain the top employer among the BPO categories,
accounting for 60% of total employment. However, the BPO industry still employs lessthan 1% of the total labor force of the country, where about 7.5% of the total labor force
(2.8 million workers in 2008) are unemployed and 18.9% are underemployed (7.2 million
workers). Since one of the minimum qualications for employment in the BPO industry is
a college degree, job opportunities in the BPO industry can benet workers with tertiary
education. There are 1.1 million unemployed and 1.4 million underemployed workers
with tertiary education in 2008. However, it must not be overlooked that the Philippines
has a total of 7.6 million workers with primary and secondary education who have been
suffering from limited job opportunities as well (Figure 15). Further, it is estimated that
the country’s labor force will increase to 52 million in 2030 from 38 million in 2008 (Felipe
and Hasan 2006, Brooks 2002). The BPO industry cannot answer the huge employment
needs of the unskilled labor.
Transforming the Philippine Economy: “Walking on Two Legs” | 17

8/3/2019 Norio Usui, Transforming the Philippine Economy
http://slidepdf.com/reader/full/norio-usui-transforming-the-philippine-economy 26/34
Figure 15: Employment Status, 2008
1.3
1.1
3.1
2.8
1.4
9.0
10.7
8.1
0.4
0 5 10 15
Primaryeducation
Secondaryeducation
Tertiaryeducation
Unemployed Underemployed Employed
3.4
8.7 10.3
24.8
19.213.1
0.0
10.0
20.0
30.0
PrimaryEducation
SecondaryEducation
TertiaryEducation
Unemployed Underemployed
Labor Force by Educational Attainment
(million person)
Unemployment and Underemployment Rates
by Educational Attainment (%)
Source: Author’s calculation based on Labor Force Survey (NSCB 2008).
Another aspect of assessing the BPO industry is its linkages with the rest of the economy.
Even if the BPO industry cannot make a direct contribution to job creation, it may
induce job opportunities in other sectors in the economy through forward and backward
linkage effects. Forward linkages measure the relative importance of the BPO industry
as a supplier to other sectors, whereas backward linkages capture its importance as a
demander for other sectors. Ramos et al. (2007) estimated the linkage effects of the BPO
sector based on the 2000 input–output (I-O) table8 and found that the industry’s forward
and backward linkage indices are 0.04 and 0.45, respectively. These are substantially
lower than that of other sectors, suggesting the limited linkage effect of the BPO industryin both directions.
The manufacturing sector has the highest intersectoral linkages (forward and
backward linkage indices are 2.9 and 1.3, respectively) in the economy. This implies
that manufacturing is the leading sector that can stimulate growth in other sectors. If
manufacturing could have a higher share, an expansion of the sector would create higher
growth through its strong linkage effects with other sectors. Unfortunately, the Philippine
economy has shifted toward services and the share of manufacturing has declined over
the years.
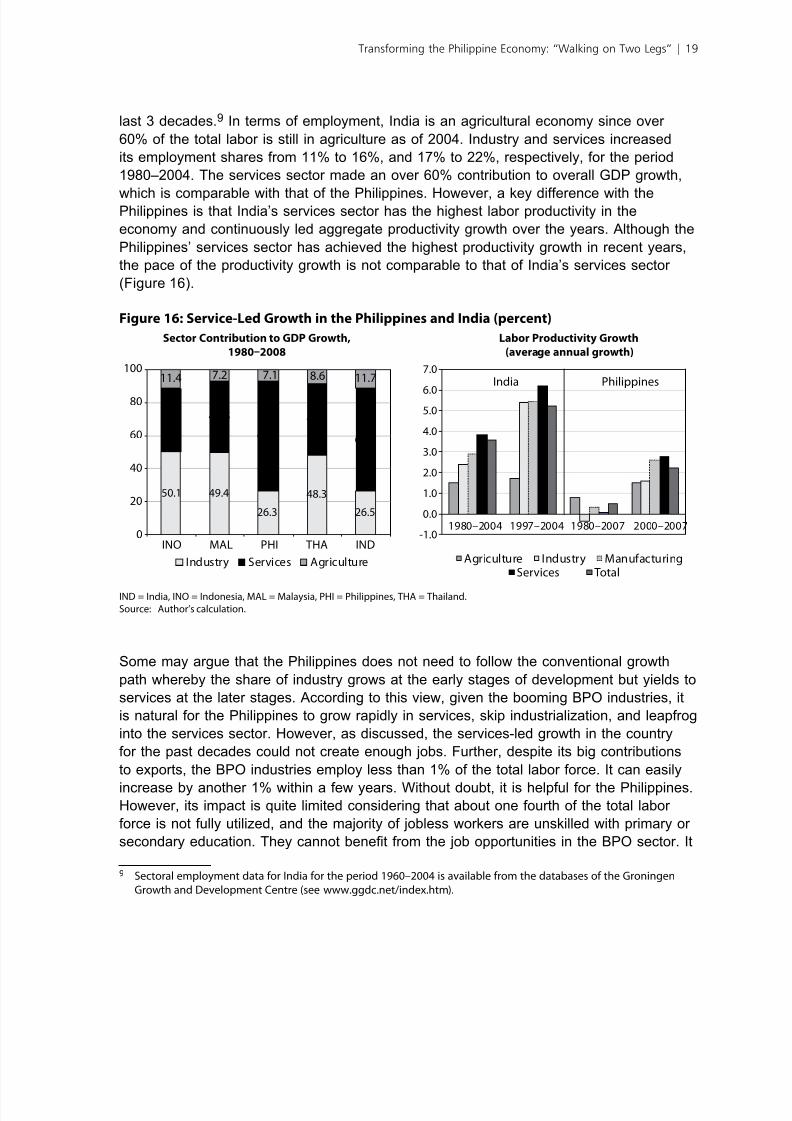
India’s steady growth (by about 6% per year over 2 decades) has been focused since
the growth has been driven more by services than by industry. While industry’s share
of GDP remained at around 25%, services’ share jumped to 57% from 38% over the
8 The latest input-output (IO) table or the Philippines is 2000, which covers the 240 by 240 industries andcommodities. The 2000 IO table includes several new industries such as the semiconductor industry, call centers,
and computer hardware and sotware development.
18 | ADB Economics Working Paper Series No. 252
8/3/2019 Norio Usui, Transforming the Philippine Economy
http://slidepdf.com/reader/full/norio-usui-transforming-the-philippine-economy 27/34
last 3 decades.9 In terms of employment, India is an agricultural economy since over
60% of the total labor is still in agriculture as of 2004. Industry and services increased
its employment shares from 11% to 16%, and 17% to 22%, respectively, for the period
1980–2004. The services sector made an over 60% contribution to overall GDP growth,
which is comparable with that of the Philippines. However, a key difference with thePhilippines is that India’s services sector has the highest labor productivity in the
economy and continuously led aggregate productivity growth over the years. Although the
Philippines’ services sector has achieved the highest productivity growth in recent years,
the pace of the productivity growth is not comparable to that of India’s services sector
(Figure 16).
Figure 16: Service-Led Growth in the Philippines and India (percent)
Sector Contribution to GDP Growth, Labor Productivity Growth
1980–2008 (average annual growth)
Philippines
50.1 49.4
26.3
48.3
26.5
38.5 43.5
66.6
43.2
61.9
11.4 7.2 7.1 8.6 11.7
0
20
40
60
80
100
INO MAL PHI THA IND
Industry Services Agriculture
-1.0
0.0
1.0
2.0
3.0
4.0
5.0
6.0
7.0
1980–2004 1997–2004 1980–2007 2000–2007
India
Agriculture Industry ManufacturingServices Total
IND = India, INO = Indonesia, MAL = Malaysia, PHI = Philippines, THA = Thailand.Source: Author’s calculation.
Some may argue that the Philippines does not need to follow the conventional growth
path whereby the share of industry grows at the early stages of development but yields to
services at the later stages. According to this view, given the booming BPO industries, it
is natural for the Philippines to grow rapidly in services, skip industrialization, and leapfrog
into the services sector. However, as discussed, the services-led growth in the country
for the past decades could not create enough jobs. Further, despite its big contributions
to exports, the BPO industries employ less than 1% of the total labor force. It can easily
increase by another 1% within a few years. Without doubt, it is helpful for the Philippines.However, its impact is quite limited considering that about one fourth of the total labor
force is not fully utilized, and the majority of jobless workers are unskilled with primary or
secondary education. They cannot benet from the job opportunities in the BPO sector. It
9 Sectoral employment data or India or the period 1960–2004 is available rom the databases o the Groningen
Growth and Development Centre (see www.ggdc.net/index.htm).
Transforming the Philippine Economy: “Walking on Two Legs” | 19

8/3/2019 Norio Usui, Transforming the Philippine Economy
http://slidepdf.com/reader/full/norio-usui-transforming-the-philippine-economy 28/34
should also not be overlooked that the country’s total labor force is expected to increase
by over 14 million in the next 2 decades.10
V. Concluding Remarks
This paper analyzes the long-term growth of the Philippine economy to clarify the root
causes of the country’s lagged growth performance in the regional context through the
lens of structural transformation. A decomposition of aggregate productivity growth shows
that unlike other countries in the region, both productivity growth in an individual sector
and sectoral reallocation of labor did not make signicant contributions to economywide
productivity growth. Minor growth in the aggregate productivity came from the labor
shift from agriculture to services, whose productivity has stagnated but is higher than
agriculture. This is a sharp contrast with other countries where economywide productivity
increased through continual improvement of sector productivity and labor shift toward
high-productivity sectors.
The evolution of the Philippines’ product space shows that, despite the increasing level
of sophistication of the country’s export basket, the process of industrial diversication
has stagnated over the years. Although the Philippines was successful in attracting
foreign direct investment to the electronics industry, it has not translated into a
deepening of industrial capabilities. Indeed, the Philippine economy has accumulated
capabilities to jump to more skill- and research-intensive segments of electronics and
more sophisticated products such as machinery and chemicals. However, incentives to
utilize the productive capabilities for diversifying the production structure toward more
sophisticated goods have been weakened by several impediments such as persistent
underprovision of basic infrastructure and poor business and investment climate.
The root cause of the Philippines’ poor growth performance is a chronic productivity
growth decit due to stagnant industrialization, in particular slow product diversication.
The chronic problems of the economy—high unemployment, slow poverty reduction, and
stagnant investment—are reections of this stagnant industrialization. The Philippines’
biggest need is employment opportunities for the growing working-age population.
The services-led growth in the Philippines has not created adequate jobs. Over the years,
the country has continued to suffer the highest unemployment (and underemployment)rates in the region. Even in the latest growth episode, over one fourth of the total
labor force has not been fully utilized. Since the early 2000s, the BPO industry has
10 India aces the same challenge. Although the services sector has led the rapid growth o the economy, its impact
on job creation has been limited, given the large amount o unskilled labor. See, or example, Eichengreen andGupta (2010), Panagariya (2008), and Subramanian (2008). It is also useul to see a dierent view on India’s
services-led growth in Ghani (2010).
20 | ADB Economics Working Paper Series No. 252

8/3/2019 Norio Usui, Transforming the Philippine Economy
http://slidepdf.com/reader/full/norio-usui-transforming-the-philippine-economy 29/34
mushroomed and the country has become the third largest global BPO destination.
However, the BPO industry still employs less than 1% of the total labor force, and its
labor demand is biased toward relatively skilled workers. Given the large amount of
underutilized unskilled labor and the prospect of a further increasing labor force in the
country, it is difcult to expect the BPO industry to be a savior for the Philippine economy.
In the near term, the Philippines’ services-led growth can be sustained thanks to strong
consumption backed by remittance inows and the booming BPO industry. However,
a strong growth of manufacturing is essential to deal with the country’s long-term
development challenges of job creation and poverty reduction. This is not to suggest that
the growing services sector, in particular the BPO industry, should not be a centerpiece
of the long-term development strategy. To be sure, the BPO industry is helpful. However,
it is not realistic to believe that the BPO industry can allow the economy to leapfrog the
process of industrialization. Without dynamic industrial development, the country will
continue to suffer from the long-standing problems of high employment, slow poverty
reduction, and stagnant investment. What the Philippines needs is to “walk on two legs”,both industry and services, to pave the way for a higher, sustained, and more inclusive
growth.
A rst step forward is to push reforms to address the long-standing challenges such as
underprovision of basic infrastructure and weak investment and business environment, to
ensure that the economy can walk on two legs. Fiscal consolidation is an urgent agenda
for increasing spending on infrastructure, since public investment has been constrained
by decades of weak revenue performance and poor expenditure management (Usui
2010). The business community has been seriously hindered by cumbersome business
procedures and overregulation, weak contract enforcement and property rights, and
rigid labor market regulations. Concrete actions to improve the country’s business andinvestment climate are urgent.
The Philippines needs strong and sustainable growth that can create rapidly expanding
demand for its workers. Transformation of the economy requires a long-term vision for the
economy, and this vision needs to be supported by strong political leadership that places
a high priority on growth. The governments in successful Asian countries intervened in
their economies with strategic public investments and even direct support to the private
sector to reshape their comparative advantages. Competent technocrats designed and
implemented appropriate policies to remove constraints impeding the development of
the industry sector (Jomo 2001). The Philippines can be an integral part of regional and
global production networks. The challenge to industrialize cannot wait.
Transforming the Philippine Economy: “Walking on Two Legs” | 21
8/3/2019 Norio Usui, Transforming the Philippine Economy
http://slidepdf.com/reader/full/norio-usui-transforming-the-philippine-economy 30/34
Appendix 1: Labor Productivity, 19802007
0
1,500
3,000
4,500
6,000
7,500
1980 83 86 89 92 95 98 01 04 07
1980 83 86 89 92 95 98 01 04 07
0
2,500
5,000
7,500
10,000
12,500
Indonesia Philippines
Thailand Malaysia (RHS)
Aggregate Labor Productivity
Labor Productivity by Sector
Philippines Indonesia
Malaysia Thailand
0
2,000
4,000
6,000
8,000
10,000
12,000
0
2,000
4,000
6,000
8,000
10,000
12,000
0
5,000
10,000
15,000
20,000
25,000
0
2,000
4,000
6,000
8,000
10,000
12,000
1980 83 86 89 92 95 98 01 04 07
1980 83 86 89 92 95 98 01 04 07 1980 83 86 89 92 95 98 01 04 07
Agriculture IndustryServices Manufacturing
RHS = right hand side.Note: Values in constant 2000 $ prices.Source: Author’s calculation.
22 | ADB Economics Working Paper Series No. 252

8/3/2019 Norio Usui, Transforming the Philippine Economy
http://slidepdf.com/reader/full/norio-usui-transforming-the-philippine-economy 31/34
Appendix 2: Labor ProductivityManuacturing,
19802006
Labor Productivity of the Manufacturing Sectors
Labor Productivity of Manufacturing Subsectors
Philippines Indonesia
Malaysia Thailand
0
5,000
10,000
15,000
20,000
Indonesia MalaysiaPhilippines Thailand
0
5,000
10,000
15,000
20,000
25,000
31 32 33 34 35 36 37 38 39 31 32 33 34 35 36 37 38 39
1980 2006
35
1982 2006
35
1982 2006
35
1980 2006
0
5,000
10,000
15,000
20,000
25,000
31 32 33 34 36 37 38 39 31 32 33 34 36 37 38 39
58,150
0
5,000
10,000
15,000
20,000
25,000
0
5,000
10,000
15,000
20,000
25,000
1 98 0 82 8 4 8 6 8 8 9 0 92 9 4 9 6 98 20 00 0 2 04 0 6
Note: Values in constant 2000 $ prices. Subsector classication is based on the ISIC revision 2: code 31 (ood, beverages, andtobacco); 32 (textile, wearing apparel, and leather); 33 (wood and wood products, including urniture); 34 (paper andpaper products, printing and publishing); 35 (chemicals and petroleum, coal, rubber, and plastic); 36 (nonmetallic mineralproducts); 37 (basic metal); 38 (abricated metal, machinery and equipment); and 39 (other manuacturing).
Source: Author’s calculation.
Transforming the Philippine Economy: “Walking on Two Legs” | 23
8/3/2019 Norio Usui, Transforming the Philippine Economy
http://slidepdf.com/reader/full/norio-usui-transforming-the-philippine-economy 32/34
Appendix 3: Thailand’s Evolution in the Product Space
1975 1985
1995 2006
Source: Author’s calculation.
24 | ADB Economics Working Paper Series No. 252
8/3/2019 Norio Usui, Transforming the Philippine Economy
http://slidepdf.com/reader/full/norio-usui-transforming-the-philippine-economy 33/34
Selected Reerences
ADB. 2007. Philippines: Critical Development Constraints. Asian Development Bank, Manila.Bocchi, M. A. 2008. Rising Growth, Declining Investment: The Puzzle of the Philippines. Policy
Research Working Paper 4472, World Bank, Washington, DC.Brooks, R. 2002. Why is Unemployment High in the Philippines? IMF Working Paper 02/23,
International Monetary Fund, Washington, DC.Eichengreen, B., and P. Gupta. 2010. The Service Sector as India’s Road to Economic Growth?
Indian Council for Research on International Economic Relations Working Paper 249, NewDelhi.
Felipe, J., and R. Hasan. 2006. “Labor Market Outcomes in Asia.” In J. Felipe and R. Hasan, eds.,Labor Markets in Asia: Issues and Perspectives. London: Palgrave Macmillan.
Ghani, E. 2010. The Service Revolution in South Asia. New Delhi: Oxford University Press.Hausmann, R., and B. Klinger. 2006. Structural Transformation and Patterns of Comparative
Advantage in the Product Space. CID Working Paper 128, Center for InternationalDevelopment, Harvard University, Massachusetts.
Heston, A., R. Summers, and B. Aten. 2009. Penn World Table 6.3. Center for International
Comparisons of Production Incomes and Prices, University of Pennsylvania.Hidalgo, C. A., B. Klinger, A.-L. Barabási, and R. Hausmann. 2007. “The Product Space and its
Consequences for Economic Growth.” Science 317:482–87.Imbs, J., and R. Wacziarg. 2003. “Stages of Diversication.” American Economic Review 93(1):63–
86.Jomo, S. K. 2001. “Rethinking the Role of Government Policy in Southeast Asia”. In J. E Stiglitz
and S. Yusuf, eds., Rethinking the East Asian Miracle. New York: World Bank and OxfordUniversity Press.
Lucas, R. E. Jr. 1993. “Making a Miracle.” Econometrica 61(2):251–72.Reyes-Macasaquit, M. 2009. “Case Study of the Electronics Industry in the Philippines: Linkages
and Innovation.” In P. Intarakumnerd, ed., Fostering Production and Science & TechnologyLinkages to Stimulate Innovation in ASEAN. ERIA Research Project Report 2009 No. 7-4,Economic Research Institute for ASEAN and East Asia, Jakarta.
National Statistical Coordination Board. 2011. 2009 Ofcial Poverty Statistics. Makati City.Panagariya, A. 2008. India: The Emerging Giant . London: Oxford University Press.Ramos, N., G. E. Estrada, and J. Felipe. 2007. “An Input-Output Analysis of the Philippine BPO
Industry.” Paper presented at the 10th National Convention on Statistics, October, Manila.Rodrik, D. 2006. “Industrial Development: Stylized Facts and Policies.” Harvard University,
Massachusetts. Mimeo.Subramanian, A. 2008. India’s Turn: Understanding the Economic Transformation. London: Oxford
University Press.Usui, N. 2010. Tax Reforms towards Fiscal Consolidation: Policy Options for the New
Administration. PhCO Policy Note July 2010, Philippines Country Ofce, Asian DevelopmentBank, Manila.
World Bank. World Development Indicators. Available: http://data.worldbank.org/data-catalog/world-
development-indicators.
Transforming the Philippine Economy: “Walking on Two Legs” | 25

8/3/2019 Norio Usui, Transforming the Philippine Economy
http://slidepdf.com/reader/full/norio-usui-transforming-the-philippine-economy 34/34
About the Paper
Norio Usui analyzes the long-term growth of the Philippine economy through the lensof structural transformation to clarify the root causes of the country’s lagged growthperformance in the regional context. The main culprit behind lagging growth is a chronicproductivity growth deficit as a result of stagnant industrialization. High unemployment,slow poverty reduction, and stagnant investment are a reflection of stagnant
industrialization.
About the Asian Development Bank
ADB’s vision is an Asia and Pacific region free of poverty. Its mission is to help itsdeveloping member countries reduce poverty and improve the quality of life of theirpeople. Despite the region’s many successes, it remains home to two-thirds of theworld’s poor: 1.8 billion people who live on less than $2 a day, with 903 millionstruggling on less than $1.25 a day. ADB is committed to reducing poverty throughinclusive economic growth, environmentally sustainable growth, and regionalintegration.
Based in Manila, ADB is owned by 67 members, including 48 from the region. Its
main instruments for helping its developing member countries are policy dialogue, loans,equity investments, guarantees, grants, and technical assistance.
Asian Development Bank 6 ADB Avenue, Mandaluyong City1550 Metro Manila, Philippineswww.adb.org/economicsISSN: 1655-5252Publication Stock No. WPS113570 < 0 1 1 3 5 7 0 1 >