Nordic Smart Government · Nordic Smart Government 2.0 Business case for Nordic SMEs –Business to...
64
Nordic Smart Government Business Case for Nordic SMEs –business to business
Transcript of Nordic Smart Government · Nordic Smart Government 2.0 Business case for Nordic SMEs –Business to...

Nordic Smart
Government
Business Case for Nordic
SMEs –business to business
Nordic Smart Government 2.0
Business case for Nordic SMEs –Business to business
Ernst & Young P/S - Osvald Helmuths Vej 4 - P.O. Box 250 - 2000 Frederiksberg - Denmark - CVR no. 30 70 02 28 Report_NSG_Final_010218.docx
1
Contents
1 Executive summary 2
2 Introduction 7 2.1 NSG: The vision 7
3 Nordic and country specific business case 8 3.1 Nordic business case 8 3.2 Denmark: business case 10 3.3 Finland: business case 11 3.4 Iceland: business case 12 3.5 Norway: business case 13 3.6 Sweden: business case 14
4 Presentation of effect types and areas 15 4.1 Effect types: primary, secondary, modernisation and transition 16
5 Effect description: financial processes and inventory management 18 5.1 NSG: Digitisation potential 19
6 Effect description: Marketing, business intelligence products and services 22 6.1 Logic of secondary effects related to marketing, business intelligence and services 22 6.2 Effects related to marketing, business intelligence and products 23 6.3 Potential extra effects for third party service providers 25
7 Effect description: Financial Services and Transactions 26 7.1 Logic of effects related to financial services and transactions 26 7.2 Description of credit cycle 27 7.3 Potential released through Financial Services and Transactions 28
8 Presentation of archetypes 31 8.1 Agriculture, Forestry and Fisheries: Archetype characteristics and NSG potential 32 8.2 Production & Construction: Archetype characteristics and NSG potential 34 8.3 Retail: Archetype characteristics and NSG potential 35 8.4 Service: Archetype characteristics and NSG potential 36 8.5 Financial institutions 37 8.6 Other 37
9 Digital maturity and ICT usage in the Nordic countries 39
10 Methodology 40 10.1 Data collection 40 10.2 Nordic validation process 42 10.3 Estimations 42
11 Appendix 46 11.1 Population data 46 11.2 Assumptions 47

Nordic Smart Government 2.0
Business case for Nordic SMEs –Business to business
2
1 Executive summary
NSG provides a vision of open, accessible financial and economic data and automated exchange of business data in the Nordic small and medium-sized enterprises (SMEs). The purpose is to share and utilise data more efficiently, avoid manual processes and extract the full value embedded in data, digitisation and automation. The report at hand seeks to estimate the value potential of this visionary concept.
The vision is implemented by establishing a digital ecosystem, which enables SMEs automatically and in real-time to share relevant economic and financial data. In essence it enables automatic flow of data between businesses and government authorities, which seek to meet the wish of both effective public administration, reduced administrative burdens on the businesses, as well as access to and use of a broad range of relevant data.
This analysis focuses on the potential benefits of NSG in the business-to-business processes and internal business processes thus disregarding the potential benefits in the government-to-business processes.
NSG drives and enables several potential benefits for the Nordic SMEs and hence for the financial institutions offering services to them. The potential benefits include amongst others more efficient business processes, better resource utilisation through analytics and more transparency in the financial market. Furthermore, the data will allow development of new data-driven products and services.
The main quantitative effects will arise from better utilisation of financial and economic data. Both the firm sharing its data and other firms can utilise the data resources to analyse and optimise their businesses both internally in terms of process optimisation and externally in relation to prizing and marketing initiatives.
The estimated potential is significant, but requires a very substantial increase in business maturity in terms of digital capabilities, competencies and digital behaviour in the coming years. Thus, a 10-year phase-in period is expected before the vision is fully realised in 2027.
The analysis carried out shows a significant upside for the Nordic SMEs within the following four overall main effects:
► Financial and inventory management
► Marketing, business intelligence and products
► Banking and finance
► Market liquidity
The value contribution of the estimated effect within each of these areas is aggregated in the table below and shown in a separate bubble chart, in the figure below.
Table 1: Business case (full implementation in 2027)
Business case (EURm)*
Denmark Norway Sweden Iceland Finland Total
Financial and inventory management 30 - 50 50 - 85 65 - 105 2 - 4 25 - 40 175 - 280 Marketing, business intelligence and services 2,600 - 2,850 4,400 - 4,900 5,150 - 5,700 205 - 225 2,150 - 2,400 14,550 - 16,100
- From cost data 550 - 610 940 - 1,040 1,100 - 1,220 40 - 50 460 - 510 3,100 – 3,400
- From revenue data 2,040 -
2,250 3,500 - 3,650 4.050 - 4,450 160 - 180 1,710 - 1,890 11,450 - 12,700
Banking and finance 135 - 150 220 - 245 385 - 425 15 - 20 160 - 175 920 - 1,000
Market liquidity 1,250 - 1,400 2,050 - 2,250 4,000 - 4,400 190 - 210 1,650 - 1,850 9,150 - 10,100
Total 4,050 - 4,450 6,750 - 7,450 9,600 - 10,650 410 - 460 4,000 - 4,450 24,800 - 27,500
*Rounded numbers, 2017 prices

Nordic Smart Government 2.0
Business case for Nordic SMEs –Business to business
3
NSG is expected to effect financial and inventory management within the SMEs. A further use of automation initiated by NSG will enable the above effects through more digital and real-time processes that are considered a prerequisite for generating the data necessary to drive the effects related to better resource utilisation. This business case shows that more digital and real-time financial and inventory management processes could free up resources within the Nordic SMEs equivalent to EUR 175-280m annually.
Also within marketing, business intelligence and products, significant benefits can be realised based on usage of the data provided within the ecosystem. Access to and use of the financial and economic data have the potential to drive effects within the companies’ own processes leading to optimisations but also in terms of the external processes related to pricing and marketing of goods and services. These effects are expected partially due to development of new products and service based on the data provided by NSG and due to companies using the accessible data in internal process optimisation. This will lead to a potential across the Nordic countries of EUR 14.6-16.1bn. Of this potential, 11.4-12.7bn is estimated to derive from utilisation of revenue data, while the remaining 3.1-3.4bn1 is estimated to derive from cost data.
Lastly, also the financial sector will benefit from more detailed and real-time data on the SMEs made available of the digital ecosystem. The sector is anticipated to integrate the data into credit evaluation processes, and thus enhance process efficiency and cycle times within the financial institutions, resulting in an estimated value corresponding to EUR 920-1,000m from increased efficiency and reduced debtor loss. Further to that, it is expected to increase the financial market liquidity between EUR 9.2bn and 10.1bn as process efficiency and transparency could affect some of the current inefficiencies on the financial markets allowing especially smaller businesses to obtain loans not accessible for them at the time being.
In addition to the benefits mentioned above, the costs relating to acquiring and implementing new solutions and processes that enable the SMEs to interact with the ecosystem are considered transition
1 Rounded numbers.
Figure 1: Business case illustration (full implementation in 2027)
Total estimated NSG value (EUR)
A) Financial & inventory
management
24,800-27,500m
175-
280
m
14,550-
16,100m
B) Marketing, business
intelligence and services
10,100-
11,100m
C) Financial services &
liquidity
11,450-12,700m
3,100-
3,400m
Revenue
Costs
0,920-
1,000m
9,150-10,100m
Efficiency
Liquidity
Requires significant changes in the businesses’ approach towards reporting and sharing of critical business data
Requires that banks and credit providers translates the enhanced transparency, frequency, and quality in data into added market liquidity

Nordic Smart Government 2.0
Business case for Nordic SMEs –Business to business
4
costs. Transition costs are per definition temporary costs, but significant to highlight, as a digital transformation often will be associated with initial investments, while the full benefits arise several years later. This has been taken into account in the phase-in model for NSG. Cost related to establishing and maintaining the ecosystem is not part of the business case.
Danish off-set for Nordic potential
The effects are based on a study consisting of both interviews and survey conducted with nearly 1,000 Danish companies participating. The results from these studies have been applied to the other Nordic countries taking into consideration the digital maturity within the countries, the number of companies within the SME segment, their size and the national labour cost levels (see below). These variables effectively take into account the main differences within the Nordic countries in terms of the sizes of the SME market, the digital maturity within the SME segment and hence the potential of further digitisation, prices and overall level of cost.
While using this approach, it is considered that the similarities between the Nordic countries are more prominent than the differences. That being said, there are still differences in the business structure of each country. An elaboration on this is carried out in the analysis below.
The potential effects for each country are shown below.
EUR 9,600-10,650m
EUR 6,750-7,450m
EUR 4,000-4,450m
EUR 4,050-4,450m
EUR 410-460m
Figure 2: NSG business case across the Nordic countries

Nordic Smart Government 2.0
Business case for Nordic SMEs –Business to business
5
Main elements behind the estimations and assumptions
The drivers used for calculating the individual business cases are shown in the table below.
The business case is based on a very broad range of assumptions about an expected behaviour in a digital ecosystem, which is still in an early phase of its construction. Compared to other business cases on public driven digital initiatives, this case differs in its broad scope and expected effort to be reached and delivered via a large and relative complex digital ecosystem. First of all, because it is based on a
Country Denmark Finland Iceland Norway Sweden
Number of SMEs (‘000) 272 356 40 436 857
Labour cost (index)
1.0 0.7 0.5 1.1 0.7
Digital maturity
index 5.2 5.4 4.9 5.4 5.5
Size index 1.0 0.93 0.95 0.97 0.94
► The business case is based on a study of nearly 1,000 Danish companies, and is thus
based on a Danish context and then extrapolated to a Nordic context quantitatively
adjusted for variance in 1) Number of SMEs and their size, 2) Labour costs and 3) Digital
maturity. This implies e.g. that Sweden will have a higher potential due to the relatively
larger size of the amount of SMEs. Norway will have a relatively higher potential driven by
labour cost and accordingly Iceland will have a higher potential due to its relatively low
maturity index. A low digital maturity is assumed to imply a higher potential from
digitisation and hence NSG.
► Financial and inventory processes: Estimations are based on a best practice scenario, with
NSG accounting for a 2-5% share of the estimated aggregated societal value from
automating and digitising financial and inventory processes in the Nordic SMEs.
► Marketing, business intelligence and services: Estimations are based on full
implementation of NSG leading to both enhanced net growth and competition. The
assumption is that the net growth in revenue from new products and innovation accounts
for 80% of the estimated potential, while the residual 20% is zero-sum through shifting
market shares within the Nordic SMEs.
► Financial services and transactions: The estimates build on OECD data on total value of
loans to SMEs. The estimates are then scaled to the general population for each Nordic
country and within each effect respectively through the usage of a value per SME
estimate.
Note 1: The estimation method is explained more in detail in the methodology part.
Sources: Number of SMEs and size index: Eurostat, DIW Econ, 2016, and national statistics bureaus, 2016. Labour
costs: Eurostat, 2016. Digital Maturity: World Economic Forum’s Network Readiness Index,2016.

Nordic Smart Government 2.0
Business case for Nordic SMEs –Business to business
6
high proportion of data delivery, sharing and interaction from the actors in the ecosystem themselves. Most of all in a substantial rise in digital maturity. To reach the full potential identified, it is therefore very important that all the elements of the NSG initiative and the identified drivers behind are implemented in the coming years.
The method used to identify the business case is designed to handle the complexity and scope of the NSG initiative. The data collected and used in the case are based on a broad mix of inputs, variables and validation methods.
Because of the nature of the initiative, the benefits and potential identified have been dealt with through a relative conservative approach: All benefits are based on 2017 prices, the benefits are not accumulated, and the case is based on a long implementation and realisation period of 10 years.
The NSG is a bold and ambitious initiative that requires a substantial amount of both effort and change in the approach to, sharing of and use of data and in the coming years. It has to be stressed that the business case identified is a rough estimation of an expected potential. The identified potential and benefits need to be interpreted and used with a degree of precaution.
The estimated potential identified in Denmark equals a 0.8-0.9% increase in the Danish GDP. If reached that is substantial. This estimate is, however, a best case estimate based on several assumptions that need be fulfilled before the potential can be realised. As mentioned above, the estimate is calculated based on full implementation amongst all Nordic SMEs and includes benefits derived from fundamentally new use of data that are not accessible today, i.e. data regarding turnover at a detailed level for all companies.

Nordic Smart Government 2.0
Business case for Nordic SMEs –Business to business
7
2 Introduction
2.1 NSG: The vision
The NSG is a vision shared by the five Nordic countries: Denmark, Finland, Iceland, Sweden and Norway. NSG provides a vision of openly accessible financial and economic data in the Nordic SMEs. The vision is implemented by establishing a digital ecosystem, which enables SMEs to share economic and financial data automatically and in real-time.
NSG drives and enables several potential benefits for the Nordic SMEs and financial institutions including more efficient business processes, better resource utilisation through analytics and more transparency in the financial market. Once the ecosystem has been established, Nordic firms can utilise the data resources to analyse and optimise their businesses. Furthermore, the data will allow better credit valuations and development of data-driven products and services.
Data can be found at a highly detailed and standardised level (i.e. entry line level) allowing transparency and usage to be maximised. As such, data are anonymously provided, although exchangeability of the data can be made feasible through mutual consent between two parties, e.g. for the purpose of a credit valuation. Also as a prerequisite for using the available data, the enterprises are requested to consent to the exchange of their data.
2.1.1 Participating countries, scope and context
The NSG vision applies to all SMEs in the five Nordic countries. The business case is carried out for the Nordic Smart Government project with reference to the Danish Business Authority.
The scope of this report is both to conduct one joint cross-Nordic business case, but also to specify the potential for each of the five countries. This business case focuses on the Nordic SMEs as defined by the EU; the staff headcount must be less than 250 and the turnover less than EUR 50m or a total balance sheet less than EUR 43m.
Furthermore, the scope of the business case is processes related to the use or exchange of financial and economic data within and across the SMEs. Thus, internal business processes, business intelligence and business-to-business-processes (B2B) and to some extent business-to-consumer-processes (B2C) are included in the business case. Business-to-government processes (B2G) are not included in this analysis even though B2G processes are expected to experience similar positive outcomes by the initiative. Not every single possible effect derived from the NSG will be addressed in the analysis. Rather, the most likely and significant effects were selected and hypotheses were created in advance of the data collection process. During the data collection and analysis process, the specific effects have been adjusted to the actual findings, which are presented in this report.
The phase-in period for the NSG2 business case is estimated to be 10 years. The phase-in period is anticipated due to a significant incubation and implementation period. NSG implementation will be associated with transition costs in the first years, as especially ERP solutions are a prerequisite for establishing the NSG ecosystem.
The ecosystem and ecosystem that the NSG vision is centred on need to be established and implemented, as well as the digital maturity within and across the Nordic businesses needs to increase, before the entire potential from NSG is released (please see next page). During the first years of the incubation period, initial investments (e.g. in ERP systems) have to be made by many SMEs. The investments are a prerequisite in creating an ecosystem, where all SMEs are integrated and thus enabled to derive the maximum benefits from NSG.

Nordic Smart Government 2.0
Business case for Nordic SMEs –Business to business
8
3 Nordic and country specific business case
3.1 Nordic business case
Cross-Nordic
Table 2: Business case (full implementation)
Effect type Potential (EURm)
Financial and inventory management
175-280
Marketing, business intelligence and products
14,550-16,100
- Hereof driven by cost data
3,100 -3,400
- Hereof driven by revenue data
11,450-12,700
Banking and Finance 920-1,000
Market liquidity 9,150-10,100
Total 24,800-27,500
*Rounded numbers
0
5.000
10.000
15.000
20.000
25.000
30.000
2017 2018 2019 2020 2021 2022 2023 2024 2025 2026 2027
EU
Rm
Figure 3: Anticipated phase-in of NSG (total effects)
The cross-Nordic business case outlines the potential related to fully implementing the NSG vision. It is anticipated that various effect types will arise from NSG. The total potential is estimated to be in the range of EUR 24,800-27,500m annually.
The main quantitative effects will arise from better utilisation of financial and economic data in all the Nordic SMEs. This potential is significant, but requires a substantial rise in business maturity in terms of digital capabilities and competencies. Thus, a 10-year phase-in period is anticipated for NSG implementation within and across the SMEs. The actual effect is expected to materialise in accordance with the implementation of the initiative. In practice from 2021 and onwards.
Furthermore, the financial sector is anticipated to benefit from more detailed and real-time data. The sector is expected to integrate the data into credit evaluation processes, and thus enhance process efficiency and cycle times within the financial institutions as well as increasing the financial market liquidity, as process efficiency and transparency could affect some of the current inefficiencies on the financial markets.
By enabling the above described effects, more digital and real-time financial and inventory management processes could free up resources within the Nordic SMEs equivalent to EUR 175-280m annually. Furthermore, more digital and real-time processes are a prerequisite for generating the data necessary to drive the above effects related to better resource
utilisation.

Nordic Smart Government 2.0
Business case for Nordic SMEs –Business to business
9
Amongst the abovementioned potentials some require more radical change from the participating companies than other. When looking at the potential derived from marketing, business intelligence and services it is important to stress that in order for the SMEs to obtain the benefits related to pricing and marketing it will require a significant change in their way of reporting and sharing more business sensitive data in terms of data related to revenue. Thus the realisation of this potential relies on the SMEs to change and adapt to the requirements in order for the digital ecosystem to function.
Also the potential identified in terms of more liquidity from the financial sector requires that banks and other loan providers adapt to the new transparent and potentially faster business environment and utilise the accessible data to provide new loans and hence liquidity for the SMEs.

Nordic Smart Government 2.0
Business case for Nordic SMEs –Business to business
10
3.2 Denmark: business case
Denmark
Figure 4: Weights in business case*
*Size of circles indicates no. of businesses adjusted for size index
Figure 5: Relative distribution of archetypes
Table 3: Business case (DK)
Effect type Potential (EURm)
Financial and inventory management
30-50
Marketing, business intelligence and products
2,600-2,850
Banking and finance 135-150
Market liquidity 1,250-1,400
Total 4,050-4,450
*Rounded numbers
0% 50% 100%
Denmark
Norway
Sweden
Iceland
FinlandProduction & construction
Retail
Service
Agriculture Forestry &Fishery
Banking & financing
Other
Estimations
Denmark has an estimated potential from implementing NSG in the range EUR 4,050-4,450m annually.
The potential derives primarily from better data utilisation (marketing, business intelligence and products), which accounts for an estimated potential in the range EUR 2,600-2,850m, while data usage in the financial sector accounts for a EUR 135-150m potential from increased sector efficiency and 1,250-1,400m added liquidity potential.
Digitisation of financial and inventory management through NSG accounts for a EUR 30-50m potential.
Characteristics
Size: Denmark has the second lowest number of SMEs amongst the Nordics. The service sector accounts for a relatively larger part of the total population, while the agricultural sector accounts for a relatively smaller part in comparison with the structure in the rest of the Nordics. In general the relative number of micro businesses (1-10 employees) in Denmark is the lowest across the Nordics.
Labour costs: The Danish labour costs are the second highest across the Nordics only surpassed by Norway.
Digital maturity: Denmark has a digital maturity that is marginally lower than Norway, Finland and Sweden. This leaves Denmark with a slightly higher upside from implementing NSG than
the three listed countries.
Nordic Smart Government 2.0
Business case for Nordic SMEs –Business to business
11
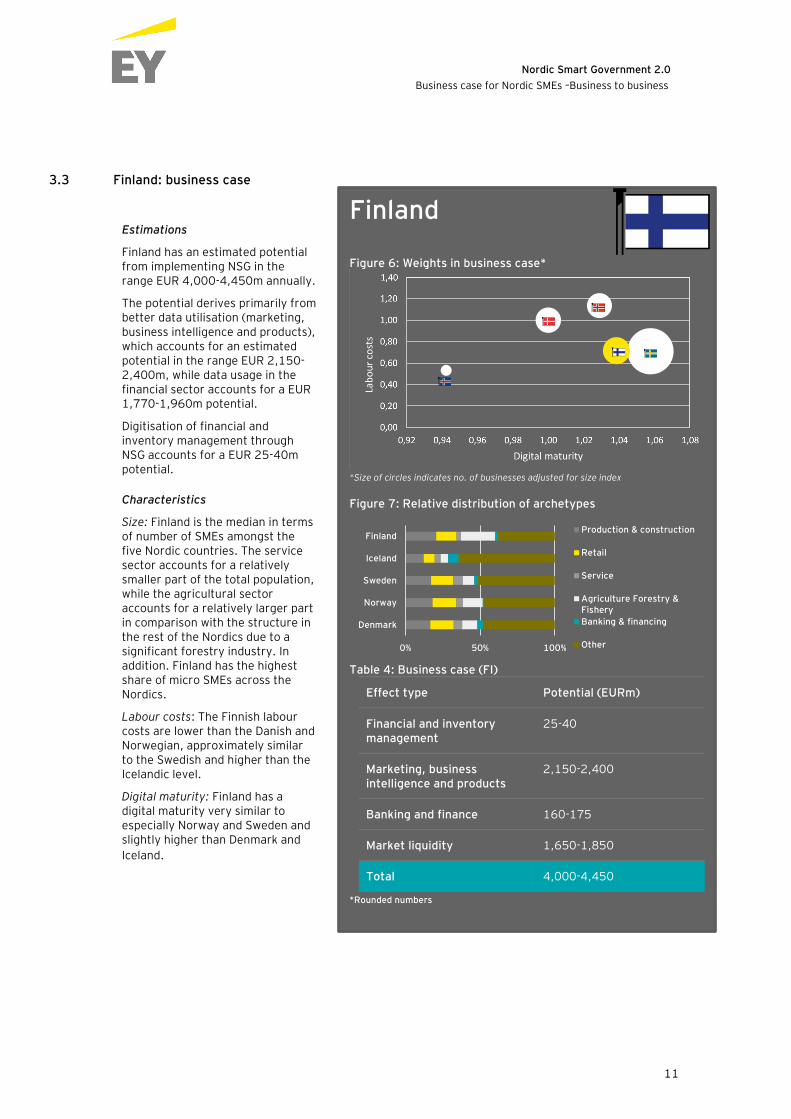
3.3 Finland: business case
Finland
Figure 6: Weights in business case*
*Size of circles indicates no. of businesses adjusted for size index
Figure 7: Relative distribution of archetypes
Table 4: Business case (FI)
Effect type Potential (EURm)
Financial and inventory management
25-40
Marketing, business intelligence and products
2,150-2,400
Banking and finance 160-175
Market liquidity 1,650-1,850
Total 4,000-4,450
*Rounded numbers
0% 50% 100%
Denmark
Norway
Sweden
Iceland
FinlandProduction & construction
Retail
Service
Agriculture Forestry &Fishery
Banking & financing
Other
Estimations
Finland has an estimated potential from implementing NSG in the range EUR 4,000-4,450m annually.
The potential derives primarily from better data utilisation (marketing, business intelligence and products), which accounts for an estimated potential in the range EUR 2,150-2,400m, while data usage in the financial sector accounts for a EUR 1,770-1,960m potential.
Digitisation of financial and inventory management through NSG accounts for a EUR 25-40m potential.
Characteristics
Size: Finland is the median in terms of number of SMEs amongst the five Nordic countries. The service sector accounts for a relatively smaller part of the total population, while the agricultural sector accounts for a relatively larger part in comparison with the structure in the rest of the Nordics due to a significant forestry industry. In addition. Finland has the highest share of micro SMEs across the Nordics.
Labour costs: The Finnish labour costs are lower than the Danish and Norwegian, approximately similar to the Swedish and higher than the Icelandic level.
Digital maturity: Finland has a digital maturity very similar to especially Norway and Sweden and slightly higher than Denmark and
Iceland.

Nordic Smart Government 2.0
Business case for Nordic SMEs –Business to business
12
3.4 Iceland: business case
Iceland Figure 8: Weights in business case*
*Size of circles indicates no. of businesses adjusted for size index Figure 9: Relative distribution of archetypes
Table 5: Business case (IC)
Effect type Potential (EURm)
Financial and inventory management
2-4
Marketing, business intelligence and products
205-225
Banking and finance 15-20
Market liquidity 190-210
Total 410-460
*Rounded numbers
0% 50% 100%
Denmark
Norway
Sweden
Iceland
FinlandProduction & construction
Retail
Service
Agriculture Forestry &Fishery
Banking & financing
Other
Estimations
Iceland has an estimated potential from implementing NSG in the range EUR 410-460m annually.
The potential derives primarily from better data utilisation (marketing, business intelligence and products), which accounts for an estimated potential in the range EUR 205-225m, while data usage in the financial sector accounts for a EUR 15-20m potential in increased efficiency and EUR 190-210m in added market liquidity.
Digitisation of financial and inventory management through NSG accounts for a EUR 2-4m potential.
Characteristics
Size: Iceland is by significant margin the smallest country in the Nordics. The service sector is above average in relative size, while the agricultural sector is below the Nordic average in relative size. In terms of the relative number of micro SMEs Iceland’s share is is quite high compared to especially Denmark, while the share is marginally lower than in Finland and Sweden.
Labour costs: The labour costs in Iceland are the lowest in the Nordics. The average cost per hour is approximately half of the Danish and less than half of the Norwegian.
Digital maturity: Iceland’s digital maturity is lower than its Nordic peers. Thus, the upside from NSG is
anticipated to be above par.

Nordic Smart Government 2.0
Business case for Nordic SMEs –Business to business
13
3.5 Norway: business case
Norway
Figure 10: Weights in business case*
*Size of circles indicates no. of businesses adjusted for size index Figure 11: Relative distribution of archetypes
Table 6: Business case (NO)
Effect type Potential (EURm)
Financial and inventory management
50-85
Marketing, business intelligence and products
4,400-4,900
Banking and finance 220-245
Market liquidity 2,050-2,250
Total 6,750-7,450
*Rounded numbers
0% 50% 100%
Denmark
Norway
Sweden
Iceland
FinlandProduction & construction
Retail
Service
Agriculture Forestry &Fishery
Banking & financing
Other
Estimations
Norway has an estimated annually potential in the range EUR 6,750-7,450m from implementing the NSG.
The potential derives primarily from better data utilisation (marketing, business intelligence and products), which accounts for an estimated potential in the range EUR 4,400-4,900m, while data usage in the financial sector accounts for a EUR 220-245m potential in increased efficiency and EUR 2,050-2,250m in increased market liquidity.
Digitisation of financial and inventory management through NSG accounts for a EUR 50-85m potential.
Characteristics
Size: Norway has more businesses than both Denmark, Finland and Iceland, which have fewer than Sweden. The retail and production/construction sectors are above the Nordic average in relative size, while the agricultural sector is below the Nordic average in relative size. The relative share of micro SMEs is the second lowest in the Nordics, only surpassed by Denmkar
Labour costs: The labour costs in Norway are by significant margin the highest across the Nordics. This implies that Norway has a significant economic potential from digitising and atomising processes in comparison with the Nordic peers.
Digital maturity: Norway’s digital maturity is slightly higher than Denmark’s and Iceland’s, while slightly lower than that of both Finland and Sweden. Thus, the upside from NSG is anticipated to
be correspondently lower.

Nordic Smart Government 2.0
Business case for Nordic SMEs –Business to business
14
3.6 Sweden: business case
Sweden
Figure 12: Weights in business case*
*Size of circles indicates no. of businesses adjusted for size index Figure 13: Relative distribution of archetypes
Table 7: Business case (SE)
Effect type Potential (EURm)
Financial and inventory management
65-105
Marketing, business intelligence and products
5,150-5,700
Banking and finance 385-425
Market liquidity 4,000-4,400
Total 9,600-10,650
*Rounded numbers
0% 50% 100%
Denmark
Norway
Sweden
Iceland
FinlandProduction & construction
Retail
Service
Agriculture Forestry &Fishery
Banking & financing
Other
Estimations
Sweden has an estimated annually potential in the range EUR 9,600-10,650m from implementing the NSG.
The potential derives primarily from better data utilisation (marketing, business intelligence and products), which accounts for an estimated potential in the range EUR 5,150-5,700m, while data usage in the financial sector accounts for a EUR 385-425m potential in increased efficiency and an estimated EUR 4,000-4,400m increase in market liquidity.
Digitisation of financial and inventory management through NSG accounts for a EUR 65-105m potential.
Characteristics
Size: Sweden has more businesses than all other Nordic countries (index 3.15 compared to DK). The production/construction, agriculture (incl. forestry) and retail sectors account for a relatively large relative share of the SMEs, while the service sector is below the Nordic average in relative weight. In addition, the relative share of micro SMEs is the second highest in the Nordics.
Labour costs: The labour costs in Sweden are below the Danish and Norwegian and approximately equal to the Finnish.
Digital maturity: Sweden’s digital maturity is slightly higher than its Nordic peers. Thus, the upside from NSG is anticipated to be
correspondently lower.

Nordic Smart Government 2.0
Business case for Nordic SMEs –Business to business
15
4 Presentation of effect types and areas
The cross-Nordic business case outlines the potential related to fully implementing the NSG vision. In order to grasp this potential, three overall main effects have been investigated.
► Financial processes and inventory management in the SMEs to become more digital and automated
► Enabling better marketing, business intelligence and data utilisation in the SMEs through establishing a data ecosystem containing financial and economic data from the Nordic SMEs
► Financial services and transactions. More efficient credit evaluations and more credit in the lending market due to more transparency gained by the data ecosystem.
The business case is built up around series of variables that each addresses relevant dimensions in the business case.
Firstly, the effects are divided into main effects as described above, which are functional, and thus dividing the effects into which part of the business that effect is anticipated to affect, e.g. financial processes, data utilisation or credit evaluations.
Secondly, the anticipated effects have been divided into effect types. These are effects, where the causality between NSG and the actual effects varies.
Thirdly, different archetypes are taken into account. This is due to the presumption that the different effects might affect the archetypes in a different manner.
Bu
sin
ess
ca
se
Financial and inventory
management Marketing, Business
intelligence & products Financial services &
transactions
Primary effects
Secondary effects
Modernisation effects
Main effects
Eff
ect
ty
pe
s
Joint business case
BC BC
BC BC
BC
Transition effects
Agriculture
Service
Financial Prod./construc
Commerce
Arc
he
typ
es Residual

Nordic Smart Government 2.0
Business case for Nordic SMEs –Business to business
16
Finally, the business case is established. A business case for each of the five Nordic countries is carried out based on the findings in a Danish context and a Nordic validation. The five business cases add up to a final, joint cross-Nordic business case for the NSG vision.
4.1 Effect types: Primary, secondary, modernisation and transition
NSG will enhance data utilisation and digitisation in the Nordic SMEs, as NSG over time potentially will affect the business processes and models in the SMEs. The included effects in this business case are anticipated to arise due to various causal mechanisms. Thus, the effects are divided into four different effect types: primary, secondary, modernisation and transition. The first three are lasting effects, while the latter is temporary.
In the calculation of the business case, the different effect types are assigned values according to the degree that the effects can be linked to the NSG initiative and the data that are made available through this. Please see below.
Primary effects
NSG is anticipated to enhance more efficient processes in the Nordic SMEs. The primary effects are effects, where data from the ecosystem are/can be utilised directly in the enterprise’s business processes, e.g. automatic use of correct and updated master data in the invoicing process or financial transparency enabling more efficient, higher quality credit ratings, etc.
In the business case, core effects are assigned with 100% effect of Smart Government.
Secondary effects
The ecosystem will contain financial and economic data. The data availability enables generation and utilisation of new customer insights, integrating heterogeneous data from both customers and markets to steer managerial decision-making, e.g. on a dashboard. A secondary effect of the NSG initiative is thus to propel the SMEs into a higher digital and data-driven state increasing internal efficiency and operations.
It is anticipated that realisation of secondary effects is associated with a significant phase-in period. This is due to certain prerequisites, e.g. a higher general digital maturity has to be developed, before full benefits are realisable.
In the business case, secondary effects are assigned with 100% effect of Smart Government.
Modernisation effects
To implement NSG, the SMEs need to acquire and implement IT solutions (e.g. ERP system) that connect the SMEs to the ecosystem and enable automatic upload and download of financial and economic data to/from the digital ecosystem. This is anticipated to drive digital transformation and thus result in more efficient business processes, e.g. more efficient posting of accounts payables/receivables in the general ledger.
Figure 14: Primary effect causality
Figure 15: Secondary effect causality
Figure 16: Modernisation effect causality
Data from digital
ecosystem
Analytics and insights
Better resource
utilisation and new products
Data from digital
ecosyste,
More efficient business process
NSG intro-duction
Acquiring and imple-menting IT
solution
More efficient business
processes

Nordic Smart Government 2.0
Business case for Nordic SMEs –Business to business
17
This effect is not directly associated with utilising data from the digital ecosystem, but rather indirectly enabled through the acquired IT solution.
Thus, effects relating to new IT solutions that enable NSG implementation are regarded as indirect effects. There will be operating costs associated with the new systems as well. These are also taken into account as modernisation effects.
In the business case, modernisation effects are assigned with 2-5% effect of Smart Government.
Transition costs
The costs relating to acquiring and implementing new solutions and processes that enable the SMEs to interact with the data bank are considered transition costs (these are only estimated related to financial and inventory management). Transition costs are per definition temporary costs, but significant to highlight, as a digital transformation often will be associated with initial investments, while the full benefits arise several years later. This will be taken into account in the phase-in model for NSG.
In the business case, transition costs are also assigned with 2-5% effect of Smart Government and thus treated equivalent to the modernisation effects.
Nordic Smart Government 2.0
Business case for Nordic SMEs –Business to business
18
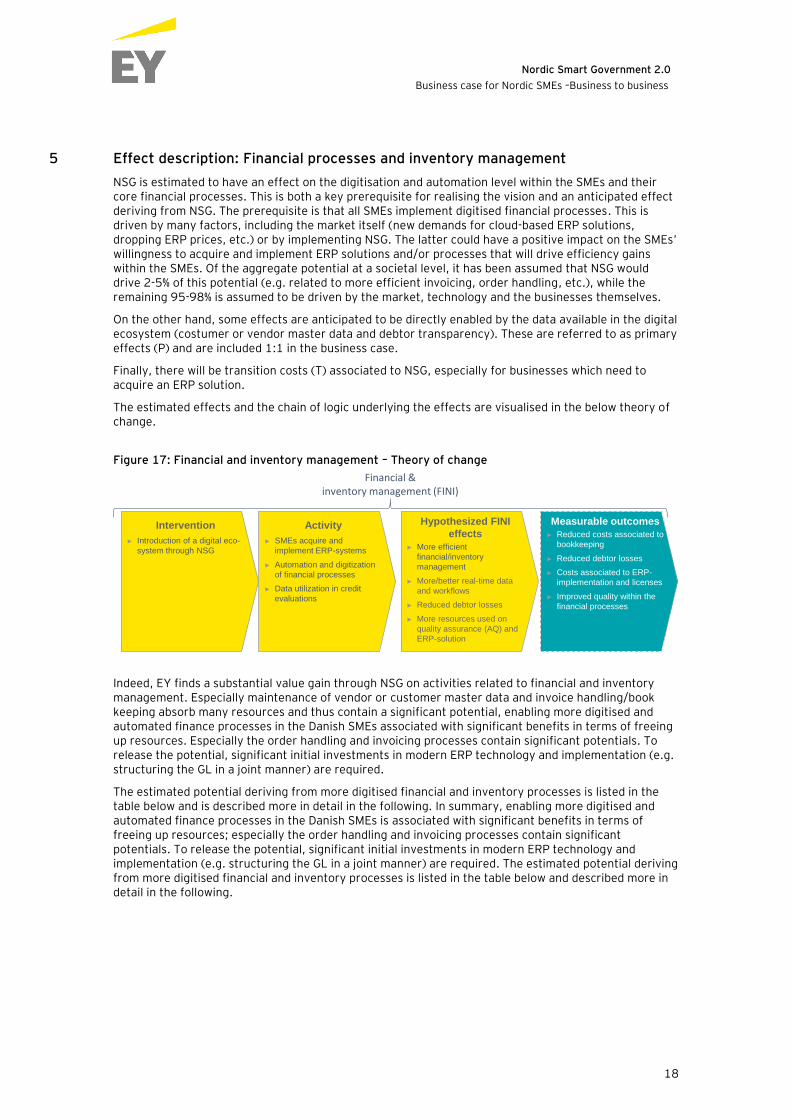
5 Effect description: Financial processes and inventory management
NSG is estimated to have an effect on the digitisation and automation level within the SMEs and their core financial processes. This is both a key prerequisite for realising the vision and an anticipated effect deriving from NSG. The prerequisite is that all SMEs implement digitised financial processes. This is driven by many factors, including the market itself (new demands for cloud-based ERP solutions, dropping ERP prices, etc.) or by implementing NSG. The latter could have a positive impact on the SMEs’ willingness to acquire and implement ERP solutions and/or processes that will drive efficiency gains within the SMEs. Of the aggregate potential at a societal level, it has been assumed that NSG would drive 2-5% of this potential (e.g. related to more efficient invoicing, order handling, etc.), while the remaining 95-98% is assumed to be driven by the market, technology and the businesses themselves.
On the other hand, some effects are anticipated to be directly enabled by the data available in the digital ecosystem (costumer or vendor master data and debtor transparency). These are referred to as primary effects (P) and are included 1:1 in the business case.
Finally, there will be transition costs (T) associated to NSG, especially for businesses which need to acquire an ERP solution.
The estimated effects and the chain of logic underlying the effects are visualised in the below theory of change.
Figure 17: Financial and inventory management – Theory of change
Indeed, EY finds a substantial value gain through NSG on activities related to financial and inventory management. Especially maintenance of vendor or customer master data and invoice handling/book keeping absorb many resources and thus contain a significant potential, enabling more digitised and automated finance processes in the Danish SMEs associated with significant benefits in terms of freeing up resources. Especially the order handling and invoicing processes contain significant potentials. To release the potential, significant initial investments in modern ERP technology and implementation (e.g. structuring the GL in a joint manner) are required.
The estimated potential deriving from more digitised financial and inventory processes is listed in the table below and is described more in detail in the following. In summary, enabling more digitised and automated finance processes in the Danish SMEs is associated with significant benefits in terms of freeing up resources; especially the order handling and invoicing processes contain significant potentials. To release the potential, significant initial investments in modern ERP technology and implementation (e.g. structuring the GL in a joint manner) are required. The estimated potential deriving from more digitised financial and inventory processes is listed in the table below and described more in detail in the following.
Intervention
► Introduction of a digital eco-
system through NSG
Hypothesized FINI
effects
► More efficient
financial/inventory
management
► More/better real-time data
and workflows
► Reduced debtor losses
► More resources used on
quality assurance (AQ) and
ERP-solution
Measurable outcomes
► Reduced costs associated to
bookkeeping
► Reduced debtor losses
► Costs associated to ERP-
implementation and licenses
► Improved quality within the
financial processes
Financial & inventory management (FINI)
Activity
► SMEs acquire and
implement ERP-systems
► Automation and digitization
of financial processes
► Data utilization in credit
evaluations

Nordic Smart Government 2.0
Business case for Nordic SMEs –Business to business
19
Table 8: NSG potential; finance processes and inventory management potential
Finance processes and inventory management potential (EURm.)
Maintaining vendor
and costumer master data (P)
Order handling and inventory
management (M)
Managing invoices and accounting (M)
Losses on debtors (P)
ERP acquisition/ implementation
(T), costs
Total (ex. transition costs)
Denmark 14 - 16 2 - 5 9 - 23 5 - 5 -1,4 - -1,5 30 - 50
Norway 25 - 27 4 - 9 15 - 38 8 - 9 -2,4 - -2,6 52 - 84
Sweden 30 - 34 5 - 12 21 - 53 10 - 11 -2,7 - -3,0 64 - 104
Iceland 1,0 - 1,5 0,2 - 0,5 1,0 - 2,5 0,4 - 0,5 -0,1 - -0,1 2,5 - 4
Finland 12 - 13 2 - 5 8 - 19 4 - 5 -1,2 - -1,4 25 - 41
Total 83 - 92 13 - 31 52 - 129 26 - 29 -8 - -9 175 - 280
5.1 NSG: Digitisation potential
5.1.1 Current degree of system support and digitisation/automation
Today, the Nordic SMEs are undergoing rapid modernisation primarily driven by market competition, where cloud-based ERP systems (e.g. E-conomic, Billy’s, Poweroffice Go, Visma, etc.) are increasingly commoditised. In particular, the activities invoicing, payment and posting in the general ledger (GL) are digitised and automated these years. In general, despite the relatively high degree of ERP support, a lot of time associated with manual finance activities is spent in the Danish SMEs. The following will address the potential related to further digitisation and automation in the financial processes.
5.1.2 Maintaining vendor and costumer master data (primary effect)
Maintenance of vendor and customer master data is a time consuming activity in many SMEs. Many spend a significant amount of time related to the activity, but also experience errors in invoicing and payments due to lack of standardised processes and low data quality. The first effect related to time usage has been estimated quantitatively. The assumption is that the data ecosystem will contain open up-to-date master data on the Nordic businesses. The master data will be available for all SMEs, which can integrate their systems (e.g. CRM systems) to the data ecosystem and thus have real-time access to relevant master data. This is anticipated to save resources within the Nordic SMEs.
The effect related to error reduction has not been estimated quantitatively, but based on findings through interviews, this qualitative effect could be significant, as master data often are not updated on a sufficient basis.
Table 9: Maintaining vendor and costumer master data (primary effect)
Country Potential (EURm)
Nordic 83-92
Order handling and inventory management
EY’s estimate is that more than one third of the SMEs use four or more minutes per order handled. In particular, incoming orders have a tendency to absorb time – approximately 20% of the respondents of the survey +10 minutes on average handling an incoming order.
10-15% have fully automated the order handling. The rest of the population has degrees of manual processes associated with order handling, often phone- or mail-based, e.g. an employee receiving a call from a customer and manually documenting the order in the Customer Management System and in some cases checking the inventory availability when receiving an order request.
Nordic Smart Government 2.0
Business case for Nordic SMEs –Business to business
20
From the interviews carried out, the primarily explanations to the relatively high degree of manual activities and time spent are 1) ad hoc procurement due to specific or shifting needs, and 2) lack of demand for digital order processes amongst vendors/costumers due to limited digital maturity in the segment. The SMEs that actually do have digital order handling processes are often due to very high volume of transactions.
Most SMEs do not have an inventory or processes associated to inventory management, e.g. due to very low volumes, order-based production or selling primarily intangible goods that cannot be stored. Of the SMEs with inventory management processes, most enterprises do have some degree of digitised processes.
It is thought to be a potential associated with an improved cash flow and management of the inventory capacity and value. This potential is not estimated quantitatively in this business case.
Table 10: Order handling and inventory management (modernisation effect)
Country Potential (EURm)
Nordic 13-31
Managing invoices and accounting
10-20% of the SMEs have fully automated their invoicing processes. They only spend relatively limited time per transaction, primarily associated with reviewing and approving transactions. The residual group does not have a high degree of automation and thus has a potential related to further automation of the invoicing and accounting processes.
In addition, our data suggest that the accounting processes are already quite automated in the Nordic SMEs. 40-50% of the businesses in the survey spend less than 1 minute per entry in the general ledger. Typically, this process is supported by the enterprise’s ERP solution and handled by a designated bookkeeper. According to the survey, approximately 50% of the SMEs have an external bookkeeper/accountant associated to perform financial tasks, often accounting tasks. This information has further been validated in the Nordic validation process, implying that this is a commonly used set-up for the SMEs in the Nordics. The potential associated with more automated and digital invoicing and accounting from NSG is driving a significant modernisation effect and is a corner stone in the realisation of the NSG vision.
Some degree of variance is identified across the Nordics in terms of using an authoritative way of structuring the GL. In Finland, Norway and Sweden, a significant share of the SMEs use an authoritative
GL2, while the standardisation in general is thought being lower in Denmark and Iceland.
Taken together, it is estimated that the potential associated to invoicing and accounting is EUR 52-129m annually, when NSG is fully implemented.
Furthermore, an effect on the quality on the bookkeeping process is anticipated, as the manual process will eliminate errors due to manual processes, though new demands related to ongoing validation are expected to arise to ensure sufficient data quality to be used real-time by the data users.
Table 11: Managing invoices and accounting (modernisation effect)
Country Potential (EURm)
Nordic 52-129
Loss on debtors
The current losses on debtors (B2B) within the SME segment are fairly low due to the favourable economic cycle these years.
2 E.g. Kontoplan BAS in Sweden and SAF-T in Norway

Nordic Smart Government 2.0
Business case for Nordic SMEs –Business to business
21
Based on data from survey and interviews, the estimated average loss on debtors is approximately 0.05% of the total revenue in the SME segment. About half of the SMEs do not even sell goods or services on credit and require payment up-front, which naturally draws down the average substantially. The other half that actually do sell on credit spend on average below one hour a month evaluating existing and potential debtors’ credit worthiness. Yet, the NSG is anticipated to reduce the losses on debtors by approximately 1% due to enhanced market transparency and real-time data on customers.
Table 12: Losses on debtors (primary effect)
Country Potential (EURm)
Nordic 26-29
5.1.3 ERP-acquisition and implementation
To realise the NSG vision, automatic data exchange between B2G and B2B is a prerequisite, and an ERP system is needed to support this. Our analysis indicates that 20-30% of the SMEs do not have such a solution and would need to require one to address the NSG vision. Our estimate is that implementation of a basic ERP solution is associated with a one-off investment in acquisition and implementation and an ongoing cost associated to a licence. The former is a transition cost, while the latter is a permanent cost.
The estimations are based on the average cost associated with a cloud-based ERP solution. Some SMEs with an existing ERP solution would probably need to upgrade the current solution to realise the NSG potential. This would be associated with a cost that has not been estimated in this analysis. Furthermore, it is expected that all the companies in the 10 years before realising the potential associated with NSG will have to invest in technology or new systems in order to keep up with the general digital development. These costs are not quantified as part of this business case since this is a common prerequisite for companies in order to survive in todays and future business environment. Furthermore, as mentioned initially, the cost of establishing the actual ecosystem is not calculated as part of this business case.
Table 13: ERP acquisition and license (transition effect)
Country Cost (EURm)
Nordic 8-9

Nordic Smart Government 2.0
Business case for Nordic SMEs –Business to business
22
6 Effect description: Marketing, business intelligence products and services
This section will describe the secondary effects related to marketing, business intelligence and products. Firstly, the theory of change that provides the logic of how the marketing, business intelligence and products effects influence the overall potential of NSG will be described. Secondly, EY’s estimations on monetary potential of the marketing, business intelligence and products effects related to pricing, benchmarking and marketing are described. Lastly, examples of additional marketing, business intelligence and products effects related to product development by third party BI developers and ERP service providers are put forward.
It is anticipated that effects related to increased revenue in the SMEs potentially will fall into two categories. The first being that the initiative will be propel net revenue growth within the Nordics. The second anticipated effect is increased competition for existing market shares. Based on the below, the two anticipated effects are distributed 80/20% with the major part being net growth in the Nordic SMEs.
The primary driver behind the assumption is that NSG includes new data, which will propel growth through innovation, improved pricing strategies and better and more qualified target marketing; according to both the quantitative and qualitative data gathered, this mechanism is evident. These findings are further supported by other business cases showing a potential for growth of 1.9% of the total European economy by the use of big data3. In addition, OECD finds that companies using big data can realise a 5% to 10% faster productivity growth than similar companies4. Thus hence the NSG initiative is more limited than big data, the possible potential is accordingly smaller with a potential around a 1.4% increase in the turnover of the SMEs.
On the other hand, the increased competition will also imply a zero-sum battle for existing market shares within the Nordic SMEs; hence, 20% of the aggregate estimate has been left out of the business case, even though the increased competition could benefit the consumers through increased product quality or prices.
This also implies that Nordic SMEs could take market shares from non-Nordic countries, e.g. Germany, Russia or USA. This share is in a global setting zero-sum, but a plus-sum for the Nordic SMEs, for which reason this share also is included in the 80% assumption. MIT finds that the digitally mature companies face significant advantages compared to the less digital companies5. These companies are 9-26% more profitable than their average industry competitors, thus supporting the case for the Nordic companies as a whole to gain market shares.
6.1 Logic of secondary effects related to marketing, business intelligence and services
NSG will enhance deployment of data across the SMEs in the Nordics. The yellow boxes illustrate the core causal process (intervention, activity, hypothesised effects) of developing new products and services based on data released through NSG. As illustrated in the grey boxes, the development of new products presupposes a range of prerequisites, while the measurable outcomes are the actual revenue and cost drivers that motivate SMEs to exploit data provided by NSG.
3 Buchholtz et al 2014 4 OECD 2016 Big Data: bringing competition policy to the digital era 5 MIT 2012 The digital advantage

Nordic Smart Government 2.0
Business case for Nordic SMEs –Business to business
23
Figure 18: Marketing, business intelligence and services – theory of change
NSG will provide data in a standardised real-time format and is thereby an intervention that provides opportunities for SMEs in nurturing their business processes and developing new products and services. NSG enhances transparency across costs, prices and revenue levels in the Nordic SME segment, which enables SMEs to collect data and conduct benchmarking analysis vis á vis peers. Based on EY’s survey data, in a Danish setting, 10-20% of companies spend time on collecting data about peers for benchmarking purposes, while 80-90% do not. Similarly, 10–20% argue that access to information on costs, revenue and prices from peers can increase revenue, while 80–90% argue that it will not have a positive influence on revenue. Enhanced benchmarking analysis is found to facilitate process optimisation and thereby propel better resource utilisation and profitability. NSG will make it easier for existing SMEs to get access to financial data and explore benefits of benchmarking to a larger extent.
6.2 Effects related to marketing, business intelligence and products
NSG will enable development of new products and services through release of financial and economic data from SMEs in the Nordic countries. As a result of NSG, it is anticipated that SMEs will exploit available data in their business intelligence solutions to enhance internal business processes and external marketing exposure. It is also anticipated that the release of data facilitates an ecosystem of entrepreneurs that will develop new products and services within the SME segment in the Nordics. The effects that are derived from the exploitation of data are referred to as secondary effects, as they can only be fulfilled when NSG is initiated and the data platform provides transparent financial and economic data.
EY has estimated the potential derived from marketing, business intelligence and products effects and disaggregates them in pricing, benchmarking and marketing. The potential is summarised in the table below followed by further elaboration.
Table 14: Potential marketing, business intelligence and products effects
Marketing, business intelligence and services potential (EURm)
Pricing Marketing Benchmarking Total
Denmark 1,170 - 1,290 870 - 960 550 - 610 2,600 - 2,850
Norway 1,990 - 2,200 1,490 - 1,500 940 - 1,040 4,400 - 4,900
Sweden 2,320 - 2,570 1,730 - 1,980 1,100 - 1,220 5,150 - 5,700
Iceland 90 - 100 70 - 80 40 - 50 210 - 230
Finland 980 - 1,080 730 - 810 460 - 510 2,150 - 2,400
Total 6,550 - 7,200 4,900 - 5,400 3,100 - 3,400 14,550 - 16,100
Prerequisites
► Automation of
financial processes
► Reporting of real-time
data
Intervention
► Release of economic
and financial data
from Nordic SMEs
through NSG
Activity
► Collection of data
from NSG
► Facilitation of
entrepreneurial
ecosystem
► Exploration of data
relationships
Hypothesized
BIPS effects
► Enhanced utilization
of resources
► Benchmarking
products
► Development of new
software
► Improved marketing
activities
Measurable
outcomes
► Improved revenue
► Fall in warehouse
costs
► Fall in administrative
costs
Marketing, business intelligence and servicesFinancial & inventory management

Nordic Smart Government 2.0
Business case for Nordic SMEs –Business to business
24
Pricing
Pricing is considered a central element in shaping SMEs’ competitive edge and driving revenue streams. Insights in competitor’s price information and strategies provides a good foundation for adapting to market trends and in understanding competitive moves. The qualitative interview data reflect that SMEs spend time on collecting price information and even subscribe to databases with price information. Based on the survey data, 10–15% believe that having access to data on prices, sales volumes, pipeline and revenue streams by competitors through NSG will enable comparisons with competitors and thereby increase the ease of proper market adaptation. Based on survey data, EY estimates that on average among Nordic enterprises, the revenue in a Nordic SME will increase by 0.8% through increased access to pricing and revenue data from competitors, which will propel into an aggregated potential across all SMEs in the Nordic countries of between EUR 6,550m and 7,240m as reflected in Table 15.
Table 15: Pricing
Potential (EURm)
Nordic 6,550-7,240
Marketing
In relation to B2B marketing, access to aggregated data on revenue streams, pricing, cost levels and sales volumes from competitor through standardised and transparent data provided in the NSG data bank will enable targeted marketing activities for SMEs in the Nordics. EY finds that 15-25% of SMEs spend time on systematically collecting data to support marketing efforts. Qualitative interviews substantiate this, and respondents argue that the data bank will support targeted marketing efforts, as SMEs can use data actively to gain insight in specific characteristic of their target groups. Within the marketing, business intelligence and products effects, the marketing effect reveals the most positive respondents in the survey. 35-45% of respondents consider access to other companies’ revenue and cost data to be a key enabler in improving marketing activities and provide foundation for increased revenue.
Based on survey data and findings from interviews, EY estimates that the marketing possibilities enabled by NSG will lead to an annual increase in revenues of 0.59% in Nordic SMEs, which accumulates to between EUR 4,900 and 5,400m as shown in table 17.
Table 16: Marketing
Potential (EURm)
Nordic 4,900-5,400
In sum, EY finds that the secondary marketing, business intelligence and products effects facilitated through the NSG initiative hold a significant potential across the Nordic countries. The biggest potential lies within the pricing effects reflecting the increased possibilities of adapting to the market, followed by the marketing effects, which cover data led marketing efforts and lastly the benchmarking effects covering benchmarking on general cost structures among competitors.
Benchmarking
The data on benchmarking are related to insights in competitors’ cost levels among Nordic SMEs. Such enhanced transparency around cost levels across industries will enhance the possibility to capture significant efficiency gains in Nordic SMEs. Through qualitative interviews, EY finds that SMEs are receptive towards an open and transparent data bank including data on cost. Respondents argue that time is spent on benchmarking cost levels with competitors to get an understanding of the market. In particular, looking through annual reports for personnel costs, costs of inventory and facility management costs such as energy consumption are sources of information while some pay a significant amount for benchmarking analysis provided by service providers. The data bank provided through NSG

Nordic Smart Government 2.0
Business case for Nordic SMEs –Business to business
25
will provide valuable data on best practice examples, enable in-house benchmarking analysis and ensure that time is consumed on creating valuable analysis rather than searching for information.
The survey data reveal that 15-25% of SMEs spend time on collecting data with the purpose of comparing business operations with competitors. 10-15% answer that access to general cost data from competitors will facilitate cost reductions in SMEs. Based on these responses, EY estimates that Nordic SMEs can reduce their costs by 0.39% on average by utilising the benchmarking opportunities enabled through NSG. This will create a total cost reduction across the Nordic SMEs of EUR 3,100-3,400m as shown in table 16.
Table 17: Benchmarking
Potential (EURm)
Nordic 3,100-3,400
6.3 Potential extra effects for third party service providers
Development of new software products
It is anticipated that NSG will facilitate an ecosystem around exchange and utilisation of financial and economic data. This creates opportunities for entrepreneurs who can exploit data in development of service offerings. EY’s interview data reveal that a high degree of Danish SMEs use cloud-based ERP systems (e.g. E-conomic, Billy’s Billing, Dinero, etc.) and subscribe to databases provided by service providers, containing benchmarking information.
Service providers such as vendors of online ERP systems and other BI developers might potentially benefit from the data provided by NSG. It gives these services providers opportunities to either refine data into service and benchmarking products or even offer completely new services such as tools to evaluate creditworthiness among customers and in general raise the quality of data-driven services. EY’s data also find that BI developers and ERP service providers are considered enablers of ecosystem. They hold the capabilities to work and refine big data, while creating ERP systems capable of automatic bookkeeping, and invoicing can be considered a prerequisite for making real-time data sharing of economic and financial data successful through NSG.

Nordic Smart Government 2.0
Business case for Nordic SMEs –Business to business
26
7 Effect description: Financial Services and Transactions
This section describes the effects and results related to financial services and transactions. First, we describe how NSG fundamentally could change the relationships between different actors on the credit market. This involves the relationship between sellers and buyers, firms and banks and credit insurers. This establishes the theory of change and causal logic for how NSG will affect this area of the business environment. The second part leads to the estimation of the overall potential stemming from changes in financial services and transactions following with a breakdown of each individual effect.
The increased availability of financial data and business information creates a foundation for radically changing and improving existing as well as creating new data-based processes and services. For banks and other financial institutions, data can become an increasingly important resource through request and consent of their business customers. Data may improve processes related to businesses seeking credit (e.g. loans) and banks evaluating such applications. It may increase the precision of the evaluations and efficiency in handling the applications. We here present several data dependent relationships, processes and areas in which NSG will make an impact.
7.1 Logic of effects related to financial services and transactions
In sum, we present the following theory of change for Financial Services and Transactions (see Figure 18).
Figure 19: Financial services and transactions – theory of change
As in the previous main effect, here we must also rely on a fundamental change in automation and digitisation of the firms in general. That is, the digital ecosystem must be established before potential benefits will be available for the financial sector through the intervention of data availability. Once established, the credit givers will be able to extract relevant data and utilise these in their existing as well as potentially new business areas. This may lead to, e.g., better screening decisions, increased transparency and better signalling of performance and easier detection of possible defaults/bankrupt-cies. The results are measurable outcomes in terms of more efficient case handling on loan applications, realised losses on loans, increased capital on the financial market in general and, as a result, increased income on interests and better fraud detection (money laundering).
Prerequisites
► Automation of
financial processes
► Reporting of real-time
data
Intervention
► Release of economic
and financial data
from Nordic SMEs
through NSG
Activity
► Financial institutions
can gain access to
financial data of firms
and key figures on
firm performance
Hypothesized
effects
► Better screening
decisions
► Increased
transparency on credit
market
► Easier detection of
possible
defaults/bankcruptcy
Measurable
outcomes
► More efficient case
handling of loan
applications
► Reduced losses on
loans
► Increased loan capital
on market in general
► Increased income on
interests
Financial Services & Transactions Financial &
inventory management

Nordic Smart Government 2.0
Business case for Nordic SMEs –Business to business
27
7.2 Description of credit cycle
Figure 20 depicts the potential data flows between entities relevant for both lending and insurance cycles.
Figure 20: Credit cycle - overview
Credit between seller (focal firm) and buyer
At the core is credit lending between businesses, i.e. the relationship between Seller and Buyer. This dyadic relationship is probably the most important one and often businesses sell goods on credit cleared at the end of the month. EY’s survey has uncovered that more than 58% of the firms sell goods or services on credit. Through EY’s interviews with firms, it has been uncovered that many firms use a substantial amount of resources to elicit and handle due balances. This especially holds true for firms selling products and services to smaller firms, which are more at risk of becoming credit constrained and thus unable to pay the outstanding debt. For detailed description and estimation, see Financial processes and Inventory management.
Credit between focal firm and bank
The NSG will affect the credit lending evaluation process in two ways. Firstly, it will make the evaluation process more efficient, implying that gathering needed information and data becomes faster with less transaction costs. Furthermore, and secondly, it will improve the quality of the assessment due to the access of more relevant data. EY has uncovered that banks and other financial institutions evaluating new clients spend somewhere around 2-3 hours per client to gather internal accounts, budgets and compliance related documents (such as identification on owners). Furthermore, handling of existing customers who must send in annual reports and accounts are often missing and thus resources are allocated to collect these. About every other client often misses the deadline. The presence of a better data ecosystem between the firms and the banks will improve this process significantly, though some data needs such as budgets are not addressed by the NSG. Thus, some processes will still be handled manually.
In 2014, the total amount of lending from Danish credit institutions to firms was around EUR 47bn. Furthermore, the access to credit through banks and financial institutions has in general been in decline. In 2007, Danish credit institutions fully granted nearly 92% loan applications. In 2014, this was reduced to about 72%6. While the share dedicated to small, medium and big firms is unknown, it is nonetheless evident that the resources allocated to handling lending activities between firms and money institutions must be substantial. From a bank’s perspective, assessment of potential lenders, the credit evaluation process, consists of two main inputs: the credit rating based on figures and numbers from annual
6 ”Små og mellemstore virksomheders adgang til finansiering 2014” by Danmarks Statistik (available at www.dst.dk/publ/VirksomhedersFinansiering).
Seller (insured)
Buyer(debtor)
Credit insurer(insurer)
Bank(finance)
Goods/service on credit
terms(Credit)
Payment for goods/services
Premium
Credit insurance
Receivables finance
Beneficiary
Risk monitoring and debt collection
Smart Government

Nordic Smart Government 2.0
Business case for Nordic SMEs –Business to business
28
reports of the firm seeking financing, and the behavioural data (the human factor) that requires investment by local bankers through dialogue with the firms.
7.2.1 Credit insurer
We end our chapter on financial services and transactions by considering the effect on credit insurance and other insurance providers in general. Credit insurance is sparse in the SME segment due to the relatively low value of transactions. Typically, the premium does not correspond to the potential risk. The biggest benefit for credit insurer is the access to real-time data on the firms’ current performances as well as potentially unlocking the data from proprietors. However, EY’s interview data uncover that credit insurance in the SME segment might be circumvented in the long run, as real-time information on debtor’s cash flows and assets may lead to internalisation of credit evaluation, thereby saving the focal firm from paying a premium.
7.3 Potential released through Financial Services and Transactions
For banks and other financial institutions, data can become an increasingly important resource through request and consent of their business customers. Data may improve processes related to businesses seeking credit (e.g. loans) and banks evaluating such applications. It may increase the precision of the evaluations and efficiency in handling the applications. Specifically, we estimate the effects of financial services and transactions in four areas: case handling on loans, income on interests, additional financing, loss on loans and fraud detection (money laundering).
The total estimated value related to the main area of financial services and transactions amounts to between EUR 9,150m and 10,100m for the Nordic region. This both includes increased efficiency in the financial sector and additional liquidity in the market. The estimates are based on Danish data where a single value per SME is calculated for each effect. The estimates are then scaled to the general population for each Nordic country and within each effect respectively.
Table 18: Potential value of effects from financial services and transactions
Case handling on
loans Income on interests
Loss on loans Total Additional liquidity
Denmark 40 - 45 50 - 55 45 - 50 140 - 150 1,250 - 1,400
Norway 65 - 75 80 - 90 75 - 80 220 - 245 2,050 - 2,250
Sweden 80 - 85 160 - 177 150 - 160 380 - 420 4,000 - 4,400
Iceland 2 - 3 7 - 8 7 - 8 15 - 20 190 - 210
Finland 30 - 35 65 - 75 60 - 65 160 - 180 1,650 - 1,850
Total 220 - 240 370 - 400 335 - 370 920 - 1,000 9,150 - 10,100
7.3.1 Case handling on loans
Financial institutions such as banks and other credit providers evaluate applications of loans on a daily basis. The process of handling loan applications broadly consists of two sub processes. First, credit providers assess behavioural aspects of the applicant through meetings and screening about the purpose of the loan, etc. Second, it involves an analysis of financial statements (external and internal). In particular, NSG is expected to make the latter process more effective. Obviously, applicants may also benefit from the more efficient handling of cases; however, the gain is primarily attributed to the assessor since it is their processes, which dictates e.g. the time of handling the case.
Through interviews with especially banks, EY uncovered that the average time spent on handling a single loan application is approximately 30 minutes. Furthermore, the time spent on this process may be reduced by 50% if the initiative is fully implemented, and based on point estimates from participants in the interviews, EY estimates the total number of financial statements handled related to loan applications in the Danish banking sector to be 160,000 cases per year.

Nordic Smart Government 2.0
Business case for Nordic SMEs –Business to business
29
This makes the foundation for the estimate of approximately EUR 220-240m across the Nordic countries.
Table 19: Case handling on loans
Potential (EURm)
Nordic 220-240
7.3.2 Additional liquidity and income on interests
Often, grants of loans are dismissed due to the lack of or inability from SMEs to gather the requested data or information or the size of the requested loan being disproportional in relation to the costs related to processing the applications. With the advent of NSG, the credit institutions may be able to approve loans which otherwise would had been disapproved or not even evaluated due to the increased transparency in the market and case management costs.
In Denmark, the total value of loans with less than EUR 1m amounts to EUR 9,800m in 2017. Using loans of less than EUR 1m serves as a reliable proxy for the size of loans given to the SME segment. Combined with an estimated 2% increase in additional loan grants, EY predicts the increased amount of capital available in the Nordic market due to NSG to be EUR 9,150-10,100m by its very nature. This benefit can be seen as a potential for future value realisation.
Finally, assuming an average yearly interest rate of 4%, the income on interests is estimated to be EUR 370-400m across the Nordic countries.
Table 20: Additional liquidity and income on interests
Potential (EURm)
Nordic – Additional liquidity 9,150-10,100
Nordic – Income on interests 370-400
Loss on loans
Realised losses on loans are expected to decline (and thus considered a realised benefit) due to the improved ability to detect potentially firms at risk of defaulting or through better screening in the initial granting process. Through EY’s interviews with credit providers, EY found the average loss on loans through a full loan cycle (approx. 7 years) to be in the range of 0.25-0.75%. While this might seem low, loss on loans is highly dependent on business cycles and given the recent economic boom, the estimate seems valid. Often smaller banks are only able to serve smaller clients. However, not all loans lead to losses and by far most cases in risk of default are handled by committing resources to counselling activities. As an example, the potential effect of NSG can be illustrated as follows: A bank handling difficult debtors of approximately 15.000 consolidated firms could lead to an increase in efficiency of about 15 minutes per consolidated firm.
Thus, across the Nordic countries, EY estimates the potential through reduced losses on loans to be EUR 330-370m.
Table 21: Loss on loans
Potential (EURm)
Nordic 330-370

Nordic Smart Government 2.0
Business case for Nordic SMEs –Business to business
30
There is inevitably and importance of the quality and detail of the data delivered by the companies in order to reach the full potential of the data ecosystem provided by NSG. Banks stress that one would be able to alleviate only some risks by the data provided real-time, but would need to depend on actual revised and controlled data before relying on the provided data in their model building. In the short run, this implies a potentially higher demand for revision and controlling of the data provided whereas in the long run, fine-tuning of processes and experience with data usage will alleviate the need for external validation of data through accountants or bookkeepers. We do not estimate this effect in the business case due to the lack of definition of the actual governance and controlling for the NSG vision. Furthermore, the data provided from firms are only partial for the whole credit evaluation process. Behavioural data on firms such as on repeated overdraft on accounts are not disclosed by the financial data. This often predicts better on potential risks rather than current financial statements.
Money laundering and risk detection
A related potential benefit of NSG related to the access of transactional data. Such data would ensure greater transparency in the actions of firms and the flow of money. To uncover this potential, EY tested this potential through interviews with financial institutions, especially banks, and concluded that the potential additional benefits of NSG in this domain are limited. Banks already monitor and register who their clients are conducting business with through dialogue with their clients.

Nordic Smart Government 2.0
Business case for Nordic SMEs –Business to business
31
8 Presentation of archetypes
This section describes each of the archetypes under scrutiny in this analysis and puts forward the estimated potential within each archetype across the Nordic countries.
EY has evaluated four primary archetypes within the SME segment in the Nordic countries: Agriculture, Forestry and Fishery; Service; Retail; and Production and Construction. The Banking and Finance segment is the fifth segment, but considered beyond the SME norms, as NSG will significantly influence both small and large banks and financial institutions in their business processes. Further, the residual group “other” is part of the analysis capturing the large part of the Nordic SMEs that do not fall below the four primary archetypes. This group does not consist of one heterogeneous group of SMEs, hence is treated as a residual group in order to calculate the full potential for all Nordic SMEs. This group has not been interviewed and the estimates are thus based on survey data.
NSG is expected to foster automation of administrative operations in Nordic SMEs, for which reason it is essential to evaluate the current rate of digitisation and use of data within each archetypes. Figure 21 represents the variation across archetypes in terms of degree of digitisation and use of data among survey, and estimations are based on EY survey data.
Data usage considers the degree to which SMEs utilise and refine internal and external data to optimise their operations, while degree of digitisation considers the degree to which SMEs use information and communications technology and digital systems in their daily operations.
Table 22 shows EY’s estimated business case for each archetypes across the Nordic countries. The numbers are estimated based on how each effect type, marketing, business intelligence and products, financial processes and inventory management and financial services and transactions influence the respective archetype. The estimations are reflected in a +/-5% interval.
Note 2: Population data is in consultation among Nordic business authorities
Table 1: Number of SMEs in each archetype across the Nordics
Archetype Number of SMEs (‘000)
Agriculture Forestry & Fishery 230
Production & construction 346
Retail 278
Service 101
Banking & financing (not SMEs) 45
Other 928
2,0
2,5
3,0
3,5
4,0
Agri,Forestry &
Fishery
Other
Production /construction
Retail
Service
Degree of digitalisation Data usage
Figure 21: Degree of digitisation and data use among archetypes (max=5)
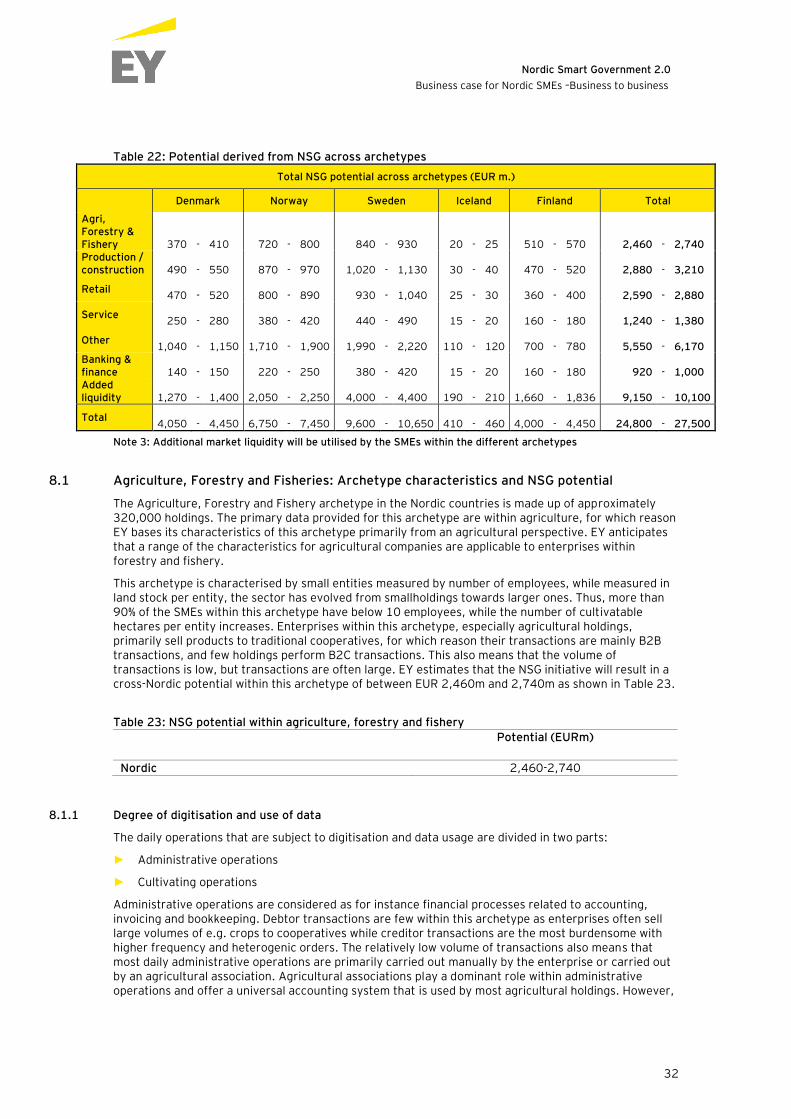
Nordic Smart Government 2.0
Business case for Nordic SMEs –Business to business
32
Table 22: Potential derived from NSG across archetypes
Total NSG potential across archetypes (EUR m.)
Denmark Norway Sweden Iceland Finland Total
Agri, Forestry & Fishery
370
-
410
720
- 800 840
- 930
20
- 25 510
- 570 2,460
- 2,740
Production / construction
490
-
550 870
- 970 1,020
- 1,130 30
- 40 470
- 520 2,880
- 3,210
Retail
470 -
520 800
- 890 930
- 1,040 25
- 30 360
- 400 2,590
- 2,880
Service
250 -
280 380
- 420 440
- 490 15
- 20 160
- 180 1,240
- 1,380
Other
1,040 -
1,150 1,710
- 1,900 1,990 - 2,220 110
- 120 700
- 780 5,550
- 6,170
Banking & finance 140 - 150 220 - 250 380 - 420 15 - 20 160 - 180 920 - 1,000 Added liquidity
1,270
- 1,400 2,050
- 2,250
4,000
- 4,400 190
- 210 1,660
- 1,836 9,150
- 10,100
Total
4,050 -
4,450 6,750
- 7,450
9,600 -
10,650
410 -
460
4,000 -
4,450 24,800
-
27,500
Note 3: Additional market liquidity will be utilised by the SMEs within the different archetypes
8.1 Agriculture, Forestry and Fisheries: Archetype characteristics and NSG potential
The Agriculture, Forestry and Fishery archetype in the Nordic countries is made up of approximately 320,000 holdings. The primary data provided for this archetype are within agriculture, for which reason EY bases its characteristics of this archetype primarily from an agricultural perspective. EY anticipates that a range of the characteristics for agricultural companies are applicable to enterprises within forestry and fishery.
This archetype is characterised by small entities measured by number of employees, while measured in land stock per entity, the sector has evolved from smallholdings towards larger ones. Thus, more than 90% of the SMEs within this archetype have below 10 employees, while the number of cultivatable hectares per entity increases. Enterprises within this archetype, especially agricultural holdings, primarily sell products to traditional cooperatives, for which reason their transactions are mainly B2B transactions, and few holdings perform B2C transactions. This also means that the volume of transactions is low, but transactions are often large. EY estimates that the NSG initiative will result in a cross-Nordic potential within this archetype of between EUR 2,460m and 2,740m as shown in Table 23.
Table 23: NSG potential within agriculture, forestry and fishery
Potential (EURm)
Nordic 2,460-2,740
8.1.1 Degree of digitisation and use of data
The daily operations that are subject to digitisation and data usage are divided in two parts:
► Administrative operations
► Cultivating operations
Administrative operations are considered as for instance financial processes related to accounting, invoicing and bookkeeping. Debtor transactions are few within this archetype as enterprises often sell large volumes of e.g. crops to cooperatives while creditor transactions are the most burdensome with higher frequency and heterogenic orders. The relatively low volume of transactions also means that most daily administrative operations are primarily carried out manually by the enterprise or carried out by an agricultural association. Agricultural associations play a dominant role within administrative operations and offer a universal accounting system that is used by most agricultural holdings. However,

Nordic Smart Government 2.0
Business case for Nordic SMEs –Business to business
33
EY has observed that more agricultural holdings are moving away from the traditional accounting system offered by the agricultural associations towards flexible cloud-based accounting systems.
Cultivating operations are concerned with optimisation of yield per hectare. These operations undergo rapid digitisation as GPS and sensor data from advanced machinery track yields and help in nurturing cultivating operations year on year.
The NSG initiative does only consider administrative operations such as automation of financial and accounting processes. A general characteristic for data usage in relation to administrative operations within this archetype is that the agricultural associations consolidate data, especially financial data. Thus, data from peers in relation to cultivating operations are usually of higher value for an agricultural holding than financial data. In addition, the agricultural associations conduct detailed sector specific benchmarking and industry analysis. However, these analyses are not available real-time, not necessarily reported in a digital format and thereby not digitised to a considerable extent. Based on EY’s survey data, the degree of digitisation and data use are shown in table 24.
Table 24: Degree of digitisation and data usage
Current digitisation (level) Current data utilisation
Agriculture, forestry and fisheries 2.9 3.0
The scale for both digitisation and data utilisation is 1-5. Both estimates are based on survey data.
8.1.2 Effects
The primary effects relevant for this archetype in relation to NSG are financial processes and inventory management and marketing, business intelligence and services.
First, the effects related to financial processes and inventory management are relevant in relation to automation of bookkeeping, which can reduce administrative operations significantly as a result of NSG. Effects related to marketing, business intelligence and services are relevant in terms of cost benchmarking in real-time. Today, most agricultural associations are performing yearly benchmark analyses, across comparable groups of agricultural holdings. A key benefit for this archetype is that they can conduct these analyses themselves and get insight in comparable holdings’ cost levels, if NSG is implemented.
Two secondary effects of less importance are worth mentioning. Development of business intelligence is of less interest, because inventory management in this archetype is limited compared to e.g. the retail archetype. Marketing effects are limited, as B2B transactions are determined by contracts with
cooperatives and that B2C transaction are few.
8.1.3 Critical observations
The observations EY has made regarding this archetype are based on agricultural holdings in Denmark. EY assumes that the key characteristics and structures regarding agriculture are applicable across the Nordics and to a certain extent within forestry and fisher.
EY finds that in Denmark, agricultural associations play a predominant role in the validation and administration of auditing and accounting processes for agricultural companies, while being mediators between credit institutions and agricultural holdings. They offer a standardised accounting system that is used by most agricultural holdings in Denmark. This system includes an automatic bookkeeping module, which is adopted by approximately 10% of agricultural holdings in Denmark according to EY’s interviews.
However, the adoption of the automatic bookkeeping system is hindered by a relatively high degree of technical mistakes in creditor transactions, which limits confidence in automated processes. EY also finds that agricultural holdings are in general concerned that real-time reporting will lead to additional burdens as validation of data will be required more often, where existing procedures are structured around annual reporting. The reduction in burdens and the enhanced efficiencies are by some agricultural enterprises not considered to take effect before all procedures are automated.

Nordic Smart Government 2.0
Business case for Nordic SMEs –Business to business
34
8.2 Production & Construction: Archetype characteristics and NSG potential
The Production and construction archetype is made up by approximately 350,000 enterprises across the Nordics, equivalent to 15-20% of the SMEs across the Nordics. This archetype is characterised by having a core business process, where they purchase resources from one enterprise, refine and add value through a production/construction process and sell/deliver the products or services to other enterprises. Thus, production enterprises often have a high degree of B2B transactions and a relatively low degree of B2C transactions. Given the NSG initiative, EY estimates that SMEs within production and construction across the Nordics can benefit from an accumulated potential of between EUR 2,880m and 3,210m.
Table 25: NSG potential within production and construction
Potential (EURm)
Nordic 2,880-3,210
8.2.1 Rate of digitisation and use of data
Administrative operations consider accounting, invoicing and bookkeeping. The volume of transactions is high within this archetype compared to other archetypes, and this archetype does also typically have a significant inventory management process and thus has many resources bound in inventory and thus a significant inventory management set-up compared to the other archetypes.
The average degree of digitisation and data use are shown in Table 26, which is based on EY’s survey data among companies within the production and construction archetype.
Table 26: Degree of digitisation and data usage within production and construction
Digitisation Data use
Production/Construction 3.3 2.9
The scale for both digitisation and data utilisation is 1-5. Both estimates are based on survey data.
Production and construction enterprises typically receive a relatively large number of orders, send debtor invoices, make evaluations of credit worthiness of other enterprises to avoid losses, etc., and furthermore, this archetype often has a need for maintaining master data about other enterprises in an ERP/CRM system.
Due to a high and B2B-related transaction volume, often with significant inventory volume/value, the digital maturity and awareness is in general high among the larger enterprises within this segment. The smaller enterprises within this archetype are often operated by few personal relations to a handful of loyal costumers and vendors. In sum, it is evident that the variation across size is significant within the production and construction archetype.
8.2.2 Effects
It is anticipated that the NSG will enable a significant potential within the production and construction archetype. Based on EY’s interview, data utilisation of internal and external data is expected to influence internal production processes, while enabling market adaptability through e.g. price adjustments. The significant potential is partly driven by rather low maturity, and because data-driven solutions become a key business driver in this sector in the years to come.
8.2.3 Critical observations
Production and construction enterprises are often dependent on being able to make business with other (larger) enterprises. In the process of interaction between two enterprises, especially if one of the parties has a certain size, it is often a prerequisite to have some structure and degree of digitisation within the process. Therefore, this archetype would often already have an ERP system, and in some cases a CRM system, to support these core transaction processes. This entails that the digitisation level
Nordic Smart Government 2.0
Business case for Nordic SMEs –Business to business
35
on average is relatively high and the potential from further digitisation correspondingly lower, while the maturity enables a more efficient data utilisation propelling better resource utilisation.
8.3 Retail: Archetype characteristics and NSG potential
The third archetype encompasses retail businesses such as wholesale, groceries, convenience stores and other business-to-consumer related firms. The archetype consists of approximately 288,000 enterprises, which are around 15% of SMEs in the Nordics and characterised by selling goods to end-consumers. The retail industry in the Nordics is quite homogenous in terms of its structural and economic similarities. As such, smaller shopping centres dominate the retail landscape compared to other Western European countries, which converge towards larger but fewer centres7. Some B2B transactions occur in the retail industry where many shops and business acquire goods from suppliers. Based on EY’s data, it is estimated that the retail industry across the Nordics will reach a potential of between EUR 2,590m and EUR 2,880m if NSG is initiated.
Table 27: NSG potential within Retail
Potential (EURm)
Nordic 2,590-2,880
8.3.1 Degree of digitisation and use of data
The rate of digitisation in the retail industry has undergone rapid digitisation for the past years. Based on EY’s interview data and supported by survey data, it is found that a shift into e-commerce and use of technologies such as smartphones and other mobile devices has caused the retail industry to make several digital transformations within their businesses. Many small and medium-sized businesses deploy eInvoices, sharing of internally electronic information with an ERP (e.g. across functional areas), send and receive information on the supply chain (inventory levels, production plans, forecasts, etc.) although there is some variation in the level of deployment. Due to the high volume of transactions in the retail industry, the administrative operations in the firms have already undergone significant digitisation and automation in their processes.
The use of financial data and information for various purposes mainly applies to internal controlling and optimisation. Consumer data are often used in marketing and product development. EY’s survey data reveal the degree of digitisation and use of data in Table 28.
Table 28: Degree of digitalisation and data usage Digitisation (level) Data usage
Retail 3.1 2.7
The scale for both digitisation and data utilisation is 1-5. Both estimates are based on survey data.
8.3.2 Effects
For the retail archetype, EY finds that four effects related to financial processes and inventory management and marketing, business intelligence and services are particularly relevant.
Within the retail archetype, firms rely on high volume transaction and therefore many bookkeeping and administrative processes might be influenced by the NSG initiative. However, as such this will also mean that the value-adding potential could be relatively smaller for this archetype within this effect type. The advent of web shops and e-commerce has further driven many small retail businesses into digitised and automated inventory management. However, the level of sophistication varies substantially. The new digital ecosystem will potentially drive the market towards more standardised and optimal solutions (e.g. data structure and format), which will lower transaction costs of automation.
7 https://www.icsc.org/europe/uploads/ICSC-NordicResearch.pdf

Nordic Smart Government 2.0
Business case for Nordic SMEs –Business to business
36
Furthermore, it is expected that an increase in marketing efforts will commence due to the accessibility to more relevant and detailed information about potential customers (B2B). As such, this may shift many retailers into performing analyses in-house or acquire analyses from BI consultancies rather than seeking standard sector reports and information.
With the move into a more digitised retail business, industry compliance is expected to increase. Data at the transactional level will make actions and activities more transparent and with the possibility of future blockchain technology, normal channels of money laundering will face a harder future.
It is anticipated that NSG enables a significant potential for better data utilisation within the retail sector, while the financial processes within the sector to some degree already are digitised, and thus the potential is rather limited relatively to other archetypes.
8.3.3 Critical observations
The retail industry encompasses many proprietorships, which causes a potential loss on debtors for businesses like wholesale firms. Ex-ante credit evaluation is nearly impossible as it is today because proprietorships are not required to publish accounts (both external and internal reports). Furthermore, even if annual reports and accounts are publicly announced, they are often outdated, which is especially critical for smaller firms that are often more affected by daily events causing volatility.
8.4 Service: Archetype characteristics and NSG potential
Service enterprises are quite heterogeneous and can potentially differ quite significantly in terms of the share of B2B transactions or B2C transactions. This archetype is characterised by offering services through intangible man-hours rather than tangible goods. The share depends on the nature of the sub-segment within the service archetype, e.g. a hairdresser would have more B2C transactions, while a bookkeeper would have more B2B transactions. This archetype also includes consultancy firms (e.g. BI developers), lawyers, etc. In this regard, the archetype has some degree of heterogeneity in terms of the anticipated effects of NSG across the service industry. On one hand, BI developers could be enabled to develop new products based on the data made available by the data ecosystem, and on the other hand accountants could be affected by changing demands from their customers.
Table 29: NSG potential within the service archetype
Potential (EURm)
Nordic 1,240-1,380
8.4.1 Rate of digitisation and use of data
The service companies typically have limited amount of transactions compared to for example enterprises, which primarily sell their products directly to end-consumers.
The service enterprises typically do not have an inventory since they sell their services and not goods. For this reason, they seldom have complicated procurement processes since the goods that they need for their business are mostly limited to products related to their workspace, i.e. computers, household goods, etc. The volume of transactions related to purchasing is therefore limited compared to other archetypes.
The need for conducting evaluations of credit worthiness of other enterprises to avoid losses, etc. is limited within this archetype. Typically, the enterprises experience few cases where the customers are not able to pay the bills. For this reason, service enterprises typically do not have a standardised process for evaluating credit worthiness of their customers. In general, service enterprises have some degree of digital processes, especially related to resource allocation and planning, while the core financial processes as invoicing; updating the GL or evaluating credit worthiness is less digital. Based on EY ‘s survey data, it is found that service companies use cloud-based ERP and accounting systems to a considerable extent and in some cases, a CRM-system to support the core transaction processes.
The degree of digitisation and data use for the service archetype is shown in Table 30 below.

Nordic Smart Government 2.0
Business case for Nordic SMEs –Business to business
37
Table 30: Degree of digitalisation and data usage within the service archetype
Digitisation (level) Data usage
Service 3.1 2.7
The scale for both digitisation and data utilisation is 1-5. Both estimates are based on survey data.
8.4.2 Effects
For the service archetype, effects related to financial processes and inventory management and marketing, business intelligence and services are relevant particularly in relation to administration of financial activities and in relation to business intelligence analysis and marketing.
Given that the service industry does not deal with inventory management and tangible goods, the primary monetary benefits derived from NSG in this archetype are related to enhanced marketing activities, general higher degree of market adaptability, better utilisation of resources in relation to financial and administrative tasks and general benchmarking on costs.
EY finds that service companies can raise the revenue streams if the data are used structurally in marketing activities. EY’s observations support that decisions in service companies about marketing activities that target specific segments and data-led price adjustments that can improve competitive pricing in the market can result in increased revenue streams. In addition, benchmarking costs are found to be of importance of service companies. In particular on facility management and salary.
The anticipated effect of NSG that improved digitisation and automation of administrative processes will also benefit the service sector. EY’s findings prove that most service companies will be able to utilise resources and staffing to a considerable higher degree.
In sum, the service archetype is said to benefit from NSG to a large extent through effects related to financial processes and inventory management and marketing, business intelligence and services.
8.4.3 Critical observations
This archetype is in general receptive towards the NSG initiative and embraces the idea of data transparency and innovation possibilities. However, through qualitative interviews, EY finds that the degree of details and standard format is key for the service companies to refine and use data. If the data are based on permanent benchmarking against competitors or used in permanent reporting of financial performance, it is key that the data source is reliable in the long run. In addition, a range of BI developers exploit a current gap in the market of fragmented data formats and the fact that it is difficult to obtain refined benchmark and industry information. They build their business around collection of industry specific data and financial information from various data sources, refine it and sell it as concise industry and benchmarking analysis. These types of service businesses fear redundancy as NSG will provide structured data in standardised format and accessibility publicly.
8.5 Financial institutions
The effects and characteristics of this archetype are described in paragraph 7.3. Please note that this group is not part of the SME segment and is hence treated differently throughout the analysis.
8.6 Other
Other is a residual group consisting of the SMEs that are not included in the defined archetypes. Since the SME segment is very heterogeneous, this segment is quite significant containing a wide range of SMEs e.g. within science, transport, administration, health, etc. The digital maturity assessment is based solely on survey data, as interviews have only been conducted with businesses from the defined archetypes. The digital maturity is rather high within this residual group compared to other archetypes. This is primarily a result of the fact that “other” businesses on average are larger than the average SME, and size correlates with digital maturity.

Nordic Smart Government 2.0
Business case for Nordic SMEs –Business to business
38
Table 31: Degree of digitalisation and data usage within “other”
Digitisation (level) Data usage
Other 3.8 3,6
The scale for both digitisation and data utilisation is 1-5. Both estimates are based on survey data.
The fact that the other group is quite significant in terms of volume implies that the aggregate potential is significant for this group.
Table 32: NSG potential within “other”
Potential (EURm)
Nordic 5,550-6,170

Nordic Smart Government 2.0
Business case for Nordic SMEs –Business to business
39
9 Digital maturity and ICT usage in the Nordic countries
The potential of NSG in the Nordic countries is extrapolated based on size, costs and digital maturity. To account for digital maturity in each of the Nordic countries, EY uses World Economic Forum’s readiness assessment index (2016) as a proxy for digital maturity. Two sub-indices are used, namely business usage of ICT and government usage of ICT. In combination, they capture how businesses in the Nordic countries adopt new technologies and use ICT in their innovation and transaction practices, while capturing the extent to which governments offer online services and how they value ICT in their long-term planning. As NSG is an initiative in the intersection between regulation and business, it is relevant to capture how governments support businesses in their use of ICT and vice versa.
Based on the average between the two numbers, as shown in the circles in Figure 22 below, EY finds that Sweden has the highest digital maturity; Norway and Finland score the same, followed by Denmark and Iceland respectively.
Figure 22: Digital maturity in the Nordic countries
Note 4: World Economic Forum; NRI Index
When using the index in the estimations across the Nordic countries, EY accounts for the relative upside between the countries, i.e. since Iceland scores lowest, they do also hold the relatively highest upside potential from NSG, while Sweden will hold a relatively lower potential. The logic is that the lower the digital maturity, the more potential the country is able to achieve from NSG.
5,2 5,4 5,5
4,95,4
0,0
1,0
2,0
3,0
4,0
5,0
6,0
7,0
Denmark Finland Sweden Iceland Norway
Ind
ex 1
-7
Business usage of ICT Govermnet usage of ICT Average of business and government usage

Nordic Smart Government 2.0
Business case for Nordic SMEs –Business to business
40
10 Methodology
10.1 Data collection
The data were collected in three steps. Firstly, data were collected through semi-structured interviews with businesses within the chosen archetypes. Secondly, a survey was sent to Danish SMEs. Furthermore, additional data were gathered from various reports, databases on digitisation in the Nordics, etc. to validate the findings and establish a cross-Nordic business case.
10.1.1 Interviews
EY has conducted 31 interviews during the data gathering process, including at least five interviews within each archetype.
The interview booking process was structured by drawing lists from the Danish CVR-register, a database for information about businesses run by the Danish Businesses Authority within the relevant segments (1. Construction and production, 2. Retail, 3. Service, 4. Agriculture). To get only SMEs, the data were sorted on number of employees (<250) and turnover (<EUR 50m) or balance (<EUR 43m). Based on these data, EY proceeded with phone calls to businesses, inviting them to participate in an interview about the business’ use of digitisation and data. A minimum of five interviews within each segment were set up. Of the five interviews, a minimum of two had to be defined as a small business (< 10 employees). The SME criteria were not applied to businesses in the banking and finance segment, where only large businesses were contacted in order to establish the aggregated effects for all companies in the financial sector and the impact on the SMEs.
10.1.2 Survey
Following the semi-structured interviews, a survey was constructed. The purpose of the survey was twofold: to obtain a more representative estimate on the implied value potentials from the interviews, and to elicit digital maturity profiles on the archetypes under investigation. Thus, the survey method enables us to make a direct comparison across archetypes and to link self-assessed maturity with value potential.
Based on a random sample of 19,414 firms subject to reporting class B drawn from the Danish CVR-register, we collected 915 completed answers (4.7%) over 10 days’ survey duration. A reminder was sent out after 7 days. Participants were completely anonymous. The relatively large number of completed answers is satisfying for the purpose of this business case. The results have been processed and validated resulting in leaving inconsistent answers and outliers out of the analysis.
10.1.3 Population data
The population data provide the foundation for estimating the aggregated potential across the Nordic countries. The estimations are supported with quantitative population data on the total size of the SME segment in the Nordic countries as well as the specific number of SMEs within each archetype; production and construction, retail, service, agriculture and banking and finance.
The primary sources of these data are Eurostat and national statistics databases in the five Nordic countries under scrutiny in this analysis: Statistics Denmark, Statistics Sweden, Statistics Norway, StatFin and Statistics Iceland. Validation of the data is ensured through consultation of a range of authorities (e.g. The Swedish Forest Agency Population data still awaits final validation from local business authorities across the Nordic countries.
Aggregated population data are based on the common statistical classification within the European Community, NACE. EY has matched the archetypes against the NACE classification as depicted in the table below. Data are extracted based on the single letter classification, as this grasps each archetype to the greatest extent possible and thereby provides the most thorough comparative foundation across the five Nordic countries. However, given the broad comprehension of the agricultural statistics in Sweden, Finland and Norway, EY has triangulated data sources to provide reasonable and comparative figures.

Nordic Smart Government 2.0
Business case for Nordic SMEs –Business to business
41
Table 33: SME distribution on archetypes (‘000)
Archetype NACE code Size (DEN) Size (NOR) Size (SWE) Size (ICE)
Size (FIN)
Production & construction
C;F 46 79 148 5 73
Retail G 43 70 127 3 48
Service J 15 19 55 2 10
Agriculture, forestry & fishery
A + Various sources8910
28 58 66 2 81
Banking & financing K 11 4 20 3 7
Total archetypes 142 230 415 14 221
Other 130 206 441 26 133
Total Nordic SMEs 272 436 857 40 356
Production and Construction, Retail and Service
Data on these three archetypes are based on NACE classification C and F, G and J respectively. NACE C is referred to as manufacturing industry, F as production industry, NACE G as wholesale and retail trade while the latter, J, is referred to as information and communication management. The data accommodate the formal definition of SMEs and reflect the number of enterprises that hold between 0 and 249 employees. Data are based on the DIW ECON SME Performance Review 2016, which is primarily based on data from Eurostat. Based on data reviews, EY has decided to use data from 2013 across the Nordic countries, as these data are the most harmonious.
Agriculture
Data on the agriculture archetype are based on NACE classification A, referred to as companies in agriculture, forestry and fishing. EY has extracted data from national statistics databases based on the NACE A classification, since data from Eurostat were limited for this segment. Given the broad comprehension of the data grasped by the NACE A classification, data from Norway and Sweden reveal a high number of companies, in particular companies registered as sole proprietors that to a certain extent reflect small family practices or inactive companies. To ensure harmonious data and limit the number of inactive companies inherent in the NACE A classification, EY has consulted authorities in Sweden and Norway, which has enabled us to validate the data and provide reasonable numbers of agricultural holdings across the Nordics.
The collection through national statistics institutions has complicated data collection, as the national collection methods vary across countries regarding data criteria for number of employees. Thus, the data shown in the table above reflect total agricultural holdings in Denmark, agricultural holdings with 0-249 employees in Finland, agricultural holdings with 0-199 employees in Sweden, total number of agricultural holdings in Iceland and number of agricultural holdings with 0-249 employees in Norway.
8 https://www.skogsstyrelsen.se/globalassets/statistik/kvalitetsdeklarationer/sysselsattning-i-skogsbruket/skogsentreprenorer/kvalitetsdeklaration_jo0504_skogsentreprenorer_avs2016.pdf 9 https://www.scb.se/en/finding-statistics/statistics-by-subject-area/agriculture-forestry-and-fishery/general-statistics/general-agricultural-statistics/pong/tables-and-graphs/number-of-holdings-by-size-group-of-arable-land/ 10 Consultation with Skogsstyrelsen and National Statistic bureaus in Sweden and Norway as well as consultation with Nordic business authorities.

Nordic Smart Government 2.0
Business case for Nordic SMEs –Business to business
42
Banking & Finance
The banking and finance archetype is reflected in NACE classification K that considers financial institutions and insurance companies. EY has collected data from national statistics databases in each of the five countries and extracted data from 2015. Within this archetype, companies of all sizes are considered, as the benefits derived from enhanced transparency and access to financial information and assets through NSG are anticipated to be in favour of larger financial institutions.
Total Nordic SMEs Table 34: NACE classifications
Except for Banking and Finance, EY considers four archetypes solely based on SMEs. The total of Nordic SMEs is the sum of registered companies under NACE A-J; L-N and R; S. Data from NACE B-L excluding K are sourced from the DIW ECON SME Performance Review 2016. NACE A, which represents agriculture, forestry and fishery, is for Sweden and Norway composed of different sources, not limited to the NACE A extractions from national statistics databases. NACE R and S are collected from national statistics databases, where collection methods differ regarding data criteria for number of employees limiting the access to correct SME data. Thus, these classifications include companies with 0-199 employees in Sweden, 0-249 employees in Norway, all companies in Finland, all for Iceland and 0-199 for Denmark.
NACE K is excluded, as companies of all sizes within the finance segment are considered. Furthermore, EY has decided to exclude NACE O, P, Q, T and U from the total population data as these classifications are of public nature or considered minor companies such as household employers, which NSG will not influence.
10.2 Nordic validation process
As described above, interviews and survey data are based on interactions with Danish business hence the estimates reflect the potential for these companies. In order to be able to use these estimates to build a Nordic business case for NSG, several measures have been applied. Firstly, local resources from EY in Sweden, Norway, Finland and Iceland have been involved in validation of the effects. These resources have provided input regarding the business environment for SMEs in their country and provided information on regulatory measures that affect the businesses. This information has been applied in the calculations of the effects in Sweden, Norway, Finland and Iceland.
Furthermore, multiple sources ranging from World Economic Forum to the European Commission have been consulted in the efforts to establish levels of maturity in the digital area for all the Nordic countries. The maturity has been taken into account when calculating the effects within the different Nordic countries.
10.3 Estimations
The estimations included in the NSG business case are based on Danish context findings. The businesses participating in the interviews and survey have all been Danish, thus the method used for calculating the business case is based in the Danish estimates obtained through interviews, survey and use of external sources.
NACE classification Total
A Companies in agriculture, forestry and fishing
Included + extra sources
B Mines and queries Included
C Manufacturing industry Included
D Electricity, gas, steam and hot water plants
Included
E Water works, sewage plants, waste disposal plants
Included
F Construction industry Included
G Wholesale and retail trade Included
H Transport and storage companies Included
I Hotels and restaurants Included
J Information and communication companies
Included
K Financial institutions and insurance Excluded
L Real estate Included
M Professional, scientific and technical companies
Included
N Administrative and support companies
Included
O Public authorities Excluded
P Educational establishments Excluded
Q Human health and social work Excluded
R Establishments for arts, entertainment and recreation
Included
S Other service companies Included
T Households as employers Excluded
U extraterritorial organisations Excluded

Nordic Smart Government 2.0
Business case for Nordic SMEs –Business to business
43
Country Denmark Finland Iceland Norway Sweden
Number of SMEs (‘000) 272 356 40 436 857
Labour cost (index)
1.0 0.7 0.5 1.1 0.7
Digital maturity
index 5.2 5.4 4.9 5.4 5.5
Size index 1.0 0.93 0.95 0.97 0.94
When obtaining the estimates for Sweden, Finland, Norway and Iceland the Danish estimates are used as a base and then extrapolated taking into account these drivers where Denmark has been indexed 1.00 across all three variables of adjustment:
1) The number of SMEs
2) Digital maturity (a low digital maturity is assumed to imply a higher potential from digitisation and hence NSG)
3) Labour costs
4) Size index
Below are shown the drivers used for calculating the individual business cases
Sources: Number of SMEs: Eurostat, DIW Econ, 2016, and national statistics bureaus. Labour costs: Eurostat, 2016.
Digital Maturity: World Economic Forum’s Network Readiness Index, 2016.

Nordic Smart Government 2.0
Business case for Nordic SMEs –Business to business
44
These variables effectively take into account the main differences within the Nordic countries in terms of the sizes of the SME market, the digital maturity within the SME segment and hence the potential of further digitization, prices and overall level of cost. While using this approach, it is considered that the similarities between the Nordic countries are more prominent than the differences. The estimation method naturally has some limitations and weaknesses that should be taken into account. Firstly, Denmark and the rest of the four Nordic countries do vary to some degree on various dimensions, despite being quite similar in a European context. That being said, of course there are certain variations in the business structure across the Nordics. This might be evident in terms of for example:
► The typical size of the SME. Denmark has fewer micro enterprises with zero or one employee compared to the other four Nordic countries. This has been handled through indexing the share of micro SMEs that have been used for calculating the business case. This way, the businesses compared across Nordics are on average more alike.
► The average turnover and cost levels.
► The speed of adapting new technology and digitisation.
Even though it is important to stress that the above differences are of course present in the SME business landscape of the Nordics, they are at the same time considered to be handled through the abovementioned drivers. Furthermore, a span on each estimation should address some of the sensitivity within the estimations across the countries.
The maturity of each archetype is considered to be similar across Nordic. Thus, the service archetype in Sweden is assigned the same level of maturity as the service archetype in Finland. The maturity of the archetypes is used for distributing the calculated effects. Hence archetypes with the lowest maturity are assigned a relatively higher potential gain from NSG than the archetype that are already very mature in terms of digitisation. Similar to the above described, the findings on these variables are based on the Danish variation in terms of maturity across the archetypes.
Below, the variables and the process of estimations are shown.
Theory of change/intervention
A theory of change is a method to illustrate an anticipated causal relation between an intervention (X) and one or more dependent variables (Y) including the in-between activities.
This NSG2 business case is made ex-ante, meaning the effects from NSG2 of course cannot actually be observed yet. The data collection, analysis and business case are all structured around hypothesis about
Financial and inventory management
(variables)
Marketing, business intelligence and services
(variables)
Financial services transactions (variables)
► Maintaining vendor and customer master data
► Order handling and inventory management
► Managing invoice and accounting
► Losses on loans
► ERP implementation = costs
► Benchmarking = cost reduction
► Marketing = revenue increases
► Pricing = revenue increases
► Average cost: EUR 0,5m
► Average revenue: EUR 0,7m
► Case Handling on loans
► Income interests
► Additional financing
► Loss on loans
Digital
maturity Size
Labour
cost
1 2 3
The Danish base case is the foundation for the extrapolation across the Nordic countries.
Labour cost, size, digital maturity and size index are the key drivers in differentiating the monetary potential of NSG
across the Nordic countries
► Estimations are based on best practice scenario with NSG accounting for 2-5% of the total potential
► Revenue increases are based on 80% net growth and 20% deadweight loss
► Average revenue data is weighted against the actual structural combination of SMEs (Danish baseline)
► Estimate is based on a value per SME estimate and triangulated with OECD data.
Size
index
4

Nordic Smart Government 2.0
Business case for Nordic SMEs –Business to business
45
anticipated effects from NSG2. The logics behind the hypothesis have been tested throughout the data collection, most eminent via the qualitative interviews. This has resulted in establishing theories of change, which should document the logics and causalities behind the measured effects in the business case. Of course, the theory of change visualises the foundation behind the business case.
However, most importantly, it documents the assumed causality of the effects ex-ante, enabling actual following up on the actual benefit realisation ex-post, when the NSG2 has been implemented. If some benefits are not realised, it could be due to implementation failure, meaning the logics behind the theory of change are not followed in reality, e.g. this business case assumes that the SMEs have to access and utilise data from the data ecosystem as to realise the benefits from it. To conduct this activity is a prerequisite to benefit from the data later on.
If the SMEs do not access and utilise the data from the data ecosystem, the benefits from NSG2 will not arise. This would be regarded as an implementation failure, and this piece of knowledge enables the authorities to prioritise their efforts in ensuring NSG2 benefit realisation.
In sum, the theory of change is established on both theoretical and empirical foundations, which ex-ante outlines the causal relations between NSG2 and the anticipated effects. This is illustrated in the below figure.
The theory of change/intervention for each of the identified effects can be found in the chapters describing each area.
Figure 23: Elements in a theory of change
Intervention Activity Output Effect
Pro
ce
ss
NSG SME adaption Gains and losses Measureable KPI’s
Implementation prerequisites

Nordic Smart Government 2.0
Business case for Nordic SMEs –Business to business
46
11 Appendix
11.1 Population data Archetype NACE code Size (DEN) Size (NOR) Size (SWE) Size
(ICE) Size (FIN)
Production & construction
C;F 46 79 148 5 73
Retail G 43 70 127 3 48
Service J 15 19 55 2 10
Agriculture, forestry & fishery
A + Various sources1112
13
28 58 66 2 81
Banking & financing K 11 4 20 3 7
Total archetypes 142 230 415 14 221
Other 130 206 441 26 133
Total Nordic SMEs 272 436 857 40 356
The primary sources of these data are Eurostat and national statistics databases in the five Nordic countries under scrutiny in this analysis: Statistics Denmark, Statistics Sweden, Statistics Norway, StatFin and Statistics Iceland. Validation of the data is ensured through consultation of a range of authorities (e.g. The Swedish Forest Agency). Population data still await final validation from local business authorities across the Nordic countries.
Aggregated population data are based on the common statistical classification within the European Community, NACE. EY has matched the archetypes against the NACE classification as depicted in the table below. Data are extracted based on the single letter classification, as this grasps each archetype to the greatest extent possible and thereby provides the most thorough comparative foundation across the five Nordic countries. However, given the broad comprehension of the agricultural statistics in Sweden, Finland and Norway, EY has triangulated data sources to provide reasonable and comparative figures.
11 https://www.skogsstyrelsen.se/globalassets/statistik/kvalitetsdeklarationer/sysselsattning-i-skogsbruket/skogsentreprenorer/kvalitetsdeklaration_jo0504_skogsentreprenorer_avs2016.pdf 12 https://www.scb.se/en/finding-statistics/statistics-by-subject-area/agriculture-forestry-and-fishery/general-statistics/general-agricultural-statistics/pong/tables-and-graphs/number-of-holdings-by-size-group-of-arable-land/ 13 Consultation with Skogsstyrelsen and National Statistic bureaus in Sweden and Norway as well as consultation with Nordic business authorities.
Nordic Smart Government 2.0
Business case for Nordic SMEs –Business to business
47
11.2 Assumptions
11.2.1 General assumptions
► The potential effects are calculated based on the analysis conducted with an offset in Danish SMEs.
► The potential for each country is then calculated taking into account the differences in:
- The numbers of SMEs, sources: Number of SMEs: Eurostat, DIW Econ 2016, and national statistics bureaus
- Labour costs, source: Eurostat
- Digital maturity, source: World Economic Forum’s Network Readiness Index
► The potential for each archetype is then calculated taking into account the digital maturity and data usage. Source for this is EY’s survey amongst SMEs.
► The digital maturity and data usage are considered to be the same across Nordics within each archetype.
11.2.2 Overview of key assumptions for Financial and inventory management
General assumptions:
► The efficiency gain potential per business is assumed identical across Nordic businesses. Data are based on Danish context (survey and interview).
► The cost per hour is calculated based on an estimate of the average price per hour for internal bookkeeping from Statistics Denmark (LONS20) and the average price per hour of outsourced bookkeeping (interview data). A relative 75/25 (internal/external) distribution key is applied. The weighed and applied cost per hour is DKK 303 and is adjusted across the countries through use of a labour cost index (Eurostat).
► Number of transactions (debtor, invoices/postings/orders) is based on survey data and adjusted through Statistics Denmark data.
11.2.3 Estimation assumptions
► Calculating the efficiency gains and thus the potentials from NSG, a best practice approach is applied. Best practice is based on answers in survey data (best practice = 5 in degree of automation, scale: 1-5). The survey data are validated with interview data.
► A 2-5 % NSG factor is applied on the aggregate potential from all businesses across the Nordics to isolate the potential that NSG is anticipated to drive through regulation, incentives, etc. The remaining 95-98 % is anticipated to be driven by the market, the SMEs themselves, etc. This is only the case for modernisation effects.
11.2.4 Other data sources
► Statistics Denmark
► Eurostat
11.2.5 Overview of key assumptions for marketing and business intelligence and services
General assumptions:
► The potential for usage of data is similar across Nordic enterprises
► The potential is calculated from estimates on cost and turnover from EY’s survey amongst SMEs
► Cost and turnover for an average SME is considered to be the same across the Nordic
► Increases in revenue are considered 80% net growth and 20% deadweight loss

Nordic Smart Government 2.0
Business case for Nordic SMEs –Business to business
48
► Revenue related increases from better pricing and marketing activities are 0.8% and 0.6% respectively (before adjusting for the above 80/20-key)
11.2.6 Overview of key assumptions for Financial Services and Transaction
General assumptions
► Financial institutions are equally productive; only their current size reflects differences.
► Long-run dynamic effects are not considered – as such the analysis is only partial.
Estimation assumptions
A) Case handling is approximately 30-45 min per case. 15 mins reduction in case handling.
B) Point estimate of 40,000 cases (at risk) for a medium-/large-sized bank (total working capital greater than DKK 12bn). Assumed 160,000 cases in the Danish financial sector.
C) 2% increase in loans (value).
D) 20% of all loans are commercial loans.
E) Share of loans is 85% for the top 10 financial institutions in Denmark:
- 16,000 commercial loans for a medium-/large-sized institution
Total of 104,000 commercial loans in Denmark
F) Loss on loans is 0.25–0.75% over a cycle (7 years)
Other data sources
G) Statistics Denmark:
- Average interest rate on loans to non-financial institutions in 2014 was 4%
- Average salary per hour for a bank analytic is DKK 326.56
H) OECD:srs
I) Total value of commercial loans to SMEs was DKK 7.300m in 2015
J) The Danish Financial Supervisory Authority:
- Number of financial institutions in Denmark (excluding foreign) is 77 in 2017
11.2.7 Survey
1. Introduktion
Kære modtager Du er blevet udvalgt til at deltage i denne undersøgelse angående små og mellemstore virksomheders brug af data og fremtidige perspektiver ved øget digitalisering. EY udarbejder undersøgelsen for Erhvervsstyrelsen. Undersøgelsen er både relevant for dig, hvis virksomheden allerede er digital og dig, hvis virksomheden i dag ikke er digital. Har du spørgsmål eller ønsker yderligere information kan du kontakte Dan Nguyen (EY) på [email protected] eller Rasmus Toft (Erhvervsstyrelsen) på [email protected]. Først vil vi gerne stille dig nogle spørgsmål angående din virksomhed og jeres brug af data og systemer. Herefter bliver du præsenteret for Smart Government-konceptet, og bliver bedt om at forholde dig til dette.

Nordic Smart Government 2.0
Business case for Nordic SMEs –Business to business
49
Din deltagelse er meget værdsat, og vil bidrage til at forme den fremtidige digitalisering og innovation i Danmark. Vi foreslår, at én i virksomheden med kendskab til virksomhedens økonomiprocesser og brug af data besvarer spørgeskemaet. Besvarelserne er anonyme og indgår kun i aggregeret form hvorfor individuelle besvarelser ikke kan identificeres. Spørgeskemaet tager ca. 10-15 min at besvare. Mange tak for din hjælp!
2. Basisoplysninger
Vi vil bede dig om at beskrive nogle basale oplysninger om virksomheden.
3. Hvad er din primære funktion i virksomheden? Vælg fra listen (State one answer only)
Bogholder/Økonomimedarbejder
Ejer/Direktør Chef Andet
4. Hvor mange medarbejdere er der i virksomheden per dags dato? (State one answer only)
0
1
2-10
10-50
50-100
100-250
250+ - Go to 48
Ønsker ikke at svare/Ved ikke
5. Virksomhedens bruttoomsætning i 2016? Angiv i antal mio. kroner. Afrund gerne til nærmeste tal. (Ved ikke/Ønsker ikke at svare: efterlad blankt felt)

Nordic Smart Government 2.0
Business case for Nordic SMEs –Business to business
50
(State value)
_ _ _ _ _ _
6. Virksomhedens omkostninger i 2016? Angiv i antal mio. kroner. Afrund gerne til nærmeste tal. (Ved ikke/Ønsker ikke at svare: efterlad blankt felt) (State value)
_ _ _ _ _ _
7. Hvad er virksomhedens alder? (State one answer only)
0-2 år 3-10 år 10+ år Ønsker ikke at svare/Ved ikke
8. Hvilken branche falder virksomheden under? Vælg den, der passer bedst. (State one answer only)
Produktionsvirksomhed
Bygge- og anlægsvirksomhed
Handelsvirksomhed
Servicevirksomhed
Landbrugsvirksomhed
Bank- og finansvirksomhed
Andet
9. Systemer
Vi vil nu stille en række spørgsmål til virksomhedens digitale systemer med særligt fokus på regnskabsmæssige og finansielle systemer.

Nordic Smart Government 2.0
Business case for Nordic SMEs –Business to business
51
10. Anvender I i dag finanssystemer til at understøtte fx regnskab, bogføring, lagerstyring, kundekartotek mm. (dog ikke Excel) til at understøtte virksomhedens finansielle og økonomiske processer (fx fakturering, bogføring mv.)? [Ja/Nej]. (State one answer only)
Ja Nej Ved ikke
Vi vil nu stille en række spørgsmål til virksomhedens digitale modenhed herunder, hvorvidt processer og systemer er automatiserede dvs. processer, der ikke kræver manuelt arbejde.
12. I hvor høj grad understøtter virksomhedens finanssystem... (State only one answer per question)
Meget lav
grad Lav grad
Hverken/eller
Høj grad Meget høj
grad Ikke
relevant
automatis
k
fakturerin
g?
automatis
k
betaling?
automatis
k
lagerstyrin
g?
automatis
k
indhentnin
g og
ajourførin
g af
kundesta
mdata?
automatis
k
indhentnin
g og
ajourførin
g af
leverandø

Nordic Smart Government 2.0
Business case for Nordic SMEs –Business to business
52
rstamdata
?
13. I hvor høj grad... (State only one answer per question)
Meget lav
grad Lav grad
Hverken/eller
Høj grad Meget høj
grad Ikke
relevant
vurderer
du
overordne
t
digitaliseri
ngsgraden
i din
virksomhe
d at
være?
samler,
bearbejde
r og
analyserer
I på egne
forretning
sdata til
at
optimere
forretning
en?
anvender
I data om
andre
virksomhe
der til at
optimere
jeres
forretning
(fx via
benchmar
king,
analyser
eller til
markedsfø
ring) ?
14. Abonnerer virksomheden på data om andre virksomheder til brug for løbende forretningsudvikling, kreditgivning, markedsføring mv.? (fx via Bisnode, Experience, Nielsens osv.) (State one answer only)

Nordic Smart Government 2.0
Business case for Nordic SMEs –Business to business
53
Ja Nej Ved Ikke
15. Hvor meget betaler virksomheden ca. årligt for dataabonnementer? Angiv i antal mio. kroner. Afrund gerne til nærmeste tal. (Ved ikke/Ønsker ikke at svare: efterlad blankt felt) (State value)
_ _ _ _ _ _
Vi vil nu stille en række spørgsmål til virksomhedens faktureringsproces
17. Bruger virksomheden ekstern bogholder/revisior til løbende finansielle opgaver? (State one answer only)
Ja Nej Ved ikke
18. Hvor mange timer bruger I (bogholderen/regnskabsansvarlige) ugentligt? (State value)
_ _ _ _ _ _
19. Hvor mange fakturaer sender virksomheden årligt? Angiv i antal. Afrund gerne til nærmeste tal. (Ved ikke/Ønsker ikke at svare: efterlad blankt felt) (State value between 0 and )
_ _ _ _ _ _
20. Hvor mange fakturaer modtager virksomheden årligt? Angiv i antal. Afrund gerne til nærmeste tal. (Ved ikke/Ønsker ikke at svare: efterlad blankt felt) (State value)
_ _ _ _ _ _

Nordic Smart Government 2.0
Business case for Nordic SMEs –Business to business
54
21. Hvor langt tid tager det i gennemsnit... (State only one answer per question)
0-1 min 1-3 min 4-10 min 10- min
at placere én
ordre hos en
leverandør?
at modtage én
ordre fra en
kunde?
at sende én
faktura til en
debitor?
at betale én
faktura til en
kreditor?
at lave én
debitorposterin
g?
at lave én
kreditorposteri
ng?
at opgøre
lagerbeholdnin
gen (pr.
måned)?
at opdatere og
ajourføre
kundestamdata
(pr. måned)?
at opdatere og
ajourføre
leverandørsta
mdata (pr.
måned)?
22. Præsentation af Smart Government
Med Smart Government vil der blive skabt en digital infrastruktur, hvori nordiske små- og mellemstore virksomheder automatisk og løbende kan dele økonomiske og finansielle data, hvilket skal fremme digitalisering og innovation. Dette muliggør at offentlige myndigheder selv kan generere fx årsregnskaber og indhente anden relevant virksomhedsdata, hvorfor virksomhederne ikke længere selv skal indberette til det offentlige. Data er anonyme, men fortrolige data kan efter samtykke udveksles mellem to

Nordic Smart Government 2.0
Business case for Nordic SMEs –Business to business
55
virksomheder, ligesom anonyme virksomhedsdata efter samtykke kan udstilles på aggregeret niveau. Eksempelvis kan både omkostnings- og omsætningsdata, som virksomheden i dag anvender til at lave årsrapporter løbende blive delt med andre virksomheder, fx i forbindelse med kreditvurderinger. Når infrastrukturen er oprettet kan både din egen virksomhed og andre virksomheder hente og anvende disse data i aggregeret og anonymiseret form til at sammenligne, analysere og forbedre jeres virksomheds omkostningsniveauer, priser, mængder eller bruge data til at få indsigt om specifikke virksomhedssegmenter, du gerne vil ramme med din markedsføring.
23. Video: Smart Government
Denne video giver en introduktion til Smart Government (afhængigt af din internetforbindelse kan der gå et øjeblik før videoen hentes):
24. I hvor høj grad vurderer du, at etablering af Smart Government og medfølgende automatisk og løbende indberetning til det offentlige kan fremskynde digitalisering i din virksomhed? (State one answer only)
1 Slet ikke
2
3 Hverken/eller
4
5 I meget høj grad
Ved ikke
25. Sælger din virksomhed varer eller ydelser på kredit? (State one answer only)
Ja Nej Ved Ikke
26. Hvor meget tid bruger virksomheden i gennemsnit på at kreditvurdere potentielle debitorer per måned? Angiv enhed i timer. Afrund gerne til nærmeste tal. (Ved ikke: efterlad blankt felt - eller 0)

Nordic Smart Government 2.0
Business case for Nordic SMEs –Business to business
56
(State value)
_ _ _ _ _ _
27. Hvor meget kan Smart Government reducere tidsforbruget forbundet med kreditvurdering med? Fx ved at have mere relevante (nyere) information om potentielle kreditorer. Angiv enhed i timer. Afrund gerne til nærmeste tal. (Ved ikke: blankt felt) (State value)
_ _ _ _ _ _
28. Hvad er det årlige tab på debitorer? Angiv enhed i antal mio. kroner. Afrund gerne til nærmeste tal. (Ved ikke: efterlad blankt felt) (State value)
_ _ _ _ _ _
29. Hvor meget kan Smart Government reducere debitortabet med? Fx ved at have mere relevante (nyere) information om potentielle debitorer. Angiv enhed i % af nuværende tab. (Ved ikke: efterlad blankt felt) (State value)
_ _ _ _ _ _
30. Har din virksomhed søgt kredit hos finansielle institutioner inden for det seneste år? (State one answer only)
Ja Nej Ved Ikke
31. Hvor meget tid brugte i på at indsamle og rapportere relevante finansielle/økonomiske oplysninger om virksomheden til kreditgiver? Angiv enhed i antal timer. (State value)
_ _ _ _ _ _

Nordic Smart Government 2.0
Business case for Nordic SMEs –Business to business
57
32. Bruger du tid eller ressourcer på at indhente data med henblik på at kunne sammenligne virksomheden med dine konkurrenter? (State one answer only)
Ja Nej Ved ikke
Gennem Smart Government vil du få adgang til andre virksomheders omkostningsdata fx på løn, varer og services i aggregeret og anonymiseret form.
34. Vil du kunne reducere dine omkostninger, hvis du kan sammenligne og analysere din virksomheds omkostninger i forhold til andre virksomheders? (State one answer only)
Ja Nej Ved ikke
35. Hvor meget vil du derigennem kunne reducere dine omkostninger med? Angiv enhed i % af virksomhedens nuværende omkostninger. Har du svaret "Ved ikke" ved forrige spørgsmål er du velkommen til at angive "0" som værdi. (State value)
_ _ _ _ _ _
Gennem Smart Government vil du få adgang til andre virksomheders omsætningsdata (priser og mængder) i anonymiseret og aggregeret form, fx til at få indsigter i prisniveauer og afsætte mængder af specifikke produkter/ydelser på dét marked, du opererer på.
37. Kan det skabe grundlag for at din virksomhed øger omsætningen? (State one answer only)
Ja Nej Ved ikke

Nordic Smart Government 2.0
Business case for Nordic SMEs –Business to business
58
38. Hvor meget vil du derigennem kunne øge din omsætning med? Angiv enhed i % af virksomhedens nuværende omsætning. (State value)
_ _ _ _ _ _
Gennem Smart Government vil du få adgang til andre virksomheders pris- og omsætningssætningsdata, der kan anvendes til at sammenligne virksomhedens priser i forhold til andre virksomheders
40. Kan det skabe grundlag for at din virksomhed øger omsætningen? (State one answer only)
Ja Nej Ved ikke
41. Hvor meget vil du kunne øge din omsætning med? Angiv enhed i % af omsætning. (State value between 0 and )
_ _ _ _ _ _
42. Bruger du tid eller ressourcer på at indhente data om andre virksomheder med henblik på at målrette markedsføring af din virksomheds produkter/services? (State one answer only)
Ja Nej Ved ikke
Gennem Smart Government vil du få adgang til andre virksomheders omkostnings- og omsætningsdata i aggregeret og anonymiseret form.
44. Vil du med disse data kunne forbedre og målrette virksomhedens markedsføringsindsats og derved skabe grundlag for at øge omsætningen?

Nordic Smart Government 2.0
Business case for Nordic SMEs –Business to business
59
(State one answer only)
Ja Nej Ved ikke
45. Hvor meget vil du kunne øge din omsætning med? Angiv i % af virksomhedens nuværende omsætning. (State value)
_ _ _ _ _ _
46. Vil du være villig til at betale for muligheden for at anvende data fra den digitale infrastruktur? (State one answer only)
Ja Nej Ved ikke
47. Angiv venligst yderligere kommentarer eller spørgsmål i følgende boks (hvis ingen kan du blot gå videre):
_ _ _ _ _ _ _ _ _ _ _ _ _ _ _ _ _ _ _ _ _ _ _ _ _ _ _ _ _ _ _ _ _ _ _ _ _ _ _ _ _ _ _ _ _ _ _ _ _ _ _ _ _
_ _ _ _ _ _ _ _ _ _ _ _ _ _ _ _ _ _ _ _ _ _ _ _ _ _ _ _ _ _ _ _ _ _ _ _ _ _ _ _ _ _ _ _ _ _ _ _ _ _
_ _ _
_ _ _ _ _ _ _ _ _ _ _ _ _ _ _ _ _ _ _ _ _ _ _ _ _ _ _ _ _ _ _ _ _ _ _ _ _ _ _ _ _ _ _ _ _ _ _ _ _ _ _ _ _
48. Tak for din deltagelse!

Nordic Smart Government 2.0
Business case for Nordic SMEs –Business to business
60
11.2.8 Questions for interviews
Interviewguide
1. Introduktion
Hvem er vi?
- Gruppe består af X, Y og Z fra EY Advisory.
- Vi er her i forbindelse med en analyse på vegne af Erhvervsstyrelsen, der skal kortlægge potentialet ved ydereligere digitalisering af finansielle og andre udvalgte processer i virksomheden.
Ramme
- Ca. 1 times varighed
- Anonymiseret – vi refererer virksomheden herefter som arketypevirksomhed X
- Frit at spørge undervejs og for god ordens skyld vil vi gøre dig opmærksom på, at du deltager frivilligt og du derfor altid kan vælge at trække dit samtykke tilbage eller udelade at besvare enkelte spørgsmål
Hvem er du?
- Vil du præsentere lidt om dig selv og virksomheden generelt?
2. Præsentation af digitaliseringskoncept
Etablering af digitalt øko-system: Konceptet som vi vil kalde for ”Øko-systemet” er en vision om åbne økonomiske og finansielle data i de nordiske SMV’er. Visionen skal konkret udmøntes gennem etablering af et øko-system, hvori SMV’erne automatisk og real-time kan lægge deres økonomiske og finansielle data op. Data er på et detaljeret og standardiseret niveau, fx på posteringslinjeniveau, så transparensen og anvendelsesmulighederne er størst mulige. Således er data også anonyme, men data kan efter samtykke udveksles mellem to virksomheder, fx i forbindelse med kreditvurderinger.
Effektiv tilgang til dataudnyttelse og transparens: Når øko-systemet er oprettet kan både virksomheden selv og andre virksomheder udnytte dataressourcen til at analysere og optimere egen forretning ved at inkorporere data i egne forretningsprocesser, ligesom data også kan muliggøre bedre kreditvurderinger eller udvikling af nye databaserede produkter.
- Har du spørgsmål til konceptet?
- Vi vil nu gennemgå en række emner relateret til virksomhedens daglige virke og funktioner. Vi vil gerne bede dig om at forholde dig til, hvordan det fremtidige scenarie, som lige beskrevet, potentielt kunne have indflydelse på virksomhedens processer og arbejdsgange. Det er vigtigt, at du tager udgangspunkt i forhold til virksomhedens nuværende situation og holder dette op imod dette fremtidsscenarie.
- Til slut vil vi gerne spørge ind til virksomhedens digitale modenhed – herunder hvordan og hvor meget I allerede bruger data og digitale løsninger/systemer jeres centrale finansielle processer og arbejdsgange.
3. Økonomi- og lagerstyring
Vi forventer at øko-systemet vil have indflydelse på virksomheders økonomi- og lagerstyring og vi vil derfor gerne gennem gå en række processer relateret hertil med dig.
De to processer vi særligt vil snakke om er:
- Omsætningscyklus (modtagelse af ordrer modtage betaling)
- Udgiftscyklus (Foretage en ordre betale for vare)

Nordic Smart Government 2.0
Business case for Nordic SMEs –Business to business
61
Omsætnings- og udgiftscycklus:
Med introduktionen af øko-systemet, er det hypotesen, at der vil være enkelte direkte effekter og en række afledte effekter på virksomhedernes omsætningscyklus (revenue cycle).
De direkte effekter vurderes i udgangspunktet at være relateret til en eventuelt kreditvurderingsproces og til faktureringsprocessen, fordi data fra øko-systemet kan understøtte disse aktiviteter direkte.
Endvidere antages det, at NSG vil skubbe på udviklingen mod at flere virksomheder anskaffer et økonomisystem, som kan udveksle data automatisk med øko-systemet. Et økonomisystem vil understøtte effektivisering af flere aktiviteter under omsætningscyklussen, herunder også ordremodtagelse, opslag i lagersystemet og postering af indtægter.
[VIS FIGUR]
Spørgsmål (gentag for begge cyklusser):
- Hvordan passer denne beskrivelse ind i din/jeres virksomhed?
o Hvilke personer er medvirkende?
- Hvad tænker du i forhold til øko-systemets indvirkning i processen?
- Tidsforbrug i dag?
o Tidsforbrug fremadrettet? Prøv at være specifik
- Hvor mange ordrer foretager I? (volumen)
o Finansbogholderiet
- Ville det gøre nogle af trinnene lettere?
o Tænker du der nogle besparelser i forhold til dette?
- Ville det gøre nogle af trinnene sværere?
o Tænker du der er nogle omkostninger i forhold til dette?
4. Kreditansøgninger og forsikringer
Øko-systemet har potentielt en direkte effekt på kreditvurderingsprocessen.
Kreditforsikringsselskaber er stærkt afhængige af valid kvalitetsdata for foretage præcise evalueringer af potentielle forsikringsemner. Øko-systemet vil gøre det muligt at indhente real-time data, hvilket er en signifikant forbedring i forhold til de nuværende årlige data indhentet fra årsrapporter.
For virksomhederne opstår en afledt effekt af bedre finansieringsmuligheder, da bankerne eksempelvist vil kunne få real-time oplysninger om kreditforsikringstilsagn og desuden vil brugen af smart contracts gøre tilsagn til finansiering lettere for virksomhederne samt reducere risici for de finansielle institutioner.
[VIS FIGUR]
Spørgsmål:
- Lad os starte med Z (tag udgangspunkt i relevante virksomhed).
- Z:
o Bank:
Vil du prøve at beskrive de trin I foretager jer, når en virksomhed søger finansiering hos jer? Er der andre relevante processer/interaktioner med virksomhederne?
Hvordan tror I, at øko-systemet vil påvirke de nuværende processer? Ansøgninger, monitorering, kontraktskrivelse, due diligence etc.?
Hvem af jeres ansatte vil være påvirket af dette?

Nordic Smart Government 2.0
Business case for Nordic SMEs –Business to business
62
o Kreditforsikringsselskab
Hvordan fungerer jeres nuværende kreditvurderingsproces?
Hvilke finansielle data er i afhængige af om virksomhederne?
Hvordan vil adgang til øko-systemet påvirke jeres nuværende kreditvurderingsproces?
o Virksomheder
Har I erfaring med at kreditvurderingsprocessen? Har I forsøgt at opnå lån?
Hvordan var processen?
Tænker I at adgang til finansielle data vil gøre denne proces lettere? Hvorfor, hvorfor ikke? Hvor meget? For hvem?
5. Udvikling af business intelligence produkter
Adgang til standardiseret finansiel data fra andre (alle) små- og mellemstore virksomheder skaber nye muligheder for produktudvikling, der potentielt vil øge profitten.
De nye produkter benytter data fra øko-systemet vedrørende andre lignende virksomheders processer og nøgletal, hvilket sætter virksomhederne i stand til at forbedre deres egen forretning baseret på egne og andres data fx til benchmarkinganalyser.
[Vis billede]
Spørgsmål:
- Hvilke data danner i dag grundlag for jeres produkter?
- På hvilken måde vil øko-systemet kunne understøtte udvikling af nye produkter?
- På hvilken måde vil øko-systemet kunne understøtte allerede eksisterende produkter?
- Hvad vurderer I, at efterspørgslen er på denne type af data?
- Hvilke gevinster kan I forestille jer at kunderne vil have ved at benytte de nye produkter baseret på øko-systemet?
- Er det muligt at få priseksempler på forskellige typer af BI løsninger?
- Hvilke slags data kunne have interesse at få indsigt i?
o Ville du være villig til at betale for det? (Hvor meget?)
6. Markedsføringsaktiviteter
Øko-systemet vil potentielt gøre markedsføringsaktiviteterne bedre gennem øgede prisdifferentieringsstrategier, tilpasset og personlig, hurtigere og øget kvalitet i markedsføringen.
Vi tænker her særligt på markedsføring til andre virksomheder.
Spørgsmål:
- Hvilke markedsføringsaktiviteter har I i dag?
- Hvor meget tid og ressourcer anvendes der?
- Har I anvendt informationer og data om andre virksomheder til dette?
o Hvis I fik adgang til andre virksomheders data, hvilke slags data tænker I ville være interessante for at udføre bedre markedsføring?
7. Modenhed i data og digitalisering

Nordic Smart Government 2.0
Business case for Nordic SMEs –Business to business
63
Vi vil nu gerne stille nogle spørgsmål i forhold til jeres brug af data generelt (generelt kan der spørges bare 1-5, 1 = overhovedet ikke; 5 = i høj grad)
1. Hvilke slags data anvender I i dag? (ingenting, digitaliseret, valideret data, + meta data, real-time)
2. Hvor formaliserede er jeres tilgang til data (tilgang)? (Ikke-formaliserede processer, formel, formel end-to-end proces for databaseret tilsyn, løbende feedback til modellen)
3. Inddrages omverdenen (andre virksomheder, aktører) I jeres data?
4. Hvor systematisk indsamles jeres data? (ikke et samlet datasæt real-time opdateret datasæt)
5. Hvorvidt anvender I systemer til at foretage risikoudtagning og dataopsamling? (tjek lige denne)
6. Hvorvidt er jeres kontroludtagning af data systematiseret? (per intuition/ingen real-time, risikobaseret og real-time).