Noradrenergic Modulation of Cortical Networks - Cerebral Cortex
15
Cerebral Cortex April 2010;20:783--797 doi:10.1093/cercor/bhp144 Advance Access publication August 17, 2009 Noradrenergic Modulation of Cortical Networks Engaged in Visuomotor Processing Christian Grefkes 1,2 , Ling E. Wang 3,4 , Simon B. Eickhoff 3,5 and Gereon R. Fink 2,3 1 Neuromodulation & Neurorehabilitation, Max Planck Institute for Neurological Research, 50931 Cologne, Germany, 2 Department of Neurology, University Hospital Cologne, 50924 Cologne, Germany, 3 Institute of Neurosciences and Medicine—Cognitive Neurology (INM3), Research Centre Ju¨lich, 52425 Ju¨lich, Germany, 4 International Graduate School of Neuroscience, Ruhr-Universita¨t Bochum, 44801 Bochum, Germany and 5 Department of Psychiatry and Psychotherapy, RWTH Aachen University, 52074 Aachen, Germany Both animal and human data suggest that stimulation of the noradrenergic system may influence neuronal excitability in regions engaged in sensory processing and visuospatial attention. We tested the hypothesis that the neural mechanisms subserving motor performance in tasks relying on the visuomotor control of goal- directed hand movements might be modulated by noradrenergic influences. Healthy subjects were stimulated using the selective noradrenaline reuptake inhibitor reboxetine (RBX) in a placebo- controlled crossover design. Functional magnetic resonance imaging and dynamic causal modeling (DCM) were used to assess drug-related changes in blood oxygen level--dependent activity and interregional connectivity while subjects performed a joystick task requiring goal-directed movements. Improved task performance under RBX was associated with increased activity in right visual, intraparietal and superior frontal cortex (premotor/frontal eye field). DCM revealed that the neuronal coupling among these regions was significantly enhanced when subjects were stimulated with RBX. Concurrently, right intraparietal cortex and right superior frontal cortex exerted a stronger driving influence on visuomotor areas of the left hemisphere, including SMA and M1. These effects were independent from task difficulty. The data suggest that stimulating noradrenergic mechanisms may rearrange the functional network architecture within and across the hemispheres, for example, by synaptic gating, thereby optimizing motor behavior. Keywords: effective connectivity, noradrenaline, parietofrontal circuits, pharmacological fMRI, visuomotor control Introduction The noradrenergic transmitter system may influence the discharge properties of neurons engaged in arousal, visuospa- tial attention and motor behavior (Posner and Petersen 1990; Berridge and Waterhouse 2003; Plewnia et al. 2004; Aston- Jones and Cohen 2005a). Stimulating noradrenergic brainstem nuclei such as the locus ceruleus in the dorsorostral pons was demonstrated to change both spontaneous and task-related neuronal discharge frequencies in cortical regions in response to novel or unexpected stimuli (Gibbs and Summers 2002; Berridge and Waterhouse 2003). These neuromodulatory effects of noradrenaline (NA) on cortical processing have been shown to be associated with improved task performance (Aston-Jones and Cohen 2005a). However, the neural mecha- nisms underpinning these noradrenergic effects in widely distributed visuomotor networks (Culham and Kanwisher 2001; Goodale et al. 2004; Grefkes and Fink 2005; Vogt et al. 2007) remain to be elucidated. For example, NA mediated improvements in visuomotor performance might result from a general increase in cortical excitability as a consequence of a global activation of noradren- ergic receptors following systemic pharmacological stimulation. This view is supported by data derived from transcranial magnetic stimulation (TMS) studies demonstrating that neuronal excitability of the primary motor cortex is enhanced under NA stimulation (Ziemann et al. 2002; Plewnia et al. 2004). However, more recent studies showed that enhanced motor excitability per se is insufficient to underlie the observed improvements in motor performance (Plewnia et al. 2006; Lange et al. 2007), and especially tasks which draw upon the visuomotor control of hand movements seem to be susceptible to the stimulation of the NA system (Wang et al. 2009). Hence, the neural mech- anisms subserving the NA effects in visuomotor coordination paradigms might draw upon task associated processes other than solely motor execution, e.g., visual target detection or visuomo- tor transformation (Rizzolatti et al. 1997; Rushworth et al. 2001; Grefkes and Fink 2005). The underlying neural correlates may be found in parietofrontal circuits encompassing intraparietal areas and the dorsal premotor cortex (Aston-Jones 1985; Gibbs and Summers 2002; Grefkes et al. 2004). To further investigate the neural mechanisms underlying NA mediated improvements of visuomotor performance, we designed a functional magnetic resonance imaging (fMRI) study in which healthy subjects performed a joystick task that relied on visuomotor processing and online control of precision movements (Eskandar and Assad 1999; Grefkes et al. 2004). Pharmacological challenge of the NA system was achieved using the selective NA reuptake inhibitor reboxetine (RBX) (Wong et al. 2000). We hypothesized that if motor performance is improved under RBX due to a facilitation of visuomotor information processing, neuronal activity might be enhanced in cortical areas involved in attention and motor control of hand movements, that is, within the aforementioned parietofrontal circuits. Enhancing the influences of modulatory neurotransmit- ters like NA on cortical information processing, however, may also impact on interregional coupling within the visuomotor circuits subserving the visuomotor control of goal-directed joystick movements. Changes in effective connectivity can be assessed by computational approaches such as dynamic causal modeling (DCM) estimating the intrinsic and task-dependent influences that a particular area exerts over the activity of another area (Friston et al. 2003). We, therefore, used DCM to assess drug-related changes in the interaction among visuomotor key regions in both hemispheres. Given the preferential role of the right hemisphere for visuospatial processing (Corbetta and Shulman 2002), we hypothesized that noradrenergic stimulation under RBX might enhance connectivity especially among visuomotor areas in the right hemisphere. Ó The Author 2009. Published by Oxford University Press. All rights reserved. For permissions, please e-mail: [email protected] Downloaded from https://academic.oup.com/cercor/article/20/4/783/303710 by guest on 09 December 2021
Transcript of Noradrenergic Modulation of Cortical Networks - Cerebral Cortex

Cerebral Cortex April 2010;20:783--797
doi:10.1093/cercor/bhp144
Advance Access publication August 17, 2009
Noradrenergic Modulation of CorticalNetworks Engaged in VisuomotorProcessing
Christian Grefkes1,2, Ling E. Wang3,4, Simon B. Eickhoff3,5 and
Gereon R. Fink2,3
1Neuromodulation & Neurorehabilitation, Max Planck Institute
for Neurological Research, 50931 Cologne, Germany,2Department of Neurology, University Hospital Cologne, 50924
Cologne, Germany, 3Institute of Neurosciences and
Medicine—Cognitive Neurology (INM3), Research Centre
Julich, 52425 Julich, Germany, 4International Graduate School
of Neuroscience, Ruhr-Universitat Bochum, 44801 Bochum,
Germany and 5Department of Psychiatry and Psychotherapy,
RWTH Aachen University, 52074 Aachen, Germany
Both animal and human data suggest that stimulation of thenoradrenergic system may influence neuronal excitability in regionsengaged in sensory processing and visuospatial attention. Wetested the hypothesis that the neural mechanisms subserving motorperformance in tasks relying on the visuomotor control of goal-directed hand movements might be modulated by noradrenergicinfluences. Healthy subjects were stimulated using the selectivenoradrenaline reuptake inhibitor reboxetine (RBX) in a placebo-controlled crossover design. Functional magnetic resonanceimaging and dynamic causal modeling (DCM) were used to assessdrug-related changes in blood oxygen level--dependent activity andinterregional connectivity while subjects performed a joystick taskrequiring goal-directed movements. Improved task performanceunder RBX was associated with increased activity in right visual,intraparietal and superior frontal cortex (premotor/frontal eye field).DCM revealed that the neuronal coupling among these regions wassignificantly enhanced when subjects were stimulated with RBX.Concurrently, right intraparietal cortex and right superior frontalcortex exerted a stronger driving influence on visuomotor areas ofthe left hemisphere, including SMA and M1. These effects wereindependent from task difficulty. The data suggest that stimulatingnoradrenergic mechanisms may rearrange the functional networkarchitecture within and across the hemispheres, for example, bysynaptic gating, thereby optimizing motor behavior.
Keywords: effective connectivity, noradrenaline, parietofrontal circuits,pharmacological fMRI, visuomotor control
Introduction
The noradrenergic transmitter system may influence the
discharge properties of neurons engaged in arousal, visuospa-
tial attention and motor behavior (Posner and Petersen 1990;
Berridge and Waterhouse 2003; Plewnia et al. 2004; Aston-
Jones and Cohen 2005a). Stimulating noradrenergic brainstem
nuclei such as the locus ceruleus in the dorsorostral pons was
demonstrated to change both spontaneous and task-related
neuronal discharge frequencies in cortical regions in response
to novel or unexpected stimuli (Gibbs and Summers 2002;
Berridge and Waterhouse 2003). These neuromodulatory
effects of noradrenaline (NA) on cortical processing have been
shown to be associated with improved task performance
(Aston-Jones and Cohen 2005a). However, the neural mecha-
nisms underpinning these noradrenergic effects in widely
distributed visuomotor networks (Culham and Kanwisher
2001; Goodale et al. 2004; Grefkes and Fink 2005; Vogt et al.
2007) remain to be elucidated.
For example, NA mediated improvements in visuomotor
performance might result from a general increase in cortical
excitability as a consequence of a global activation of noradren-
ergic receptors following systemic pharmacological stimulation.
This view is supported by data derived from transcranial
magnetic stimulation (TMS) studies demonstrating that neuronal
excitability of the primary motor cortex is enhanced under NA
stimulation (Ziemann et al. 2002; Plewnia et al. 2004). However,
more recent studies showed that enhanced motor excitability
per se is insufficient to underlie the observed improvements
in motor performance (Plewnia et al. 2006; Lange et al. 2007),
and especially tasks which draw upon the visuomotor control of
hand movements seem to be susceptible to the stimulation of
the NA system (Wang et al. 2009). Hence, the neural mech-
anisms subserving the NA effects in visuomotor coordination
paradigms might draw upon task associated processes other than
solely motor execution, e.g., visual target detection or visuomo-
tor transformation (Rizzolatti et al. 1997; Rushworth et al. 2001;
Grefkes and Fink 2005). The underlying neural correlates may
be found in parietofrontal circuits encompassing intraparietal
areas and the dorsal premotor cortex (Aston-Jones 1985; Gibbs
and Summers 2002; Grefkes et al. 2004).
To further investigate the neural mechanisms underlying NA
mediated improvements of visuomotor performance, we
designed a functional magnetic resonance imaging (fMRI) study
in which healthy subjects performed a joystick task that relied
on visuomotor processing and online control of precision
movements (Eskandar and Assad 1999; Grefkes et al. 2004).
Pharmacological challenge of the NA system was achieved using
the selective NA reuptake inhibitor reboxetine (RBX) (Wong
et al. 2000). We hypothesized that if motor performance is
improved under RBX due to a facilitation of visuomotor
information processing, neuronal activity might be enhanced
in cortical areas involved in attention and motor control of hand
movements, that is, within the aforementioned parietofrontal
circuits. Enhancing the influences of modulatory neurotransmit-
ters like NA on cortical information processing, however, may
also impact on interregional coupling within the visuomotor
circuits subserving the visuomotor control of goal-directed
joystick movements. Changes in effective connectivity can be
assessed by computational approaches such as dynamic causal
modeling (DCM) estimating the intrinsic and task-dependent
influences that a particular area exerts over the activity of
another area (Friston et al. 2003). We, therefore, used DCM to
assess drug-related changes in the interaction among visuomotor
key regions in both hemispheres. Given the preferential role of
the right hemisphere for visuospatial processing (Corbetta and
Shulman 2002), we hypothesized that noradrenergic stimulation
under RBX might enhance connectivity especially among
visuomotor areas in the right hemisphere.
� The Author 2009. Published by Oxford University Press. All rights reserved.
For permissions, please e-mail: [email protected]
Dow
nloaded from https://academ
ic.oup.com/cercor/article/20/4/783/303710 by guest on 09 D
ecember 2021

Material and Methods
SubjectsThe study was approved by the local ethics committee (EK 001/06) and
the German Federal Institute for Drugs and Medical Devices (BfArM,
Bonn, Germany; EudraCT number 2006-000048-23), and conducted in
accordance with the Declaration of Helsinki from 1964. Fifteen
subjects (9 males) with no history of neurological or psychiatric
disease gave informed consent. All participants had a right hand
preference as determined by a handedness questionnaire (Oldfield
1971). The mean age of the subjects was 26.4 ± 4.2 years (age range
from 20 to 33). Parts of the data, that is, the behavioral effects of RBX
on the kinematics of simple finger tapping, joystick guidance and
complex hand-object interaction movements, have already been
published in another paper (Wang et al. 2009). We report here the
effects of RBX on cortical activity and interregional connectivity during
goal-directed joystick movements assessed with fMRI.
Study DesignA placebo (PBO)--controlled, double-blind, within-subject design was
employed to investigate the behavioral and neural effects of a single
dose administration of RBX, a selective NA reuptake inhibitor (SNRI)
(Wong et al. 2000). Solvex tablets (4 mg Reboxetinemesylate, Merz
Pharmaceuticals, Frankfurt, Germany) were used to produce a set of
study capsules (NextPharma, Gottingen, Germany) containing either 8
mg RBX (clinical dose recommended by the manufacturer) or a PBO
formulation with identical visual appearance and weight. Studies on the
pharmacokinetics of RBX in humans showed rapid absorption (tmax � 2
h), an elimination half-time of about 13 h, and a modest clearance and
volume of distribution (ratio to bioavailability: CL/F � 29 mL/min; Vz/F
� 32 L) (Edwards et al. 1995).
Seven subjects received a single dose of 8 mg RBX and, 7 days later,
the PBO, thereby ensuring a sufficiently long wash-out phase (t1/2 of
RBX � 13 h). The other 8 subjects received PBO first and RBX 7 days
later. Before drug administration, pulse and blood pressure were
assessed in order to monitor cardiovascular effects of RBX. The fMRI
sessions were started approximately 2 h after administration of the
study capsules to ensure peak plasma levels of the drug (tmax(RBx) � 2
h; Edwards et al. 1995). Upon completion of the experiments, venous
blood samples (10 mL) were acquired for the analysis of the individual
RBX levels.
Stimulation DevicesWe used a joystick task to probe the visuomotor abilities of the subjects
(Grefkes et al. 2004). The MR compatible joystick was a metal-free,
glass fiber optic based device (Coldswitch Technologies, Inc., Burnaby,
British Columbia, Canada) which was placed on the right side of the
subjects near to the hip. The software ‘‘Presentation’’ (Version 9.9,
Neurobehavioral Systems, Inc., CA, www.neurobehavioralsystems.com)
was used for visual stimulus presentation, joystick control and
movement recordings. Subjects viewed an MR-modified computer
monitor (Apple 30’’ Cinema HD LCD display, resolution = 2560 3 1600
pixels) via a mirror mounted on the head coil from a total distance of
approx. 245 cm (top end of the scanner bore).
Visuomotor TaskSubjects were asked to guide a cursor from a circle in the center of the
screen to a target circle in the periphery of the screen (‘‘center-out
task,’’ Georgopoulos et al. 1982). This task probes the ability of the
subjects to transform the visuospatial coordinates of the target circle
into a corresponding movement vector, a process known as ‘‘visuomo-
tor coordinate transformation’’ (Andersen et al. 1985; Ghahramani et al.
1996). The underlying neural processes also encompass online
feedback mechanisms enabling a permanent control, adjustment and
redirection of the actual movement with the intended movement, and
hence resemble those processes required for visually guided reaching
movements. The peripheral circle appeared in 1 of 8 possible directions
relative to the central circle (0�, 45�, 90�, 135�, 180�, 225�, 270�, 315�;Fig. 1). The distance between the center and the peripheral circle was
12.5 cm (3� visual angle). We used 3 different circle sizes (small ‘‘S’’: 1.1
cm/0.26�; medium ‘‘M’’: 1.9 cm/0.45�; large ‘‘L’’: 3.4 cm/0.79�) in order
to vary task difficulty according to Fitt’s law on the relationship of
movement time, distance and target size (Fitt 1954).
We designed a 2-factorial blocked design experiment with the factor
‘‘drug’’ (comprising the levels ‘‘PBO’’ and ‘‘RBX’’) and the factor
‘‘difficulty level’’ (comprising the levels ‘‘small circles’’ [S], ‘‘medium
circles’’ [M], ‘‘large circles’’ [L]). Circles of the same size (S, M, or L) were
presented in blocks of 5 trials (trial length 4 sec; block length 20 s).
Each trial started from the central circle. Subjects were instructed to
move the cursor as fast and as accurately as possible into the peripheral
circle (randomly appearing in one of the 8 possible positions) and
to hold the cursor within the target until the circle disappeared (2 s
following its onset). Subjects then moved the cursor back to the central
circle and waited until the next peripheral target circle appeared.
Blocks were separated by resting baselines of 20 s during which
subjects watched a black screen. Prior to scanning, subjects were
trained inside the scanner for about 5 min until reaching stable
performance. Subjects were then scanned in a single fMRI run. The
scanning session comprised 21 activation blocks (7 blocks for each
circle size, i.e., small [S], medium [M], and large [L]) and 22 baseline
conditions, and lasted about 14.3 min. The order of conditions was
preudorandomized and counterbalanced across the sequence to account
for ordering effects.
Control fMRI ExperimentWe performed a control fMRI experiment to assess the specificity of
any differences in BOLD activity between RBX and PBO obtained in
the joystick task, that is, whether the cortical regions specifically
responding to RBX stimulation were indeed related to the require-
ments of the visuomotor task or rather reflected unspecific changes in
regional excitability or neurovascular coupling. Subjects were asked
to perform rhythmic fist closures with their right or left hand with
a frequency indicated by a visual cue (1.5 Hz). This task did hence not
draw upon neural mechanisms enabling visuomotor control of goal-
directed movements as required in the joystick task. The paradigm
and technical details have been described elsewhere in more detail
(Grefkes, Eickoff, et al.2008; Grefkes, Nowak, et al. 2008). In short, we
employed a block design in which fist closures were alternated with
resting baselines, each of them lasting 15 s. Subjects were informed via
the video screen which hand (left or right) to move in the upcoming
activation block. Unlike in earlier versions of the experiment,
however, subjects did not perform bimanual movements. The session
comprised 2 (left, right) 3 8 activation blocks (randomized in
sequence) and lasted about 10.2 min. The order of conditions was
again preudorandomized and counterbalanced across the sequence to
account for ordering effects.
Figure 1. Visuomotor joystick task. Subjects were asked to use a joystick to movea cursor from the central circle to one of the randomly appearing peripheral circles.Difficulty levels were manipulated by using 3 different circles sizes with one size perblock.
784 Visuomotor Networks and Noradrenergic Stimulation d Grefkes et al.
Dow
nloaded from https://academ
ic.oup.com/cercor/article/20/4/783/303710 by guest on 09 D
ecember 2021

Functional Magnetic Resonance ImagingFunctional MR images were acquired using a Siemens Trio 3.0 T whole-
body scanner. We employed a gradient echo planar imaging (EPI)
sequence with the following blood oxygenation level--dependent
(BOLD) imaging parameters (joystick task): repetition time [TR] =2250 ms, echo time [TE] = 30 ms, field of view [FOV] = 200 mm, 37
axial slices, slice thickness = 3.0 mm, in-plane resolution = 3.1 3 3.1
mm, flip angle = 90�, distance factor = 10%. The slices covered the brain
from the vertex to lower parts of the cerebellum. Each fMRI time series
consisted of 383 images preceded by 4 dummy images allowing the MR
scanner to reach a steady state in T2* contrast. For the control
experiment (visually paced fist closures), the following EPI parameters
were used: TR = 1600 ms, TE = 30 ms, FOV = 200 mm, 26 axial slices,
slice thickness = 3.0 mm, in-plane resolution = 3.1 3 3.1 mm, flip angle =90�, distance factor = 10%. The fMRI time series consisted of 382
images preceded by 4 dummy images.
Additional high-resolution anatomical images were acquired using
a 3D MP--RAGE (magnetization--prepared, rapid acquisition gradient
echo) sequence with the following parameters: TR = 2250 ms, TE = 3.93
ms, FOV = 256 mm, 176 sagittal slices, slice thickness = 1.0 mm, in-plane
resolution = 1.0 3 1.0 mm, flip angle = 9�, distance factor = 50%.
Behavioral Data AnalysisThe movement time (in ms), the length of the pathway (in mm)
covered by the joystick cursor and reaction time (in ms) were
calculated after 5 Hz filtering of the data with a dual low-pass
Butterworth digital filter (Winter 1990). The onset of the joystick
movement was calculated by applying the algorithm of Teasdale et al.
(1993) to the velocity profile of each movement. The movement time
was defined as the interval between the movement onset and the time
when the cursor entered into the peripheral circle. The length of the
cursor pathway was the distance that the cursor traversed during the
movement time, which was computed by the displacement of 2
continuous time points during the movement time. The reaction time
was the interval between stimuli onsets and movement onsets.
Trials were counted as errors when subjects did not reach the target
circle before it disappeared. For each parameter (movement times,
reaction time, pathway length) we calculated repeated-measures
analyses of variance (RM-ANOVA) with the factors ‘‘drug’’ (2 levels:
PBO, RBX) and the factor ‘‘difficulty level’’ (3 levels: S, M, L).
Image ProcessingFor MR image preprocessing and statistical analysis, we used the SPM
software package (SPM5; Wellcome Department of Imaging Neurosci-
ence, London, UK, www.fil.ion.ucl.ac.uk). The EPI time series of the 2
experiments (joystick task, control task) were processed separately.
After removing the first 4 volumes of a session (dummy images), all EPI
volumes were realigned to the now first EPI of the time series to
correct for head movements. All subjects did not move more than 2 mm
in x, y, z direction, and also head rotation was within acceptable limits
( <1�). After coregistration with the anatomical 3D image, all volumes
were spatially normalized to the standard template of the Montreal
Neurological Institute (MNI, Canada) using the unified segmentation
approach (Ashburner and Friston 2005). An isotropic smoothing kernel
of 8-mm full width half maximum was applied to the EPI images to
suppress noise and effects due to residual differences in functional and
gyral anatomy.
Both experiments (joystick task, control task) were analyzed in
separate design matrices. Box-car vectors for each condition were
convolved with a canonical hemodynamic response function and its
first temporal derivative in the framework of the general linear model
(GLM) (Kiebel and Holmes 2004). The time series in each voxel were
high-pass filtered at 1/128 Hz. The 6 head motion parameters as
assessed by the realignment algorithm were treated as covariates
(regressors of no interest) to exclude movement related variance from
the image time series. Simple main effects for each of the experimental
conditions were calculated for each subject by applying appropriate
baseline contrasts.
For the group analysis of the joystick task data, the parameter
estimates of all conditions were compared between subjects (n = 15) in
a full-factorial ANOVA with the factors ‘‘drug’’ (factor levels ‘‘RBX’’ and
‘‘PBO’’), and ‘‘circle size’’ (3 levels: ‘‘small’’, ‘‘medium’’, ‘‘large’’), thereby
effecting a random effects model. For the visuomotor control
experiment, we used a separate ANOVA with the factors ‘‘drug’’
(RBX, PBO), and ‘‘hand’’ (left, right). In order to assess interactions
between the 2 experimental tasks and the pharmacological challenge,
we constructed an additional ANOVA with the factor ‘‘task’’ (levels:
joystick movements with the right hand; fist closure movements with
the right hand) and ‘‘drug’’ (RBX, PBO). A statistical threshold of P <
0.05 (family wise error corrected on the cluster level) was employed to
identify significantly activated regions in both fMRI experiments.
Dynamic Causal ModelingA key focus of the present study was to investigate whether and—if
so—how RBX stimulation of the noradrenergic system modulates the
interregional coupling of areas involved in visuomotor control. Such
changes in interregional coupling may occur independently from the
actual task or might be linked to a specific condition (e.g., joystick
movements at different levels of task difficulty). DCM (Friston et al.
2003) allows assessing both the task-independent and task-dependent
coupling of areas activated by the joystick task under RBX and PBO.
DCM treats the brain as a nonlinear deterministic system in which
external inputs cause changes in neural activity that in turn lead to
changes in the fMRI signal (Friston et al. 2003; Penny et al. 2004; Kiebel
et al. 2007; Stephan et al. 2007). As this approach explicitly models
neuronal activity, which is then linked via a biophysically validated
hemodynamic model (Friston et al. 2003) to the measured functional
response (i.e., a change in the BOLD response), DCM is closely related
to changes in neural dynamics in both time and space (Friston et al.
2003). The changes in neuronal states over time are modeled as
dx
dt=
A + +
m
j=1
ujBðjÞ
!x +Cu
where x is the neuronal state vector, A represents the intrinsic
connectivity, B(j) represent the task-dependent modulations of the
modeled region driven by the input function u (which in the present
study is either 0 or 1 due to the box-car function of the employed block
design), and C represents the influence of sensory inputs to the system.
As becomes evident from this formulation, the intrinsic connectivity (A
matrix) represents those interactions among areas which were
independent from the specific influences a condition may have during
any given fMRI session (i.e., RBX or PBO). By contrast, task-dependent
modulations represented in the B matrix only contribute to the
changes in neuronal states when the respective condition (here:
joystick movements at different levels of task difficulty) is performed.
Regions of InterestDCM is a hypotheses-driven approach to model effective connectivity
between distinct regions, and has to rely on an a priori neurobiological
model reflecting the hypothesis on relevant regions and connections
involved in the task. As DCMs are fitted to subject-specific BOLD time
series (Friston et al. 2003), we extracted the BOLD time series from 8
ROIs at subject specific coordinates (8-mm spheres around individual
activation maxima) in the individual SPMs. All regions of interest were
defined by functional and anatomical criteria based on the individual
activation maps superimposed on the corresponding structural T1-
volume. For each ROI, we used the group maximum MNI coordinate as
origin to search for the closest local maximum in the individual SPM
maps meeting the a priori defined anatomical constraints (see below).
The coordinates of all individual ROIs are given in Supplementary
Table 2.
We constructed a bihemispheric visuomotor network with ROIs
based on the following assumptions: Subjects used their right hand for
guiding the joystick to the visual targets, hence the underlying neural
processes should engage motor areas predominantly in the left
hemisphere (Fig. 2). Primary motor (M1), dorsal premotor (dPMC),
and the supplementary motor area (SMA) feature key regions in of the
motor system, and were hence included in the connectivity model.
Anatomical landmarks for M1 were the ‘‘hand knob’’ in the central
Cerebral Cortex April 2010, V 20 N 4 785
Dow
nloaded from https://academ
ic.oup.com/cercor/article/20/4/783/303710 by guest on 09 D
ecember 2021

sulcus. dPMC was identified at the junction of the superior branch of
the precentral sulcus and superior frontal sulcus. SMA was located on
the mesial cortical surface anterior to the paracentral lobule, superior
to the cingulate sulcus and posterior to the coronal plane running
through the anterior commissure (y coordinate < 0). Furthermore,
intraparietal cortex (IPS) as part of the dorsal visual stream
(Ungerleider and Mishkin 1982) constitutes an important region for
integrating sensory information into motor plans, and was also included
in the connectivity matrix. In macaques, visuomotor integration-related
areas are the lateral intraparietal area (LIP) for eye movements
(Andersen et al. 1990), and the medial intraparietal area (MIP) for
arm movements (Colby and Duhamel 1991). The putative human
homologues of LIP and MIP are both most likely situated on the medial
bank of the intraparietal sulcus (IPS) (Grefkes and Fink 2005). Figure
2A demonstrated that the joystick task strongly activated (medial)
intraparietal cortex and the adjacent superior parietal lobe. We hence
used the medial wall of the horizontal IPS branch as anatomical
landmark for the IPS ROI. As subjects used visual information for
guiding the joystick to the targets, we also incorporated V1 in the
model. It is important to note that assuming a connection between V1
and IPS does not imply a direct anatomical connection, but rather
a functional interaction mediated by other areas of the visual system
linking occipital to parietal cortex such as area V6 (Galletti et al. 2001).
For the construction of the connectivity network, we then assumed
that the 3 regions showing enhanced BOLD activity under RBX in the
right hemisphere (Fig. 3A, Table 1) interact with the visuomotor
network in the left hemisphere. Therefore, the connectivity model also
included V1 in the right calcarine sulcus, right intraparietal cortex (IPS,
horizontal branch), and the cortex at the junction of the right precentral
sulcus and superior frontal sulcus. The latter region may correspond
to the frontal eye field (FEF) (Bruce and Goldberg 1985) or to the
‘‘rostral subdivision of dorsal premotor cortex’’ which in macaques is
also influenced by both eye and hand movements (Boussaoud 2001).
We from now on refer to this region as FEF/dPMC as we cannot
reliably distinguish between both areas based on the fMRI data.
The putative connections among the 8 ROIs in the left and right
hemisphere were derived from invasive connectivity studies in
nonhuman primates. We, accordingly, constructed an intrinsic connec-
tivity matrix assuming connections between SMA and ipsilateral and
contralateral M1 (Rouiller et al. 1994), between SMA and ipsilateral
(Luppino et al. 1993) as well as contralateral dPMC/FEF (Boussaoud
et al. 2005), SMA and ipsilateral IPS (Cavada and Goldman-Rakic 1989),
between dPMC and ipsilateral M1 (Rouiller et al. 1994), as well as
transcallosal connections between V1--V1 (Kennedy et al. 1986), IPS--
IPS (Neal 1990; Padberg et al. 2005), and dPMC--dPMC/FEF (Marconi
et al. 2003; Boussaoud et al. 2005). The IPS-dPMC/FEF connection used
in the present study is thought to represent the parietofrontal circuits
between area LIP and FEF, or MIP and dPMC, which cannot be clearly
distinguished in the present task as the areas of both circuits in IPS
(MIP, LIP) and in superior frontal cortex (dPMC/FEF) are adjacent
regions sharing similar neuronal properties (Simon et al. 2002).
Note that the obtained connectivity parameters may not be assumed
to necessarily reflect monosynaptic anatomical connections but rather
the net effect a region exerts on the activity of another region, for
Figure 2. Visuomotor network engaged in the joystick task. Compared with the resting baseline, guiding the joystick cursor into the peripheral targets activated a widespreadnetwork of visuomotor areas in both hemispheres (group analysis; random effects model; P\0.05, FWE corrected). (A) BOLD activity under PBO (left) and after RBX (right). Colorscale represents T-values. Major sulci are labeled: cs, central sulcus; ips, intraparietal sulcus; sfs, superior frontal sulcus. (B) The effect of circle size (small vs. large) wasespecially pronounced in right thalamus. The parameter estimates extracted from the local maximum demonstrated a decrease in BOLD activity for easier (i.e., larger) targets forboth PBO and RBX stimulation.
786 Visuomotor Networks and Noradrenergic Stimulation d Grefkes et al.
Dow
nloaded from https://academ
ic.oup.com/cercor/article/20/4/783/303710 by guest on 09 D
ecember 2021

example, transmitted via direct connections, a single relay area or more
extensive (subcortical) loops.
Connectivity ModelsDCMs were estimated separately for each of the 2 sessions (RBX, PBO)
in each subject, thereby allowing an identification of changes in inter-
regional coupling induced by the pharmacological challenge. As all
connections outlined above have reliably been established in non-
human primates, they can be assumed to exist in humans, and hence
are likely to represent the anatomical (i.e., intrinsic) scaffold of our
connectivity model.
In addition to the intrinsic coupling as outlined above, we also analyzed
how guiding the joystick to circles of different diameter (S, M, L)
modulated effective connectivity within this network. These task-
dependent modulations, however, do not necessarily affect all of the
intrinsic connections. We, therefore, constructed 19 different connec-
tivity models (Supplementary Fig. 1) reflecting biologically plausible
hypotheses about the context-specific modulations of interregional
coupling. These models differed in the number of connections (i.e.,
complexity) and the routes of information transfer (e.g., bottom-up,
top-down). For all models, we assumed that neural activity was driven
by the visual cortex (V1) as all joystick movements depended on the
visual analysis of the target circles.
Bayesian Model SelectionWe used Bayesian model selection (Penny et al. 2004) as implemented
in SPM5 to test which of the 19 connectivity models showed the
highest evidence in the applied Bayesian framework in our data. Bayes
factors can be interpreted in a similar way like P values in classical
statistics. The Bayes factor is a summary of the evidence provided by
the data in favor of one statistical model as opposed to another. The
model evidence is approximated using both the Bayesian Information
Criterion (BIC) and the Akaike Information Criterion (AIC), and
a decision is only made if BIC and AIC concur (Penny et al. 2004;
Stephan et al. 2007). The ‘‘winning’’ model should then represent the
best balance between the relative fit and complexity of the model
(Stephan et al. 2007) for both sessions (PBO, RBX). Following the
estimation of all models and the computation of subject specific Bayes
factors for pairwise model comparison (Penny et al. 2004), average
Bayes factors (ABF) were assessed by multiplying the individual Bayes
factors of the same model comparison across subjects and computing
the geometric mean (Stephan et al. 2007). We additionally calculated
Figure 3. Drug specific effects in the joystick task. Compared with PBO, stimulating healthy subjects with RBX significantly increased cortical activity in right visual (V1),intraparietal (IPS) and superior frontal cortex (frontal eye field, FEF, and adjacent dorsal premotor cortex, dPMC), and decreased activity in left M1 (group analysis; P\ 0.05, FWEcorrected on the cluster level). The plots next to the figures demonstrate the neural responses in the local maxima of the 3, respectively, 4 activation clusters, separated for thedifferent difficulty levels (i.e., circle sizes: s, small; m; medium; l, large) and drug sessions (PBO; RBX). Error bars: SEM. ro, rostral; oc, occipital; cs, central sulcus. Otherabbreviations as in Figure 2.
Cerebral Cortex April 2010, V 20 N 4 787
Dow
nloaded from https://academ
ic.oup.com/cercor/article/20/4/783/303710 by guest on 09 D
ecember 2021

the positive evidence ratio (PER) for each model comparison: The PER
represents the number of subjects in whom the Bayes factor gave
a positive evidence for model A in relation to the number of subjects
showing a stronger evidence for the alternative model B (Stephan et al.
2007). We considered the model with the highest ABF and best PER in
both sessions (RBX, PBO) as the ‘‘winning model’’, that is, the model
which received the maximum evidence from our fMRI data (Penny
et al. 2004; Stephan et al. 2007). The connectivity parameters (intrinsic
connections and modulatory influences) of the winning model were
then entered in a second level analysis by means of a one-sample t-test
for corresponding (RBX, PBO) coupling parameter from the subject
specific DCMs. Connections were considered statistically significant if
they passed a threshold of P < 0.05 (Bonferroni--Holm corrected for
multiple comparisons). Paired t-tests were used to identify statistically
significant differences in the intrinsic or contextual coupling between
RBX and PBO (P < 0.05).
Results
Physiological Data
All subjects had significant drug plasma levels approximately
2 h after oral administration of 8 mg RBX (186 ± 86 ng/mL;
one-sample 2-sided t-test; t = 8.7; P < 0.001). The analysis of
cardiovascular parameters (pulse frequency, blood pressure)
did not reveal significant differences before and after
RBX administration (repeated measures ANOVA; F = 1.06,
P = 0.32).
Behavioral Data
Repeated measures ANOVA revealed a significant main effect of
‘‘drug’’ (PBO, RBX; F1,14 = 8.31, P = 0.012) and ‘‘circle size’’
(small/medium/large; F2,28 = 300.09, P < 0.001) on movement
times. Post hoc t-tests showed that movements were signifi-
cantly faster for larger circles compared with smaller circles
(P < 0.001), reflecting the impact of task difficulty on
movement times. Furthermore, for all circles sizes (i.e.,
difficulty levels) subjects were significantly faster under RBX
stimulation compared with PBO (P < 0.05; Table 2). The
interaction of the factors ‘‘drug’’ and ‘‘circle size’’ was not
significant (F2,28 = 0.30, P = 0.74) indicating no differential
effect of RBX for different task difficulties. Correlating RBX
plasma levels with the improvements in movement time (RBX--
PBO) yielded a significant result for the most difficult condition
(i.e., targeting at small circles) (r = 0.78, P < 0.01), whereas
correlations between RBX concentrations and improvements
for medium (r = 0.27) and large (r = 0.23) circles were not
significant (P > 0.05). The average improvement in movement
speed (collapsed over all 3 difficulty levels) was only weakly
correlated with RBX blood concentrations and just failed the
pre-set statistical threshold (r = 0.56; P = 0.057).
There was no significant difference for the movement times
in early blocks compared with late blocks, neither for RBX nor
for PBO (P > 0.05), indicating no relevant learning effects
during the scanning sessions. Reaction times (stimulus
onset—start of joystick movement) were not affected by the
factor ‘‘drug’’ (F1,14 = 0.01, P = 0.94) or by the factor ‘‘difficulty
level’’ (F2,28 = 0.35, P = 0.71). Furthermore, we found no
statistically significant difference between RBX and PBO for
pathway lengths (F1,14 = 1.81; P = 0.20) or error rates (F1,14 =1.65; P = 0.22). In other words, the improvements in movement
speed were not at the cost of movement accuracy, as would be
reflected by longer pathways or more errors.
Functional Imaging Data
Figure 2A demonstrates the neural network activated by the
visuomotor joystick task across all difficulty levels (small,
medium, large circles) for both the PBO session (left) and the
RBX session (right). The network revealed by this analysis
comprised sensorimotor areas (left M1, SI, SII, bilateral ventral
PMC, SMA, preSMA, and bilateral dPMC extending into FEF),
parietal cortex (bilateral IPS, superior parietal lobule), visual
areas (bilateral V1--V5), bilateral superior and inferior cerebel-
lum, and subcortical regions (thalamus, bilateral putamen)
(Table 1). Activation clusters were more extended on the right
hemisphere when subjects were stimulated with RBX compared
with PBO (Fig. 2A). This impression was statistically confirmed
by testing for a differential effect between BOLD activity under
RBX versus PBO. This analysis ([RBX_S + RBX_M + RBX_L] >
[PBO_S + PBO_M + PBO_L]) identified 3 cortical right hemi-
spheric areas which showed a significant increase in BOLD
activity under RBX (P < 0.05; FWE corrected on the cluster level;
Fig. 3 and Table 1): 1) right calcarine sulcus (V1), 2) fundus of
the IPS extending from the medial bank to the rostral end, and 3)
the frontal cortex at the intersection of the precentral sulcus
and superior frontal sulcus (FEF/dPMC) (P < 0.05, corrected at
the cluster level). Enhanced activity under RBX in subcortical
regions was found in the thalamus and putamen in both
Table 1Local maxima of significantly activated regions (FWE-corrected P\ 0.05)
Coordinates Side Region T-value
Effect of task (all conditions vs. baseline)�38, �20, 51 L Precentral gyrus, ‘‘hand knob’’ 26.8�56, �18, 41 L Postcentral sulcus 25.3730, �96, �5 R Occipital pole 21.01�5, �12, 55 L Paracentral lobule, SMA 20.03�32, �10, 53 L Precentral sulcus, premotor 19.6636, �88, �7 R Lateral occipital cortex 19.5636, �42, 51 R IPS 17.34, �2, 55 R Paracentral lobule, SMA 17.2940, �6, 51 R Precentral sulcus 16.5854, 4, 37 R Precentral sulcus, ventral premotor 15.8720, �64, 59 R IPS 15.73
�20, �60, 63 L IPS 15.63�6, �20, 49 L Cingulate sulcus 14.24�52, 2, 39 L Precentral sulcus, ventral premotor 14.11�44, �26, 19 L Parietal operculum, SII 13.15�24, �76, 29 L Parieto-occipital junction 13.0646, �70, 1 R Middle occipital/inferior temporal (V5) 12.32
�42, �66, 5 L Middle occipital/inferior temporal (V5) 12.03�08, �86, 3 L Calcarine sulcus, V1 9.0850, 8, 5 R Frontal operculum 8.96
�42, 4, 5 L Frontal operculum 8.1216, �84, 3 R Calcarine sulcus, V1 6.8442, �26, 19 R Parietal operculum, SII 5.5332, �48, �31 R Superior cerebellum 19.35
�14, �15, 5 L Thalamus 16.4418, �60, �49 R Inferior cerebellum 14.33
�22, 6, �1 L Basal ganglia, putamen 13.99�28, �56, �23 L Superior cerebellum 13.6624, 4, 1 R Basal ganglia, putamen 12.0212, �14, 7 R Thalamus 10.37
�16, �56, �45 L Inferior cerebellum 5.55RBX versus PBO
26, 4, 57 R Superior frontal sulcus/superiorprecentral sulcus
6.64
38, �54, 41 R IPS, horizontal branch 5.6218, �86, 1 R Calcarine sulcus 5.5721, �8, �3 R Basal ganglia (putamen) 5.6820, �26, 9 R Thalamus 4.56
�16, �28, 5 L Thalamus 4.39�28, �8, �5 L Basal ganglia (putamen) 4.11
PBO versus RBX�36, �26, 55 L Precentral gyrus, ‘‘hand knob’’ 5.48
788 Visuomotor Networks and Noradrenergic Stimulation d Grefkes et al.
Dow
nloaded from https://academ
ic.oup.com/cercor/article/20/4/783/303710 by guest on 09 D
ecember 2021

hemispheres (Table 1), and at uncorrected thresholds (P <
0.001) also in left V1. The reverse contrast (PBO > RBX)
identified left M1 to have stronger activity during PBO
stimulation compared with RBX (Fig. 3 and Table 1). The main
effect of circle size was not significant (P < 0.05, FWE corrected
on the cluster level). Only directly comparing small circles
against large circles [PBO_S + RBX_S] > [PBO_L + RBX_L])
yielded a significant difference in right thalamus (P = 0.05,
corrected on the cluster level; Fig. 2B). At a more liberal
statistical threshold (P < 0.001, uncorrected), the data showed
that guiding the joystick cursor into small circles evoked
stronger BOLD signal changes in cortical regions located in left
inferior parietal lobule (–56, –18, 39), right ventral premotor
cortex (60, 10, 27) and right dorsal premotor cortex (42, –12,
53). Trends for higher activity at more difficult conditions were
also evident from the BOLD response estimates in Figure 3
extracted from the local maxima showing differential activity for
RBX and PBO. Hence, the parametrical modulation of the
visuomotor difficulty level indicated a stronger engagement of
especially right hemispheric cortical and thalamus for more
difficult conditions.
Control Experiment
The control experiment was performed to evaluate whether
the RBX mediated increases in BOLD activity in the main
experiment were specific to the visuomotor joystick task, or
rather reflected unspecific effects, for example, due to changes
in the neurovascular response by enhanced stimulation of
noradrenergic receptors in blood vessels. As illustrated by
Figure 4, the activation pattern for right hand movements, that
is, the same hand as used for guiding the joystick, were almost
identical between both sessions (P < 0.05, FWE corrected)
which was confirmed by the differential contrast showing no
statistically significant difference for either hand (P > 0.05). In
other words, no differential effect of RBX on the activity
pattern in this simple motor task was observed. In order to
exclude possible confounds in sensitivity, we extracted the
BOLD responses (parameter estimates) from the 3 RBX
Figure 4. Activity in the control task. The activity pattern for visually paced fist closures did not differ between RBX and PBO sessions (group analysis; random effects model;P\ 0.05, corrected). The neural responses extracted from the peak voxels (see white circles in the right hemisphere) identified by the RBX versus PBO contrast in the mainexperiment (cf. Fig. 3) were not significantly different between both drug sessions (P[ 0.05). RH, right hand; LH, left hand. Other abbreviations as in Figures 2 and 3.
Cerebral Cortex April 2010, V 20 N 4 789
Dow
nloaded from https://academ
ic.oup.com/cercor/article/20/4/783/303710 by guest on 09 D
ecember 2021

responsive regions in the joystick experiment (i.e., right V1,
IPS, and FEF; see white circles in Fig. 4) The data showed that
there was not even a trend for increased BOLD activity in the 3
regions during RBX stimulation (compared with PBO) in
contrast to the first experiment. This was statistically con-
firmed by an interaction contrast between the factors ‘‘task’’
(levels: joystick movements with right hand, fist closures with
right hand) and ‘‘drug’’ (PBO, RBX): Only when subjects were
stimulated with RBX in the joystick condition, a differential
increase in the BOLD response was observed in right V1, IPS,
and FEF/dPMC (Suppl. Fig. 2). The reverse interaction contrast
produced no significant voxels, even at uncorrected P values
(P < 0.001). The data hence imply that the BOLD signal
increase under RBX was specific to the visuomotor demands
probed by the joystick task.
Connectivity Analysis
Following the GLM analysis, we estimated the effects of RBX on
the effective connectivity among visuomotor key regions
activated by the joystick task. Bayesian model selection
identified one connectivity model (model 17, cf. Supplemental
Fig. 1) to receive the highest statistical model evidence
compared with all other models tested. Importantly, this model
was indicated for the RBX and PBO sessions by both ABF and
PER (see Suppl. Table 1).
Intrinsic Connectivity under PBO
The intrinsic coupling of areas can be regarded as baseline
connectivity established by the entire experimental context
(Friston et al. 2003) onto which context- (i.e., condition-)
dependent modulations are added. The model we chose was
based upon the assumption that the visual information (e.g., the
position of the circles necessary for starting a movement in
a given trial) entered the cortical system via V1 in both
hemispheres (‘‘driving input’’, Fig. 5A). This information was
then propagated to the IPS, which itself was reciprocally
connected with the 2 premotor areas (dPMC, SMA) and with its
contralateral counterpart via transcallosal connections. The
model further featured that both frontal regions (dPMC, FEF)
regions were reciprocally connected with each other, with left
SMA and left M1. The SMA was also reciprocally connected to
left M1 and to the IPS.
The parameter estimates for these intrinsic connections
showed a strong positive coupling among, in particular, left
hemispheric areas (Fig. 5A, Table 3). The reciprocal connections
between V1-IPS, IPS-PMC, IPS-SMA, SMA-M1, and PMC-M1 were
strongly asymmetric (P < 0.001 for left hemispheric connections,
P <0.05for righthemisphericconnections) suggestingapreferred
flow of neural information from visual cortex via parietal to
premotor areas and finally M1. Left IPS had a significantly stronger
influence on right IPS than vice versa (P = 0.035). The strongest
influence on intrinsic M1 activity was exerted by left dPMC,
Figure 5. Intrinsic connectivity (group analysis) between visuomotor key regions under PBO and RBX. Coupling parameters indicate connection strength, which is also coded inthe size of the arrows representing effective connectivity. The greater the absolute value (reflecting the rate constant of the observed influence in 1/s), the stronger the effect onearea exerts upon another. Colored arrows indicate significant increases (red) and decreases (blue) in the RBX session compared with PBO (P\ 0.05, corrected). (A) Couplingparameters in the PBO session demonstrate strong influences between left V1 and left IPS, left IPS and left PMC/SMA, and both premotor regions to left M1. (B) Couplingparameters under RBX stimulation show a significant enhancement of effective connectivity 1) within the right hemisphere, and 2) between areas of the right and the lefthemisphere (red arrows). By contrast, neuronal coupling was significantly reduced (compared with PBO) between some areas of the left hemisphere, especially those originatingfrom left dPMC (blue arrows).
Table 2Group data (n 5 15) of the movement times (ms, mean ± SEM) from both drug sessions
Circle size PBO (ms) RBX (ms) Difference(ms)
P value(t-test)
Small 1007 ± 31 951 ± 25 55 ± 22 0.026Medium 806 ± 28 761 ± 17 44 ± 19 0.038Large 621 ± 22 581 ± 19 40 ± 17 0.035Mean 811 ± 27 765 ± 20 47 ± 20 0.012
Note: Subjects under RBX stimulation were significantly faster compared with PBO for all difficulty
levels (2-tailed paired t-tests).
790 Visuomotor Networks and Noradrenergic Stimulation d Grefkes et al.
Dow
nloaded from https://academ
ic.oup.com/cercor/article/20/4/783/303710 by guest on 09 D
ecember 2021

followed by left SMA and—significantly less (P < 0.001)—by right
FEF/dPMC. Connectivity within the right hemisphere was
significantly weaker for all connections except for the (retro-
grade) connection between IPS and V1 (P = 0.084).
Effect of RBX on Intrinsic Connectivity
RBX challenge evoked several changes in the intrinsic coupling
within and across hemispheres (Fig. 5B). Significant increases
were found for the coupling among right V1 and right IPS as
well as between right IPS and right FEF/dPMC (red arrows in
Fig. 5B) when subjects had received RBX. Likewise, trans-
callosal influences exerted from right IPS and right FEF/dPMC
on left hemispheric areas were significantly enhanced under
RBX. These enhancements were, however, not significantly
correlated with the individual improvements in movement
speed (P > 0.05 for all comparisons). Furthermore, none of the
connections in the left hemisphere showed a stronger coupling
under RBX. Rather, the connections originating from left PMC
to ipsilateral IPS, SMA and M1 showed small, but significant (P <
0.05) reductions in coupling strengths.
Hence, the increased activity in right V1, right IPS and right
FEF/dPMC under RBX (as demonstrated in the GLM analysis,
Fig. 3) could be explained by a significantly enhanced driving
influence of right V1 on right IPS, and right IPS on right FEF/
dPMC. The data furthermore suggest that RBX mediated
a stronger control of activity in left hemispheric areas by
frontoparietal areas of the right hemisphere which was
independent from task difficulty.
Task-Dependent Modulation under PBO
The strongest modulation of connectivity (depending on task
difficulty) was observed for the connection between left V1 to
left IPS which was most pronounced for the ‘‘small circle’’
condition (highest difficulty level; Fig. 6A). Connectivity from
SMA and PMC onto M1 activity was also enhanced, albeit to
a lesser degree than that along the V1-IPS-PMC axis. In the
right hemisphere, there was a strong effect of circle size on
effective connectivity: Although medium and large circles did
not specifically modulate connectivity in the right hemisphere,
guiding the cursor into small circles significantly enhanced
neural coupling between right V1 and right IPS and between
right IPS and right FEF/dPMC. In other words, higher difficulty
levels in guiding the joystick caused a stronger coupling within
the visuomotor system, also among right hemispheric areas.
Task-Dependent Modulations under RBX
The task-specific modulations of the interregional coupling
under RBX were very similar as compared with PBO (Fig. 6B).
The only statistically significant reduction in interregional
coupling was observed for the connection between left PMC
and left M1 for the highest difficulty level (i.e., the ‘‘small circle’’
condition). Right hemispheric connections were not differen-
tially modulated by RBX for any different difficulty level (P >
0.05). Likewise, there were no significant correlations between
changes in coupling rates and task improvements (P > 0.05).
The connectivity data, therefore, suggest that there were only
weak effects of RBX on interregional coupling for a specific
difficulty level (matching the behavioral data).
Task-Specificity of the DCM Changes
In order to assess whether the RBX induced differences in
interregional coupling were indeed specific to the joystick task,
we performed a separate DCM analysis on the visuomotor
Table 3Significant coupling parameters for RBX and PBO in Hz (P\ 0.05, Bonferroni--Holm corrected) for the intrinsic connections (A) and their condition-related modulations reflecting the influence of task
difficulty on interregional coupling (B)
(A) Intrinsic connectivity (A) Intrinsic connectivity (continued)
Connections PBO RBX t-Test Connections PBO RBX t-Test
Origin--target Mean SEM Mean SEM P Origin--target Mean SEM Mean SEM P
L_IPS--L_PMC 0.430 0.012 0.404 0.018 n.s. L_SMA--L_PMC 0.199 0.018 0.177 0.021 n.s.L_IPS--L_SMA 0.354 0.024 0.343 0.025 n.s. L_SMA--R_FEF 0.066 0.012 0.093 0.012 n.s.L_IPS--L_V1 0.067 0.019 0.046 0.014 n.s. L_V1--L_IPS 0.401 0.024 0.363 0.034 n.s.L_IPS--R_IPS 0.182 0.027 0.184 0.029 n.s. L_V1--R_V1 0.074 0.021 0.067 0.015 n.s.L_M1--L_PMC 0.132 0.012 0.106 0.015 0.046 R_IPS--L_IPS 0.099 0.031 0.147 0.040 0.025L_M1--L_SMA 0.116 0.016 0.095 0.016 0.060 R_IPS--R_FEF 0.047 0.011 0.122 0.023 0.001L_M1--R_FEF 0.046 0.007 0.053 0.009 n.s. R_IPS--R_V1 0.032 0.007 0.063 0.011 0.013L_PMC--L_IPS 0.202 0.025 0.148 0.024 0.016 R_FEF--L_M1 0.050 0.010 0.094 0.019 0.007L_PMC--L_M1 0.288 0.011 0.255 0.018 0.033 R_FEF--L_PMC 0.046 0.011 0.085 0.019 0.012L_PMC--L_SMA 0.214 0.019 0.186 0.021 0.037 R_FEF--L_SMA 0.042 0.010 0.073 0.016 0.017L_PMC--R_FEF 0.080 0.016 0.114 0.014 n.s. R_FEF--R_IPS 0.028 0.006 0.043 0.009 n.s.L_SMA--L_IPS 0.164 0.024 0.129 0.025 n.s. R_V1--L_V1 0.021 0.008 0.034 0.012 n.s.L_SMA--L_M1 0.224 0.020 0.203 0.020 n.s. R_V1--R_IPS 0.081 0.023 0.153 0.027 0.000
(B) Small circle size Medium circle size Large circle size
Connections PBO RBX PBO RBX PBO RBX
Origin--Target Mean SEM Mean SEM P Mean SEM Mean SEM P Mean SEM Mean SEM P
L_IPS--L_PMC 0.113 0.013 0.089 0.018 n.s 0.092 0.011 0.075 0.013 n.s. 0.095 0.017 0.048 0.014 n.s.L_PMC--L_M1 0.078 0.011 0.049 0.014 0.037 0.071 0.013 0.041 0.012 n.s. 0.065 0.011 0.049 0.014 n.s.L_SMA--L_M1 0.053 0.007 0.033 0.011 n.s 0.049 0.010 n.s n.s. n.s. 0.048 0.008 0.036 0.011 n.s.L_V1--L_IPS 0.130 0.017 0.106 0.022 n.s 0.101 0.012 0.066 0.014 n.s. 0.073 0.015 0.059 0.017 n.s.R_IPS--R_FEF 0.028 0.010 0.053 0.016 n.s n.s n.s n.s n.s n.s. n.s n.s n.s n.s n.s.R_V1--R_IPS 0.037 0.011 0.058 0.019 n.s. n.s n.s n.s n.s n.s. n.s n.s n.s n.s n.s.
Note: n.s.: not significant.
Cerebral Cortex April 2010, V 20 N 4 791
Dow
nloaded from https://academ
ic.oup.com/cercor/article/20/4/783/303710 by guest on 09 D
ecember 2021
control task using the ROI coordinates and connectivity
matrices derived from the joystick task. We then computed
a repeated measures ANOVA with the factors ‘‘task’’ (levels:
‘‘joystick task’’, ‘‘hand clenching task’’), ‘‘drug’’ (levels: ‘‘RBX’’,
‘‘PBO’’), and ‘‘connection’’ (26 intrinsic coupling parameters).
Although the main effect of drug was not significant (P =0.718), there were significant interactions between task and
connection (P < 0.001), between drug and connection (P =0.001) and for task 3 drug 3 connection (P < 0.001). Pairwise
t-tests revealed that in contrast to the significant differences
reported above for the joystick task none of the connections
was significantly different between the PBO condition and
the RBX condition for the hand clenching task (P > 0.05 for
each comparison). Especially the significant 3-way interaction
and the pairwise t-tests suggest that the differences in
coupling rates observed under RBX were specific to the
joystick task.
Discussion
We used the NA reuptake inhibitor RBX to modulate the neural
mechanisms underlying visuomotor processing during goal-
directed hand movements as probed by a joystick task. The
behavioral data showed that stimulating healthy subjects with
RBX significantly increased movement speed for target-
directed joystick movements. The improvements in visuomotor
performance were associated with enhanced activity in right
hemispheric areas known to be involved in visuospatial
attention and motor control (Culham and Kanwisher 2001;
Grefkes and Fink 2005). The connectivity analysis showed that
these differential activations can be explained by increased
coupling of right V1, IPS, and FEF/dPMC with left hemispheric
areas, which was independent from task difficulty. Hence,
stimulating the NA system with RBX mediated a bihemispheric
rearrangement of the functional network architecture that
might have enabled a more efficient implementation of the
visuospatial capacities of the right hemisphere (Seidler et al.
2004), thereby improving behavioral performance in the
joystick task.
Dynamic Causal Modeling
DCM is an approach to assess neurobiological hypotheses about
effective connectivity based on a neuronal-system-model of
network interactions. Importantly, DCM is designed for model-
ing interactions in a priori assumed networks (though different
alternative hypotheses are compared via Bayesian model
selection). It is, however, not intended as an exploratory tool
to test which areas in the brain interact with a particular area of
interest, as would be possible using, for example, Granger
causality models (Roebroeck et al. 2005) or psychophysical
interaction (PPI) analyses (Friston et al. 1997; Stephan et al.
2003). DCM treats the brain as a deterministic system in which
external inputs cause changes in neural activity that in turn lead
to changes in the fMRI signal (Friston et al. 2003; Penny et al.
2004). The approach employed by DCM is to explicitly model
neuronal activity, which is then linked via a biophysically
validated hemodynamic model (Friston et al. 2003) to the
measured functional response (i.e., a change in the BOLD
response). DCM therefore is much closer related to changes in
neural dynamics in both time and space than previous
approaches used to estimate connectivity. One important
consideration in the assessment of DCMs is that the modeled
effects represent effective as opposed to axonal connectivity.
That is, although one usually strives to constrain to anatomically
plausible connections, DCM does not rely on a direct axonal
connection between 2 regions. Rather, the observed functional
effects may also be mediated by (implicitly captured) relays
(Friston et al. 2003; Grefkes, Eickoff, et al. 2008).
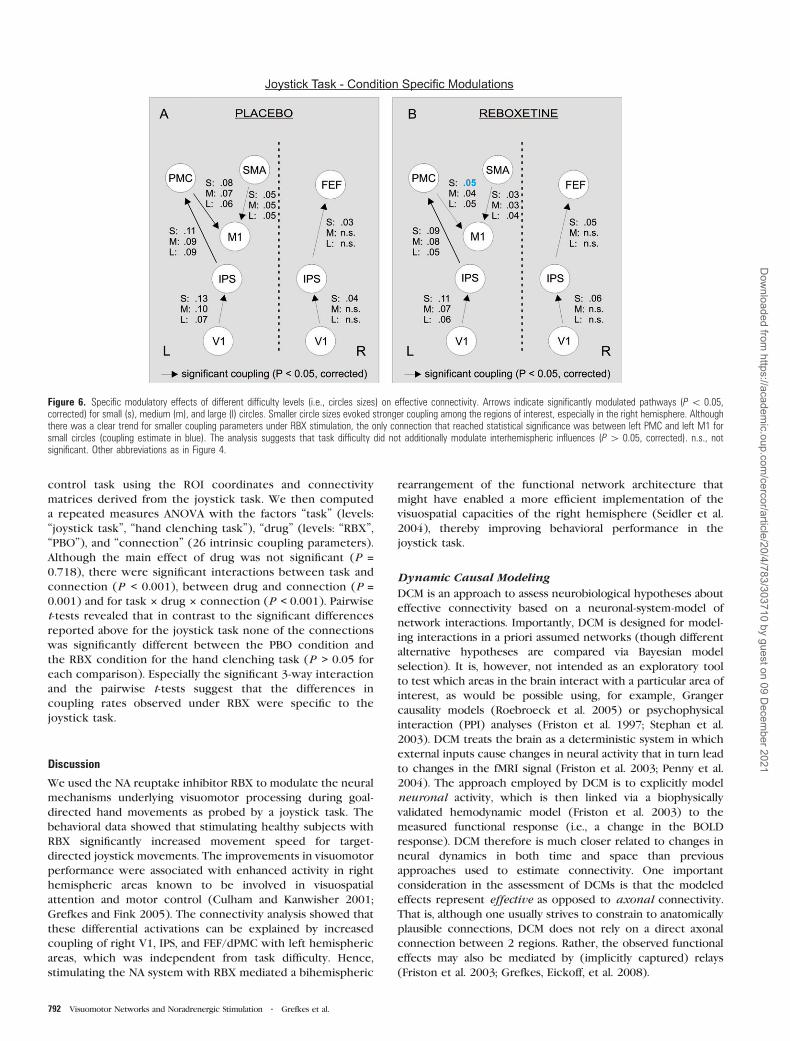
Figure 6. Specific modulatory effects of different difficulty levels (i.e., circles sizes) on effective connectivity. Arrows indicate significantly modulated pathways (P \ 0.05,corrected) for small (s), medium (m), and large (l) circles. Smaller circle sizes evoked stronger coupling among the regions of interest, especially in the right hemisphere. Althoughthere was a clear trend for smaller coupling parameters under RBX stimulation, the only connection that reached statistical significance was between left PMC and left M1 forsmall circles (coupling estimate in blue). The analysis suggests that task difficulty did not additionally modulate interhemispheric influences (P [ 0.05, corrected). n.s., notsignificant. Other abbreviations as in Figure 4.
792 Visuomotor Networks and Noradrenergic Stimulation d Grefkes et al.
Dow
nloaded from https://academ
ic.oup.com/cercor/article/20/4/783/303710 by guest on 09 D
ecember 2021

Pharmacological Modulation of Performance
Interactions in cortical networks underlying behavioral perfor-
mance are ultimately driven by the interplay of neurotransmit-
ters with their specific receptors (Loubinoux, Pariente, Rascol,
et al. 2002; Plewnia et al. 2004; Floel et al. 2005). However, the
effects exerted upon the neural architecture by pharmacolog-
ical stimulation most likely differ between the different
receptor systems and the task under investigation. For
example, there is growing evidence that stimulating the human
NA system with RBX does not affect performance in simple
motor tasks (resembling the hand clenching task of the present
study) (Plewnia et al. 2006; Zittel et al. 2007, Wang et al. 2009),
but rather improves those motor tasks relying on visuomotor
integration and 3D-coordination (Plewnia et al. 2004; Wang
et al. 2009). Loubinoux et al. (2002b) showed that stimulation
of serotonergic receptors by means of paroxetine (a selective
serotonin reuptake inhibitor) may significantly enhance visuo-
motor performance in tasks relying on practice. These use-
dependent effects are associated with an increase of BOLD
response in contralateral sensorimotor areas (Loubinoux,
Pariente, Boulanouar, et al. 2002), that is, regions which have
previously been associated with motor learning (Sakai et al.
1998; Muller et al. 2002). In contrast, in the present study, RBX
stimulation did not significantly influence visuomotor learning
(as the repetition by drug interactions for movement times or
errors were not significant), and the fMRI results did not reveal
enhanced recruitment of a sensorimotor ‘‘learning’’ network.
Rather, increased activity was observed in the thalamus and
particularly in right hemispheric regions in visual, parietal and
frontal cortex resembling patterns of activations previously
referred to as the ‘‘attention network’’ (Nobre et al. 1997;
Corbetta et al. 2008).
Noradrenergic Mechanisms Influencing VisuomotorProcessing
The neurotransmitter system that has been frequently associ-
ated with influencing alertness and attention is the noradren-
ergic system (Posner and Petersen 1990). The most important
source for cortical NA is the locus ceruleus (LC) in the pontine
brainstem which widely projects to the spinal cord, thalamus,
and cortex (Berridge and Waterhouse 2003; Logan et al. 2007;
Takano et al. 2008). Studies in rats demonstrated that RBX
administration may inhibit the firing of LC neurons (Wong et al.
2000). Such effects may well result from increased extracellular
NA acting at alpha-2 autoreceptors on LC neurons (Berridge
and Abercrombie 1999; Wong et al. 2000) which might also
help to explain opposite effects of RBX on the discharge of LC
neurons and target neurons of the LC. However, the question
remains why enhancing noradrenergic transmission selectively
improves visuomotor network functions given the broad
distribution of norepinephrine fibers and the presumably
system wide action of RBX on NA release. Studies in rats
showed that low-dose administration of the NA reuptake
inhibitor methylphenidate may differentially enhance NA
transmission in prefrontal cortex compared with other cortical
regions (Berridge et al. 2006). This gradient of efficacy of RBX
to raise NA levels may explain differences in connectivity
changes between more frontal cortical regions and those more
posterior. The cellular mechanisms underlying such regionally
specific effects are likely to comprise differences in the
distribution of adrenergic receptor subtypes (alpha-1, alpha-2,
beta-receptors), in the respective receptor sensitivity for NA
binding, and in the local modulation of NA release (Bonanno
et al. 1989; Berridge et al. 2006; Devilbiss et al. 2006). Similar
mechanisms may also underlie the regionally specific changes
in BOLD signal and connectivity observed as a result of RBX
stimulation. However, we found no correlation of the BOLD
signal changes or DCM connectivity changes with RBX plasma
levels. The findings that 1) neural changes were not correlated
with RBX plasma concentrations and 2) RBX effects were
absent in the visuomotor control task suggest that rather other,
more indirect mechanisms (e.g., modulation of LC activity or
synaptic gating mechanisms) than direct interference of RBX
with cortical synapses might be responsible for the effects
observed in the present study. For example, data derived from
studies in macaques suggest that changes in the phasic
discharge of LC neurons during target detection may enhance
the gain of neural responses in sensorimotor regions, thereby
speeding up behavioral responses (Aston-Jones and Cohen
2005b). Electrophysiological studies imply that an appropriate
state of arousal might facilitate the task-related phasic
discharge of the LC (Aston-Jones et al. 1999; Clayton et al.
2004; Rajkowski et al. 2004), thereby improving behavioral
responses. Studies in rats showed that both frequency and
pattern of LC discharge may determine NA release in cortical
regions such as the prefrontal or parietal cortex (Florin-
Lechner et al. 1996; Berridge and Abercrombie 1999; Devoto
et al. 2005). Also within the same region, stimulation of the LC
or application of NA can differentially modulate the respon-
siveness of neighboring neurons responding to the same
peripheral stimulus (Devilbiss et al. 2006). The effects of RBX
on extracellular levels of norepinephrine might also depend
upon the impulse activity of the LC. This activity may change
according to the behavioral state as might occur under
conditions of higher LC output, for example, during the
challenges of the joystick task opposed to the less demanding
fist closure task.
However, the behavioral data did not show significant
differences in reaction times when subjects were stimulated
with RBX. Hence, RBX might not have facilitated stimulus
detection but rather the neural mechanisms subserving the
control of guiding the cursor into the target circle as suggested
by the faster movements under RBX. Electrophysiological
studies in rodents showed that enhancing NA transmission
has divergent effects on neurons found in different cortical
layers, thereby modulating stimulus feature coding and signal-
to-noise ratio (Hurley et al. 2004). For example, in visual cortex,
enhancing NA may increase the signal-to-noise ratio (measured
as spike train activity) by decreasing spontaneous activity
(Hasselmo et al. 1997). The current fMRI data also showed
enhanced BOLD responses in visual cortex under RBX
stimulation. Furthermore, global enhancement of NA trans-
mission by systemic administration of a NA reuptake blocker
might have facilitated the gating of neural information, that is,
the increase in the responsiveness of neurons to otherwise
subthreshold stimuli (Devilbiss and Waterhouse 2000). Ac-
cordingly, the better use of sensory (visual, proprioceptive)
feedback information during movement execution (due to
RBX-induced neural gating) might have speeded up the
joystick movements in the present study. Although RBX may
have induced a system-wide increase in NA levels, neuronal
processing might have been especially facilitated in those
regions contributing to the actual task. Consistent with this
Cerebral Cortex April 2010, V 20 N 4 793
Dow
nloaded from https://academ
ic.oup.com/cercor/article/20/4/783/303710 by guest on 09 D
ecember 2021

view, the imaging data point to a modulation of areas known to
be involved in visuospatial attention and online control of hand
movements. Also the connectivity analysis implies that neural
gating mechanisms might play a crucial role for the RBX effects
observed in the present study, for example, by enhancing the
functional interactions among areas in the right hemisphere.
Such a hypothesis is in line with a recent study in rats
demonstrating that overall functional connectivity among
ensembles of neurons may be enhanced with increasing LC
output and NA efflux (Devilbiss et al. 2006).
Networks Engaged in Visuospatial Attention and MotorControl
The connectivity analysis suggested a preferred flow of neural
information from V1 over IPS to premotor and motor areas
(Figs 5 and 6), which is in good accordance with data derived
from studies in nonhuman primates (Rizzolatti et al. 1997). The
data imply enhanced influences of right IPS on right V1 under
RBX stimulation. Such a top-down mechanism could explain
the higher BOLD activity observed in right V1 compared with
PBO (Fig. 3A; left V1 activity was much less enhanced under
RBX and only significant at uncorrected thresholds). The IPS is,
however, not only engaged in visual attention (Nobre et al.
1997; Thiel et al. 2004; Corbetta et al. 2008), but also in
visuomotor intention (Rushworth et al. 2003) and online
control of movements (Eskandar and Assad 1999; Grefkes et al.
2004). Our results suggest that the stronger implementation of
right frontoparietal areas into the visuomotor network sub-
serving the joystick movements may have reduced the
computational load posed onto the left hemisphere. In
macaques, medial intraparietal cortex (area MIP) is engaged
in planning and execution of reaching movements (Colby
1998), and is strongly connected to the dorsal premotor cortex
(Rizzolatti et al. 1998). Medial IPS is supposed to transform
sensory (e.g., visual, auditory) target information into a common
eye-centered reference frame which can be ‘‘read out’’ by the
motor system independent of the type of action planned
(Cohen and Andersen 2000, 2002). Therefore, stronger
activation of intraparietal cortex mediated by RBX stimulation
might reflect enhanced engagement of transformation pro-
cesses facilitating the integration of visual information into
planned motor programs (i.e., goal-directed joystick move-
ments) (Rushworth et al. 2001; Astafiev et al. 2003; Grefkes and
Fink 2005).
Although it is tempting to conclude that the critical neural
correlate for improved task performance is the human homo-
logue of area MIP, we cannot make such a clear anatomical
statement as also the human homologue of the LIP area is found
on medial IPS in humans (Koyama et al. 2004; Grefkes and Fink
2005). This area is involved in the transformation of (visuo-)
spatial coordinates in saccadic eye movements (Andersen 1995;
Snyder et al. 2000), and also projects to superior frontal cortex,
that is, the frontal eye fields (FEF) which are located slightly
rostral to the reaching related neurons in dPMC (Boussaoud et al.
1998; Schall and Thompson 1999). In a more conceptual
framework, the FEF is thought to transform visual signals into
motor commands (i.e., saccades), hence subserving similar
properties as hand/arm related neurons in dorsal premotor
cortex (Schall and Thompson 1999; Schubotz and von Cramon
2003). However, cell recordings in macaques demonstrated that
more than half of FEF neurons can bemodulated by hand position
signals (Boussaoud et al. 1998; Thura et al. 2008), which may
indicate that these regions have an important role beyond
saccade programming, for example, in mediating visual salience
and spatial attention for the control of hand and eye movements
(Thompson and Bichot 2005). Although we cannot exclude that
changes in eye movements might have played a role for the
BOLD signal increases observed under RBX stimulation, the
strong lateralization of activity to the right hemisphere and
the asymmetric changes in interhemispheric connectivity speak
against a purely saccade related effect: Both saccades and also the
suppression of eye movements typically show strong bilateral
activations of the frontal eye fields (Paus 1996; Corbetta et al.
1998; Connolly et al. 2002). Furthermore, the faster joystick
movements under RBX were not associated with faster reaction
times in starting the joystick movements after target onset.
Hence, although we cannot rule out differences in eye move-
ments between the RBX and PBO session, the missing effects
on reaction times imply that target selection and control of
saccades might not have played a dominant role for the neural
effects observed. We rather suggest that the enhanced influence
of right IPS onto the right FEF/dPMC region mediated by RBX
may reflect the promotion of an interaction between eye- and
hand-related neurons for the planning and execution of visually
guided joystick movements (Boussaoud et al. 1998; Thura et al.
2008). Such a view is consistent with data showing that also
human oculomotor areas in IPS and FEF are involved in pointing
preparation and execution (Simon et al. 2002; Astafiev et al.
2003). It remains, therefore, difficult to separate the specific
contributions of different attentional mechanisms to the joystick
task. Andersen and Buneo (2003) also emphasize the extremely
similar coding strategies of the reaching and saccade related
areas in IPS suggesting that both regions (MIP, LIP) are parts of
a single network for the purpose of coordinating hand and
eye movements, and which might both have been activated by
the current experiment.
Conclusions
The present study shows that improvements in visuomotor
performance following noradrenergic stimulation with RBX
underlie not only changes in regional activity but also complex
network effects affecting both neural processing within and
across the hemispheres. We, therefore, conclude that motor
improvements under noradrenergic stimulation (Evans et al.
1976; Butefisch et al. 2002; Plewnia et al. 2004) might not
simply reflect general arousal effects impacting on motor
cortex excitability, but rather a (task-) specific modulation of
the neural networks subserving the visuomotor control of
target-directed movements. Such a view is compatible with
data from animal experiments showing that stimulation of the
LC--NA system may change functional connectivity among
selective ensembles of neurons, thereby maximizing informa-
tion processing capabilities of cerebral networks (Devilbiss
et al. 2006). Modulation of connectivity among cellular
assemblies might also account for the beneficial effects of NA
enhancing drugs in pathological conditions, for example, after
a stroke (Zittel et al. 2007). As stroke patients may show
profound changes in the effective connectivity among motor
areas across both hemispheres (Grefkes et al. 2008b), drugs
such as RBX might effectively interfere with disturbances in
interregional coupling. Analyses of effective connectivity (e.g.,
by using DCM) may, therefore, contribute to further our
understanding of the neural effects induced by novel treatment
794 Visuomotor Networks and Noradrenergic Stimulation d Grefkes et al.
Dow
nloaded from https://academ
ic.oup.com/cercor/article/20/4/783/303710 by guest on 09 D
ecember 2021

approaches (pharmacological or electrophysiological interven-
tions) aiming at improving neurological functions.
Funding
Marie Curie Early Stage Training Programme ‘‘NovoBrain’’ funded
by the European Union to L.E.W.; Initiative and Networking Fund
of the Helmholtz Association within the Helmholtz Alliance on
Systems Biology to S.B.E.
Notes
We thank Dr Manuel Dafotakis for his medical support. We are grateful
to the M.R. staff for their technical support. Conflict of Interest : None
declared.
Address correspondence to Christian Grefkes, MD, Neuromodulation
& Neurorehabilitation, Max-Planck-Institute for Neurological Research,
Gleueler Str. 50, 50931 Koln, Germany. Email: christian.grefkes@
uk-koeln.de.
References
Andersen RA. 1995. Encoding of intention and spatial location in the
posterior parietal cortex. Cereb Cortex. 5:457--469.
Andersen RA, Bracewell RM, Barash S, Gnadt JW, Fogassi L. 1990. Eye
position effects on visual, memory, and saccade-related activity in
areas LIP and 7a of macaque. J Neurosci. 10:1176--1196.
Andersen RA, Buneo CA. 2003. Sensorimotor integration in posterior
parietal cortex. Adv Neurol. 93:159--177.
Andersen RA, Essick GK, Siegel RM. 1985. Encoding of spatial location
by posterior parietal neurons. Science. 230:456--458.
Ashburner J, Friston K. 2005. Unified segmentation. Neuroimage.
26:839--851.
Astafiev SV, Shulman GL, Stanley CM, Snyder AZ, Van Essen DC,
Corbetta M. 2003. Functional organization of human intraparietal
and frontal cortex for attending, looking, and pointing. J Neurosci.
23:4689--4699.
Aston-Jones G. 1985. The locus coeruleus: behavioral functions of locus
coeruleus derived from cellular attributes. Physiol Psychol. 13:
118--126.
Aston-Jones G, Rajkowski J, Cohen J. 1999. Role of locus coeruleus in
attention and behavioral flexibility. Biol Psychiatry. 46:1309--1320.
Aston-Jones G, Cohen JD. 2005a. An integrative theory of locus
coeruleus-norepinephrine function: adaptive gain and optimal
performance. Annu Rev Neurosci. 28:403--450.
Aston-Jones G, Cohen JD. 2005b. Adaptive gain and the role of the locus
coeruleus-norepinephrine system in optimal performance. J Comp
Neurol. 493:99--110.
Berridge CW, Abercrombie ED. 1999. Relationship between locus coe-
ruleus discharge rates and rates of norepinephrine release within
neocortex assess by in vivo microdialysis. Neuroscience. 9:1263--1270.
Berridge CW, Devilbiss DM, Andrejewski ME, Arnsten AFT, Kelley AE,
Schmeichel B, Hamilton C, Spencer RC. 2006. Methylphenidate
preferentially increases catecolamine neurotransmission within the
prefrontal cortex at low doses that enhance cognitive function. Biol
Psychiatry. 60:1111--1120.
Berridge CW, Waterhouse BD. 2003. The locus coeruleus-noradrenergic
system: modulation of behavioral state and state-dependent cognitive
processes. Brain Res Brain Res Rev. 42:33--84.
Bonanno G, Fontana G, Fedele W, Robino G, Raiteri M. 1989.
Presynaptic mechanisms underlying the gamma-aminobutyric acid-
evoked receptor-independent release of [3H]norepinephrine in rat
hippocampus. J Neurochem. 52:1854--1858.
Boussaoud D. 2001. Attention versus intention in the primate premotor
cortex. Neuroimage. 14:S40--S45.
Boussaoud D, Jouffrais C, Bremmer F. 1998. Eye position effects on the
neuronal activity of dorsal premotor cortex in the macaque
monkey. J Neurophysiol. 80:1132--1150.
Boussaoud D, Tanne-Gariepy J, Wannier T, Rouiller EM. 2005. Callosal
connections of dorsal versus ventral premotor areas in the macaque
monkey: a multiple retrograde tracing study. BMC Neurosci. 6:67.
Bruce CJ, Goldberg ME. 1985. Primate frontal eye fields. I. Single
neurons discharging before saccades. J Neurophysiol. 53:603--635.
Butefisch CM, Davis BC, Sawaki L, Waldvogel D, Classen J, Kopylev L,
Cohen LG. 2002. Modulation of use-dependent plasticity by D-
amphetamine. Ann Neurol. 51:59--68.
Cavada C, Goldman-Rakic PS. 1989. Posterior parietal cortex in rhesus
monkey: II. Evidence for segregated corticocortical networks
linking sensory and limbic areas with the frontal lobe. J Comp
Neurol. 287:422--445.
Clayton EC, Rajkowski J, Cohen JD, Aston-Jones G. 2004. Phasic
activation of monkey locus ceruleus neurons by simple decisions in
a forced-choice task. J Neurosci. 24:9914--9920.
Cohen YE, Andersen RA. 2000. Reaches to sounds encoded in an eye-
centered reference frame. Neuron. 27:647--652.
Cohen YE, Andersen RA. 2002. A common reference frame for
movement plans in the posterior parietal cortex. Nat Rev Neurosci.
3:553--562.
Colby CL. 1998. Action-oriented spatial reference frames in cortex.
Neuron. 20:15--24.
Colby CL, Duhamel JR. 1991. Heterogeneity of extrastriate visual areas
and multiple parietal areas in the macaque monkey. Neuropsycho-
logia. 29:517--537.
Connolly JD, Goodale MA, Menon RS, Munoz DP. 2002. Human fMRI
evidence for the neural correlates of preparatory set. Nat Neurosci.
5:1345--1352.
Corbetta M, Akbudak E, Conturo TE, Snyder AZ, Ollinger JM, Drury HA,
Linenweber MR, Petersen SE, Raichle ME. 1998. A common network
of functional areas for attention and eye movements. Neuron. 21:
761--773.
Corbetta M, Patel G, Shulman GL. 2008. The reorienting system of the
human brain: from environment to theory of mind. Neuron. 58:
306--324.
Corbetta M, Shulman GL. 2002. Control of goal-directed and stimulus-
driven attention in the brain. Nat Rev Neurosci. 3:201--215.
Culham JC, Kanwisher NG. 2001. Neuroimaging of cognitive functions
in human parietal cortex. Curr Opin Neurobiol. 11:157--163.
Devilbiss DM, Page ME, Waterhouse BD. 2006. Locus ceruleus regulates
sensory encoding by neurons and networks in waking animals. J
Neurosci. 26:9860--9872.
Devilbiss DM, Waterhouse BD. 2000. Norepinephrine exhibits two
distinct profiles of action on sensory cortical neuron responses to
excitatory synaptic stimuli. Synapse. 37:273--282.
Devoto P, Flore G, Saba P, Fa M, Gessa GL. 2005. Stimulation of the locus
coeruleus elicits noradrenaline and dopamine release in the medial
prefrontal and parietal cortex. J Neurochem. 92:368--374.
Edwards DM, Pellizzoni C, Breuel HP, Berardi A, Castelli MG, Frigerio E,
Poggesi I, Rocchetti M, Dubini A, Strolin BM. 1995. Pharmacokinet-
ics of reboxetine in healthy volunteers. Single oral doses, linearity
and plasma protein binding. Biopharm Drug Dispos. 16:443--460.
Eskandar EN, Assad JA. 1999. Dissociation of visual, motor and
predictive signals in parietal cortex during visual guidance. Nat
Neurosci. 2:88--93.
Evans MA, Martz R, Lemberger L, Rodda BE, Forney RB. 1976. Effects of
dextroamphetamine on psychomotor skills. Clin Pharmacol Ther.
19:777--781.
Fitt PM. 1954. The information capacity of the human motor system in
controlling the amplitude of movement. J Exp Psychol. 47:381--391.
Floel A, Hummel F, Breitenstein C, Knecht S, Cohen LG. 2005.
Dopaminergic effects on encoding of a motor memory in chronic
stroke. Neurology. 65:472--474.
Florin-Lechner SM, Druhan JP, Aston-Jones G, Valentino RJ. 1996.
Enhanced norepinephrine release in prefrontal cortex with burst
stimulation of the locus coeruleus. Brain Res. 742:89--97.
Friston KJ, Buechel C, Fink GR, Morris J, Rolls E, Dolan RJ. 1997.
Psychophysiological and modulatory interactions in neuroimaging.
Neuroimage. 6:218--229.
Friston KJ, Harrison L, Penny W. 2003. Dynamic causal modelling.
Neuroimage. 19:1273--1302.
Galletti C, Gamberini M, Kutz DF, Fattori P, Luppino G, Matelli M. 2001.
The cortical connections of area V6: an occipito-parietal network
processing visual information. Eur J Neurosci. 13:1572--1588.
Cerebral Cortex April 2010, V 20 N 4 795
Dow
nloaded from https://academ
ic.oup.com/cercor/article/20/4/783/303710 by guest on 09 D
ecember 2021

Georgopoulos AP, Kalaska JF, Caminiti R, Massey JT. 1982. On the rela-
tions between the direction of two-dimensional arm movements
and cell discharge in primate motor cortex. J Neurosci. 2:1527--1537.
Ghahramani Z, Wolpert DM, Jordan MI. 1996. Generalization to local
remappings of the visuomotor coordinate transformation. J Neuro-
sci. 16:7085--7096.
Gibbs ME, Summers RJ. 2002. Role of adrenoceptor subtypes in memory
consolidation. Prog Neurobiol. 67:345--391.
Goodale MA, Westwood DA, Milner AD. 2004. Two distinct modes of
control for object-directed action. Prog Brain Res. 144:131--144.
Grefkes C, Eickhoff SB, Nowak DA, Dafotakis M, Fink GR. 2008.
Dynamic intra- and interhemispheric interactions during unilateral
and bilateral hand movements assessed with fMRI and DCM.
Neuroimage. 41:1382--1394.
Grefkes C, Fink GR. 2005. The functional organization of the
intraparietal sulcus in humans and monkeys. J Anat. 207:3--17.
Grefkes C, Nowak DA, Eickhoff SB, Dafotakis M, Kust J, Karbe H, Fink GR.
2008. Cortical connectivity after subcortical stroke assessed with
functional magnetic resonance imaging. Ann Neurol. 63:236--246.
Grefkes C, Ritzl A, Zilles K, Fink GR. 2004. Human medial intraparietal
cortex subserves visuomotor coordinate transformation. Neuro-
image. 23:1494--1506.
Hasselmo M, Linster C, Patil M, Ma D, Cekic M. 1997. Noradrenergic
suppression of synaptic transmission may influence cortical signal-
to-noise ratio. J Neurophysiol. 77:3326--3339.
Hurley LM, Devilbiss DM, Waterhouse BD. 2004. A matter of focus:
monoaminergic modulation of stimulus coding in mammalian
sensory networks. Curr Opin Neurobiol. 14:488--495.
Kennedy H, Dehay C, Bullier J. 1986. Organization of the callosal
connections of visual areas V1 and V2 in the macaque monkey. J
Comp Neurol. 247:398--415.
Kiebel S, Holmes A. 2004. The general linear model. In: Frackowiak RS,
Friston K, Frith CD, Dolan RJ, Price CJ, Zeki S, Ashburner J, Penny W,
editors. Human brain function. 2nd ed. San Diego: Elsevier Academic
Press. p. 725--761.
Kiebel SJ, Kloppel S, Weiskopf N, Friston KJ. 2007. Dynamic causal
modeling: a generative model of slice timing in fMRI. Neuroimage.
34:1487--1496.
Koyama M, Hasegawa I, Osada T, Adachi Y, Nakahara K, Miyashita Y.
2004. Functional magnetic resonance imaging of macaque monkeys
performing visually guided saccade tasks, comparison of cortical eye
fields with humans. Neuron. 41:795--807.
Lange R, Weiller C, Liepert J. 2007. Chronic dose effects of reboxetine
on motor skill acquisition and cortical excitability. J Neural Transm.
114:1085--1089.
Logan J, Wang GJ, Telang F, Fowler JS, Alexoff D, Zabroski J, Jayne M,
Hubbard B, King P, Carter P, et al. 2007. Imaging the norepinephrine
transporter in humans with (S,S)-[11C]O-methyl reboxetine and
PET: problems and progress. Nucl Med Biol. 34:667--679.
Loubinoux I, Pariente J,BoulanouarK,CarelC,ManelfeC,RascolO,Celsis P,
Chollet F. 2002. A single dose of the serotonin neurotransmission
agonist paroxetine enhances motor output: double-blind, placebo-
controlled, fMRI study in healthy subjects. Neuroimage. 15:26--36.
Loubinoux I, Pariente J, Rascol O, Celsis P, Chollet F. 2002. Selective
serotonin reuptake inhibitor paroxetine modulates motor behavior
through practice. A double-blind, placebo-controlled, multi-dose
study in healthy subjects. Neuropsychologia. 40:1815--1821.
Luppino G, Matelli M, Camarda R, Rizzolatti G. 1993. Corticocortical
connections of area F3 (SMA-proper) and area F6 (pre-SMA) in the
macaque monkey. J Comp Neurol. 1993:114--140.
Marconi B, Genovesio A, Giannetti S, Molinari M, Caminiti R. 2003.
Callosal connections of dorso-lateral premotor cortex. Eur J
Neurosci. 18:775--788.
Muller RA, Kleinhans N, Pierce K, Kemmotsu N, Courchesne E. 2002.
Functional MRI of motor sequence acquisition: effects of learning
stage and performance. Brain Res Cogn Brain Res. 14:277--293.
Neal JW. 1990. The callosal connections of area 7b, PF in the monkey.
Brain Res. 514:159--162.
Nobre AC, Sebestyen GN, Gitelman DR, Mesulam MM, Frackowiak RS,
Frith CD. 1997. Functional localization of the system for visuospatial
attention using positron emission tomography. Brain. 120:515--533.
Oldfield RC. 1971. The assessment and analysis of handedness: The
Edinburgh inventory. Neuropsychologia. 9:97--113.
Padberg J, Disbrow E, Krubitzer L. 2005. The organization and
connections of anterior and posterior parietal cortex in titi monkeys:
do new world monkeys have an area 2? Cereb Cortex. 15:1938--1963.
Paus T. 1996. Location and function of the human frontal eye-field:
a selective review. Neuropsychologia. 34:475--483.
Penny WD, Stephan KE, Mechelli A, Friston KJ. 2004. Comparing
dynamic causal models. Neuroimage. 22:1157--1172.
Plewnia C, Hoppe J, Cohen LG, Gerloff C. 2004. Improved motor skill
acquisition after selective stimulation of central norepinephrine.
Neurology. 62:2124--2126.
Plewnia C, Hoppe J, Gerloff C. 2006. No effects of enhanced central
norepinephrine on finger-sequence learning and attention. Psycho-
pharmacology. 187:260--265.
Posner MI, Petersen SE. 1990. The attention system of the human brain.
Annu Rev Neurosci. 13:25--42.
Rajkowski J, Majczynski H, Clayton EC, Aston-Jones G. 2004. Activation
of monkey locus coeruleus neurons varies with difficulty and
performance in a target detection task. J Neurophysiol. 92:361--371.
Rizzolatti G, Fogassi L, Gallese V. 1997. Parietal cortex: From sight to
action. Curr Opin Neurobiol. 4:562--567.
Rizzolatti G, Luppino G, Matelli M. 1998. The organization of the
cortical motor system: new concepts. Electroencephalogr Clin
Neurophysiol. 106:283--296.
Roebroeck A, Formisano E, Goebel R. 2005. Mapping directed influence
over the brain using Granger causality and fMRI. Neuroimage.
25:230--242.
Rouiller EM, Babalian A, Kazennikov O, Moret V, Yu XH,
Wiesendanger M. 1994. Transcallosal connections of the distal
forelimb representations of the primary and supplementary
motor cortical areas in macaque monkeys. Exp Brain Res. 102:
227--243.
Rushworth MF, Johansen-Berg H, Gobel SM, Devlin JT. 2003. The left
parietal and premotor cortices: motor attention and selection.
Neuroimage. 20(Suppl. 1):S89--S100.
Rushworth MF, Paus T, Sipila PK. 2001. Attention systems and the
organization of the human parietal cortex. J Neurosci. 21:
5262--5272.
Sakai K, Hikosaka O, Miyauchi S, Takino R, Sasaki Y, Putz B. 1998.
Transition of brain activation from frontal to parietal areas in
visuomotor sequence learning. J Neurosci. 18:1827--1840.
Schall JD, Thompson KG. 1999. Neural selection and control of visually
guided eye movements. Annu Rev Neurosci. 22:241--259.
Schubotz RI, von Cramon DY. 2003. Functional-anatomical concepts of
human premotor cortex: evidence from fMRI and PET studies.
Neuroimage. 20(Suppl. 1):S120--S131.
Seidler RD, Noll DC, Thiers G. 2004. Feedforward and feedback
processes in motor control. Neuroimage. 22:1775--1783.
Simon O, Mangin JF, Cohen L, Le Bihan D, Dehaene S. 2002.
Topographical layout of hand, eye, calculation, and language-related
areas in the parietal lobe. Neuron. 33:475--487.
Snyder LH, Batista AP, Andersen RA. 2000. Intention-related activity in
the posterior parietal cortex, a review. Vision Res. 40:1433--1441.
Stephan KE, Marshall JC, Friston KJ, Rowe JB, Ritzl A, Zilles K, Fink GR.
2003. Lateralized cognitive processes and lateralized task control in
the human brain. Science. 301:384--386.
Stephan KE, Weiskopf N, Drysdale PM, Robinson PA, Friston KJ. 2007.
Comparing hemodynamic models with DCM. Neuroimage. 38:
387--401.
Takano A, Varrone A, Gulyas B, Karlsson P, Tauscher J, Halldin C.
2008. Mapping of the norepinephrine transporter in the human
brain using PET with (S,S)-[18F]FMeNER-D2. Neuroimage. 42:
474--482.
Teasdale N, Bard C, Fleury M, Young DE, Proteau L. 1993. Determining
Movement Onsets from Temporal Series. J Mot Behav. 25:97--106.
Thiel CM, Zilles K, Fink GR. 2004. Cerebral correlates of alerting,
orienting and reorienting of visuospatial attention: an event-related
fMRI study. Neuroimage. 21:318--328.
Thompson KG, Bichot NP. 2005. A visual salience map in the primate
frontal eye field. Prog Brain Res. 147:251--262.
796 Visuomotor Networks and Noradrenergic Stimulation d Grefkes et al.
Dow
nloaded from https://academ
ic.oup.com/cercor/article/20/4/783/303710 by guest on 09 D
ecember 2021

Thura D, Boussaoud D, Meunier M. 2008. Hand position affects saccadic
reaction times inmonkeys and humans. J Neurophysiol. 99:2194--2202.
Ungerleider LG, Mishkin M. 1982. Two cortical visual systems. In: Ingle
DJ, Goodale MA, Mansfield RJW, editors. Analysis of visual behavior.
Cambridge (MA): The MIT Press. p. 549--586.
Vogt S, Buccino G, Wohlschlager AM, Canessa N, Shah NJ, Zilles K,
Eickhoff SB, Freund HJ, Rizzolatti G, Fink GR. 2007. Prefrontal
involvement in imitation learning of hand actions: effects of practice
and expertise. Neuroimage. 37:1371--1383.
Wang LE, Fink GR, Dafotakis M, Grefkes C. 2009. Noradrenergic
stimulation and motor performance: Differential effects of rebox-
etine on movement kinematics and visuomotor abilities in healthy
human subjects. Neuropsychologia. 47:1302--1312.
Winter DA. 1990. Biomechanics and Motor Control of Human
Movement. 2nd ed. New York: Wiley.
Wong EH, Sonders MS, Amara SG, Tinholt PM, Piercey MF,
Hoffmann WP, Hyslop DK, Franklin S, Porsolt RD, Bonsignori A,
et al. 2000. Reboxetine: a pharmacologically potent, selective, and
specific norepinephrine reuptake inhibitor. Biol Psychiatry.
47:818--829.
Ziemann U, Tam A, Butefisch CM, Cohen LG. 2002. Dual modulating
effects of amphetamine on neuronal excitability and stimulation-
induced plasticity in human motor cortex. Clin Neurophysiol.
113:1308--1315.
Zittel S, Weiller C, Liepert J. 2007. Reboxetine improves motor function
in chronic stroke. A pilot study. J Neurol. 254:197--201.
Cerebral Cortex April 2010, V 20 N 4 797
Dow
nloaded from https://academ
ic.oup.com/cercor/article/20/4/783/303710 by guest on 09 D
ecember 2021