
NONSTOP NETWORKING IN THE AGE OF AVAILABILITY
59
NONSTOP NETWORKING IN THE AGE OF AVAILABILITY American Power Conversion Corporation 1998 Annual Report ™
Transcript of NONSTOP NETWORKING IN THE AGE OF AVAILABILITY

1998 Awards
Corporate
Magazine Award/RankingForbes ASAP Top 100 Most Dynamic Technology CompaniesKiplinger’s Personal Finance Biggest Winners of the DecadeElectronic Business Top 200 Electronics Companies, #126Mass High Tech Weekly Top 50 Public Technology Companies in New England
USA
Magazine Award ProductComputer Reseller News Channel Champion APCComputer Reseller News Editor’s Choice Smart-UPSComputer Reseller News Test Center Recommended Web/SNMP Management CardComputer Shopper Best Buy 1998 Smart-UPS 700Family PC Best Hardware Extra SurgeStationInternet Week Best of Breed Matrix-UPSNetWork Solutions Product of the Year Smart-UPSPC Computing Desktop Usability Test Back-UPS Pro 650PC Computing Peripherals “A-List” Back-UPSPC Computing Most Valuable Player Back-UPS Pro 650PC Magazine PC Essential Hardware SurgeStation; Back-UPS ProSmart Reseller Top 50 Smart Vendor Program APCVARBusiness Recommended APCVARBusiness Top 100 Products 1998 Smart-UPS 2200
International
Magazine Award ProductComputer Reseller News (Canada) Channel Champion APCPublishing Essentials (Australia) UPS of the Year Smart-UPS 1000Computer Reseller News (Australia) Editor’s Choice Smart-UPS 1000PC Magazine (UK) Editor’s Choice Smart-UPSSecure Computing (UK) Best Security Hardware Smart-UPSSecure Computing (UK) Best Buy Editor’s Choice Symmetra Power ArrayMicro Hebdo (France) Best Value Editor’s Choice Back-UPSChannels Asia Preferred Vendor APCPC World (China) Best Buy Smart-UPS 2200PC World (India) Reader’s Choice Best Products Smart-UPSPC Quest (India) Users’ Choice APCDataQuest (India) Top 5 “Magical Companies” APCSoftdisk (India) Most Revolutionary Product of 1998 Symmetra Power ArrayLANTimes (Korea) Editor’s Choice APCComputerWorld (Korea) Editor’s Choice APC
0525-AR-99
NONSTOPNETWORKING
IN THE AGEOF AVAILABILITY
American Pow
er Conversion Corporation1998 A
nnual Report
American Power Conversion Corporation1998 Annual Report
™

Our PhilosophyTo listen to our customers.
Their wants, needs and
wishes are our strategic
blueprint.
To justify our expenditures as
they relate to our goals.
To quantify all aspects of our
business in order to create
benchmarks for success.
To avoid bureaucracy.
Employees must make direct
contributions to our goals.
To emphasize quality.
We believe that good enough
never is.
To respond quickly and
decisively to opportunity.
To create an environment
where ideas are encouraged,
recognized and rewarded.
To help employees grow per-
sonally and professionally.
To work together toward
our goals and be rewarded
together when they are
achieved.
To commit to leadership
in every aspect of our business.
Our VisionAPC products ensuring
availability wherever data is
created, transmitted or stored.
Our MissionTo create delighted
customers by improving the
manageability, availability
and performance of
information and
communication systems
through the rapid delivery of
innovative solutions to real
customer problems.
American Power Conversion Corporation
996-1498A© 1999, American Power Conversion Corporation. All rightsreserved. APC 132 Fairgrounds Road, West Kingston, RI,02892. The APC logo, Legendary Reliability, NonstopNetworking, SurgeArrest, SurgeStation, Back-UPS, Back-UPS Pro,Back-UPS Office, Smart-UPS, Matrix-UPS, NetShelter, Call-UPS II,Share-UPS, Measure-UPS, PowerChute plus, PowerManager,PowerAudit, WebAlert, PowerShield, PowerStack, PowerXtend,BlockSafe, SmartCell, ProtectME! with APC, ProtectNet, SilconDP300, SmartSlot, QuickSwap, CellGuard, SmartTrim, SmartBoost,Line-R, PowerNet, Symmetra, Power Array, PowerView,MasterSwitch, Equipment Protection Policy, Control-UPS/400, andDouble-UP are APC trademarks and property of APC. Others areproperty of their owners.
Corporate Headquarters132 Fairgrounds RoadWest Kingston, Rhode Island USA 02892(401) 789-5735
Transfer Agent and RegistrarBankBoston, N.A.c/o Equiserve, L.P.P. O. Box 8040Boston, Massachusetts 02266-8040(781) 575-3120http://www.equiserve.com
Annual MeetingAn Annual Meeting of Shareholders of theCompany will be held on Friday, May 7, 1999 at10:00 a.m. local time, Radisson Airport Hotel, The University Ballroom, 2081 Post Road, Warwick, RI 02886, (401) 739-3000
Common StockCommon Stock of American Power ConversionCorporation is traded on The NASDAQ StockMarket® under the symbol APCC, and on thePacific Exchange Inc. under the symbol ACC.
AuditorsKPMG LLP600 Fleet CenterProvidence, Rhode Island 02903
Legal CounselTesta, Hurwitz & Thibeault, LLPHigh Street Tower125 High StreetBoston, Massachusetts 02110
Shareholder InformationAdditional copies of the Company’s Annual Reporton Form 10-K are available to shareholders onrequest without charge. Send requests to:
APCAttn: Investor Relations132 Fairgrounds Road West Kingston, Rhode Island 02892
You may telephone requests to our investor relations line at (401)789-5735, ext. 2994; or E-mail requests to: [email protected]
APC Worldwide Web address: http://www.apcc.com
APC's 1998 Annual Report was produced by APC Marketing Communications and Financial teams.
Printed by Universal Press at a cost of approximately $ 1.10 per piece.

1998 Awards
Corporate
Magazine Award/RankingForbes ASAP Top 100 Most Dynamic Technology CompaniesKiplinger’s Personal Finance Biggest Winners of the DecadeElectronic Business Top 200 Electronics Companies, #126Mass High Tech Weekly Top 50 Public Technology Companies in New England
USA
Magazine Award ProductComputer Reseller News Channel Champion APCComputer Reseller News Editor’s Choice Smart-UPSComputer Reseller News Test Center Recommended Web/SNMP Management CardComputer Shopper Best Buy 1998 Smart-UPS 700Family PC Best Hardware Extra SurgeStationInternet Week Best of Breed Matrix-UPSNetWork Solutions Product of the Year Smart-UPSPC Computing Desktop Usability Test Back-UPS Pro 650PC Computing Peripherals “A-List” Back-UPSPC Computing Most Valuable Player Back-UPS Pro 650PC Magazine PC Essential Hardware SurgeStation; Back-UPS ProSmart Reseller Top 50 Smart Vendor Program APCVARBusiness Recommended APCVARBusiness Top 100 Products 1998 Smart-UPS 2200
International
Magazine Award ProductComputer Reseller News (Canada) Channel Champion APCPublishing Essentials (Australia) UPS of the Year Smart-UPS 1000Computer Reseller News (Australia) Editor’s Choice Smart-UPS 1000PC Magazine (UK) Editor’s Choice Smart-UPSSecure Computing (UK) Best Security Hardware Smart-UPSSecure Computing (UK) Best Buy Editor’s Choice Symmetra Power ArrayMicro Hebdo (France) Best Value Editor’s Choice Back-UPSChannels Asia Preferred Vendor APCPC World (China) Best Buy Smart-UPS 2200PC World (India) Reader’s Choice Best Products Smart-UPSPC Quest (India) Users’ Choice APCDataQuest (India) Top 5 “Magical Companies” APCSoftdisk (India) Most Revolutionary Product of 1998 Symmetra Power ArrayLANTimes (Korea) Editor’s Choice APCComputerWorld (Korea) Editor’s Choice APC
0525-AR-99
NONSTOPNETWORKING
IN THE AGEOF AVAILABILITY
American Pow
er Conversion Corporation1998 A
nnual Report
American Power Conversion Corporation1998 Annual Report
™

1
Contents
2 President’s Message
4 Financial Highlights
5 One Billion DollarsThe age of availability
APC’s new business strategies
6 GlobalGrowth and penetration
North and Latin America
Europe, Middle East and Africa
Japan, Asia and Australia
Success in the sales channel
Communication and customer satisfaction
10 End-to-EndSymmetra™ Power Array™ success
High power markets
Protecting internetworking gear
Complete enterprise coverage
14 Nonstop Networking™
The dynamics of data
Internet explosion
The world’s largest cash register
Reinventing the telephone
Protecting the enterprise
Power availability: the weakest link
Just not enough
Assessing the IS impact worldwide
Potential impact of Y2K on utility power
23 Annual Report on Form 10-K
Board of Directors
Rodger B. Dowdell, Jr.
Chairman, President and Chief Executive OfficerAmerican Power Conversion Corp.
James D. Gerson
Senior Vice President, Fahnestock & Co.
Emanuel E. Landsman
Vice President and ClerkAmerican Power Conversion Corp.
Ervin F. Lyon
Neil E. Rasmussen
Vice President and Chief Technical OfficerAmerican Power Conversion Corp.
Company ProfileIncorporated in 1981, American Power Conversion Corporation
(APC) designs, manufactures and markets products that improve
the reliability and productivity of computer systems worldwide
by protecting hardware and data from the ongoing threat of
power disturbances.
Our solutions include surge suppressors, uninterruptible power
supplies (UPSs), power conditioning equipment and related soft-
ware for computer and computer-related equipment. Protected
applications include facilities, sites, mainframe computers, data-
centers, wide area networks (WANs), local area networks (LANs),
Internet and intranet equipment, midrange computers, telecom-
munications equipment, home and office workstations, integrated
services digital network (ISDN) equipment and a variety of con-
sumer electronics.
We also protect these applications against power problems on
data, network, serial, coaxial (CATV) and telephone lines.
C O N T E N T S

1998 was an extremely rewarding year for
APC. We reached the $1 billion milestone,
becoming the first and only company whose
sole focus is power protection to surpass the
$1 billion sales mark.
In an effort to explain some of what was
behind this record year, I will begin by thank-
ing the millions of satisfied APC customers
who have played the central role in our suc-
cess over the years. At APC we always put
the customer first.
I must also thank and congratulate the entire
APC team. Reaching $1 billion is a significant
accomplishment, and every APC employee
should be proud of their role in helping to
further distinguish the Company from the
rest of our industry. I feel privileged to work
with such a dedicated group of people.
I would also like to thank you, our sharehold-
ers, for your continued investment in our
enterprise. In spite of the sometimes wild
fluctuations in the stock market and stock
prices, APC’s focus on long term growth has
paid off. In fact, I take great pride that the
Wall Street Journal recently named APC
stock the third best performing over the last
ten years. Kiplinger’s Personal Finance also
named the Company one of the “Biggest
Winners of the Decade.” APC has been a top
performer over the long term, and we will
continue to apply our formula for success to
our global objectives for continued long-
term returns.
The evolution of networking When APC began selling power protection
equipment, networking was in its infancy.
Most computer users were still transferring
data on the “sneaker net” using 512k floppy
disks. As networking began to evolve, users
began to use linked PCs to share files and
print documents, which gradually increased
the importance of the computers and equip-
ment upon which these tasks were transact-
ed. Still, the number of people protecting the
hardware and data with UPSs was small.
Initially, the motivation for using APC’s prod-
ucts was to protect the hardware itself. As
more and more data was passed across net-
works, our customers began recognizing the
importance and value of the data on their
servers and PCs; they quickly began protect-
ing this data as well. As the value of data grew
“As a company we could not have hoped for a better
business opportunity than one in which network downtime correlates to a loss
of revenue. “
President’s M
essage
President’s Message
2

President’s M
essage
exponentially, the importance of protecting the
availability of the network reached critical
mass. A growing number of customers cannot
tolerate any downtime in their networks.
In the last few years, the value of the data
being created, transferred and stored has
continued to multiply. Not only is the quan-
tity of data increasing, but E-commerce
applications are literally transferring, pro-
cessing and storing money on the servers
we protect. As a result, highly reliable solu-
tions like our Power Array technology are
being adopted by industry-leading global
enterprises to ensure E-commerce delivers
on its promise.
In 1984, when we built our first UPS, I don’t
think anyone at APC could have imagined a
better scenario for the Company than what we
are seeing today. Data has become money,
and it is flying around the globe, without
bounds, at an incredible rate of speed. As a
company we could not have hoped for a better
business opportunity than one in which net-
work downtime correlates to a loss of revenue.
Global, end-to-end, Nonstop NetworkingIn 1998, with the convergence of data and
revenues in mind, we put many elements of
our objective of providing global, end-to-end,
Nonstop Networking solutions into play.
The acquisition of Silcon™; the continued
introduction of new products for existing and
new markets, geographies and industry
trends; the expansion and development of
strategic relationships; and, the addition of
global manufacturing efforts throughout 1998
all brought us closer to this objective.
One of the many areas of potential growth
for the Company going forward is the
Enterprise or high-power space. In 1998,
our efforts there were bolstered by two
primary factors: the continued roll out and
acceptance of the Symmetra Power Array
and the acquisition of Silcon. Overall,
Symmetra and its Power Array technology
has continued to gain acceptance as the pre-
mier high-availability solution for datacenters.
The three-phase power protection market
addressed by the acquired Silcon products
represents an incremental $1.3 billion in
potential revenue to APC (source: Venture
Development Corporation). We intend to
aggressively pursue these new opportunities
worldwide while we maintain a watchful eye
on the industry trends, customer needs and
new markets that define our objectives.
In closing, I would like to thank you for the
attention you pay our annual report. As
always, we welcome your comments, and
invite you to use the response card enclosed
in the back of the report to relay them to us.
Finally, to the entire APC team, thank you
once again for your admirable dedication,
your unrivaled accomplishments, and the
winning attitude that serves as the founda-
tion for the Company’s continued success.
Rodger B. Dowdell, Jr.
Chairman, President
and Chief Executive Officer
3

Financial Highlights
Net sales
Cost of goods sold
Gross profit
Costs and expenses
Operating income
Other income, net
Earnings before income taxes
Income taxes
Earnings before minority interest
Minority interest, net
Net income
Diluted earnings per share
Diluted weighted average shares outstanding
Total assets
Cash and cash equivalents
Long-term debt
$1,126$148
$873$122
$92
$70$71
$707
$515
$378
1994
1995
1996
1997
1998
Net Income
1994
$378,295
189,954
188,341
82,692
105,649
3,701
109,350
38,075
71,275
-
$71,275
$.77
92,913
$265,163
$29,073
-
1995
$515,262
284,500
230,762
127,057
103,705
860
104,565
35,029
69,536
-
$69,536
$.74
93,867
$346,588
$39,040
-
1996
$706,877
407,902
298,975
165,185
133,790
5,189
138,979
46,558
92,421
-
$92,421
$.98
94,347
$504,002
153,234
-
1997
$873,388
476,060
397,328
225,890
171,438
6,354
177,792
56,004
121,788
-
$121,788
$1.27
96,121
$641,290
270,134
-
1998
$1,125,835
621,073
504,762
300,293
204,469
11,687
216,156
68,231
147,925
349
$147,576
$1.52
96,788
$871,983
219,908
-
Financial Highlights
1995
1996
1997
1998
Net SalesIn millions of U.S. dollars
1994
All amounts are in dollars except for outstanding shares. Dollars are in thousands except for basic and diluted earnings per share. Shares are in thousands. The Company did not declareany cash dividends for the five year period presented. Note: Included in the 1998 results are $7.6 million of acquired research and development expenses associated with the acquisi-tion of Silcon A/S. Excluding these R&D charges, net income would have been $155.1 million or $1.60 per share.
4
In millions of U.S. dollars

One B
illion Dollars
1998: One billion dollarsIn 1998, we closed our eleventh year as a publiccompany with our eleventh consecutive reportof record revenues. In doing so, we were thefirst company solely dedicated to power protec-tion solutions to surpass the $1 billion annualrevenue mark.
The milestone was reached through a combina-tion of teamwork and our ability to build on thefoundation of our past successes, our reputationfor reliability and our outstanding customer serv-ice. We continued our global efforts to leveragethe strength of our brand, to acquire new cus-tomers and to ensure the satisfaction of thosewho have been loyal to us over the years.
The age of availabilityIn 1988, when the Company went public, many ofthe key applications which drove our business in1998 were either non-existent or virtually unknown.There was no E-commerce, and no computer userwould have considered looking for an InternetService Provider. The concept of a “Browser War”would have been as completely alien as the“World Wide Web.” A few UNIX technophilesknew about the Internet, but America was defi-nitely not online, and Windows was still in itsinfancy. Things have changed.
Today, we see the explosion of technology andthe implosion of the global economy as technolo-gy links the farthest geographic reaches to theportal of our home PCs, and eliminates the histor-ical barriers to trade.
In the future, key technology trends–includingE-commerce, voice over IP (V/IP) and enterpriseresource planning (ERP)–will all depend onunshakable reliability and the availability of infor-mation systems (IS).
These IS trends all represent a paradigm shift in theway the world looks at power protection. Whatbegan as a need to protect hardware, developedinto the need to protect data, and has now culmi-nated in a need to protect availability (see Figure 1).In this age of availability, IS professionals will pushtheir systems as close to 100 percent availabilityas possible because every second of downtimemeans lost revenue and lost business.
APC’s new business strategiesOur plan to provide Nonstop Networking in theage of availability translates into several newbusiness strategies, both internal and external.Our customers are looking for comprehensivesolutions to protect their networks from end-to-end. They are also seeking ways to stay connect-ed, as individuals, to the Internet.
By focusing on end-to-end enterprise solutions,we aim to expand our sales throughout our cus-tomers’ infrastructures. This model also gives usthe opportunity to develop global relationshipswith key accounts. We plan to enter accounts viaa compelling and innovative product, such as aSymmetra Power Array, then expand the sale toother APC solutions from end-to-end.
The growth and importance of the Web will tieinto this Enterprise strategy as the importance ofavailability leads companies to protect all the
The age of availabilityAvailability
Data Protection
HardwareProtection
1995 1996 1997 1998 1999 2000Figure 1
We are also proud
of being the first
company solely
dedicated to power
protection solutions
to surpass the
$1 billion annual
revenue mark.
Dramatic changesin the uses of tech-nology have lead tochanges in the rea-sons people protectIT equipment withAPC solutions.
While hardwareand data protectionare still critical, theneed for availabilityhas eclipsed both.
5

Global
1984
American PowerConversion is incorporatedin Massachusetts. Founded by three electronic power engineerswho had been working at MIT
July1988
1986 1989
APC introduces its first UPS, the 450AT+
APC goes public at$7.50 per share.Adjusted for splitsthat is $.25 per share
Major distributorsTech Data andIngram Microbegin carryingAPC’s solutions.PowerChute® soft-ware is introduced
APC’s 450 AT+receives PCMagazine’s Editor’sChoice award
March1981
pieces of their network. We plan to focus on newsolutions and partnerships to increase attachmentto the internetworking equipment which connectsthe many pieces of a network together.
The need for comprehensive protection is alsopresent in the home, where technology is becom-ing more pervasive. Sub-$1,000 PCs, WebTV andcomputer-operated, networked home appliancesall need power protection. This trend representsanother incremental opportunity for the Companyin the coming years. The trend is especially goodfor APC because it means a larger number ofservers will be needed to support these PCs andadvanced home electronics.
We feel strongly that we should be present wher-ever a potential customer makes the decision topurchase power protection. This translates toexpanded channel opportunity for APC as theway people buy technology changes. First, thedirect PC channel is growing as customers opt topurchase their equipment via the telephone andthe Web. Second, high-power solutions are beingsold through Power VARs who specialize inpower availability consulting. These powerresellers will be especially useful in leveragingthe sale of Symmetra and Silcon units.
These represent just a few of the opportunitieson APC’s horizon. We hope for continued suc-cess as we apply our business formula to theseand other areas of potential growth. As we lookto the new trends and opportunities that defineNonstop Networking in the age of availability, wewill continue to focus on our core competenciesand strive to grow the markets that have broughtus to where we are today and that made 1998such a successful year.
Global In 1998, we witnessed another year of evaporat-ing geographic borders as information and onlinetransactions continued to flow freely throughoutthe globe. At the same time, we continued toconvey our message of Legendary Reliability™ tocomputer users.
At the core of our strategy for global market pen-etration is the fact that we enjoy unmatched glob-al offerings of products, programs and services.Multinational corporations depend on this broad,consistent distribution of solutions to solve theirworldwide availability needs.
Growth and penetrationThe global marketplace during 1998 was filled witheconomic challenges for many companies acrossvarious industries. Instead of retreating in the faceof the challenge, we focused our efforts. We arepleased to report that our business grew in everymajor geographic region on a year-over-year basis.
Supporting this growth was the addition of newfacilities and the expansion of APC’s presenceinto new countries. Our continued global manu-facturing expansion is based on our belief that weshould produce our products where customersare located and to provide them with the mostcost-effective solutions possible.
North and Latin AmericaFor the full year, revenues in the Americas (Northand Latin America) increased 27 percent. Theresults were driven by a healthy U.S. economy andthe continued purchase of IT equipment to supporthigh-availability applications such as the Internetand E-commerce.
T I M E L I N E
6
Figure 2

“An interruption in the operating voltageof just ten milliseconds in a high-tech production facility such as ours canhave enormous consequences. In chipproduction, it can lay waste to hundredsof man-hours of labor. The regionalpower utility could not guarantee either100 percent reliability of supply nor aconsistency in electrical quality. Thiswas of grave concern to us.
“A solution with the highest reliabilitywas required. Power protection was
critical for both our production plantsand the computer systems. We alsoneeded a steady power supply forlighting, air conditioning and auxiliaryoperating mechanisms.
“The APC Silcon DP300 has solved thisproblem for us. In addition, we arepleasantly surprised by the energy savings, the expandability and environmental friendliness of the APCSilcon DP300. Of course, you alwaysencounter risk when implementing a
new technology. The APC Silcon UPSwas no exception. Nevertheless, wedared to take the step and it has reallypaid off for us. We made the rightinvestment decision and we havepeace of mind.”
Global
“An interruption in the operating voltage of just tenmilliseconds in a high-techproduction facility such asours can have enormous
consequences.”
Peter Nikonowitsch Engineering Manager,
Hitachi’s Landshut facilityLandshut, Germany
Hitachi Corporation
The APC Silcon DP300E
7

“Forrester Consulting Group, Inc. (FCGI –www.fcgi.com) is a respected Lotus/IBMBusiness Partner specializing in applica-tion hosting using Lotus Notes®, LotusDomino®, Web-site and E-commerceapplication design and consulting.
“Our mission is to help organizations,such as the Leadership Alliance(www.leadership-alliance.org), deploy,manage and grow their Internet/intranet infrastructure as appropriateto their business computing needs.
The alliance consists of 25 collegesand universities who have joinedforces to develop outstanding minorityleaders and role models. We use LotusDomino to securely capture scholarshipapplications in addition to supportingtheir Web site.
“APC Smart-UPS® serve the criticalfunction of protecting the hardwarethat provides the content for these andother mission-critical sites.
“APC has a solid reputation in the indus-try. We’re confident that the servers for the Leadership Alliance and those of our other clients enjoy maximumavailability protected by APC. I wouldn’tthink of using any other brand.”
“APC has a solid reputationin the industry.…
I wouldn’t think of usingany other brand.”
Howard ForresterPresident,Forrester Consulting Group, Inc.Norwood, Massachusetts
and Ray SambranoSr. Product Manager for Domino Performance, IRIS
Forrester Consulting Group, Inc.
The APC Smart-UPS ®

1990 19931991
Relocated to West Kingstonfacility- site of current cor-porate headquarters.Smart-UPS brand of UPSsare introduced. Rodger Dowdell awardedInc. Magazine’s NewEngland “Entrepreneur ofthe Year” award
SurgeArrest comesto market, APC’sfirst dedicatedsurge protectionsolution
Matrix-UPS® intro-duced, APC’s firstventure in the >2kVA market space
1994
Opened first international facility in Galway,Ireland
APC revenuescross the half bil-lion dollar mark.Over 155 newproducts intro-duced
1995
In Latin America (LAM), we introduced new Back-UPS® and Smart-UPS solutions which answeredthe need, respectively, for a high-end desktop anda low-end server solution.
Europe, Middle East and AfricaRevenues in Europe, Middle East and Africa(EMEA) were up 38 percent. In 1998, thegrowth was enhanced by the addition of Silcon.With the Danish company came additional man-ufacturing facilities in Denmark, Ireland, Chinaand Switzerland. We also pursued the strategyof widening our product offering, both to opti-mize price points and to fill holes in the productline, with the introduction of new Back-UPS andSmart-UPS solutions.
Japan,Asia and AustraliaIn spite of the lackluster Asian economy, our rev-enues in Japan, Asia and Australia (JPAA) grew 19percent in 1998. Our strong financial position–com-pared to the relatively weak position of local UPScompanies–allowed us to increase our presence inthe region. Our position was further helped by theaddition of new manufacturing facilities in thePhilippines and in China.
To round out our product offering in JPAA, weintroduced a SurgeArrest® (Japan), a Back-UPS andan entry-level Smart-UPS. We also began shippingSymmetra in the region in 1998. Symmetra wasmet with accolades including Softdisk’s “MostRevolutionary Product of 1998” award.
The availability of our tested and proven solutionsallows global IT companies who have selectedAPC to be sure the products they specify for newnetworks are available wherever they do busi-ness. The value to our customers is that theyneed only design their network power architec-ture once, instead of once for each country in
which they do business. This also leads toreduced overhead, installation, training and inte-gration costs. By offering a global solution, wehelp add profit to our customers’ bottom line.
Success in the sales channelIn 1998, we also reinforced our global dedicationto our channel with the expansion and improve-ment of our worldwide reseller partner pro-grams. The programs continue to be custom-tailored to suit the channel needs, channel matu-rity and target demographics of each region. Ourreseller programs are designed to provide train-ing, reduced-price demonstration units and otherselling tools to the resellers responsible for thesale of APC products to our end customers.
Our reseller program continued to be successful aswe attracted new members and participants world-wide. Maintaining our close relationship with ourreseller channel protects our ability to mount suc-cessful product introductions and provides us witha healthy distribution pipeline to support ourdemand creation efforts.
Our channel support efforts were rewarded withacclaim and awards from around the world. Wewere listed in VARBusiness’ “Top 100 Products.”We were also awarded the Computer ResellerNews “Channel Champion” award for the fifthyear in a row in the U.S. We garnered this sameaward in Canada. Internationally, APC was named“Preferred Vendor” by Channels Asia.
Communication and customer satisfactionWe continued to focus on industry-leading effortsin advertising, direct marketing and other brand-building market education activities. One of ourmost comprehensive, global programs involved the1998 World Cup. The World Cup was by far thelargest sporting event of 1998, and no other event
APC’s saleschannel showedits ongoing commitment to selling ourproducts:ComputerReseller Newsnamed APC“ChannelChampion” for thefifth year in a row.
9
Global

19971996
First Philippines manufacturingplant. Back-UPS Office® andPowerAudit® introduced. APCenters the greater than 5kVAUPS market with the revolution-ary Symmetra Power Array.
Systems EnhancementCorp. is APC’s firstacquisition
1998
APC reaches thebillion dollar mark.APC purchasesSilcon, creating aone-stop shop forglobal, end-to-end,NonstopNetworking solutions
Approaching the next millennium,APC faces new challenges andopportunities, but our ability toapply our core business formulawill be instrumental in our future successes
came close to the global interest it sparked. TheCompany recognized the key opportunity to extendits brand through event sponsorship, and throughprotection of the IT networks supporting the WorldCup. APC’s role was to serve as the last line ofdefense against bad power.
According to Fernand Sastre, co-president ofFrance ’98, “The French Organizing Committeechose APC for its world-wide reputation for prod-uct reliability.” With no trial run, APC helped pro-vide maximum uptime. Nearly 37 billion viewersworldwide didn’t need to worry about missingeven one second of the action.
We also worked diligently to develop our skills inthe arena of online customer support and mar-keting. The APC Web site now offers our cus-tomers E-mail links and a technical referencelibrary which can be accessed from anywhere inthe world. Our customers and resellers havefound our site a valuable information tool. In fact,the number of user sessions has steadilyincreased over the last year, and in January of1999 reached nearly 500,000 for the month.
Our demand creation was effectively backed bystrong customer service and inside sales staff sup-port. These APC employees who spend their timein direct contact with our customers were rankednumber one by Computerworld in an independentstudy. The study rated APC in post-sales support,product knowledge, treatment of the customer,speed of solution, ability to satisfy customerrequests, accuracy of solution, clarity of explana-tion and level of Web innovation. APC was rankedfirst in all but one category.
End-to-EndOur company strategy of closing the availability gapmeans presenting a solution wherever and when-
ever our customers could experience downtime asa result of power problems. In 1998, that strategyled us into several new market spaces. First, wedrove the rapid adoption of our premium categoryof power protection, the Power Array. Second, wemoved into the high-end of the product spectrumwith the acquisition of Silcon and its range of above20kVA products. Third, we paid special attention tothe equipment that lives in the space betweendesktop and server: internetworking gear. Fourth, anew product offering for laptops further openedthat market to the Company. Finally, we roundedout our offering with innovative and comprehen-sive additions to our line of enterprise power management software and accessories.
Symmetra Power Array successWe first entered the high-power space in 1997.Our introduction of the Symmetra Power Arraycreated a new category of power protectiondesigned for high-availability computer datacen-ters. For the first time anywhere, a company wasoffering a fully redundant power protection sys-tem. That meant power protection could operateat availability levels equal to or greater than themost advanced information technology.
As units shipped in EMEA and JPAA, the innova-tion quickly earned APC several major internation-al awards, including Secure Computing “Editor’sChoice.” Symmetra also lead the pack in head-to-head competition. Throughout 1998, Symmetraenjoyed continued success as our premium avail-ability solution.
To complement Symmetra in lower power envi-ronments, and in response to growing demandsfor redundant power protection solutions, theCompany introduced a High Availability RedundantSwitch Package, which uses two APC Smart-UPS, one backing up the other, to ensure con-stant availability.
APC is proud tohave providedthe official powerprotection solutions for thecomputers andsensitive electronics of the1998 World Cup.
10

“As Simulator Team Leader at BostonEdison’s Chiltonville Training Center,one of my responsibilities is to managethe operation of our nuclear powerplant control room simulator.
“Historically, power conditions at oursite have been marginal, and ironically,Boston Edison does not provide powerto the site. Power fluctuations havecaused a number of equipment failuresin the control room simulator, resultingin downtime to effectuate repairs.
“The reliable operation of the PilgrimNuclear Power Simulator (PNPS) is avital part of the success and continuedoperation of Pilgrim station. Upon therecommendation of Power Associates,Inc., our APC ‘Power Specialist’, wedecided to consider an APC SilconDP300E 3-phase solution.
“APC sent teams of experts from theAPC Global Services Group on two sep-arate occasions in order to take meas-urements and verify total power used
by the system. The professionalism andthoroughness exhibited by the represen-tatives of APC’s Global Services Groupin explaining all facets of the transitionsold me on the APC solution.” E
nd-to-End
“The professionalism and thoroughness exhibited by the representatives of APC’s
Global Services Group in explaining all facets of the transition sold me on the APC solution.”
Boston Edison
Franco PasqualeSimulator Team Leader,
Boston Edison’s Chiltonville Training Center
Chiltonville, Massachusetts
The APC Silcon DP300E
11

Arthur Andersen
“When the tax practice is withoutcomputers, $35,000 per hour inrevenue and production is lost.
We need APC Symmetra to help us keep our platform stable.”
Gready HunterNovell NetWare Manager,
Houston OfficeHouston, Texas
Bill CopeNetwork Analyst,Houston OfficeHouston, Texas
Steve BlandingDirector of Technology,Houston OfficeHouston, Texas
“We service over 2,700 clients in theHouston area alone,” said Bill Cope,Network Analyst. “We cannot rely onbuilding power as was proven in Marchof this year. For more than 12 hours, ourbuilding was without power and all sys-tems were down. Also, our equipmentwas already overloaded and we couldnot support any new equipment. We were undergoing a major hardwareupgrade and needed additional conditioned power and runtime.
“Our network consists of over 30Compaq servers and a backbone of
Cisco routers and hubs,” said Cope.“Our servers (protected by Symmetra)are essential to our tax, audit and business consulting practices. Whenthe tax practice is without computers,$35,000 per hour in revenue and pro-duction is lost. We need APC Symmetrato help us keep our platform stable.”
“Installing the three APC Symmetra unitsprovides a well-rounded solution for ourdisaster recovery plan,” said GreadyHunter, Novell Netware Manager.
“The Houston office of Arthur Andersenhas now established an internal best
practice…with the implementation ofAPC’s Symmetra,” said Steve Blanding,Director of Technology.
The APC SymmetraPower Array

13
End-to-E
nd
High-power markets
Our customers also requested a site-wide enter-prise power protection solution to both comple-ment Symmetra and eclipse the legacy UPSsystems in the 20 to 500 kVA range. In 1998, weaccelerated our entry into this market spacethrough the acquisition of Silcon. Silcon hadalready successfully differentiated itself in thehigh-power space with the kind of technologicalinnovation our customers are accustomed to see-ing from APC.
The high-power solutions in the new APC Silcon
product line are designed to support not just com-
puter systems, but entire buildings. At the other
end of the Silcon spectrum, non-redundant 6, 8,
and 10 kVA products compliment the Symmetra
Power Array line. These new products offer a
good, ultra-efficient solution to our customers
wherever they do not need the premium protec-
tion of a Power Array.
Protection of internetworking gearAlong with the high-power additions to our prod-
uct line, we also focused on providing several
other availability solutions to ensure global, end-
to-end, Nonstop Networking. Some of the most
important and often unprotected equipment on
the network is the internetworking gear that car-
ries data from server to client. When a hub or
router is unavailable due to a power problem, net-
work traffic stops and immediately triggers costly
support and help desk calls. According to Cisco
Systems, “Power-related network downtime is a
business-critical issue which prevents companies
from realizing their financial objectives….” APC is
in a prime position to deal with that issue.
In 1998, we introduced APC PowerStack™, a rack-
mount solution designed to protect hubs, routers
and switches. PowerStack ensures the uptime of
the remote interconnections so critical to the avail-
ability of most networks. This product compli-
mented our existing Smart-UPS rack-mount solu-
tions which serve the continued need to protect
multiple servers housed in rack enclosures like
APC NetShelter®.
The NetShelter itself was enhanced with nearly a
dozen new accessories designed to help our cus-
tomers increase the availability, flexibility and
security of their networks. The complete line of
NetShelter products continue to act as a strong
differentiator in the marketplace.
In fact, because of this continuing migration to the
rack environment, we extended our Smart-UPS
line to include a new rack solution. Introduced late
in the year, the Smart-UPS 5000 was the indus-
try’s slimmest 5kVA rack-mount UPS. It was
designed to protect the increasingly powerful
servers and internetworking products that are
more frequently being housed in one rack.
Complete enterprise coverageBecause end-to-end protection doesn’t stop with
the wide area network (WAN), we gave interna-
tional business travelers a tool to help them breathe
a little easier when plugging notebook computers
into phone and power outlets: the APC SurgeArrest
Notebook Pro. This globally-compatible unit offers
protection against the surges that so often destroy
portable computer modems and motherboards.
Another key component of our high-availability
offering is end-to-end management. In 1998, we
developed a new Web/SNMP management card
which gives network administrators the ability to
manage their APC UPSs via a Web browser or
SNMP management system using a single acces-
sory card. Web and SNMP management are two
leading industry standards for network manage-
ment communications. By combining these two
solutions, we’ve made our customers’ jobs that
much easier.
This accessory is complimented by a suite of soft-
ware developments which demonstrate our con-
tinued leadership in designing and supporting solu-
tions which integrate with customers’ existing sys-
tems. Our software developers work with industry
leaders in network management to develop solu-
tions which integrate seamlessly with the products
our customers already use for network manage-
ment. That way, the task of getting network
administrators to adopt APC solutions is that much
easier. In 1998, we lead the industry by integrating
our software with Tivoli, a leading network man-
agement platform, Cabletron Spectrum, which
specializes in management of internetworking
14
Nonstop N
etworking
gear and TopTools, HP’s proprietary enterprise
management suite. We also enhanced our Web-
based device manager to monitor UPSs in a mixed
operating system environment. Leveraging the
customer’s existing investment, whether operat-
ing system or management software, instead of
forcing them to adopt a new and different solution,
helps make APC the easy choice.
Nonstop NetworkingComputer networks are rapidly connecting every-
thing and everyone around the globe. The avail-
ability of these networks is directly linked to the
profitability, productivity and public image of every
company that chooses to be connected. Whether
the purpose of being online is brand-building, E-
commerce or information distribution, when the
connection fails, the bottom line suffers.
The dynamics of dataWith every new connection, the role of data in busi-
ness is changing. Not long ago, a company’s data
pool was primarily a historical reference point. That
point is now a moving target; data capture and dis-
tribution has become a real-time, global flood.
Customers demand instantaneous response. For
companies, the threat of competition requires
total, up-to-the-second awareness of customer
needs. Meanwhile, the volume of data has
changed the role of IS from data collection and pro-
cessing to revenue capture. Where data was once
used to drive revenues, E-commerce has trans-
formed the data into actual revenues. In business,
availability is everything because data is everything.
The need for Nonstop Networking in this data-
intensive world drives the APC vision and mission.
Our vision is to have APC products ensuring avail-
ability wherever data is created, transmitted or
stored. In support of our vision, our mission is to
create delighted customers by improving the man-
ageability, availability and performance of informa-
tion and communication systems through the rapid
delivery of innovative solutions to real customer
problems. Understanding the industry trends and
staying ahead of the curve in terms of solution
development is critical to APC’s success.
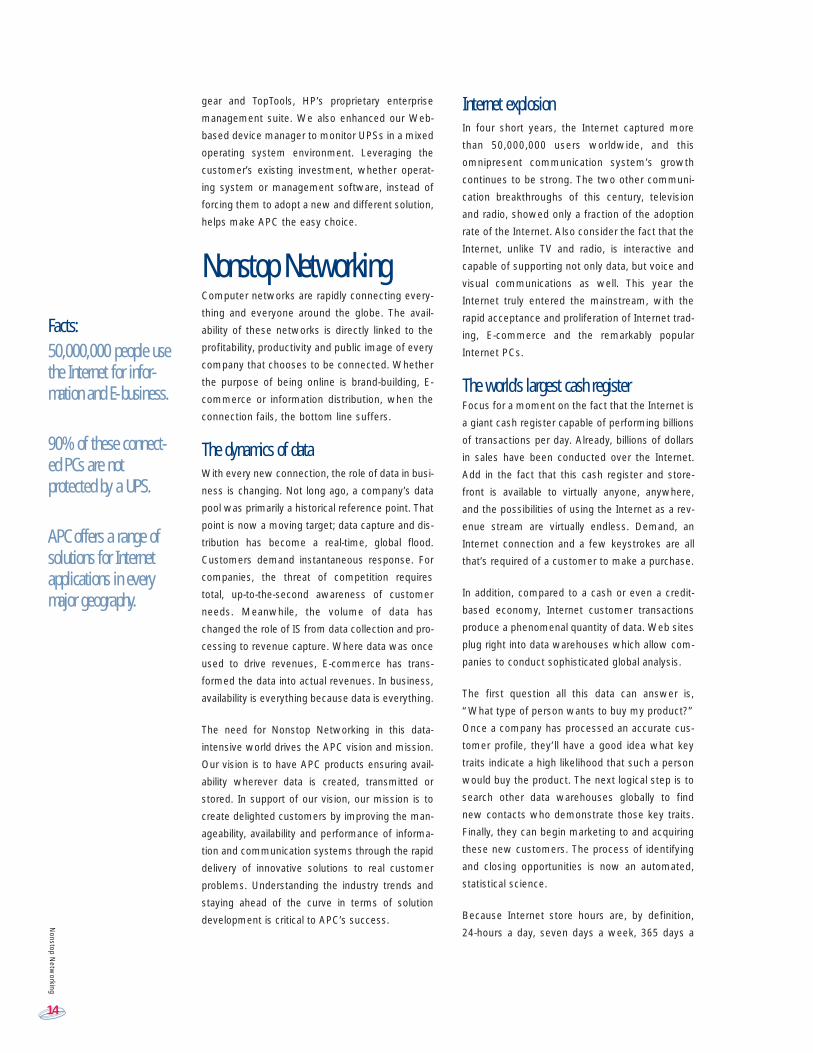
Internet explosionIn four short years, the Internet captured more
than 50,000,000 users worldwide, and this
omnipresent communication system’s growth
continues to be strong. The two other communi-
cation breakthroughs of this century, television
and radio, showed only a fraction of the adoption
rate of the Internet. Also consider the fact that the
Internet, unlike TV and radio, is interactive and
capable of supporting not only data, but voice and
visual communications as well. This year the
Internet truly entered the mainstream, with the
rapid acceptance and proliferation of Internet trad-
ing, E-commerce and the remarkably popular
Internet PCs.
The world’s largest cash registerFocus for a moment on the fact that the Internet is
a giant cash register capable of performing billions
of transactions per day. Already, billions of dollars
in sales have been conducted over the Internet.
Add in the fact that this cash register and store-
front is available to virtually anyone, anywhere,
and the possibilities of using the Internet as a rev-
enue stream are virtually endless. Demand, an
Internet connection and a few keystrokes are all
that’s required of a customer to make a purchase.
In addition, compared to a cash or even a credit-
based economy, Internet customer transactions
produce a phenomenal quantity of data. Web sites
plug right into data warehouses which allow com-
panies to conduct sophisticated global analysis.
The first question all this data can answer is,
“What type of person wants to buy my product?”
Once a company has processed an accurate cus-
tomer profile, they’ll have a good idea what key
traits indicate a high likelihood that such a person
would buy the product. The next logical step is to
search other data warehouses globally to find
new contacts who demonstrate those key traits.
Finally, they can begin marketing to and acquiring
these new customers. The process of identifying
and closing opportunities is now an automated,
statistical science.
Because Internet store hours are, by definition,
24-hours a day, seven days a week, 365 days a
Facts:50,000,000 people usethe Internet for infor-mation and E-business.
90% of these connect-ed PCs are not protected by a UPS.
APC offers a range ofsolutions for Internetapplications in everymajor geography.

15
Nonstop N
etworking
year, the collection of these new opportunities is
dramatically enhanced. As the data pours in and
the customer analysis is applied, the flow of rev-
enue becomes a matter of percentages.
Availability increases the ability to collect opportu-
nity at the top of the funnel and correlates direct-
ly to revenues at the bottom.
A power outage, data loss and hardware damage
can all but close the doors of a successful Internet
store. APC’s role in solving the first problem is
clear–instant battery back-up. Recent studies have
shown that more than 45 percent of all data loss is
the result of bad power and that 25 percent of the
CPUs destroyed every year are victims of bad
power (Sources: Contingency Planning/Safeware).
Billions of dollars are spent every year on technol-
ogy to ensure those stores stay open for business,
and many millions are spent on APC power pro-
tection to ensure the same. Those businesses that
depend on E-commerce simply cannot afford net-
work downtime.
Reinventing the telephoneLikewise, as voice over IP (V/IP) continues to
grow as a viable alternative to telephone service,
customers will demand the reliability they have
come to expect from their phones. Telephone
systems use both surge suppressors and UPSs
throughout their networks. The only way V/IP will
be able to compete with telephone service is if
the networks provide comparable availability. In
other words, these networks must avoid the
impact of power problems.
Even if clients and servers are up and running,
networks depend on hubs and routers to maintain
the communication links. With data transfers, a
“buffer” is built into the system so that if an oper-
ation “times out” because a piece of the network
is unavailable, the operation can sometimes con-
tinue after a temporary delay. Real-time voice
communication depends on constant availability,
and users will not tolerate being timed-out or
forced to wait to speak.
Protecting the enterpriseAnother major IS trend driving the need for con-
stant availability is enterprise resource planning
(ERP). Core business processes are being auto-
mated and distributed via networks to employees
around the world. The productivity and profitability
of a company is directly linked to the ERP sys-
tems that support the business. These systems
include accounting, E-mail, E-commerce, order-
taking and many other critical systems. When
they stop, the business stops.
APC has taken a leadership role in offering ERP
integration. We protect corporate productivity
with automatic safe shutdown of Microsoft
BackOffice and Lotus Notes. APC also integrates
with and protects financial applications and plat-
forms such as Oracle and SAP/R3. By protecting
all levels of our customers’ business through inte-
gration with industry-leading ERP solutions, we
successfully differentiate ourselves from the rest
of the industry.
Whatever the application, power protection is a critical
element in the quest for the highest levels of network
availability. In 1998, that impact of bad power on net-
works was very real. A recent analysis of a global data-
com network demonstrated that power problems had
nearly five times the impact of the next leading problem.
The mean time to repair for those problems was nearly
three and a half hours. APC is in a key position to pre-
vent these problems from affecting business and to
define Nonstop Networking in the process.
In 1998, as network availability moved to center
stage, we saw more and more industry leaders rec-
ommending APC solutions as a critical piece of
their end-to-end network architecture. IT manufac-
turers, industry experts and IT professionals con-
tinue to point toward the importance of power pro-
tection for PCs, servers and datacenters. During
the year we enjoyed the support of these leaders
as they either bundled, recommended or helped
develop new solutions.
NEC Japan recommended APC on the desktop
and named APC the vendor of choice for their
Express Server line. Meanwhile, Dell bundled
PowerNet® Manager for NT with PowerEdge
Servers 2200, 4200 & 6100. Helping to increase
our worldwide exposure, HP selected APC for
scalable NT Enterprise server solutions (LXr Pro8
system) in EMEA, offered Smart-UPS bundle pro-
16
Nonstop N
etworking
mos in China, and shipped a promotional
ProtectNet® with servers in EMEA. Continuing
this trend of a global standardized solution, IBM
offered Smart-UPS 620 for RS/6000 workstations
and APC UPSs for select IBM RS/6000 servers in
EMEA. IBM had already made APC power pro-
tection solutions available for RS/6000 servers in
North America (NAM), LAM and JPAA.
Siemens, emphasizing the importance of maxi-
mum availability in telecom applications, added
APC’s Symmetra Power Array to the list of APC
solutions they offer. Also at the enterprise level,
Sun selected Symmetra for Starfire servers, and
tested and qualified Smart-UPS 1000 for their
Enterprise 250 server.
As more and more importance was placed on inter-
networking gear, APC integrated with CiscoWorks
2000, while Nortel selected APC to protect the
BayStack line of internetworking equipment.
Power availability: the weakest linkIn spite of the flood of technological advance-
ments seen in the high-tech industry over the last
year, the reliable supply of electricity continues to
require the intervention of battery back-up power
and surge suppression. Many factors impact
power delivery, but few are as visible and lasting
as the weather. The year began with a bang as ice
storms ravaged the northern part of the North
American continent and caused major outages.
The need to bring in crews from all over the U.S.
and Canada to assist with repairs once again raised
the issue of the growing impact of deregulation on
utility companies’ ability to staff for contingencies.
On December 24, 1998 thousands of consumers
in the mid-Atlantic states suffered a serious blow
at the hands of Mother Nature. An unprecedent-
ed ice storm caused an eight-day outage, in spite
of advance preparations by the utility company
serving the region.
According to the Richmond Times-Dispatch, “The
silver lining in this coat of ice is awareness. It
should focus attention on whether enough safe-
guards are in place after deregulation to deal with
a widespread power outage.“
In many instances, utilities can provide power to
customers 99.977 percent of the time. This trans-
lates to 1.927 hours per year of downtime. At first
look, that means the power company would leave
the top MIS managers only a few hundredths of a
percent short of their goal of 99.999 percent
based on power availability alone.
Unfortunately, no matter how consistent the utility
power output is, power delivery holds its own set
of challenges over which the utilities have no con-
trol. The utility reliability figures are calculated dur-
ing normal conditions and do not include these inci-
dents and “acts of God” that are out of the utilities’
control. In the case of the Christmas Eve ice storm
mentioned above, the actual downtime was more
than a week. Companies that depend on IS, and
who carefully plan against downtime, must take
these uncontrollable outages into consideration. A
more accurate metric of total power availability is
the sum of downtime caused by all factors affect-
ing power from creation to delivery.
Just not enoughWhile the jury is still out on the impact of deregu-
lation on power availability, the need for power
protection as part of any contingency plan is clear.
During the past year, lengthy outages in New
Zealand, continued poor power quality in develop-
ing regions like India and China, and recent reports
published in the U.S. and Canada indicate that the
best course for businesses anywhere in the world
is to expect outages.
Even the most reliable utility companies in the
U.S. regularly fall short of the 99.999 percent
availability sought by IT managers. IT equipment
depends on power to function, and without a
back-up power supply, these systems are only as
capable as their weakest link. In many cases that
means the power coming out of the wall.
Assessing the IS impact worldwideTo make matters worse, little or no worldwide util-
ity availability reporting criteria have been estab-
lished. Many of the utility reliability estimates fail
to account for outages of five-seconds or shorter
duration, while some draw the line at one second.
In fact, only a few states or countries require any
kind of public disclosure at all.

17
“I’ve been involved with HAM radio operations as a hobby for almost 50 years,and have talked with people from hundredsof countries around the world.
“In June of 1998, a line of thunderstormsrolled across Long Island. I was working onmy PC at the time when suddenly I heardwhat sounded like a cannon going off rightover my head. It was obvious we had takena pretty serious hit. My radio, terminal nodecontroller (TNC), transformer, antennae and
Atari were all destroyed, to the tune ofabout $500 and several months off air.
“I immediately looked down at my four year-old Back-UPS Pro. Its light flickered but then stabilized, and my monitor blinked,but the PC stayed online and fully operational.That UPS did more than I thought it wouldever have to do, or I would ever ask it to do,and it continues to work today. What morecould you ask?”
“That UPS did morethan I thought it
would ever have todo, or I would everask it to do, and itcontinues to worktoday. What morecould you ask?”
Amateur Radio Enthusiast
The APC Back-UPS Pro®
Nonstop N
etworking
Marvin FricklasFreeport, New York

18
Nonstop N
etworking
“Spanning approximately 58 square miles between Dallas and Fort Worth,the Grand Prairie Independent SchoolDistrict serves over 19,000 K-12 studentsand approximately 1,500 district staff in30 school locations across Grand Prairie.The district has invested heavily in infor-mation technology, and our IT infrastruc-ture has changed dramatically in the lastseveral years.
“Many of our schools are older facilitiesthat were never designed to handle theelectrical loads necessary to support
the number of computers and the network infrastructure at each location.To protect our IT equipment in thesechallenging environments, we use APCuninterruptible power supplies and APCSurgeArrest surge protection devices atevery location.
“If the system fails, the teachers andstudents are denied the use of thetechnology in the learning process. I don’t think anyone can place a mone-tary figure on that cost.
“We have experienced no data lossesover the past two years due to systemfailures or electrical issues. APC prod-ucts have performed very well for us,and our experience has given us theconfidence to continue purchasing andinstalling APC equipment.”
“If the system fails, the teachers and students are denied theuse of the technology in the learning process. I don’t think
anyone can place a monetary figure on that cost.”
Grand Prairie Independent School District
Jon Warren and staffManager, Technology Services, Grand Prairie Independent School DistrictTexas
The APC SurgeArrest ®
SurgeStation™

19
Nonstop N
etworking
For network managers concerned about availability,
the task of tracking down the source and impact
of bad power is difficult to say the least. They
must begin with published utility downtime (if it is
published). Then they need to add in potential out-
ages due to:
● local weather; ● problems with the local power grid and dis-tribution system (which, due to deregula-tion, may or may not be managed by theutility providing the power);
● site characteristics (i.e., internal buildingwiring problems);
● and, planned downtime due to mainte-nance and construction.
The actual impact is then calculated based on:
● total user downtime and recovery time;● session losses (i.e., connections breaking inthe middle of a data transfer);
● help desk and service calls;● lost revenue;● and, worse, lost customers.
As you can see, the initial downtime factors cre-
ate a powerful “ripple effect” (see Figure 3)
which can quickly send costs skyrocketing.
Because so many of the factors are unpre-
dictable, the network manager must plan for and
prevent all of them to ensure reliability. APC is
positioned to assist at every point on the network
susceptible to power problems.
According to Contingency Planning, mission-critical
business application downtime can cost as much
as $6.45 million per hour (see Figure 4, p. 20 ). That
revenue exposure is at the core of the quest for
99.999 percent systems availability. If a utility
claims that two hours per year, excluding momen-
tary outages and acts of God, represent their peak
utility availability performance, it doesn’t take
much math to figure out just how quickly power
protection pays for itself.
Potential impact of Y2K on utility powerIn 1998, it seemed like everyone was talking
about Y2K and the full spectrum of its possible
impact on the world. Ranging from all out panic to
complete indifference, the consensus by year’s
end seemed to drift toward a cautious optimism
mixed with concern. The most recent report deliv-
ered by the North American Electric Reliability
Council (NERC) indicates a high probability that
the utility system won’t suffer a major interruption
of service as a result of the Y2K problem.
In spite of this good news, however, NERC does
recommend that “customers with electrical
demands essential to safety and public well-being
…[and] large commercial and industrial customers
that would be severely impacted by an electrical
outage, should review their emergency power
supply provisions and procedures, and coordinate
their needs with the local electricity provider.”
In sum, no one knows what the the future will
hold, but a recent APC survey of its customers
indicated that 78 percent of those surveyed have
included power protection in their Y2K contin-
gency plan. The same survey indicated a full 46
Compounded Impact
Local Weather
Local Grid(transformer load,poles or underground)
Site Characteristics(age, type of bldg.)
User Downtime
Session Losses
Recovery TimeHelp Desk Calls
Ripple effect: the impact of bad power
Source: APCFigure 3
Utility PowerInterruptions

20
Nonstop N
etworking
percent plan to purchase additional power protec-
tion in the next 12 months as part of that plan.
Most interesting from APC’s perspective is the
heightened level of overall awareness of the
importance of power protection. Even the process
of discussing the impact of Y2K on the utility
industry has many people in the press talking
about power problems in general. Dean Wolfe,
business editor of Network Magazine, had this to
say in his February, 1999 column:
“While amidst all the hair pulling and teeth gnash-
ing over Y2K readiness, don’t forget that a less
high-profile (and unforeseen) emergency could be
just as damaging to your network and IT systems.
The point was reinforced for me in December 1998
when Network Magazine’s editorial offices were
knocked offline by a massive power outage in the
San Francisco Bay Area. Your contingency plan
should be broad and collaborative. The network
department may have its house in order, but what
happens if the power goes down? Do you have a
plan to keep your server room from overheating?
What if you lose power and phone service?”
Meanwhile, the international outlook with regards
to the Y2K and utility power picture is much less
clear and in some cases much more ominous. The
government of the United Kingdom, one of the
few other Western nations with privatized utility
power, was feeling pressure from the private sec-
tor to provide details regarding Y2K readiness of
the power grid. As a result the government’s
Office of Electricity (OFFER) commissioned an
independent assessment of the electricity indus-
try’s Y2K readiness.
More drastic are the plans put in place by Dutch
energy officials. Uncomfortable with the progress
of its neighbors with regard to Y2K, the Dutch
government is adopting a policy of utility isola-
tionism designed to protect the stability of their
own grid. According to a recent report issued by
the International Trade Administration at the
United States Department of State, “As part of a
contingency plan for the sector, the Dutch nation-
al power grid will be disconnected from the inter-
national grid before the turn of the century.”
The impact could be greater in nations where the
resources to repair the millennium bug are simply
not available. Companies doing business in these
less stable regions will be forced to implement
more extreme contingency plans, many of which
should include power protection.
Overall, it is unclear what impact Y2K fears will
have on UPS buyers, but we welcome the
increased awareness of the potential impact of
power problems, and expect not every country will
ride into the next millennium without a few bumps.
In conclusion, through both innovation and acqui-sition, APC continued, in 1998, to meet cus-tomer demand for solutions that enhance theavailability of information systems. These effortsmoved us dramatically closer to our goal of pro-viding global, end-to-end, Nonstop Networkingsolutions to our customers.
$6.45 million
$2.6 million
$150,000
$113,000$89,500
Hom
e sh
oppi
ng (T
V)
Pay-
per-
view
Cred
it ca
rd/s
ales
Brok
erag
e op
erat
ions
Downtime costs per hour Airli
ne re
serv
atio
ns
Source: Contingency PlanningFigure 4

Annual Report on Form 10-K

23
ANNUAL REPORT ON FORM 10-KU.S. SECURITIES AND EXCHANGE COMMISSION
Washington, D.C. 20549
(Mark One)
[ X ] ANNUAL REPORT PURSUANT TO SECTION 13 OR 15(d) OF THE SECURITIES AND EXCHANGE ACT OF 1934
For the fiscal year ended December 31, 1998
or
[ ] TRANSITION REPORT PURSUANT TO SECTION 13 OR 15(d) OF THE SECURITIES EXCHANGE ACT OF 1934
For the transition period from ____________________ to ____________________
Commission File Number 1-12432
AMERICAN POWER CONVERSION CORPORATION(Exact name of Registrant as specified in its charter)
MASSACHUSETTS 04-2722013
(State or Other Jurisdiction of (I.R.S. Employer Incorporation or Organization) Identification No.)
132 FAIRGROUNDS ROAD, WEST KINGSTON, RHODE ISLAND 02892401-789-5735
(Address and telephone number of Principal Executive Offices)
Securities registered pursuant to Section 12(b) of the Act:
Securities registered pursuant to Section 12(g) of the Act:
None
Indicate by check mark whether the Registrant (1) has filed all reports required to be filed by Section 13 or 15(d) of the SecuritiesExchange Act of 1934 during the preceding 12 months (or for such shorter period that the Registrant was required to file suchreports) and (2) has been subject to such filing requirements for the past 90 days. YES [ X ] NO [ ]
Indicate by check mark if disclosure of delinquent filers pursuant to Item 405 of Regulation S-K is not contained herein, and willnot be contained, to the best of the Registrant’s knowledge, in definitive proxy or information statements incorporated by refer-ence in Part III of this Form 10-K or any amendment to this Form 10-K. [ ]
The aggregate market value of the voting stock held by non-affiliates of the Registrant on February 18, 1999 was approximate-ly $2,993,065,000 based on the price of the last reported sale as reported by the NASDAQ Stock Market on February 18, 1999.The number of shares outstanding of the Registrant’s Common Stock on February 18, 1999 was 95,881,000.
Documents Incorporated by ReferencePortions of the Registrant’s definitive Proxy Statement in connection with the Annual Meeting of the Shareholders to be held onMay 7, 1999 are incorporated by reference in Part III hereof.
Title of Each Class
Common Stock, $.01 par value
Name of Each Exchange on Which Registered
Pacific Exchange, Inc.
Form 10-K

24
Description of B
usiness
Part I
Item 1. Description of Business
The CompanyAmerican Power Conversion Corporation and its sub-sidiaries (the “Company”) designs, develops, manufac-tures, and markets power protection and managementsolutions for computer and electronic applications world-wide. The Company’s solutions include uninterruptiblepower supply products (“UPS”), electrical surge protectiondevices, power conditioning products, and associated soft-ware, services, and accessories. These solutions are foruse with sensitive electronic devices which rely on electricutility power including, but not limited to, home electronics,personal computers (“PCs”), high performance worksta-tions, servers, networking equipment, telecommunicationsequipment, internetworking equipment, datacenters, main-frame computers, and facilities.
The Company's UPS products regulate the flow of utilitypower to ensure safe and clean power to the protectedequipment and provide seamless backup power in theevent of the loss of utility power. The backup power lastsfor a period of time sufficient to enable the user to continuecomputer operations, conduct an orderly shutdown of theprotected equipment, preserve data, work through shortpower outages or, in some cases, continue operating forseveral hours or even days. The Company's surge protec-tion devices and power conditioning products provide pro-tection from electrical power surges and noise in the flowof utility power. The Company’s software and accessorysolutions enhance monitoring, management, and perform-ance of APC’s UPS products. The Company’s service offer-ings assist the end-user with installation and maintenanceof the Company’s UPS products.
The Company markets its products to business and homeusers around the world through a variety of distribution chan-nels, including computer distributors and dealers, valueadded resellers, mass merchandisers, catalog merchandis-ers, E-commerce vendors, and strategic partnerships.
The Company was incorporated under the laws of theCommonwealth of Massachusetts on March 11, 1981. TheCompany's executive offices are located at 132 FairgroundsRoad, West Kingston, RI 02892 and its telephone number is(401) 789-5735.
Acquisition of Silcon A/SEarly in the second quarter of 1998, the Company enteredinto a definitive agreement with the principal managementshareholders of Silcon A/S (“Silcon”) to acquire stock ofSilcon, a Denmark-based manufacturer of three-phaseUPSs up to 480 kilo volt-amps (“kVA”), and the Companycommenced a tender offer for Silcon shares. In June 1998,the initial tender offer and purchase of stock from principal
management shareholders was completed enabling theCompany to operate Silcon as a majority-owned subsidiary.During the second half of 1998, the Company increased itsownership percentage to 89%. The Company’s 1998 cashoutlays associated with the acquisition aggregating $64 mil-lion were financed from operating cash. In January 1999,the Company attained ownership of more than 90% of theshare capital of Silcon through open market purchasesfinanced from operating cash and commenced a mandatoryredemption of the remaining Silcon shares. Through thismandatory share redemption process, the Company antici-pates that it will complete its acquisition of the remainingoutstanding shares of Silcon during the second half of 1999.In connection with the mandatory redemption, theCopenhagen Stock Exchange has approved the de-listing ofSilcon’s shares effective March 1, 1999. See also the“Acquisition” section included in Management’s Discussionand Analysis of Financial Condition and Results ofOperations in Item 7 of this Report.
Market OverviewThe growth of the UPS industry has been fueled by therapid proliferation of microprocessor-based equipment andrelated systems in the corporate marketplace and in thesmall office / home office (“SOHO”) environment. PCs andservers have become an integral part of the overall businessstrategy of many organizations as well as in many technical,scientific, and manufacturing settings. Businesses continueto implement and run their operations via local area andwide area networks (“LANs” and “WANs”) as well as viacorporate intranets and the Internet. Businesses are alsobecoming aware of the need to protect devices such asswitches, hubs, routers, bridges, and other “smart” devicesthat manage and interconnect networks. It is necessary toprotect both the hardware and data stored in and travelingthrough these networks as well as to provide battery back-up to enhance productivity through the high availability ofnetworks, sensitive electronics and even facilities.
The Company believes that the increased awareness of thecosts and lost productivity associated with poor power qual-ity has increased demand for power protection products.Complete failures, surges, or sags in the electrical powersupplied by a utility can cause computers and related elec-tronic systems to malfunction, resulting in costly downtime,damaged or lost data files, and damaged hardware. A UPSprotects against these power disturbances by providingcontinuous power automatically and virtually instantaneous-ly after the electric power supply is interrupted, as well asline filtering and protection against surges or sags while theelectric utility is operating. A UPS can draw on the energystored in its internal battery to provide continuous, clean,computer power. In international regions power qualityoften results in varied levels of distortions and, as a result,these areas provide the Company with additional opportuni-ties for its products.
In 1998, the Company focused on providing global, end-to-end, Nonstop Networking solutions for the PC, server, data-
25
Description of B
usiness
center and enterprise markets. The acquisition of Silconexpanded the scope of the Company’s product reach,enabling it to address incremental segments of the UPSmarket, i.e., the larger than 16 kVA or enterprise segmentthat it was not previously addressing. Major global trendsaffecting the Company’s business in 1998 included the con-tinued global proliferation of servers and information tech-nology (“IT”) equipment, including those for Internet andintranet applications; the growth of PC sales; and the con-tinued poor and unreliable quality of power worldwide.
The Company’s goal is to leverage these trends, to targetthe sales of UPSs with new IT equipment, to have theproducts and presence to succeed in new geographies,and to continue to position itself as the UPS and power pro-tection solution provider of choice. The Company also con-tinues to target promotional efforts at the corporate, home,and SOHO PC markets, which it has identified as growthopportunities for the future, and continues to target indus-tries that are becoming more dependent on electronic sys-tems, such as the telecommunications industry, as poten-tial market growth opportunities.
Products
The Company's strategy is to design and manufactureproducts which incorporate high-performance and qualityat competitive prices. The Company’s products aredesigned to fit seamlessly into the computer and network-ing environments of businesses, homes, and SOHOs.These products are engineered and extensively tested forcompatibility with leading PC, server, datacenter, andenterprise hardware and software.
The Company currently manufactures a broad range of stan-dard domestic and international power protection solutions.The Company’s UPS models are designed for different appli-cations with the principal differences among the productsbeing the amount of power which can be supplied during anoutage, the length of time for which battery power can besupplied (the “run time”), the level of intelligent networkinterfacing capability, and the number of brownout and over-voltage correction features. The Company's present line ofUPS products ranges from 200 volt-amps (suitable for a PC)to 480 kVA (suitable for mainframe computers or facilities).List prices to end-users range from approximately $100 toapproximately $200,000. The Company also offersSurgeArrest®, PowerManager™, and ProtectNet® productsto protect against power spikes and surges. The principal dif-ference among the surge suppressor models is the level ofprotection available and feature sets. List prices to end-usersrange from approximately $25 to approximately $135.
The Company also develops a family of software productsunder the PowerChute® plus name which provides its userswith unattended shutdown capabilities, UPS power man-agement, and diagnostic features. PowerChute plus is avail-
able free of charge for many major operating systems withthe purchase of select UPS units from the Company. Listprices to end-users for other PowerChute products start at$69. The Company also offers software packages foradvanced monitoring, configuring, and managing of powerresources. Select versions are available free of charge fromthe Company. List prices range from $169 to $499.
In addition, the Company offers a range of complimentaryaccessory products designed to enhance the functionalityof the Company’s UPS and surge protection products.NetShelter® is a high-quality, free-standing enclosure forstoring and protecting network, internetworking, and powerprotection equipment. Other accessories offered by theCompany include MasterSwitch™ which provides remoteWeb/SNMP management and control of power to attachednetwork devices; PowerView™ for display of a UPS’s oper-ational status; Share-UPS® for reliable shutdown of multi-ple servers connected to a single UPS; SmartSlot™adapters designed to fully integrate with APC Smart-UPS®,Matrix UPS®, and Symmetra™ Power Array™ systems foradvanced UPS and environmental management; and cus-tomized cables for enhanced management and monitoringof APC UPSs. List prices to end-users for accessory prod-ucts range from $75 to $1,999.
Service ProgramsThe Company provides service programs to its customersfor in-warranty UPS products and out-of-warranty UPS prod-ucts, as well as for product installation and start-up. TheCompany offers two-year and one-year limited warrantiescovering its UPS products. The Company also offers its cus-tomers the opportunity to extend the basic warranty period,at an additional charge, for a period of one or three addi-tional years. In-warranty service programs allow customersto return their original unit for repair and, if found defective,the Company will replace the original unit with a factoryreconditioned unit or, if requested, repair the original unitand return it to the customer. The extended warranty can bepurchased anytime during the standard warranty period. Fora fixed fee (varying by model), the Company will replace anout-of-warranty UPS unit with a factory reconditioned unit.The Company offers a standard one year warranty whichcovers certain Silcon product parts. This warranty can beextended in annual increments for a period not to exceedten years. Additionally, the Company offers on-site serviceand preventative maintenance visits for Silcon systems.The Company offers on-site service through APC’s servicedepartment and third party vendors as well as Trade-UPSprograms for customers to upgrade old APC or competitiveunits to new APC units. The Company offers PowerAudit®,an on-site power quality consulting service which analyzesthe electrical infrastructure of a building to determine itssuitability for a given business and to identify corrections toexisting anomalies.

26
Description of B
usiness
The Company offers an Equipment Protection Policy (U.S.and Canada only) which provides up to $25,000 for repair orreplacement of customers' hardware should a surge orlightning strike pass through a Company unit. The policyapplies to all units manufactured after January 1, 1992.Other restrictions also apply. The Company’s customerscan also register the ProtectNet line of data line surge sup-pressors for a “Double-Up” Supplemental EquipmentProtection Policy, under which the total recoverable limitunder the Equipment Protection policy is doubled, up to$50,000. Most of the Company’s surge suppressor prod-ucts come with a lifetime product warranty.
The Company’s products have experienced satisfactoryfield operating results, and warranty costs incurred to datehave not had a significant impact on the Company's con-solidated results of operations.
Distribution Channels
The Company markets its products to businesses, homeusers, and SOHOs around the world through a variety ofdistribution channels, including computer distributors anddealers, value added resellers, mass merchandisers, cata-log merchandisers, E-commerce vendors and strategicpartnerships. The Company also sells directly to some largevalue added resellers, which typically integrate theCompany’s products into specialized microcomputer sys-tems and then market turnkey systems to selected verticalmarkets. Additionally, the Company sells certain selectproducts directly to manufacturers for incorporation intoproducts manufactured or packaged by them.
In 1998 and 1997, one customer accounted for approxi-mately 11% and 10%, respectively, of the Company’s netsales. In 1996, no single customer comprised 10% or moreof the Company’s net sales.
Sales and Marketing
The Company’s sales and marketing organizations are pri-marily responsible for four activities: sales, marketing, cus-tomer service, and technical support. The Company’s salesstaff is responsible for relationships with distributors, deal-ers, strategic partners and end users as well as developingnew distribution channels, particularly in geographic andproduct application areas into which the Company isexpanding. The Company’s sales force focuses on the cus-tomer through customer units dedicated to specific cus-tomer groups. The Company has charged its sales forcewith providing its customers with comprehensive productand service solutions to their power management needs.
The Company’s marketing activities include marketresearch, product planning, trade shows, sales and pricingstrategies, and product sales literature. The Company alsoutilizes direct marketing efforts domestically and interna-tionally, including direct mailings and print, online/Internet,radio, and television advertising, as well as exhibiting at
computer trade shows. Customer service is responsible forall technical marketing inquiries and customer support. TheCompany has developed a number of programs and tech-niques to support the Company’s distribution channels.These include, but are not limited to, toll-free phone assis-tance, online product and technical information, formalproduct demonstrations, and reseller trainings.
Manufacturing, Quality Control, and SupplyThe Company’s manufacturing operations are located in theUnited States, Ireland, the Philippines, China, Denmark,and Switzerland. The Company believes that its long-termsuccess depends on, among other things, its ability to con-trol its costs. The Company utilizes state-of-the-art auto-mated manufacturing techniques and extensive qualitycontrol in order to minimize costs and maximize productreliability. In addition, the design of products and the com-monality of parts allow for efficient circuit board componentinsertion, wave soldering, and in-process testing. Qualitycontrol procedures are performed at the component, sub-assembly, and finished product levels.
The Company is committed to an ongoing effort to enhancethe overall productivity of its manufacturing facilities. TheCompany uses lean, “cell” based manufacturing processes.Such processes have been implemented in the Company’sU.S. facilities as well as a majority of its international locations.
National Quality Assurance has granted the Company itsISO 9000 quality seal. The Company’s systems have beenaudited to the stringent ISO 9002 level at its manufacturingfacilities in the United States, Galway, Ireland, and at two ofits facilities in the Philippines. Additionally, its Denmarkmanufacturing operation is certified at the ISO 9001 level.
The Company generally purchases devices and componentsfrom more than one source where alternative sources areavailable; however, it does use sole source suppliers for cer-tain components. The Company believes that alternativecomponents for these sole source items could be incorpo-rated into the Company’s products, if necessary. While theCompany has been able to obtain adequate supplies of itscomponents from sole source suppliers, the future unavail-ability of components from these suppliers could disruptproduction and delivery of products until an alternativesource is identified. See also the Company’s Year 2000Readiness Disclosure Statement included in Management’sDiscussion and Analysis of Financial Condition and Resultsof Operations in Item 7 of this Report.
Product DevelopmentThe Company's research and development (“R&D”) staffincludes engineers and support persons who develop newproducts and provide engineering support for existing prod-ucts. The Company’s R&D efforts are also aimed at reduc-ing cost and total cycle time and improving product andcomponent quality. Most of these employees are located intwo Massachusetts facilities with additional resources

27
Description of B
usiness
located in Denmark. Employees devoted to the improve-ment and development of software products are located inthe West Kingston, Rhode Island facility and in St. Louis,Missouri, at the Company’s subsidiary, SystemsEnhancement Corporation. The Company believes that thetechnical expertise of its R&D staff is very important to itsgrowth as technological change is rapid in the UPS field.
During 1998, the Company expanded its product offeringsin the enterprise market with the acquisition of Silcon, aleading manufacturer of three-phase UPSs up to 480 kVA.(For more information about this acquisition, see the“Acquisition” section included in Management’sDiscussion and Analysis of Financial Condition and Resultsof Operations in Item 7 of this Report.) Implementation ofAPC’s enterprise power protection strategy began in 1997with the introduction of the Symmetra Power Array, thefirst scalable and fault-tolerant power protection systemfor multiple servers, computer rooms, call centers, andback-office applications. The Company also innovated itsdesktop line of UPSs during 1998, revamping its Back-UPS® line and adding new features, including UniversalSerial Bus support, to select products in the Back-UPSPro® line. Additional areas of development included newproducts for the internetworking market; additional net-work management support via new PowerChute andPowerNet® solutions; and customized hardware and soft-ware products for strategic partners.
During 1997, the Company’s new product offeringsincluded the Symmetra Power Array, its first entry into theabove 5kVA market segment. Shipments of Symmetrabegan in the third quarter of 1997. The Company alsoadded additional products which strengthen theCompany’s position as an overall network solutionprovider. These introductions included additions to theCompany’s SurgeArrest line of surge protectors; addition-al and enhanced solutions for addressing manageabilityacross a growing number of operating systems and man-agement platforms; new rack-mount networking solutionsand special product development for our strategic part-ners and international marketplaces.
During 1996, the Company’s new product offerings includ-ed the Back-UPS Office® which was introduced in the sec-ond quarter. This product was designed to be solution spe-cific to the PC end-user, especially those using theInternet. Other new products included web managementcapability with PowerChute plus software, a network-man-ageable power distribution unit, and MasterSwitch, whichenables a network manager to control attached loadsindependent of each other.
Intellectual PropertyThe Company protects certain proprietary rights in its prod-ucts as well as certain proprietary technology develop-
ments by seeking patent protection. The Companybelieves that the loss of such rights concerning thesedevelopments would not have a material adverse effect onthe Company’s business. With respect to protection ofthose areas of its technology for which patent protectionhas not been sought, the Company relies on the complex-ity of its technology, trade secrecy law, and employee con-fidentiality agreements.
The Company has numerous trademarks registered in theUnited States and in many foreign countries. The Companyalso has trademark applications pending domestically andinternationally. The Company believes that its trademarksare valuable intangible assets, but also believes that theloss of any one trademark would not have a materialadverse effect on its operations.
CompetitionThe Company believes that it is one of less than ten globalcompanies providing a full range of UPS products and serv-ices worldwide. The Company’s principal competitorsinclude Exide Electronics Group, Inc., a business unit ofBTR PLC, Best Power, a business unit of SPX Corp., LiebertCorporation, a division of Emerson Electric Co., MGE UPSSystems, a privately held French company, Chloride Power,a subsidiary of Chloride Group PLC, and Phoenixtec PowerCompany Ltd., a publicly held Taiwanese company. TheCompany also competes with a number of other U.S. andnon-U.S. based companies which offer power protectionproducts similar to the Company’s products. Some of thesecompetitors have greater financial and other resources thanthe Company. The Company competes in the sale of itsproducts on the basis of several factors, including productperformance and quality, marketing and access to distribu-tion channels, customer service, product design, and price.
International OperationsThe Company plans to continue to expand its internationalmarketing efforts and manufacturing operations. With a fullline of internationally-positioned products already available,the Company continues to staff personnel to serve geo-graphical markets of interest. The Company’s primary man-ufacturing operations outside of the United States are locat-ed in Ireland, the Philippines, China, Denmark, andSwitzerland. For more information about the Company’srecent Denmark-based acquisition, see the “Acquisition”section included in Management’s Discussion and Analysisof Financial Condition and Results of Operations in Item 7 ofthis Report. The Company’s primary sales offices outside ofthe United States are located in Europe and the Far East.These offices, together with offices in other locations world-wide, provide sales and technical support to customersaround the globe. The Company utilizes third party ware-houses in Europe, the Far East, Canada, South Africa, andUruguay for distribution into its international markets.

28
Description of B
usiness
During the fourth quarter of 1998, the Company beganestablishing a manufacturing operation in India. TheCompany will be leasing a 42,000 square foot facility inBangalore and expects to begin manufacturing selectedproducts at this facility during the second quarter of 1999.
During the first quarter of 1998, the Company establisheda manufacturing operation in China. The Company is leas-ing a 50,000 square foot facility in Suzhou and beganmanufacturing selected products at this facility during thethird quarter of 1998.
The Company’s manufacturing facilities in the Philippinesare operating within a designated economic zone whichprovides certain incentives, primarily in the form of taxexemptions. In August 1998, the Company purchased athird manufacturing facility in the Philippines for approxi-mately $750,000, financed from operating cash. ThePhilippines facilities manufacture certain Back-UPS andSmart-UPS products sold in the Company’s domestic andinternational markets.
The Company’s Galway and Castlebar, Ireland operationsare providing manufacturing and technical support to serv-ice the Company's international customers. The Companyhas agreements with the Industrial Development Authorityof Ireland (“IDA”) under which the Company receives grantmonies for costs incurred for machinery, equipment, andbuilding improvements for its Galway and Castlebar facili-ties equal to 40% and 60%, respectively, of such costs upto a maximum of $13.1 million and $1.3 million, respective-ly. Such grant monies are subject to the Company meetingcertain employment goals and maintaining operations inIreland until termination of the respective agreements.Under separate agreements with the IDA, the Companyreceives direct reimbursement of training costs at itsGalway and Castlebar facilities for up to $3,000 and$12,500, respectively, per new employee hired. See alsonote 12 to the consolidated financial statements.
The Company continues to evaluate international manufac-turing expansion including additional locations in the FarEast and South America.
Financial Information About Foreign and Domestic OperationsThe information required under this section is included innote 8 of Notes to Consolidated Financial Statements in Item8 of this Report and is incorporated herein by reference.
EmployeesAs of December 31, 1998, the Company had approxi-mately 5,443 full-time employees worldwide, approxi-mately 2,173 of whom are located in the United Statesand Canada. The Company also engages other personnelon a part-time basis. The Company considers its relationswith employees to be good.
Executive Officers of the CompanyExecutive officers of the Company are elected annually andhold office until the next Annual Meeting of the Board ofDirectors and until their successors are duly elected andqualified. As of February 18, 1999, the executive officers ofthe Company were as follows:
Name Age Positions
Rodger B. Dowdell, Jr 49 Chairman of the Board of Directors, President, and Chief Executive Officer
Neil E. Rasmussen 44 Vice President, Chief Technical Officer, and Director
Edward W. Machala 44 Vice President, Operations, and Treasurer
Donald M. Muir 42 Vice President, Finance and Administration, and Chief Financial Officer
Emanuel E. Landsman 62 Vice President, Clerk, and Director
David P. Vieau 48 Vice President, Worldwide Business Development
Aaron L. Davis 32 Vice President, Marketing and Communications
Rodger B. Dowdell, Jr. joined the Company in August1985 and has been the President and a Director sincethat time. From January to August 1985, Mr. Dowdellworked for the Company as a consultant, developing amarketing and production strategy for UPS products.From 1978 to December of 1984 he was President ofIndependent Energy, Inc., a manufacturer of electronictemperature controls.
Neil E. Rasmussen has been Vice President and aDirector of the Company since its inception. From 1979to 1981, Mr. Rasmussen worked in the Energy SystemEngineering Group at Massachusetts Institute ofTechnology’s Lincoln Laboratory.
Edward W. Machala joined the Company in January 1989as Vice President, Operations. From January 1985 toJanuary 1989, Mr. Machala was Director of Manufacturingand Engineering Technology for GTECH, a manufacturer ofelectronic lottery and gaming terminals, where he wasresponsible for manufacturing and engineering functions.
Donald M. Muir joined the Company in July 1995 as ChiefFinancial Officer. From July 1993 to July 1995, Mr. Muirwas the Treasurer of Stratus Computer, Inc. where he wasresponsible for managing investor relations, treasury serv-

29
Description of B
usiness
In Square FeetSales,
Location of Marketing, &Principal Properties Administration Manufacturing R&D Warehouse Total
OwnedUnited States
Rhode Island 136,000 86,000 30,000 252,000Massachusetts 69,000 69,000
EuropeIreland 20,000 200,000 130,000 350,000Denmark 27,660 71,925 11,065 110,650
Far EastPhilippines 110,370 38,031 148,401
LeasedUnited States
Rhode Island 115,800 417,200 533,000Florida 66,000 85,000 151,000Missouri 12,500 2,700 11,460 1,350 28,010
EuropeSwitzerland 14,120 19,380 540 8,610 42,650
Far EastChina 50,000 50,000
ices, corporate taxation and risk management. Prior to hisappointment as Treasurer at Stratus Computer, Inc., Mr.Muir held the position of Director of Finance andAdministration from January 1991 to July 1993 andController, Worldwide Sales and Service from December1988 to January 1991.
Emanuel E. Landsman has been Vice President, Clerk, anda Director of the Company since its inception. From 1966 to1981, Dr. Landsman worked at Massachusetts Institute ofTechnology’s Lincoln Laboratory, where he was in theSpace Communications Group from 1966 to 1977 and theEnergy System Engineering Group from 1977 to 1981.
David P. Vieau assumed the position of Vice President,Worldwide Business Development in October 1995 aftercompleting a short sabbatical. Mr. Vieau served as VicePresident of Marketing from October 1991 to June 1995.From July 1988 to August 1991, he was President of Poly-Flex Circuits, Inc., a division of Cookson America.
Aaron L. Davis was appointed Vice President, Marketingand Communications in June 1997, after serving as VicePresident of Marketing Communications since January1995. Mr. Davis joined the Company as Director ofMarketing Communications in May 1989.
Item 2. Properties
The Company’s principal properties are located in theUnited States, Ireland, Denmark, Switzerland, thePhilippines, and China. In addition, the Company owns orleases sales offices and other space at various locationsthroughout the United States and outside the United States.The Company also owns or leases such machinery andequipment as are necessary in its operations. In general, itsproperties are in good condition, are considered to be ade-quate for the uses to which they are being put, and are sub-stantially in regular use. The Company continues to evaluateinternational manufacturing expansion, including additionallocations in the Far East and South America. See tablebelow.
Item 3. Legal Proceedings
The information required under this section is included innote 9 of Notes to Consolidated Financial Statements inItem 8 of this Report and is incorporated herein by reference.
Item 4. Submission of Matters to a Vote ofSecurity Holders
Not applicable.

30
Selected Financial D
ata
Net sales
Cost of goods sold
Gross profit
Costs and expenses
Operating income
Other income, net
Earnings before income taxesand minority interest
Income taxes
Earnings before minority interest
Minority interest, net
Net income
Basic earnings per share
Basic weighted average shares outstanding
Diluted earnings per share
Diluted weighted average shares outstanding
Total assets
Short-term debt
Long-term debt
1994
$378,295
189,954
188,341
82,692
105,649
3,701
109,350
38,075
71,275
-
$71,275
$.78
91,824
$.77
92,913
$265,163
-
-
1995
$515,262
284,500
230,762
127,057
103,705
860
104,565
35,029
69,536
-
$69,536
$.75
92,939
$.74
93,867
$346,588
-
-
1996
$706,877
407,902
298,975
165,185
133,790
5,189
138,979
46,558
92,421
-
$92,421
$.98
93,872
$.98
94,347
$504,002
-
-
1997
$873,388
476,060
397,328
225,890
171,438
6,354
177,792
56,004
121,788
-
$121,788
$1.28
94,993
$1.27
96,121
$641,290
-
-
1998
$1,125,835
621,073
504,762
300,293
204,469
11,687
216,156
68,231
147,925
349
$147,576
$1.55
95,503
$1.52
96,788
$871,983
$12,540
-
Part II
Item 5. Market for Registrant’s Common Stockand Related Stockholder Matters
The Company’s Common Stock is traded over-the-counter onthe NASDAQ Stock Market under the symbol APCC and thePacific Exchange, Inc. under the symbol ACC. The followingtable sets forth the range of high and low bid quotations pershare of Common Stock for the years 1998 and 1997.
On February 18, 1999, the closing sale price for theCompany’s Common Stock was $37 7/8 per share. As ofFebruary 18, 1999, there were approximately 2,025 holdersof record of the Company’s Common Stock. No cash divi-dends have been paid and it is anticipated that none will bedeclared in the foreseeable future. The Company currentlyintends to retain any earnings to finance the growth anddevelopment of the Company’s business. Any future divi-dends will be at the discretion of the Board of Directors andwill depend upon, among other things, the financial condition,capital requirements, earnings, and liquidity of the Company.
Item 6. Selected Financial Data
All amounts are in dollars except for outstanding shares.Dollars are in thousands except for basic and diluted earningsper share. Shares are in thousands. The Company did notdeclare any cash dividends for the five year period presented.
Low
$18 7/8
15 1/4
18 1/4
22 1/8
High
$31 1/2
24 1/2
28 5/8
34 3/8
Low
$23 1/2
27 1/8
26 7/8
29 3/4
High
$30 3/8
34 3/8
39 1/2
49 9/16
First Quarter
Second Quarter
Third Quarter
Fourth Quarter
1998 1997
216,156 177,792 138,979 104,565 109,350

31
Managem
ent’s Discussion and A
nalysis
Item 7. Management’s Discussion and Analysis of Financial Condition and Results of Operations
Results of operationsThe following table sets forth the Company’s net sales, costof goods sold, gross profit, marketing, selling, general andadministrative expenses, R&D expenses, operating income,other income, earnings before income taxes and minorityinterest, earnings before minority interest, and net income,expressed as a percentage of net sales, for the years endedDecember 31, 1998, 1997, and 1996.
Revenues
Net sales in fiscal year 1998 increased by 28.9% to $1,125.8million from $873.4 million in fiscal year 1997, which reflect-ed a 23.6% increase from $706.9 million in fiscal year 1996.The increases from 1996 to 1998 are attributable to contin-ued strong demand for the Company's uninterruptiblepower supply products (“UPS”) and surge protection prod-ucts, combined with $49.8 million in 1998 net sales attrib-utable to Silcon (see “Acquisition” below). In addition, salesof new products and increased efforts by, and the additionof members to, the Company's sales staff have contributedto increased sales volumes. Net sales attributable to newproducts totaled approximately 11%, 8%, and 7%, of 1998,1997 and 1996 net sales, respectively.
Foreign sales to unaffiliated customers, primarily in Europe,the Far East, Canada, and South America, were $486.6 mil-lion or 43.2% of net sales in fiscal year 1998 compared to$378.3 million or 43.3% of net sales in fiscal year 1997 and$305.1 million or 43.2% of net sales in fiscal year 1996. Seealso note 8 to the consolidated financial statements.
Cost of Goods Sold
Cost of goods sold was $621.1 million or 55.2% of net salesin fiscal year 1998 compared to $476.1 million or 54.5% ofnet sales in fiscal year 1997. Gross margins declined byapproximately 70 basis points during 1998 from fiscal year1997. Substantially all of the gross margin erosion was prod-uct mix related as the Company’s high-power UPS businessnow accounts for a larger percentage of revenue.
Cost of goods sold was $476.1 million or 54.5% of net salesin fiscal year 1997 compared to $407.9 million or 57.7% ofnet sales in fiscal year 1996. Gross margins improved byapproximately 320 basis points during 1997 over fiscal year1996, primarily attributable to several factors including, butnot limited to: continued improvement in margins on lowercost Back-UPS products manufactured in the Philippines,the favorable margin impact of a higher-end product mixresulting from strong growth in Smart-UPS sales into theserver segment of the power protection market, and vol-ume production efficiencies, partially offset by certain pricereductions implemented during the fourth quarter.
Total inventory reserves at December 31, 1998 were $13.3million compared to $19.3 million at December 31, 1997.The Company’s reserve estimate methodology involvesquantifying the total inventory position having potential lossexposure, reduced by an amount reasonably forecasted tobe sold, and adjusting its interim reserve provisioning tocover the net loss exposure.
Operating Expenses
Marketing, selling, general, and administrative (SG&A)expenses were $260.2 million or 23.1% of net sales in 1998compared to $203.5 million or 23.3% of net sales in 1997 and$150.4 million or 21.3% of net sales in 1996. The increases intotal spending in 1998 and 1997 were due primarily to costsassociated with increased staffing and operating expenses ofselling, administrative, and marketing functions, as well asincreased advertising and promotional costs.
The allowance for bad debts was 7.9% of accounts receivableat December 31, 1998 compared to 8.5% at December 31,1997. The Company continues to experience strong collectionperformance from its accounts receivable with outstandingbalances over 60 days outstanding representing 8.6% and6.6% of total receivables at December 31, 1998 and 1997,respectively. Write-offs of uncollectible accounts representless than 1% of net sales. A majority of international customerbalances are covered by receivables insurance.
R&D expenditures for 1998, 1997 and 1996 were $32.6 mil-lion, $22.4 million, and $14.8 million, respectively. Theincreased R&D spending primarily reflects increased num-bers of software and hardware engineers and costs associ-ated with new product development and engineering sup-port. In addition, during 1998, the Company recorded non-recurring charges of $7.6 million for acquired in-processR&D in connection with its acquisition of Silcon (see“Acquisition” below). The Company expects its recurringR&D expenditures to remain at substantially the same levelas a percentage of sales for the foreseeable future.
Net sales
Cost of goods sold
Gross profit
Marketing, selling, general& administrative expenses
Research & development
Acquired research & development
Operating income
Other income, net
Earnings before income taxes& minority interest
Earnings before minority interest
Net income
1996
100.0
57.7
42.3
21.3
2.1
-
18.9
.8
19.7
13.1
13.1
1997
100.0
54.5
45.5
23.3
2.6
-
19.6
.7
20.3
13.9
13.9
1998
100.0
55.2
44.8
23.1
2.9
.6
18.2
1.0
19.2
13.1
13.1
32
Managem
ent’s Discussion and A
nalysis
Other Income, Net and Income Taxes
Other income is comprised principally of interest income,which increased substantially from 1996 to 1998 due tohigher average cash balances available for investment dur-ing 1997 and 1998.
Excluding 1998 non-tax deductible charges of $7.6 millionfor acquired in-process R&D (see “Acquisition” below), theCompany's effective income tax rates were 30.5%, 31.5%,and 33.5% in 1998, 1997 and 1996, respectively. Thedecrease from 1996 to 1998 is due to the expected tax sav-ings from an increasing portion of taxable earnings beinggenerated from the Company’s operations in Ireland, a juris-diction which currently has a lower income tax rate for man-ufacturing companies than the present U.S. statutoryincome tax rate.
Effects of InflationManagement believes that inflation has not had a materialeffect on the Company’s operations.
Liquidity and Financial ResourcesWorking capital at December 31, 1998 was $493.8 millioncompared to $426.8 million at December 31, 1997. TheCompany’s cash position decreased to $219.9 million atDecember 31, 1998 from $270.1 million at December 31,1997, primarily due to the cash purchase of approximately89% of the share capital of Silcon (see “Acquisition”below).
Worldwide inventories were $228.7 million at December 31,1998 compared to $104.2 million at December 31, 1997.Inventories increased during 1998 due to increased demandand increased sourcing from the Philippines where longertransit times result in higher finished goods inventories,combined with $19 million of inventory purchased in theSilcon acquisition.
At December 31, 1998, the Company had $50 million avail-able for future borrowings under an unsecured line of cred-it agreement at a floating interest rate equal to the bank’scost of funds rate plus .625% and an additional $15 millionunder an unsecured line of credit agreement with a secondbank at a similar interest rate. No borrowings were out-standing under these facilities at December 31, 1998. Inconnection with the acquisition of Silcon (see “Acquisition”below), the Company acquired $24.8 million in bank indebt-edness with interest rates ranging from 4% to 8%. TheCompany repaid $12.3 million of this indebtedness duringthe second half of 1998. The Company had no significantfinancial commitments, other than those required in thenormal course of business, at December 31, 1998.
During 1998 and 1997, the Company's capital expenditures,net of capital grants, amounted to approximately $55.7 mil-lion and $37.2 million, respectively, consisting primarily ofmanufacturing and office equipment, buildings andimprovements, and purchased software applications. The
nature and level of capital spending was made to improvemanufacturing capabilities, establish additional manufactur-ing capabilities in China, the Philippines, and Ireland to sup-port the increased selling, marketing, and administrativeefforts necessitated by the Company's significant growth,and to improve the Company’s enterprise-wide softwareapplications. Substantially all of the Company’s net capitalexpenditures were financed from available operating cash.The Company had no material capital commitments atDecember 31, 1998. Capital expenditures in 1999 areplanned to grow in line with expected 1999 revenuegrowth, primarily to support planned capacity expansions.
The Company has agreements with the IndustrialDevelopment Authority of Ireland (“IDA”) under which theCompany receives grant monies for costs incurred formachinery, equipment, and building improvements for itsGalway and Castlebar facilities equal to 40% and 60%,respectively, of such costs up to a maximum of $13.1 mil-lion and $1.3 million, respectively. Such grant monies aresubject to the Company meeting certain employment goalsand maintaining operations in Ireland until termination of therespective agreements. Under separate agreements withthe IDA, the Company receives direct reimbursement oftraining costs at its Galway and Castlebar facilities for up to$3,000 and $12,500, respectively, per new employee hired.See also note 12 to the consolidated financial statements.
During the fourth quarter of 1998, the Company beganestablishing a manufacturing operation in India. TheCompany will be leasing a 42,000 square foot facility inBangalore and expects to begin manufacturing selectedproducts at this facility during the second quarter of 1999.
During the first quarter of 1998, the Company established amanufacturing operation in China. The Company is leasing a50,000 square foot facility in Suzhou and began manufac-turing selected products at this facility during the third quar-ter of 1998. Capital expenditures for the China expansionwere financed from operating cash.
The Company’s manufacturing operation in the Philippinesis operating within a designated economic zone which pro-vides certain economic incentives, primarily in the form oftax exemptions. In August 1998, the Company purchased athird manufacturing facility in the Philippines for approxi-mately $750,000, financed from operating cash. ThePhilippines facilities currently manufacture certain Back-UPS and Smart-UPS products sold in the Company’sdomestic and international markets.
The Company continues to evaluate international manufac-turing expansion, including additional locations in the FarEast and South America.
Management believes that current internal cash flowstogether with available cash, available credit facilities or, ifneeded, the proceeds from the sale of additional equity, willbe sufficient to support anticipated capital spending and otherworking capital requirements for the foreseeable future.

33
Managem
ent’s Discussion and A
nalysis
Acquisition of Silcon A/SEarly in the second quarter of 1998, the Company enteredinto a definitive agreement with the principal managementshareholders of Silcon A/S (“Silcon”) to acquire stock ofSilcon, a Denmark-based manufacturer of three-phase UPSsup to 480 kilo volt-amps (“kVA”), and the Company com-menced a tender offer for Silcon shares. In June 1998, theinitial tender offer and purchase of stock from principal man-agement shareholders was completed enabling theCompany to operate Silcon as a majority-owned subsidiary.During the second half of 1998, the Company increased itsownership percentage to 89%. The Company’s 1998 cashoutlays associated with the acquisition aggregating $64 mil-lion were financed from operating cash. In January 1999, theCompany attained ownership of more than 90% of the sharecapital of Silcon through open market purchases financedfrom operating cash and commenced a mandatory redemp-tion of the remaining Silcon shares. Through this mandatoryshare redemption process, the Company anticipates that itwill complete its acquisition of the remaining outstandingshares of Silcon during the second half of 1999. In connec-tion with the mandatory redemption, the Copenhagen StockExchange has approved the de-listing of Silcon’s shareseffective March 1, 1999.
The purchase price was allocated to the net tangible and iden-tifiable intangible assets acquired and to acquired in-processR&D (“acquired R&D”). Acquired R&D includes the value ofproducts in the development stage that are not considered tohave reached technological feasibility and that have no alter-native future uses. The acquired R&D effort related to sever-al technologies for products that Silcon was developing forwhich the Company intends to complete development. At thevaluation date, none of these products had demonstratedtheir technological or commercial feasibility. Significant riskexists since the Company is unable to predict with certaintythe obstacles it may encounter in the form of time and costnecessary to produce technologically feasible products.Should these proposed products fail to become viable, the in-process technology has no alternative use and it is unlikelythat the Company would be able to realize any value from thesale of the technology to another party. The Company usedprofessional consultants to assess and allocate values to theacquired R&D, which were determined by estimating the con-tribution of the acquired R&D technology to developing com-mercially viable products, estimating the resulting net cashflows from the expected sales of such products, and dis-counting the net cash flows to their present value using a risk-adjusted discount rate. The Company believes that theassumptions used in the forecasts were reasonable at thetime of the acquisition. No assurance can be given, however,that the underlying assumptions used to estimate expectedproduct sales, development costs, or profitability will transpireas estimated. For these reasons, actual results may vary fromthe projected results.
In accordance with applicable accounting rules, acquired R&Dis required to be expensed. Accordingly, $7.6 million of theacquisition cost was expensed in 1998. The remaining pur-
chase price exceeded the fair value of the tangible net assetsacquired by approximately $47 million, consisting of identifi-able intangible assets and goodwill, which is being amortizedon a straight-line basis over 15 years. The acquisition hasbeen accounted for as a purchase and, accordingly, Silcon’sresults of operations are included in the Company’s consoli-dated financial statements from the date of acquisition.
Foreign Currency ActivityThe Company invoices its customers in Denmark, France,Germany, Great Britain, Switzerland, and Japan in their respec-tive local currencies. Realized and unrealized transaction gainsor losses are included in the results of operations and aremeasured based upon the effect of changes in exchange rateson the actual or expected amount of functional currency cashflows. Transaction gains and losses were not material to theresults of operations in 1998, 1997 and 1996.
At December 31, 1998, the Company’s unhedged foreigncurrency accounts receivable, by currency, were as follows:
The Company also had non-trade receivables of 3.9 millionIrish Pounds (approximately US$5.8 million), as well as IrishPound denominated liabilities of 3.9 million (approximatelyUS$5.8 million). The Company also had short term debt andliabilities denominated in various European currencies ofUS$42.8 million, as well as Yen denominated liabilities ofapproximately US$1.6 million.
The Company continually reviews its foreign exchange expo-sure and considers various risk management techniques,including the netting of foreign currency receipts and dis-bursements, rate protection agreements with customers/ven-dors and derivatives arrangements, including foreignexchange contracts. The Company presently does not utilizerate protection agreements or derivative arrangements.
Recently Issued Accounting StandardThe Financial Accounting Standards Board recently issuedStatement of Financial Accounting Standards (“SFAS”)No. 133, Accounting for Derivative Instruments andHedging Activities, which establishes accounting andreporting standards for derivative instruments, includingcertain derivative instruments embedded in other con-tracts (collectively referred to as derivatives), and forhedging activities. This Statement is effective for all fiscalquarters of fiscal years beginning after June 15, 1999. Theadoption of this Statement is not expected to have a
In thousands
German Marks
British Pounds
French Francs
Swiss Francs
Danish Kroner
Japanese Yen
Foreign Currency
21,442
6,063
48,679
7,821
23,000
1,086,192
US Dollars
$12,762
10,062
8,662
5,666
3,594
9,528

34
Managem
ent’s Discussion and A
nalysis
material impact on the Company’s consolidated financialposition or results of operations.
The AICPA Accounting Standards Executive Committeerecently issued Statement of Position (“SOP”) 98-1,Accounting for the Costs of Computer Software Developedor Obtained for Internal Use. This SOP requires that certaincosts related to the development or purchase of internal-use software be capitalized and amortized over the esti-mated useful life of the software, and is effective for fiscalyears beginning after December 15, 1998. The SOP alsorequires that costs related to the preliminary project stageand post implementation/operations stage in an internal-usecomputer software development project be expensed asincurred. The adoption of this SOP is not expected to havea material impact on the Company’s consolidated financialposition or results of operations.
The AICPA Accounting Standards Executive Committeerecently issued SOP 98-5, Reporting on the Costs of Start-Up Activities. This SOP requires that costs incurred duringstart-up activities, including organization costs, be expensedas incurred, and is effective for fiscal years beginning afterDecember 15, 1998. The adoption of this SOP is expectedto have no impact on the Company’s consolidated financialposition or results of operations.
Year 2000 Readiness Disclosure StatementMany computer systems were not designed to handle anydates beyond the year 1999 and, therefore, many compa-nies will be required to modify their computer hardware andsoftware prior to the year 2000 in order to remain fully oper-ational. During 1998, the Company commenced a year 2000readiness program to assess the impact of the year 2000issue on the Company’s operations and address necessaryremediation. A year 2000 program director reporting direct-ly to senior management has been assigned to this project.
Assessment of the Company’s Products for Year 2000 Compliance
All of the Company’s hardware products and accessoriesare year 2000 compliant, meaning that they have been test-ed to verify that where date fields are processed, dates arecalculated and displayed accurately, and that scheduledevents such as shutdowns, self-tests, and run-time calibra-tions, and also the handling of unscheduled events, such aspower failures, are unaffected by the millennium and cen-tury change; provided that all other third party products(e.g., software, firmware, operating systems, and hard-ware) properly exchange date data with the Company’sproducts and provided also that the Company’s products areused in accordance with the product documentation. Inaddition, the Company’s year 2000 compliant products rec-ognize the year 2000 as a leap year. The Company has alsotested its software products and determined that theseproducts are substantially year 2000 compliant, and theCompany intends to resolve any remaining year 2000issues before the beginning of the fourth quarter of 1999.
Periodically updated information about the Company’s soft-ware products is available at the Company’s Year 2000Readiness Disclosure Web site (www.apcc.com).Information on this site is provided to the Company’s cus-tomers for the sole purpose of assisting in planning for tran-sition to the year 2000. Such information is the most cur-rently available concerning the behavior of the Company’sproducts in the next century and is provided “as is” withoutwarranty of any kind. In addition, to the extent theCompany’s hardware and software products are combinedwith the hardware and software products of other compa-nies, there can be no assurance that users of theCompany’s products will not experience year 2000 prob-lems as a result of the combination of the Company’s hard-ware and software products with non-compliant products ofother companies. The Company currently does not antici-pate material expenditures to remedy any year 2000 issueswith its products and services.
Assessment of the Company’s Information Technology (“IT”)and Non-IT Systems for Year 2000 Compliance
The Company is currently in the process of evaluating its ITsystems for compliance. The Company’s Oracle manufac-turing and financial information systems were implementedduring 1998. The Company is evaluating the year 2000 com-pliance of these systems in accordance with Oracle’s rec-ommendations. At December 31, 1998, the Company hadcompleted its initial installation and testing of softwarepatches available from Oracle. The Company is currentlycontinuing to install and test additional software patches asthey become available from Oracle. The Company does notconsider the cost of the new hardware and software for theOracle implementations to be related to year 2000 readi-ness as these system replacements were already plannedto satisfy the demands of expansion of its worldwide oper-ations and were not accelerated due to year 2000 issues.The Company is also currently in the process of evaluatingits non-IT systems for compliance. Additionally, theCompany utilizes other third party software and equipmentto distribute its products as well as to operate other aspectsof its business. The Company is reviewing such softwareand equipment. The Company’s review process is expectedto be completed before the beginning of the fourth quarterof 1999. There can be no assurance that such software andequipment is year 2000 compliant, that non-compliant soft-ware and equipment will be made compliant on a timelybasis, or that any such non-compliant software and equip-ment would not have a material adverse effect on theCompany’s systems and operations.
Evaluation of Third Parties with which the Company has aMaterial Relationship, including Key Suppliers, ServiceProviders, and Strategic Partners
The Company’s year 2000 readiness program includesidentifying these third parties and determining, based onreceipt of written verification, review of publicly availablefinancial statement disclosures, and other means, thatsuch third parties are either in compliance or expect to be

35
Managem
ent’s Discussion and A
nalysis
in compliance prior to January 1, 2000. The Company iscurrently in the process of communicating with its signif-icant vendors, service providers, and certain strategicpartners. Many enterprises, including the Company’spresent and potential customers, may be devoting a sub-stantial portion of their information systems spending toresolving year 2000 issues, which may result in theirspending being diverted from applications such as theCompany’s products, over the next two years.
Development of Contingency Plans
The Company is currently not in a position to determine whatwould be its most reasonably likely worst case year 2000scenario or any plan for handling such scenario. To date, theCompany has not completed a formal contingency plan fornon-compliance, however to the extent that further evalua-tion of its products, its IT and non-IT systems, or informationobtained from the third parties with which it has a materialrelationship suggests that there is a significant risk, contin-gency plans will be implemented. Such contingency plansmay include the development of alternative sources for theproduct or service provided by any non-compliant vendor.
It is the Company’s policy to expense as incurred all costsassociated with year 2000 readiness. The Company hasdeveloped a separate budget for operating and capitalexpenditures relating to year 2000 issues. No IT projectshave been deferred due to year 2000 efforts. Although theCompany is not yet able to estimate its total incrementalcost for year 2000 issues, based on its preliminary review todate, the Company does not believe that the costs of year2000 issues will have a material adverse effect on theCompany’s business, operating results, or financial condi-tion. Although the Company is taking measures to addressthe impact, if any, of year 2000 issues, it cannot predict theoutcome or success of its year 2000 readiness program, orwhether the failure of third party systems or equipment tooperate properly in the year 2000 will have a materialadverse effect upon the Company’s business, operatingresults, or financial condition, or require the Company toincur unanticipated material expenses to remedy any year2000 issue.
The foregoing discussion regarding the Company’s year2000 readiness program’s implementation, effectiveness,and cost, contains forward-looking statements which arebased on management’s expectations, determined utilizingcertain assumptions of future events, including third partycompliance and other factors. However, there can be noguarantee that these expectations will be realized, and actu-al results could differ materially from management’s expec-tations. Specific factors that might cause such material dif-ferences include, but are not limited to, the availability andcost of personnel trained in this area and other similar uncer-tainties, and the remediation success of the Company’s sup-pliers, service providers, and strategic partners.
Factors That May Affect Future ResultsThis document may include forward-looking statements.Any statements contained herein that do not describe his-torical facts are forward-looking statements. The Companymakes such forward-looking statements under the provi-sions of the “safe harbor” section of the Private SecuritiesLitigation Reform Act of 1995. The forward-looking state-ments contained herein are based on current expectations,but are subject to a number of risks and uncertainties. Thefactors that could cause actual results to differ materiallyfrom such forward-looking statements include the risk fac-tors set forth below.
Fluctuations in Revenue and Operating Results
The Company’s quarterly operating results may fluctuate asa result of a number of factors, including the growth rates inthe UPS industry and related industries; timing of ordersfrom, and shipments to, customers; the timing of new prod-uct introductions and the market acceptance of those prod-ucts; increased competition; changes in manufacturingcosts; changes in the mix of product sales; inventory risksdue to shifts in market demand; component constraints andshortages; risks of nonpayment of accounts receivable;expansion of manufacturing capacity; factors associatedwith international operations; and changes in world eco-nomic conditions.
Management of Growth
The Company has experienced, and is currently experi-encing, a period of rapid growth which has placed, andcould continue to place, a significant strain on theresources of the Company. In order to support thegrowth of its business, the Company plans to signifi-cantly expand its level of operations during 1999. If theCompany’s management is unable to manage growtheffectively, the Company’s operating results could beadversely affected.
Competition
The Company believes that it is one of less than ten globalcompanies providing a full range of UPS products and serv-ices worldwide. The UPS industry, however, is highly com-petitive on both a worldwide basis and a regional geograph-ic basis. The Company competes, and will continue to com-pete, with several U.S. and foreign firms with respect toUPS products, both on a worldwide basis and in variousgeographical regions, and within individual UPS product andapplication niches. The Company expects competition toincrease in the future from existing competitors and a num-ber of companies which may enter the Company’s existingor future markets. Increased competition could adverselyaffect the Company’s revenue and profitability through pricereductions and loss of market share. The principal competi-tive factors in the UPS industry are product performanceand quality, marketing and access to distribution channels,

36
Managem
ent’s Discussion and A
nalysis
customer services, product design and price. Some of theCompany’s current and potential competitors have substan-tially greater financial, technical, sales and marketingresources than the Company. There can be no assurancethat the Company will be able to continue to compete suc-cessfully with its existing competitors or will be able tocompete successfully with new competitors.
Technological Change; New Product Delays; Risks ofProduct Defects
The market for the Company’s products is characterized byrapidly changing technology, evolving industry standards andfrequent new product introductions. Current competitors ornew market entrants may develop new products with fea-tures that could adversely affect the competitive position ofthe Company’s products. There can be no assurance that theCompany will be successful in selecting, developing, manu-facturing and marketing new products or enhancing its exist-ing products or that the Company will be able to respondeffectively to technological changes, new standards or prod-uct announcements by competitors. The timely availability ofnew products and enhancements, and their acceptance bycustomers are important to the future success of theCompany. Delays in such availability or a lack of marketacceptance could have an adverse effect on the Company.Although the Company has not experienced materialadverse effects resulting from product defects, there can beno assurance that, despite testing internally or by current orpotential customers, defects will not be found in products,resulting in loss or delay in market acceptance, which couldhave a material adverse effect upon the Company’s busi-ness, operating results, or financial condition.
Year 2000 Issues
Although the Company is taking measures to address theimpact, if any, of year 2000 issues, it cannot predict the out-come or success of its year 2000 readiness program, orwhether the failure of third party systems or equipment tooperate properly in the year 2000 will have a materialadverse effect upon the Company’s business, operatingresults, or financial condition, or require the Company toincur unanticipated material expenses to remedy any year2000 issue. See also the Company’s Year 2000 ReadinessDisclosure Statement above.
Dependence on Key Employees
The Company’s success depends to a significant degreeupon the continuing contributions of its key management,sales, marketing, R&D and manufacturing personnel, manyof whom would be difficult to replace. The Company doesnot have employment contracts with most of its key per-sonnel. The Company believes that its future success willdepend in large part upon its ability to attract and retain high-ly-skilled hardware and software engineers, and manage-ment, sales and marketing personnel. Competition for suchpersonnel is intense, and there can be no assurance that theCompany will be successful in attracting and retaining such
personnel. Failure to attract and retain key personnel couldhave a material adverse effect on the Company’s business,operating results, or financial condition.
Foreign Operations; Risk of Currency Fluctuations
The Company manufactures and markets its productsworldwide through several foreign subsidiaries and inde-pendent agents. The Company’s worldwide operations aresubject to the risks normally associated with foreign opera-tions including, but not limited to, the disruption of markets,changes in export or import laws, restrictions on currencyexchanges, potentially negative tax consequences and themodification or introduction of other governmental policieswith potentially adverse effects.
International sales (sales to customers outside the UnitedStates, both direct and indirect) accounted for approxi-mately 43.2%, 43.3%, and 43.2% of the Company’s netsales in 1998, 1997, and 1996, respectively. TheCompany anticipates that international sales will continueto account for a significant portion of revenue. TheCompany invoices its customers in Denmark, France,Germany, Great Britain, Switzerland, and Japan in theirrespective local currencies. To date, the Company doesnot utilize any rate protection agreements or derivativeagreements to hedge any foreign exchange exposure.Accordingly, the Company may be exposed to exchangelosses based upon currency exchange rate fluctuations,which losses could have a materially adverse effect onthe Company’s operating results.
Dependence on Sole Source Suppliers
Some components of the Company’s products are current-ly obtained from single sources. There can be no assurancethat in the future the Company’s suppliers will be able tomeet the Company’s demand for components in a timelyand cost-effective manner. The Company generally pur-chases these single or limited source components pursuantto purchase orders and has no guaranteed supply arrange-ments with the suppliers. In addition, the availability ofmany of these components to the Company is dependentin part on the ability of the Company to provide the suppli-ers with accurate forecasts of future requirements. TheCompany has generally been able to obtain adequate sup-plies of parts and components in a timely manner fromexisting sources. The Company’s operating results and cus-tomer relationships could be adversely affected by either anincrease in prices for, or an interruption or reduction in sup-ply of, any key components.
Uncertainties Regarding Patents and Protection ofProprietary Technology
The Company’s success will depend, to a large extent, onits ability to protect its proprietary technology. The Companyrelies on a combination of contractual rights, trade secretsand copyrights to protect its proprietary rights. Although theCompany may apply for patents in the future, there can beno assurance that the Company’s intellectual property pro-

37
Managem
ent’s Discussion and A
nalysis
tection will be sufficient to prevent competitors from devel-oping similar technology. Moreover, in the absence ofpatent protection, the Company’s business may be adverse-ly affected by competitors that independently develop func-tionally equivalent technology. The Company attempts toensure that its products and processes do not infringe uponpatents and other proprietary rights, but there can be noassurance that such infringement may not be alleged bythird parties in the future. If infringement is alleged or deter-mined, there can be no assurance that the necessary licens-es would be available on acceptable terms, if at all, or thatthe Company would prevail in any such challenge.
Integration of Acquired Businesses
The Company has limited experience in integrating acquiredcompanies or technologies into its operations. TheCompany may from time to time pursue the acquisition ofother companies, assets, products or technologies. Therecan be no assurance that products, technologies, distribu-tion channels, key personnel and businesses of acquiredcompanies will be successfully integrated into theCompany’s business or product offerings, or that such inte-gration will not adversely affect the Company’s business,operating results, or financial condition. There can be noassurance that any acquired companies, assets, products ortechnologies will contribute significantly to the Company’ssales or earnings, or that the sales and earnings fromacquired businesses will not be adversely affected by theintegration process or other factors. If the Company is notsuccessful in the integration of such acquired businesses,there could be an adverse impact on the financial results ofthe Company. There can be no assurance that the Companywill continue to be able to identify and consummate suitableacquisition transactions in the future. For information on theCompany’s recent acquisition of Silcon, see the“Acquisition” section above. The Company’s determinationof acquired R&D in connection with this acquisition is sub-ject to review and revaluation by the Securities andExchange Commission.
Possible Volatility of Stock Price
The market price of the Company’s Common Stock hasbeen, and may continue to be, extremely volatile. The trad-ing price of the Company’s Common Stock could be subjectto wide fluctuations in response to quarter-to-quarter varia-tions in operating results, changes in earnings estimates byanalysts, announcements of technological innovations or
new products by the Company or its competitors, chal-lenges associated with integration of businesses and otherevents or factors. In addition, the stock market has fromtime to time experienced extreme price and volume fluctu-ations which have particularly affected the market price formany high technology companies and which often havebeen unrelated to the operating performance of these com-panies. These broad market fluctuations may adverselyaffect the market price of the Company’s Common Stock.
Tax Rate
The Company’s tax rate is heavily dependent upon theproportion of earnings that are derived from its Irelandand Philippines manufacturing operations and its ability toreinvest those earnings permanently outside the UnitedStates. If the earnings of these operations as a percent-age of the Company’s total earnings were to decline sig-nificantly from anticipated levels, or should its ability toreinvest these earnings be reduced, the Company’s effec-tive tax rate would exceed the currently estimated rate for1999. In addition, should the Company’s intercompanytransfer pricing with respect to its Ireland or Philippinesmanufacturing operations require significant adjustmentdue to audits or regulatory changes, the Company’s over-all effective tax rate could increase.
Uncertainty Regarding the Litigation Process
The Company has been, is, and/or may in the futurebecome involved in material litigation involving theCompany, its products or its operations. The litigationprocess is uncertain and includes the risk of an unexpected,unfavorable result and there can be no assurance that theCompany will not be materially adversely impacted by anysuch litigation.
Item 7A. Quantitative and QualitativeDisclosures About Market Risk
The Company, in the normal course of business, is exposedto market risks relating to fluctuations in foreign currencyexchange rates. The information required under this sectionrelated to such risks is included in the Foreign CurrencyActivity section of Management’s Discussion and Analysis ofFinancial Condition and Results of Operations in Item 7 of thisReport and is incorporated herein by reference.

38
Consolidated Financial S
tatements
See accompanying notes to consolidated financial statements.
Current assets:
Cash and cash equivalents
Accounts receivable, less allowance for doubtful accounts of
$15,471 in 1998 and $12,230 in 1997 (Note 2)
Inventories (Note 3)
Prepaid expenses and other current assets
Deferred income taxes (Note 5)
Total current assets
Property, plant, and equipment:
Land, buildings, and improvements
Machinery and equipment
Office equipment, furniture, and fixtures
Purchased software
Less accumulated depreciation and amortization
Net property, plant, and equipment
Goodwill and other intangibles
Other assets
Total assets
1997
$270,134
131,115
104,171
13,305
21,571
540,296
31,143
80,091
31,431
9,584
152,249
52,631
99,618
-
1,376
$641,290
1998
$219,908
180,356
228,682
17,801
28,498
675,245
51,735
125,274
44,955
11,505
233,469
85,205
148,264
45,837
2,637
$871,983
Item 8. Financial Statements and Supplementary Data
AMERICAN POWER CONVERSION CORPORATION AND SUBSIDIARIES
CONSOLIDATED BALANCE SHEETS
December 31, 1998 and 1997
In thousands

39
Consolidated Financial S
tatements
ASSETS
AMERICAN POWER CONVERSION CORPORATION AND SUBSIDIARIES
CONSOLIDATED BALANCE SHEETS
December 31, 1998 and 1997
In thousands
See accompanying notes to consolidated financial statements.
Current liabilities:
Short term debt (Note 4)
Accounts payable
Accrued expenses
Accrued compensation
Accrued sales and marketing programs
Accrued retirement contributions
Income taxes payable
Total current liabilities
Deferred tax liability (Note 5)
Total liabilities
Minority interest
Shareholders' equity (Notes 6 and 7):
Common stock, $.01 par value;
authorized 200,000 shares in 1998 and 1997;
issued 95,973 in 1998 and 95,383 in 1997
Additional paid-in capital
Retained earnings
Treasury stock, 125 shares, at cost
Accumulated other comprehensive income
Total shareholders' equity
COMMITMENTS AND CONTINGENCIES
(Notes 9, 11 and 12)
OTHER INFORMATION (Notes 4 and 10)
Total liabilities and shareholders’ equity
1997
$ -
37,068
16,334
16,476
15,965
7,446
20,241
113,530
6,006
119,536
-
954
55,626
466,725
(1,551)
-
521,754
$641,290
1998
$12,540
75,190
28,560
22,130
17,824
2,469
22,753
181,466
7,500
188,966
1,725
960
67,080
614,301
(1,551)
502
681,292
$871,983

40
Consolidated Financial S
tatements
LIABILITIES AND SHAREHOLDERS’ EQUITY
AMERICAN POWER CONVERSION CORPORATION AND SUBSIDIARIES
CONSOLIDATED STATEMENTS OF INCOME
Years ended December 31, 1998, 1997 and 1996
See accompanying notes to consolidated financial statements.
Net sales (Note 8)
Cost of goods sold
Gross profit
Costs and expenses:
Marketing, selling, general, and administrative expenses
Research and development
Acquired research and development
Total operating expenses
Operating income
Other income, net
Earnings before income taxes and minority interest
Income taxes (Note 5)
Earnings before minority interest
Minority interest, net
Net income
Basic earnings per share (Note 1)
Basic weighted average shares outstanding
Diluted earnings per share (Note 1)
Diluted weighted average shares outstanding
1996
$706,877
407,902
298,975
150,401
14,784
-
165,185
133,790
5,189
138,979
46,558
92,421
-
$92,421
$.98
93,872
$.98
94,347
1997
$873,388
476,060
397,328
203,469
22,421
-
225,890
171,438
6,354
177,792
56,004
121,788
-
$121,788
$1.28
94,993
$1.27
96,121
1998
$1,125,835
621,073
504,762
260,176
32,563
7,554
300,293
204,469
11,687
216,156
68,231
147,925
349
$147,576
$1.55
95,503
$1.52
96,788

41
In thousands except per share amounts
AMERICAN POWER CONVERSION CORPORATION AND SUBSIDIARIES
CONSOLIDATED STATEMENTS OF CHANGES IN SHAREHOLDERS’ EQUITY
Years ended December 31, 1998, 1997 and 1996
In thousands
See accompanying notes to consolidated financial statements.
Balances atDecember 31, 1995
Net income
Comprehensive income
Exercises of stock options
Tax effect of exercises ofstock options
Shares issued to EmployeeStock Ownership Plan
Purchases of common stock
Balances atDecember 31, 1996as previously reported
Adjustment for immaterialpooling-of-interests
Balances atDecember 31, 1996as adjusted
Net income
Comprehensive income
Exercises of stock options
Tax effect of exercises ofstock options
Shares issued to EmployeeStock Ownership Plan
Balances atDecember 31, 1997
Net income
Foreign currencytranslation adjustment
Comprehensive income
Exercises of stock options
Tax effect of exercises ofstock options
Shares issued to EmployeeStock Purchase Plan
Balances atDecember 31, 1998
Total
$289,766
92,421
92,421
2,906
1,430
6,926
(1,551)
391,898
811
392,709
121,788
121,788
3,232
765
3,260
521,754
147,576
502
148,078
8,481
2,082
897
$681,292
Income
$-
-
-
-
502
$502
Shares
-
(125)
(125)
(125)
(125)
(125)
Amount
$-
(1,551)
(1,551)
(1,551)
(1,551)
$(1,551)
Earnings
$251,710
92,421
344,131
806
344,937
121,788
466,725
147,576
$614,301
Capital
$37,123
2,900
1,430
6,921
48,374
48,374
3,228
765
3,259
55,626
8,475
2,082
897
$67,080
Amount
$933
6
5
944
5
949
4
1
954
6
$960
Shares
93,271
576
570
94,417
480
94,897
348
138
95,383
553
37
95,973
$.01 Par, Common Stock
Treasury Stock,at Cost
Accumulated OtherComprehensiveRetained
AdditionalPaid-in

42
Consolidated Financial S
tatements
AMERICAN POWER CONVERSION CORPORATION AND SUBSIDIARIES
CONSOLIDATED STATEMENTS OF CASH FLOWS
Years ended December 31, 1998, 1997 and 1996
In thousands
See accompanying notes to consolidated financial statements.
Cash flows from operating activitiesNet incomeAdjustments to reconcile net income to net cash
provided by operating activities:Depreciation and amortizationProvision for doubtful accountsDeferred income taxesAcquired research and developmentChanges in operating assets and liabilities
excluding effects of acquisitions:Accounts receivableInventoriesPrepaid expenses and other current assetsOther assetsAccounts payableAccrued expensesAccrued compensationAccrued sales and marketing programsAccrued retirement contributionsIncome taxes payable
Other, netNet cash provided by operating activities
Cash flows from investing activitiesCapital expenditures, net of capital grantsAcquisitionsSale of assetsNet cash used in investing activities
Cash flows from financing activitiesRepayment of short term debtProceeds from issuances of common stockPurchases of common stockNet cash provided by (used in) financing activities
Net change in cash and cash equivalentsCash and cash equivalents at beginning of yearCash and cash equivalents at end of year
1996
$92,421
13,5114,291
(8,080)-
(41,636)17,098(2,332)
(186)15,1806,7855,7459,5801,612
16,929-
130,918
(25,005)--
(25,005)
-9,832
(1,551)8,281
114,19439,040
$153,234
1997
$121,788
17,7164,834
(1,061)-
(26,821)26,631(2,372)
644(4,999)
2,7214,256(395)1,1433,425
-147,510
(37,208)101
-(37,107)
-6,497
-6,497
116,900153,234
$270,134
1998
$147,576
22,9516,593
(5,967)7,554
(36,321)(105,327)
(4,151)(536)
23,5506,3955,6541,859
(4,977)3,138(409)
67,582
(55,654)(62,424)
3,200(114,878)
(12,308)9,378
-(2,930)
(50,226)270,134
$219,908
Supplemental cash flow disclosuresCash paid during the year for:Income taxes (net of tax refunds)Details of acquisitions:
Fair value of assetsLiabilities and minority interestCash paidCash acquiredAcquisitions
$37,219
$ ----
$ -
$48,563
$ ---
(101)$ (101)
$65,109
$113,177(48,793)
64,384(1,960)
$62,424
NON-CASH TRANSACTIONS: In 1998, 1997 and 1996, the tax effect of the exercise of stock options resulted in increases to additional paid-in capital and reductions to income taxes payable of $2,082, $765, and $1,430, respectively.
43
Notes to C
onsolidated Financial Statem
ents
AMERICAN POWER CONVERSION CORPORATION AND SUBSIDIARIES
NOTES TO CONSOLIDATED FINANCIAL STATEMENTS
Years ended December 31, 1998, 1997 and 1996
1. Summary of Significant Accounting Policies
Nature of Business
American Power Conversion Corporation and its sub-sidiaries (the “Company”) designs, develops, manufac-tures, and markets power protection and managementsolutions for computer and electronic applications world-wide. The Company’s solutions include uninterruptiblepower supply products (“UPS”), electrical surge protectiondevices, power conditioning products, associated software,services, and accessories. These solutions are for use withsensitive electronic devices which rely on electric utilitypower including, but not limited to, home electronics, per-sonal computers (“PCs”), high performance workstations,servers, networking equipment, telecommunications equip-ment, internetworking equipment, datacenters, mainframecomputers, and facilities. The Company’s principal marketsare in North America, Europe, and the Far East.
Principles of Consolidation
The consolidated financial statements include the accountsof American Power Conversion Corporation and all of itswholly- and majority-owned subsidiaries. All intercompanyaccounts and transactions are eliminated in consolidation.
Cash and Cash Equivalents
Cash and cash equivalents consists of funds on deposit,money market savings accounts, and short-term commer-cial paper with original maturities of three months or less.
Inventories
Inventories are stated at the lower of cost or market, costbeing determined using the first-in, first-out (FIFO) method.
Property, Plant, and Equipment
Property, plant, and equipment are stated at cost.Depreciation is provided by using the straight-line methodover estimated useful lives as follows:
Land improvements 15 years
Buildings and improvements 40 years
Machinery and equipment 5 - 10 years
Office equipment, furniture, and fixtures 3 - 10 years
Purchased software 3 years
Goodwill and Other Intangibles
Goodwill and other intangibles represents the excess ofcost over the fair value of the net tangible assets of busi-nesses acquired and is being amortized on a straight-linebasis over 15 years. Periodically, the Company evaluatesthe recovery of goodwill to assure that changes in facts andcircumstances do not suggest that recoverability has beenimpaired. This analysis relies on a number of factors, includ-ing operating results, business plans, budgets, economicprojections, and changes in management’s strategic direc-tion or market emphasis. In management’s opinion, noimpairment exists at December 31, 1998.
Research and Development
Expenditures for R&D are expensed in the year incurred.
Warranties
The Company offers limited two-year and one-year war-ranties. The provision for potential liabilities resulting fromwarranty claims is provided at the time of sale. The provi-sion is computed based upon historical data and currentestimates. The Company also offers its customers theopportunity to extend the basic warranty period up to anadditional three years under a separately priced program.Recognition of the revenue associated with the extendedwarranty program commences on the date the extendedwarranty becomes effective and is recognized on a straight-line basis over the extended warranty period. In addition,the Company has an Equipment Protection Policy whichprovides up to $25,000 for repair or replacement of a cus-tomers’ hardware should a surge or lightning strike passthrough a Company unit. The policy applies to all units man-ufactured after January 1, 1992. Other restrictions alsoapply. The Company’s ProtectNet line of data line surgesuppressors feature a unique “Double-Up” SupplementalEquipment Protection Policy, under which the total recover-able limit under the Equipment Protection Policy is dou-bled, up to $50,000 (U.S. and Canada only). The Companyhas experienced satisfactory field operating results, andwarranty costs incurred to date have not had a significantimpact on the Company’s results of operations.
Income Taxes
Income taxes are accounted for under the asset and liabilitymethod. Under this method, deferred tax assets and liabili-ties are recognized for the future tax consequences attribut-able to differences between the financial statement carryingamounts of existing assets and liabilities and their respectivetax bases. Deferred tax assets and liabilities are measuredusing enacted tax rates expected to apply to taxable incomein the years in which those temporary differences areexpected to be recovered or settled. The effect on deferredtax assets and liabilities of a change in tax rates is recognizedin income in the period that includes the enactment date.
Deferred income taxes have not been provided for theundistributed earnings of the Company’s foreign sub-
44
Notes to C
onsolidated Financial Statem
ents
sidiaries which aggregated approximately $180 million atDecember 31, 1998. The Company plans to reinvest allsuch earnings for future expansion. If such earnings weredistributed, taxes would be increased by approximately$48 million.
Earnings per Share
Basic earnings per share is computed by dividing netincome by the weighted average number of commonshares outstanding during the period. Diluted earnings pershare is computed by dividing net income by the weightedaverage number of common shares and dilutive potentialcommon shares outstanding during the period. Under thetreasury stock method, the unexercised options areassumed to be exercised at the beginning of the period orat issuance, if later. The assumed proceeds are then usedto purchase common shares at the average market priceduring the period.
Potential common shares for which inclusion would havethe effect of increasing diluted earnings per share (i.e.,antidilutive) are excluded from the computation. Antidilutivepotential common shares outstanding at December 31,1998, 1997, and 1996 were approximately 248,000,83,000, and 68,000, respectively.
Stock-Based Compensation
The Company applies APB Opinion 25 and relatedInterpretations in accounting for its stock option plans. Nocompensation cost has been recognized for these plans inthe accompanying consolidated financial statements.
Advertising Costs
Advertising costs are expensed as incurred and reportedin selling, general, and administrative expenses in theaccompanying consolidated statements of income. Suchcosts of advertising, advertising production, trade shows,and other activities designed to enhance demand for theCompany’s products. Advertising costs were $67.4 millionin 1998, $59.9 million in 1997, and $36.3 million in 1996.There are no capitalized advertising costs in the accompa-nying consolidated balance sheets.
Use of Estimates
The preparation of financial statements in conformity withgenerally accepted accounting principles requires manage-ment to make estimates and assumptions that affect thereported amounts of assets and liabilities and disclosure ofcontingent assets and liabilities at the date of the financialstatements and the reported amounts of revenues andexpenses during the reporting period. Actual results maydiffer from those estimates.
2. Accounts ReceivableAccounts receivable are generally not concentrated in anygeographic region or industry. Collateral is usually notrequired except for certain international transactions forwhich the Company requires letters of credit to secure pay-ment. The Company estimates an allowance for doubtfulaccounts based on the credit worthiness of its customersas well as general economic conditions. Consequently, anadverse change in those factors could affect theCompany’s estimate of its bad debts.
3. InventoriesInventories consist of the following:
4. Revolving Credit Agreements and Short Term DebtAt December 31, 1998, the Company had available forfuture borrowings $50 million under an unsecured line ofcredit agreement at a floating interest rate equal to thebank’s cost of funds rate plus .625% and an additional $15million under an unsecured line of credit agreement with asecond bank at a similar interest rate. No borrowings wereoutstanding under these facilities at December 31, 1998. Inconnection with the acquisition of Silcon, the Companyacquired $24.8 million in bank indebtedness with interestrates ranging from 4% to 8%. The Company repaid $12.3million of this indebtedness during the second half of 1998.
Basic weighted average shares outstanding
Net effect of dilutive potential common shares outstanding based on the treasury stock method using the average market price
Diluted weighted average shares outstanding
1996
93,872
475
94,347
1997
94,993
1,128
96,121
1998
95,503
1,285
96,788
In thousands
Raw materials
Work in process
Finished goods
1997
$ 61,430
3,731
39,010
$104,171
1998
$ 87,975
9,328
131,379
$228,682
45
5. Income TaxesTotal federal, state, and foreign income tax expense (benefit)from continuing operations for the years ended December31, 1998, 1997, and 1996 consists of the following:
Income tax expense attributable to continuing operationsamounted to $68.2 million in 1998, $56.0 million in 1997, and$46.6 million in 1996, (effective rates of 31.6%, 31.5%, and33.5%, respectively). The actual expense for 1998, 1997,and 1996 differs from the “expected” tax expense (comput-ed by applying the statutory U.S. federal corporate tax rateof 35% to earnings before income taxes) as follows:
The domestic and foreign components of earnings beforeincome taxes were $162.0 million and $54.2 million,respectively, for 1998, $121.0 million and $56.8 million,respectively, for 1997, and $94.8 million and $44.2 mil-lion, respectively, for 1996. Total income tax expense forthe years ended December 31, 1998, 1997 and 1996 wasallocated as follows:
At December 31, 1998 and 1997, deferred income taxassets and liabilities result from temporary differences inthe recognition of income and expense for tax and financialreporting purposes. The sources and tax effects of thesetemporary differences are presented below:
In thousands
Income from continuing operations
Shareholders' equity, for compen-sation expense for tax purposes in excess of amounts recognizedfor financial statement purposes
1998
$68,231
(2,082)
$66,149
1997
$56,004
(765)
$55,239
1996
$46,558
(1,430)
$45,128
In thousands
Deferred tax liabilities
Excess of tax over financial statement depreciation
Other
Total deferred tax liabilities
Deferred tax assets
Allowance for doubtful accounts
Additional costs inventoried for tax purposes
Intercompany inventory profits
Allowances for sales and marketing programs
Inventory obsolescence reserve
Accrual for compensation and compensated absences
Reserve for warranty costs
Deferred revenue
Other
Total gross deferred tax assets
Less valuation allowance
Net deferred tax assets
Net deferred income taxes
1997
$ 5,736
270
6,006
3,702
22
2,983
6,005
4,569
1,039
761
1,913
577
21,571
-
21,571
$15,565
1998
$ 5,605
1,895
7,500
4,441
1,050
4,521
6,517
3,865
1,672
1,024
2,356
3,052
28,498
-
28,498
$20,998
In thousands
1998:
Federal
State
Foreign
1997:
Federal
State
Foreign
1996:
Federal
State
Foreign
Current
$58,294
4,707
11,197
$74,198
$41,090
7,031
8,944
$57,065
$38,279
7,100
9,259
$54,638
Deferred
($4,188)
(785)
(994)
($5,967)
($1,028)
(193)
160
($1,061)
($6,759)
(1,100)
(221)
($8,080)
Total
$54,106
3,922
10,203
$68,231
$40,062
6,838
9,104
$56,004
$31,520
6,000
9,038
$46,558
In thousands
Computed “expected” tax expense
State income taxes, net of federal income tax benefit
Foreign earnings taxed at rates lower than U.S. statutory rate(principally Ireland)
Foreign sales corporation
Acquired R&D
Other
1998
$75,655
2,549
(12,676)
(2,729)
3,094
2,338
$68,231
1997
$62,227
4,445
(10,727)
(1,603)
-
1,662
$56,004
1996
$48,643
3,900
(4,520)
(1,475)
-
10
$46,558

46
Notes to C
onsolidated Financial Statem
ents
In assessing the realizability of deferred tax assets, theCompany considers whether it is more likely than not thatsome portion or all of the deferred tax assets will not be real-ized. Due to the fact that the Company has sufficient taxableincome in the federal carryback period and anticipates suffi-cient future taxable income over the periods which thedeferred tax assets are deductible, the ultimate realization ofdeferred tax assets for federal and state tax purposes appearsmore likely than not. The U.S. federal taxable income for1997, 1996 and 1995 was approximately $111.6 million, $98.3million, and $82.8 million, respectively.
6. Stock Plans
Stock Option Plans
At December 31, 1998, the Company had four stock optionplans, which are described below. SFAS No. 123, Accountingfor Stock-Based Compensation, requires companies to either(a) record an expense related to its stock option plans basedon the estimated fair value of stock options as of the date ofthe grant or (b) disclose pro forma net income and earningsper share data as if the company had recorded an expense,beginning with options granted in 1995. The Company haselected to continue to apply APB Opinion 25 and relatedInterpretations in accounting for these plans and to complywith the SFAS No. 123 disclosure requirements. Accordingly,no compensation cost has been recognized for its stockoption plans in the accompanying consolidated financialstatements. Had compensation cost for such plans beendetermined based on the fair value at the grant dates forawards under these plans consistent with the method ofSFAS No. 123, the Company’s net income and earnings pershare would have been reduced to the pro forma amountsindicated below:
The pro forma effect on net income for 1998, 1997 and 1996is not representative of the pro forma effect on net income infuture years because it does not take into consideration proforma compensation expense related to grants made prior to1995. The weighted average fair value of options granted dur-ing 1998, 1997 and 1996 was $17.67, $11.19, and $5.13,respectively. The Company estimates the fair value of eachoption as of the date of grant using the Black-Scholes pricingmodel with the following weighted average assumptionsused for grants in 1998, 1997 and 1996:
On April 21, 1997, the Company’s shareholders approved the1997 Stock Option Plan and on June 19, 1987 approved the1987 Stock Option Plan (collectively the “Plans”). The 1997and 1987 Stock Option Plans authorized the grant of optionsfor up to 6.0 million shares and 10.8 million shares, respec-tively, of common stock. Options granted under the Plans areeither (a) options intended to constitute incentive stockoptions (“ISOs”) under the Internal Revenue Code of 1986(the “Code”) or (b) non-qualified options. Incentive stockoptions may be granted under the Plans to employees or offi-cers of the Company. Non-qualified options may be grantedto consultants, directors (whether or not they are employ-ees), employees or officers of the Company.
ISOs granted under the Plans may not be granted at a priceless than the fair market value of the common stock on thedate of grant (or 110% of fair market value in the case ofemployees or officers holding 10% or more of the votingstock of the Company). The aggregate fair market value ofshares, for which ISOs granted to any employee are exer-cisable for the first time by such employee during any cal-endar year (under all stock option plans of the Company andany related corporation), may not exceed $100,000. Non-qualified options granted under the Plan may not be grantedat a price less than the lesser of (a) the book value per shareof common stock as of the end of the fiscal year of theCompany immediately preceding the date of such grant, or(b) 50% of the fair market value of the common stock on thedate of grant.
Options granted under the Plans before December 1, 1995vested 25% at the end of the first year and 12.5% at the endof each six month period thereafter. Options granted afterDecember 1, 1995 and before February 14, 1997 vest 20% atthe end of the second year and 20% at the end of each yearthereafter. Options granted after February 14, 1997 vest 25%at the end of the first year and 12.5% at the end of each sixmonth period thereafter.
On April 21, 1997, the Company’s shareholders approved the1997 Non-employee Director Stock Option Plan and on May20, 1993 approved the 1993 Non-employee Director StockOption Plan (collectively the “Director Plans”). Optionsgranted under these plans are non-qualified stock options andmay be granted to each person who was a member of theCompany’s Board of Directors on April 21, 1997 and February25, 1993, respectively, and who was not an employee or offi-cer of the Company. The 1997 and 1993 Director Plansauthorized the grant of options for up to 200,000 shares and40,000 shares of common stock, respectively. Two directorswere entitled to participate in the Director Plans with eachreceiving a grant of options as of February 12, 1998 for
Net income
Basic earnings per share
Diluted earnings per share
1998
$147,576132,296
$1.551.39
$1.521.37
As reportedPro forma
As reportedPro forma
As reportedPro forma
1997
$121,788116,370
$1.281.23
$1.271.22
1996
$ 92,42191,228
$.98.97
$.98.97
In thousands except per share amounts
Expected volatility
Dividend yield
Risk-free interest rate
Expected life
1998
57%
-
5.5%
5 years
1997
57%
-
6.3%
5 years
1996
56%
-
6.6%
5 years

47
10,000 shares at an exercise price of $27.00, as of April 21,1997 for 10,000 shares at an exercise price of $21.75 pershare, and as of February 25, 1993 for 20,000 shares at anexercise price of $12 per share (i.e., the market price on thedates of grant).
Options granted under the 1997 Director Plan vest 25% atthe end of the second year and 9.375% at the end of eachsix month period thereafter. Options granted under the1993 Director Plan vested 25% at the end of the first yearand 25% annually thereafter.
Options granted under all stock option plans before January1, 1993 will expire not more than five years from the date
of grant. Options granted under all stock option plans afterJanuary 1, 1993 will expire not more than ten years fromthe date of grant (five years in the case of ISOs granted toten percent shareholders). The outstanding options expireat various dates through 2008. Options granted terminatewithin a specified period of time following termination of anoptionee’s employment or position as a director or consult-ant with the Company.
A summary of the status of the Company’s stock option plansas of December 31, 1998, 1997 and 1996, and changes dur-ing the years ending on those dates is presented below:
Outstanding at beginning of year
Granted
Exercised
Terminated
Outstanding at end of year
Exercisable at end of year
Shares reserved at end of year
Shares in thousands 1998 1997 1996
Shares
3,009
2,399
(472)
(156)
4,780
677
6,768
WeightedAverageExercise
Price
$15.62
33.02
13.23
22.33
24.45
Shares
1,609
1,939
(348)
(191)
3,009
397
7,240
WeightedAverageExercise
Price
$10.04
18.78
9.29
12.03
15.62
Shares
1,947
461
(576)
(223)
1,609
556
2,837
WeightedAverageExercise
Price
$ 8.59
9.68
5.05
9.17
10.04
The following table summarizes information about stock options outstanding at December 31, 1998:
Range ofExercise Prices
$9.13 to $12.00
$13.63 to $17.50
$19.50 to $21.75
$22.63 to $26.88
$27.00 to $30.25
$31.75 to $35.41
$44.81
Shares Outstanding
747
811
660
154
115
2,153
140
4,780
Weighted AverageRemaining
ContractualLife (years)
6.9
8.2
8.4
8.0
9.1
9.3
9.9
8.6
Weighted AverageExercise Price
$ 9.63
16.52
19.97
23.59
28.33
32.49
44.81
24.45
Shares Exercisable
295
220
136
11
-
15
-
677
Weighted AverageExercise Price
$10.08
16.59
20.07
23.77
-
31.75
-
14.90
Shares in thousands Options Outstanding Options Exercisable

48
Notes to C
onsolidated Financial Statem
ents
Stock Purchase Plan
On April 21, 1997, the Company’s shareholders approvedan Employee Stock Purchase Plan (the “Plan”) to providesubstantially all employees an opportunity to purchaseshares of its common stock through payroll deductions, upto 10% of eligible compensation. Semiannually, participantaccount balances are used to purchase shares of stock atthe lesser of 85% of the fair market value of shares on thegrant date or the exercise date. The aggregate number ofshares purchased by an employee may not exceed 3,000shares annually (subject to limitations imposed by theInternal Revenue Code). The employee stock purchase planexpires on February 11, 2007. A total of 1.0 million sharesare available for purchase under the Plan. During 1998,21,316 shares were issued at $26.88 per share and 15,313shares were issued at $21.14 per share under the Plan.There were no shares issued under the Plan during 1997.
7. Retirement Benefits
Employee Stock Ownership Plans
At December 31, 1998, the Company had noncontributoryEmployee Stock Ownership Plans (the “ESOP”) coveringsubstantially all employees in North America and Ireland.Contributions to the ESOP are based on a percentage of eli-gible compensation and are determined by the Company’sBoard of Directors at its discretion, subject to the limitationsestablished by U.S. and Ireland tax laws. The ESOP holds4.7 million shares of common stock at December 31, 1998.Substantially all contributed shares have been allocated toparticipant accounts. No shares were contributed to theESOP in 1998. The value of contributed shares to the ESOPin 1997 and 1996 amounted to approximately $3.3 millionand $6.9 million, respectively.
Employee Savings Plan
On May 1, 1997, the Company established an employeesavings plan (the “Savings Plan”) that qualifies as adeferred salary arrangement under Section 401(k) of theInternal Revenue Code of 1986, as amended, covering sub-stantially all North American employees. The Savings Planallows eligible employees to contribute up to 15% of theircompensation on a pre-tax basis subject to certain limita-tions. The Company matches, with Company commonstock, 100% of the first 3% of employee contributions.Such matching Company contributions vest according to anemployee’s years of service. The Company’s matching con-
tributions in 1998 and 1997 amounted to approximately$1.6 million and $0.4 million, respectively.
The retirement expense for 1998, 1997, and 1996 amount-ed to approximately $2.9 million, $5.2 million, and $8.5 mil-lion, respectively.
8. Operating Segment and Geographic InformationAt December 31, 1998, the Company adopted Statement ofFinancial Accounting Standards ("SFAS") No. 131,"Disclosures about Segments of an Enterprise and RelatedInformation." Prior-period amounts have been restated inaccordance with the requirements of SFAS 131. Segmentaccounting policies are the same as policies described innote 1.
Basis for presentation
The Company’s operating businesses design, manufacture,and market power protection equipment and related soft-ware and accessories for computer and computer-relatedequipment. The Company manages its businesses basedon the nature of products provided. These businesses sharesimilar economic characteristics and have been aggregatedinto one reportable operating segment. Markets and com-petition are global. Products are sold to businesses, homeusers, and SOHOs utilizing an indirect selling model whichencompasses computer distributors and dealers, valueadded resellers, mass merchandisers, catalog merchandis-ers, E-commerce vendors, and strategic partnerships. TheCompany also sells directly to some large value addedresellers, which typically integrate the Company’s productsinto specialized microcomputer systems and then marketturnkey systems to selected vertical markets. Additionally,the Company sells certain select products directly to manu-facturers for incorporation into products manufactured orpackaged by them.
The Company evaluates the performance of its businessesbased on direct contribution margin. Direct contributionmargin includes R&D, marketing, and administrativeexpenses directly attributable to the segment and excludescertain expenses which are managed outside the reportablesegment. Costs excluded from segment profit are indirectoperating expenses, primarily consisting of selling and cor-porate expenses, and income taxes. Expenditures for addi-tions to long-lived assets are not reported to managementby the operating businesses.

49
Notes to C
onsolidated Financial Statem
ents
Summary operating segment information is as follows:
In thousands
Net sales
Segment direct contribution margin
Indirect operating expenses
Other income, net
Earnings before incomes taxes and minority interest
Segment depreciation
1998
$1,125,835
$448,200
243,731
11,687
$216,156
$16,996
1997
$873,388
$345,156
173,718
6,354
$177,792
$15,421
1996
$706,877
$268,139
134,349
5,189
$138,979
$11,755
In thousands
Net Sales
United States
North and Latin America excluding United States
Europe, Middle East, and Africa
Far East
1998
$639,229
60,897
305,108
120,601
$1,125,835
1997
$495,108
55,138
222,011
101,131
$873,388
1996
$401,823
42,052
179,002
84,000
$706,877
In thousands
Long-lived assets
United States
Europe
Far East
1998
$79,724
87,711
29,303
$196,738
1997
$72,167
17,350
11,477
$100,994
1996
$62,035
15,443
2,409
$79,887
Summary geographic information is as follows:
Note: Sales are attributed to geographic regions based on location of customer
The Company closely monitors the credit worthiness of itscustomers, adjusting credit policies and limits as deemednecessary. One customer accounted for approximately 11%and 10%, respectively, of the Company’s net sales in 1998and 1997. No single customer comprised 10% or more ofthe Company’s net sales in 1996.
9. LitigationOn or about November 6, 1998, General Signal PowerSystems, Inc. (“GSPS”) filed suit against the Company inWaukesha County Circuit Court in Wisconsin. GSPS allegesinterference with a contractual relationship with respect to adistribution agreement between the Best Power division ofGSPS and Silcon Power Electronics A/S, a wholly-ownedsubsidiary of Silcon A/S. GSPS seeks unspecified damages,costs, fees, and injunctive relief. On or about November 17,1998, the Company removed the case from the WaukeshaCounty Circuit Court to the United States District Court for
the Eastern District of Wisconsin. The Company believesthe GSPS lawsuit to be without merit and intends to vigor-ously defend against it. The Company also believes the ulti-mate disposition of this matter will not have a materialadverse effect on the Company’s consolidated financialposition or results of operations or liquidity. No provision forany liability that may result from this action has been recog-nized in the Company’s consolidated financial statements.
On or about January 27, 1999, the Company was servedwith a lawsuit filed by an individual in the United StatesDistrict Court for the Central District of California allegingpatent infringement. The plaintiff, Anthony F. Coppola,claims sole ownership of the patent referenced in the law-suit. Coppola seeks unspecified damages, costs, fees, andinjunctive relief. The Company intends to vigorously defendagainst the suit and believes the ultimate disposition of thismatter will not have a material adverse effect on theCompany’s consolidated financial position or results of oper-

50
Notes to C
onsolidated Financial Statem
ents
ations or liquidity. No provision for any liability that mayresult from this action has been recognized in theCompany’s consolidated financial statements.
The Company is also involved in various claims and legalactions arising in the ordinary course of business. In theopinion of management, the ultimate disposition of thesematters will not have a material adverse effect on theCompany’s consolidated financial position or results of oper-ations or liquidity.
10. Fair Value of Financial InstrumentsThe carrying amount of cash, cash equivalents, accountsreceivable, short-term debt, accounts payable, and accruedliabilities approximates their fair value because of the shortduration of these instruments.
11. CommitmentsThe Company has several noncancelable operating leases,primarily for warehousing and office space, expiring at vari-ous dates through 2004. These leases contain renewaloptions for periods ranging from one to three years andrequire the Company to pay its proportionate share of utili-ties, taxes, and insurance. Rent expense under these leas-es for 1998, 1997 and 1996 was $2.5 million, $2.3 million,and $2.5 million, respectively.
Future minimum lease payments under these leases are:1999 - $2.9 million; 2000 - $2.1 million; 2001 - $2.0 million;2002 - $1.7 million; 2003 - $1.4 million; and 2004 - $1.3 million.
12. ContingenciesThe Company has agreements with the IndustrialDevelopment Authority of Ireland (“IDA”) under which theCompany receives grant monies for costs incurred formachinery, equipment, and building improvements for its
Galway and Castlebar facilities equal to 40% and 60%,respectively, of such costs up to a maximum of $13.1 millionand $1.3 million, respectively. Such grant monies are subjectto the Company meeting certain employment goals andmaintaining operations in Ireland until termination of therespective agreements. The total cumulative amounts ofcapital grant claims submitted and received throughDecember 31, 1998 for the Galway facility were approxi-mately $12.8 million and $9.4 million, respectively. The totalcumulative amount of capital grant claims submitted throughDecember 31, 1998 for the Castlebar facility was $1.3 mil-lion; no capital grant claims had been received for theCastlebar facility. Under separate agreements with the IDA,the Company receives direct reimbursement of trainingcosts at its Galway and Castlebar facilities for up to $3,000and $12,500, respectively, per new employee hired. Thetotal cumulative amounts of training grant claims submittedand received through December 31, 1998 for the Galwayfacility were approximately $1.3 million and $1.3 million,respectively. The total cumulative amount of training grantclaims submitted through December 31, 1998 for theCastlebar facility was approximately $1.0 million; no traininggrant claims had been received for the Castlebar facility.
In addition, the Company executed agreements in 1994with an unrelated company to acquire the 280,000 squarefoot manufacturing and distribution facility presently occu-pied for one (1) Irish Pound (equivalent to approximately$1.50). As additional consideration for the facility, theCompany assumed a contingent liability of approximately$5.2 million as part of the Company’s agreement with theIDA. The contingent liability is canceled upon successfulcompletion of the terms of the agreement.
13. Quarterly Financial Data (Unaudited)The following is a summary of quarterly results of opera-tions in thousands except per share amounts:
1998:Net SalesGross ProfitNet IncomeBasic Earnings Per ShareBasic Weighted Average
Shares OutstandingDiluted Earnings Per ShareDiluted Weighted Average
Shares Outstanding
1997:Net SalesGross ProfitNet IncomeBasic Earnings Per ShareBasic Weighted Average
Shares OutstandingDiluted Earnings Per ShareDiluted Weighted Average
Shares Outstanding
Q1
$218,867$98,012$26,726
$.28
95,304$.28
96,568
$171,989$76,188$20,975
$.22
94,542$.22
95,551
Q2
$260,661$118,218$26,772
$.28
95,394$.28
96,740
$203,619$91,410$26,611
$.28
95,049$.28
96,076
Q3
$327,370$144,283$46,618
$.49
95,537$.48
96,861
$246,044$113,573$36,773
$.39
95,154$.38
96,495
Q4
$318,937$144,249$47,460
$.50
95,775$.49
97,712
$251,736$116,157$37,429
$.39
95,226$.39
96,588

51
Exhibits, Financial S
tatement S
chedules
Item 9. Changes in and Disagreements with Accountants on Accounting and Financial Disclosure
Not applicable.
Part III
Item 10. Directors of the Registrant
Information with respect to Directors may be found underthe caption “Occupations of Directors” appearing in theCompany’s definitive Proxy Statement for the AnnualMeeting of Shareholders to be held on May 7, 1999. Suchinformation is incorporated herein by reference.
Item 11. Executive Compensation
The information set forth under the caption “ExecutiveCompensation” appearing in the Company’s definitiveProxy Statement for the Annual Meeting of Shareholders tobe held on May 7, 1999 is incorporated herein by reference.
Item 12. Security Ownership of CertainBeneficial Owners and Management
The information set forth under the caption, “Managementand Principal Holders of Voting Securities” appearing in theCompany’s definitive Proxy Statement for the AnnualMeeting of Shareholders to be held on May 7, 1999 is incor-porated herein by reference.
Item 13. Certain Relationships and Related Transactions
The information set forth under the captions, “CertainRelationships and Related Transactions” appearing in theCompany’s definitive Proxy Statement for the AnnualMeeting of Shareholders to be held on May 7, 1999 isincorporated herein by reference.
Part IV
Item 14. Exhibits, Financial Statement Schedulesand Reports on Form 8-K
(a) Documents filed as part of Form 10-K
1. Consolidated Financial StatementsThe consolidated financial statements of the Company havebeen included in Item 8 of this report.
Consolidated Balance Sheets as of December 31, 1998and 1997
Consolidated Statements of Income for each of the threeyears ended December 31, 1998, 1997 and 1996
Consolidated Statements of Changes in Shareholders’Equity for each of the three years ended December 31,1998, 1997 and 1996
Consolidated Statements of Cash Flows for each of thethree years ended December 31, 1998, 1997 and 1996
Notes to Consolidated Financial Statements
2. Consolidated Financial Statement Schedules
Schedules other than those listed above have been omittedsince they are either not required or the information requiredis included in the consolidated financial statements or thenotes thereto.
KPMG LLP’s reports with respect to the above listed con-solidated financial statements and consolidated financialstatement schedule are included herein on pages 53 and 54.
Schedule Number
II
Description
Valuation andQualifying
Accounts andReserves
Page No.
56
52
Exhibit Listing
3. Exhibit Listing
Exhibit Number Description
3.01 Articles of Organization of the Registrant, as amended
3.02 By-Laws of the Registrant, as amended and restated
10.01 1987 Stock Option Plan of the Registrant (X)
10.02 Form of Incentive Stock Option Agreement under the Registrant’s 1987 Stock Option Plan (X)
10.03 Form of the Non-Qualified Stock Option Agreement under the Registrant’s 1987 Stock Option Plan (X)
10.04 The Registrant’s Employee Stock Ownership Plan Trust Agreement dated December 30, 1987 (X)
10.05 The Registrant’s Employee Stock Ownership Plan dated December 30, 1987, as amended and restated (X)
10.06 Employment Agreement dated June 16, 1986 betweenthe Company and Rodger B. Dowdell, Jr. (X)
10.7 Unsecured line of credit agreement dated June 29,1991 between the Registrant and Rhode IslandHospital Trust National Bank
10.8 Unsecured line of credit agreement datedDecember 30, 1991 between the Registrant andFleet National Bank
10.9 Amendment dated December 30, 1992 to Unsecuredline of credit agreement between the Registrantand Fleet National Bank
10.10 Grant agreement dated February 16, 1994 betweenthe Registrant and Industrial Development Authorityof Ireland
10.11 Contract for Sale dated January 31, 1994 between theRegistrant and Digital Equipment International
10.12 Management Agreement dated January 31, 1994between the Registrant and Digital EquipmentInternational
10.13 License Agreement dated January 31, 1994 betweenthe Registrant (Grantor) and Digital EquipmentInternational (Licensee)
10.14 Grant of Options Agreement dated January 31, 1994between the Registrant and Digital EquipmentInternational
10.15 Memorandum Agreement dated January 31, 1994between the Registrant and Digital EquipmentInternational
10.16 1993 Non-Employee Director Stock Option Plan (X)
10.17 Letter Agreement dated June 22, 1995 to amend loanagreement dated December 30, 1991 by and betweenRegistrant and Fleet National Bank
10.18 Letter Agreement dated October 11, 1995 to amendloan agreement dated December 30, 1991 by andbetween Registrant and Fleet National Bank
10.19 Purchase and Sale Contract dated April 12, 1995between the Registrant and Trustees of Normac-Billerica Associates III u/d/t dated October 11, 1979
10.20 American Power Conversion Corporation B.V. ProfitSharing Scheme dated September 25, 1996 (X)
10.21 1997 Stock Option Plan of the Registrant (X)
10.22 Form of Incentive Stock Option Agreement under theRegistrant’s 1997 Stock Option Plan (X)
10.23 Form of the Non-Qualified Stock Option Agreementunder the Registrant’s 1997 Stock Option Plan (X)
10.24 1997 Non-Employee Director Stock Option Plan of theRegistrant (X)
10.25 1997 Employee Stock Purchase Plan of the Registrant (X)
21 Subsidiaries of Registrant
23 Consent of KPMG LLP
27 Financial Data Schedule (for SEC EDGAR filing only;intentionally omitted)
(X) Indicates a management contract or any compensatory plan,contract or arrangement
(b) Reports on Form 8-K
No reports on Form 8-K have been filed by the Registrant duringthe quarter ended December 31, 1998.

53
Independent Auditors’ R
eport
INDEPENDENT AUDITORS’ REPORT
The Board of Directors and ShareholdersAmerican Power Conversion Corporation:
We have audited the accompanying consolidated balance sheets of American Power Conversion Corporation and subsidiariesas of December 31, 1998 and 1997, and the related consolidated statements of income, changes in shareholders’ equity, andcash flows for each of the years in the three-year period ended December 31, 1998. These consolidated financial statementsare the responsibility of the Company’s management. Our responsibility is to express an opinion on these consolidated financialstatements based on our audits.
We conducted our audits in accordance with generally accepted auditing standards. Those standards require that we plan andperform the audit to obtain reasonable assurance about whether the financial statements are free of material misstatement. Anaudit includes examining, on a test basis, evidence supporting the amounts and disclosures in the financial statements. An auditalso includes assessing the accounting principles used and significant estimates made by management, as well as evaluatingthe overall financial statement presentation. We believe that our audits provide a reasonable basis for our opinion.
In our opinion, the consolidated financial statements referred to above present fairly, in all material respects, the financial posi-tion of American Power Conversion Corporation and subsidiaries as of December 31, 1998 and 1997, and the results of theiroperations and their cash flows for each of the years in the three-year period ended December 31, 1998, in conformity with gen-erally accepted accounting principles.
Providence, Rhode Island
February 4, 1999

54
Independent Auditors’ R
eport
INDEPENDENT AUDITORS’ REPORT
The Board of Directors and ShareholdersAmerican Power Conversion Corporation:
Under date of February 4, 1999, we reported on the consolidated balance sheets of American Power Conversion Corporationand subsidiaries as of December 31, 1998 and 1997 and the related consolidated statements of income, shareholders’ equity,and cash flows for each of the years in the three-year period ended December 31, 1998, as contained in the annual report onForm 10-K for the year 1998. In connection with our audits of the aforementioned consolidated financial statements, we alsoaudited the related financial statement schedule listed in Item 14(a)(2). This financial statement schedule is the responsibility ofthe Company’s management. Our responsibility is to express an opinion on the financial statement schedule based on our audits.
In our opinion, such financial statement schedule, when considered in relation to the basic consolidated financial statementstaken as a whole, presents fairly, in all material respects, the information set forth therein.
Providence, Rhode Island
February 4, 1999

55
Signatures
SIGNATURES
Pursuant to the requirements of Section 13 or 15(d) of the Securities Exchange Act of 1934, the Registrant has duly causedthis report to be signed on its behalf by the undersigned, thereunto duly authorized.
AMERICAN POWER CONVERSION CORPORATION
Date: March 22, 1999
Donald M. Muir, Chief Financial Officer(principal financial and accounting officer)
Pursuant to the requirements of the Securities Exchange Act of 1934, this report has been signed by the following persons on behalf of the Registrant and in the capacities indicated on the date indicated.
Date: March 22, 1999
Rodger B. Dowdell, Jr.,Chairman, President,
Chief Executive Officer and Director(principal executive officer)
Date: March 22, 1999
Neil E. Rasmussen,Vice President and Director
Date: March 22, 1999
Emanuel E. Landsman,Vice President, Clerk and Director
Date: March 22, 1999
Ervin F. Lyon, Director
Date: March 22, 1999
James D. Gerson, Director

56
Schedule II
Schedule II
AMERICAN POWER CONVERSION CORPORATION AND SUBSIDIARIES
Valuation and Qualifying Accounts and Reserves
For the years ended December 31, 1998, 1997 and 1996
In thousands
1998
1997
1996
Balance atBeginning of Year
$12,230
10,789
6,920
Charged to Costsand Expenses
$6,593
4,834
4,291
Write Offs/Allowances Taken
$(3,352)
(3,393)
(422)
Balance at End ofYear
$15,471
12,230
10,789
Allowance for Doubtful Accounts Receivable
Valuation accounts deducted from assets to which they apply:


