Nonresponse in the Norwegian Labour Force Survey (LFS ... · PDF fileLabour Force Survey...
28
Notater Documents 54/2012 • Ib Thomsen and Ole Villund Nonresponse in the Norwegian Labour Force Survey (LFS): using administrative information to describe trends
Transcript of Nonresponse in the Norwegian Labour Force Survey (LFS ... · PDF fileLabour Force Survey...

NotaterDocuments
54/2012 •
Ib Thomsen and Ole Villund
Nonresponse in the Norwegian Labour Force Survey (LFS): using administrative information to describe trends


Documents 54/2012
Ib Thomsen and Ole Villund
Nonresponse in the Norwegian Labour Force Survey (LFS): using administrative information to describe trends
Statistisk sentralbyrå • Statistics NorwayOslo–Kongsvinger

In this series, documentation, method descriptions, model descriptions and standards are published.
Documents
Symbols in tables SymbolCategory not applicable .Data not available ..Data not yet available …Not for publication :Nil -Less than 0.5 of unit employed 0Less than 0.05 of unit employed 0.0Provisional or preliminary figure *Break in the homogeneity of a vertical series —Break in the homogeneity of a horizontal series |
© Statistics Norway When using material from this publication, Statistics Norway shall be quoted as the source. Published August 2012 ISBN 978-82-537-8457-1 (printed) ISBN 978-82-537-8458-8 (electronic) ISSN 1891-5906 Subject: 06.90 Print: Statistics Norway Decimal punctuation mark .

Documents 54/2012 Nonresponse in the Norwegian Labour Force Survey (LFS)
Statistics Norway 3
Preface This document is the result of a study on nonresponse in the Norwegian Labour Force Survey (LFS). The study follows a broader project on how to deal with nonresponse, which investigates several different surveys. The LFS is distinct in its size and the relatively long time series, and therefore ideal for studying nonresponse trends in some detail. The motivation was how to better describe the effects of nonresponse, as the focus on increasing nonresponse rates tells us little about the effect on official statistics. Statistics Norway, 14 August 2012 Hans Henrik Scheel

Nonresponse in the Norwegian Labour Force Survey (LFS) Documents 54/2012
4 Statistics Norway
Abstract Studying data from the Norwegian Labour Force Survey sample linked to administrative register data, we focus on trends in nonresponse and its effects. Analyzing response rates and nonresponse bias in several subgroups, we find relatively stable response patterns. Although the overall response rate is decreasing, it seems to exist some structural differences. Factors such as age, gender, citizenship and employment seem to determine a response pattern that changes little over a relatively long period, when we observe clearly increasing nonresponse over the same period. Using register-based employment status available for the total sample, we have estimated the nonresponse bias for employment. Defining the response structure as the ratio of response rates among employed/not-employed, we compare this indicator with nonresponse rate and nonresponse bias.

Documents 54/2012 Nonresponse in the Norwegian Labour Force Survey (LFS)
Statistics Norway 5
Contents Preface .................................................................................................................................. 3 Abstract................................................................................................................................. 4 Contents................................................................................................................................ 5 1. Introduction and summary ..................................................................................... 6 2. Data sources............................................................................................................ 6 2.1. Survey sample .......................................................................................................... 6 2.2. Administrative registers ............................................................................................. 7 3. Response rate.......................................................................................................... 7 4. Nonresponse Bias................................................................................................. 11 5. A simple relationship between response rate and nonresponse bias, for
binominal variables............................................................................................... 13 References.......................................................................................................................... 17 Appendix A ......................................................................................................................... 18 List of figures...................................................................................................................... 24 List of tables ....................................................................................................................... 25

Nonresponse in the Norwegian Labour Force Survey (LFS) Documents 54/2012
6 Statistics Norway
1. Introduction and summary The purpose of this document is to present a straightforward description of the nonresponse development over the period 1996–2011 in the Norwegian Labour Force Survey (LFS). The sample is linked to administrative registers in order to compare response rates in various subgroups. In chapter 3, response rates are presented for a number of subgroups, such as age groups, gender, citizenship and employment. In chapter 4, we concentrate on one variable, namely employment status in the register. However the target variable is employment status according to the ILO definition, based on the survey response. We know that the correlation between the two variables is very high (Thomsen and Zhang 2001), and therefore the findings concerning register status are relevant for the target variable as well. In this study we concentrate on trends in yearly average nonresponse rates. However, as illustrated in additional figures (Annex), the difference in nonresponse rate between quarters can be relatively large. We plan to study this phenomenon later. We discuss two quality indicators and compare their development over time: nonresponse rate and nonresponse bias. The main findings are: There are clear differences in response rates between subgroups, and more interesting, the pattern remains relatively constant over time. This is an important finding because, it indicates that the representativeness of the sample of respondents changes little over time compared to a steady increase in nonresponse rates. In spite of the clear increase in nonresponse rate, we find that the bias (of registered employment) is more or less constant during the studied period. This is observed across several subgroups such as age, gender and nationality. This shows that nonresponse rate alone is a poor indicator of the quality. In chapter 5 we define response structure as a ratio of response rates. A simple relationship between the bias of a binomial variable and the response structure is presented. From this relationship we see that the bias is a function of the response structure and not of the nonresponse rate.
2. Data sources
2.1. Survey sample The Norwegian Labour Force Survey (LFS) is a continuous, rotating panel, sample survey. The sample size is 24.000. The sample frame is registered families of residents between 15 and 74 years old. The sample design is a one-stage cluster sampling where every family member is included in the sample. Each person is interviewed once every quarter for eight consecutive quarters. Oversampling of some sparsely populated regions, result in a slight variation of selection probability. The reference period is one week, and the interview is supposed to be performed within ten days after the reference week. Sample units are allocated to every week in each year, in order to cover all seasonal variation. The interviewers are organized in a central unit and several local interviewers, but the mode of data collecting is exclusively computer-assisted telephone interviews and uses the same questionnaire.

Documents 54/2012 Nonresponse in the Norwegian Labour Force Survey (LFS)
Statistics Norway 7
The variable of interest here is employment, defined in the sample as having worked at least one hour during the reference week. This definition is in line with recommendations from the ILO (International Labour Organization). Our goal was to study as long as possible time series. The Norwegian LFS started in 1972, but available data collected before 1996 do not contain relevant information about nonresponse at the micro level. For the present study, we have selected data starting with 1st Quarter 1996 up to and including 4th Quarter 2011. The resulting study data consists of over 1.5 million records for 230.000 people; including over 1.35 million interviews from nearly 220.000 people.
2.2. Administrative registers Register data used in this study are collected by governmental agencies for administrative purposes. The main source is the Norwegian Labour and Welfare Service’s employee register. It is mandatory for employers to report employee jobs to the register, with few exceptions. Most data are sent to the register directly from the employers own IT-systems. Thus, the register data are independent of the survey responses, and quite comprehensive and accurate as well. In addition, the register data are somewhat revised at Statistics Norway, for instance merging records that pertain to the same job, and adjusting status by checking against other registers. Another important source of administrative data is the Central Population Register, run by the Tax Agency. Demographic attributes, such as age, gender, citizenship and place of residence, are collected only from register data. The survey sample data is linked to the register data at the micro level, using the personal identification and approximate reference time. It can be described as linking at the person level and not at job level. We remark that due to differences in definitions, data collecting routines and time lag, there is some divergence at micro- and macro level between survey employment and register-based employment. For a discussion about these matters, se for instance Villund (2010).
3. Response rate
We define nonresponse rate as t
n
1it,i
t n
Rr
t
== where t,iR is a binary variable for the
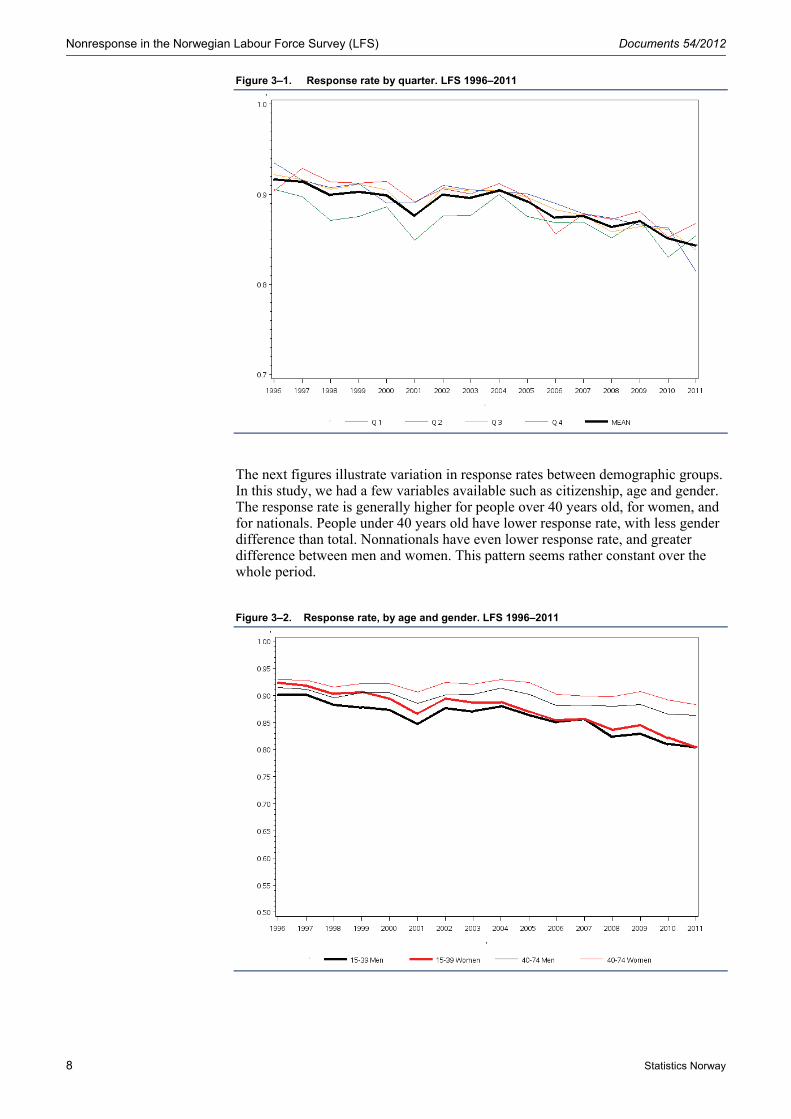
response status for individual i at time t in sample of size nt. Figure 3–1 shows response rates over time, for each quarter and the yearly mean. Response rates show a declining trend over the years (1996–2011). In addition to this trend, there is a variation between the years due to random and nonrandom factors (for instance interview staff reorganizations, countermeasures aimed at increasing response, etc.). A “seasonal” pattern is observed in the period 1996–2005, when the response rate is significantly lower in the second quarter. We believe this can be explained by the allocation of ad-hoc modules, which result in more burdensome interviews. From 1996 to 2005 these extra questions where allocated to the 2nd quarter, now they are distributed over the whole year.
Nonresponse in the Norwegian Labour Force Survey (LFS) Documents 54/2012
8 Statistics Norway
Figure 3–1. Response rate by quarter. LFS 1996–2011
The next figures illustrate variation in response rates between demographic groups. In this study, we had a few variables available such as citizenship, age and gender. The response rate is generally higher for people over 40 years old, for women, and for nationals. People under 40 years old have lower response rate, with less gender difference than total. Nonnationals have even lower response rate, and greater difference between men and women. This pattern seems rather constant over the whole period.
Figure 3–2. Response rate, by age and gender. LFS 1996–2011

Documents 54/2012 Nonresponse in the Norwegian Labour Force Survey (LFS)
Statistics Norway 9
Figure 3–3. Response rate, by citizenship and age. LFS 1996–2011
Figure 3–4 Response rate, by citizenship and gender. LFS 1996–2011
We now turn to variation in response rate between employed and not-employed people. The next three figures illustrate variation in response rates between employed and not-employed people by age, gender and citizenship. We observe a clear difference in response rate between employed and not-employed, across the demographic groups.

Nonresponse in the Norwegian Labour Force Survey (LFS) Documents 54/2012
10 Statistics Norway
Figure 3–5. Response rate, by employment and age. LFS 1996–2011
Figure 3–6. Response rate, by employment and gender. LFS 1996–2011

Documents 54/2012 Nonresponse in the Norwegian Labour Force Survey (LFS)
Statistics Norway 11
Figure 3–7. Response rate, by employment and citizenship. LFS 1996–2011
4. Nonresponse Bias
We define nonresponse bias as t
n
1it,i
n
1it,i
n
1it,it,i
n
X
R
)RX(pp̂
t
t
t
=
=
= −=−
where t,iX is a binary variable for the register employment status for individual i
in sample n at time t, and R as defined in the response rate formula, p̂ the employment rate in the response sample, and p the employment rate in the total sample. The previous section demonstrated the variation in response rate by employment. From earlier, we know that register-based employment status is correlated with survey-based employment status and survey response status. Therefore, register-based employment is a key variable for analyzing nonresponse bias. We define nonresponse bias as employment rate in the response sample minus employment rate in the total sample. Thus, a positive figure means that the response sample over-represents employment. In order to observe the relationship between the bias and the rate over time, we compare the trends for nonresponse rate and nonresponse bias over the period 1996–2011. Figure 4–1 shows the results for this period. While the nonresponse rate shows a growing trend, the nonresponse bias shows no clear trend. Taking averages over 4-year periods, we actually find smaller bias in the period 2008–2011 than in the previous three periods, .85 percentage point compared to .9-1.0.

Nonresponse in the Norwegian Labour Force Survey (LFS) Documents 54/2012
12 Statistics Norway
From this, we draw two preliminary conclusions: • Nonresponse bias does not show any clear trend during this period, but
possibly a slow decline.
• The nonresponse rate is increasing and shows no obvious relationship with the bias. Thus it seems to be of little use in assessing the impact of nonresponse.
Figure 4–1. Nonresponse rate and -bias. LFS 1996–2011
Non-nationals and non-response Since earlier findings (e.g. Villund 2008) have shown low response rates for immigrants, we wish to look closer at this group. Although still a relatively small group, the immigrant population has grown from 5 percent to 13 percent from 1996 to 2011. In comparison, the proportion of nonnationals in the sample has grown from around 3.5 percent to nearly 8 percent.Figure 4–2 Compares the nonresponse for nationals and nonnationals (thin lines). We observe a higher nonresponse rate and bias for nonnationals seems to be rather constant over time.

Documents 54/2012 Nonresponse in the Norwegian Labour Force Survey (LFS)
Statistics Norway 13
Figure 4–2. Comparing nonresponse rate and –bias, by citizenship. LFS 1996–2011
5. A simple relationship between response rate and nonresponse bias, for binominal variables
Let Xi and Ri denote the binominal variable and response status as defined in the previous chapter. Furthermore, we define the following probabilities:
)1X|1R(Pr ii1 ===
)0X|1R(Pr ii0 ===
)1X(Pp i ==
)1R|1X(Pp̂ ii === Consider now the estimated odds of being employed:
=
=
−=
− n
1iii
n
1iii
R)X1(
RX
)p̂1(
p̂
Taking the expected value we find the following approximation:
( )
( ) 0
1n
1iiii
n
1iiii
n
1iii
n
1iii
r
r
p1
p
X|)R)X1((EE
X|)RX(EE
R)X1(E
RXE
)p̂1(
p̂E
−
=−
=
−
≈
−
=
=
=
=

Nonresponse in the Norwegian Labour Force Survey (LFS) Documents 54/2012
14 Statistics Norway
From this we see that the bias of the observed odds, and therefore of the observed
proportion, is a function of the ratio 0
1
r
r but not of the response rate. In other
words, response rates can vary considerably without affecting the nonresponse bias, if this ratio remains constant. Figure 5–1 illustrates that this in fact is the case in the data we have studied. We plan to compare several sample surveys regarding this.
Figure 5–1. Comparing nonresponse rate, bias and response structure. LFS 1996–2011

Documents 54/2012 Nonresponse in the Norwegian Labour Force Survey (LFS)
Statistics Norway 15
Tables
Table 1. Response rates. LFS yearly average 1996-2011
1996 1997 1998 1999 2000 2001 2002 2003 2004 2005 2006 2007 2008 2009 2010 2011Total ................. 91,7 91,5 89,9 90,3 89,9 87,7 90,0 89,6 90,4 89,2 87,4 87,5 86,4 87,0 85,1 84,4 Gender Men ................... 90,8 90,6 88,9 89,2 89,0 86,7 89,0 88,8 89,9 88,5 86,7 87,1 85,6 86,0 84,1 83,8Women .............. 92,6 92,3 91,0 91,4 90,9 88,8 91,0 90,5 91,0 90,0 88,1 88,0 87,2 88,1 86,2 85,0 Age 15-24 år ............. 92,3 90,7 89,7 90,5 89,7 87,7 90,4 89,0 90,1 89,4 88,1 88,1 86,7 88,6 86,2 86,025-39 år ............. 90,6 91,1 89,1 88,6 87,6 84,6 87,6 87,3 87,5 85,2 83,6 84,1 80,8 80,7 78,7 77,040-54 år ............. 92,0 91,6 90,0 90,9 90,6 88,3 90,2 89,8 91,2 89,8 87,7 88,2 87,3 87,5 84,7 84,355-66 år ............. 91,9 91,3 89,7 90,5 90,9 89,5 91,5 91,6 92,2 91,8 89,8 89,7 89,9 90,4 89,7 89,067-74 år ............. 93,0 94,2 93,8 94,3 95,1 94,2 94,8 95,2 95,6 95,9 92,7 90,4 92,3 94,2 94,0 93,6 Residence
Other residences 92,6 92,4 91,1 91,3 91,1 89,3 91,2 90,6 91,4 90,3 88,7 88,8 87,6 88,3 86,3 85,7Large Municipalities
92,0 91,8 88,6 90,5 90,1 87,2 90,9 90,0 90,8 89,7 86,8 88,1 87,0 87,1 85,1 84,8
Oslo (CAPITAL) .. 84,9 84,2 83,5 82,6 81,2 76,4 79,5 81,9 83,3 81,2 79,1 78,3 76,9 78,1 77,2 75,2 Employment Not employed ..... 89,1 88,8 87,3 87,8 87,7 85,6 87,6 87,3 88,1 86,9 85,0 84,7 83,9 85,2 83,2 82,4Employed .......... 93,3 93,0 91,3 91,6 91,1 88,9 91,2 90,9 91,7 90,5 88,8 89,2 87,7 88,0 86,2 85,5
Table 2. Nonresponse bias. LFS yearly average 1996 - 2011
P1-P
1996 1997 1998 1999 2000 2001 2002 2003 2004 2005 2006 2007 2008 2009 2010 2011Total ................... 0,00 0,00 0,00 0,00 0,00 0,00 0,00 0,00 0,00 0,00 0,00 0,00 0,00 0,00 0,00 0,00 Gender Men ..................... -0,49 -0,47 -0,57 -0,61 -0,53 -0,59 -0,57 -0,49 -0,32 -0,41 -0,39 -0,28 -0,47 -0,61 -0,60 -0,37Women ................ 0,49 0,47 0,57 0,61 0,53 0,59 0,57 0,49 0,32 0,41 0,39 0,28 0,47 0,61 0,60 0,37 Age '15-24 .................. 0,10 -0,14 -0,03 0,04 -0,04 -0,01 0,06 -0,10 -0,06 0,04 0,13 0,10 0,06 0,29 0,22 0,32'25-39 .................. -0,37 -0,14 -0,32 -0,62 -0,80 -1,09 -0,81 -0,80 -0,97 -1,29 -1,21 -1,05 -1,72 -1,90 -2,00 -2,30'40-54 .................. 0,10 0,05 0,03 0,19 0,21 0,20 0,07 0,05 0,23 0,19 0,11 0,23 0,32 0,14 -0,16 -0,04'55-66 .................. 0,04 -0,03 -0,03 0,04 0,16 0,34 0,30 0,41 0,38 0,54 0,53 0,47 0,81 0,79 1,07 1,09'67-74 .................. 0,13 0,26 0,36 0,36 0,47 0,57 0,38 0,44 0,42 0,53 0,44 0,25 0,54 0,68 0,88 0,93 Residence Other residences .. 0,73 0,76 0,96 0,82 0,94 1,38 1,04 0,83 0,76 0,86 1,11 1,03 1,06 1,10 1,02 1,11Large municipalities .......
0,06 0,06 -0,23 0,04 0,03 -0,08 0,15 0,06 0,06 0,09 -0,10 0,10 0,11 0,01 0,00 0,09
Oslo (capital) ........ -0,79 -0,82 -0,73 -0,86 -0,97 -1,29 -1,19 -0,89 -0,82 -0,95 -1,01 -1,14 -1,17 -1,11 -1,03 -1,21 Employment Not employed ....... -1,10 -1,04 -1,01 -0,93 -0,86 -0,85 -0,91 -0,94 -0,91 -0,93 -1,01 -1,18 -0,98 -0,73 -0,84 -0,86Employed ............ 1,10 1,04 1,01 0,93 0,86 0,85 0,91 0,94 0,91 0,93 1,01 1,18 0,98 0,73 0,84 0,86
Table 3. Response rate, by age and gender. LFS yearly average 1996 - 2011
Total Men Women
Total Other age groups
25-35 years olds
Total Other age groups
25-35 years olds
Total Other age groups
25-35 years olds
1996 .......................... 91,6 92,0 90,2 90,7 91,3 88,6 92,5 92,8 91,81997 .......................... 91,4 91,6 90,8 90,5 90,9 89,5 92,3 92,3 92,11998 .......................... 89,9 90,3 88,6 88,9 89,5 86,9 90,9 91,1 90,31999 .......................... 90,2 90,9 88,0 89,1 90,0 86,1 91,4 91,8 89,92000 .......................... 89,8 90,6 87,2 88,9 89,9 85,7 90,8 91,4 88,82001 .......................... 87,6 88,8 83,6 86,6 87,9 82,3 88,6 89,7 85,02002 .......................... 89,9 90,8 87,1 88,9 89,9 85,8 91,0 91,7 88,42003 .......................... 89,6 90,5 86,4 88,7 89,6 85,6 90,5 91,3 87,42004 .......................... 90,4 91,4 86,7 89,8 90,8 86,2 91,0 92,0 87,22005 .......................... 89,2 90,5 84,1 88,4 89,8 83,0 89,9 91,1 85,22006 .......................... 87,4 88,5 82,4 86,7 87,8 81,9 88,0 89,3 82,92007 .......................... 87,5 88,5 83,1 87,0 88,0 82,7 88,0 89,0 83,42008 .......................... 86,3 88,0 79,1 85,5 87,2 78,1 87,2 88,7 80,12009 .......................... 87,0 88,7 79,0 85,9 87,7 77,9 88,1 89,8 80,22010 .......................... 85,1 86,9 76,8 84,1 86,0 75,7 86,1 87,9 78,12011 .......................... 84,3 86,4 75,4 83,7 85,7 75,2 85,0 87,1 75,7

Nonresponse in the Norwegian Labour Force Survey (LFS) Documents 54/2012
16 Statistics Norway
Table 4. Response rate, by citizenship and gender. LFS yearly average 1996 - 2011
Total Men Women
Total Nonnational National Total Nonnational National Total Nonnational National1996 .......................... 91,6 76,3 92,2 90,7 72,8 91,4 92,5 80,1 93,01997 .......................... 91,4 75,4 92,0 90,5 72,0 91,2 92,3 79,0 92,81998 .......................... 89,9 75,8 90,4 88,9 71,7 89,5 90,9 80,2 91,31999 .......................... 90,2 75,2 90,8 89,1 70,8 89,8 91,4 80,3 91,72000 .......................... 89,8 76,5 90,3 88,9 75,0 89,4 90,8 78,1 91,32001 .......................... 87,6 71,9 88,2 86,6 69,1 87,3 88,6 74,7 89,22002 .......................... 89,9 77,2 90,4 88,9 73,5 89,6 91,0 81,0 91,42003 .......................... 89,6 77,7 90,1 88,7 76,1 89,3 90,5 79,4 91,02004 .......................... 90,4 78,0 90,9 89,8 77,1 90,4 91,0 78,9 91,52005 .......................... 89,2 74,8 89,9 88,4 74,0 89,1 89,9 75,5 90,72006 .......................... 87,4 71,3 88,1 86,7 68,2 87,5 88,0 73,9 88,82007 .......................... 87,5 73,1 88,2 87,0 69,8 87,9 88,0 76,3 88,62008 .......................... 86,3 69,6 87,3 85,5 66,4 86,7 87,2 73,3 87,92009 .......................... 87,0 69,1 88,1 85,9 65,1 87,3 88,1 73,7 88,92010 .......................... 85,1 67,2 86,3 84,1 62,7 85,6 86,1 72,4 87,02011 .......................... 84,3 67,0 85,7 83,7 63,2 85,4 85,0 71,2 86,0
Table 5. Response rate, by citizenship and residence LFS yearly average 1996 - 2011
Total Nonnational National
Total Other residences
Oslo Total Other residences
Oslo Total Other residences
Oslo
1996 .......................... 91,6 92,5 84,4 76,3 82,5 64,8 92,2 92,7 87,01997 .......................... 91,4 92,3 84,0 75,4 81,9 62,4 92,0 92,5 86,71998 .......................... 89,9 90,6 83,3 75,8 81,3 65,0 90,4 90,9 85,71999 .......................... 90,2 91,1 82,2 75,2 80,6 63,6 90,8 91,4 84,52000 .......................... 89,8 90,9 80,8 76,5 82,2 63,7 90,3 91,1 82,92001 .......................... 87,6 88,9 75,8 71,9 78,3 55,9 88,2 89,3 78,32002 .......................... 89,9 91,1 79,4 77,2 81,3 62,6 90,4 91,5 81,02003 .......................... 89,6 90,5 81,9 77,7 81,7 64,0 90,1 90,8 83,62004 .......................... 90,4 91,2 83,2 78,0 81,4 67,1 90,9 91,6 85,02005 .......................... 89,2 90,1 81,1 74,8 79,3 60,3 89,9 90,6 83,52006 .......................... 87,4 88,3 79,0 71,3 74,7 60,3 88,1 88,9 81,22007 .......................... 87,5 88,6 78,2 73,1 76,2 61,3 88,2 89,2 80,02008 .......................... 86,3 87,5 76,9 69,6 73,0 56,2 87,3 88,2 79,22009 .......................... 87,0 88,1 78,0 69,1 71,3 61,0 88,1 89,0 80,32010 .......................... 85,1 86,1 77,2 67,2 69,9 58,0 86,3 87,0 80,02011 .......................... 84,3 85,5 75,1 67,0 69,4 57,3 85,7 86,6 77,8
Table 6. Response rate, by age and residence LFS yearly average 1996 - 2011
Total Other residences Oslo
Total Other age groups
25-35 years olds
Total Other age groups
25-35 years olds
Total Other age groups
25-35 years olds
1996 91,6 92,0 90,2 92,5 92,8 91,2 84,4 84,8 83,71997 .............. 91,4 91,6 90,8 92,3 92,4 91,8 84,0 83,8 84,41998 .............. 89,9 90,3 88,6 90,6 90,9 89,6 83,3 84,1 81,61999 .............. 90,2 90,9 88,0 91,1 91,7 89,1 82,2 83,1 80,22000 .............. 89,8 90,6 87,2 90,9 91,5 88,5 80,8 81,7 78,82001 .............. 87,6 88,8 83,6 88,9 90,0 85,2 75,8 76,8 73,62002 .............. 89,9 90,8 87,1 91,1 91,8 88,6 79,4 80,2 77,82003 .............. 89,6 90,5 86,4 90,5 91,3 87,4 81,9 82,4 80,62004 .............. 90,4 91,4 86,7 91,2 92,1 87,6 83,2 84,1 81,32005 .............. 89,2 90,5 84,1 90,1 91,4 84,9 81,1 81,8 79,32006 .............. 87,4 88,5 82,4 88,3 89,5 83,4 79,0 79,8 76,92007 .............. 87,5 88,5 83,1 88,6 89,5 84,5 78,2 79,2 75,92008 .............. 86,3 88,0 79,1 87,5 89,0 80,1 76,9 78,1 73,92009 .............. 87,0 88,7 79,0 88,1 89,6 80,3 78,0 80,2 72,72010 .............. 85,1 86,9 76,8 86,1 87,7 78,0 77,2 79,4 71,42011 .............. 84,3 86,4 75,4 85,5 87,4 76,5 75,1 77,1 70,2

Documents 54/2012 Nonresponse in the Norwegian Labour Force Survey (LFS)
Statistics Norway 17
References Thomsen, I. and Zhang, L.-C.: “The Effects of Using Administrative Registers in Economic Short Term Statistics: The Norwegian Labour Force Survey as a Case Study” Journal of Official Statistics, Vol. 17, No. 2, 2001, pp. 285–294 Villund, O.: “Evaluating employment classification. A quality study linking survey data and register data” Statistics Norway Documents 2010/09. Villund, O.: “Immigrant participation in the Norwegian Labour Force Survey” Statistics Norway Documents 2008/7

Nonresponse in the Norwegian Labour Force Survey (LFS) Documents 54/2012
18 Statistics Norway
Appendix A This annex contains some technical information and more detailed results made during the study. This material is included for reference and background information for future studies. Documentation of the sample data Figure 1compares the sample size of direct- and proxy response, as well as nonresponse and ineligible units.
“Proxy response” means that a spouse or parent is interviewed on behalf of the study unit. “Direct” means self-response, i.e. the study units answer themselves. “Passive” units are old-age pensioners and institutionalized people that are intentionally not interviewed, thus not classified as nonresponse. The small group “Out” consists of people who are dead or emigrated between sampling and interview week.
Figure 1. Composition of total sample. LFS 1996–2011
The purpose of this study was not to analyze the reasons or underlying causes of nonresponse. However, during fieldwork, the nonrespondents are classified according to reason for nonresponse. This classification is of course mainly based on the interviewers’ perception of the situation, since we can’t ask the potential respondent about the “real reason”. Some groups are relatively specific, such as ‘language problems’ and ‘refusals’, these groups are often relatively small. Many of the major groups tell us little about the actual causes, such as ‘non-contact’ and unspecified reasons. Figure 2 shows the composition of the nonresponse, with respect to selected types. The main group “Other” consists mainly of non-contact and other plausible reasons for not being interviewed. Outright refusal constitutes a relatively small part of nonresponse, and without a clear trend. Explicitly identified language problems are growing somewhat in later years, in line with an increasing immigrant population. We suspect that the proportions of both refusals and language problems are underestimated. For instance when people do not answer the telephone, it is hard to know the real reason.

Documents 54/2012 Nonresponse in the Norwegian Labour Force Survey (LFS)
Statistics Norway 19
Figure 2. Composition of nonresponse. LFS 1996–2011
Quarterly results The figures presented previous chapters are yearly average results, with the intention of looking for structures and trends. In fact, results from the quarterly data show much more variation. The following figures illustrate this.
Figure 3. Response rate, by age and gender. LFS 1996–2011

Nonresponse in the Norwegian Labour Force Survey (LFS) Documents 54/2012
20 Statistics Norway
Figure 4. Response rate, by citizenship and age. LFS 1996–2011
Figure 5. Response rate, by citizenship and gender. LFS 1996–2011

Documents 54/2012 Nonresponse in the Norwegian Labour Force Survey (LFS)
Statistics Norway 21
Figure 6. Response rate, by employment and age. LFS 1996–2011
Figure 7. Response rate, by employment and gender. LFS 1996–2011

Nonresponse in the Norwegian Labour Force Survey (LFS) Documents 54/2012
22 Statistics Norway
Figure 8. Response rate, by employment and citizenship. LFS 1996–2011
Place of residence The two next figures illustrate difference in response rate by place of residence. We have not found a clear association between response rate and urbanization in general, but there are differences between the capital and other places of residence. These differences cut across demographic variables.
Figure 9. Response rate, by place of residence and age. LFS 1996–2011

Documents 54/2012 Nonresponse in the Norwegian Labour Force Survey (LFS)
Statistics Norway 23
Figure 10. Response rate, by place of residence and citizenship. LFS 1996–2011
Figure 11 compares nonresponse rate and nonresponse bias trends over the years 1996–2011. While the nonresponse rate shows a growing trend, the nonresponse bias shows a small but possibly decreasing trend, but with relatively large fluctuations over time.
Figure 11. Nonresponse rate vs nonresponse bias. LFS 1996–2011

Nonresponse in the Norwegian Labour Force Survey (LFS) Documents 54/2012
24 Statistics Norway
List of figures Figure 3–1. Response rate by quarter. LFS 1996–2011...................................................8 Figure 3–2. Response rate, by age and gender. LFS 1996–2011 .....................................8 Figure 3–3. Response rate, by citizenship and age. LFS 1996–2011 ...............................9 Figure 3–4 Response rate, by citizenship and gender. LFS 1996–2011 ..........................9 Figure 3–5. Response rate, by employment and age. LFS 1996–2011...........................10 Figure 3–6. Response rate, by employment and gender. LFS 1996–2011......................10 Figure 3–7. Response rate, by employment and citizenship. LFS 1996–2011 ................11 Figure 4–1. Nonresponse rate and -bias. LFS 1996–2011..............................................12 Figure 4–2. Comparing nonresponse rate and –bias, by citizenship. LFS 1996–2011....13 Figure 5–1. Comparing nonresponse rate, bias and response structure. LFS 1996–
2011 .....................................................................................................................14 Figure 1. Composition of total sample. LFS 1996–2011...................................................18 Figure 2. Composition of nonresponse. LFS 1996–2011 .................................................19 Figure 3. Response rate, by age and gender. LFS 1996–2011........................................19 Figure 4. Response rate, by citizenship and age. LFS 1996–2011 ..................................20 Figure5. Response rate, by citizenship and gender. LFS 1996–2011 .............................20 Figure 6. Response rate, by employment and age. LFS 1996–2011 ...............................21 Figure 7. Response rate, by employment and gender. LFS 1996–2011 ..........................21 Figure 8. Response rate, by employment and citizenship. LFS 1996–2011.....................22 Figure 9. Response rate, by place of residence and age. LFS 1996–2011 .....................22 Figure 10. Response rate, by place of residence and citizenship. LFS 1996–2011 ......23 Figure 11. Nonresponse rate vs nonresponse bias. LFS 1996–2011...........................23
List of tables Table 1. Response rates. LFS yearly average 1996-2011 ..............................................15 Table 2. Nonresponse bias. LFS yearly average 1996 - 2011 ........................................15 Table 3. Response rate, by age and gender. LFS yearly average 1996 - 2011 ..............15 Table 4. Response rate, by citizenship and gender. LFS yearly average 1996 - 2011 ...16 Table 5. Response rate, by citizenship and residence LFS yearly average 1996 -
2011 ..........................................................................................................................16 Table 6. Response rate, by age and residence LFS yearly average 1996 - 2011...........16


Statistics Norway
Oslo:PO Box 8131 DeptNO-0033 OsloTelephone: + 47 21 09 00 00Telefax: + 47 21 09 00 40
Kongsvinger:NO-2225 KongsvingerTelephone: + 47 62 88 50 00Telefax: + 47 62 88 50 30
E-mail: [email protected]: www.ssb.no
ISBN 978-82-537-8457-1 Printed versionISBN 978-82-537-8458-8 Electronic versionISSN 1891-5906
Returadresse:Statistisk sentralbyråNO-2225 KongsvingerB
No
nresp
on
se in th
e No
rweg
ian Lab
ou
r Force Su
rvey (LFS)54/2012
Statistics No
rway
Des
ign:
Siri
Boq
uist


![Brochure Leviflow LFS Family English - Home - Levitronix ......LFS-008 LFS-04(H) LFS-08(H) LFS-20(H) LFS-50(H) LFS-80(H) Flow Range [lpm] 0 – 0.8 0 – 4 0 – 8 0 – 20 0 – 50](https://static.fdocuments.net/doc/165x107/61393aa2a4cdb41a985b916a/brochure-leviflow-lfs-family-english-home-levitronix-lfs-008-lfs-04h.jpg)