
EM2AN - M BONNETIER Planestresselasto-plasticconstitutive ...

Research ArticleNonlinear Creep Behavior and Viscoelastic-Plastic ConstitutiveModel of Rock-Concrete Composite Mass
Yang Liu1 Da Huang1 Baoyun Zhao 234 Chen Wang5 and Duofeng Cen1
1School of Civil and Transportation Engineering Hebei University of Technology Tianjin 300401 China2School of Civil Engineering and Architecture Chongqing University of Science and Technology Chongqing 401331 China3Chongqing Key Laboratory of Energy Engineering Mechanics amp Disaster Prevention and Mitigation Chongqing 401331 China4e Key Laboratory of Well Stability and Fluid amp Rock Mechanics in Oil and Gas Reservoir of Shaanxi ProvinceXirsquoan Shiyou University Xirsquoan 710065 China5School of Petroleum Engineering Chongqing University of Science and Technology Chongqing 401331 China
Correspondence should be addressed to Baoyun Zhao baoyun666163com
Received 8 January 2020 Revised 13 May 2020 Accepted 31 July 2020 Published 27 August 2020
Academic Editor Dimitris Rizos
Copyright copy 2020 Yang Liu et al +is is an open access article distributed under the Creative Commons Attribution Licensewhich permits unrestricted use distribution and reproduction in any medium provided the original work is properly cited
+e joint force deformation of rock-concrete composite structures is different from that of simple rock specimens or concretespecimens such as the tunnel surrounding rock-lining concrete dam foundations and concrete In order to study the creepmechanical properties of rock-concrete composite structures under long-duration load the TFD-2000 microcomputer servo triaxialcreep testing machine is used to carry out step loading creep tests on rock-concrete composite specimens (hereinafter referred to ascomposite specimens) under different confining pressures (including the confining pressures σ3 0MPa)+e creep test results showthat under the same confining pressure when axial deviatoric stress is applied step-by-step according to 10 20 30 40 50and so forth of the UCS (σ3 0MPa) and TCS (triaxial compressive strength) of the composite specimens the failure stress that thespecimen can bear is closely related to the confining pressure When the confining pressures are 0MPa 7MPa 15MPa and 22MParespectively the failure stresses that the composite specimens can bear are 60 (corresponds to 0MPa) 50 30 and 20 of theTCS under the current confining pressures respectively Under the same confining pressure the initial creep rate of the compositespecimen on each step shows a U-shaped change trend Meanwhile the instantaneous creep rate and failure creep rate of thespecimen increase as the confining pressure increases When the failure creep rate is excluded the initial creep rate of other steppedloads at the same confining pressure level decreases step-by-step+e improved Nishihara model can better describe the whole creepprocess of rock-concrete composite specimens especially in the accelerating creep step +e testing data and research results in thispaper can serve as references for further research on mechanical properties of rock-concrete composite structures
1 Introduction
Rock and concrete are two kinds of common buildingmaterials with each containing differences in structuremechanical properties and chemical composition +esetwo materials are often combined together to bear variouscomplex forces and deformations such as dam concrete anddam foundation rock tunnel surrounding rock and shot-crete and concrete foundation and rock foundation [1ndash3]+e mechanical properties of rock-concrete compositestructures is an essential parameter involved in the designand stability analysis of many engineering structures [4ndash6]
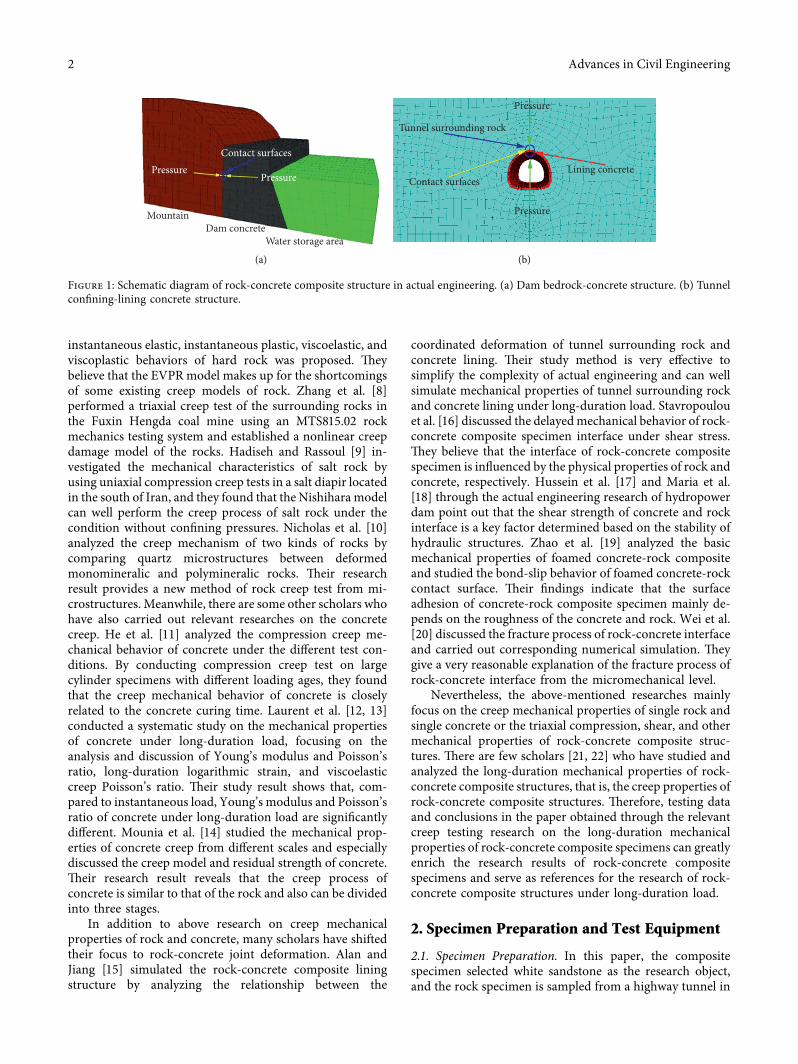
+erefore it is of great value and significance to carry outstudies on the mechanical properties of rock-concretecomposite structures especially the mechanical properties ofrock-concrete composite structures under long-durationload +e schematic diagram of the rock-concrete compositestructure in actual engineering is shown in Figure 1
At present abundant research studies on rock creep andconcrete creep have been carried out and many scholarshave conducted extremely in-depth research studies oncreep mechanical properties of rock In Zhao et alrsquos work[7] based on the experimental results at different stressconditions an EVPR model that can represent the
HindawiAdvances in Civil EngineeringVolume 2020 Article ID 9059682 14 pageshttpsdoiorg10115520209059682
instantaneous elastic instantaneous plastic viscoelastic andviscoplastic behaviors of hard rock was proposed +eybelieve that the EVPR model makes up for the shortcomingsof some existing creep models of rock Zhang et al [8]performed a triaxial creep test of the surrounding rocks inthe Fuxin Hengda coal mine using an MTS81502 rockmechanics testing system and established a nonlinear creepdamage model of the rocks Hadiseh and Rassoul [9] in-vestigated the mechanical characteristics of salt rock byusing uniaxial compression creep tests in a salt diapir locatedin the south of Iran and they found that the Nishihara modelcan well perform the creep process of salt rock under thecondition without confining pressures Nicholas et al [10]analyzed the creep mechanism of two kinds of rocks bycomparing quartz microstructures between deformedmonomineralic and polymineralic rocks +eir researchresult provides a new method of rock creep test from mi-crostructures Meanwhile there are some other scholars whohave also carried out relevant researches on the concretecreep He et al [11] analyzed the compression creep me-chanical behavior of concrete under the different test con-ditions By conducting compression creep test on largecylinder specimens with different loading ages they foundthat the creep mechanical behavior of concrete is closelyrelated to the concrete curing time Laurent et al [12 13]conducted a systematic study on the mechanical propertiesof concrete under long-duration load focusing on theanalysis and discussion of Youngrsquos modulus and Poissonrsquosratio long-duration logarithmic strain and viscoelasticcreep Poissonrsquos ratio +eir study result shows that com-pared to instantaneous load Youngrsquos modulus and Poissonrsquosratio of concrete under long-duration load are significantlydifferent Mounia et al [14] studied the mechanical prop-erties of concrete creep from different scales and especiallydiscussed the creep model and residual strength of concrete+eir research result reveals that the creep process ofconcrete is similar to that of the rock and also can be dividedinto three stages
In addition to above research on creep mechanicalproperties of rock and concrete many scholars have shiftedtheir focus to rock-concrete joint deformation Alan andJiang [15] simulated the rock-concrete composite liningstructure by analyzing the relationship between the
coordinated deformation of tunnel surrounding rock andconcrete lining +eir study method is very effective tosimplify the complexity of actual engineering and can wellsimulate mechanical properties of tunnel surrounding rockand concrete lining under long-duration load Stavropoulouet al [16] discussed the delayedmechanical behavior of rock-concrete composite specimen interface under shear stress+ey believe that the interface of rock-concrete compositespecimen is influenced by the physical properties of rock andconcrete respectively Hussein et al [17] and Maria et al[18] through the actual engineering research of hydropowerdam point out that the shear strength of concrete and rockinterface is a key factor determined based on the stability ofhydraulic structures Zhao et al [19] analyzed the basicmechanical properties of foamed concrete-rock compositeand studied the bond-slip behavior of foamed concrete-rockcontact surface +eir findings indicate that the surfaceadhesion of concrete-rock composite specimen mainly de-pends on the roughness of the concrete and rock Wei et al[20] discussed the fracture process of rock-concrete interfaceand carried out corresponding numerical simulation +eygive a very reasonable explanation of the fracture process ofrock-concrete interface from the micromechanical level
Nevertheless the above-mentioned researches mainlyfocus on the creep mechanical properties of single rock andsingle concrete or the triaxial compression shear and othermechanical properties of rock-concrete composite struc-tures +ere are few scholars [21 22] who have studied andanalyzed the long-duration mechanical properties of rock-concrete composite structures that is the creep properties ofrock-concrete composite structures +erefore testing dataand conclusions in the paper obtained through the relevantcreep testing research on the long-duration mechanicalproperties of rock-concrete composite specimens can greatlyenrich the research results of rock-concrete compositespecimens and serve as references for the research of rock-concrete composite structures under long-duration load
2 Specimen Preparation and Test Equipment
21 Specimen Preparation In this paper the compositespecimen selected white sandstone as the research objectand the rock specimen is sampled from a highway tunnel in
Mountain
PressurePressure
Contact surfaces
Water storage areaDam concrete
(a)
Pressure
Lining concrete
Pressure
Contact surfaces
Tunnel surrounding rock
(b)
Figure 1 Schematic diagram of rock-concrete composite structure in actual engineering (a) Dam bedrock-concrete structure (b) Tunnelconfining-lining concrete structure
2 Advances in Civil Engineering
Chongqing of China +e rock has compact and uniformstructure and white gray appearance Its mineral compo-nents mainly include quartz feldspar calcite and a smallamount of iron and its chemical components mainly in-clude SiO2 Al2O3 MgO CaO and Fe2O3 By our previousrelated study [23] it was learned that the rock is brittle rockwith low strength In addition the UCS (uniaxial com-pression strength) has been found to be equal to 3056MPaand the average bulk density is 2431 kgm3 +e elasticmodulus and Poissonrsquos ratio of the tested rock under uni-axial compression are 64GPa and 014 respectively
+e concrete specimens are mixed in the laboratoryaccording to the actual engineering conditions by usingP425 ordinary Portland cement All indexes shall meet therequirements of Standard Specification for Portland Cement[24] +e coarse aggregate is continuously graded crushedstones with a particle size ranging from 6mm to 13mm andall indexes meet the requirements of Standard Test Methodfor Sieve Analysis of Fine and Coarse Aggregates [25]+e fineaggregate is ordinary medium river sand with the gradingcurve in Area II and all its indexes meet the requirements ofStandard Test Method for Relative Density (Specific Gravity)and Absorption of Fine Aggregate [26] Tap water is used formixing concrete and the concrete is mixed in strict ac-cordance with the Standard Practice for Sampling FreshlyMixed Concrete [27] +e mechanical properties of theconcrete meet the requirements of [28] +e basic physicalparameters of rock and concrete specimens are shown inTable 1
As for the processing and manufacturing of rock-con-crete composite specimens the following steps were taken
① Clean the upper surface of the rock and maintain acertain degree of roughness to facilitate the bondingof concrete and rock +e roughness of the uppersurface of rock is caused by manual with graver
② In order to ensure sufficient humidity on the uppersurface of the rock before pouring the concrete soakthe rock in water for 24 hours in advance
③ Take the rock out from the water put it into a steelmould and pour concrete on the rough side of it afterthe surface of the rock is slightly dried to facilitate theforming of the rock-concrete composite test block
④ Manufacture Φ 50times (50 + 50) mm cylindrical com-posite specimens in laboratory+emanufacturing ofthe specimens is strictly in accordance with the testprocedures formulated by the International Societyfor Rock Mechanics (ISRM) (Fairhurst and Hudson[29]) standard cylinder specimens with a height of100mm and a diameter of 50mm are manufacturedand the error of specimen diameter is no more than03mm and that of end face nonparallelism is nomore than 005mm +e rock-concrete compositespecimens are shown in Figure 2
22 Test Equipment Figure 3 shows the test equipment ofTFD-2000 and deformation gauge +e test equipmentconsists of four parts which are confining pressure control
system axial pressure control system loading system andcomputer service platform +e experiments were per-formed with the microcomputer servo-controlled triaxialrheological test machine +is equipment can be used tocarry out conventional compression and rheological testssuch as uniaxial and triaxial compression tests and triaxialrheological tests +e confining pressure ranged from 0 to100MPa and the maximum axial test force of the equipmentwas 500MPa Furthermore the axial displacement ismeasured by a pair of LVDTs having a measurement rangeof 0ndash10mmwith precision of 0001mm+e radius change ismeasured by a circumferential ring that has a measurementrange of 15mm and precision of 0001mm
23 Test Process and Plan In this paper three compositespecimens were tested under the same condition for all teststo reduce the experimental error +e specific testing stepsconcerning creep are as follows
Step 1 +e device installed with a rock-concretecomposite specimens was fixed on the testing platformof triaxial compression test machine and the pressurechamber was closedStep 2 +e confining pressures are designed to be0MPa 7MPa 15MPa and 22MPa in sequenceaccording to the buried depth of the highway tunnel+e confining pressure σ3 was loaded to the desiredlevel which makes the specimen be always in the stressstate of σ1 σ2 σ3 (namely hydrostatic stress state)during the loading process of confining pressure +econfining pressure will remain constant in the subse-quent axial loading processStep 3 According to the UCS and TCS of rock-concretecomposite specimens under the same confining pres-sures 10 20 30 and so forth of the peak axialdeviatoric strengths are chosen in sequence until thespecimens are in failure +e loading rate of each step is05MPas [30] and the loading of each step lasts about24 hours
In this paper the reason why we select 24 hours for everystep is that when the axial strain value is less than 0001 itcan be deemed that the creep rate of the rock-concretecomposite specimen will not change any more +e rock-concrete composite specimen enters into a stable state Sobefore the formal test by observing several groupsrsquo rock-concrete composite specimens under creep tests it wasfound that the 24-hour period is meeting the test require-ments for each step +e test results of rock-concretecomposite specimens with triaxial compression test (TCT)under different confining pressures are shown in Table 2+e specific creep test plans under different confiningpressure are shown in Table 3
3 Test Results
31 Stress Strain +e step loading time-stress-strain curvesof rock-concrete composite specimens under differentconfining pressures are shown in Figures 4(a)ndash4(d) It can be
Advances in Civil Engineering 3
seen that the creep curves are not smooth due to a hugeamount of microfissures and microcracks in the concretespecimens leading to closure and collapse under the action
of axial stress and resulting in redistribution of internalstress but without affecting the overall deformation lawSimultaneously it can be seen that with the increase of
50
5050 Concrete
Rock
Figure 2 Pictures and schematic diagram of rock-concrete composite specimens
Confining pressurecontrol system
Axial pressurecontrol system
Confining pressurechamber
Loading system
Computer andservice platform
Axial deformationextensometer
Circumferentialdeformationextensometer
Figure 3 Installation of the TFD-2000 microcomputer servo-controlled triaxial rheological testing machine for rock and deformationextensometer
Table 2 +e test results of rock-concrete composite specimens with triaxial compression under different confining pressures [23]
Rock-concretecomposite
(triaxial compression)
Confiningpressure σ3
(MPa)
Peak axial deviatoricstress σ-pads (MPa)
Elasticmodulus E
(GPa)
Poissonrsquosratio μ
Axial peakstrain ε1 ()
Circumferential peakstrain ε3 ()
0 3056 874 012 059 1187 6598 898 014 082 10015 9407 1148 017 106 09422 11554 1058 018 149 084
Table 1 Basic physical parameters of rock and concrete specimens [23]
Specimens name Diameter d(mm)
Height h(mm)
Density ρ(kgm3)
Peak strengthσ-pc (MPa)
ElasticModulus E
(GPa)
Axial peakstrain ε-A ()
Circumferential peakstrain ε-C ()
Rock specimens
R1 4987 9962 2281 3541 682 039 022R2 5014 9947 2294 6519 594 066 034R3 4975 9958 2257 9935 642 098 098R4 4957 9987 2275 11601 581 091 088
Concrete specimens
C1 4904 9956 2189 2387 1279 018 107C2 5012 10002 2145 7019 1345 042 059C3 4975 10015 2098 8434 1368 080 064C4 4988 9963 2136 9733 1382 170 200
4 Advances in Civil Engineering
confining pressure the percentage of the peak axial devia-toric stress of TCT σ-pads (ie the creep failure stress) thatthe composite specimen in the creep tests can bear decreasesstep-by-step In the uniaxial state (σ3 0MPa) the creepfailure stress that the composite specimen can bear is 60 ofits UCS and the loading step is 6 When the confiningpressure reached 7MPa the creep failure stress that thecomposite specimen can bear is 50 of the peak axialdeviatoric stress corresponding to the same confiningpressure and the corresponding loading step is 5 When theconfining pressure increased to 15MPa the creep failurestress that the composite specimen can bear is 30 of thecorresponding peak axial deviatoric stress and the corre-sponding loading step is 3 Moreover when the confiningpressure increased to 22MPa the creep failure stress that thecomposite specimen can bear was only 20 of its corre-sponding peak axial deviatoric stress and the correspondingloading step is 2
+is is quite different from the creep change rule ofconventional pure rock samples under different confiningpressures +e phenomenon is caused by the confiningpressure and loading history together On the one handdue to the gradual transition from brittleness to ductility ofconcrete samples with the increase of confining pressure[31 32] the deformation capacity increases elasticmodulus and secant modulus decrease and Poissonrsquos ratioas well as the peak axial strain increases which leads to thedecrease of loading steps of composite samples with theincrease of confining pressure Besides the loading historyis a very important factor in creep response [33 34] +elarger the axial deviatoric stress the greater the effect onthe deformation of the composite specimen In otherwords the large axial deviatoric stress accelerates theclosure of the microcracks and micropore in the compositespecimen thereby accelerating the deformation and failureof the composite specimen +e physical parameters ofrock-concrete composite specimens and creep test resultsunder different confining pressures are shown in Table 4
32CreepRateAnalysis At the initial stage of stress loadingof all steps the rock-concrete composite specimen un-dergoes instantaneous elastic strain and then enters thedecay creep stage During the decay creep the strain valueof the composite specimen continuously increases thestrain rate decreases and gradually tends to be stable andthen enters the stable creep stage +e initial creep rate of
rock-concrete composite specimens with different con-fining pressures under step loading is shown in Table 5 andthe change trend of step loading rate is shown in Figure 5When the confining pressure reaches 0MPa the instan-taneous creep rate and the instantaneous elastic strain ofthe composite specimen are 1511times 10minus2h and 004respectively After entering the stable creep stage the strainvalue of the composite specimen is stable at 00235 to00311 When the confining pressure reaches 22MPa theinstantaneous creep rate of the composite specimen is4632 times10minus2h and the instantaneous elastic strain is 023After entering the stable creep stage the strain value of thecomposite specimen is stable at 02510 to 02558
According to Table 5 and Figure 5 it can be seen thatwith the increase of confining pressure the initial creeprate of the rock-concrete composite specimen shows aU-shaped trend in the whole creep process and can beroughly divided into three sections first there are a largenumber of micropores and microcracks in the compositespecimen especially in the concrete specimen part so thecomposite specimen will produce a huge deformationafter being subjected to the Step 1 axial stress resulting inthe instantaneous increases on the instantaneous defor-mation and initial strain rate of the rock-concrete com-posite specimen and reaching larger values +edeformation grows rapidly in this stage and in the wholecreep process the stage also has the fastest decelerationSecondly as time goes by it gradually enters a stable creepstage Except for the failure creep stage in the last step itcan be seen that the initial creep rate actually tends todecrease slightly between the other two steps Finallywhen the composite specimen reaches the peak strengthand fails the creep rate increases rapidly in this stage andthe accelerating creep rate also increases gradually withthe increase of confining pressure
By differentiating the time-strain curves inFigures 4(a)ndash4(d) the step loading creep rate under dif-ferent confining pressures can be obtained +e creep rateunder a single loading step is shown in Figure 6 +ereforethe complete fitting curves of step loading rate and initialcreep rate under different confining pressures are shown inFigures 7(a)ndash7(d)
+rough analysis it is found that the decreasing trendof step loading initial creep rate of rock-concrete com-posite specimens under different confining pressures canbe fitted by using power functions When the confiningpressures reach 0MPa 7MPa 15MPa and 22MPa
Table 3 +e specific creep test plan under different confining pressure
Confining pressure σ3(MPa)
Peak axial deviatoric stress ofTCT σ-pads
+e axial deviatoric stress for each stepStep 110
Step 220
Step 330
Step 440
Step 550
Step 660
Step 770
0 3056 306 611 917 1222 1528 lowast18337 6598 1320 1979 2639 3299 lowast395915 9407 941 1881 2822 lowast376322 11554 1155 2310 lowast3465According to the final test results only the tested steps are listed and the untested steps are not listed lowastindicates the creep failure stress under differentconfining pressures
Advances in Civil Engineering 5
respectively the initial creep rates meet equations(1)ndash(4) respectively +e initial creep change trend ofrock-concrete composite specimens under differentconfining pressures obtained through induction andanalysis can be used to predict and compare the creep ofrock-concrete composite specimens under the sameconfining pressure
y 17478xminus0951
R2
0912(1)
y 22126xminus1061
R2
0923(2)
306MPa
611MPa
917MPa
1222MPa
1528MPa
1833MPa
002006
012018
023028
Axial stressAxial strain
10
20
30
40A
xial
stre
ss (M
Pa)
00
01
02
03
04
05
06
Axi
al st
rain
()
24 48 72 96 120 1440Time (h)
(a)
Axial stressAxial strain
3959MPa
660MPa
1320MPa
1979MPa
2639MPa
3299MPa
014
026035
024
053
0
10
20
30
40
50
60
70
80
90
Axi
al st
ress
(MPa
)
24 48 72 96 1200Time (h)
00
02
04
06
08
10
Axi
al st
rain
()
(b)
Axial stressAxial strain
3763MPa
051
941MPa
1881MPa
2822MPa
020032
041
000
20
40
60
80
Axi
al st
ress
(MPa
)
02
04
06
08
10
12A
xial
stra
in (
)
24 48 720Time (h)
(c)
Axial stressAxial strain
1155MPa
2310MPa
3465MPa
025
046
068
00
02
04
06
08
10
12
14
Axi
al st
rain
()
0
20
40
60
80
Axi
al st
ress
(MPa
)
0 4824Time (h)
(d)
Figure 4 Step loading time-stress-strain curves of rock-concrete composite specimens under different confining pressures (a) Confiningpressure 0MPa (b) Confining pressure 7MPa (c) Confining pressure 15MPa (d) Confining pressure 22MPa
Table 4 +e physical parameters of rock-concrete composite specimens and creep test results under different confining pressures
Rock-concretecomposite(triaxial creep)
Confiningpressure σ3
(MPa)
Diameter d(mm)
Height h(mm)
Density ρe(kgm3)
Failure stressσ-fs (MPa)
Instantaneousstrain εi ()
Total strainεt () εiεt ()
0 4995 9996 2358 1833 002 028 77 4999 10005 2389 3959 014 053 2615 4997 10002 2331 3763 020 051 3922 4998 9998 2338 3465 025 068 36
6 Advances in Civil Engineering
Table 5 Step loading initial creep rate of rock-concrete composite specimens under different confining pressures
Confining pressure (MPa)Axial initial creep rate (10minus2h)
Instantaneous creep rate Step 2 Step 3 Step 4 Step 5 Step 6 Step 70 1511 893 766 588 442 203 2775 (lowast)7 2447 1585 927 768 586 421 3052 (lowast)15 3899 142 822 647 3882 (lowast)22 4632 983 866 5927 (lowast)(lowast) is the maximum creep rate of the rock-concrete composite specimen when failure happens
Confining pressure 0MPaConfining pressure 7MPaConfining pressure 15MPaConfining pressure 22MPa
05
1015202530354045505560
Cree
p ra
te 0
01
h
1 2 3 4 5 6 7 80Loading step
Figure 5 Change trend of initial creep rate of rock-concrete composite specimens with different confining pressures under step loading
Time-creep rate curve
00
05
10
15
20
25
30
35
40
Cree
p ra
te 0
01
h
1 2 3 4 50Time (h)
Figure 6 Creep time-creep rate curve under a single loading step (taking accelerating creep section at the confining pressure of 7MPa as anexample)
Advances in Civil Engineering 7
y 3734xminus1381
R2
0914(3)
y 4033xminus1663
R2
0924(4)
33 Failure Modes With the increased axial stress de-struction occurs in the composite specimen finally Figure 8shows the creep failure mode of the composite specimenunder different confining pressures As can be seen fromFigure 8 the main failure modes of rock-concrete composite
specimens are axial splitting failure and bevel shear failureat the same time accompanied by local crushing damageWhile local crushing damage mostly occurs in the concretespecimen part the rock parts present less significantdamage In addition the influence of the confining pressureon the creep failure mode of the composite specimen is notobvious but regardless of the composite specimen de-struction under whatever confining pressures the contactsurface of the composite sample is always intact withoutbreakage occurring from the contact surface +erefore forcomposite specimens during creep until final failure it canbe considered that the contact surface does not have toomuch influence on the mechanical properties of thecomposite specimens +e ultimate failure of the composite
Step loading rateInitial creep rateFitting curve of the initial creep rate
02775h
00203h00442h00588h
00766h00893h
01511h
1833MPa
1528MPa1222MPa917MPa611MPa
306MPay = 17478xndash0951 R2 = 0912
0
5
10
15
20
25
30Cr
eep
rate
00
1h
24 48 72 96 120 1440Time (h)
(a)
Step loading rateInitial creep rateFitting curve of the initial creep rate
y = 22126xndash1061 R2 = 0923
03052h
00421h3959MPa
02447h660MPa
01585h1320MPa
00927h1979MPa 00768h
3639MPa 00586h3299MPa
0
5
10
15
20
25
30
35
Cree
p ra
te 0
01
h
24 48 72 96 1200Time (h)
(b)
Step loading rateInitial creep rateFitting curve of the initial creep rate
y = 3734xndash1381 R2 = 0914
03882h
00647h00822h
01420h
03899h
3763MPa2822MPa
1881MPa
941MPa
0
10
20
30
40
Cree
p ra
te 0
01
h
24 480Time (h)
(c)
Step loading rateInitial creep rateFitting curve of the initial creep rate
y = 4033xndash1663 R2 = 0924
05927h
00866h00983h
04632h
3465MPa2310MPa
1155MPa
0
10
20
30
40
50
60Cr
eep
rate
00
1h
24 480Time (h)
(d)
Figure 7 Fitting curves of step loading rate and initial creep rate of composite specimens under different confining pressures (a) Confiningpressure 0 MPa (b) Confining pressure 7 MPa (c) Confining pressure 15 MPa (d) Confining pressure 22 MPa
8 Advances in Civil Engineering
specimen can be considered as a result of co-coordinateddeformation
4 Nonlinear Viscoelastic-Plastic CreepModel for Rock-ConcreteComposite Specimens
41NishiharaModel Generally speaking the creep processof rock can be divided into three stages decelerating creepstage constant rate creep stage and accelerating creepstage +e existing Nishihara model can well perform thedecelerating creep stage and constant rate creep stage ofthe rock [35 36] however since the Nishihara model iscomposed of ideal linear elements Hooke body (H)Kelvin body (NH) and ideal viscoplastic body (NStV)as shown in Figure 9 it cannot accurately describe thethird stage of the rock creep process namely the accel-erating creep stage Nevertheless it can be seen fromFigures 4(a)ndash4(d) that the rock-concrete compositespecimen has an obvious accelerating creep stage so thecreep process of the rock-concrete composite specimencannot be directly described by the Nishihara model InFigure 10 E0 and E1 are the elastic moduli in Hooke andKelvin bodies respectively η1 and η2 are the viscositycoefficients of Kelvin body and ideal viscoplastic bodyrespectively
+e creep equation of Nishihara model is shown inequation (5)
When σ0lt σs the creep equation of Nishihara model isas follows
ε σ0E0
+σ0E1
1 minus exp minusE0
η1t1113888 11138891113890 1113891 (5)
When σ0gt σs the creep equation of Nishihara model isas follows
ε σ0E0
+σ0E1
1 minus exp minusE1
η1t1113888 11138891113890 1113891 +
1η2
σ0 minus σs( 1113857t (6)
where E0 E1 η1 and η2 are the elastic plastic and viscousmoduli of the rock respectively ε is the rock strain () σ0 isthe axial stress of the rock (MPa) and t is time (h)
42 Nonlinear Viscoelastic-Plastic Creep Model +e rock-concrete composite sample is formed by pouring tightsandstone and concrete with a large number of microcracksandmicropores there is an obvious difference in the internalmicrostructure between the two materials According to thescanning electron microscope micrographs of Figures 10(a)and 10(b) it can be clearly seen that there are lots ofmicrocracks and micropores in the concrete sampleHowever these microcracks and micropores are caused bydrying shrinkage due to evaporation of water inside theconcrete sample during solidification +ese microcracksand micropores will preferentially compress and close whenthe concrete sample is subjected to external force While themicrostructure of the rock sample is compact and orderly itcan be clearly seen that the rock crystals are tightly boundtogether and there are almost no obvious microcracks ormicropores
+erefore the creep process of the rock-concretecomposite sample can be divided into three stages In thefirst stage T1 when the composite sample is subjected to axialstress the low-strength concrete specimen with large
(a) (b) (c) (d)
Figure 8 Failure mode of rock-concrete composite specimen under different confining pressures (a) 0MPa (b) 7MPa (c) 15MPa (d)22MPa
σ0 σ0
σsE1
E0η2η1
Figure 9 Nishihara model
Advances in Civil Engineering 9
numbers of microcracks and micropores will be compactedfirst while the deformation of the rock sample is very smallMeanwhile the deformation and stress are linearly elastic Inthe second stage T2 with the gradual increase of axial stressmost of microcracks and micropores in the concrete areclosed At this time the rock and the concrete will begin todeform coordinately and jointly produce deformation In thethird stage T3 the composite specimen reaches the axial peakstress causing failure and accelerating creep By the aboveanalysis a new creep constitutive model is proposed todescribe the creep process of rock-concrete compositespecimen +e new constitutive model is obtained by im-proving the Nishihara constitutive model +e improvedNishihara constitutive model corresponding to the specificcreep process is shown in Figure 11
Based on the analysis of the deformation process of therock-concrete composite specimen the improvement ofthe Nishihara model mainly includes the following basedon the original model a nonlinear viscoplastic body isconnected in series and the main function of the visco-plastic body is to embody the accelerating creep process ofthe rock-concrete composite sample According to theimproved Nishihara model in Figure 11 the following canbe obtained
σ σ1 σ2 σ3 σ4
ε ε1 + ε2 + ε3 + ε41113896 (7)
where each stress-strain relation satisfies equation (8)
σ1 E0ε1
σ2 E1ε2 + η1ε2prime
σ3 σS1 + η2ε3prime
σ4 σS2 + η3ε4prime
atb( 1113857
⎧⎪⎪⎪⎪⎪⎪⎪⎪⎪⎪⎪⎪⎪⎪⎨
⎪⎪⎪⎪⎪⎪⎪⎪⎪⎪⎪⎪⎪⎪⎩
(8)
After sorting out equations (7) and (8) the following canbe obtained
σPrime +E0 + E1
η1+
E1
η2+
E1tb
η31113888 1113889σprime + σ minus σs1( 1113857
E0E1
η1η2
+E1 σ minus σS2( 1113857
η3abt
bminus1+
E1
η1at
b1113890 1113891 E1εPrime +
E0E1
η1εprime
(9)
+e creep equation of rock-concrete composite speci-men obtained by Laplace transformation of equation (9) is asfollows
ε σ0E0
+σ0E1
1 minus exp minusE1
η1t1113888 11138891113890 1113891 +
1η2
σ0 minus σs1( 1113857t1
+1η3
σ0 minus σs2( 1113857tn2
(10)
where E0 E1 η1 η2 and η3 are respectively 2 elastic co-efficients and 3 viscosity coefficients of rock-concretecomposite specimens ε is strain of rock-concrete compositespecimen σ0 is the axial stress of the rock-concretecomposite specimen MPa t is the total creep time t1 is thestarting time for linear viscoplastic body to participate increep and t2 is starting time for accelerating creep h σs1 isthe creep initial strength of the rock-concrete compositespecimen MPa σs2 is the long-term strength of the rock-concrete composite specimen MPa
43 Model Parameter Identification and Model VerificationTaking the test data under 7MPa confining pressure toidentify and verify the creep parameters of the improvedmodel it is found that there is a critical stress value duringthe creep of the rock-concrete composite specimen Whenthe applied stress is less than the critical stress value thecreep is stable that is the rock failure will not occur with theincrease of time When the time stress (axial deviatoricstress) is greater than the critical stress value the creep isunstable that is the rock failure will occur with the increaseof time and this critical value is the long-term strengthAmong them the families of the isochronous stress-straincurve method [37 38] are a widely used method and it hasbeen incorporated into rock test specifications According tothe families of the isochronous stress-strain curves of the
(a) (b)
Figure 10 Microstructure of concrete and rock specimens when magnified 2000 times respectively (a) Concrete specimen (b) Rockspecimen
10 Advances in Civil Engineering
rock-concrete composite specimen under the confiningpressure of 7MPa shown in Figure 12 it can be seen that thefamilies of the isochronous stress-strain curves have obviousinflection points when the axial stress σ0 1331MPa andσ0 2656MPa At the first inflection pointσ0 σs1 1331MPa and the families of curves after thesecond inflection point will gradually become parallel to X-axis with the increase of time According to the corre-sponding change trend it can be seen that with the increaseof time the second half of the corresponding curve tends tobe a straight smooth line
+erefore when the confining pressure reaches 7MPathe axial stress σ0 σs2 2656MPa that is the long-termstrength value of the rock+en 1st Opt software is used andLevenberg-Marquardt as well as the General Global Opti-mization method is adopted to fit the curve+ere is no needto use the initial value of the parameters for calculation andthe software will automatically give the optimal solution ofthe undetermined parameters according to the global op-timization algorithm +erefore when the confining
pressure reaches 7MPa all parameters of the improvedNishihara model are shown in Table 6
Figure 13 is a comparison figure between the fittingcurve and the test curve of the improved Nishihara model ofthe rock-concrete composite specimen under the confiningpressure of 7MPa +e improved Nishihara model can notonly restore the creep process of the rock-concrete com-posite specimen without accelerating creep under lowconfining pressure but also restore the creep process of therock-concrete composite specimen with accelerating creepunder high confining pressure +e correlation coefficient R2
of fitting under 7MPa is 0945 which verifies the precisionand accuracy of the improved Nishihara model for creepprocess simulation of rock-concrete composite specimens
As shown in Figure 14 the accelerating creep curve ofthe rock-concrete composite specimen is fitted with theimproved Nishihara model and the original Nishiharamodel respectively and then compared It can be clearlyseen that the accelerating creep section cannot be fitted byusing the original Nishihara model while the improved
1h5h10h
15h20h
t rarr infin
Magnification Trend line
x = 0422 y = 2656
x = 0261 y = 1331
σs2
5
10
15
20
25
30
35
40
Axi
al st
ress
(MPa
)
01 02 03 04 0500Axial strain ()
Magnification
Figure 12 Families of isochronous stress-strain curves of rock-concrete composite specimens under the confining pressure of 7MPa
Composite specimen-transient deformation
Coordinated deformation-constant velocity creep of composite specimens
Coordinated deformation-accelerating creep of composite specimens
Nishihara model Nonlinear viscoplastic body
σ0
σs1 σs2
E0
T2
T1
T3
E1
σ0
η3η2η1
Figure 11 Improved Nishihara model
Advances in Civil Engineering 11
Nishihara model can In addition the fitting similaritycoefficient R2 of the original Nishihara model is 0814 whilethe similarity coefficient R2 of the improved Nishiharamodel is 0945
44 Discussion on the Sensitivity of Parameter n of the CreepEquation In order to determine the influence of the sen-sitivity coefficient n in the creep equation of the improvedNishihara model on the accelerating creep curve fitting ofthe rock-concrete composite sample 05 08 14 2 and 25are taken respectively for analysis and comparison +ecomparison curves of five different sensitivity coefficients areshown in Figure 15 As shown in Figure 15 it can be seenthat when n is equal to 05 or 08 the theoretical valueobtained will be smaller than the test value while when n isequal to 2 or 25 the fitting value obtained will be larger thanthe test value
5 Conclusions
Based on the step loading triaxial creep tests of rock-concretecomposite specimens under different confining pressureswith focus on the analysis of the creep rate and its changetrend of the rock-concrete composite specimens the creepprocess of the rock-concrete composite specimens is de-scribed by using the improved Nishihara model and thefollowing conclusions are obtained
(1) +e rock-concrete composite specimen has re-markable creep characteristics during the creepprocess the creep failure stress that the compositespecimen can bear is closely related to the confiningpressure When the confining pressure reaches0MPa 7MPa 15MPa and 22MPa the creep failure
Table 6 Parameters of the improved Nishihara model for rock-concrete composite specimens under the confining pressure of 7MPa
Axial stress (MPa) E0 (MPa) E1 (MPa) η1 (MPamiddoth) η2 (MPamiddoth) η3 (MPamiddoth) n R2
660 9569 181138 326633 09541320 10254 295527 769578 09721979 12030 274409 417133 3936741 09492639 13199 288372 498111 5165632 09853299 13686 178677 239115 5647160 4414379 09863959 15695 357824 579431 4978237 4867123 14 0945
Test dataFitting data
000005010015020025030035040045050055060065070075
Axi
al st
rain
()
4 8 12 16 20 240Time (h)
Figure 13 Comparison between the fitting curve and the test curveof the improved Nishihara model under the confining pressure of7MPa
n = 25n = 2Test data (n 14)
n = 08n = 05
045
050
055
060
065
070
Axi
al st
rain
()
1 2 3 4 50Time (h)
Figure 15 Sensitivity analysis of creep equation parameter n
Improved Nishihara fitting curveNishihara fitting curveTest data
055
060
065
070
075
Axi
al st
rain
()
0 2 3 4 51Time (h)
Figure 14 Comparison of accelerating creep curves and test curvesof two creep models
12 Advances in Civil Engineering
stress that the composite specimen can bear is 6050 30 and 20 respectively of the UCS andTCS under the same confining pressure
(2) Under the same confining pressure the initial creeprate of the rock-concrete composite specimen showsa U-shaped change trend meanwhile the instanta-neous creep rate and the failure creep rate of therock-concrete composite specimen both increasewith the increase of confining pressure Apart fromthe failure creep rate the other step loading initialcreep rates under the same confining pressure de-crease step-by-step
(3) +e creep process of rock-concrete composite spec-imens can be described very well by using the im-proved Nishihara model especially in the acceleratingcreep stage of rock-concrete composite specimens Bycomparing and analyzing the fitting curve obtained bythe improved Nishihara model with the fitting curveand test curve obtained by the original Nishiharamodel it can be seen that the similarity coefficient R2of the improved Nishihara model is 0945 which isgreatly improved compared with the similarity co-efficient of the Nishihara model R2 0814 and theimproved Nishihara model is more fitted with the testcurve thus verifying the precision and accuracy of theimproved creep model
Data Availability
+e data used to support the findings of this study are in-cluded within the article
Conflicts of Interest
+e authors declare no conflicts of interest
Acknowledgments
+is work was supported by the National Natural ScienceFoundation of China (nos 41672300 41807279 and41972297) the Supporting Program of Hundred PromisingInnovative Talents in Hebei Provincial Education Office (noSLRC2019027) Chongqing Municipal Natural Science Foun-dation (no cstc2020jcyj-msxm1078) and the key laboratory ofwell stability and fluid and rock mechanics in Oil and GasReservoir of Shaanxi Province Xirsquoan Shiyou University (noFRM20190201002)
References
[1] M D Granrut A Simon and D Dias ldquoArtificial neuralnetworks for the interpretation of piezometric levels at therock-concrete interface of arch damsrdquo Engineering Structuresvol 178 pp 616ndash634 2019
[2] Y Shen Y Wang Y Yang Q Sun T Luo and H ZhangldquoInfluence of surface roughness and hydrophilicity onbonding strength of concrete-rock interfacerdquo Constructionand Building Materials vol 213 pp 156ndash166 2019
[3] Y A Fishman ldquoStability of concrete retaining structures andtheir interface with rock foundationsrdquo International Journal
of Rock Mechanics and Mining Sciences vol 46 no 6pp 957ndash966 2009
[4] Y A Fishman ldquoFeatures of shear failure of brittle materialsand concrete structures on rock foundationsrdquo InternationalJournal of Rock Mechanics and Mining Sciences vol 45 no 6pp 976ndash992 2008
[5] V Sujatha and J M C Kishen ldquoEnergy release rate due tofriction at bimaterial interface in damsrdquo Journal of Engi-neering Mechanics vol 129 no 7 pp 793ndash800 2003
[6] M Flansbjer and J Magnusson ldquoSystem design of dome plugmechanical properties of rock-concrete interfacerdquo Report NoP-13-38 Swedish Nuclear Fuel and Waste Management CoVol 53 Stockholm Sweden 2014
[7] Y Zhao Y WangWWangWWan and J Tang ldquoModelingof non-linear rheological behavior of hard rock using triaxialrheological experimentrdquo International Journal of Rock Me-chanics and Mining Sciences vol 93 pp 66ndash75 2017
[8] S Zhang W Liu and H Lv ldquoCreep energy damage model ofrock graded loadingrdquo Results in Physics vol 12 pp 1119ndash1125 2019
[9] M Hadiseh and A Rassoul ldquoMechanical behavior of salt rockunder uniaxial compression and creep testsrdquo InternationalJournal of Rock Mechanics and Mining Sciences vol 110pp 19ndash27 2018
[10] J R H Nicholas R F Weinberg C J L Wilson V Luznand S Misra ldquoQuartz deformation across interlayeredmonomineralic and polymineralic rocks a comparativeanalysisrdquo Journal of Structural Geology vol 119 pp 118ndash134 2019
[11] S He Z Zhu M Lv and H Wang ldquoExperimental study onthe creep behaviour of rock-filled concrete and self-com-pacting concreterdquo Construction and Building Materialsvol 186 pp 53ndash61 2018
[12] C Laurent L P Yann C Eric et al ldquoA 12 year EDF study ofconcrete creep under uniaxial and biaxial loadingrdquo Cementand Concrete Research vol 103 pp 140ndash159 2018
[13] C Laurent and S Julien ldquoCreep and relaxation Poissonrsquosratio back to the foundations of linear viscoelasticity Ap-plication to concreterdquo International Journal of Solids andStructures vol 1110-111 pp 2ndash14 2017
[14] F Mounia S Jacqueline G Frederic and L Ahmedldquo7ndashmulti-scale methods for the analysis of creep-damagecoupling in concreterdquo in Advances in Multi-Physics andMulti-Scale Couplings in Geo-Environmental Mechanicspp 205ndash241 Elsevier Amsterdam Netherlands 2018
[15] B Alan and S Jiang ldquoNumerical analysis and capacityevaluation of composite sprayed concrete lined tunnelsrdquoUnderground Space vol 3 no 2 pp 87ndash108 2018
[16] E Stavropoulou M Briffaut F Camps and C GuillaumeldquoExperimental characterisation of the mechanical prop-erties of the clay-rockconcrete interfaces and their evo-lution in timerdquo in Challenges in Mechanics of TimeDependent Materials vol 2 pp 1ndash3 Springer ChamSwitzerland 2018
[17] M Hussein B Marion L Madly and V Didier ldquoExperi-mental study of the shear strength of bonded concretendashrockinterfaces surface morphology and scale effectrdquo Rock Me-chanics and Rock Engineering vol 50 no 10 pp 2601ndash26252017
[18] L B F Maria M A Nuno and C Mariline ldquoSmall dis-placement coupled analysis of concrete gravity dam foun-dations static and dynamic conditionsrdquo Rock Mechanics andRock Engineering vol 50 no 2 pp 439ndash464 2017
Advances in Civil Engineering 13
[19] W Zhao W Chen and K Zhao ldquoLaboratory test on foamedconcrete-rock joints in direct shearrdquo Construction andBuilding Materials vol 173 pp 69ndash80 2018
[20] D Wei Z M Wu X M Zhou N Wang and G KastiukasldquoAn experimental study on crack propagation at rock-con-crete interface using digital image correlation techniquerdquoEngineering Fracture Mechanics vol 171 pp 50ndash63 2017
[21] E Stavropoulou M Briffaut F Dufour and G CampsldquoTime-dependent behaviour of the Callovo-Oxfordian clay-stone-concrete interfacerdquo Journal of Rock Mechanics andGeotechnical Engineering vol 12 no 1 pp 89ndash101 2020
[22] O Buzzi M Boulon M Herve and K Su ldquoLeaching of rock-concrete interfacesrdquo Rock Mechanics and Rock Engineeringvol 41 no 3 pp 445ndash466 2007
[23] B Zhao Y Liu T Huang and XWang ldquoExperimental study onstrength and deformation characteristics of rock-concrete com-posite specimens under compressive conditionrdquo Geotechnicaland Geological Engineering vol 37 no 4 pp 2693ndash2706 2019
[24] ASTM C150C150M-19a Standard Specification for PortlandCement ASTM International West Conshohocken PA USA2019
[25] ASTM C136C136M-14 Standard Test Method for SieveAnalysis of Fine and Coarse Aggregates ASTM InternationalWest Conshohocken PA USA 2014
[26] ASTM C128-15 Standard Test Method for Relative Density(Specific Gravity) and Absorption of Fine Aggregate ASTMInternational West Conshohocken PA USA 2015
[27] ASTM C172C172M-17 Standard Practice for SamplingFreshly Mixed Concrete ASTM International West Con-shohocken PA USA 2017
[28] ASTM C1140C1140M-11 Standard Practice for Preparingand Testing Specimens from Shotcrete Test Panels ASTMInternational West Conshohocken PA USA 2011
[29] C E Fairhurst and J A Hudson ldquoDraft ISRM suggestedmethod for the complete stress train curve for the intact rockin uniaxial compressionrdquo International Journal of Rock Me-chanics and Mining Sciences vol 36 no 3 pp 279ndash289 1993
[30] ASTM D7070-16 Standard Test Methods for Creep of RockCore under Constant Stress and Temperature ASTM Inter-national West Conshohocken PA USA 2016
[31] R J M Wolfs F P Bos and T A M Salet ldquoTriaxialcompression testing on early age concrete for numericalanalysis of 3D concrete printingrdquo Cement and ConcreteComposites vol 104 p 103344 2019
[32] E Papa and A Taliercio ldquoAnisotropic damage model for thetriaxial creep behaviour of plain concreterdquo in Damage Me-chanics in Engineering Materials pp 337ndash350 ElsevierAmsterdam Netherlands 1998
[33] I Boumakis M Marcon K Nincevic L-M Czernuschkaand R Wan-Wendner ldquoConcrete creep and shrinkage effectin adhesive anchors subjected to sustained loadsrdquo EngineeringStructures vol 175 pp 790ndash805 2018
[34] A B Giorla and C F Dunant ldquoMicrostructural effects in thesimulation of creep of concreterdquo Cement and Concrete Re-search vol 105 pp 44ndash53 2018
[35] H W Zhou C P Wang B B Han and Z Q Duan ldquoA creepconstitutive model for salt rock based on fractional deriva-tivesrdquo International Journal of Rock Mechanics and MiningSciences vol 48 no 1 pp 116ndash121 2011
[36] X Li C Yang T Ren et al ldquoCreep behaviour and constitutivemodel of coal filled with gasrdquo International Journal of MiningScience and Technology vol 27 no 5 pp 847ndash851 2017
[37] X Zhao B Chen H Zhao B Jie and Z Ning ldquoLaboratorycreep tests for time-dependent properties of a marble in
Jinping II hydropower stationrdquo Journal of Rock Mechanicsand Geotechnical Engineering vol 4 no 2 pp 168ndash176 2012
[38] M Aubertin L Li and R Simon ldquoAmultiaxial stress criterionfor short- and long-term strength of isotropic rock mediardquoInternational Journal of Rock Mechanics and Mining Sciencesvol 37 no 8 pp 1169ndash1193 2000
14 Advances in Civil Engineering
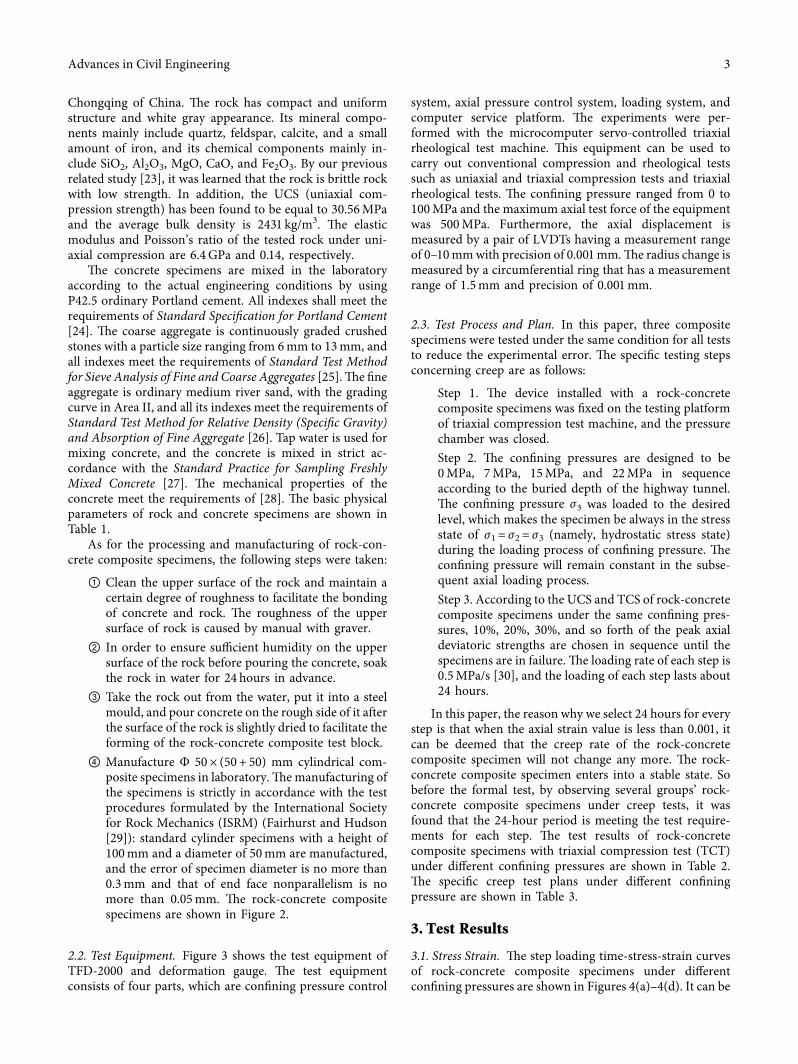
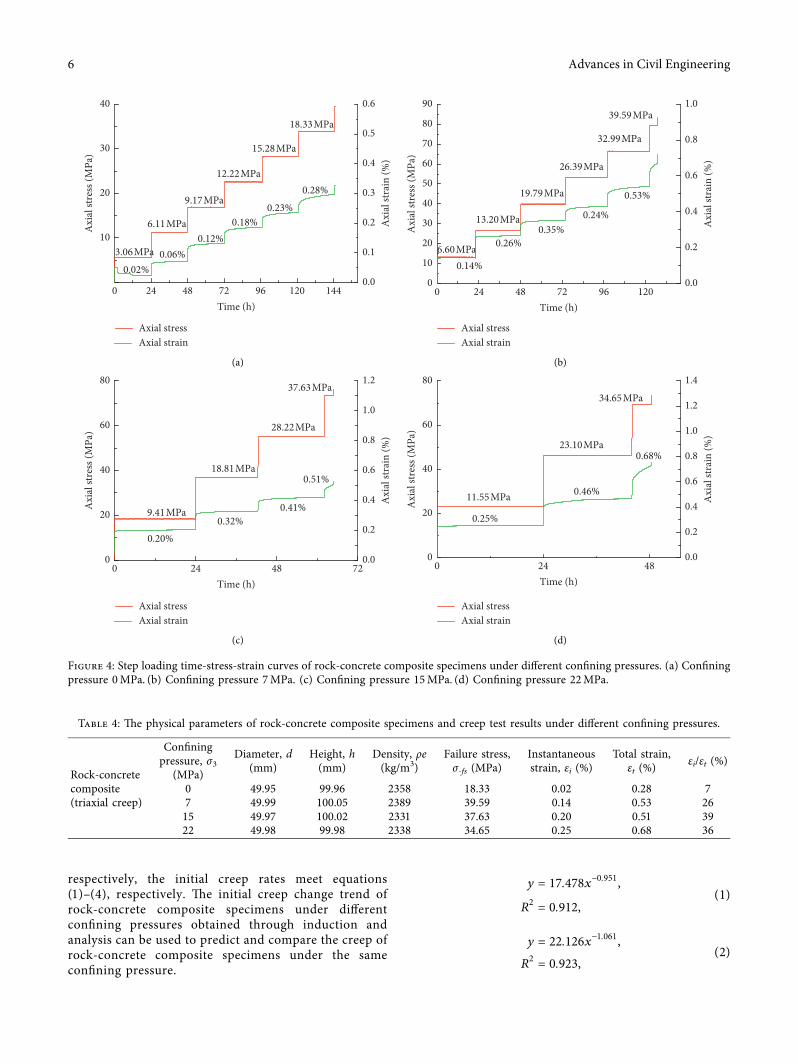
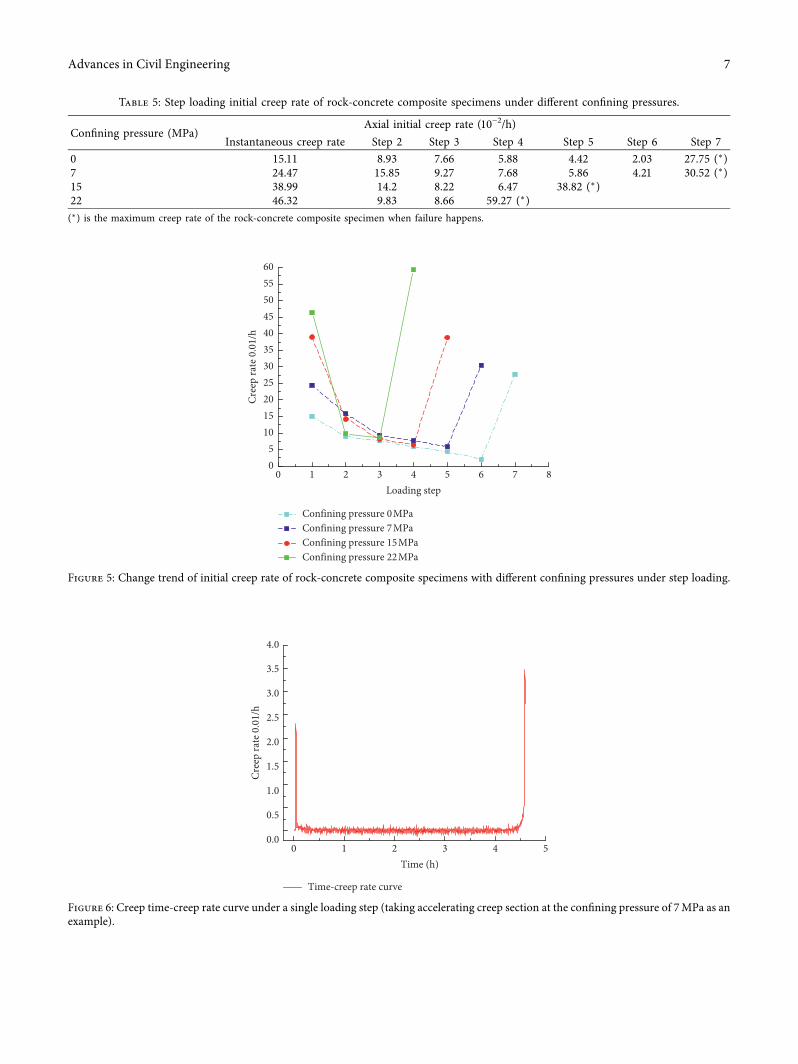
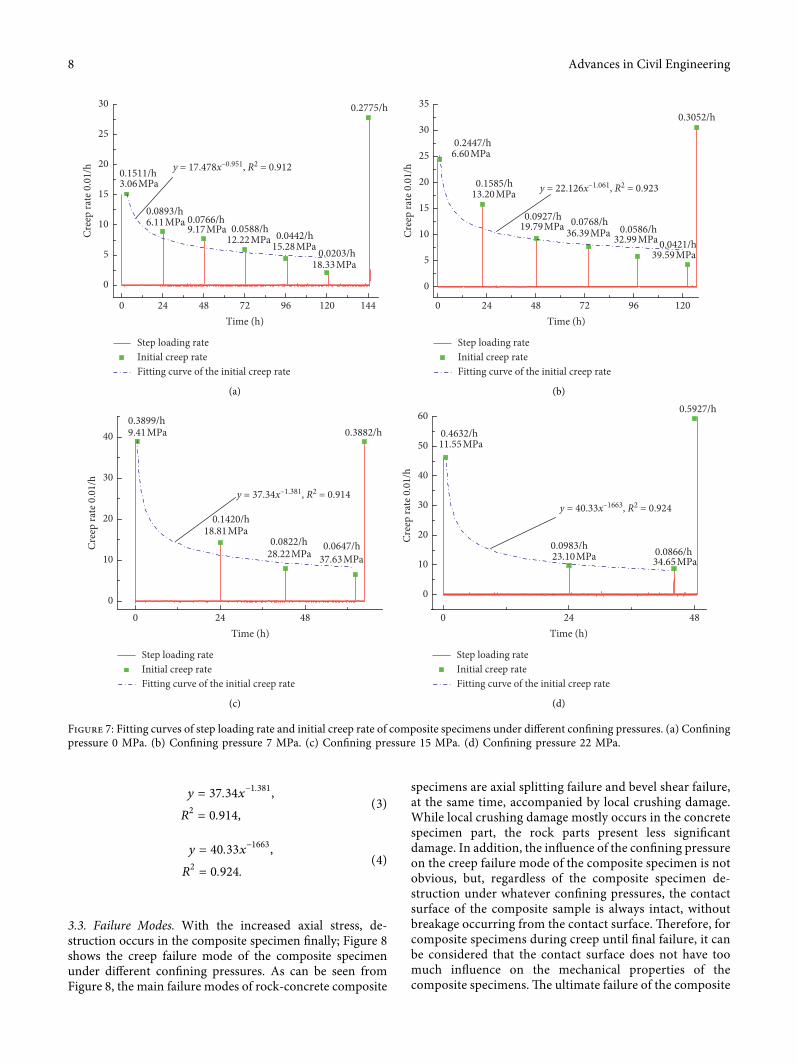
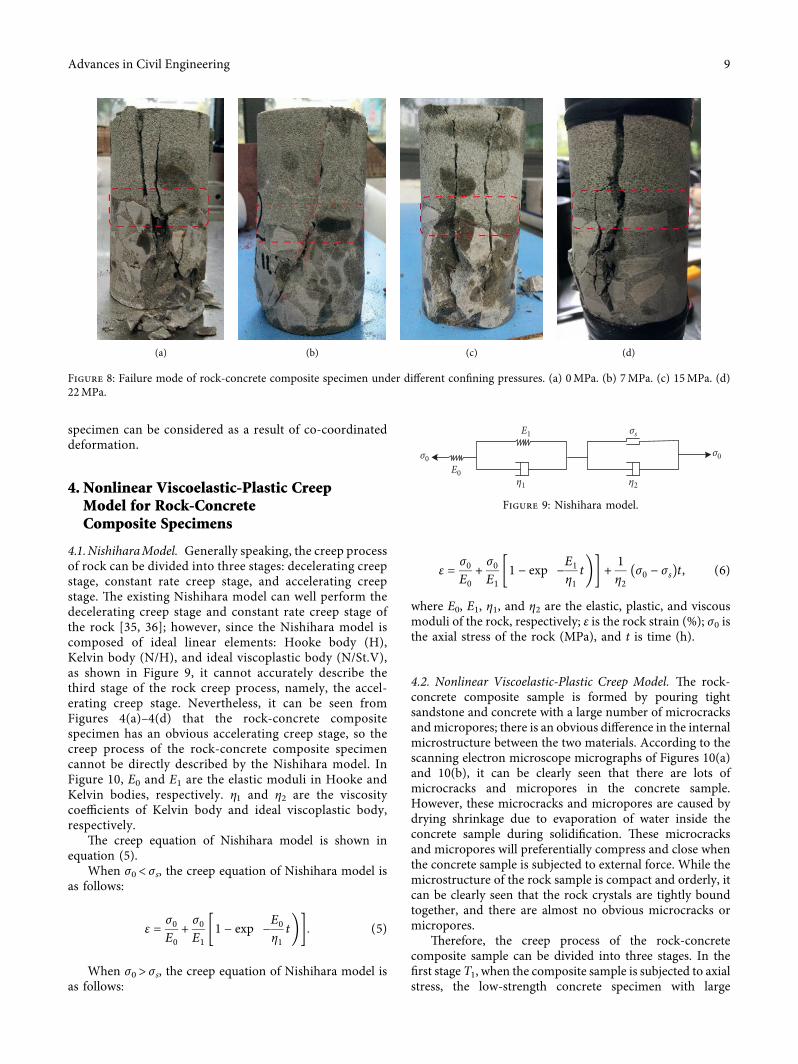
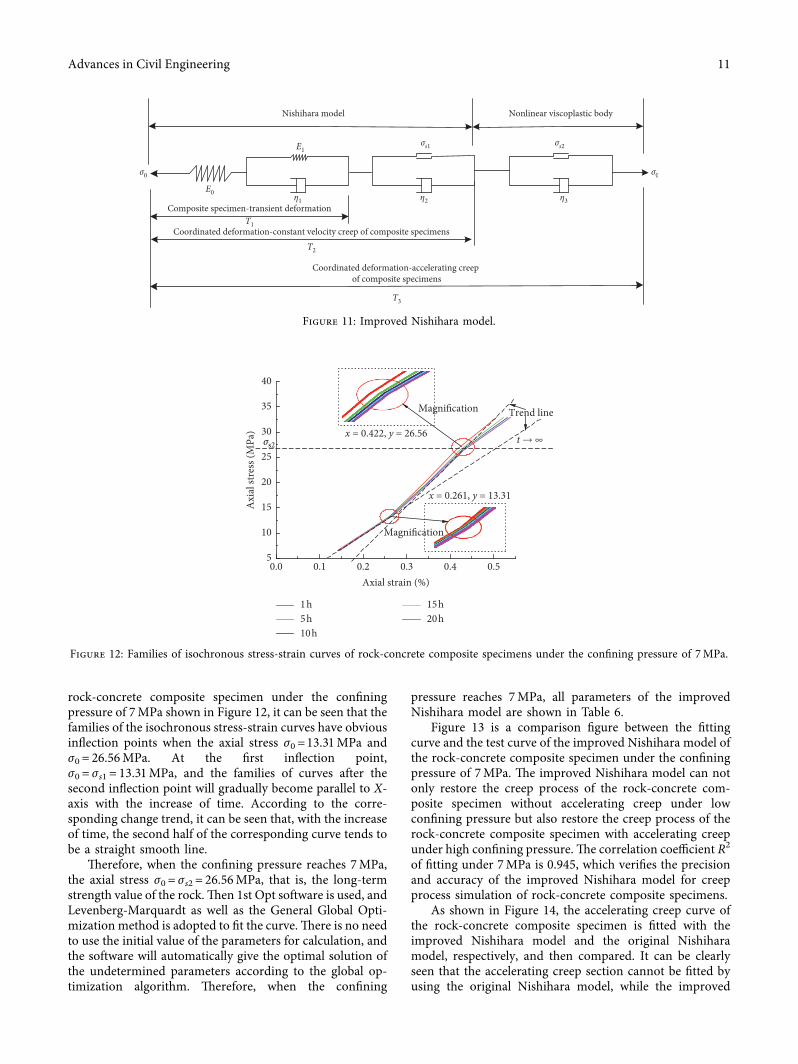
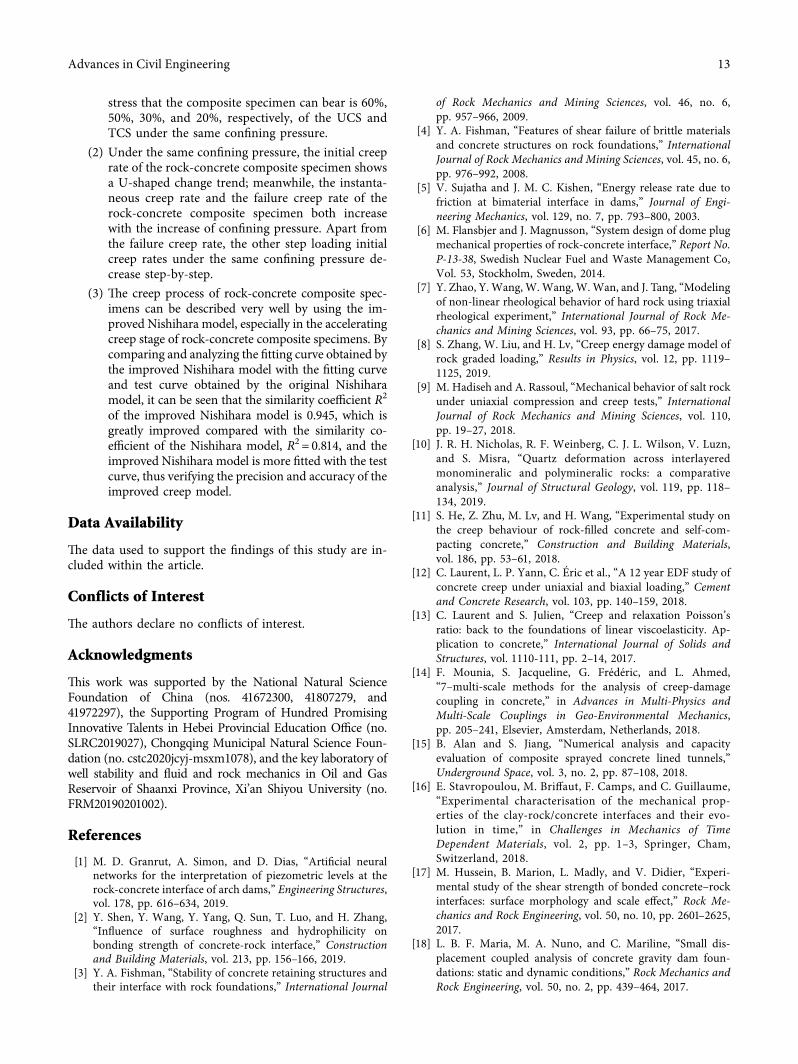
