Noninvasive Estimation of the Instantaneous Derivative...
11
2101 Noninvasive Estimation of the Instantaneous First Derivative of Left Ventricular Pressure Using Continuous-Wave Doppler Echocardiography Chunguang Chen, MD; Leonardo Rodriguez, MD; J. Luis Guerrero, BS; Shane Marshall, MD; Robert A. Levine, MD; Arthur E. Weyman, MD; and James D. Thomas, MD Background. The complete continuous-wave Doppler mitral regurgitant velocity curve should allow reconstruction of the ventriculoatrial (VA) pressure gradient from mitral valve closure to opening, including left ventricular (LV) isovolumic contraction, ejection, and isovolumic relaxation. Assuming that the left atrial pressure fluctuation is relatively minor in comparison with the corresponding LV pressure changes during systole, the first derivative of the Doppler-derived VA pressure gradient curve (Doppler dP/dt) might be used to estimate the LV dP/dt curve, previously measurable only at catheterization (catheter dP/dt). Methods and Results. This hypothesis was examined in an in vivo mitral regurgitant model during 30 hemodynamic stages in eight dogs. Contractility and relaxation were altered by inotropic stimulation and hypothermia. The Doppler mitral regurgitant velocity spectrum was recorded along with simultaneously acquired micromanometer LV and left atrial pressures. The regurgitant velocity profiles were digitized and converted to VA pressure gradient curves using the simplified Bernoulli equation. The instantaneous dP/dt of the VA pressure gradient curve was then derived. The instantaneous Doppler-derived VA pressure gradients, instantaneous Doppler dP/dt, dP/dtmax, and -dP/dt.. were compared with corresponding catheter measurements. This method of estimating dP/dt.., from the instantaneous dP/dt curve was also compared with a previously proposed Doppler method of estimating dP/dt,. using the Doppler-derived mean rate of LV pressure rise over the time period between velocities of 1 and 3 m/sec on the ascending slope of the Doppler velocity spectrum. Both instantaneous Doppler-derived VA pressure gradients (r=0.95, p<O.OOOl) and Doppler dP/dt (r=0.92, p<0.0001) correlated well with corresponding measure- ments by catheter during systolic contraction and isovolumic relaxation (pooled data). The Doppler dP/dtmax (1,266±701 mm Hg/sec) also correlated well (r=0.94) with the catheter dP/dtm,. (1,200±573 mm Hg/sec). There was no difference between the two methods for measurement of dP/dt.. (p=NS). Although Doppler -dP/dt. was slightly lower than the catheter measurement (961±511 versus 1,057540 mm Hg/sec, p<0.01), the correlation between measurements by Doppler and catheter was excellent (r=0.93,p<0.0001). The alternative method of mean isovolumic pressure rise (896±465 mm Hg/sec) underestimated the catheter dP/dt,.,, (1,200±573 mm Hg/sec) significantly (on average, 25%; p<O.001). Conclusions. The present study demonstrated an accurate and reliable noninvasive Doppler method for estimating instantaneous LV dP/dt, dP/dtma, and -dP/dtmax. (Circulation 1991; 83:2101-2110) r3Nhe changing rate of left ventricular pressure dtm.) function.' Conventionally, dP/dt is derived (dP/dt) during the cardiac cycle is an impor- from the left ventricular (LV) pressure curve ob- _L_ tant parameter in the assessment of myocar- tained at cardiac catheterization using micromanom- dial systolic (e.g., dP/dtm~,,) and diastolic (e.g., -dP/ eter catheter recording. From the Non-Invasive Cardiac Laboratory, Massachusetts Heart Association (J.D.T.), Massachusetts Affiliate, Needham, Mass. General Hospital, Harvard Medical School, Boston, Mass. J.D.T. is supported by the Bayer Fund for Cardiovascular Research. Supported in part by grant HL-38176 from the National Institutes Address for correspondence: James D. Thomas, MD, Zero of Health, Bethesda, Md.; a grant from the Whitaker Foundation Emerson Place, 2F, Boston, MA 02114. (R.A.L.), Camp Hill, Pa.; and grant 13-532-867 from the American Received May 18, 1990; revision accepted January 29, 1991. by guest on June 7, 2018 http://circ.ahajournals.org/ Downloaded from
Transcript of Noninvasive Estimation of the Instantaneous Derivative...

2101
Noninvasive Estimation of the InstantaneousFirst Derivative of Left VentricularPressure Using Continuous-Wave
Doppler EchocardiographyChunguang Chen, MD; Leonardo Rodriguez, MD; J. Luis Guerrero, BS; Shane Marshall, MD;
Robert A. Levine, MD; Arthur E. Weyman, MD; and James D. Thomas, MD
Background. The complete continuous-wave Doppler mitral regurgitant velocity curve shouldallow reconstruction of the ventriculoatrial (VA) pressure gradient from mitral valve closure toopening, including left ventricular (LV) isovolumic contraction, ejection, and isovolumicrelaxation. Assuming that the left atrial pressure fluctuation is relatively minor in comparisonwith the corresponding LV pressure changes during systole, the first derivative of theDoppler-derived VA pressure gradient curve (Doppler dP/dt) might be used to estimate the LVdP/dt curve, previously measurable only at catheterization (catheter dP/dt).Methods and Results. This hypothesis was examined in an in vivo mitral regurgitant model during
30 hemodynamic stages in eight dogs. Contractility and relaxation were altered by inotropicstimulation and hypothermia. The Doppler mitral regurgitant velocity spectrum was recordedalong with simultaneously acquired micromanometer LV and left atrial pressures. The regurgitantvelocity profiles were digitized and converted to VA pressure gradient curves using the simplifiedBernoulli equation. The instantaneous dP/dt of the VA pressure gradient curve was then derived.The instantaneous Doppler-derived VA pressure gradients, instantaneous Doppler dP/dt, dP/dtmax,and -dP/dt.. were compared with corresponding catheter measurements. This method ofestimating dP/dt.., from the instantaneous dP/dt curve was also compared with a previouslyproposed Doppler method of estimating dP/dt,. using the Doppler-derived mean rate of LVpressure rise over the time period between velocities of 1 and 3 m/sec on the ascending slope of theDoppler velocity spectrum. Both instantaneous Doppler-derived VA pressure gradients (r=0.95,p<O.OOOl) and Doppler dP/dt (r=0.92, p<0.0001) correlated well with corresponding measure-ments by catheter during systolic contraction and isovolumic relaxation (pooled data). The DopplerdP/dtmax (1,266±701 mm Hg/sec) also correlated well (r=0.94) with the catheter dP/dtm,.(1,200±573 mm Hg/sec). There was no difference between the two methods for measurement ofdP/dt.. (p=NS). Although Doppler -dP/dt. was slightly lower than the catheter measurement(961±511 versus 1,057540 mm Hg/sec, p<0.01), the correlation between measurements byDoppler and catheter was excellent (r=0.93,p<0.0001). The alternative method ofmean isovolumicpressure rise (896±465 mm Hg/sec) underestimated the catheter dP/dt,.,, (1,200±573 mm Hg/sec)significantly (on average, 25%; p<O.001).
Conclusions. The present study demonstrated an accurate and reliable noninvasive Dopplermethod for estimating instantaneous LV dP/dt, dP/dtma, and -dP/dtmax. (Circulation 1991;83:2101-2110)
r3Nhe changing rate of left ventricular pressure dtm.) function.' Conventionally, dP/dt is derived(dP/dt) during the cardiac cycle is an impor- from the left ventricular (LV) pressure curve ob-
_L_ tant parameter in the assessment of myocar- tained at cardiac catheterization using micromanom-dial systolic (e.g., dP/dtm~,,) and diastolic (e.g., -dP/ eter catheter recording.
From the Non-Invasive Cardiac Laboratory, Massachusetts Heart Association (J.D.T.), Massachusetts Affiliate, Needham, Mass.General Hospital, Harvard Medical School, Boston, Mass. J.D.T. is supported by the Bayer Fund for Cardiovascular Research.
Supported in part by grant HL-38176 from the National Institutes Address for correspondence: James D. Thomas, MD, Zeroof Health, Bethesda, Md.; a grant from the Whitaker Foundation Emerson Place, 2F, Boston, MA 02114.(R.A.L.), Camp Hill, Pa.; and grant 13-532-867 from the American Received May 18, 1990; revision accepted January 29, 1991.
by guest on June 7, 2018http://circ.ahajournals.org/
Dow
nloaded from

2102 Circulation Vol 83, No 6 June 1991
Mitral regurgitation is commonly found in patientswith a variety of cardiac conditions.2-10 Continuous-wave Doppler echocardiography is able to record thecomplete velocity spectrum of regurgitant flowthrough the mitral valve during systole and isovolu-mic diastole. By using the simplified Bernoulli equa-tion, the continuous-wave Doppler mitral regurgitant
See p 2141
velocity curve can be converted to a pressure gradientcurve.11'12 Therefore, it follows that, by using thecomplete mitral regurgitant velocity profile duringsystole and isovolumic relaxation, it should be possi-ble to reconstruct a left ventriculoatrial pressuregradient curve and to derive dP/dt from the recon-structed pressure curve. If the left atrial (LA) pres-sure were constant during systole, the first derivativeof the left ventriculoatrial pressure gradient curvewould be identical to that of the LV pressure curve.Unfortunately, there is always a V wave of varyingamplitude on the LA pressure tracing during systole.But if the LA pressure fluctuation is relatively minorin comparison with corresponding LV pressurechanges during systole, this fluctuation should notresult in a significant difference between the firstderivative of the left ventriculoatrial pressure gradi-ent curve and that of the LV pressure curve. Underthese conditions, we can hypothesize that the Dopp-ler-derived instantaneous dP/dt determined fromventriculoatrial gradients could be used to estimatetrue LV instantaneous dP/dt. From the Doppler-derived dP/dt curve it should be possible to obtaindP/dtmax, -dP/dtma, and other early systolic parame-ters, such as dP/dt corrected by developed pressureor instantaneous LV pressure.' Thus, noninvasiveDoppler assessment of LV dP/dt would be an attrac-tive clinical and research tool.
Recent studies2-5 have attempted to assess LVdP/dtmax noninvasively using Doppler echocardiogra-phy. It has been demonstrated that the mean rate ofDoppler-derived LV pressure rise (RPR) duringearly systole (determined by the 1- and 3-m/secvelocity points on the rising segment of the continu-ous-wave mitral regurgitation velocity curve) corre-lated well with peak dP/dt obtained from LV pres-sure curves at catheterization.2-5 However, becausethis method uses an average slope, it may underesti-mate the true peak dP/dt.To explore the possibility of noninvasive assess-
ment of instantaneous LV dP/dt by Doppler echocar-diography, we conducted an in vivo study using acanine model of mitral regurgitation to examine 1)the accuracy of the pressure gradient curve derivedfrom continuous-wave Doppler mitral regurgitantvelocity as compared with micromanometer cathetermeasurements and 2) the reliability of estimation ofthe first derivative of the LV pressure curve by thefirst derivative of the left ventriculoatrial pressuregradient curve using continuous-wave Doppler mitralregurgitant velocity curves.
MethodsAnimal Preparation
The study conformed to the guiding principles ofthe American Heart Association guidelines for ani-mal research. Eight adult dogs (25-34 kg) wereanesthetized with 30 mg/kg i.v. sodium pentobar-bital, intubated, and ventilated with a respirator(Harvard Apparatus, South Natick, Mass.). The con-centration of inspired oxygen and the ventilation ratewere adjusted to keep blood gases within the physi-ological range.A left thoracotomy was performed with the dog
supine. The pericardium was left open throughoutthe experiment. The pressure catheters were insertedin the following manner: a micromanometer-tippedcatheter (Millar Mikro-tip, Millar Instruments,Houston) and a fluid-filled catheter connected to apressure transducer (Statham P23DB, Statham In-struments, Oxnard, Calif.) were inserted through theLV apex to record LV pressure. A second microma-nometer-tipped catheter was inserted from a pulmo-nary vein into the LA to record LA pressure. A thirdmicromanometer-tipped catheter was inserted fromthe internal mammary artery into the aortic root torecord aortic pressure.
Great care was taken to ensure the accuracy of thepressure measurements. Fluid-filled transducerswere balanced at atmospheric pressure and cali-brated against a mercury column. Micromanometer-tipped catheters were calibrated against the zero andmean pressures recorded by the fluid-filled transduc-ers. All pressure measurements and a single electro-cardiographic lead were continuously recorded on aneight-channel strip-chart recorder (model 7700,Hewlett-Packard Co., Waltham, Mass.). Paper speedwas increased to 100 mm/sec when data for eachexperimental stage were formally recorded.The dogs were placed on right heart bypass. All
venous return was drained from the superior andinferior venae cavae and coronary sinus. The venousblood was filtered, warmed and oxygenated, and thenpumped by calibrated roller pump back into the dogthrough a wide-bore cannula inserted into the rightatrium. With a second calibrated roller pump, bloodcould also be pumped into or removed from thesystemic arterial circuit through cannulas insertedinto the femoral arteries. This maneuver allowed LVsystolic pressure, used as an index of afterload, to becontrolled independent of preload.13To create mitral regurgitation, a grommet with a
2.8-4.5-mm diameter was inserted into the anteriormitral leaflet. The peak mitral regurgitant flow rate,calculated as the product of effective orifice area andpeak velocity, varied from 21.5 to 87.5 ml/sec(41.8±+ 18.2 ml/sec). The effective orifice areas weredetermined individually in an in vitro model as theratio of flow rate and peak orifice velocity. For thegrommets studied, the coefficient of contraction (ra-tio of effective to anatomic orifice area) rangedbetween 0.68 and 0.75.
by guest on June 7, 2018http://circ.ahajournals.org/
Dow
nloaded from
Chen et al Noninvasive Assessment of dP/dt 2103
A Pressure gradient fmmHg) by Doppler
120
100 -
60
40
20
0 50 WO 060 200 250 300 360Time from beginning of ORS (ins)
Idpdx1O (mmHg/s) by Doppler
0 50 10 1tL0 50 30 "
T1:0rombeginning of QAS t'msT
10pressure gradient (mmHg) by CatheterB14
120
100
s0Pressure (mmHg) 60
14040
120 20
100 -LV-20
0 50 _00 060 200 260 300 360so Time from beginning of ORS (ms)
0 - ^dp/dt x fO3mmHg/s by Catheter
40-
LAP
20
0 i 1i '1: ;,0,
0 60 100 150 200 250 300 350 6
Time from beginning of OHS (ins)
0 60 100 060 200 250 300 350Time from beginning of QRS (ins)
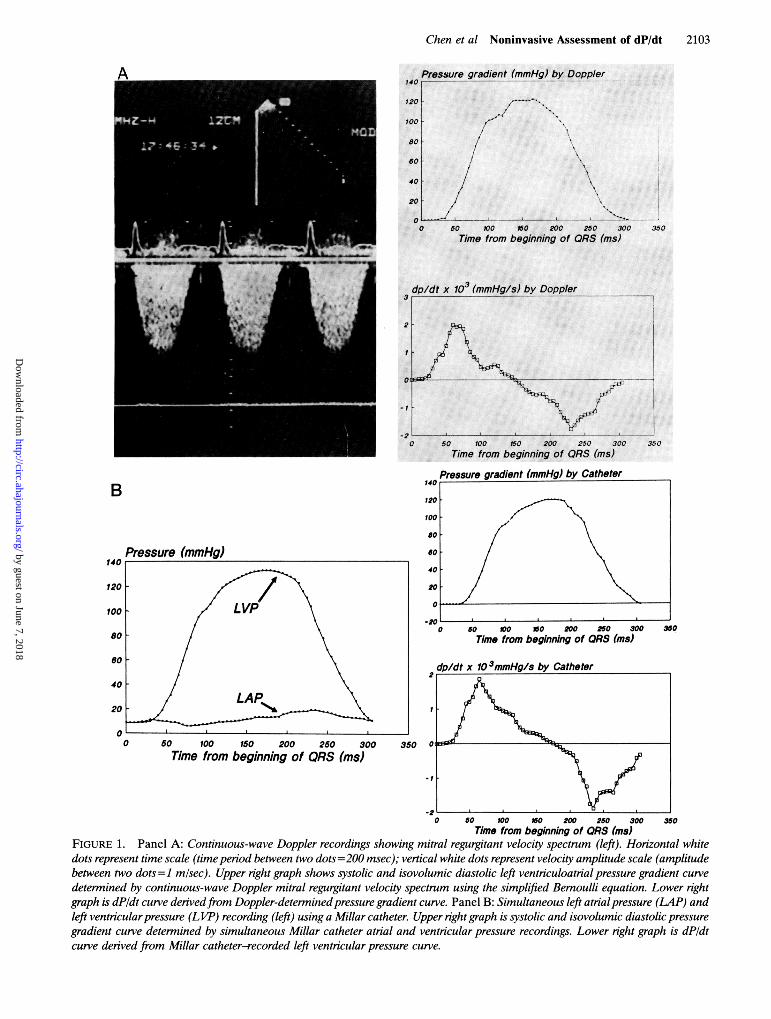
FIGURE 1. Panel A: Continuous-wave Doppler recordings showing mitral regurgitant velocity spectrum (left). Horizontal whitedots represent time scale (time period between two dots = 200 msec); vertical white dots represent velocity amplitude scale (amplitudebetween two dots=1 misec). Upper right graph shows systolic and isovolumic diastolic left ventriculoatrial pressure gradient curvedetermined by continuous-wave Doppler mitral regurgitant velocity spectrum using the simplified Bernoulli equation. Lower rightgraph is dP/dt curve derivedfrom Doppler-determined pressure gradient curve. Panel B: Simultaneous left atrial pressure (LAP) andleft ventricularpressure (LVIP) recording (left) using a Millar catheter. Upper right graph is systolic and isovolumic diastolic pressuregradient curve determined by simultaneous Millar catheter atrial and ventricular pressure recordings. Lower right graph is dPldtcurve derived fr-om Millar catheter-recorded left ventricular pressure curve.
by guest on June 7, 2018http://circ.ahajournals.org/
Dow
nloaded from

2104 Circulation Vol 83, No 6 June 1991
FIGURE 2. Graph comparingDoppler-denived left ventriculo-atrial pressure gradient curve(CW Doppler) with gradientcurve derived from Millar cathe-ter-recorded simultaneous leftatrial and ventricular pressures.
100 200 300 400 500
Time from beginning of QRS (ms)600
To simulate chronic mitral regurgitation, the LAwas enlarged by attaching a skin graft or prosthesis tothe posterior wall of the atrium in five dogs. Thisallowed a less dramatic elevation in LA pressureduring systole, thereby simulating LA pressure fluc-tuations seen in chronic mitral regurgitation. In twodogs, acute mitral regurgitation was simulated by notsurgically enlarging the LA, thereby allowing a more
prominent rise (V wave) in LA pressure duringsystole. In the eighth dog, the LA was not enlarged atthe first stage but was enlarged at subsequent stages.
Experimental ProtocolIn the first phase of the experiment, arterial pres-
sure was altered by manipulating roller pump flowinto or out of the femoral artery. By use of thismaneuver, systolic arterial pressure ranged from 65to 145 mm Hg. In the second stage of the experiment,intravenous calcium (1 g) or propranolol (5 mg) was
used to alter systolic and diastolic function. Finally,hypothermia was induced by cooling blood throughthe bypass, thereby allowing more dramatic alter-ations in diastolic (-dP/dtmax) and systolic (dP/dtmax)function.14 A total of 30 hemodynamic stages was
obtained in the eight dogs. In each experimentalstage, the Doppler velocity profile, electrocardio-gram, and LA, LV, and aortic pressures were re-
corded simultaneously.
Doppler EchocardiographyFor echocardiographic examination, the heart was
stabilized in a pericardial cradle. Two-dimensional,continuous-wave color Doppler echocardiographicdata were acquired using a Hewlett-Packard 72020ultrasound imaging system. The mitral regurgitantvelocity curves were obtained either using an apicalapproach (three dogs) or an LA site (five dogs). In
each case, the continuous-wave Doppler ultrasoundbeam was aligned as parallel as possible to the colorDoppler mitral regurgitant jets, or if a blind contin-uous-wave Doppler transducer was used, then themaximal and most clearly delineated velocity enve-lopes were recorded. All two-dimensional imagesand Doppler spectral velocity profiles were recordedat a speed of 100 mm/sec on 1/2-in. videotape forfurther analysis.
Data AnalysisThe continuous-wave Doppler mitral regurgitant
profile was traced manually beginning at the initialpart of the QRS wave and ending at the zerocrossover point and digitized at 5-msec intervalsusing a Bitpad (Summagraphics Corp., Seymour,Conn.) interfaced with a customized software writtenfor the ASYST programming environment (Macmillan,Inc., New York). The instantaneous pressure dropbetween the LV and LA was calculated from themodified Bernoulli equation: Ap=4v2, where Ap isthe pressure gradient (in millimeters mercury) and v
is the instantaneous regurgitant jet velocity (inmeters per second). The pressure gradient curve wasthen reconstructed for each traced cardiac beat (Fig-ure 1A). The instantaneous LV dP/dt throughoutsystole and early diastole (isovolumic relaxation pe-riod) was determined from this reconstructed pres-sure curve by differentiating the data at 5-msecintervals (Figure lA).' dP/dtmx, and -dP/dtm, werethen obtained. For comparison purposes, RPR in theLV during early systole was also calculated using twopoints on the initial ascending segment of the con-tinuous-wave mitral regurgitant velocity curve asproposed by Bargiggia et al.2 The first point wasselected at 1 m/sec=4 mm Hg, and the second pointwas selected at 3 m/sec=36 mm Hg; the time interval
Pressure gradients (mmHg)Millar Catheter80
60
40
20
-200
by guest on June 7, 2018http://circ.ahajournals.org/
Dow
nloaded from

Chen et al Noninvasive Assessment of dP/dt 2105
0 100 200 300 400 500 600
Time from beginning of QRS (ms)
(St) between these two points was measured. TheRPR was calculated as 32 mm Hg/8t.2
Simultaneous Millar catheter-recorded LA andLV pressures were similarly traced and digitized at5-msec intervals beginning at the initial part of theQRS wave and ending at the LA and LV pressurecrossover (Figure 1B). The instantaneous left ventric-uloatrial pressure gradient was calculated from thedigitized LV and LA pressure curves, and the instan-taneous LV dP/dt was determined from the LV pres-sure curve (Figure 1B). dP/dtm. at the early systolicphase and -dP/dtmi,, at the early diastolic phase were
obtained from the instantaneous dP/dt curve. For eachhemodynamic stage, the velocity and pressure datafrom three cardiac cycles were analyzed, and the valueswere averaged for further comparison.
Variability StudyTo determine intraobserver variability, a single
cardiac beat was chosen for examination from each of10 hemodynamic stages. For each beat, the Doppler-derived and Millar catheter-derived instantaneouspressure gradients and the instantaneous dP/dt weremeasured by one examiner (C.C.) on two separatedays and then paired for statistical comparison. Thecorrelation coefficient of linear regression analysisbetween the two measurements was 0.96+0.02 forinstantaneous pressure gradients (10 separate corre-
lations,p<0.0001 for all cases), 0.94±0.03 for instan-taneous dP/dt (10 separate correlations, p<0.0001for all cases), 0.93 for dP/dtmax (p<0.0001), and 0.92for the -dP/dtmax (P<0.0001).
Statistical AnalysisData are expressed as mean+SD. In each case, the
Doppler-derived instantaneous pressure gradients
and the instantaneous dP/dt were correlated withtemporally corresponding Millar measurements usinglinear regression analysis. Comparisons of dP/dt,axand -dP/dtmax between Doppler measurements andcatheterization measurements were performed usingunivariate linear regression analysis and paired Stu-dent's t test. If there was a significant differencebetween the two measurement approaches, peak LVpressure, peak systolic (V wave) LA pressure, anddP/dtmax determined from Millar catheter recordingswere correlated to this difference to examine thepossible factors affecting the accuracy of Dopplermeasurement of dP/dt. The comparative accuracy withwhich Doppler-derived instantaneous dP/dtma,x andmean RPR predicted the Millar catheter-derivedpeak dP/dt was tested by analysis of covariance. Inaddition, the relative accuracy of the mean and instan-taneous estimates of peak dP/dt were assessed by themethod of Bland and Altman.'5 For this approach, thedifference between the Doppler and hemodynamicmeasurements of dP/dt were plotted against the he-modynamic measurement. Mean±SD of this error
were compared for the two Doppler methods.
ResultsPressure Gradients Between Left Ventricle and AtriumThe peak LV pressure recorded by Millar catheter
was 105 +28 (62-141) mm Hg. The mean LA pressurewas 13+6 (6-30) mm Hg with a peak systolic (V wave)LA pressure of 17±9 (9-35) mm Hg. The calculatedpeak pressure drop between LV and LA was 89±+19(53-128) mm Hg from Millar catheter recordings.The instantaneous Millar catheter-derived pressure
gradients between LA and LV correlated well(r=0.91-0.97) with instantaneous continuous-wave
dp/dt (mmHg/s)1500
1000
500
O
-500
- 1000
Millar Catheter
1k/
FIGURE 3. Graph comparingdP/dt curve determined byDoppler mitral regurgitant veloc-ity spectrum (CW Doppler) withdP/dt curve derived from Millarcatheter-recorded left ventricu-lar pressure curve.
by guest on June 7, 2018http://circ.ahajournals.org/
Dow
nloaded from

2106 Circulation Vol 83, No 6 June 1991
4000
3500
3000
2500
2000
1500
1000
500
0
Maximal dp/dt (mmHg/s) by Doppler
* Doppler Max dD/dty 1.18x - 153r - 0.97p ' 0.00001 0STD - 138
O1Doppler Mea,y - 0.77x - 2r - 0.94p .00001
0 500 1000 1500 2000 2500Maximal dp/dt (mmHg/s) by Catheter
Doppler-derived pressure gradients for each case(Figure 2). For pooled data, the correlations betweenDoppler- and catheter-derived pressure gradientswere excellent, with a correlation coefficient of 0.95(p<0.OOOl) and slope of 0.92. The intercept of theregression line was not different from zero (p=NS).Although Doppler-derived mean pressure gradients(67±16 mmHg) tended to be smaller than Millarcatheter-derived mean gradients (69+14 mm Hg),this difference was not statistically significant (p=NS).
Instantaneous Left Ventricular dP/dtSimultaneously recorded Millar catheter-derived
dP/dt and continuous Doppler-derived dP/dt werecorrelated for each case (Figure 3). The correlationcoefficient varied from 0.85 to 0.98 (0.92+0.038), andthe slope of the regression line ranged from 0.87 to1.20 (1.01±0.11). The intercept of the regression line(-14 -13) was not significantly different from zero(p=NS). For pooled data, the correlation betweenDoppler- and catheter-derived dP/dt was similarlyexcellent (r=0.92, p<0.0001) with a slope of 0.93.The intercept was not significantly different fromzero. The values of dP/dt from pooled data for allcases were not different for Doppler and cathetermeasurement (p=NS). To test whether higher LApressure would affect the accuracy of the measure-ments, the data were divided into two groups. Group1 consisted of nine hemodynamic stages in which themean LA pressure was less than 13 mm Hg, andgroup 2 consisted of hemodynamic stages in whichthe LA pressure was 13 mm Hg or greater. Nodifference was found in the correlation coefficientsbetween group 1 and group 2 (0.92±0.04 versus0.93 ± 0.03, p=NS), suggesting that Doppler-deriveddP/dt is not significantly affected by a mean LApressure ranging from 6 to 30 mm Hg.
FIGURE 4. Graph showing correla-tion between dP/dtma,x determined by theDoppler method and dP/dt,,,. derivedfrom Millar catheter pressure recording(filled circles). Also shown for compar-ison is the relation between Millarcatheter-measured dPIdtmax and Dopp-ler-determined mean rate ofleft ventric-uloatrial pressure gradient rise (RPR)during early systole at time period be-tween regurgitant velocity of 1 and 3m/sec (open squares). Note that slope(0. 77) of regression line for mean RPR
In RPF? is reduced in comparison with line of7.5 identity (dashed line), indicating un-
derestimation of Millar catheter-mea-sured dP/dtma,r by mean RPR. In con-trast, regression line for Doppler-
3000 derived dP/dtmax was not different fromthe line of identity. STD=standard de-viation of the regression.
Maximal dP/dtdP/dtmax in early systole was 1,200±+573 (447-2,935)
mm Hg/sec for Millar measurements and 1,266+701(415-3,231) mm Hg/sec for Doppler-derived mea-surements (p=NS). The correlation between bothmethods was strong, with an r value of 0.97 (Figure 4,filled circles; p<0.001). The regression line is notdifferent from the line of identity.
Mean Early Systolic Changing Rate ofVentricular PressureWe compared the relative accuracy of our Dopp-
ler-derived method of measuring dP/dtm, to theearlier method of estimating dP/dtma by the meanrate of pressure rise2 using the arbitrarily selectedtime period between 1 and 3 m/sec of the regurgitantvelocity profile; these two methods were comparedwith the Millar catheter-derived dP/dtma,, (Figure 4).The mean RPR correlated well (r=0.94, p<0.001)with the catheter-derived dP/dtma,, (Figure 4, opensquares). However, the slope of the regression linewas significantly different from the slope achieved byour Doppler method when compared against cathe-ter-derived dP/dtm.a, (1.18 versus 0.77, p<0.01). Themean early systolic RPR (896+465 [320-2,133]mm Hg/sec) was found to significantly underestimatedP/dtmax measured by Millar catheter (1,200+573mm Hg/sec, p<0.01). The difference between dP/dtmax and mean RPR correlated significantly withpeak systolic pressure (r=0.48, p<0.01) and withdP/dtm,, (r=0.67, p<0.001). For all the stages, theaortic diastolic pressure was more than 36 mm Hgabove the LA pressure. Thus, the mean RPR datacorresponded in all cases to ventricular pressure riseoccurring before aortic valve opening.
Figure 5 displays the discrepancy between theDoppler and hemodynamic measurements of peakdP/dt for the instantaneous Doppler method (panel
by guest on June 7, 2018http://circ.ahajournals.org/
Dow
nloaded from

1Ch-en et al Noninvasive Assessment of dP/dt 2107
Error:. Instantaneous method A
4.
A
-2e
-4t
-6C
-Be
)00
'00
)00
0 500 1000 1500 2000 2500 3000
True dp/dt ImmHglsec/
Error:. Mean RPR method
-Q 03
Cl 0]1ol
03
.0 500 1000 1500 2000 2500 3000
True dp/dt ImmHglseclFIGURE 5. Graphs showing accuracy and variability of the instantaneous (panel A) and mean rate ofpressure rise (RPR, panel
B) Doppler methods for estimatingpeak dPldt. In each graph, the true (hemodynamic) peak dPldt is plotted along the abscissa with
the difference between the Doppler and hemodynamic estimates (Doppler minus hemodynamic) plotted along the ordinate; mean
error is shown by heavy line, and 95% confidence interval is shown by dashed line. There is a significant negative bias in the mean
RPR data, with slightly more variability.
A) and the mean method (panel B). Shown on each
graph are the average error and the 95% confidence
intervals. On average, the instantaneous method
overestimated the true (hemodynamic) dP/dt by 59.3
mm Hg/sec, with a standard deviation (variability) of
±+-185.8 mm Hg/sec. The average error was not sta-
tistically different from zero. By contrast, the two-
point estimation significantly underestimated true
peak dP/dt by 303.1 mm Hg/sec (p<0.OOOOl) with a
standard deviation of ±+ 196.6 mm Hg/sec.
Maximal Negative dP/dt
Doppler-derived and Millar catheter-derived mea-
surements of -dP/dtmax correlated well (r=0.93,
p<0.001), as shown in Figure 6. -dP/dtmax derived
from Doppler velocity profiles (961±t511 [252-2,2721mm Hg/sec) was slightly (mean, -95.4± 193.1
mm Hg/sec; an average of 8.5% of the true value) but
significantly (p <0.02) lower than that obtained by
Millar catheter measurements (1,057±t540 [245-2,369] mm Hg/sec) (p<0.01). The difference be-
tween dP/dtmax measured by Doppler and that
measured by Millar catheter tended to correlate with
peak systolic (V wave) LA pressure (r=0.35) but did
not reach statistical significance (p =0.07).
Discussion
The present study demonstrates that Doppler-deter-mined instantaneous left ventriculoatrial pressure gra-
dients correlate well with simultaneous Millar cathe-
ter-measured gradients. More importantly, the first
derivative of the Doppler-derived pressure gradientcurve could also be used to reliably estimate the first
derivative of the LV pressure curve during systole and
early isovolumic diastole, as determined by Millar cath-
eter recordings. This has important clinical and re-
search applications, because the instantaneous dP/dt
curve permits accurate noninvasive determination of
FIGURE 6. Graph showing correlation be-
tween -dPIdtn,, determined by the Doppler
method and dPIdtn,,, derived fr-om the Millar
catheter pressure recording. STD=standard de-
viation of regression.
0 - 500 - 1000 -1500 - 2000 - 2500
Catheter Maximal Negative dp/dt (mmHgls)
Botflfl- L
40
20
-20
-40
-60
-80
-10o0
BJLI -
C0 -0 Ela& 0 -1
o
- 7uuu,
by guest on June 7, 2018http://circ.ahajournals.org/
Dow
nloaded from

2108 Circulation Vol 83, No 6 June 1991
systolic (dP/dtma) and diastolic (-dP/dt..) parametersof LV function. Although our results confirmed previ-ous reports2-5 of good correlation between Doppler-derived mean rate of early systolic LV pressure rise(RPR) and the true dP/dtm,, by Millar catheter, themean RPR underestimated the true dP/dt.,a, signifi-cantly (p<0.01).Accuracy and Feasibility ofMeasurements ofSystolic Ventriculoatrial Pressure Gradientsby Continuous-Wave Doppler MitralRegurgitant Velocity Spectrum
Using the simplified Bernoulli equation, the pres-sure gradient between two cardiac chambers can bederived from the velocity of blood flow across thesechambers by Doppler echocardiography. The clinicalaccuracy and reliability of the Doppler determinationof pressure gradients across stenotic lesions, such asaortic, pulmonary, and mitral stenoses, have beenrepeatedly demonstrated.11"16-19 Continuous-waveDoppler echocardiography is also an accuratemethod of measuring peak pressure gradients acrossregurgitant orifices including the tricuspid,2021 pul-monary,22 aortic,12 and mitral12 valves. Comparingcontinuous-wave Doppler-determined pressure gra-dients between LA and LV with simultaneous cath-eter-derived pressure gradients, Nishimura andTajikW2 found a close linear correlation for meangradient (r=0.94, SEE=6 mm Hg) and for maximalsystolic instantaneous gradient (r=0.98, SEE=8mm Hg) in patients with mitral regurgitation. How-ever, in this study there were a time delay and a whipartifact from the fluid-filled catheters used to recordLV and LA or pulmonary wedge pressures, makingaccurate instantaneous temporal comparisons be-tween Doppler and catheter measurements diffi-cult.12 Since currently available continuous-waveDoppler equipment typically analyzes the input sig-nal in 5-msec windows,23 it is not clear whether thetemporal resolution (5 msec) of continuous-waveDoppler echocardiography is able to reflect accu-rately the instantaneous pressure gradient changesduring systole. Clarification of this issue, however, isof importance when attempting to use Doppler-determined pressure gradient curves to derive time-related changing parameters such as the first deriva-tive of the pressure curve. Our study, by correlatingthe instantaneous pressure gradients measured byMillar catheter with those derived from Dopplervelocity data, demonstrates that continuous-waveDoppler echocardiography can determine instanta-neous pressure gradient changes with adequate ac-curacy in both amplitude and phase in this in vivomitral regurgitation model.
Temporal Derivative of VentriculoatrialPressure Gradient
Having demonstrated accurate determination ofventriculoatrial pressure gradient curves using con-tinuous-wave Doppler mitral regurgitant velocityprofiles, we then calculated the first derivative of
these curves. The results showed that for systole andearly isovolumic diastole the Doppler-derived dP/dtcurves correlated well (r=0.85-0.98) with dP/dt fromLV pressure curves simultaneously recorded byMillar catheter. There was no difference in absolutevalues between the two methods (p=NS) for allpooled data. The regression line for the correlationbetween values measured by the two methods wasvery close to the line of identity (b=0.85-1.08),suggesting that the true first derivatives of LV pres-sure curve can be accurately estimated from the firstderivative of the ventriculoatrial pressure gradientcurve.
For the purpose of clinical applicability, we se-lected Doppler-derived dP/dt at individual timepoints in the cardiac cycle such as dP/dtmax and-dP/dtmax to compare with the true Millar cathetermeasurements. Our study demonstrated that dP/dtmaxof the LV pressure curve during early systole can beaccurately estimated from dP/dtma, of the Doppler-derived pressure gradient curve. However, there wasa minor but significant difference in measurement of-dP/dtma by the Doppler and Millar catheter meth-ods. Doppler-derived -dP/dtm,,: was on average 8.5%less than Millar catheter-derived -dP/dtm.. Never-theless, the correlation between Doppler- and cath-eter-derived -dP/dtmax was excellent, suggesting thatcontinuous-wave Doppler echocardiography can beused to reliably estimate and assess changes in direc-tion of the true -dP/dtma,c. The reason for the Dopp-ler underestimation of -dP/dtm~, is unclear. It may berelated to LA pressure fluctuation (V wave) duringventricular contraction at the time of -dP/dtma. TheV wave of the LA pressure usually begins to declinewhile LV pressure is declining. As observed in thisstudy (Figure 1B), this decline of LA pressure occursat or near the point of -dP/dtm.. The simultaneouslydecreasing LA and LV pressures may result in a fallin changing rate of ventriculoatrial pressure gradi-ents during this phase. This may account for theunderestimation of -dP/dtm.. by the Doppler echo-cardiographic method.
Estimation of Maximal dP/dt by Mean Rate of LeftVentriculoatrial Pressure Gradient Rise
Bargiggia et a12 have estimated dP/dtma,,x using theDoppler-derived mean RPR at early systole. Thismean RPR is determined by arbitrarily selecting thetime period on the initial slope of the mitral regur-gitant velocity curve between 1 m/sec (correspondingto 4 mm Hg of ventriculoatrial pressure gradient)and 3 m/sec (corresponding to 36 mm Hg of thepressure gradient). Although this noninvasive calcu-lation of mean RPR during early systole correlatedwell with dP/dtmx, our study shows that it significantlyunderestimates the true dP/dtm.ax (on average, -303mm Hg/sec, or 25% of the hemodynamic peak dP/dt). The degree of this underestimation is dependenton the peak systolic LV pressure and dP/dtma,x. UsingRPR in rapidly changing dP/dt may result in greatererrors than in a slower changing rate of pressure rise.
by guest on June 7, 2018http://circ.ahajournals.org/
Dow
nloaded from

Chen et al Noninvasive Assessment of dP/dt 2109
The mean RPR actually measures the rate of pressurechange between developed pressures of 4 and 36mm Hg (developed pressure=pressure rise from theend-diastolic LV pressure). However, the time pointof dP/dtm,, on the LV pressure curve has been shownto depend in part on the peak systolic LV pressureattained."24 Thus, the peak dP/dt tends to occur athigher developed LV pressure when high peak LVpressures are present and at lower developed LVpressure when low peak ventricular pressures areattained.1"24 Thus, the accuracy of mean RPR using afixed developed pressure interval (between 4 and 36mm Hg) is significantly influenced by different systolicpeak pressures. Our results may provide an explana-tion for discrepancies between the mean rate ofpressure rise and true dP/dtma, in various patientsubgroups reported previously. For example, in pa-tients with congestive cardiomyopathy, a correlationcoefficient of 0.84 and a slope of 0.55 have beenreported,4 whereas in populations with coronary orrheumatic heart disease, a correlation coefficient of0.87 with a slope of 1.05 has been observed.23 Thehigher slope of 1.05 for correlation between the cath-eter-derived dP/dtmax and the Doppler-derived RPRmay also be due to the underestimation of dP/dtma, bythe fluid-filled catheter used in the previous study.2Although the study of Bargiggia et a12 did not reportunderestimation of dP/dtma,, by RPR during earlysystole, there was a tendency toward a more reducedslope of regression line for correlation between Dopp-ler RPR and dP/dtma,,x derived from fluid-filled catheterrecordings than for the correlation between DopplerRPR and dP/dtm,, derived from Millar catheter re-cordings, as shown in Figure 3 of their study.2 This ismost likely related to the damping effect of thefluid-filled catheters used in their study.2
Clinical ImplicationsThe maximum rate of rise (dP/dtmax) and decline
(-dP/dtmax) of LV pressure are among the oldest andmost widely used measures of ventricular contractil-ity and relaxation, respectively.' Although both mea-surements are altered by loading conditions,1"24 thesechanges are usually small (<10%), in the physiolog-ical range of moderate increase in preload or after-load (25-30 mm Hg of systolic artery blood pres-sure).' In the presence of mitral regurgitation, thevalidity of isovolumic indexes as indicators of con-tractility has been challenged. However, various stud-ies25-27 have demonstrated that mitral regurgitationhas little effect on the accuracy of determination ofdP/dt derived from isovolumic indexes. Furthermore,in addition to dP/dt, more complex indexes have beenintroduced in an attempt to obtain a purer contrac-tility index, less dependent on loading conditions.These indexes include the maximum value of (dP/dt)/P, dP/dt/PD, and Vm,, where P is the LV pres-sure, PD is the developed LV pressure, and Vma isthe extrapolated value of (dP/dt)/P versus P whenP=0.1 The present study demonstrates accurate de-termination of instantaneous dP/dt and correspond-
ing pressure gradients and thus suggests that thesecomplex isovolumic systolic indexes may also bederived from Doppler data in patients with mitralregurgitation. Since mitral regurgitation is commonin patients with congestive heart failure and othercardiac disorders,6-10 serial noninvasive assessmentof dP/dt in these conditions may be used to study theeffect of disease course or interventions on myocar-dial function. It is also possible to combine Doppler-derived dP/dt or pressure gradient curves withtwo-dimensional or M-mode echocardiographic mea-surements to obtain end-systolic pressure-volume re-lations28 and the rate of increase in wall stress duringsystole, which have been shown to account for changesin LV geometry and mass.28-30
LimitationsThere are several potential limitations of this non-
invasive method to derive instantaneous pressure gra-dients and the systolic LV dP/dt. A complete, welldelineated velocity spectral envelope from mitral re-gurgitation is mandatory to derive accurate measure-ments of instantaneous pressure gradients, which arethen used to derive the dP/dt curve during systole andearly isovolumic diastole. It may be difficult to obtainthe complete regurgitant spectral envelope in patientswith trace mitral regurgitation.2 Eccentric mitral re-gurgitant jets may complicate the acquisition of com-plete regurgitant velocity spectral envelopes.31 How-ever, in this canine model of mitral regurgitation, wewere able to clearly record complete velocity curvesfrom eccentric regurgitant jets using apical views. Aswith any Doppler velocity measurement, the ultra-sound beam must be aligned parallel to the velocityvectors at the regurgitant orifice to prevent underes-timation of the pressure gradients. Careful scanning isnecessary to obtain maximal velocity spectra by blindDoppler transducer or by image-directed continuous-wave Doppler transducers.We have demonstrated the accuracy of this
method in a canine model of moderate to severemitral regurgitation (a regurgitant flow rate of41.8+18.2 ml/sec), both in enlarged (increased com-pliance) and normal-sized (low compliance) LAs andwith LA pressures ranging from 9 to 35 mm Hg. It ispossible that a higher V wave on the LA pressuretracing in patients with mitral stenosis or acutesevere mitral regurgitation may affect the accuracy ofthis noninvasive determination of dP/dt. Furtherstudies will be necessary to evaluate this method insuch patient subgroups.
ConclusionsThis in vivo canine study demonstrated that the
instantaneous systolic gradient between the LV andLA can be accurately determined from the continu-ous-wave Doppler mitral regurgitant velocity spec-trum and that the first derivative of the pressuregradient curve can be used to estimate the true LVdP/dt curve during systole and early isovolumic dias-tole. Thus, Doppler echocardiography provides an
by guest on June 7, 2018http://circ.ahajournals.org/
Dow
nloaded from
2110 Circulation Vol 83, No 6 June 1991
accurate and reliable noninvasive approach for de-riving the dP/dtm, and -dP/dtm,, of the LV.
AcknowledgmentsThe authors would like to thank Michael A. Fifer,
MD, Frank Flachskampf, MD, and Brian Griffin,MD, for critical discussion and Tracy Svizzero, BS,and Shawn McGlew, BS, for technical assistance.
References1. Grossman W: Evaluation of systolic and diastolic function of
the myocardium, in Grossman W (ed): Cardiac Catheterizationand Angiography, ed 3. Philadelphia, Lea & Febiger, 1986, pp302-306
2. Bargiggia GS, Bertucci C, Recusani F, Raisaro A, de Servi S,Valdes-Cruz LM, Sahn DJ, Tronconi L: A new method forestimating left ventricular dP/dt by continuous wave Doppler-echocardiography: Validation studies at catheterization. Cir-culation 1989;80:1287-1292
3. Eng AK, Shakudo M, Shah PM: Validation of Dopplerderived left ventricular pressure rise from the mitral regurgi-tation signal (abstract). Circulation 1989;80(suppl II):II-567
4. Neumann A, Korcarz C, Lang RM, Sareli P, Marcus R, BorowKM: Comparison of Doppler vs catheterization derived dP/dtin dilated cardiomyopathy (abstract). Circulation 1989;80(suppl II):II-170
5. Chung N, Nishimura RA, Reeder GS, Schwartz RS, SewardJB, Tajik AJ: Non-invasive measurement of left ventriculardP/dt by Doppler echocardiography (abstract). J Am CollCardiol 1990;15:140A
6. Boltwood CM, Tei C, Wong M, Shah PM: Quantitativeechocardiography of the mitral complex in dilated cardiomy-opathy: The mechanism of functional mitral regurgitation.Circulation 1983;68:498-508
7. Gahl K, Sutton R, Pearson M, Caspari P, Lairet A, McDonaldL: Mitral regurgitation in coronary heart disease. Br Heart J1977;39:13-18
8. Loperfido F, Biasucci LM, Pennestri F, Laurenzi F,Gimigliano F, Vigna C, Rossi E, Favuzzi A, Santarelli P,Manzoli U: Pulsed Doppler echocardiographic analysis ofmitral regurgitation after myocardial infarction. Am J Cardiol1986;58:692-697
9. Izumi S, Miyatake K, Beppu S, Park YD, Nagata S, KinoshitaN, Sakakibara H, Nimura Y: Mechanism of mitral regurgita-tion in patients with myocardial infarction: A study usingreal-time two-dimensional Doppler flow imaging and echocar-diography. Circulation 1987;76:777-785
10. Strauss RH, Stevenson LW, Dadourian BA, Child JS: Predict-ability of mitral regurgitation detected by Doppler echocardi-ography in patients referred for cardiac transplantation. Am JCardiol 1987;59:892-894
11. Hatle L, Angelsen B: Doppler Ultrasound in Cardiology: Phys-ical Principles and Clinical Application. Philadelphia, Lea &Febiger, 1984, pp 1-238
12. Nishimura RA, Tajik AJ: Determination of left-sided pressuregradients by utilizing Doppler aortic and mitral regurgitantsignals: Validation by simultaneous dual catheter and Dopplerstudies. JAm Coll Cardiol 1988;11:317-321
13. Choong CY, Abascal VM, Thomas JD, Guerrero JL, McGlewS, Weyman AE: Combined influence of ventricular loadingand relaxation on the transmitral flow velocity profile in dogsmeasured by Doppler echocardiography. Circulation 1988;78:672-683
14. Domalik-Wawrzynski U, Powell WJ Jr, Guerrero JL, PalaciosIF: Effect of changes in ventricular relaxation on early dia-stolic coronary blood flow in canine hearts. Circ Res 1987;61:747-756
15. Bland JM, Altman DG: Statistical methods for assessingagreement between two methods of clinical measurement.Lancet 1986;1:307-310
16. Holen J, Aaslid R, Landmark K, Simonsen S: Determinationof pressure gradient in mitral stenosis with a non-invasiveultrasound Doppler technique. Acta Med Scand 1976;199:455-460
17. Wilkins GT, Gillam LD, Kritzer GL, Levine RA, Palacios IF,Weyman AE: Validation of continuous wave Doppler echo-cardiographic measurements of mitral and tricuspid valvegradients: A simultaneous Doppler-catheter study. Circulation1986;74:786-795
18. Currie PJ, Seward JB, Reeder GS, Vlietstra RE, BresnahanDR, Bresnahan JF, Smith HC, Hagler DJ, Tajik AJ: Contin-uous-wave Doppler echocardiographic assessment of severityof calcific aortic stenosis: A simultaneous Doppler-cathetercorrelative study in 100 adult patients. Circulation 1985;71:1162-1169
19. Currie PJ, Hagler DJ, Seward JB, Reeder GS, Fyfe DA, BoveAA, Tajik AJ: Instantaneous pressure gradient: A simulta-neous Doppler and dual catheter correlative study. JAm CollCardiol 1986;7:800-806
20. Yock PG, Popp RL: Noninvasive estimation of right ventric-ular systolic pressure by Doppler ultrasound in patients withtricuspid regurgitation. Circulation 1984;70:657-662
21. Currie PJ, Seward JB, Chan KL, Fyfe DA, Hagler DJ, MainDD, Reeder GS, Nishimura RA, Tajik AJ: Continuous waveDoppler determination of right ventricular pressure: A simul-taneous Doppler catheterization study in 127 patients. J AmColl Cardiol 1985;6:750-756
22. Masuyama T, Kodama K, Kitabatake A, Sato H, Nanto S,Inoue M: Continuous-wave Doppler echocardiographic detec-tion of pulmonary regurgitation and its application to nonin-vasive estimation of pulmonary artery pressure. Circulation1986;74:484-492
23. Lee R: Waveform analysis and technical considerations inDoppler instrumentation, in Sutton MS, Oldershaw PJ (eds):Textbook ofAdult and Pediatric Echocardiography and Doppler.Boston, Blackwell Scientific Publication, 1989, pp 19-76
24. Mahler F, Ross J Jr, O'Rourke RA, Covell JW: Effects ofchanges in preload, afterload and inotropic state on ejectionand isovolumic phase measures of contractility in the con-scious dog. Am J Cardiol 1975;35:626-634
25. Borgenhagen DM, Serur JR, Gorlin R, Adams D, SonnenblickEH: The effects of left ventricular load and contractility onmitral regurgitant orifice size and flow in the dog. Circulation1977;56:106-113
26. Sasayama S, Takahashi M, Osakada G, Hiroshe K, Hama-shima H, Nishimura E, Kawai C: Dynamic geometry of the leftatrium and left ventricle in acute mitral regurgitation. Circu-lation 1979;60:177-186
27. Yoran C, Yellin EL, Becker RM, Gabbay S, Frater RWM,Sonnenblick EH: Dynamic aspects of acute mitral regurgita-tion: Effects of ventricular volume, pressure and contractilityon the effective regurgitant orifice area. Circulation 1979;60:170-176
28. Mehmel HC, Stockins B, Ruffmann K, von Olshausen K,Schuler G, Kubler W: The linearity of the end-systolic pres-sure-volume relationship in man and its sensitivity for assess-ment of left ventricular function. Circulation 1981:63:1216-1222
29. Fifer MA, Gunther S, Grossman W, Mirsky 1, Carabello B,Barry WH: Myocardial contractile function in aortic stenosisas determined from the rate of stress development duringisovolumic systole. Am J Cardiol 1979;44:1318-1324
30. Grossman W, Braunwald E, Mann T, McLaurin LP, GreenLH: Contractile state of the left ventricle in man as evaluatedfrom end-systolic pressure-volume relations. Circulation 1977;56:845-851
31. Chen C, Thomas DJ, Anconina J, Harrigan P, Levine RA,Weyman AE: Impact of eccentrically directed impinging walljets on quantitation of mitral regurgitation by color Dopplerflow mapping (abstract). Circulation 1989;80(suppl II):II-579
KEY WORDS * echocardiography, Doppler * left ventricularfunction * left ventricular dP/dt
by guest on June 7, 2018http://circ.ahajournals.org/
Dow
nloaded from

C Chen, L Rodriguez, J L Guerrero, S Marshall, R A Levine, A E Weyman and J D Thomasusing continuous-wave Doppler echocardiography.
Noninvasive estimation of the instantaneous first derivative of left ventricular pressure
Print ISSN: 0009-7322. Online ISSN: 1524-4539 Copyright © 1991 American Heart Association, Inc. All rights reserved.
is published by the American Heart Association, 7272 Greenville Avenue, Dallas, TX 75231Circulation doi: 10.1161/01.CIR.83.6.2101
1991;83:2101-2110Circulation.
http://circ.ahajournals.org/content/83/6/2101the World Wide Web at:
The online version of this article, along with updated information and services, is located on
http://circ.ahajournals.org//subscriptions/
is online at: Circulation Information about subscribing to Subscriptions:
http://www.lww.com/reprints Information about reprints can be found online at: Reprints:
document. Permissions and Rights Question and Answer information about this process is available in the
located, click Request Permissions in the middle column of the Web page under Services. FurtherEditorial Office. Once the online version of the published article for which permission is being requested is
can be obtained via RightsLink, a service of the Copyright Clearance Center, not theCirculationpublished in Requests for permissions to reproduce figures, tables, or portions of articles originallyPermissions:
by guest on June 7, 2018http://circ.ahajournals.org/
Dow
nloaded from