Nondestructive Inspection Reliability: State of the Artcdn.intechopen.com/pdfs/30279.pdf ·...
21
1 Nondestructive Inspection Reliability: State of the Art Romeu R. da Silva 1 and Germano X. de Padua 2 1 Federal University of Rio de Janeiro, 2 Petróleo Brasileiro S.A. (PETROBRAS), Brazil 1. Introduction In health, there are numerous types of tests for the identification of pathologies in patients. Some questions that can be brought up: How accurate are these tests? What are the "losses" of a medical report error if the patient has a serious health problem and it cannot be detected by the examination chosen? On the other hand, if the patient has no problem and the medical report shows positive? What consequences are there in a medical report error? If we imagine that the medical risks assumed in inaccurate reports may lead to serious consequences, which can happen with the result of an inspection of equipment without reliability? Unlike the medical field instead of a fatal case, there may be multiple fatalities, environmental damage, irreparable financial losses, etc. There is several non-destructive inspection methods used to evaluate the integrity of industrial equipment and thus raise several questions. What are the most reliable? Which ones provide lower risk of decision? There is an ideal method for a given type of equipment? A more reliable inspection method also costs more? Some of these questions are answered in the study of methods for estimating the reliability of Nondestructive Testing (NDT), area of scientific research that has been the focus of many investments in recent decades, aiming mainly to provide greater operational reliability of equipments from different branches of industries. PoD curves may become a powerful tool for quantifying the performance of inspection techniques, as well as inspectors and can be used to: Establish criteria for project acceptance; Set up maintenance inspection intervals; Qualification of NDT procedure; Performance verification of qualification of persons; Qualify improvements in NDT procedures. Considering the thematic importance and the increasing trend of investment projects aimed at better understanding the reliability of NDT methods, this chapter has the main objective of making an approach on the state of the art studies of the reliability of non-destructive inspection to be used as the first bibliographic guidance to future researches. Firstly, it www.intechopen.com
Transcript of Nondestructive Inspection Reliability: State of the Artcdn.intechopen.com/pdfs/30279.pdf ·...

1
Nondestructive Inspection Reliability: State of the Art
Romeu R. da Silva1 and Germano X. de Padua2 1Federal University of Rio de Janeiro,
2Petróleo Brasileiro S.A. (PETROBRAS), Brazil
1. Introduction
In health, there are numerous types of tests for the identification of pathologies in patients. Some questions that can be brought up: How accurate are these tests? What are the "losses" of a medical report error if the patient has a serious health problem and it cannot be detected by the examination chosen? On the other hand, if the patient has no problem and the medical report shows positive? What consequences are there in a medical report error?
If we imagine that the medical risks assumed in inaccurate reports may lead to serious consequences, which can happen with the result of an inspection of equipment without reliability? Unlike the medical field instead of a fatal case, there may be multiple fatalities, environmental damage, irreparable financial losses, etc.
There is several non-destructive inspection methods used to evaluate the integrity of industrial equipment and thus raise several questions. What are the most reliable? Which ones provide lower risk of decision? There is an ideal method for a given type of equipment? A more reliable inspection method also costs more? Some of these questions are answered in the study of methods for estimating the reliability of Nondestructive Testing (NDT), area of scientific research that has been the focus of many investments in recent decades, aiming mainly to provide greater operational reliability of equipments from different branches of industries.
PoD curves may become a powerful tool for quantifying the performance of inspection techniques, as well as inspectors and can be used to:
Establish criteria for project acceptance;
Set up maintenance inspection intervals;
Qualification of NDT procedure;
Performance verification of qualification of persons;
Qualify improvements in NDT procedures.
Considering the thematic importance and the increasing trend of investment projects aimed at better understanding the reliability of NDT methods, this chapter has the main objective of making an approach on the state of the art studies of the reliability of non-destructive inspection to be used as the first bibliographic guidance to future researches. Firstly, it
www.intechopen.com
Nondestructive Testing Methods and New Applications 4
covers topics of major theoretical techniques used in the estimation of reliability curves. Then, some of the most relevant research publications in the area of reliability of NDT are commented in their main results. It must be noted that this work does not exhaust all the literature produced; there are other references that can be studied to obtain detailed information on this research topic.
2. Methods for reliability assessment
2.1 PoD - Probability of Detection curves
It’s supposed that the first PoD (Probability of Detection) studies arose by the end of 60’s and beginning of 70’s, when most of studies were from aeronautic industry. At that time, it was realized that the question “what is the smaller detectable discontinuity with NDT methods?” was less appropriate than “what is the larger not detectable discontinuity?”.
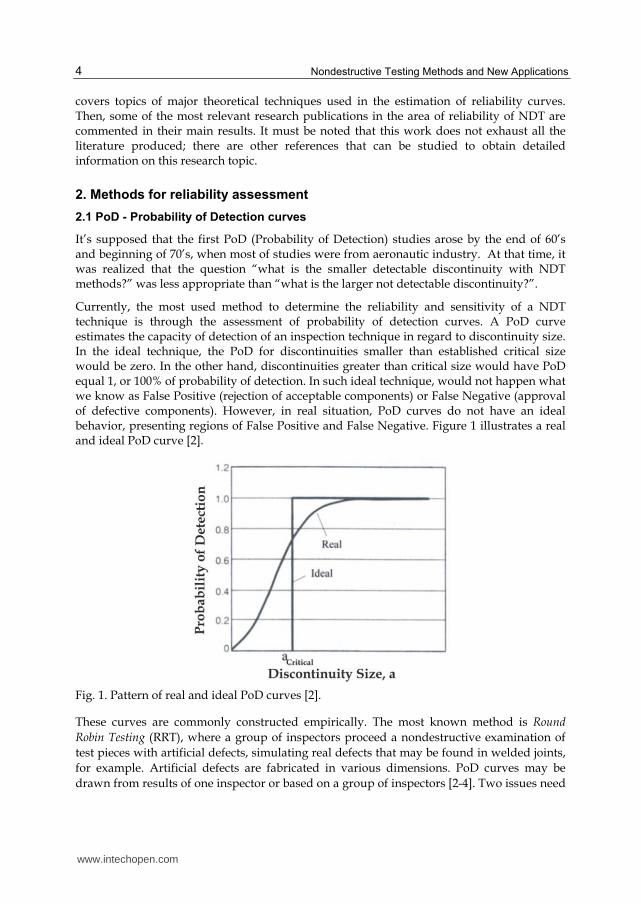
Currently, the most used method to determine the reliability and sensitivity of a NDT technique is through the assessment of probability of detection curves. A PoD curve estimates the capacity of detection of an inspection technique in regard to discontinuity size. In the ideal technique, the PoD for discontinuities smaller than established critical size would be zero. In the other hand, discontinuities greater than critical size would have PoD equal 1, or 100% of probability of detection. In such ideal technique, would not happen what we know as False Positive (rejection of acceptable components) or False Negative (approval of defective components). However, in real situation, PoD curves do not have an ideal behavior, presenting regions of False Positive and False Negative. Figure 1 illustrates a real and ideal PoD curve [2].
Fig. 1. Pattern of real and ideal PoD curves [2].
These curves are commonly constructed empirically. The most known method is Round
Robin Testing (RRT), where a group of inspectors proceed a nondestructive examination of
test pieces with artificial defects, simulating real defects that may be found in welded joints,
for example. Artificial defects are fabricated in various dimensions. PoD curves may be
drawn from results of one inspector or based on a group of inspectors [2-4]. Two issues need
www.intechopen.com

Nondestructive Inspection Reliability: State of the Art 5
to be highlighted in this RRT methodology, the first is the amount of test pieces necessary to
guarantee statistic reliability of the estimated curve, and second is the complexity of
obtaining artificial defects in dimension, location and characteristics as similar as real
defects. In welding, for instance, only skilled, experienced and well trained welders are able
to produce defective welds in such way that simulate real situations of inspections that
provide representative results of PoD.
At First European-American Workshop of reliability (Berlin, June 1997), a model of reliability
was proposed, which recognize three functions connected to the reliability of a
nondestructive testing technique: intrinsic capacity of the system, characteristics of specific
applications and human factor. Thus, it’s suggested that reliability of a NDT technique will
never be higher than that idealized. The reliability of a technique, when applied to a specific
type of defect, may be represented by following concept:
迎結 = 血岫荊系岻 − 訣岫鶏畦岻 − ℎ岫茎繋岻 (1)
Where,
Re is the total reliability of the system. f (IC) is function of intrinsic capacity of the NDT system; g (PA) is function of parameters applied (access, surface finishing etc.); h (HF) is function of human factor (skills, training, experience etc.).
By this concept, the function f is associated to intrinsic capacity of the specific inspection
technology in ideal conditions. In case of any noise (deviation of ideal conditions), the ideal
reliability is going to be reduced as function of g nature. When there are human factors
associated to manual inspection, reliability is reduced, according to function h. Automatic
inspections are free of these factors, due to this fact, often provide higher probability of
detection [2].
The PoD of a discontinuity sizing ”a” is determined as the average of probability of
detection for all discontinuities sizing ”a”. A PoD curve is constructed from the average of
PoD for each dimension of discontinuity. Normally, a confidence level is associated, since it
is estimated in function of a finite sample space. The length is the dimension commonly
used, although the height (internal defect) or depth (surface defect) may be used as
well [2-4].
Difficulties in fabricating a number of test pieces high enough, frequently provide a poor sample space. Due to this, there are various statistic models used to estimate PoD curves [2-5]. These models run data obtained from two types of analysis: 欠賦 versus 欠 and hit/miss [1-5]. According to Carvalho [2], some NDT techniques connect a signal with response “欠賦” to a real dimension 欠 of the discontinuity. Nevertheless, some inspection techniques do not size the defects, the response is only detected or not. The analysis hit/miss get useful due to its simplicity. Both methods may be used to implement PoD curves, however, different results are obtained when applied to the same data set.
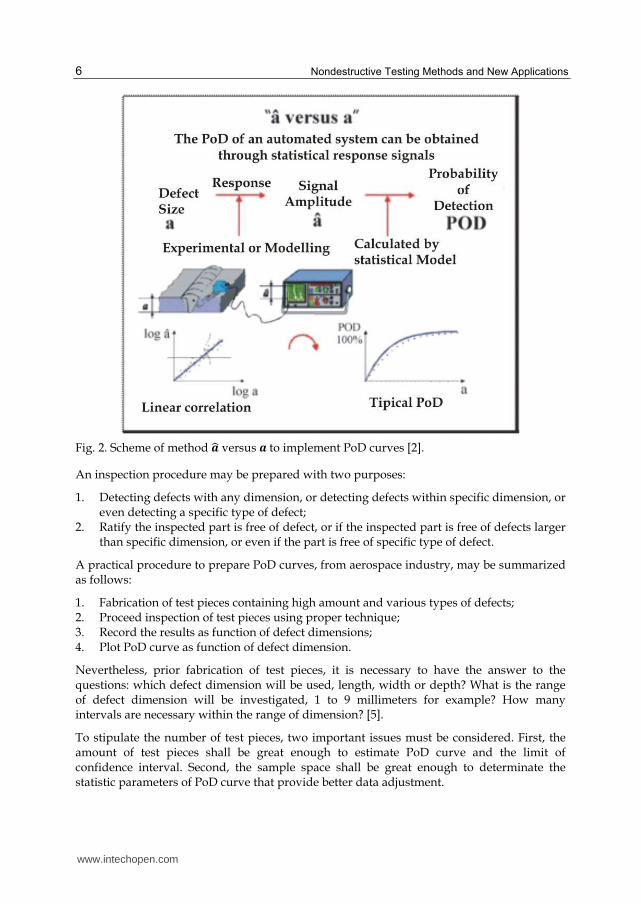
Figure 2 shows a scheme presented by Carvalho [2] to describe the methodology of analysis 欠賦 versus 欠. Observe that a defect sizing 欠 in a welded test piece cause a signal with
magnitude 欠賦 on the ultrasonic apparel during examination.
www.intechopen.com
Nondestructive Testing Methods and New Applications 6
Fig. 2. Scheme of method 珊赴 versus 珊to implement PoD curves [2].
An inspection procedure may be prepared with two purposes:
1. Detecting defects with any dimension, or detecting defects within specific dimension, or even detecting a specific type of defect;
2. Ratify the inspected part is free of defect, or if the inspected part is free of defects larger than specific dimension, or even if the part is free of specific type of defect.
A practical procedure to prepare PoD curves, from aerospace industry, may be summarized as follows:
1. Fabrication of test pieces containing high amount and various types of defects; 2. Proceed inspection of test pieces using proper technique; 3. Record the results as function of defect dimensions; 4. Plot PoD curve as function of defect dimension.
Nevertheless, prior fabrication of test pieces, it is necessary to have the answer to the questions: which defect dimension will be used, length, width or depth? What is the range of defect dimension will be investigated, 1 to 9 millimeters for example? How many intervals are necessary within the range of dimension? [5].
To stipulate the number of test pieces, two important issues must be considered. First, the amount of test pieces shall be great enough to estimate PoD curve and the limit of confidence interval. Second, the sample space shall be great enough to determinate the statistic parameters of PoD curve that provide better data adjustment.
www.intechopen.com
Nondestructive Inspection Reliability: State of the Art 7
2.1.1 Statistic model for hit/miss
For analysis of Hit/Miss cases, various statistic distributions have been proposed. Distribution log-logistics or log-probability was found to be more suitable and function PoD(a) may be written as follows [5]:
鶏剣経 = 勅 肺√典磐嶋投 尼貼銅配 卑怠袋勅 肺√典磐嶋投 尼貼銅配 卑 (2)
Where a is a defect dimension, and µ e are average and standard deviation, respectively [5]. Equation 2 can be written as follows:
鶏剣経 = 勅岫琶甜破 嶋投 尼岻怠袋勅岫琶甜破 嶋投 尼岻 (3)
It is simple to reach the equation 4:
ln 岾 牒墜帖岫銚岻怠貸牒墜帖岫銚岻峇 = 糠 + 紅 ln 欠 (4)
Where μ = − 底庭 and 購 = 訂庭√戴.
Thus
健券岫喧堅剣決欠決件健件建検岻 ∝ ln 岫欠岻. (5)
2.1.2 Statistic model for data of response signal
Concerning to response signal of the inspection technique, it is considered a linear relation
between ln 欠賦 and ln a, where a is the dimension established of the defect [5]. This relation
may be represented by equation 6:
健券岫欠賦岻 = 糠怠 + 紅怠 ln岫欠岻 + 紘 (6)
Where 紘 is the error with normal distribution, presenting average equal zero and standard
deviation constant and equal 購怠. Equation 6 represent normal distribution of 健券岫欠賦岻 centered
at 航岫欠岻 and deviation 購廷態, where,
航岫欠岻 = 糠怠 + 紅怠 ln 岫欠岻 (7)
PoD (a) function for the NDT response signal (健券岫欠賦岻) may be presented as follows:
鶏剣経岫欠岻 = 鶏堅剣決欠決件健件建検岫健券岫欠賦岻 > ln 岫欠賦痛朕岻) (8)
Where ln 岫欠賦痛朕岻 is the limit of defect evaluation [3].
Using statistic pattern simbology, the PoD function for the response signal of NDT may be
represented by equation 9:
鶏剣経岫欠岻 = な − 繋 釆狸樽岫銚賦禰廿岻貸岫底迭袋庭迭 狸樽岫銚岻岻蹄婆 挽 (9)
Where F is a continuous cumulative distribution function.
www.intechopen.com
Nondestructive Testing Methods and New Applications 8
Using the symmetric property of normal distribution:
鶏剣経岫欠岻 = 繋 峙狸樽岫銚岻貸禎蹄 峩 (10)
Which is a cumulative log-normal distribution, where 航岫欠岻 = 狸樽 銚賦禰廿貸底迭庭迭 and the standard
deviation 購 = 蹄婆庭迭. The parameters 糠怠, 紅怠 e 購廷 are estimated through the maximum
verisimilitude method. Such function is often used on analysis Hit/Miss as well [5].
2.1.3 Estimation of PoD curve parameters
To estimate PoD curve parameters using hit/miss method, it is recommended that dimension
of defects being uniformly distributed from the smallest to largest dimension of interest,
containing at least 60 defects. For signal response analysis, it is recommended, at least, 30
defects [5].
2.1.4 Confidence interval of PoD curve
For a hit/miss analysis, a confidence interval of 95% is usually applied, it is necessary a
minimum of 29 defects on each dimension range of study, taking into account that the
number of discontinuities detected follows a binomial distribution. It can be interpreted as
29 test pieces containing one defect each. Thus, as an example, if an analysis requires 6
ranges of dimensions, it is going to be necessary, at least, 174 test pieces, increasing costs for
fabrication of test pieces to estimate PoD curve and confidence intervals correctly [5].
As stated previously, a confidence interval may be calculated, assuming it follows a normal
distribution, through the equations 11 and 12.
鶏 峙−権 岾底態峇 ≤ 掴̅貸禎蹄 √津⁄ ≤ 権 岾底態峇峩 = な − 糠 (11)
峙捲̅ − 権 岾底態峇 蹄√津 , 捲̅ + 権 岾底態峇 蹄√津峩 (12)
Where is the significance level, µ is is average and is standard deviation.
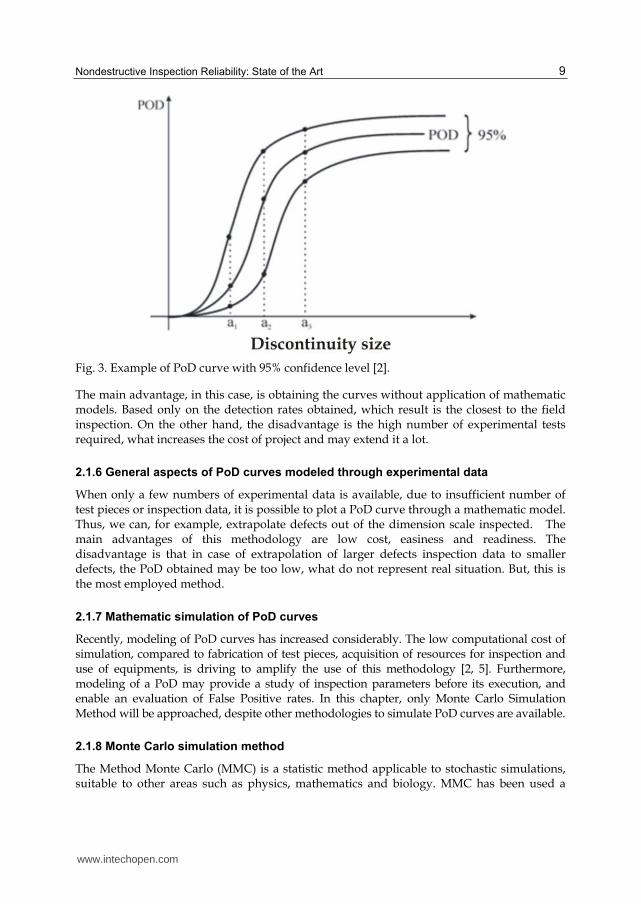
Figure 3 shows a didactic example of 95% confidence interval (=5%).
2.1.5 General aspects of experimental PoD curves
Experimental PoD curves are plotted when a high volume of inspection data were obtained
experimentally. They can be applied in projects that include fabrication of test pieces
containing defects with controlled characteristics, such as type, dimensions and location.
Another application is to equipments which inspection history is fully recorded from the
same reference block containing well known defects.
For fabrication of test pieces, a significative number of artificial defects is necessary to
provide a sample space that enable estimation of the curves. To reproduce the field situation
as feasible as possible, many inspectors and defects characteristics shall be used.
www.intechopen.com
Nondestructive Inspection Reliability: State of the Art 9
Fig. 3. Example of PoD curve with 95% confidence level [2].
The main advantage, in this case, is obtaining the curves without application of mathematic models. Based only on the detection rates obtained, which result is the closest to the field inspection. On the other hand, the disadvantage is the high number of experimental tests required, what increases the cost of project and may extend it a lot.
2.1.6 General aspects of PoD curves modeled through experimental data
When only a few numbers of experimental data is available, due to insufficient number of test pieces or inspection data, it is possible to plot a PoD curve through a mathematic model. Thus, we can, for example, extrapolate defects out of the dimension scale inspected. The main advantages of this methodology are low cost, easiness and readiness. The disadvantage is that in case of extrapolation of larger defects inspection data to smaller defects, the PoD obtained may be too low, what do not represent real situation. But, this is the most employed method.
2.1.7 Mathematic simulation of PoD curves
Recently, modeling of PoD curves has increased considerably. The low computational cost of simulation, compared to fabrication of test pieces, acquisition of resources for inspection and use of equipments, is driving to amplify the use of this methodology [2, 5]. Furthermore, modeling of a PoD may provide a study of inspection parameters before its execution, and enable an evaluation of False Positive rates. In this chapter, only Monte Carlo Simulation Method will be approached, despite other methodologies to simulate PoD curves are available.
2.1.8 Monte Carlo simulation method
The Method Monte Carlo (MMC) is a statistic method applicable to stochastic simulations, suitable to other areas such as physics, mathematics and biology. MMC has been used a
www.intechopen.com
Nondestructive Testing Methods and New Applications 10
long time in order to obtain numeric approaches of complex functions. This method is typically used to generate observations of any distribution of probabilities and use of sampling to approximate the interest function.
The application of Monte Carlo simulation to estimate PoD of a defect may be obtained through the equation 13.
鶏剣経岫経岻 = 継岷荊岫捲, 検岻峅 = 完 完 荊岫捲, 検岻血掴,槻鳥痛待鳥銚待 岫捲, 検岻穴捲穴検 (13)
Where “D” is the diameter of defect, x and y are random variables associated to the position
of the center of circular defect, fx,y(x,y) is the density function of probability for both
variables, E[_] is the expected or average value. In an ultrasonic inspection for example, the
elements dt and da are distance between each probe and distance between two data
acquisitions, respectively. As the center of defect may be located randomly in a rectangle
(inspected area), the function fx,y(x,y) is given by two normal distributions, one for each
coordinate of center of defect, as follows:
血掴,槻岫捲, 検岻 = 怠鳥銚 怠鳥痛 (14)
I(x, y) is an indicator of inspection function, it assumes value 1 if the defect was detected and
0 if not detected. In case of ultrasonic examinations [2], detection is considered successful
when an overlap between defect and ultrasonic beam occur and the amplitude of the echo
produced by defect is larger than reference curve. The simulation of test pieces is
accomplished by random definition of the center of defect (x, y), according to equation 14.
Then, results of inspection of simulated defects, detected or not detected, shall be considered
for the study. Equation 13 may be rewritten as follows:
鶏剣経岫経岻 = ∑ 彫岫掴日,槻日岻朝朝沈退怠 (15)
Where N means the number of simulations (simulated test pieces), it must be great enough to
provide statistic reliability of the results. According to literature [6], the error rate of results
obtained through equation 15, considering a confidence level 95%, is given by equation 16.
結堅堅剣堅 = にどど謬怠貸牒墜帖朝.牒墜帖 岫%岻 (16)
From equation 16, it is possible to determinate the number of simulations necessary to reach the error level wished. Details of Method Monte Carlo are provided by Carvalho [2] and Ang [6].
3. ROC curves (Receiver ou Relative Operating Characteristic)
The ROC curves are well known in theory of signal detection and accessed on technical
referenced of pattern recognition [7-10]. These curves are result of relation between number
of false positives (FP), abscissas axis, and number of true positives (TP), ordinates axis. Alike
PoD, reliability is given by area under the curve. Reliability of technique is better as much as
higher values of TP and lower values of FP. Ideal reliability is encompassed in a 100% of a
square area, according to didactic example of figure 4.
www.intechopen.com

Nondestructive Inspection Reliability: State of the Art 11
The probability of detection, or in other word, the probability of True Positive is:
鶏剣経 = 鶏岫劇鶏岻 = 脹牒脹牒袋庁朝 (17)
where FN is the value of False Negative.
The probability of False Alarm or False Positive (FP):
鶏岫繋鶏岻 = 庁牒脹朝袋庁牒 (18)
where TN is the value of True Negative [7, 8].
The ROC curves have some advantages compared to PoD curves. One of these advantages is the evaluation of false positive index, which are not taking into account when PoD curves are plotted. Certainly, these indexes are very important for nondestructive testing. Just supposing a situation when false positive may imply in an unnecessary emergency shut down of an equipment or operating unit. In the other hand, a worse situation would be a false negative that may start up defective equipment, elevating the risk of a catastrophic occurrence, causing damages to facilities, environment and human deaths.
Fig. 4. Example of ROC curve.
4. Bibliographic review
4.1 Experimental PoD
4.1.1 Manufacture of specimens
The manufacture of specimens with artificial defects can be considered an art, as they should be induced in order to represent, in location, size and shape defects that occur in the reality of manufacturing processes and equipment operation. At this point, the main focus is to address some techniques of manufacturing well-done defects in materials in order to produce specimens for estimation of inspection reliability, which can also be used for training and certification of NDT personnel.
www.intechopen.com

Nondestructive Testing Methods and New Applications 12
a. Fatigue cracks
For metal alloys, fatigue cracks are initiated and grown under controlled conditions with the purpose of construction of PoD curves. Fatigue cracks have particular characteristics, they are economical to produce and constitute a challenge for detection. These cracks can be initiated, for instance, through a notch. The controlled growth of the crack can be accomplished by loading constant at approximately 70% of the yield strength of the material, or by fatigue test, monitoring its growth with methods such as ultrasound by TOFD (Time of Flight Diffraction). The notch should be removed from the original specimen before the inspection process to allow a correct measurement of the crack only [11].
b. Welding defects
Silk's book [1], in chapter 3, contains an item devoted to description of the main causes of welding defects, which do is not scope of the proposed work.
Another interesting work is that of Bullough et al [12] describes a model for estimating the distribution of defects in submerged arc welding in equipment of nuclear industry.Potential defects are mainly: lack of fusion, solidification cracking in weld metal hydrogen cracking in the HAZ and weld metal. It also estimated the probability of the presence of defects in weld inspection after manufacturing by calculating the probability of defect formation versus the probability of not detecting [12].
The table 1 below contains some recommendations to produce controlled defects in welded plates resulting from the experience of welders of the SENAI RJ Technology Welding Center.
Type of Weld Defect Recommendations
Lack of root fusion Welding with lower amperage/Welding only one side of root face.
Lack of fusion in the wall groove
Place a piece of graphite on the wall and make the filling.
Lack of Penetration Use a rod thicker than the root gap/ Put a piece of material (carbon steel) at the root gap.
Excessive Penetration Welding with higher amperage.
Surface crack Add copper, aluminum or cobalt before welding the face reinforcement.
Internal Crack During the filling step of the weld beam, create a notch through a cutting disc or saw blade thinness. Afterwards, finish the face reinforcement.
Crack in the Root The same procedure for internal crack, but carried out in the root step.
Porosity
Lower gas flow (Ar for GTAW). For a 7 mm diameter nozzle, the flow of gas is recommended 8 l/minute. You can use a flow 3l/minute to generate porosity. To generate porous in Shielded Metal Arc Weld, the best practice is to weld in direct polarity.
Face Undercutting Apply high amperage / increase the speed of welding. For
GTAW and SMAW, weld with angle ≤15 or ≥ 30. Table 1. General Recommendations to produce typical welding defects.
www.intechopen.com
Nondestructive Inspection Reliability: State of the Art 13
4.1.2 Estimation of experimental PoD
One of the first projects of reliability of NDT method was the Program for Inspection of Steel
Components (PISC) in mid-70s, which has been initiated in order to assess the ability of
defect detection by method of ultrasound in the walls of pressure vessels of up to 250mm in
the nuclear industry [13-15]. Several ultrasound procedures existing at that time were
strictly applied to the results of inspections, which resulted in PoD with low values [13-15].
However, some inspectors could also use the procedures they wanted, thus achieving much
better results in terms of detection for the same defects analyzed. In the PISC II and III
programs, the project drew on more flexible procedures. The results showed that
characteristics of defects such as shape and geometry are more relevant to the POD when
compared to other physical parameters. They also concluded that there were some mistakes
in the ASME code, however, the most relevant contribution was made to a detailed
evaluation of NDT techniques for detecting and sizing of defects [13-15].
Another important program was titled NORDTEST, which was developed in Scandinavia
by the Netherlands Institute of Welding (NIL), the ICON (Inter Calibration of Offshore
Nondestructive Examination) and TIP (Topside Inspection Project). The main object of this
project was to compare the manual method of ultrasonic with the method applied to X-ray
inspection of welded plates carbon-manganese steel with thickness smaller than 25 mm. The
results also were used to establish acceptance curves (curves (1-POD) versus height of the
defect) [13]. This project also compared the technique of inspection by manual ultrasonic
with the automated inspection assisted by processing techniques (such as focusing system),
certifying that the computerized inspection result in a PoD significantly higher than the
manual inspection [16].
The UCL (University College London) conducted a project in the offshore area for the preparation of PoD from fatigue cracks in tubular joints in the mid 90s. The aim was to compare the probability of defect detection of these cracks by the method of magnetic particles with the method of eddy currents, as well as the method of using ultrasonic Creeping waves. Which has reached PoD between 90 and 95% for cracks larger than 100mm[5, 17]?
In the 90's, the Netherlands Institute of Welding (NIL) has issued a report with the results of a project to study the reliability of the method of mechanized ultrasonic, among other methods, to detect defects in welded plate of 6 to 15mm thick. The results proved that the mechanized method and TOFD (Time of Flight Diffraction) technique have probability of detection much higher than the manual method (60-80% of PoD compared to about 50% of the manual). The mechanized method is also more effective in sizing of defects [2, 18].
Carvalho [2] employed the method of ultrasonic pulse-echo both in manual and in
automated form, as well as the automatic method of TOFD. More information about
inspection procedures can be obtained in [2]. The inspection by the pulse-echo manual
technique was carried out by five (5) inspectors duly certified by ABENDI - Brazilian
Association of Nondestructive Tests and Inspection, recognized by SNQC - National System
of Qualification and Certification, in accordance with ISO 9712. Thus, the PoD curves were
constructed from an average of 75 defects (samples), since each length was repeated 15
times. Each set was replicated by this bootstrap technique [19] in 1500 a new set containing
75 samples. The average probability of detection of each length was estimated for each of
www.intechopen.com
Nondestructive Testing Methods and New Applications 14
these sets. The 1500 PoD values were arranged in ascending order by choosing a 95%
confidence interval [2].
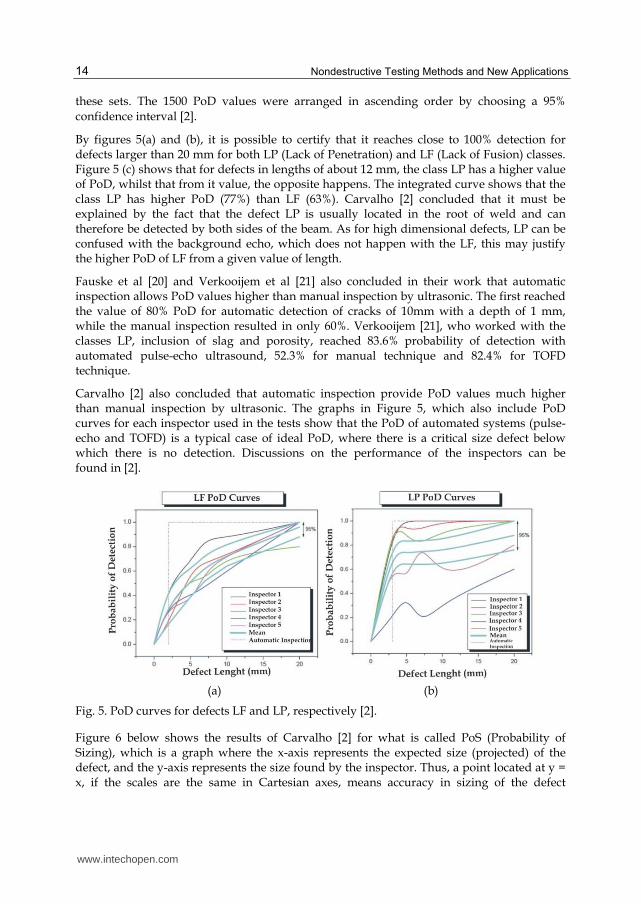
By figures 5(a) and (b), it is possible to certify that it reaches close to 100% detection for defects larger than 20 mm for both LP (Lack of Penetration) and LF (Lack of Fusion) classes. Figure 5 (c) shows that for defects in lengths of about 12 mm, the class LP has a higher value of PoD, whilst that from it value, the opposite happens. The integrated curve shows that the class LP has higher PoD (77%) than LF (63%). Carvalho [2] concluded that it must be explained by the fact that the defect LP is usually located in the root of weld and can therefore be detected by both sides of the beam. As for high dimensional defects, LP can be confused with the background echo, which does not happen with the LF, this may justify the higher PoD of LF from a given value of length.
Fauske et al [20] and Verkooijem et al [21] also concluded in their work that automatic inspection allows PoD values higher than manual inspection by ultrasonic. The first reached the value of 80% PoD for automatic detection of cracks of 10mm with a depth of 1 mm, while the manual inspection resulted in only 60%. Verkooijem [21], who worked with the classes LP, inclusion of slag and porosity, reached 83.6% probability of detection with automated pulse-echo ultrasound, 52.3% for manual technique and 82.4% for TOFD technique.
Carvalho [2] also concluded that automatic inspection provide PoD values much higher than manual inspection by ultrasonic. The graphs in Figure 5, which also include PoD curves for each inspector used in the tests show that the PoD of automated systems (pulse-echo and TOFD) is a typical case of ideal PoD, where there is a critical size defect below which there is no detection. Discussions on the performance of the inspectors can be found in [2].
(a) (b)
Fig. 5. PoD curves for defects LF and LP, respectively [2].
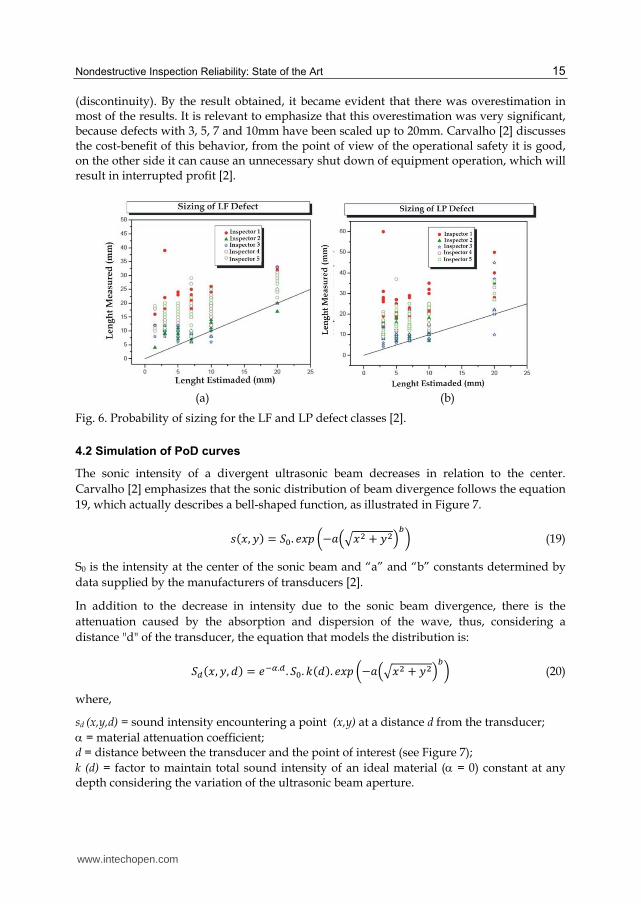
Figure 6 below shows the results of Carvalho [2] for what is called PoS (Probability of Sizing), which is a graph where the x-axis represents the expected size (projected) of the defect, and the y-axis represents the size found by the inspector. Thus, a point located at y = x, if the scales are the same in Cartesian axes, means accuracy in sizing of the defect
www.intechopen.com
Nondestructive Inspection Reliability: State of the Art 15
(discontinuity). By the result obtained, it became evident that there was overestimation in most of the results. It is relevant to emphasize that this overestimation was very significant, because defects with 3, 5, 7 and 10mm have been scaled up to 20mm. Carvalho [2] discusses the cost-benefit of this behavior, from the point of view of the operational safety it is good, on the other side it can cause an unnecessary shut down of equipment operation, which will result in interrupted profit [2].
(a) (b)
Fig. 6. Probability of sizing for the LF and LP defect classes [2].
4.2 Simulation of PoD curves
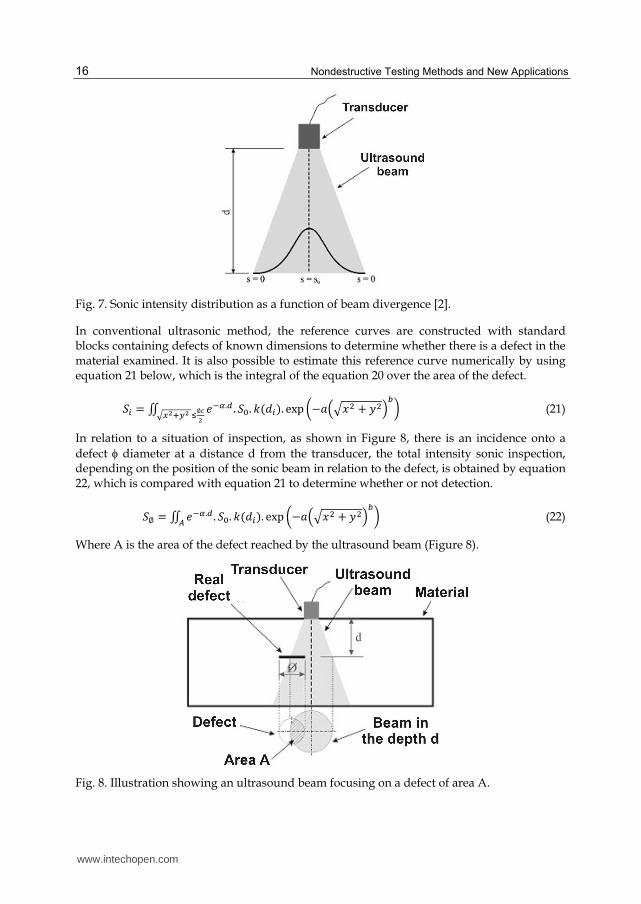
The sonic intensity of a divergent ultrasonic beam decreases in relation to the center.
Carvalho [2] emphasizes that the sonic distribution of beam divergence follows the equation
19, which actually describes a bell-shaped function, as illustrated in Figure 7.
嫌岫捲, 検岻 = 鯨待. 結捲喧 磐−欠岾紐捲態 + 検態峇長卑 (19)
S0 is the intensity at the center of the sonic beam and “a” and “b” constants determined by
data supplied by the manufacturers of transducers [2].
In addition to the decrease in intensity due to the sonic beam divergence, there is the
attenuation caused by the absorption and dispersion of the wave, thus, considering a
distance "d" of the transducer, the equation that models the distribution is:
鯨鳥岫捲, 検, 穴岻 = 結貸底.鳥 . 鯨待. 倦岫穴岻. 結捲喧 磐−欠岾紐捲態 + 検態峇長卑 (20)
where,
sd (x,y,d) = sound intensity encountering a point (x,y) at a distance d from the transducer;
= material attenuation coefficient; d = distance between the transducer and the point of interest (see Figure 7);
k (d) = factor to maintain total sound intensity of an ideal material ( = 0) constant at any depth considering the variation of the ultrasonic beam aperture.
www.intechopen.com
Nondestructive Testing Methods and New Applications 16
Fig. 7. Sonic intensity distribution as a function of beam divergence [2].
In conventional ultrasonic method, the reference curves are constructed with standard blocks containing defects of known dimensions to determine whether there is a defect in the material examined. It is also possible to estimate this reference curve numerically by using equation 21 below, which is the integral of the equation 20 over the area of the defect.
鯨沈 = ∬ 結貸底.鳥 . 鯨待. 倦岫穴沈紐掴鉄袋槻鉄丁∅迩鉄 岻. exp 磐−欠岾紐捲態 + 検態峇長卑 (21)
In relation to a situation of inspection, as shown in Figure 8, there is an incidence onto a
defect diameter at a distance d from the transducer, the total intensity sonic inspection, depending on the position of the sonic beam in relation to the defect, is obtained by equation 22, which is compared with equation 21 to determine whether or not detection.
鯨∅ = ∬ 結貸底.鳥 . 鯨待. 倦岫穴沈凋 岻. exp 磐−欠岾紐捲態 + 検態峇長卑 (22)
Where A is the area of the defect reached by the ultrasound beam (Figure 8).
Fig. 8. Illustration showing an ultrasound beam focusing on a defect of area A.
www.intechopen.com
Nondestructive Inspection Reliability: State of the Art 17
After the normalization process in relation to the pattern flaw c at d position, the R valued is:
迎 = ∬ 勅掴椎磐貸銚岾紐掴鉄袋槻鉄峇弐卑鳥掴鳥槻豚∬ 勅掴椎磐貸銚盤√掴鉄袋長鉄匪弐卑鳥掴鳥槻謬猫鉄甜熱鉄敦∅迩鉄 (23)
Then, if curveRR the flaw is detected, where Rcurve is the value of the employed reference
curve, that is, Rcurve = 1 for the 100% reference curve, and so on. After the simplification R becomes independent of s0 and k(d) [2].
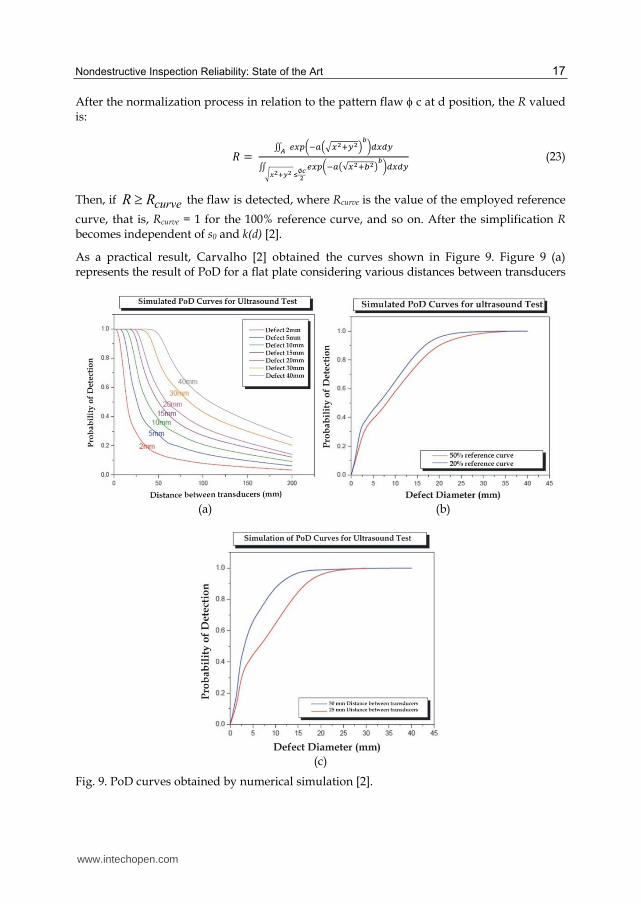
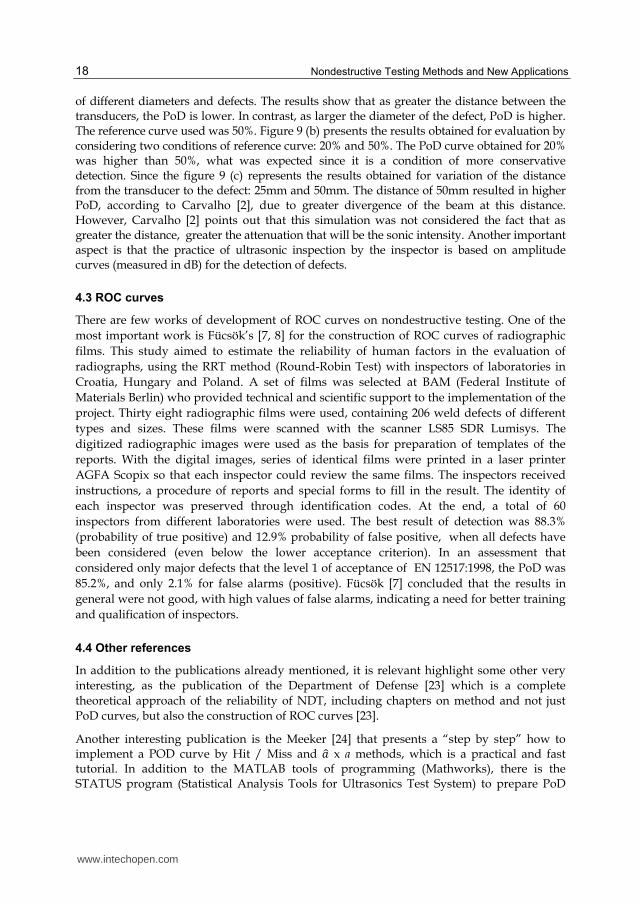
As a practical result, Carvalho [2] obtained the curves shown in Figure 9. Figure 9 (a) represents the result of PoD for a flat plate considering various distances between transducers
(a) (b)
(c)
Fig. 9. PoD curves obtained by numerical simulation [2].
www.intechopen.com
Nondestructive Testing Methods and New Applications 18
of different diameters and defects. The results show that as greater the distance between the transducers, the PoD is lower. In contrast, as larger the diameter of the defect, PoD is higher. The reference curve used was 50%. Figure 9 (b) presents the results obtained for evaluation by considering two conditions of reference curve: 20% and 50%. The PoD curve obtained for 20% was higher than 50%, what was expected since it is a condition of more conservative detection. Since the figure 9 (c) represents the results obtained for variation of the distance from the transducer to the defect: 25mm and 50mm. The distance of 50mm resulted in higher PoD, according to Carvalho [2], due to greater divergence of the beam at this distance. However, Carvalho [2] points out that this simulation was not considered the fact that as greater the distance, greater the attenuation that will be the sonic intensity. Another important aspect is that the practice of ultrasonic inspection by the inspector is based on amplitude curves (measured in dB) for the detection of defects.
4.3 ROC curves
There are few works of development of ROC curves on nondestructive testing. One of the
most important work is Fücsök’s [7, 8] for the construction of ROC curves of radiographic
films. This study aimed to estimate the reliability of human factors in the evaluation of
radiographs, using the RRT method (Round-Robin Test) with inspectors of laboratories in
Croatia, Hungary and Poland. A set of films was selected at BAM (Federal Institute of
Materials Berlin) who provided technical and scientific support to the implementation of the
project. Thirty eight radiographic films were used, containing 206 weld defects of different
types and sizes. These films were scanned with the scanner LS85 SDR Lumisys. The
digitized radiographic images were used as the basis for preparation of templates of the
reports. With the digital images, series of identical films were printed in a laser printer
AGFA Scopix so that each inspector could review the same films. The inspectors received
instructions, a procedure of reports and special forms to fill in the result. The identity of
each inspector was preserved through identification codes. At the end, a total of 60
inspectors from different laboratories were used. The best result of detection was 88.3%
(probability of true positive) and 12.9% probability of false positive, when all defects have
been considered (even below the lower acceptance criterion). In an assessment that
considered only major defects that the level 1 of acceptance of EN 12517:1998, the PoD was
85.2%, and only 2.1% for false alarms (positive). Fücsök [7] concluded that the results in
general were not good, with high values of false alarms, indicating a need for better training
and qualification of inspectors.
4.4 Other references
In addition to the publications already mentioned, it is relevant highlight some other very
interesting, as the publication of the Department of Defense [23] which is a complete
theoretical approach of the reliability of NDT, including chapters on method and not just
PoD curves, but also the construction of ROC curves [23].
Another interesting publication is the Meeker [24] that presents a “step by step” how to implement a POD curve by Hit / Miss and 欠賦 x a methods, which is a practical and fast tutorial. In addition to the MATLAB tools of programming (Mathworks), there is the STATUS program (Statistical Analysis Tools for Ultrasonics Test System) to prepare PoD
www.intechopen.com

Nondestructive Inspection Reliability: State of the Art 19
curves by the two methods of analyzing, as well as analysis of PoS (Probability of Sizing). Another program is the “mh1823” that also allows the construction of curves and performing reliability analysis (freely available).
There are several other publications which are listed below, which although not directly addressed in this work, especially not to make the technical discussion of the subject too repetitive, since many are similar to the methodology presented by the work described, they can be analyzed because present other applications of experimental situations [25-45].
4.5 General discussion
In general, the human factor is usually the cause of most failures to detect discontinuities, and that even well qualified and experienced inspectors make mistakes. Thus, automatic inspection methods allow significantly higher probability of detection as the ultrasonic method. However, it must be noted that sometimes the automatic inspection is still economically impracticable. Another important issue that a PoD analysis can support a choice when there are two possible methods of inspection of a given equipment, for example, if a method “A” cost 50% of a method “B” and if your PoD is 30% of “B” PoD , your actual cost is greater than “B”.
The experimental methods require high costs to be carried out, as well as time, as they demand the production an enough quantity of specimens to allow the correct estimation of relevant statistical parameters of the reliability curves and their confidence intervals. Another important point here is that the preparation of specimens with defects properly controlled, as in the case of welding defects, is an art a bit rare to find skilled professionals to do so. The defects made should reproduce the maximum of reality in terms of size, morphology and location in the weld. These methods employ mathematical tools for estimation of curves and log-normal function is most often employed for this purpose, although other functions can also be used. Considering the lack of samples in many studies, some researchers also resort to the techniques of simulation data, as the bootstrap technique to generate new data sets and produce the needed confidence intervals.
There is now a series of works focusing on numerical simulation of reliability curves as a solution to the disadvantages presented by the method of preparation of specimens. Nevertheless, despite the cost advantages and speed, it is extremely difficult to reproduce in a simulation all variables that are embedded in a real inspection and which are not easily quantified, such as those related to the human factor. In Mores’ study [46], there are descriptions of 39 variables that are relevant to an inspection by ultrasonic. Considering advances in tools and simulation programs, this methodology should gain more space compared to the experimental methods.
The probability of detection of defects has been used to meet the requirements for equipment design, and has worked as a tool for comparing the performance capabilities of various NDT methods, procedures and guidance of qualified professionals.
5. Conclusions
The reliability of nondestructive testing has been the subject of important research projects over the past 40 years, many of them highlighted in this work, which can reach the main conclusions:
www.intechopen.com
Nondestructive Testing Methods and New Applications 20
Most of the works present experimental methodologies of specimens manufacture. In this case, one should always look for the minimum number of defects generated in order to get the better estimation of PoD curves and their confidence intervals.
The preparation of samples requires extreme skill, in particular, the welded specimens must contain defects that are the most realistic possible with ideal dimensions to regulatory acceptance criteria used.
Some functions are usually employed to model mathematically the PoD curve obtained with some experimental data, and the Log-Normal function is the normally chosen by the researchers.
Due to the disadvantages of experimental methods related to the time, cost and logistics, the simulation of PoD and ROC curves can be a solution, having already carried out several experiments in this direction. However, it is necessary to emphasize that is very difficult to reproduce in simulation, either physical or numerical (simulations of ultrasonic or radiographic tests, for example), several factors that occur in a real inspection, especially those related to the human factors, which generally make a major influence on PoD. But with the advances of the simulators, it is possible that this disadvantage be mitigated in a near future.
The methodologies for estimating the reliability of NDT are extremely important for modern industry and will increasingly focus investments.
6. References
[1] Silk, M G. The Reliability of Non-destructive Inspection. Assessing the Assessment of Structures under Stresse. Adam Hilger, Bristol. 1987.
[2] Carvalho, A. A. Confiabilidade de Técnicas de Ensaios Não Destrutivos na Inspeção de Dutos Utilizados na Indústria do Petróleo. Tese de Doutorado. COPPE. Rio de Janeiro, 2006. (In portuguese).
[3] Carvalho, A. A., Sagrilo, L. V. S., Silva, I. C., et al. The POD Curve for the Detection of Planar Defects Using a Multi-Channel Ultrasonic System. Insight, Vol. 44, N°. 10, p. 689-693, 2002.
[4] Carvalho, A.A. Rebello, J.M.A. Silva, R.R. Sagrilo, L.V.S. Reliability of the Manual and Automatic Ultrasonic Technique in the Detection of Pipe Weld Defects. Insight, vol. 48, n.11, November 2006.
[5] Georgiou, G.A. PoD Curves, their Derivation, Application and Limitations. Vol. 49, n.7. Insight, p. 409-413, 2007.
[6] Ang, A.H.S. Tang, W.H. Proabability Concepts in Engineering Planing and Design – Decision, Risk an Realibility, vol. 3, New York, Editora Jonh Wiley & Sons, 1984.
[7] Fücsök, F. Muller, C. Reliability of Routine Radiographic Film Evaluation – An Extended ROC Study of the Human Factor. 8th ECNDT, Barcelona 2002.
[8] Fücsök, F. Muller, C, Scharmach, M. Measuring of The Reliability of NDE. 8th International Conference of the Slovenian Society for Nondestrutive Testing. Application of Contemporary Nondestrutive Testing in Engineering. September 1-3, Slovenia, pp. 173-180.
[9] Schoefs, F., Clément, A., Nouy, A. Assessment of ROC curves for inspection of random fields. Structural Safety. Vol. 31, p.409-419, 2009.
www.intechopen.com
Nondestructive Inspection Reliability: State of the Art 21
[10] Nockemann, C. Heidt, H. H. Thomsen, N. Reliability in NDT: ROC Study of Radiographic Weld Inspections. C. Nockemann, H. Heidt and N. Thomsen. NDT&E International, vol. 24, n.5, October 1991.
[11] http://www.asnt.org/publications/materialseval/basics/jan98basics/jan98basics.htm (acesso em 10/05/2011).
[12] Bullough, R., Dolby, R.E., Beardsmore, D.W., Burdekin, F.M., Schneider, C.R.A. The Probability of Formation and Detection of Large Flaws in Welds. International Journal of Pressure Vessels and Piping. Vol. 84, p.730-738.
[13] Lamaitre, P., Koblé, T.D. Summary of the PISC Round Robin Results on Wrought and Cast Austenitic Steel Weldments, Part I: Wrought to Wrought Capability Study. International Journal of Pressure Vessels & Piping. Vol. 69, pp. 5-19, 1996.
[14] Lamaitre, P., Koblé, T.D. Summary of the PISC Round Robin Results on Wrought and Cast Austenitic Steel Weldments, Part II: Wrought to Cast Capability Study. International Journal of Pressure Vessels & Piping. Vol. 69, pp. 21-32, 1996.
[15] Lamaitre, P., Koblé, T.D. Summary of the PISC Round Robin Results on Wrought and Cast Austenitic Steel Weldments, Part III: Cast to Castt Capability Study. International Journal of Pressure Vessels & Piping. Vol. 69, pp. 33-44, 1996.
[16] PoD/PoS Curves for Nondestrutive Examination – Offshore Technology Report, 2000/018. Prepared by Visser Consultancy Limited for the Health and Safety Executive (HSE).
[17] NDT of Thin Plates – Evaluation of Results. Nil Report. NDP 93-38 Rev.1. (in Dutch), 1995.
[18] Dover, W.D., Rudlin, J.R. Results of Probability of Detection Trials. Proc. IOCE 91, Aberdeen, 13-16 October 1992.
[19] Efron, B., Tibshirani, R. J., “AN Introduction to the Bootstrap”, 1a Edição,New York, Editora Chapman & Hall/CRC, 1993.
[20] Fauske, T. H., Dalberg, P., Hansen, A. Ultrasonic Crack Detection Trials. 15th WCNDT - World Conference on Nondestructive Testing. Roma, October, 2000.
[21] Verkooijem, J. The Need for Reliable NDT Measurements in Plant Management Systems. 7th ECNDT - European Conference on Nondestructive Testing. Copenhagen, May, 1998.
[22] Bartholo, P.U. Modelagem da Probabilidade de Detecção do Ensaio Ultrassônico e Avaliação da Influência de Inspetores e Tipos de Defeitos. Projeto Final de Curso. Universidade Federal do Rio de Janeiro, RJ, Brasil, 2008. (In portuguese).
[23] MIL-HDBK-1823. Non-Destructive Evaluation System Reliability Assessment, 1999. [24] Meeker, W. Q. and Escobar, L. A. Statistical Methods for Reliability Data, John Wiley
and Sons, New York. [25] Forsyth, D. S., Fahr A., “On the Independence of Multiple Inspections and the Resulting
Probability of Detection”, Quantitative Nondestructive Evaluation, Iowa, July, 2000. [26] Wall, M. Wedgwood, F. A. Burch, S. Modeling of NDT Reliability (POD) and Applying
Corrections for Human Factors. 7th ECNDT European Conference on Nondestructive Testing. Copenhagen, May, 1998.
[27] Forsyth, D. S. Fahr A. Leemans, D. V. et al. Development of POD from In-Service NDI Data. Quantitative Nondestructive Evaluation. Iowa, July, 2000.
[28] Topp, D. A. Dover, W. D. Reliability of Non-Destructive Inspection Test. Análisis de Riesgo y confiabilidad Estructural de Instalaciones Marinas. México, diciembre, 2001.
www.intechopen.com
Nondestructive Testing Methods and New Applications 22
[29] Olin, B.D, Meeku, Willian Q. Application of Statistical Methods to Nondestructive Evaluation. Technometrics, vol. 38, n.2, 1996, p. 95-112.
[30] Wall, M. Burch, S. Lilley, J. Human Factors in POD Modelling and Use of Trial Data. Insight, Vol. 51, N. 10, October 2009.
[31] Rummel, W D. Recommended practice for a demonstration of non-destructive evaluation (NDE) reliability on aircraft production parts’. Materials Evaluation Vol. 40. August 1982.
[32] Generazio, E.R. Directed Design of Experiments for Validating Probability of Detection Capability of NDE Systems. Review of Quantitative Nondestructive Evaluation. Vol.27, p. 1693-1700, 2008.
[33] Burch, S.F., Stow, B.A., Wall, M. Computer Modelling for the Prediction of the Probability of Detection of Ultrasonic Corrosion Mapping. Vol. 4, n.12, Insight, pp.761-765, December 2005.
[34] Gandossi, L., Simola, K. Derivation and Use of Probability of Detection Curves in the Nuclear Industry. Insight, Vol. 52, n. 12, December, 2010.
[35] Sweeting, Trevor. Statistical Models for Nondestructive Evaluation. International Statistical Review. Vol. 63, n.2, p. 199-214, 1995.
[36] Wall, M., Burch, S.F., Lilley, J. Review of Models and Simulators for NDT. Vol. 51, n.11, Insight, November 2009.
[37] Hong, H.P. Reliability Analysis with Nondestructive Inspection. Structural Safety, Vol. 19. N.14, pp. 383-395, 1997.
[38] Bullough, R., Burdekin, F.M., Chapman, O.V.J., Green, V.R., Lidbury, D.P.G, Pisarski, H., Warnick, R.G., Wintle, J.B. The Probabibility of “Large” Defects in Thick-Section Butt Welds in Nuclear Components. International Journal of Pressure Vessels and Piping, Vol. 78, p. 553-565, 2001.
[39] Kazantsev, I.G., Lemakien, I., Salov, G.I., Denys, R. Statistical Detection of Defects in Radiographic Images in Nondestructive Testing. Signal Processing. Vol. 82, p. 791-801, 2002.
[40] Wall, M., Burch, S.F., Lilley, J. Simulators for NDT Reliability (PoD). Insight, Vol. 51, p. 612-619, 2009.
[41] Wall, M.,Wedgwood, F.A., Burch, S. Modeling of NDT Reliability (PoD) and Applying Correction for Human Factors. 7th European Conference on Nondestructive Testing. Copenhagen, 1998.
[42] Forsyth, D.S., A., Leemans, D.V., et al. Development of PoD from In-service NDI Data. Quantitative Nondestructive Evaluation, EUA, 2000.
[43] Topp, D.A., Dover, W.D. Reliability of Nondestructive Inspection Test. Análisis de Riesgo y Confiabilidad Estructural de Instalaciones Marinas, México, 2001.
[44] Simola, K., Pulkkinen, U. Models for Nondestructive Inspection Data. Reliability Engineering and System Safety. Vol. 60, p. 1-12, 1998.
[45] Serabian, S. Ultrasonic Probability of Detection of Subsurface Flaws. Materials Evaluation. Vol. 40, p. 294-298, 1982.
[46] Moré, J.D. Aplicação de Lógica Fuzzy para Avaliação da Confiabilidade Humana nos Ensaios Não Destrutivos Tipo Ultrassom. Tese de Doutorado. COPPE/UFRJ, Rio de Janeiro, 2004.
www.intechopen.com
Nondestructive Testing Methods and New ApplicationsEdited by Dr. Mohammad Omar
ISBN 978-953-51-0108-6Hard cover, 264 pagesPublisher InTechPublished online 02, March, 2012Published in print edition March, 2012
InTech EuropeUniversity Campus STeP Ri Slavka Krautzeka 83/A 51000 Rijeka, Croatia Phone: +385 (51) 770 447 Fax: +385 (51) 686 166www.intechopen.com
InTech ChinaUnit 405, Office Block, Hotel Equatorial Shanghai No.65, Yan An Road (West), Shanghai, 200040, China
Phone: +86-21-62489820 Fax: +86-21-62489821
Nondestructive testing enables scientists and engineers to evaluate the integrity of their structures and theproperties of their materials or components non-intrusively, and in some instances in real-time fashion.Applying the Nondestructive techniques and modalities offers valuable savings and guarantees the quality ofengineered systems and products. This technology can be employed through different modalities that includecontact methods such as ultrasonic, eddy current, magnetic particles, and liquid penetrant, in addition tocontact-less methods such as in thermography, radiography, and shearography. This book seeks to introducesome of the Nondestructive testing methods from its theoretical fundamentals to its specific applications.Additionally, the text contains several novel implementations of such techniques in different fields, including theassessment of civil structures (concrete) to its application in medicine.
How to referenceIn order to correctly reference this scholarly work, feel free to copy and paste the following:
Romeu R. da Silva and Germano X. de Padua (2012). Nondestructive Inspection Reliability: State of the Art,Nondestructive Testing Methods and New Applications, Dr. Mohammad Omar (Ed.), ISBN: 978-953-51-0108-6, InTech, Available from: http://www.intechopen.com/books/nondestructive-testing-methods-and-new-applications/nondestructive-inspection-reliability-state-of-the-art