
Non-stationary influence of El Niño-Southern …...circulation patterns (ENSO, NAO), and regional...
14
ARTICLE Non-stationary influence of El Niño-Southern Oscillation and winter temperature on oak latewood growth in NW Iberian Peninsula Vicente Rozas & Ignacio García-González Received: 14 December 2010 / Accepted: 15 July 2011 /Published online: 5 August 2011 # ISB 2011 Abstract The properties of El Niño-Southern Oscillation (ENSO), such as period, amplitude, and teleconnection strength to extratropical regions, have changed since the mid-1970s. ENSO affects the regional climatic regime in SW Europe, thus tree performance in the Iberian Peninsula could be affected by recent ENSO dynamics. We estab- lished four Quercus robur chronologies of earlywood and latewood widths in the NW Iberian Peninsula. The relationship between tree growth and the Southern Oscilla- tion Index (SOI), the atmospheric expression of ENSO, showed that only latewood growth was correlated nega- tively with the SOI of the previous summer–autumn–winter. This relationship was non-stationary, with significant correlations only during the period 1952–1980; and also non-linear, with enhanced latewood growth only in La Niña years, i.e. years with a negative SOI index for the previous autumn. Non-linear relationship between latewood and SOI indicates an asymmetric influence of ENSO on tree performance, biassed towards negative SOI phases. During La Niña years, climate in the study area was warmer and wetter than during positive years, but only for 1952–1980. Winter temperatures became the most limiting factor for latewood growth since 1980, when mean regional temper- atures increased by 1°C in comparison to previous periods. As a result, higher winter respiration rates, and the extension of the growing season, would probably cause an additional consumption of stored carbohydrates. The influence of ENSO and winter temperatures proved to be of great importance for tree growth, even at lower altitudes and under mild Atlantic climate in the NW Iberian Peninsula. Keywords Annual tree rings . Dendrochronology . ENSO . Climate warming . Latewood . Quercus robur Introduction Dendroclimatologists focus on the impacts of locally measured climatic components on the radial growth dynamics of trees, but also on the effects of large-scale climatic patterns of tree growth (Peterson and Peterson 2001; Schöngart et al. 2004). The productivity and dynamics of aquatic and terrestrial ecosystems worldwide can be influenced by climatic teleconnections, which account for major variations in local weather and climate (Stenseth et al. 2002). The dominant teleconnections that affect weather and climate variability worldwide [e.g. North Atlantic Oscillation (NAO), El Niño-Southern Oscillation (ENSO)], provide a broad understanding of observed changes in the local physical environment and the associ- ated ecological processes (Stenseth et al. 2003). ENSO is the strongest interannual variation of the Earth’ s climate, affecting a wide range of geographic areas (McPhaden et al. 2006), and it fluctuates between two phases with unusually warm and cold conditions in the tropical Pacific Ocean, the Electronic supplementary material The online version of this article (doi:10.1007/s00484-011-0479-5) contains supplementary material, which is available to authorized users. V. Rozas (*) Misión Biológica de Galicia (MBG), Consejo Superior de Investigaciones Científicas (CSIC), Apdo. 28, 36080 Pontevedra, Spain e-mail: [email protected] I. García-González Departamento de Botánica, Escola Politécnica Superior, Universidade de Santiago de Compostela, Campus de Lugo, 27002 Lugo, Spain Int J Biometeorol (2012) 56:787–800 DOI 10.1007/s00484-011-0479-5
Transcript of Non-stationary influence of El Niño-Southern …...circulation patterns (ENSO, NAO), and regional...
ARTICLE
Non-stationary influence of El Niño-Southern Oscillationand winter temperature on oak latewood growth in NWIberian Peninsula
Vicente Rozas & Ignacio García-González
Received: 14 December 2010 /Accepted: 15 July 2011 /Published online: 5 August 2011# ISB 2011
Abstract The properties of El Niño-Southern Oscillation(ENSO), such as period, amplitude, and teleconnectionstrength to extratropical regions, have changed since themid-1970s. ENSO affects the regional climatic regime inSW Europe, thus tree performance in the Iberian Peninsulacould be affected by recent ENSO dynamics. We estab-lished four Quercus robur chronologies of earlywood andlatewood widths in the NW Iberian Peninsula. Therelationship between tree growth and the Southern Oscilla-tion Index (SOI), the atmospheric expression of ENSO,showed that only latewood growth was correlated nega-tively with the SOI of the previous summer–autumn–winter.This relationship was non-stationary, with significantcorrelations only during the period 1952–1980; and alsonon-linear, with enhanced latewood growth only in La Niñayears, i.e. years with a negative SOI index for the previousautumn. Non-linear relationship between latewood and SOIindicates an asymmetric influence of ENSO on treeperformance, biassed towards negative SOI phases. DuringLa Niña years, climate in the study area was warmer andwetter than during positive years, but only for 1952–1980.
Winter temperatures became the most limiting factor forlatewood growth since 1980, when mean regional temper-atures increased by 1°C in comparison to previous periods.As a result, higher winter respiration rates, and theextension of the growing season, would probably cause anadditional consumption of stored carbohydrates. Theinfluence of ENSO and winter temperatures proved to beof great importance for tree growth, even at lower altitudesand under mild Atlantic climate in the NW IberianPeninsula.
Keywords Annual tree rings . Dendrochronology . ENSO .
Climate warming . Latewood .Quercus robur
Introduction
Dendroclimatologists focus on the impacts of locallymeasured climatic components on the radial growthdynamics of trees, but also on the effects of large-scaleclimatic patterns of tree growth (Peterson and Peterson2001; Schöngart et al. 2004). The productivity anddynamics of aquatic and terrestrial ecosystems worldwidecan be influenced by climatic teleconnections, whichaccount for major variations in local weather and climate(Stenseth et al. 2002). The dominant teleconnections thataffect weather and climate variability worldwide [e.g. NorthAtlantic Oscillation (NAO), El Niño-Southern Oscillation(ENSO)], provide a broad understanding of observedchanges in the local physical environment and the associ-ated ecological processes (Stenseth et al. 2003). ENSO isthe strongest interannual variation of the Earth’s climate,affecting a wide range of geographic areas (McPhaden et al.2006), and it fluctuates between two phases with unusuallywarm and cold conditions in the tropical Pacific Ocean, the
Electronic supplementary material The online version of this article(doi:10.1007/s00484-011-0479-5) contains supplementary material,which is available to authorized users.
V. Rozas (*)Misión Biológica de Galicia (MBG),Consejo Superior de Investigaciones Científicas (CSIC),Apdo. 28,36080 Pontevedra, Spaine-mail: [email protected]
I. García-GonzálezDepartamento de Botánica, Escola Politécnica Superior,Universidade de Santiago de Compostela,Campus de Lugo,27002 Lugo, Spain
Int J Biometeorol (2012) 56:787–800DOI 10.1007/s00484-011-0479-5

so-called El Niño and La Niña, respectively. The conse-quences of ENSO on the dynamics of vegetation andprimary productivity have been demonstrated over a widerange of terrestrial ecosystems, causing their most impor-tant effects under arid and semiarid climates at tropicallatitudes (Fichtler et al. 2004; Holmgren et al. 2001).
ENSO also influences the climate of extratropicalregions, with wet periods typically associated with El Niño[positive Southern Oscillation Index (SOI)] phases, anddroughts connected to La Niña (negative SOI) episodes insouthern and western North America (Cleaveland andDuvick 1992; Swetnam and Betancourt 1998). By contrast,El Niño events induce cooler surface temperatures, reducedcloud cover, and reduced precipitation in northern NewZealand, with opposite effects of La Niña phases (Fowler etal. 2000). As a consequence, important ecological processesat regional scale in the extratropics, such as synchronic treeestablishment, vegetation productivity and dynamics, treegrowth patterns, insect outbreaks, wildfires or tree dieback,are associated with interannual wet-dry cycles derived fromENSO dynamics (Fowler et al. 2008; Schöngart et al. 2004;Swetnam and Betancourt 1998; Villalba and Veblen 1998).ENSO influence also appears in southwest Europe andnorthern Africa, with a significant impact on winter–springrainfall, river discharge, and lake level variation in theIberian Peninsula (Knippertz et al. 2003; Pozo-Vázquez etal. 2005; Rodó et al. 1997). Although ENSO influence onEuropean climate could be considered stationary during thelast centuries (Brönnimann et al. 2007), previous studiessuggested that ENSO teleconnection to extratropical areas,and particularly to southern Europe, can vary from regionto region, and can also change over time (Rodó et al. 1997;D’Arrigo et al. 2005; Pozo-Vázquez et al. 2005). We canexpect negative sea-level pressure anomalies west of Spainand over southern Europe during El Niño events (Pozo-Vázquez et al. 2005; Brönnimann et al. 2007), which, incombination with other large-scale circulation patterns suchas NAO, can significantly influence rainfall regimes in theIberian Peninsula (Rodó et al. 1997; Zorita et al. 1992).
Measured climatic records during the last decadessuggest that a warming trend in Western Europe is muchstronger than predicted by climate models, despite the factthat such models already predict exceptionally high temper-atures and a great climatic variability over SW Europe(IPCC 2007; van Oldenborgh et al. 2009). The phenologyof temperate forests is driven mainly by temperature, whichaffects the start of the growing season, and thereby itsduration (Kramer et al. 2000). Predictions for the end of thetwenty-first century anticipate an average increase in theduration of the growing season of about 20 days forEuropean oaks, with a predicted increase of up to 30 daysin SW Europe (Lebourgeois et al. 2010). The observedextension of the growing season for European tree species
during recent decades is mainly the result of an earlier onsetof spring due to increased winter–spring temperatures(Chmielewski and Rötzer 2001). In general, an increase inthe length of the growing season increases tree growth indeciduous forest stands (Rötzer et al. 2004).
Quercus robur is a deciduous, long-living tree that isdominant throughout a wide geographic and ecologicalrange over Eastern, Central, and Atlantic Europe (Ducoussoand Bordacs 2004). In general, the radial growth of thisspecies in the Mediterranean region is related negativelyto temperature during May–July of the active growingperiod (Tessier et al. 1994), while the response innorthernmost locations is opposite, often showing apositive response to July temperature (Pilcher and Gray1982). However, the positive impact of spring–summerrainfall on oak ring widths is a general feature throughoutEurope (Friedrichs et al. 2009; Hilasvuori and Berninger2010; Tessier et al. 1994). Accordingly, previous studies ofQ. robur in NW Spain showed that radial growth is limitedmainly by water availability during the growing season,primarily during summer (García-González and Eckstein2003), or by elevated winter temperatures (Rozas 2005;Rozas et al. 2009).
In this work, we studied the influence of large-scalecirculation patterns (ENSO, NAO), and regional climate onthe inter- and intra-annual tree-growth variation in fourpopulations of Quercus robur in the NW Iberian Peninsula,at the southwestern edge of its world range. The particularquestions to be addressed are the following: are tree-ringseries sensitive to ENSO, NAO, and regional climate in theNW Iberian Peninsula? Has the sensitivity of the tree-ringgrowth to ENSO, NAO, and regional climate changed overthe last century? How do large-scale climatic patternsimpact regional climate to induce a particular response ontree growth?
Materials and methods
Study sites
We selected four populations of Q. robur located at least50 km apart in Galicia (42.19–43.58°N, 7.22–8.96°W), NWSpain (Fig. 1a). Two sites were located at low elevations(Table 1; Baio and Ribeiro do Bispo, below 300 m),whereas the others were at higher elevations (Estornín andSan Mamede, above 800 m). The sites were relativelyundisturbed by human management, at least during the lastdecades, without any other significant treatment than theoccasional removal of dead trees for lumber. The regionalclimate is temperate and humid, with a mean yearlytemperature ranging between 10.8 and 13.4°C, and yearlyrainfall between 1,071 and 1,392 mm (averages for the
788 Int J Biometeorol (2012) 56:787–800

period 1910–2006). A conspicuous elevation of the meanregional temperature was revealed by its general trendwithin the period 1910–2006, which significantly (P<0.001) fitted to a rising quadratic line (Fig. 1b). Annualprecipitation varied slightly throughout the period consid-ered, although there was also a slight rising trend (P=0.026;Fig. 1c).
Sampling, sample processing and tree-ring measurement
We took at least two 5-mm diameter cores per tree from 18to 31 dominant trees at each site, using an increment borerat breast height. The cores were air-dried, glued ontowooden mounts, surfaced mechanically, and then polishedmanually with successively finer grades of sandpaper until
8ºW 7ºW9ºW
43ºN
42ºN
Sampling sites
Elevation above 500 m
Elevation above 1000 m
distribution range
Study area
Quercus robur
BAI
BIS
EST
SAM
0 25 50 km
N
(A)
1910 1920 1930 1940 1950 1960 1970 1980 1990 2000 2010
Year AD
11.5
12.5
13.5
11
12
13
14
Mea
n an
nual
tem
pera
ture
(o C)
1910 1920 1930 1940 1950 1960 1970 1980 1990 2000 2010
Year AD
600
800
1000
1200
1400
1600
1800
2000
Tota
l ann
ual p
reci
pita
tion
(mm
)
(B) (C)r = 0.530 p < 0.001
y = 559.678 - 0.575 x + 0.001 x
r = 0.051 p = 0.026
y = -2242.250 + 1.738 x
2
2
2
Fig. 1 a Location of the sampling sites in the NW Iberian Peninsulanear the southwestern range boundary of Quercus robur (according toDucousso and Bordacs 2004). Site codes are described in Table 1.Mean annual temperature (b) and total annual precipitation (c) for theperiod 1910–2006, averaged annually from the gridded CRU TS 3
datasets of the T and P series in those 0.5°×0.5° squarescorresponding to the four study sites. The annual period consideredextends from 1 October of the prior year to 30 September of thecurrent year. Dashed lines Adjusted trends, and statistics ofregressions from these trends are shown
Int J Biometeorol (2012) 56:787–800 789
the xylem cellular structure was visible in the transverseplane. The tree-ring series were dated absolutely byassigning calendar years to the rings through the identifi-cation of characteristic ring sequences. Earlywood (EW)and latewood (LW) widths were measured under magnifi-cation to the nearest 0.001 mm with a Velmex Unislidesliding-stage micrometer (Velmex, Bloomfield, NY) inter-faced with a computer; the conspicuously larger vessels inthe EW, and its abrupt transition to the LW allowed an easydiscrimination of both tree-ring compartments. Since bothcan be influenced by climate during different seasons, thedevelopment of separate EW and LW chronologies canprovide a more detailed assessment of intraannual climaticsensitivity (Rozas et al. 2009). The computer programCOFECHA (Grissino-Mayer 2001) was used to checkquantitatively for crossdating errors. We used the seriesthat had been dated confidently to compute the chronolo-gies of EW and LW for each site.
Chronologies computation and assessment
Each raw ring-width series was standardized with theARSTAN computer program (Cook and Holmes 1996).Both the ages of the sampled trees and the low-frequencyvariation of radial growth showed a high inter-individualvariability, which could act as a relevant masking factor inthe analysis of climate–growth relationships. Therefore, weused a flexible detrending, i.e. a spline function with a 50%frequency response of 32 years, in order to successfully
remove the low-frequency trends and maximise the high-frequency climatic signal in our tree-ring index chronolo-gies (Cook and Peters 1981). The residuals obtained werepre-whitened by autoregressive modelling, giving dimen-sionless indices that represent independent records ofannual growth for each measured series. The indices forthe individual series were averaged by biweight robustmeans, and the mean chronologies were truncated when thesample size was lower than five trees. The statistical qualityof the chronologies was assessed in the optimum commonperiod for each site using basic statistics to measure thecommon signal (Briffa and Jones 1990), i.e. signal-to-noiseratio (SNR), expressed populations signal (EPS), meanseries intercorrelation (Rbar), and variance explained by thefirst principal component (PC1). SNR indicates the strengthof the observed common signal among trees, EPS quanti-fies the degree to which the obtained chronology representsthe theoretically perfect chronology, Rbar is the mean valueof all possible correlations between the radial series, andPC1 indicates the percentage of year-to-year growthvariation shared by trees. Regional growth chronologieswere obtained as the year-by-year mean of the localchronologies, for the common period to all sites.
Climatic data
We used the SOI, the atmospheric expression of ENSO, tomonitor its effects on tree growth and regional climate. SOI iscalculated as the standardised difference of sea level pressure
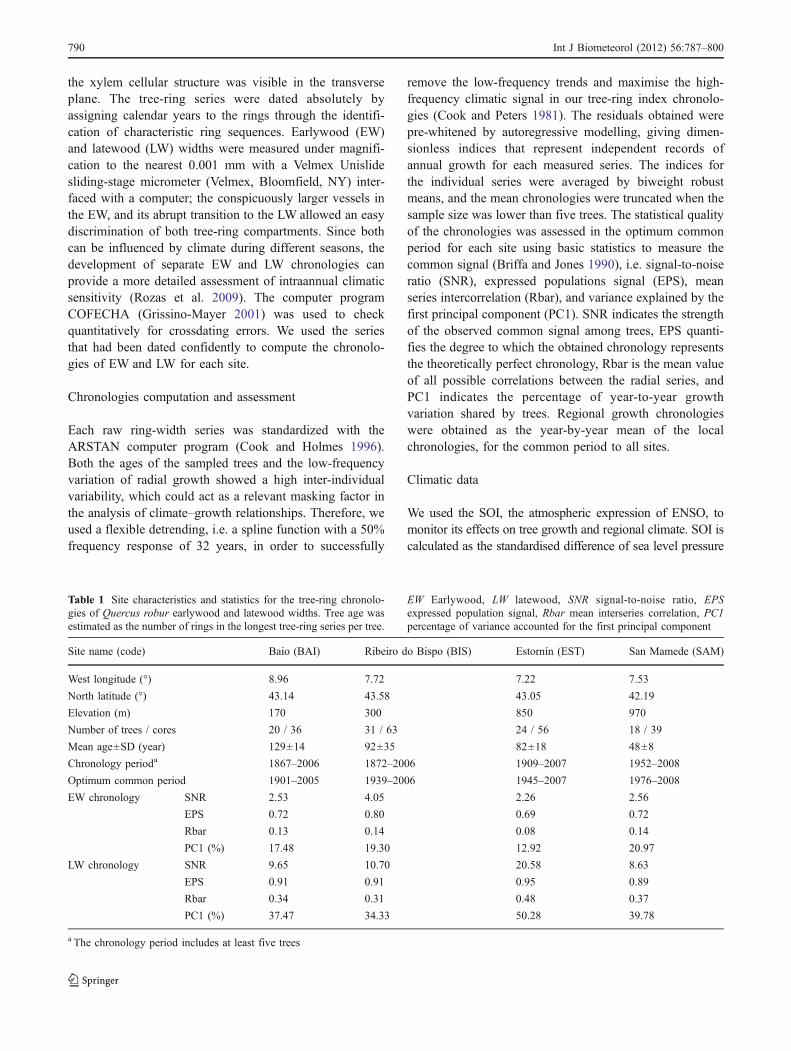
Table 1 Site characteristics and statistics for the tree-ring chronolo-gies of Quercus robur earlywood and latewood widths. Tree age wasestimated as the number of rings in the longest tree-ring series per tree.
EW Earlywood, LW latewood, SNR signal-to-noise ratio, EPSexpressed population signal, Rbar mean interseries correlation, PC1percentage of variance accounted for the first principal component
Site name (code) Baio (BAI) Ribeiro do Bispo (BIS) Estornín (EST) San Mamede (SAM)
West longitude (°) 8.96 7.72 7.22 7.53
North latitude (°) 43.14 43.58 43.05 42.19
Elevation (m) 170 300 850 970
Number of trees / cores 20 / 36 31 / 63 24 / 56 18 / 39
Mean age±SD (year) 129±14 92±35 82±18 48±8
Chronology perioda 1867–2006 1872–2006 1909–2007 1952–2008
Optimum common period 1901–2005 1939–2006 1945–2007 1976–2008
EW chronology SNR 2.53 4.05 2.26 2.56
EPS 0.72 0.80 0.69 0.72
Rbar 0.13 0.14 0.08 0.14
PC1 (%) 17.48 19.30 12.92 20.97
LW chronology SNR 9.65 10.70 20.58 8.63
EPS 0.91 0.91 0.95 0.89
Rbar 0.34 0.31 0.48 0.37
PC1 (%) 37.47 34.33 50.28 39.78
a The chronology period includes at least five trees
790 Int J Biometeorol (2012) 56:787–800
between Tahiti in the eastern Pacific and Darwin in northernAustralia (Stenseth et al. 2003). Monthly SOI data for theperiod 1866–2008 were obtained from the Web site of theNational Center for Atmospheric Research, United States(http://www.cgd.ucar.edu/cas/catalog/climind/). In addition weobtained monthly NAO data (Gibraltar–Iceland: http://www.cru.uea.ac.uk/cru/data/nao/) for the period 1821–2006, inorder to test the effects of NAO on our tree-ring chronologies.
The growth of deciduous oaks has proved to becontrolled by a complex combination of several climaticfactors rather than by a single limiting factor (Friedrichs etal. 2009). Therefore, we used monthly gridded data (CRUTS 3 and CRU self-calibrating PDSI, 0.5°×0.5°) for meanand maximum temperature (T and Tmax, respectively,period 1901–2006), total precipitation (P, period 1901–2006), Palmer Drought Severity Index (PDSI, period 1901–2002; Dai et al. 2004) and vapour pressure (VP, period1901–2006), taken from the Web site of the Royal Nether-lands Meteorological Institute (http://climexp.knmi.nl/).Annual values were calculated from monthly values onthe basis of the hydrologic year, 1 October of the prior year[Oct (t−1)] to 30 September of the current year [Sep (t)].Regional values of T, Tmax, P, PDSI, and VP values werecalculated as the year-by-year mean of these climatic seriesfrom the four 0.5° longitude×0.5° latitude squarescorresponding to the four study sites.
Climate–growth relationships
Correlations between monthly SOI and NAO records, andresidual indices of EW and LW, were calculated for thecommon period 1952–2006. The temporal window forclimatic variables was taken from June of the year beforering formation [Jun (t−1)] to September of the year of ringformation [Sep (t)]. The effects of large-scale climaticfluctuations on tree growth may be difficult to ascertainbecause the relationships between climate and localprocesses are frequently non-stationary (i.e. time varying)and/or non-linear (Stenseth et al. 2003). For these reasons,we paid special attention to the detection of non-stationaryand non-linear relationships among tree growth, SOI, NAO,and local climate indicators. To evaluate the stationarity andconsistency of the relationships over time, we calculatedmoving 25-year correlation coefficients with the softwareDENDROCLIM2002 (Biondi and Waikul 2004), for 1910–2006. A bootstrap procedure was used for significancetesting based on 1,000 iterations, and each correlationcoefficient was considered to be significant (P<0.05) if itwas at least twice, in absolute value, its bootstrappedstandard deviation (|r/sd|≥2).
Tree growth–climate relationships were analysed usingstepwise multiple linear regression in three consecutiveperiods selected a posteriori within 1910–2006, by taking
0.2
0.6
1.0
1.4
1.8
0.2
0.6
1.0
1.4
0.2
0.6
1.0
1.4
Tre
e-rin
g in
dex
1880 1900 1920 1940 1960 1980 2000
Year AD
0.2
0.6
1.0
1.4
BAI
BIS
EST
SAM
EWLW
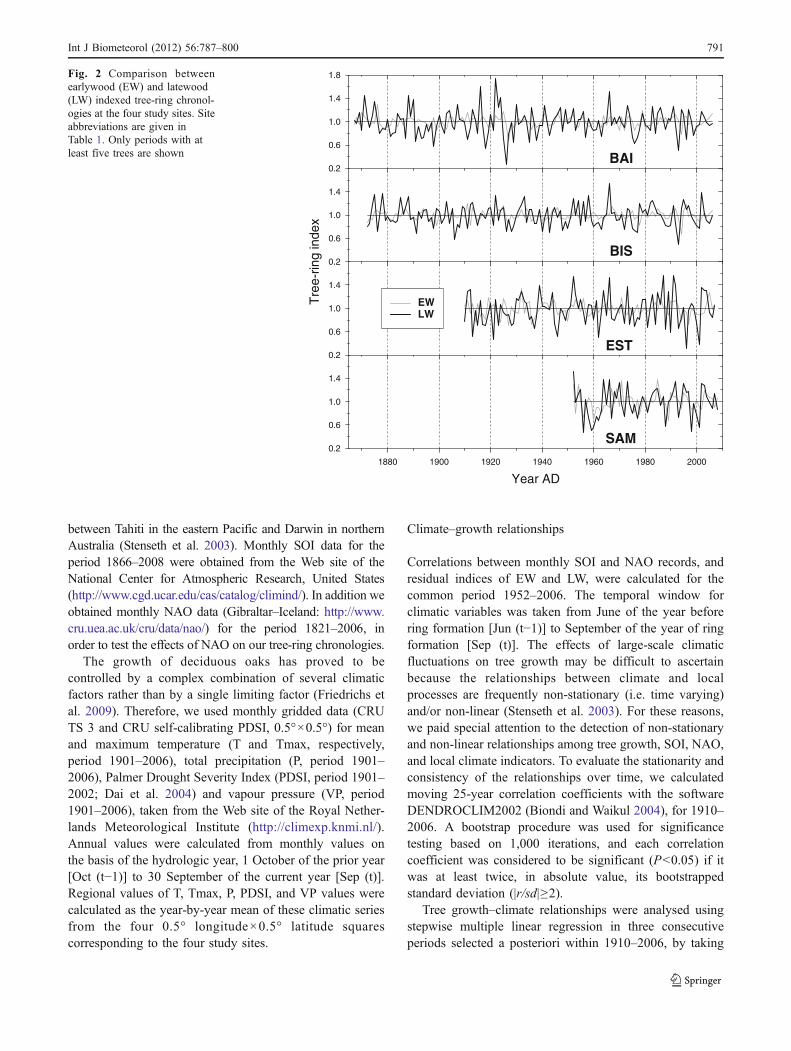
Fig. 2 Comparison betweenearlywood (EW) and latewood(LW) indexed tree-ring chronol-ogies at the four study sites. Siteabbreviations are given inTable 1. Only periods with atleast five trees are shown
Int J Biometeorol (2012) 56:787–800 791

the monthly, seasonal and annual SOI, NAO, T, Tmax, P,PDSI, and VP values as climatic predictors. Stepwiseprocedure allowed excluding redundant and collinearclimatic predictors, which could have caused varianceoverestimation. The total variation of tree growth explainedby climate at each site was quantified from the coefficientsof determination adjusted for the loss of degrees of freedom(radj
2) derived from the regression models. Statisticalanalyses were performed with the software SPSS v15.0(SPSS, Chicago IL).
Pearson’s correlations between SOI and climaticvariables were calculated in the same consecutiveperiods. To describe the temporal variation of geograph-ic patterns for SOI-regional climate correlations in theseconsecutive periods, we performed spatial-field correla-tions between SOI and selected climatic variables of theCRU database for the Iberian Peninsula (latitude 35°N–45°N, longitude 10°W–4°E) using the Climate Explorer(http://climexp.knmi.nl/).
Results
Tree-ring chronologies assessment
Mean ages of the sampled trees varied between 48 and129 years, and their standard deviations between 8 and
35 years (Table 1). All LW chronologies surpassed thefrequently applied minimum threshold of 0.85 for EPS, andshowed high values for SNR, Rbar and PC1, indicating thatthe trees shared a large amount of inter-annual LW growthvariation. By contrast, EW had a rather low quality fordendrochronological analyses, according to their values ofchronology statistics. Site chronologies (Fig. 2) werecorrelated significantly to each other for the commonperiod 1952–2006 (P<0.01), ranging between 0.316 and0.528 for EW, and between 0.399 and 0.685 for LW, as aresult of a shared inter-site variation.
Teleconnection of ENSO on latewood growth
No significant correlations between EW tree-ring indicesand monthly SOI values were observed for the commonperiod 1952–2006 (Fig. 3a). In contrast, LW indices werecorrelated significantly to SOI values between July andDecember before tree growth, depending on the site, and inJanuary and March of the current year in only EST(Fig. 3b). However, no consistent patterns of significantcorrelations were found between NAO indices and EW orLW chronologies at any of the four study sites; only LW atEST showed a significant correlation with previous Decem-ber NAO (r=0.296, P=0.025). Moreover, the observedrelationships between seasonal SOI and LW indices werenon-stationary, as moving bootstrapped correlations
Jun
(t-1
)
Jul (
t-1)
Aug
(t-
1)
Sep
(t-
1)
Oct
(t-
1)
Nov
(t-
1)
Dec
(t-
1)
Jan
(t)
Feb
(t)
Mar
(t)
Apr
(t)
May
(t)
Jun
(t)
Jul (
t)
Aug
(t)
Sep
(t)
EW
Jun
(t-1
)
Jul (
t-1)
Aug
(t-
1)
Sep
(t-
1)
Oct
(t-
1)
Nov
(t-
1)
Dec
(t-
1)
Jan
(t)
Feb
(t)
Mar
(t)
Apr
(t)
May
(t)
Jun
(t)
Jul (
t)
Aug
(t)
Sep
(t)
LW
-0.4
-0.2
0.0
0.2
0.4
Cor
rela
tion
coef
ficie
nt
p = 0.01p = 0.05
p = 0.05p = 0.01
p = 0.01p = 0.05
p = 0.05p = 0.01
(A)
(B)
-0.4
-0.2
0.0
0.2
0.4
Cor
rela
tion
coef
ficie
nt BAIBISESTSAM
Fig. 3 Correlations between aEW and b LW tree-ring chro-nologies, and monthly series ofthe Southern Oscillation Index(SOI) for the common period1952–2006. Horizontal lines in-dicate the significance bound-aries (P=0.05 and P=0.01) forcorrelation coefficients. (t−1)and (t): year before ring infor-mation and current growth year,respectively
792 Int J Biometeorol (2012) 56:787–800

revealed a significant negative relationship just within theperiod 1952–1980 (Fig. 4), and mainly for the previousautumn.
Besides its non-stationarity, the relationship between LWgrowth and SOI was non-linear within the period 1952–1980. LW growth indices and autumn SOI were statisticallyindependent for 1910–1951 and 1981–2006, whereas bothvariables showed a highly significant (P<0.001) non-linearrelationship at the four sites in 1952–1980 (Appendix S1);and so did the mean LW growth chronology at a regionalscale (Fig. 5a), indicating an asymmetrical effect of SOI onLW growth. The non-linear models showed that SOIaccounted for 35–49% of LW growth variance in 1952–1980, but only 19–33% using linear models. Accordingly,
SOI of previous September–November explained 64.8% ofmean LW growth according to the exponential model, whilethe linear model accounted for 41.9% of LW growthvariance, which is considerably lower. LW indices werehigher in years with negative SOI values during the autumnbefore tree growth, whereas positive SOI values did notinfluence LW.
Climate–growth relationships
The climatic response of LW growth was non-stationary,with the amount of variance explained by climate (radj
2
model values) increasing with time (Table 2). It did notreach 35% for 1910–1951, and there were no climatic
BAI-0.6
-0.4
-0.2
0.0
0.2
BIS-0.6
-0.4
-0.2
0.0
0.2
EST-0.6
-0.4
-0.2
0.0
0.2
Boo
tstr
appe
d co
rrel
atio
n co
effic
ient
1910 1920 1930 1940 1950 1960 1970 1980 1990
SAM-0.6
-0.4
-0.2
0.0
0.2
SOI Jun-Aug (t-1)SOI Sep-Nov (t-1)SOI Dec (t-1)-Feb (t)
Year AD
Fig. 4 Moving 25-year boot-strapped correlations, lagged by2 years, between seasonal SOIvalues previous to tree growthand LW growth indices at thefour study sites. Each correlationrepresents the central year of the25-year interval. Symbols rep-resent significant correlations(P<0.05). Vertical lines indicatethe years 1952 and 1980
Int J Biometeorol (2012) 56:787–800 793

variables with comparable effects that were common to allfour sites. For 1952–1980, climate accounted for 45.3–48.4% of LW growth variance, and SOI in the precedingautumn was the most significant variable controlling LWgrowth at all sites, explaining 23.6–35.5% of growthvariance. The greatest climatic sensitivity was reached for1981–2006, with 58.1–73.1% of LW growth variancerelated to climate; in this period, the negative effect ofwinter temperatures explained the largest amount of growthvariance, between 21.2% at the highest site, and 46.8% atthe lowest site. The period 1981–2006 was the warmest,with mean T increasing from 11.8°C in 1910–1951, to 12.0°C in 1952–1980, and to 12.9°C in 1981–2006. However,annual P varied slightly among the periods considered
(1,112 mm in 1910–1951, 1,202 mm in 1952–1980, and1,194 mm in 1981–2006).
There was no relationship between the average LWchronology and T of the preceding December in 1952–1980, while in 1981–2006 this relationship was highlysignificant, linear, and opposite (Fig. 5b). The relationshipsbetween LW growth and winter temperature (Tmax ofprevious November–December in BAI, Tmax of previousDecember in BIS, T of previous December in EST, and T ofprevious December–March in SAM) were also significantand opposite in 1981–2006 at the four study sites(Appendix S2). By contrast, in 1910–1951 and 1952–1980, LW growth was independent of winter temperature;the exception was Bispo, the mildest site, which showed a
1950 1960 1970 1980 1990 2000 2010
Year AD
-3
-2
-1
0
1
2
SO
I Sep
-Nov
(t-1
)
0.4
0.6
0.8
1.0
1.2
1.4
1.6
LW g
row
th in
dex
-3 -2 -1 0 1 2
SOI Sep-Nov (t-1)
0.5
1.0
1.5
LW g
row
tn in
dex
-3 -2 -1 0 1 2
SOI Sep-Nov (t-1)
0.5
1.0
1.5
1950 1960 1970 1980 1990 2000 2010
Year AD
4
6
8
10
12
T D
ec (t
-1)
(ºC
)
0.4
0.6
0.8
1.0
1.2
1.4
1.6
LW g
row
th in
dex
4 6 8 10 12
T Dec (t-1) (ºC)
0.5
1.0
1.5
LW g
row
th in
dex
4 6 8 10 12
T Dec (t-1) (ºC)
0.5
1.0
1.5
1952-1980 1981-2006
1952-1980 1981-2006
r = 0.648p < 0.001
r = 0.079n.s.
2 2
r = 0.016n.s.
2 r = 0.345p = 0.002
2
(A)
(B)
SOI Sep-Nov (t-1)LW growth index
T Dec (t-1)LW growth index
Fig. 5 a Relationships betweenLW growth indices, averagedfrom the four study sites,and mean SOI in September–October–November of the yearbefore growth [SOI Sep–Nov(t−1)], for the periods 1952–1980, and 1981–2006. b Rela-tionships between LW growthindices, averaged out of the fourstudy sites, and mean tempera-ture in December of the yearbefore growth [T Dec (t−1)].The best adjustments relatingLW growth indices and theclimatic variables, for the peri-ods 1952–1980 and 1981–2006,along with the correspondingstatistics, are shown. Note theinverted scale of the growthindex axes. n.s. Non-significantrelationship
794 Int J Biometeorol (2012) 56:787–800

positive significant correlation with December Tmax in1952–1980.
SOI-regional climate relationships
The spatial field correlations showed a large-scale associ-ation between October SOI and several climatic variables inthe Iberian Peninsula, but only for 1952–1980, not for1910–1951 or 1981–2006 (Fig. 6). The inverse associationbetween October SOI and mean annual temperature waswidespread throughout the Iberian Peninsula in 1952–1980(Fig. 6a), with a significant correlation in the study area (r=−0.468, P=0.010). In contrast, the influence of SOI onprecipitation and PDSI data was more local, as the negativeeffect of October SOI was restricted mainly to the westernIberian Peninsula in 1952–1980 (Fig. 6b–d). In the studyarea, both annual PDSI (r=−0.497, P=0.006) and PDSI inSeptember–December of the previous year (r=−0.560, P=0.001) showed significant correlations with October SOI,but not annual precipitation (r=−0.347, P=0.065). Similarly,a large-scale inverse association of previous October SOI and
vapour pressure in current September was found significant(r=−0.467, P=0.011) in the study area for 1952–1980(Fig. 6e).
Discussion
We found significant effects of ENSO dynamics on Q.robur growth in the NW Iberian Peninsula, with almostidentical patterns of seasonal, non-stationary, and non-linearsensitivity to ENSO for the four populations studied, whichcovered most of the complete altitudinal range of thespecies in this region. Although some connection betweentree-ring growth and NAO have been observed previouslyin southern Europe (Piovesan and Schirone 2000; Rozas etal. 2009), this work demonstrates that the connection of oakgrowth with ENSO was more important than that withNAO in NW Spain, which was mediated by a robust ENSOmodulation of regional climate. The relationships of Iberianclimate with NAO were studied in a previous work (Zoritaet al. 1992), which showed that winter precipitation and
Site Period Model radj2 Predictor variablea Var (%) t-value P-value
BAI 1910–1951 0.271 P Mar (t) 18.7 3.31 0.002
VP Jul (t) 8.4 2.37 0.023
1952–1980 0.484 (SOI Sep-Nov (t−1)+2)1/2 25.9 −3.84 0.001
T Jan (t) 12.9 2.99 0.006
Tmax Sep (t-1) 9.6 2.42 0.023
1981–2006 0.731 Tmax Nov-Dec (t−1) 46.8 −4.97 <0.001
VP Aug (t) 13.3 3.23 0.005
P Feb (t) 13.0 4.03 0.001
BIS 1910–1951 0.310 Tmax Jul (t) 17.7 −4.27 <0.001
P Sep (t−1) 13.3 2.95 0.005
1952–1980 0.457 (SOI Sep-Nov (t−1)+2)1/2 34.0 −4.69 <0.001
VP Jul (t) 11.7 2.73 0.011
1981–2006 0.645 Tmax Dec (t−1) 38.5 −5.47 <0.001
P Feb (t) 13.2 4.96 <0.001
Tmax Apr (t) 12.8 3.85 0.001
EST 1910–1951 0.340 P Jul (t) 25.9 3.89 <0.001
Tmax May (t) 8.1 2.43 0.020
1952–1980 0.453 (SOI Sep-Nov (t−1)+2)1/2 35.5 −4.11 <0.001
T Apr (t) 9.8 2.42 0.023
1981–2006 0.655 T Dec (t−1) 33.6 −4.22 <0.001
P May (t) 21.4 −3.55 0.002
Tmax Jun (t) 10.5 −2.60 0.018
SAM 1952–1980 0.461 (SOI Sep-Nov (t−1)+2)1/2 23.6 −4.24 <0.001
PDSI Mar (t) 14.5 3.26 0.003
P Jun (t−1) 8.0 −2.20 0.037
1981–2006 0.581 T Dec (t−1)-Mar (t) 21.2 −3.64 0.002
P Mar-Jul (t) 18.8 −3.17 0.005
Tmax Apr (t) 18.1 3.48 0.002
Table 2 Statistics of the multi-ple regressions of tree-ring late-wood chronologies for each ofthe four study sites (BAI, BIS,EST, and SAM) with the cli-matic variables for the periods1910–1951 (n=42), 1952–1980(n=29), and 1981–2006 (n=26).T Mean temperature, Tmaxmaximum temperature, P totalprecipitation, SOI Southern Os-cillation Index, PDSI Palmerdrought severity index, VPvapour pressure
a Owing to the non-linear rela-tionship between LW growthand SOI, SOI values weretransformed according to (SOI+2)1/2 . (t−1) and (t): year beforetree growth and current growthyear, respectively
Int J Biometeorol (2012) 56:787–800 795

NAO are negatively related in southwestern Iberia, butcorrelations are low in the northwest.
Effects of ENSO on tree growth have been described attropical latitudes in America, Africa and Asia, usually for
1910-1951 1952-1980 1981-2006
(A)
(B)
(C)
(D)
(E)
796 Int J Biometeorol (2012) 56:787–800

water-limited climates or in seasonally inundated forests,owing to the strong links between hydrological regimes andENSO dynamics (Fichtler et al. 2004; Schöngart et al.2004; Stahle et al. 1998). Evidence of extratropical tree-growth sensitivity to ENSO has also been established inNorth America and New Zealand (Cleaveland and Duvick1992; Fowler et al. 2000, 2008). In accordance with ourresults, which are to our knowledge the first confirmationof ENSO impacts on tree growth in Europe, the negativerelationships between SOI and subsequent tree growth aregeneral in all extratropical cases (Fowler et al. 2008; Stahleet al. 1998).
The previously reported tropical and extratropical rela-tionships between tree growth and ENSO were stationary, i.e. consistent through time (Cleaveland and Duvick 1992;Fowler et al. 2000; Schöngart et al. 2004). In fact,stationarity and robustness of the ENSO-growth relation-ships have allowed the reconstruction of past ENSOdynamics based on long tree-ring proxy records (Fowleret al. 2008; Stahle et al. 1998). However, there is alsoevidence that ENSO teleconnection on both regionalclimate and tree growth can vary through time (Swetnamand Betancourt 1998). The observed relationships betweenENSO, LW growth, and regional climate in NW Spain werenon-stationary, with significant correlation only during1952–1980. In general, support for non-stationary effectsof regional climate on tree growth has been shown recentlyfor different species, related mainly to variations in localconditions, deposition of contaminants, or climate change(Oberhuber et al. 2008). In our case, the influence of ENSOon diverse regional climatic descriptors in our study areawas significant only for 1952–1980, supporting the non-stationarity of the ENSO-growth relationships. The impactof interannual ENSO dynamics is most consistent in thetropical Pacific Ocean and bordering areas, where theatmosphere responds directly to ENSO, whereas thegeographical variation of their teleconnections can resultfrom extratropical processes and random atmosphericdisturbances (McPhaden et al. 2006; Timmermann and Jin2002). Both observational and modelling studies revealedthat the strength of ENSO teleconnections can vary in timeand space owing to interactions with other large-scaleatmospheric patterns, heat flux anomalies, stochastic forc-ing, and recent warming trends (Sterl et al. 2007; Ye andHsieh 2006).
In addition to its non-stationarity, the observedENSO–LW growth relationships were non-linear in30% of the period analysed in the four populationsstudied, i.e. the effects of ENSO on LW growth wereasymmetrical, with markedly positive effects of negativeSOI values. The nature of ENSO dynamics is non-linear, showing asymmetries between the warm and coldphases with characteristically stronger El Niño than LaNiña events (McPhaden et al. 2006). The reasons for thisnon-linearity are not completely understood, with both thevertical mixing of the upper ocean layers and the heat fluxto the equatorial eastern Pacific Ocean being asymmetricalprocesses that can contribute to the non-linearity of ENSO(An and Jin 2004).
The absence of a significant correlation between SOI andprecipitation in our study area, even for 1952–1980,supports previous studies that did not find significanteffects of ENSO on precipitation in the NW IberianPeninsula (Knippertz et al. 2003; Rodó et al. 1997). Infact, Rodó et al. (1997) established a close link betweenENSO events and spring precipitation in Spain; in someareas ENSO can explain up to 50% of the observed rainfallduring the period 1953–1994, but the effect is strongest insouth-eastern areas of Spain, away from our study area.During 1952–1980, LW growth was probably enhanced bynegative SOI extremes through the combination of a greaterannual–winter soil moisture, and a higher atmosphericvapour pressure at the end of the active growing season.When sufficient soil and air moisture exist, as expressed byPDSI and VP, respectively, the stomata can dilate, allowingfor higher transpiration and photosynthetic rates (Friedrichset al. 2009).
For the most recent period, the results of this study areconsistent with previous findings showing that radialincrement variation of Q. robur in northwest Spain isinversely related to prior winter temperatures (Rozas 2005;Rozas et al. 2009), probably owing to a threshold-inducedgrowth response to increasing temperatures (Wilmking etal. 2004; D’Arrigo et al. 2004), but also due to theindependence of local climate and ENSO since 1980(Fig. 6). The negative relationship between winter temper-ature and growth was evident since 1980, when meantemperatures in the study area increased significantly by 1°C in comparison to previous periods. In accordance with aprevious study at a nearby site, this negative dependencewas evident in the LW but not in the EW (Rozas et al.2009). Warmer winters increase respiration rates and theconsequent use of stored carbohydrates, when losses cannotbe replaced by photosynthesis (Hamerlynck and Knapp1996). Such conditions negatively affected LW growth ofQ. robur, whereas it could be expected a priori that EW andLW formation were supported by previous- and current-year photosynthates, respectively (Robertson et al. 1996).
Fig. 6 Spatial correlations between SOI in October of the previousyear, and the gridded 0.5°×0.5°CRU TS 3 and CRU self-calibratingPalmer drought severity index (PDSI) datasets of a mean annualsurface temperature, b total annual precipitation, c mean annual PDSI,d mean PDSI from September to December of the previous year, and emean vapour pressure in September of the actual year, for the periods1910–1951, 1952–1980, and 1981–2006. Only correlations significantat the P<0.1 level are shown
�
Int J Biometeorol (2012) 56:787–800 797

Large EW vessels of ring-porous trees are essential forsurvival, because they are responsible for more than 90% ofwater conductivity, but remain functional only during asingle growing season (Cochard and Tyree 1990). Sincethey are usually formed before bud break (Suzuki et al.1996), at least part of the EW and current year’s leaves andfine roots, which are strong carbon sinks, need to besupported by previously stored reserves (Gallé et al. 2007;Yang and Midmore 2005). As a consequence, carbohydratestorage is maximum before leaf fall in autumn andminimum just after leaf expansion (Barbaroux and Bréda2002). Climate must therefore affect the consumption ofreserves during the dormant period. In a previous work, wehypothesized that mild winters in northwest Spain werecausing a significant consumption of stored reserves in Q.robur by increasing respiration rates (Rozas et al. 2009).Thus, winter temperatures would mediate LW productionby affecting the amount of reserves available for leafflushing and fine root growth and, according to our presentresults, this increase in respiration rates should haveoccurred mostly since 1980, as compared with colderconditions in previous periods. A trade-off betweencarbohydrate investments for LW growth and storage tobe used in the following year is also expected during theactive growing season. The recent extension of the activegrowing season observed in many tree species throughoutEurope (Chmielewski and Rötzer 2001; Lebourgeois et al.2010; Linderholm 2006) probably also modulate this trade-off by reducing the amount of stored carbohydrates andexacerbating the negative effects of winter temperatures onsubsequent growth (Rötzer et al. 2004).
Conclusions
We found evidence of a seasonal (only in LW growth), non-stationary (significant for the period 1952–1980), and non-linear (markedly positive effects of negative SOI values)dependency of Q. robur growth on the interactions betweenENSO dynamics and regional climate. Whereas thephysical and physiological processes for the observedresponses of Q. robur growth in the NW Iberian Peninsulawere not identified conclusively in this work, our findingssuggest that growth dynamics have been driven largely byENSO in the period 1952–1980. The dynamics of ENSOhave changed since the late 1970s, with increasedfrequency, persistence and intensity of El Niño events,and changes in ENSO connectivity to extratropicalregions (Wang and An 2001; Ye and Hsieh 2006). Inour study area, changes in ENSO teleconnection havebeen found as a large-scale association between OctoberSOI and several climatic variables in the Iberian Peninsulain the period 1952–1980 only. However, elevated winter
temperatures became the main factor limiting growth in1981–2006, probably as a consequence of phenologicalchanges in the duration of the active period, and the lossof larger amounts of stored carbohydrates by enhancedwinter respiration. The non-stationary nature of the treegrowth-climate relationships in NW Spain precludesclimate reconstructions based on ring widths withoutmiscalibration of past climate time series. However, theconnection between ENSO and regional climate proved tobe of great importance to the growth and productivity ofdeciduous broadleaved trees, even at lower altitudes and undera mild Atlantic climate, on the NW Iberian Peninsula.
Acknowledgements We thank Dr. José M. Olano, Dr. Luis Sampedro,and four anonymous reviewers for useful suggestions on an earlierversion of the manuscript, and Adrián González, Borja González, andManuel Souto for field and laboratory assistance. V.R. benefited fromresearch contracts by INIA-Xunta de Galicia and CSIC. This researchwas funded partially by the Instituto Nacional de Investigación yTecnología Agraria y Alimentaria, Ministerio de Ciencia e Innovación(RTA2006-00117), and Dirección Xeral de Investigación, Desenvolve-mento e Innovación, Xunta de Galicia (PGIDIT06PXIB502262PR).
References
An S-I, Jin F-F (2004) Nonlinearity and asymmetry of ENSO. JClimate 17:2399–2412
Barbaroux C, Bréda N (2002) Contrasting distribution and seasonaldynamics of carbohydrate reserves in stem wood of adult ring-porous sessile oak and diffuse-porous beech trees. Tree Physiol22:1201–1210
Biondi F, Waikul K (2004) DENDROCLIM2002: A C++ program forstatistical calibration of climate signals in tree-ring chronologies.Comput Geosci 30:303–311
Briffa K, Jones PD (1990) Basic chronology statistics andassessment. In: Cook ER, Kairiukstis LA (eds) Methods ofdendrochronology: applications in the environmental sciences.Kluwer, Dordrecht, pp 137–152
Brönnimann S, Xoplaki E, Casty C, Pauling A, Luterbacher J (2007)ENSO influence on Europe during the last centuries. Clim Dyn28:181–197
Chmielewski F-M, Rötzer T (2001) Response of tree phenology toclimate change across Europe. Agric For Meteorol 108:101–112
Cleaveland MK, Duvick DN (1992) Iowa climate reconstructed fromtree rings, 1640–1982. Water Resour Res 28:2607–2615
Cochard H, Tyree MT (1990) Xylem dysfunction in Quercus: vesselsizes, tyloses, cavitation and seasonal changes in embolism. TreePhysiol 6:393–407
Cook ER, Holmes RL (1996) Guide for computer program ARSTAN.In: Grissino-Mayer HD, Holmes RL, Fritts HC (eds) Theinternational tree-ring data bank program library version 2.0user’s manual. Laboratory of tree-ring research. University ofArizona, Tucson, USA, pp 75–87
Cook ER, Peters K (1981) The smoothing spline: a new approach tostandardizing forest interior tree-ring width series for dendrocli-matic studies. Tree-Ring Bull 41:45–53
D’Arrigo RD, Kaufmann RK, Davi N, Jacoby GC, Laskowski C,Myneni RB, Cherubini P (2004) Thresholds for warming-induced growth decline at elevational tree line in the Yukon
798 Int J Biometeorol (2012) 56:787–800

Territory, Canada. Global Biogeochem Cycles 18:GB3021,doi:10.1029/2004GB002249
D’Arrigo R, Cook ER, Wilson RJ, Allan R, Mann ME (2005) On thevariability of ENSO over the past six centuries. Geophys ResLett 32:L03711, doi:10.1029/2004GL022055
Dai A, Trenberth KE, Qian T (2004) A global data set of PalmerDrought Severity Index for 1870–2002: Relationship with soilmoisture and effects of surface warming. J Hydrometeorol5:1117–1130
Ducousso A, Bordacs S (2004) EUFORGEN technical guidelines forgenetic conservation and use for pedunculate and sessile oaks(Quercus robur and Q. petraea). International Plant GeneticResources Institute, Rome, Italy, p 6
Fichtler E, Trouet V, Beeckman H, Coppin P, Worbes M (2004)Climatic signals in tree rings of Burkea africana and Pterocarpusangolensis from semiarid forests in Namibia. Trees 18:442–451
Fowler A, Palmer J, Salinger J, Ogden J (2000) Dendroclimaticinterpretation of tree-rings in Agathis australis (kauri): 2.Evidence of a significant relationship with ENSO. J R Soc N Z30:277–292
Fowler AM, Boswijk G, Gergis J, Lorrey A (2008) ENSO historyrecorded in Agathis australis (kauri) tree rings. Part A: kauri’spotential as an ENSO proxy. Int J Climatol 28:1–20
Friedrichs DA, Büntgen U, Frank DC, Esper J, Neuwirth B, Löffler J(2009) Complex climate controls on 20th century oak growth inCentral-West Germany. Tree Physiol 29:39–51
Gallé A, Haldimann P, Feller U (2007) Photosynthetic performance andwater relations in young pubescent oak (Quercus pubescens) treesduring drought stress and recovery. New Phytol 174:799–810
García-González I, Eckstein D (2003) Climatic signal of earlywoodvessels of oak on a maritime site. Tree Physiol 23:497–504
Grissino-Mayer HD (2001) Evaluating crossdating accuracy: a manualand tutorial for the computer program COFECHA. Tree-RingRes 57:205–221
Hamerlynck E, Knapp AK (1996) Photosynthetic and stomatalresponses to high temperature and light in two oaks at thewestern limit of their range. Tree Physiol 16:557–565
Hilasvuori E, Berninger F (2010) Dependence of tree ring stableisotope abundances and ring width on climate in Finnish oak.Tree Physiol 30:636–647
Holmgren M, Scheffer M, Ezcurra E, Gutiérrez JR, Mohren GMJ(2001) El Niño effects on the dynamics of terrestrial ecosystems.Trends Ecol Evol 16:89–94
IPCC (2007) Summary for policymakers. In: Solomon S, Qin D,Manning M et al (eds) Climate change 2007: the physical sciencebasis. Cambridge University Press, Cambridge, Contribution ofWorking Group I to the Fourth Assessment Report of theIntergovernmental Panel on Climate Change, pp 1–18
Knippertz P, Ulbrich U, Marques F, Corte-Real J (2003) Decadalchanges in the link between El Niño and springtime NorthAtlantic Oscillation and European-north African rainfall. Int JClimatol 23:1293–1311
Kramer K, Leinonen I, Loustau D (2000) The importance ofphenology for the evaluation of impact of climate change ongrowth of boreal, temperate and Mediterranean forests ecosys-tems: an overview. Int J Biometeorol 44:67–75
Lebourgeois F, Pierrat J-C, Perez V, Piedallu C, Cecchini S, Ulrich E(2010) Simulating phenological shifts in French temperate forestsunder two climatic change scenarios and four driving globalcirculation models. Int J Biometeorol 54:563–581
Linderholm HW (2006) Growing season changes in the last century.Agric For Meteorol 137:1–14
McPhaden MJ, Zebiak SE, Glantz MH (2006) ENSO as an integratingconcept in Earth science. Science 314:1740–1745
Oberhuber W, Kofler W, Pfeifer K, Seeber A, Gruber A, Wieser G(2008) Long-term changes in tree-ring–climate relationships at
Mt. Patscherkofel (Tyrol, Austria) since the mid-1980s. Trees22:31–40
Peterson DW, Peterson DL (2001) Mountain hemlock growthresponds to climatic variability at annual and decadal time scales.Ecology 82:3330–3345
Pilcher JR, Gray B (1982) The relationships between oak tree growthand climate in Britain. J Ecol 70:297–304
Piovesan G, Schirone B (2000) Winter North Atlantic oscillationeffects on the tree rings of the Italian beech (Fagus sylvatica L.).Int J Biometeorol 44:121–127
Pozo-Vázquez D, Gámiz-Fortis SR, Tovar-Pescador J, Esteban-ParraMJ, Castro-Díez Y (2005) El Niño-Southern Oscillation eventsand associated European winter precipitation anomalies. Int JClimatol 25:17–31
Robertson I, Pollard AM, Heaton THE, Pilcher JR (1996) Seasonalchanges in the isotopic composition of oak cellulose. In: DeanJS, Meko DM, Swetnam TW (eds) Tree rings, environment andhumanity, radiocarbon; proceedings of an international confer-ence. Radiocarbon, Tucson, pp 617–628
Rodó X, Baert E, Comin FA (1997) Variations in seasonal rainfall inSouthern Europe during the present century: relationships withthe North Atlantic Oscillation and the El Niño-SouthernOscillation. Clim Dynam 13:275–284
Rötzer T, Grote R, Pretzsch H (2004) The timing of bud burst and itseffect on tree growth. Int J Biometeorol 48:109–118
Rozas V (2005) Dendrochronology of pedunculate oak (Quercusrobur L.) in an old-growth pollarded woodland in northern Spain:tree-ring growth responses to climate. Ann For Sci 62:209–218
Rozas V, Lamas S, García-González I (2009) Differential tree-growthresponses to local and large-scale climatic variation in two Pinusand two Quercus species in northwest Spain. Ecoscience 16:299–310
Schöngart J, Junk WJ, Piedade MTF, Ayres JM, Hüttermann A,Worbes M (2004) Teleconnection between tree growth in theAmazonian floodplains and the El Niño–Southern Oscillationeffect. Global Change Biol 10:683–692
Stahle DW, D'Arrigo RD, Krusic PJ, Cleaveland MK, Cook ER, AllanRJ, Cole JE, Dunbar RB, Therrell MD, Gay DA, Moore MD,Stokes MA, Burns BT, Villanueva-Diaz J, Thompson LG (1998)Experimental dendroclimatic reconstruction of the SouthernOscillation. Bull Am Meteorol Soc 79:2137–2153
Stenseth NC, Mysterud A, Ottersen G, Hurrell JW, Chan K-S, Lima M(2002) Ecological effects of climate fluctuations. Science297:1292–1296
Stenseth NC, Ottersen G, Hurrell JW, Mysterud A, Lima M, Chan KS,Yoccoz NG, Ådlandsvik B (2003) Studying climate effects onecology through the use of climate indices: the North AtlanticOscillation, El Niño Southern Oscillation and beyond. Proc RSoc B Biol Sci 270:2087–2096
Sterl A, van Oldenborgh GJ, Hazeleger W, Burgers G (2007) On therobustness of ENSO teleconnections. Clim Dynam 29:469–485
Suzuki M, Yoda K, Suzuki H (1996) Phenological comparison of theonset of vessel formation between ring-porous and diffuse-porousdeciduous trees in a Japanese temperate forest. IAWA J 17:431–444
Swetnam TW, Betancourt JL (1998) Mesoscale disturbance andecological response to decadal climatic variability in theAmerican Southwest. J Climate 11:3128–3147
Tessier L, Nola P, Serre-Bachet F (1994) Deciduous Quercus in theMediterranean region: tree-ring/climate relationships. New Phy-tol 126:355–367
Timmermann A, Jin F-F (2002) A nonlinear mechanism for decadal ElNiño amplitude changes. Geophys Res Lett 29:1003.doi:10.1029/2001GL013369
van Oldenborgh GJ, Drijfhout S, van Ulden A, Haarsma R, Sterl A,Severijns C, Hazeleger W, Dijkstra H (2009) Western Europe iswarming much faster than expected. Clim Past 5:1–12
Int J Biometeorol (2012) 56:787–800 799

Villalba R, Veblen TT (1998) Influences of large-scale climaticvariability on episodic tree mortality in northern Patagonia.Ecology 79:2624–2640
Wang B, An S (2001) Why the properties of El Niño changed duringthe late 1970s. Geophys Res Lett 28:3709–3712
Wilmking M, Juday GP, Barber VA, Zald HSJ (2004) Recent climatewarming forces contrasting growth responses of white spruce attreeline in Alaska through temperature thresholds. Global ChangeBiol 10:1724–1736
Yang Z, Midmore DJ (2005) Modelling plant resource allocation andgrowth partitioning in response to environmental heterogeneity.Ecol Model 181:59–77
Ye Z, Hsieh WW (2006) The influence of climate regime shift onENSO. Clim Dynam 26:823–833
Zorita E, Kharin V, von Storch H (1992) The atmospheric circulationand sea surface temperature in the North Atlantic area in winter:their interaction and relevance for Iberian precipitation. JClimatol 5:1097–1108
800 Int J Biometeorol (2012) 56:787–800