Non-rigid image registration using spatially region ...
12
> REPLACE THIS LINE WITH YOUR PAPER IDENTIFICATION NUMBER (DOUBLE-CLICK HERE TO EDIT) < 1 Abstract—Objective: Non-rigid image registration with high accuracy and efficiency is still a challenging task for medical image analysis. In this work, we present the spatially region-weighted correlation ratio (SRWCR) as a novel similarity measure to improve the registration performance. Methods: SRWCR is rigorously deduced from a three-dimension joint probability density function combining the intensity channels with an extra spatial information channel. SRWCR estimates the optimal functional dependence between the intensities for each spatial bin, in which the spatial distribution modeled by a cubic B-spline function is used to differentiate the contribution of voxels. We also analytically derive the gradient of SRWCR with respect to the transformation parameters and optimize it using a quasi-Newton approach. Furthermore, we propose a GPU-based parallel mechanism to accelerate the computation of SRWCR and its derivatives. Results: The experiments on synthetic images, public 4-D thoracic computed tomography (CT) dataset, retinal optical coherence tomography (OCT) data, and clinical CT and positron emission tomography (PET) images confirm that SRWCR significantly outperforms some state-of-the-art techniques such as spatially encoded mutual information and Robust PaTch-based cOrrelation Ration. Conclusion: This study demonstrates the advantages of SRWCR in tackling the practical difficulties due to distinct intensity changes, serious speckle noise, or different imaging modalities. Significance: The proposed registration framework might be more reliable to correct the non-rigid deformations and more potential for clinical applications. Index Terms—non-rigid registration, spatially region-weighted correlation ratio, functional dependence, spatial distribution, GPU, parallel mechanism. The paper is submitted for review on April 3, 2018. This work was supported in part by the National Program on Key Research and Development Project under Grants 2016YFC0104500, 2016YFC0104505, 2016YFC0103500, 2016YFC0103502, in part by NSFC under Grants 61201117, 61701492, in part by the NSFJ under Grants BK20151232, BK20170392, and in part by the Youth Innovation Promotion Association CAS under Grant 2014281. L. Gong, C. Zhang, L. Duan, X. Du and *J. Zheng are with Medical Imaging Department, Suzhou Institute of Biomedical Engineering and Technology, Chinese Academy of Sciences, Suzhou, 215163 China (e-mail: [email protected]; [email protected] ; [email protected] ; [email protected]; e-mail: [email protected]). H. Liu is with Department of Radiology, Huashan hospital, Fudan University, Shanghai, 200000 China (e-mail: [email protected] ). *X. Chen is with the School of Electronics and Information Engineering, Soochow University, Suzhou, 215163 China(e-mail: [email protected]). Corresponding authors: *J. Zheng , *X. Chen. I. INTRODUCTION on-rigid image registration plays a more and more important role in a variety of applications, such as radiation assessment [1], disease surveillance [2], atlas-based segmentation [3], image-guided surgery [4] and so on. All these applications are based on plausibly correcting the spatial distortion between the corresponding anatomical tissues from different images. Over the nearly two decades, lots of non-rigid registration approaches have been proposed to estimate the dense deformation fields [5], [6]. Currently, the most widely-used method estimates the alignment correspondences by optimizing an intensity-based metric. Mutual information (MI) [7], [8] is a popular metric and has been successfully applied to both mono-modal and multi-modal registration [9]. It is derived from information theory and quantifies the amount of statistical information that one image depends on the other. However, several recent studies have confirmed that the optimal alignment might be not corresponding to the hypothesis of intensity bin correspondence held by MI-based registration, especially for aligning images with intensity distortion or different modalities [10]-[12]. Embedding spatial information into the calculation of MI is an effective approach to improve the registration accuracy [13]-[19]. The most direct way was to estimate a high-dimensional MI by considering the neighbors of each voxel [13], [14]. This method required plenty of samples to ensure the accuracy of the joint entropy. Some studies incorporated the spatial information by combining MI with geometric features, such as image gradient [15] and 3D Harris operator [16]. However, for multi-modal registration, particularly when the image pairs have absolutely different representations for the same tissues, it is quite challenging to detect enough features in both two images. Recent approaches proposed to weight the MI metric using local structural information [11] or contextual similarities [12]. However, the computational complexity increased significantly due to the calculation of self-similarity or the detection of similar structures. Another strategy was to extend the 2-D intensity joint histogram with an extra spatial channel representing the location of the intensity pairs. For each spatial bin, this three-channel strategy calculated a local MI value with a given spatial distribution. Studholme et al. [17] firstly introduced this Non-rigid image registration using spatially region-weighted correlation ratio and GPU-acceleration Lun Gong, Cheng Zhang, Luwen Duan, Xueying Du, Hanqiu Liu, Xinjian Chen*, Jian Zheng* N
Transcript of Non-rigid image registration using spatially region ...
> REPLACE THIS LINE WITH YOUR PAPER IDENTIFICATION NUMBER (DOUBLE-CLICK HERE TO EDIT) <
1
Abstract—Objective: Non-rigid image registration with high
accuracy and efficiency is still a challenging task for medical
image analysis. In this work, we present the spatially
region-weighted correlation ratio (SRWCR) as a novel similarity
measure to improve the registration performance. Methods:
SRWCR is rigorously deduced from a three-dimension joint
probability density function combining the intensity channels with
an extra spatial information channel. SRWCR estimates the
optimal functional dependence between the intensities for each
spatial bin, in which the spatial distribution modeled by a cubic
B-spline function is used to differentiate the contribution of voxels.
We also analytically derive the gradient of SRWCR with respect
to the transformation parameters and optimize it using a
quasi-Newton approach. Furthermore, we propose a GPU-based
parallel mechanism to accelerate the computation of SRWCR and
its derivatives. Results: The experiments on synthetic images,
public 4-D thoracic computed tomography (CT) dataset, retinal
optical coherence tomography (OCT) data, and clinical CT and
positron emission tomography (PET) images confirm that
SRWCR significantly outperforms some state-of-the-art
techniques such as spatially encoded mutual information and
Robust PaTch-based cOrrelation Ration. Conclusion: This study
demonstrates the advantages of SRWCR in tackling the practical
difficulties due to distinct intensity changes, serious speckle noise,
or different imaging modalities. Significance: The proposed
registration framework might be more reliable to correct the
non-rigid deformations and more potential for clinical
applications.
Index Terms—non-rigid registration, spatially region-weighted
correlation ratio, functional dependence, spatial distribution,
GPU, parallel mechanism.
The paper is submitted for review on April 3, 2018. This work was supported
in part by the National Program on Key Research and Development Project
under Grants 2016YFC0104500, 2016YFC0104505, 2016YFC0103500, 2016YFC0103502, in part by NSFC under Grants 61201117, 61701492, in part
by the NSFJ under Grants BK20151232, BK20170392, and in part by the
Youth Innovation Promotion Association CAS under Grant 2014281. L. Gong, C. Zhang, L. Duan, X. Du and *J. Zheng are with Medical Imaging
Department, Suzhou Institute of Biomedical Engineering and Technology,
Chinese Academy of Sciences, Suzhou, 215163 China (e-mail: [email protected]; [email protected]; [email protected] ;
[email protected]; e-mail: [email protected]). H. Liu is with Department of Radiology, Huashan hospital, Fudan
University, Shanghai, 200000 China (e-mail: [email protected]).
*X. Chen is with the School of Electronics and Information Engineering,
Soochow University, Suzhou, 215163 China(e-mail: [email protected]). Corresponding authors: *J. Zheng , *X. Chen.
I. INTRODUCTION
on-rigid image registration plays a more and more
important role in a variety of applications, such as
radiation assessment [1], disease surveillance [2], atlas-based
segmentation [3], image-guided surgery [4] and so on. All these
applications are based on plausibly correcting the spatial
distortion between the corresponding anatomical tissues from
different images. Over the nearly two decades, lots of non-rigid
registration approaches have been proposed to estimate the
dense deformation fields [5], [6].
Currently, the most widely-used method estimates the
alignment correspondences by optimizing an intensity-based
metric. Mutual information (MI) [7], [8] is a popular metric and
has been successfully applied to both mono-modal and
multi-modal registration [9]. It is derived from information
theory and quantifies the amount of statistical information that
one image depends on the other. However, several recent
studies have confirmed that the optimal alignment might be not
corresponding to the hypothesis of intensity bin
correspondence held by MI-based registration, especially for
aligning images with intensity distortion or different modalities
[10]-[12]. Embedding spatial information into the calculation
of MI is an effective approach to improve the registration
accuracy [13]-[19].
The most direct way was to estimate a high-dimensional MI
by considering the neighbors of each voxel [13], [14]. This
method required plenty of samples to ensure the accuracy of the
joint entropy. Some studies incorporated the spatial
information by combining MI with geometric features, such as
image gradient [15] and 3D Harris operator [16]. However, for
multi-modal registration, particularly when the image pairs
have absolutely different representations for the same tissues, it
is quite challenging to detect enough features in both two
images. Recent approaches proposed to weight the MI metric
using local structural information [11] or contextual similarities
[12]. However, the computational complexity increased
significantly due to the calculation of self-similarity or the
detection of similar structures.
Another strategy was to extend the 2-D intensity joint
histogram with an extra spatial channel representing the
location of the intensity pairs. For each spatial bin, this
three-channel strategy calculated a local MI value with a given
spatial distribution. Studholme et al. [17] firstly introduced this
Non-rigid image registration using spatially
region-weighted correlation ratio
and GPU-acceleration
Lun Gong, Cheng Zhang, Luwen Duan, Xueying Du, Hanqiu Liu, Xinjian Chen*, Jian Zheng*
N
> REPLACE THIS LINE WITH YOUR PAPER IDENTIFICATION NUMBER (DOUBLE-CLICK HERE TO EDIT) <
2
strategy to encode the location information and proposed
regional mutual information (RMI) as a novel similarity
measure. RMI manually partitioned the image into a set of
overlapping squares and mapped the spatial distribution to a
boxcar function. The experiments on brain MR images showed
that RMI was more robust to local intensity changes. Instead of
subdividing regions over the whole image domain, localized
mutual information (LMI) [18] provided a random partition
mechanism where subregions were the neighborhoods of lots of
stochastic points. However, both RMI and LMI assumed that
the weights of voxels within each subregion were equal,
regardless of their different coordinates. Conditional mutual
information (CMI) [19] addressed this problem by fitting the
spatial distribution to a tensor-product B-spline function. For
each subregion, the weight of each voxel was associated with
the distance to the center. The experiments on simulated,
mono-modal and multi-modal data demonstrated that CMI
obviously improved the registration accuracy compared with
MI and RMI. Following the weighting scheme of CMI,
spatially encoded mutual information (SEMI) [10] exploited
the Gaussian function for spatial distribution and divided the
image into a set of spheres. To reduce the registration time, a
local ascent optimization framework was presented to
minimize SEMI. Essentially, SEMI-based registration
improved the efficiency at the cost of precision. It estimated the
approximate derivatives using the voxels with larger weights,
which greatly deteriorated the global convergence.
Although these three-channel MI metrics have achieved
satisfying performance for many applications, especially for the
cases with spatial intensity changes, there are still some
obstacles. One is the conflict between the reliable MI
estimations and the local performance as for the regional size.
In general, MI requires enough samples to ensure the statistical
power, which means that the regional size should be as large as
possible. However, the literature [10] concludes that the
smaller the size of each subregion is, the better locality of the
three-channel metric will be. To maintain the balance between
the two advantages, SEMI-based registration employed a
hierarchical weighting scheme which halved the regional size
at each subsequent level. But this scheme did not solve the
problem fundamentally. Additionally, due to the huge
computational burden of MI [20], the computing time to
estimate a series of local MI values is not practical.
Correlation ratio (CR), first introduced by Roche et al. [21],
[22], is an alternative intensity-based metric for image
registration. With the hypothesis of a more restrictive
functional mapping between the intensities, it is demonstrated
to be with less computational complexity and more reliable to
small sample sets [21], [22]. Recently, Rivaz et al. [23]
incorporated the three-channel strategy into CR and presented
Robust PaTch-based cOrrelation Ration (RaPTOR) algorithm,
which estimated local CR values over small patches and
accumulated these values to constitute a global cost function.
Similar to LMI, RaPTOR randomly selected patches as spatial
bins and fitted the spatial distribution to a boxcar function.
Compared with LMI, it was more reliable in handling large
intensity distortion due to the better locality performance.
In this paper, we incorporate the spatial information of
voxels into the functional dependence between the intensities
and present the spatially region-weighted correlation ratio
(SRWCR) as a novel similarity measure. The work of RaPTOR
is acted as a starting point. RaPTOR maps the spatial
distribution to a boxcar function, which is not accurate to
express the location of the joint intensity pairs (see Section
II-C). Additionally, RaPTOR employs a frequency statistics to
simplify the derivation, which significantly reduces the
stability for different datasets. In contrast, our proposed
SRWCR is rigorously deduced from a 3-D joint probability
density function (PDF). For each spatial bin, the contribution of
different voxels is distinguished by a cubic B-spline function.
Consequently, SRWCR is more effective in estimating the
optimal mapping relationship between the intensities within
each subregion. SRWCR not only inherits the robustness of
RaPTOR to intensity distortion, but also becomes less sensitive
to speckle noise and more suitable to align images with
different modalities.
In our previous work [24], we have obtained some
preliminary results of SRWCR-based registration on a small
retinal OCT dataset. Here, we extend this work as follows: 1)
we investigate the three-channel strategy using different spatial
distributions and provide a more principled description of
SRWCR and its derivatives; 2) we combine the
CUDA-programming with the three-channel strategy and
propose a GPU-based highly efficient framework to speed up
the calculation; 3) we perform more comprehensive
assessments on four different datasets, including 3-D synthetic
images distorted with initial bias fields, public 4-D thoracic CT
scans with distinct intensity changes, 3-D retinal OCT images
disturbed by strong speckle noise, and 3-D lung CT/PET scans.
The rest of the paper is organized as follows. In the next
section, we will give a detailed description of our method. The
registration performance is then validated on several datasets in
Section III, followed by a profound discussion presented in
Section IV. And the final summary is listed in Section V.
II. METHODS
Let 3( , , ) | 0 ,0 ,0x y zx y z x y zN N N x denote
the whole image domain, and then aligning a moving image M
to a fixed image F can be formulated as an optimization
problem which minimizes a cost function defined by
( ( ), ( ( ; ))) ( ( ; ))p pC D F M T Tw C x x x (1)
where D is a similarity measure, and pC is the constraint of
the deformation fields that avoids implausible movements. pw
is an experiential penalty weight and ( ; )T x represents the
transformation parameterized by . We choose a free-form
deformation (FFD) modeled by the location of cubic B-spline
nodes to simulate the transformation. The spacings of the
control nodes along the three directions are respectively set to
, ,x y z . Therefore, 0 1( , , )n is a set of coordinates
of all control nodes. In this work, we mainly focus on the
construction of the accelerated-SRWCR (A-SRWCR). To
> REPLACE THIS LINE WITH YOUR PAPER IDENTIFICATION NUMBER (DOUBLE-CLICK HERE TO EDIT) <
3
simplify the calculation, the intensities of the fixed and moving
images have been normalized between zero and the maximal
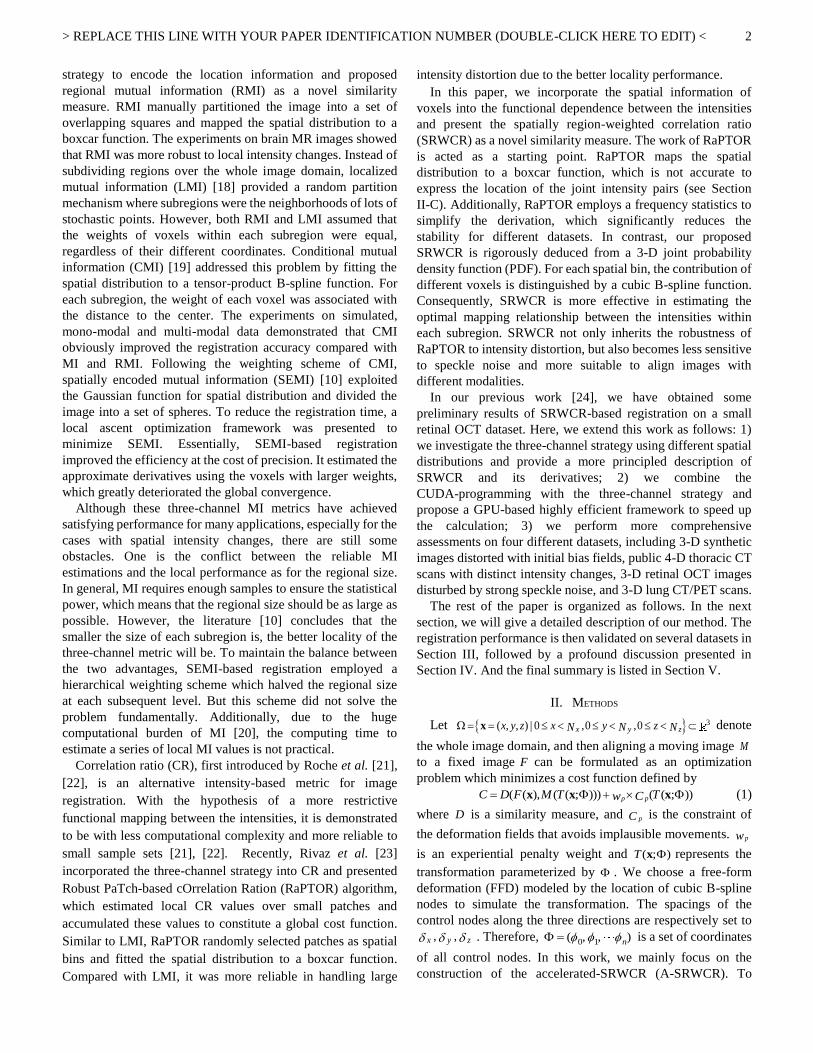
intensity bin L . The flowchart of our algorithm, which adopts
a GPU-based acceleration scheme, is shown in Fig. 1.
A. Correlation Ratio (CR)
CR is first introduced to the rigid alignment of multi-modal
images by Roche et al. [21], [22]. For two images A and B ,
CR assumes that all intensities of B can be estimated by A
using an unknown function, and it measures the dispersion of
the mapping relationship from this function.
Supposing that 2 is the variance of the estimated image B
and ( )p a denotes the marginal PDF of the model image A , and
then CR takes the following form
22
0
1( , ) 1 ( ) ( )
L
a
CR A B a p a
(2)
where 0,1, 2, ,a L represents the discrete intensity bins
associated to A , and 2( )a is the conditional variance of B
given a specific intensity bin a . CR varies between 0 and 1: the
higher the value is, the more perfect the functional dependence
is. Unlike MI, CR is asymmetric noted as ( , ) ( , )CR A B CR B A .
Therefore, it is important to choose the proper estimated image
B from F and M .
B. Three-Dimension Joint Density Function
The major drawback of CR is that it establishes a purely
quantitative functional dependence between the intensities, but
ignores the spatial information shared across the image.
Following the three-channel strategy, we divide the whole
image domain into a series of subregions labeled by
0,1, 2, , nr R R , and assume that the possibility of voxel x
appearing in region r is corresponding to a spatial distribution
defined by ( , )w r x . Hence, a 3-D PDF can be defined using a
weighted intensity statistics scheme
1( , , ) ( , ) ( ( )) ( ( ))p a b r w r h a A h b B
Z
x
x x x (3)
where 0,1, 2, ,a L and 0,1, 2, ,b L , and r can be
viewed as the spatial bin corresponding to the label of
subregion. Z is a normalization factor. In essence, ( , , )p a b r
represents the probability of a pair of intensity bins a and b
co-occurring in region r . According to the characteristics of
the conditional probability, it can be re-written as the product of
the probability of intensity pairs ( , )a b within a given subregion
r , called ( , )r
a bp , and the probability ( )p r that region r occurs
in the whole image domain, so that
0 0( ) ( , , )L L
a bp r p a b r
( , ) ( , , ) ( )r
a b p a b r p rp (4)
0( ) ( , )L
br ra a bp p
0( ) ( , )L
ar rb a bp p
.
In this work, a second-order polynomial function designed
by Xu et al. [25] which is smoother and more differentiable is
used to estimate the joint histogram
2
2
1.8 0.1 1, 0 0.5
( ) 1.8 3.7 1.9, 0.5 1
0,
t t t
h t t t t
otherwise
. (5)
C. Encoding Location Information from Spatial Distribution
According to (3), there are two key points to integrate the
spatial information into the functional dependence: the way to
partition the subregions and the specific expression of the
spatial distribution. Similar to LMI, RaPTOR randomly selects
points as the centers of subregions and maps the spatial
distribution to a boxcar function
1,
( , )0,
r
r
w r
xx
x (6)
where r is the user-defined subregion corresponding to
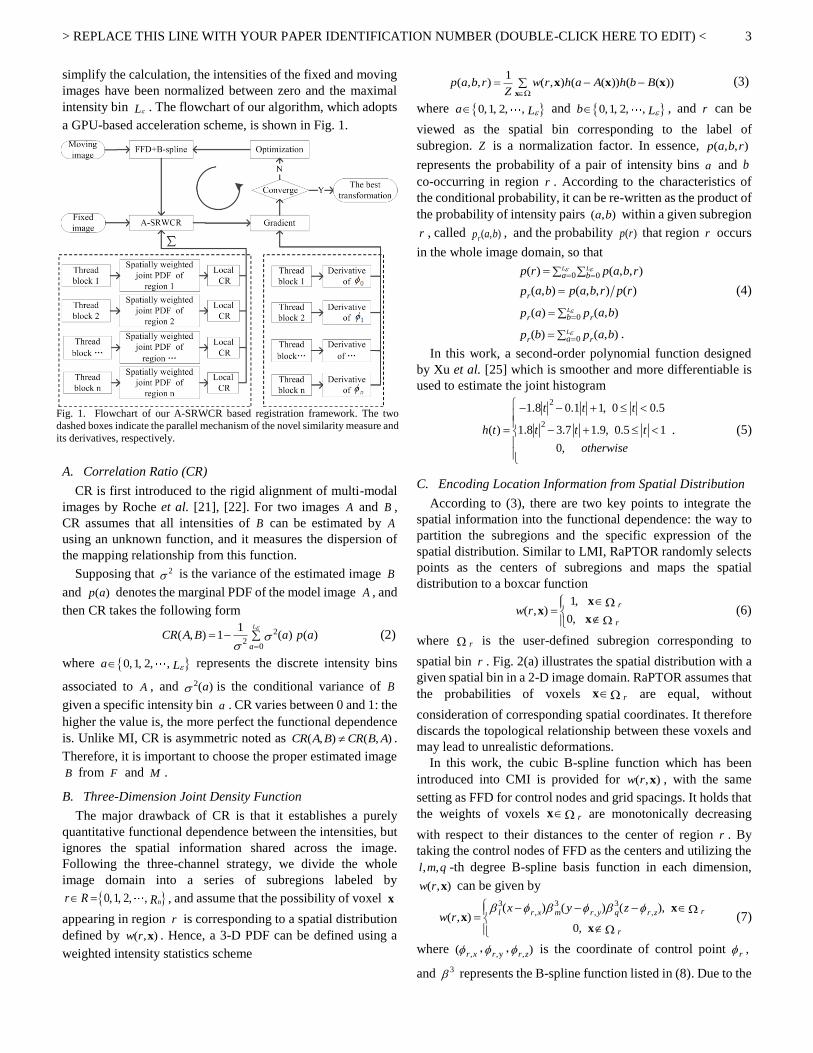
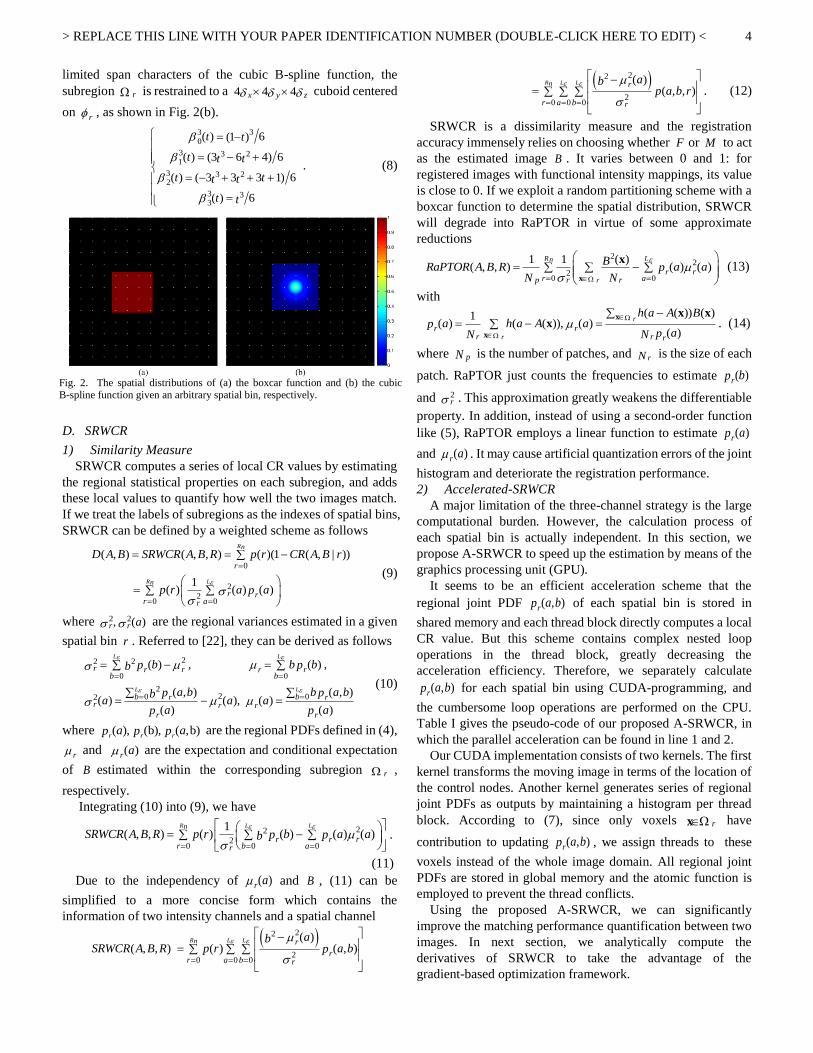
spatial bin r . Fig. 2(a) illustrates the spatial distribution with a
given spatial bin in a 2-D image domain. RaPTOR assumes that
the probabilities of voxels rx are equal, without
consideration of corresponding spatial coordinates. It therefore
discards the topological relationship between these voxels and
may lead to unrealistic deformations.
In this work, the cubic B-spline function which has been
introduced into CMI is provided for ( , )w r x , with the same
setting as FFD for control nodes and grid spacings. It holds that
the weights of voxels rx are monotonically decreasing
with respect to their distances to the center of region r . By
taking the control nodes of FFD as the centers and utilizing the
, ,l m q -th degree B-spline basis function in each dimension,
( , )w r x can be given by
3 3 3, , ,( ) ( ) ( ),
( , )0,
rl r x m r y q r z
r
x y zw r
xx
x (7)
where , ,y ,( )r x r r z , , is the coordinate of control point ,r
and 3 represents the B-spline function listed in (8). Due to the
Fig. 1. Flowchart of our A-SRWCR based registration framework. The two
dashed boxes indicate the parallel mechanism of the novel similarity measure and
its derivatives, respectively.
> REPLACE THIS LINE WITH YOUR PAPER IDENTIFICATION NUMBER (DOUBLE-CLICK HERE TO EDIT) <
4
limited span characters of the cubic B-spline function, the
subregion r is restrained to a 4 4 4x y z
cuboid centered
on r , as shown in Fig. 2(b).
330
3 3 21
3 3 22
3 33
( ) 6(1 )
( ) (3 6 4) 6
( ) ( 3 3 3 1) 6
( ) 6
t t
t t t
t tt t
t t
. (8)
D. SRWCR
1) Similarity Measure
SRWCR computes a series of local CR values by estimating
the regional statistical properties on each subregion, and adds
these local values to quantify how well the two images match.
If we treat the labels of subregions as the indexes of spatial bins,
SRWCR can be defined by a weighted scheme as follows
0
22
0 0
( , ) ( , , ) ( )(1 ( , | ))
1( ) ( ) ( )
R
R L
n
n
r
r rr ar
D A B SRWCR A B R p r CR A B r
p r a ap
(9)
where 2 2, ( )r r a are the regional variances estimated in a given
spatial bin r . Referred to [22], they can be derived as follows
22 2
0 0
220 02
( ) , ( ) ,
( , ) ( , )( ) ( ), ( )
( ) ( )
L L
L L
r rr rrb b
b br rr r r
r r
b b bp pb
a b b a bp pba a a
a ap p
(10)
where ( ), (b), ( ,b)r r r
a ap p p are the regional PDFs defined in (4),
r and ( )r a are the expectation and conditional expectation
of B estimated within the corresponding subregion r ,
respectively.
Integrating (10) into (9), we have
222
0 0 0
1( , , ) ( ) ( ) ( ) ( )
R L Ln
rr rr b ar
SRWCR A B R p r b a ap pb
.
(11)
Due to the independency of ( )r a and B , (11) can be
simplified to a more concise form which contains the
information of two intensity channels and a spatial channel
22
20 0 0
( )( , , ) ( ) ( , )
R L Ln r
rr a b r
abSRWCR A B R p r a bp
22
20 0 0
( )( , , )
R L Ln r
r a b r
abp a b r
. (12)
SRWCR is a dissimilarity measure and the registration
accuracy immensely relies on choosing whether F or M to act
as the estimated image B . It varies between 0 and 1: for
registered images with functional intensity mappings, its value
is close to 0. If we exploit a random partitioning scheme with a
boxcar function to determine the spatial distribution, SRWCR
will degrade into RaPTOR in virtue of some approximate
reductions
22
20 0
1 1 ( )( , , ) ( ) ( )
R Ln
r
rrr ap r r
BRaPTOR A B R a ap
N N
x
x (13)
with
( ( )) ( )1( ) ( ( )), ( )
( )
r
r
rrr r r
h a A Ba h a A ap
apN N
x
x
x xx . (14)
where pN is the number of patches, and rN is the size of each
patch. RaPTOR just counts the frequencies to estimate ( )r
bp
and 2r . This approximation greatly weakens the differentiable
property. In addition, instead of using a second-order function
like (5), RaPTOR employs a linear function to estimate ( )r
ap
and ( )r a . It may cause artificial quantization errors of the joint
histogram and deteriorate the registration performance.
2) Accelerated-SRWCR
A major limitation of the three-channel strategy is the large
computational burden. However, the calculation process of
each spatial bin is actually independent. In this section, we
propose A-SRWCR to speed up the estimation by means of the
graphics processing unit (GPU).
It seems to be an efficient acceleration scheme that the
regional joint PDF ( , )r
a bp of each spatial bin is stored in
shared memory and each thread block directly computes a local
CR value. But this scheme contains complex nested loop
operations in the thread block, greatly decreasing the
acceleration efficiency. Therefore, we separately calculate
( , )r
a bp for each spatial bin using CUDA-programming, and
the cumbersome loop operations are performed on the CPU.
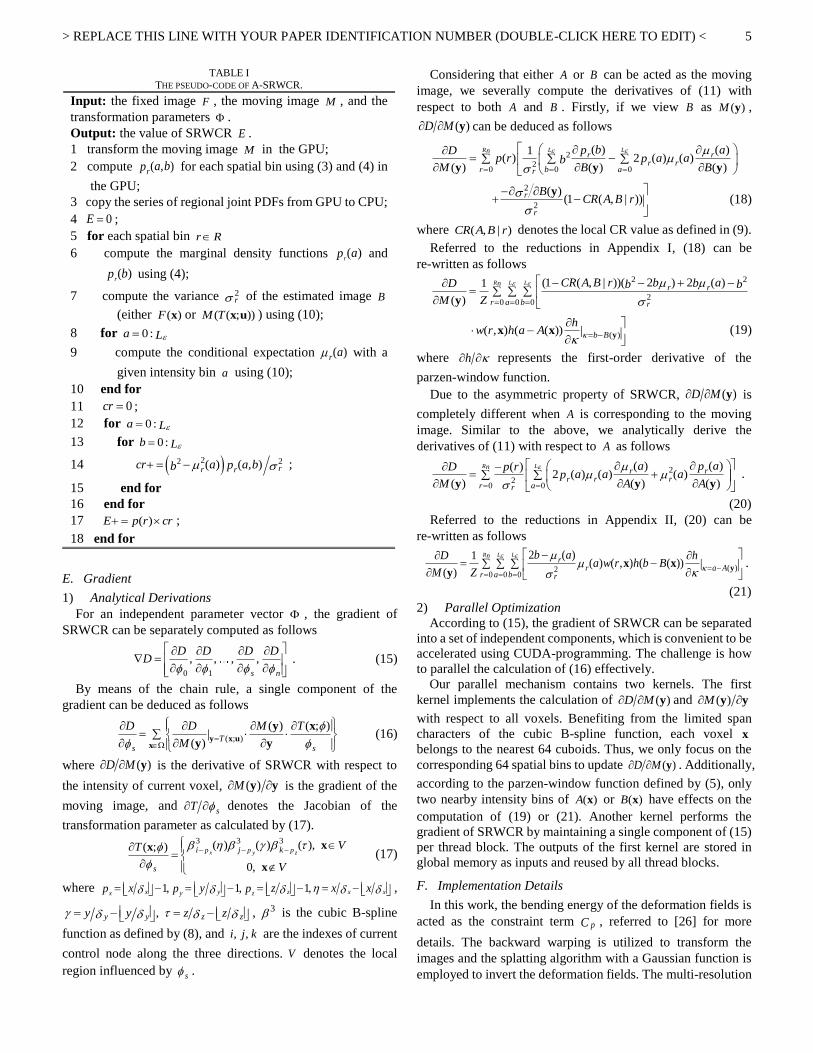
Table I gives the pseudo-code of our proposed A-SRWCR, in
which the parallel acceleration can be found in line 1 and 2.
Our CUDA implementation consists of two kernels. The first
kernel transforms the moving image in terms of the location of
the control nodes. Another kernel generates series of regional
joint PDFs as outputs by maintaining a histogram per thread
block. According to (7), since only voxels rx have
contribution to updating ( , )r
a bp , we assign threads to these
voxels instead of the whole image domain. All regional joint
PDFs are stored in global memory and the atomic function is
employed to prevent the thread conflicts.
Using the proposed A-SRWCR, we can significantly
improve the matching performance quantification between two
images. In next section, we analytically compute the
derivatives of SRWCR to take the advantage of the
gradient-based optimization framework.
Fig. 2. The spatial distributions of (a) the boxcar function and (b) the cubic B-spline function given an arbitrary spatial bin, respectively.
> REPLACE THIS LINE WITH YOUR PAPER IDENTIFICATION NUMBER (DOUBLE-CLICK HERE TO EDIT) <
5
E. Gradient
1) Analytical Derivations
For an independent parameter vector , the gradient of
SRWCR can be separately computed as follows
0 1
, , , ,s n
D D D DD
. (15)
By means of the chain rule, a single component of the
gradient can be deduced as follows
( ; )
( ) ( ; )|
( )T
s s
D D M T
M
y x u
x
y x
y y (16)
where ( )D M y is the derivative of SRWCR with respect to
the intensity of current voxel, ( )M y y is the gradient of the
moving image, and sT denotes the Jacobian of the
transformation parameter as calculated by (17).
3 3 3
( ) ( ) ( ),( ; )
0,
x y zp p pi j k
s
VT
V
xx
x (17)
where 1, 1, 1,x y z x xx y zx y z x xp p p ,
,y y z zy y z z , 3 is the cubic B-spline
function as defined by (8), and , ,i j k are the indexes of current
control node along the three directions. V denotes the local
region influenced by s .
Considering that either A or B can be acted as the moving
image, we severally compute the derivatives of (11) with
respect to both A and B . Firstly, if we view B as ( )M y ,
( )D M y can be deduced as follows
22
0 0 0
( ) ( )1( ) 2 ( ) ( )
( ) ( ) ( )
R L Lnr r
rrr b ar
b apDp r a apb
M B B
y y y
2
2
( )(1 ( , | ))r
r
BCR A B r
y (18)
where ( , | )CR A B r denotes the local CR value as defined in (9).
Referred to the reductions in Appendix I, (18) can be
re-written as follows 2 2
20 0 0
(1 ( , | ))( 2 ) 2 ( )1
( )
R L Lnr r
r a b r
CR A B r b abD b b
M Z
y
( )( , ) ( ( )) | b B
hw r h a A
yx x (19)
where h represents the first-order derivative of the
parzen-window function.
Due to the asymmetric property of SRWCR, ( )D M y is
completely different when A is corresponding to the moving
image. Similar to the above, we analytically derive the
derivatives of (11) with respect to A as follows
2
20 0
( )( )( )2 ( ) ( ) ( )
( ) ( ) ( )
R Lnr r
r rrr ar
aa pD p ra a ap
M A A
y y y .
(20)
Referred to the reductions in Appendix II, (20) can be
re-written as follows
( )20 0 0
2 ( )1( ) ( , ) ( ( )) |
( )
R L Lnr
r a Ar a b r
b aD ha w r h b B
M Z
yx x
y.
(21)
2) Parallel Optimization
According to (15), the gradient of SRWCR can be separated
into a set of independent components, which is convenient to be
accelerated using CUDA-programming. The challenge is how
to parallel the calculation of (16) effectively.
Our parallel mechanism contains two kernels. The first
kernel implements the calculation of ( )D M y and ( )M y y
with respect to all voxels. Benefiting from the limited span
characters of the cubic B-spline function, each voxel x
belongs to the nearest 64 cuboids. Thus, we only focus on the
corresponding 64 spatial bins to update ( )D M y . Additionally,
according to the parzen-window function defined by (5), only
two nearby intensity bins of ( )A x or ( )B x have effects on the
computation of (19) or (21). Another kernel performs the
gradient of SRWCR by maintaining a single component of (15)
per thread block. The outputs of the first kernel are stored in
global memory as inputs and reused by all thread blocks.
F. Implementation Details
In this work, the bending energy of the deformation fields is
acted as the constraint term pC , referred to [26] for more
details. The backward warping is utilized to transform the
images and the splatting algorithm with a Gaussian function is
employed to invert the deformation fields. The multi-resolution
TABLE I THE PSEUDO-CODE OF A-SRWCR.
Input: the fixed image F , the moving image M , and the
transformation parameters .
Output: the value of SRWCR E .
1 transform the moving image M in the GPU;
2 compute ( , )r
a bp for each spatial bin using (3) and (4) in
the GPU;
3 copy the series of regional joint PDFs from GPU to CPU;
4 0E ;
5 for each spatial bin r R
6 compute the marginal density functions ( )r
ap and
( )r
bp using (4);
7 compute the variance 2 r of the estimated image B
(either ( )F x or ( ( ; ))M T x u ) using (10);
8 for 0 :a L
9 compute the conditional expectation ( )r a with a
given intensity bin a using (10);
10 end for
11 0cr ;
12 for 0 :a L
13 for 0 :b L
14 22 2( ) ( , ) rr rcr a a bpb ;
15 end for
16 end for
17 ( )E p r cr ;
18 end for
> REPLACE THIS LINE WITH YOUR PAPER IDENTIFICATION NUMBER (DOUBLE-CLICK HERE TO EDIT) <
6
strategy and the concatenation of three isotropic control grids
are used to improve search efficiency.
The experiential penalty factor pw is set to 0.1 for
mono-modal registration and 30 for multi-modal registration.
The grid spacing at the finest level and the maximal intensity
bin are chosen to be fixed for all experiments ( [5, 5, 5] and
31L ) .
The minimization of the cost function is performed with the
quasi-Newton limited-memory BFGS (LBFGS) provided in the
liblbfgs package (http://www.chokkan.org/software/liblbfgs/).
The number of Hessian corrections is set to 5, and the maximal
iteration is set to 200, 200, 120 for low, medium and high
resolution. The backtracking line search with a Wolfe condition
is adopted. The optimizer is stopped when the metric value is
stable within the last 20 steps or when the optimization reaches
the maximal iterations.
All experiments are accomplished on a PC equipped with 8
GB RAM, Intel Core i7 3.4 GHz CPU and an NVIDIA Geforce
GTX 1060 graphics card. An executable tool of the presented
algorithm is available online at
https://github.com/Gonglun/Registration.
III. RESULTS
To evaluate the performance of A-SRWCR for non-rigid
image registration, a number of tests are performed on synthetic
images, public 4-D thoracic CT dataset, retinal OCT images
and clinical lung CT/PET scans. All experiments are carried out
following the principles of the Declaration of Helsinki, and
approved by the volunteers and patients for publication.
For each dataset, the proposed method is compared with the
classical MI metric and two state-of-the-art three-channel
metrics: SEMI and RaPTOR. Among them, the popular
registration package Elastix [27] based on MI and the existing
executable tool of SEMI can be severally downloaded from the
homepages (http://elastix.isi.uu.nl/) and
(http://www.sdspeople.fudan.edu.cn/zhuangxiahai/0/zxhproj/),
and RaPTOR is accomplished following the idea of [23] using
CUDA-programming. For clinical datasets without anatomical
landmarks, the Hausdorff distance (HD) which quantifies the
maximum distance between two outlines and the
maximum-likelihood Hausdorff distance (MHD) [28] which
quantifies the mean distance of all points are utilized to
evaluate the accuracy of the alignment.
A. Registration of synthetic images
We evaluate the robustness of the four metrics to a bias field
on ten synthetic image pairs. In this experiment, a 3-D binary
black and white grid image with dimension 128 128 128 is
aligned with a warped version of itself. For each image pair, the
warped image is distorted with a B-spline transformation field,
in which the control nodes are initialized by a uniform
distribution with the maximum amplitude of 15 voxels. The
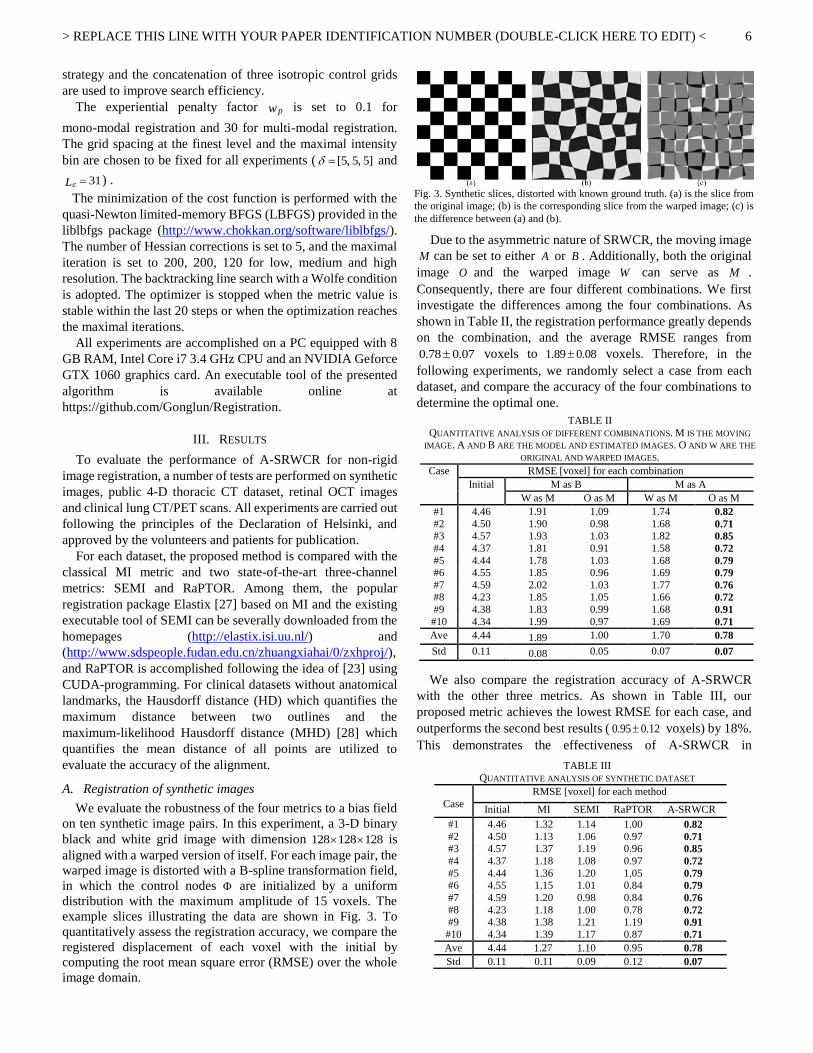
example slices illustrating the data are shown in Fig. 3. To
quantitatively assess the registration accuracy, we compare the
registered displacement of each voxel with the initial by
computing the root mean square error (RMSE) over the whole
image domain.
Due to the asymmetric nature of SRWCR, the moving image
M can be set to either A or B . Additionally, both the original
image O and the warped image W can serve as M .
Consequently, there are four different combinations. We first
investigate the differences among the four combinations. As
shown in Table II, the registration performance greatly depends
on the combination, and the average RMSE ranges from
0.78 0.07 voxels to 1.89 0.08 voxels. Therefore, in the
following experiments, we randomly select a case from each
dataset, and compare the accuracy of the four combinations to
determine the optimal one.
We also compare the registration accuracy of A-SRWCR
with the other three metrics. As shown in Table III, our
proposed metric achieves the lowest RMSE for each case, and
outperforms the second best results ( 0.95 0.12 voxels) by 18%.
This demonstrates the effectiveness of A-SRWCR in
Fig. 3. Synthetic slices, distorted with known ground truth. (a) is the slice from
the original image; (b) is the corresponding slice from the warped image; (c) is
the difference between (a) and (b).
TABLE II
QUANTITATIVE ANALYSIS OF DIFFERENT COMBINATIONS. M IS THE MOVING
IMAGE. A AND B ARE THE MODEL AND ESTIMATED IMAGES. O AND W ARE THE
ORIGINAL AND WARPED IMAGES.
Case RMSE [voxel] for each combination
Initial M as B M as A
W as M O as M W as M O as M
#1 4.46 1.91 1.09 1.74 0.82
#2 4.50 1.90 0.98 1.68 0.71
#3 4.57 1.93 1.03 1.82 0.85
#4 4.37 1.81 0.91 1.58 0.72
#5 4.44 1.78 1.03 1.68 0.79
#6 4.55 1.85 0.96 1.69 0.79
#7 4.59 2.02 1.03 1.77 0.76
#8 4.23 1.85 1.05 1.66 0.72
#9 4.38 1.83 0.99 1.68 0.91
#10 4.34 1.99 0.97 1.69 0.71
Ave 4.44 1.89 1.00 1.70 0.78
Std 0.11 0.08 0.05 0.07 0.07
TABLE III
QUANTITATIVE ANALYSIS OF SYNTHETIC DATASET
Case
RMSE [voxel] for each method
Initial MI SEMI RaPTOR A-SRWCR
#1 4.46 1.32 1.14 1.00 0.82
#2 4.50 1.13 1.06 0.97 0.71
#3 4.57 1.37 1.19 0.96 0.85
#4 4.37 1.18 1.08 0.97 0.72
#5 4.44 1.36 1.20 1.05 0.79
#6 4.55 1.15 1.01 0.84 0.79
#7 4.59 1.20 0.98 0.84 0.76
#8 4.23 1.18 1.00 0.78 0.72
#9 4.38 1.38 1.21 1.19 0.91
#10 4.34 1.39 1.17 0.87 0.71
Ave 4.44 1.27 1.10 0.95 0.78
Std 0.11 0.11 0.09 0.12 0.07
> REPLACE THIS LINE WITH YOUR PAPER IDENTIFICATION NUMBER (DOUBLE-CLICK HERE TO EDIT) <
7
recovering the realistic deformations. Additionally, we also
find that MI provides the worst result for each case, which
verifies the robustness of encoding spatial information to a bias
field.
B. Registration of extreme inhale and exhale CT scans
Image-Guided Radiation Therapy (IGRT) is one of the most
effective technologies for the treatment of lung cancer.
However, due to respiratory motion, it is crucial to construct a
respiratory motion model by registering the images of different
phases acquired from 4D-CT to a template image in advance.
The treatment plan can be adjusted according to this model and
the treatment effect will be improved.
In this experiment, we investigate the registration
performance of A-SRWCR on ten thoracic CT scan pairs
between extreme inhale and exhale phase of a respiratory cycle,
provided by the DIR database (https://www.dir-lab.com/). The
scans have a slice thickness of 2.5 mm and an axial resolution
ranging from 0.97 to 1.16 mm. Each DIR image includes 300
anatomical landmarks manually annotated by clinical experts.
The mean target registration error (mTRE) between these
landmarks is severed as the quantitative index. It should be
noted that the changes in lung volume due to ventilation are
expressed as the differences in corresponding voxel values
during the respiratory cycle [29]. This means that the intensities
of air and vessels between extreme inhale and exhale phase can
suffer from distinct changes [30]. Therefore, we not only need
to correct location deformations, but also should take large
intensity distortion into account.
Table IV shows the final mTRE results for the ten cases
obtained by the four metrics. We also include the results
reported in a recent literature [30] which focuses on aligning
images with strong intensity distortion. It is observed that
A-SRWCR generates the best results for all cases except case
#7 and significantly decreases the average mTRE from
8.46 3.33 mm to 1.66 0.53 mm, which outperforms the
second best result (1.89 0.89 mm) by 12%. This improvement
shows that A-SRWCR is more reliable in registering images
with distinct intensity changes. Especially for case #8,
A-SRWCR successfully corrects the deformations, which is far
better than others. It verifies the advantages of our method in
recovering large deformations. Although all metrics greatly
reduce the errors between the landmarks for each case, the
three-channel metrics have a more clear decrease compared
with MI ( 2.60 1.35 mm). It confirms the effective
performance of this three-channel strategy to intensity
fluctuations. Additionally, we also notice that SEMI gives the
second highest mTRE value ( 2.34 1.21 mm). The main reason
is that SEMI requires more samples in each subregion to ensure
the reliable estimations. Consequently, it is more sensitive to
large intensity bias.
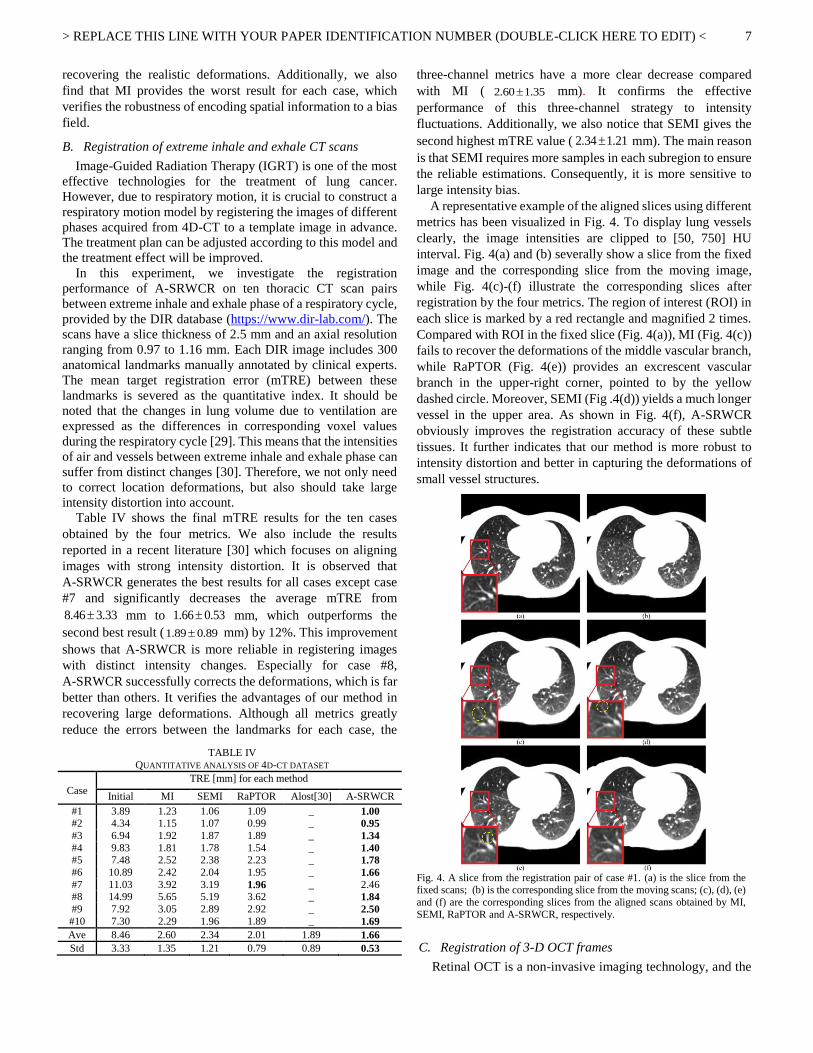
A representative example of the aligned slices using different
metrics has been visualized in Fig. 4. To display lung vessels
clearly, the image intensities are clipped to [50, 750] HU
interval. Fig. 4(a) and (b) severally show a slice from the fixed
image and the corresponding slice from the moving image,
while Fig. 4(c)-(f) illustrate the corresponding slices after
registration by the four metrics. The region of interest (ROI) in
each slice is marked by a red rectangle and magnified 2 times.
Compared with ROI in the fixed slice (Fig. 4(a)), MI (Fig. 4(c))
fails to recover the deformations of the middle vascular branch,
while RaPTOR (Fig. 4(e)) provides an excrescent vascular
branch in the upper-right corner, pointed to by the yellow
dashed circle. Moreover, SEMI (Fig .4(d)) yields a much longer
vessel in the upper area. As shown in Fig. 4(f), A-SRWCR
obviously improves the registration accuracy of these subtle
tissues. It further indicates that our method is more robust to
intensity distortion and better in capturing the deformations of
small vessel structures.
C. Registration of 3-D OCT frames
Retinal OCT is a non-invasive imaging technology, and the
TABLE IV
QUANTITATIVE ANALYSIS OF 4D-CT DATASET
Case
TRE [mm] for each method
Initial MI SEMI RaPTOR Alost[30] A-SRWCR
#1 3.89 1.23 1.06 1.09 _ 1.00
#2 4.34 1.15 1.07 0.99 _ 0.95
#3 6.94 1.92 1.87 1.89 _ 1.34
#4 9.83 1.81 1.78 1.54 _ 1.40
#5 7.48 2.52 2.38 2.23 _ 1.78
#6 10.89 2.42 2.04 1.95 _ 1.66
#7 11.03 3.92 3.19 1.96 _ 2.46 #8 14.99 5.65 5.19 3.62 _ 1.84
#9 7.92 3.05 2.89 2.92 _ 2.50
#10 7.30 2.29 1.96 1.89 _ 1.69
Ave 8.46 2.60 2.34 2.01 1.89 1.66
Std 3.33 1.35 1.21 0.79 0.89 0.53
Fig. 4. A slice from the registration pair of case #1. (a) is the slice from the fixed scans; (b) is the corresponding slice from the moving scans; (c), (d), (e)
and (f) are the corresponding slices from the aligned scans obtained by MI,
SEMI, RaPTOR and A-SRWCR, respectively.

> REPLACE THIS LINE WITH YOUR PAPER IDENTIFICATION NUMBER (DOUBLE-CLICK HERE TO EDIT) <
8
longitudinal registration between multiple OCT images
acquired from the same subject at different time allows for
monitoring the development and assessing the efficacy of many
eye diseases. However, due to the coherent detection
characteristics, OCT images are accompanied with strong
speckle noise and inherently own a low signal-to-noise ratio
(SNR) [31]. Fig. 5 illustrates a B-scan view of 3-D OCT image,
in which most voxels are background polluted by strong noise.
In this experiment, we investigate the performance of the
four metrics on low SNR retinal OCT dataset, collected from
ten healthy volunteers using Topcon 3D-OCT 1000 scanner.
Each volunteer collects two 3D OCT sets at interval of one
month. The scans are comprised of 512 992 256 voxels with
a resolution of 11.72 2.62 23.44 μm3. Each image is
automatically segmented into 10 retinal layers with 11 surfaces
(see Fig. 5) by using a graph search based surface detection
algorithm [32], and the segmentation accuracy is identified by
ophthalmologists. For each pair (the same volunteer collected
at different time), the mean HD and MHD values of 11 surfaces
after registration are employed to quantify the alignment
accuracy. Due to the limitation of GPU memory, we first
register two down-sampling images with dimension
512 512 128 , and then up-sample the deformation fields to
the original resolution.
As listed in Table V, A-SRWCR produces the lowest MHD
for all cases, and greatly reduces the average MHD from
158.62 194.39 μm to 34.98 5.33 μm. Although the HD values
in cases #2 and #9 are slightly higher than the optimal results,
A-SRWCR yields a statistically significant improvement with
the lowest average HD ( 256.11 76.47 μm). It demonstrates that
A-SRWCR is more robust to speckle noise. Especially for case
#4, in which the initial OCT images are completely mismatched,
the outcomes obtained by A-SRWCR are still around the
average values, while all contrast algorithms converge to the
invalid local optima. It further confirms that A-SRWCR is
more potential to correct large deformations even in the
presence of strong speckle noise. There are two reasons for the
excellent performance of our proposed metric. First, CR
estimates an optimal function to map voxel pairs with the
smallest distance in intensity space, which is verified to be less
sensitive to noise [33]. Second, compared with the boxcar
function, the cubic B-spline function preserves the topological
relationship between the voxels within each subregion. It is
therefore more reliable to find the optimal functional
relationship even if the region is seriously polluted by noise.
Additionally, it might be confusing that the performance of
SEMI is even worse than MI. The reason is that most
subregions contain little retinal structural information, and
Fig. 5. A slice of 3-D OCT image and 10 retinal layers with 11 surfaces.
TABLE V
QUANTITATIVE ANALYSIS OF 3D OCT DATASET
Case MHD [μm] obtained by different methods for each case HD [μm] obtained by different methods for each case
Initial MI SEMI RaPTOR A-SRWCR Initial MI SEMI RaPTOR A-SRWCR
#1 49.46 39.44 42.35 33.29 31.90 268.58 239.78 210.21 220.35 183.11
#2 108.61 51.30 49.02 36.53 34.21 436.42 498.14 275.77 283.52 296.49
#3 82.82 35.59 40.73 37.94 34.68 419.54 235.16 231.15 280.09 200.58
#4 702.18 53.18 60.49 64.87 40.07 1796.23 387.88 731.34 700.67 262.93
#5 56.47 37.64 39.47 38.22 33.72 264.28 292.38 238.52 319.89 163.52
#6 114.69 55.38 75.81 51.15 39.94 625.79 401.25 512.81 578.14 301.46
#7 125.82 60.03 72.39 48.05 45.14 584.59 510.46 592.63 415.45 387.47
#8 171.53 46.27 44.85 54.97 33.26 520.67 368.47 341.09 649.63 335.82
#9 68.83 35.36 35.1 35.33 29.21 335.25 338.62 204.96 362.30 264.31 #10 105.75 31.28 33.23 29.69 27.62 427.41 201.52 187.68 275.38 165.37
Ave 158.62 44.55 49.34 43.00 34.98 567.88 347.37 352.62 408.54 256.11
Std 194.39 9.97 15.13 11.22 5.33 448.40 106.91 191.43 172.42 76.47
Fig. 6. Checkerboard images with a C-scan view using the four metrics. (a) is the slice from the fixed scans; (b) is the corresponding slice from the moving scans;
(c), (d), (e) and (f) are the corresponding checkerboard images obtained by MI,
SEMI, RaPTOR and A-SRWCR, respectively.

> REPLACE THIS LINE WITH YOUR PAPER IDENTIFICATION NUMBER (DOUBLE-CLICK HERE TO EDIT) <
9
some may even be all noisy. Consequently, the local MI values
estimated over these subregions do not reflect the intensity bin
correspondence of retinal tissues.
To make the results of A-SRWCR more convincible, a
qualitative comparison of the C-scan view which contains
retinal vessels is illustrated in Fig. 6. Fig. 6(a) and (b) are the
fixed and corresponding moving slices, respectively. Fig.
6(c)-(f) show the checkerboard images which alternately
arrange the fixed and registered slices. It can be seen that SEMI
(Fig. 6(d)) gives the worst registration result since the vessels in
both two ROIs are broken. Moreover, MI (Fig. 6(c)) provides a
good alignment of the vessel within the yellow ROI, but
completely fails in the red ROI. In contrast, RaPTOR (Fig. 6(e))
provides a more continuous vessel within the red ROI, but fails
in the yellow ROI. As shown in Fig. 6(f), A-SRWCR clearly
improves the registration accuracy of the retinal vessels, thus
further verifying that A-SRWCR is more suitable to register
images with strong speckle noise.
D. Registration of lung CT/PET images
Non-rigid multi-modal registration is also an insurmountable
obstacle for many applications. In this experiment, we apply
our proposed method to a clinical lung database collected from
ten patients. Each patient has been scanned by PET-CT and
high quality diagnostic CT at different time. Due to the
different scanning protocols, the diagnostic CT scans acquired
from Siemens Somatom have a slice thickness of 5 mm and an
in-plane resolution around 1.20-1.46 mm, while the PET scans
acquired from the integrated PET-CT scanner Siemens
Biograph 64 have a resolution of 4.07 4.07 3 mm3. To
improve the registration efficiency, each pair has been
resampled to a uniform resolution with 3 mm slices and the
same in-plane resolution as CT image. Moreover, a rigid
registration of all cases using A-SRWCR with the rigid
transformation model is performed to recover global
deformations. Since it is quite difficult to manually select
landmarks that can be observed both in CT and PET images, the
MHD and HD values between the lung surfaces are provided
for quantitative comparison of the registration accuracy.
Table VI shows the quantitative results achieved by the four
metrics. Although the MHD or HD values obtained by
A-SRWCR are not the lowest for some cases, such as case #7 or
#9, our method has a statistically significant improvement over
the ten cases, and achieves the lowest average and standard
deviation values ( 3.70 0.52 mm for MHD, 30.25 5.22 mm for
HD). It demonstrates that A-SRWCR is more stable to align
CT/PET images. Especially for cases #1 and #10, the
comparative methods completely fail to align the point pairs
with maximal displacement, whereas A-SRWCR greatly
reduces the HD values. Additionally, we also find that the
registration performance of the MI-based metrics is much
worse than the CR-based metrics. In CT images, there is one
intensity bin for several structures, but the intensities of these
tissues might correspond to a number of intensity bins in PET
images. Consequently, the optimal alignment of these tissues
do not obey the hypothesis of the intensity bin correspondence.
In contrast, RaPTOR and A-SRWCR quantify the functional
dependence between the intensity values instead of the
intensity bins. They are therefore more potential to register
CT/PET images. However, due to the approximate reductions,
RaPTOR is less stable and yields larger standard deviation
values.
Fig. 7 illustrates a representative example of fusion images
with a coronal view, in which the PET images have been
TABLE VI
QUANTITATIVE ANALYSIS OF CT/PET DATASET
Case
MHD [mm] obtained by different methods for each case HD [mm] obtained by different methods for each case
Initial MI SEMI RaPTOR A-SRWCR Initial MI SEMI RaPTOR A-SRWCR
#1 10.30 6.71 6.07 4.72 4.22 62.54 60.55 65.90 46.45 28.91
#2 13.25 5.12 4.27 5.30 3.71 70.13 36.23 36.19 29.69 28.82
#3 4.12 3.32 3.28 2.59 3.14 30.77 31.26 34.42 27.47 25.42
#4 7.52 3.67 4.14 4.33 4.12 43.91 30.58 31.97 26.83 23.58
#5 11.91 5.34 4.49 4.93 4.47 71.38 45.42 48.82 44.89 40.95
#6 8.79 4.96 4.52 4.04 4.02 78.01 44.09 49.68 30.03 31.85
#7 5.66 2.93 3.43 3.02 3.37 36.45 25.82 26.56 25.66 27.34 #8 10.03 3.80 3.24 3.40 2.75 58.19 26.53 27.07 27.44 27.38
#9 7.72 3.66 3.24 3.16 3.56 47.94 32.16 39.49 32.49 36.36
#10 9.26 5.70 5.64 4.41 3.63 54.07 54.93 63.31 43.77 31.87
Ave 8.86 4.52 4.23 3.99 3.70 55.34 38.76 42.34 33.47 30.25
Std 2.75 1.22 1.00 0.90 0.52 15.63 12.42 14.10 8.94 5.22
Fig. 7. Visualization of the fusion images with a coronal view. (a) is the slice
from CT scans; (b) is the corresponding slice from PET scans; (c), (d), (e) and
(f) are the corresponding fusion images obtained by MI, SEMI, RaPTOR and A-SRWCR, respectively.

> REPLACE THIS LINE WITH YOUR PAPER IDENTIFICATION NUMBER (DOUBLE-CLICK HERE TO EDIT) <
10
enhanced with green for better observation. By comparing the
ROI marked by the red rectangle, it is obvious that A-SRWCR
provides more accurate alignment of the lung diaphragm than
the other three methods.
E. Experiments of GPU Acceleration
In this experiment, we validate the acceleration performance
of the parallel mechanism. According to our proposed
framework, there are four CUDA kernels performed on the
GPU during each iteration. First, kernel 1 reads the initial
transformation parameters and the moving image from the
RAM, and outputs the transformed image to the RAM. Then,
kernel 2 reads the fixed image from the RAM and outputs the
regional joint PDFs to the RAM. Third, kernel 3 accomplishes
the computation of ( )D M y and ( )M y y for each voxel.
Finally, kernel 4 outputs the gradient of SRWCR to the RAM.
Table VII shows the memory bandwidth occupied by each
kernel at the finest deformation level. The results are measured
by Visual Studio Nsight. For each kernel, we reach around half
of the theoretical peak bandwidth, which is 192.2 GB/s.
Especially for kernel 3, the efficiency is up to 56.7%.
Table VIII lists the computational time of SRWCR and its
derivatives taken by the CPU and GPU during one iteration
with different image sizes. The calculation speed of our
paralleled scheme has a significant improvement compared
with that of the CPU. It might be puzzling that the acceleration
rate of SRWCR is much lower than that of its derivatives. The
main reason is due to the atomic operations, which enforce the
threads serialize access to the same address and seriously
diminish the parallel efficiency.
Fig. 8 illustrates the average registration time for four
datasets. Considering that the public 4D-CT dataset contains
two different in-plane dimensions ( 256 256 and 512 512 ),
we compute each average value separately. Relying on the
dataset to be registered, execution time consumed by our
method ranges from 3 to 37.2 minutes, which is approximately
24 times less than the CPU-based registration. It successfully
confirms the impact of our parallel mechanism.
IV. DISCUSSION
MI is an extensively used similarity measure which aims to
maximize the amount of shared information between two
images. However, when confronted with practical challenges
such as intensity distortion or different imaging modalities, it
may lead to undesired results. SEMI and RaPTOR are two
state-of-the-art techniques which encode the spatial
information into the statistical intensity relationship and greatly
improve the robustness to these challenges. But there are still
some drawbacks for both two methods. SEMI is sensitive to the
size of subregion, and thereby its local performance is
significantly limited. RaPTOR, which assumes that the spatial
distribution is corresponding to a boxcar function, can not
differentiate the contribution of voxels within each subregion.
In this work, we introduce A-SRWCR, a novel similarity
measure that incorporates the spatial information into the
functional mapping relationship. A-SRWCR starts from a 3-D
PDF which extends the intensity dimensions with a spatial
channel, and then estimates local CR values give the spatial
distribution modeled by a cubic B-spline function. We also
design an efficient parallel mechanism to overcome the
shortcoming of huge computation burden.
We perform an extensive comparison of our proposed
method and the three metrics: MI, SEMI and RaPTOR.
Experiments with synthetic images provide the evaluation of
both accuracy and robustness to bias fields. Application in DIR
dataset demonstrates the effectiveness of A-SRWCR in
registering images with distinct intensity distortion. The
optimal alignment of lung vessels shown in Fig. 4 further
demonstrates that A-SRWCR could provide a more accurate
respiratory motion model for IGRT. Experiments with OCT
scans show an objective comparison of the robustness of the
four metrics to speckle noise. The lowest HD and MHD values
listed in Table V imply that A-SRWCR is more reliable in
analyzing the thickness variations of retinal layers, which is
specifically useful in the surveillance of multiple sclerosis (MS)
[34]. The highest accuracy illustrated in Fig. 6 also verifies that
the presented metric is more suitable for the assessment of
choroidal neovascularization (CNV), an eye disease caused by
vasculopathy. For multi-modal registration validated with
clinical CT/PET scans, A-SRWCR also provides a statistically
significant improvement over all other three metrics.
Several reasons account for the excellent performance of
A-SRWCR. First, similar to RaPTOR, A-SRWCR is a local
TABLE VII
QUANTITATIVE ANALYSIS OF MEMORY BANDWIDTH
kernel 1 2 3 4
Bandwidth (GB/s) 94.31 81.46 108.99 95.28
Efficiency (%) 49.07 42.38 56.71 49.57
TABLE VIII COMPUTATION TIME DURING AN ITERATION FOR DIFFERENT IMAGE SIZE.
Image size
SRWCR Derivatives
CPU (ms) GPU (ms) Acceleration rate CPU (ms) GPU (ms) Acceleration rate
64×64×24 327 21 15.6 297 4 74.3
128×128×49 2278 132 17.3 2153 32 67.3
256×256×99 18533 851 21.8 16989 238 71.4
Fig. 8. Average execution time for four datasets.
> REPLACE THIS LINE WITH YOUR PAPER IDENTIFICATION NUMBER (DOUBLE-CLICK HERE TO EDIT) <
11
similarity measure. Although it may be over-constrained to
map all intensities between two images using one function, it is
more feasible to assume a functional dependence between
intensities within a subregion, especially for small region.
Second, in virtue of the cubic B-spline function, the intensity of
each voxel is weighted in terms of the distance to the center of
subregion. It is therefore more reliable in estimating one-to-one
mapping relationship for each region. Third, we rigorously
deduce A-SRWCR from a three-channel joint PDF which is
estimated by a second-order polynomial function. It ensures
that the presented metric is more accurate to measure the
difference between two images and more differentiable.
Recently, the symmetric diffeomorphic transformation
model which ensures the reversible spatial deformations has
been successfully incorporated into some similarity measures
and significantly improves the registration accuracy [35], [36].
In the future, we will investigate the potential advantages of
combining A-SRWCR with this symmetric diffeomorphic
framework on more challenging applications such as the
diseased OCT images.
V. CONCLUSION
We have presented SRWCR as a novel similarity measure
for non-rigid registration, and sped up the computation of
SRWCR and its derivatives using CUDA-programming. The
experiments on both mono-modal and multi-modal datasets
have shown that A-SRWCR is very stable and outperforms the
existing methods such as MI, SEMI or RaPTOR. With more
accurate matching performance and higher speed, our proposed
registration framework is more suitable to handle the clinical
challenges.
APPENDIX I
Here, we derive (19) from (18) in detail. The key is to
compute the derivatives of 2 , ( )r r a with the respect to ( )B y .
Therefore, we first compute them independently. 2
2
0
( )2
( ) ( ) ( )
Lr r r
rb
bpb
B B B
y y y
2
0 0
( ) ( )2
( ) ( )
L Lr r
rb b
b bp pbb
B B
y y
02
0
( , )( 2 )
( )
LL
a rr
b
a bpbb
B
y. (22)
Since ( )r
ap is independent in ( )B y , ( ) ( )r a B y can be
calculated as follows
0
( , )( ) 1
( ) ( ) ( )
Lr r
br
a ba pb
B a Bp
y y. (23)
Combining (22) and (23) with (18), we obtain
022
0 0 0 0
( , ) ( , )1( ) 2 ( )
( ) ( ) ( )
LR L L Ln
a r rr
r b a br
a b a bp pDp r a bb
M B B
y y y
022
0
( , )(1 ( , | ))( 2 )
( )
LL
a rr
br
a bpCR A B rbb
B
y. (24)
After merging the same items, (24) can be simplified as
2 2
20 0 0
2 ( ) (1 ( , | ))( 2 ) ( , , )
( ) ( )
R L Lnr r
r a b r
a CR A B r bbD p a b rb b
M B
y y.
(25)
In virtue of the chain rule, the derivative of the 3-D joint PDF
defined by (3) can be deduced as follows
( )
( , , ) 1( , ) ( ( )) |
( )b B
p a b r hw r h a A
B Z
yx x
y
. (26)
Combining (25) with (26), we have 2 2
20 0 0
(1 ( , | ))( 2 ) 2 ( )1
( )
R L Lnr r
r a b r
CR A B r b abD b b
M Z
y
( )( , ) ( ( )) | b B
hw r h a A
yx x . (27)
APPENDIX II
According to (20), we first compute ( ) ( )r a A y as follows
20 0
( ) ( ) ( , )( ) 1( , )
( ) ( ) ( )( )
L Lr r r
rb brr
a A a ba p pb a b bp
A a Apap
y
y y
0
0
( , ) ( ) ( , )1( )
( ) ( ) ( )
LL
b r rr
br r
a b A a bp pa b
a a Ap p
y
y. (28)
Incorporating (28) into (20), ( )D M y can be re-written as
2 0
20 0
( , )( )2 ( )
( ) ( )
LR Ln
b rr
r ar
a bpD p ra
M A
y y
2 0
0
( , ) ( , )( ) ( )
( ) ( )
LL
br rr r
b
a b a bp pa b a
A A
y y
. (29)
Similar to (25), (29) can be simplified as follows
2
20 0 0
( ) 2 ( ) ( , , )
( ) ( )
R L Lnr r
r a b r
a b aD p a b r
M A
y y . (30)
Combining (30) with (25), we obtain
( )20 0 0
2 ( )1( ) ( , ) ( ( )) |
( )
R L Lnr
r a Ar a b r
b aD ha w r h b B
M Z
yx x
y.
(31)
ACKNOWLEDGMENT
The authors would like to thank MOSTC, NSFC, NSFJ and
CAS for financial support, colleague Chengtao Peng for
valuable discussions and Yang Yang from Huashan Hospital
for providing the clinical CT and PET images. The authors are
also grateful to anonymous reviewers for their valuable
comments and suggestions. The authors declare that there are
no financial interests of the authors in any company.
REFERENCES
[1] C. Lee et al., “Assessment of Parotid Gland Dose Changes During Head and Neck Cancer Radiotherapy Using Daily Megavoltage
Computed Tomography and Deformable Image Registration,” Int. J.
Radiat. Oncol. Biol. Phys., vol. 71, no. 5, pp. 1563–1571, 2008. [2] D. Holland and A. M. Dale, “Nonlinear registration of longitudinal
images and measurement of change in regions of interest,” Med.
Image Anal., vol. 15, no. 4, pp. 489–497, 2011. [3] P. Aljabar, R. A. Heckemann, A. Hammers, J. V. Hajnal, and D.
Rueckert, “Multi-atlas based segmentation of brain images: Atlas
selection and its effect on accuracy,” Neuroimage, vol. 46, no. 3, pp. 726–738, 2009.

> REPLACE THIS LINE WITH YOUR PAPER IDENTIFICATION NUMBER (DOUBLE-CLICK HERE TO EDIT) <
12
[4] J. A. Collins et al., “Improving Registration Robustness for
Image-Guided Liver Surgery in a Novel Human-to-Phantom Data Framework,” IEEE Trans. Med. Imaging, vol. 36, no. 7, pp.
1502–1510, 2017.
[5] A. Sotiras, C. Davatzikos, and N. Paragios, “Deformable medical image registration: A survey,” IEEE Trans. Med. Imaging, vol. 32,
no. 7, pp. 1153–1190, 2013.
[6] E. Ferrante and N. Paragios, “Slice-to-volume medical image registration: A survey,” Med. Image Anal., vol. 39, pp. 101–123,
2017.
[7] W. Wells, P. Viola, H. Atsumid, S, Nakajimae and R. Kikinis, “Multi-modal volume registration maximization of mutual
information,” Med. Image Anal., vol. 1, no. 1, pp. 35-51, 1996.
[8] F. Maes, A. Collignon, D. Vandermeulen, G. Marchal, and P. Suetens, “Multimodality image registration by maximization of mutual
information,” IEEE Trans. Med. Imag., vol. 16, no. 2, pp. 187–198,
1997. [9] J. P. W. Pluim, J. B. A. Maintz, and M. A. Viergever,
“Mutual-information-based registration of medical images: A survey,”
IEEE Trans. Med. Imaging, vol. 22, no. 8, pp. 986–1004, 2003.
[10] X. Zhuang, S. Arridge, D. J. Hawkes, and S. Ourselin, “A nonrigid
registration framework using spatially encoded mutual information
and free-form deformations,” IEEE Trans. Med. Imaging, vol. 30, no. 10, pp. 1819–1828, 2011.
[11] H. Rivaz, Z. Karimaghaloo, and D. L. Collins, “Self-similarity
weighted mutual information: A new nonrigid image registration metric,” Med. Image Anal., vol. 18, no. 2, pp. 343–358, 2014.
[12] H. Rivaz, Z. Karimaghaloo, V. Fonov, and D. L. Collins, “Nonrigid registration of ultrasound and MRI using contextual conditioned
mutual information,” IEEE Trans. Med. Imag., vol. 33, no. 3, pp.
708–725, 2014. [13] D. Rueckert, M. J. Clarkson, D. L. G. Hill, and D. J. Hawkes,
“Nonrigid registration using higher-order mutual information,” in
Proc. SPIE, vol. 3979, p. 438, Mar. 2000. [14] D. B. Russakoff, C. Tomasi, T. Rohlfing, and C. R. Maurer, Jr.,
“Image similarity using mutual information of regions,” in Proc. 8th
Eur. Conf. Comput. Vis., 2004, pp. 596–607.
[15] J. P. W. Pluim, J. B. A. Maintz, and M. A. Viergever, “Image
Registration by Maximization of Combined Mutual
Information and Gradient Information,” IEEE Trans. Med. Imag., vol. 19, no. 8, pp. 809-814, 2000.
[16] J. Woo, M. Stone, and J. L. Prince, “Multimodal Registration via
Mutual Information Incorporating Geometric and Spatial Context,” IEEE Trans. Image Process., vol. 24, no. 2, pp. 757-769, 2015.
[17] C. Studholme, C. Drapaca, B. Iordanova, and V. Cardenas,
“Deformation-based mapping of volume change from serial brain MRI in the presence of local tissue contrast change,” IEEE Trans.
Med. Imaging, vol. 25, no. 5, pp. 626–639, 2006.
[18] S. Klein, U. A. van der Heide, I. M. Lips, M. van Vulpen, M. Staring, and J. P. W. Pluim, “Automatic segmentation of the prostate in 3D
MR images by atlas matching using localized mutual information,”
Med. Phys., vol. 35, no. 4, pp. 1407–1417, 2008. [19] D. Loeckx, P. Slagmolen, F. Maes, D. Vandermeulen and P. Suetens,
“Nonrigid Image Registration Using Conditional Mutual
Information,” IEEE Trans. Med. Imaging, vol. 29, no. 1, pp. 19–29, 2010.
[20] S. Ourselin, A. Roche, S. Prima, and N. Ayache, “Block matching:
A general framework to improve robustness of rigid registration of medical images,” in Med. Image Comput. Comput. Assisted Intervent.
(MICCAI), 2000, pp. 557–566.
[21] A. Roche, G. Malandain, X. Pennec, and N. Ayache, “The correlation ratio as a new similarity measure for multimodal image registration,”
in Proc. Med. Image Comput. Comput. Assisted Intervent. (MICCAI),
1998, pp. 1115–1124. [22] A. Roche, G. Malandain, N. Ayache, X. Pennec, “Multimodal Image
Registration by Maximization of the Correlation Ratio,” Technical
Report, INRIA, 1998. [23] H. Rivaz, S. J. S. Chen, and D. L. Collins, “Automatic deformable
MR-ultrasound registration for image-guided neurosurgery,” IEEE
Trans. Med. Imaging, vol. 34, no. 2, pp. 366–380, 2015. [24] X. Du, L. Gong et al., “ Non-rigid registration of retinal OCT images
using conditional correlation ratio,” in International Workshop on
Ophthalmic Medical Image Analysis, 2017, pp. 159-167.
[25] R. Xu, Y. Chen, S. Tang, and S. Morikawa, “Parzen-Window Based
Normalized Mutual Information for Medical Image Registration,” IEICE Trans. Inf. & Syst, vol. 91, no. 1, pp. 132–144, 2008.
[26] D. Rueckert, L. I. Sonoda, C. Hayes, D. L. G. Hill, M. O. Leach, and
D. J. Hawkes, “Nonrigid registration using free-form deformations: application to breast MR images,” IEEE Trans. Med. Imaging, vol.
18, no. 8, pp. 712–721, 1999.
[27] S. Klein, M. Staring, K. Murphy, M. A. Viergever, and J. P. W. Pluim, “Elastix: A toolbox for intensity-based medical image registration,”
IEEE Trans. Med. Imaging, vol. 29, no. 1, pp. 196–205, 2010.
[28] J. W. Suh, O. Kwon, D. Scheinost, A. J. Sinusas, G. W. Cline, and X. Papademetris, “CT-PET weighted image fusion for separately
scanned whole body rat.,” Med. Phys., vol. 39, no. 1, pp. 533–542,
2012. [29] R. Castillo, E. Castillo, J. Martinez, and T. Guerrero, “Ventilation
from four dimensional computed tomography: Density versus
Jacobian methods,” Phys. Med. Biol., vol. 55, pp. 4661–4685, 2010. [30] Z. Li, D. Mahapatra, J. A. W. Tielbeek, J. Stoker, L. J. van Vliet, and
F. M. Vos, “Image Registration Based on Autocorrelation of Local
Structure,” IEEE Trans. Med. Imaging, vol. 35, no. 1, pp. 63–75,
2016.
[31] Z. Jian, L. Yu, B. Rao, B. J. Tromberg, and Z. Chen, “Three-
dimensional speckle suppression in optical coherence tomography based on the curvelet transform,” Opt. Exp., vol. 18, no. 2, pp.
1024–1032, 2010.
[32] F. Shi et al., “Automated 3-D retinal layer segmentation of macular optical coherence tomography images with serous pigment epithelial
detachments,” IEEE Trans. Med. Imaging, vol. 34, no. 2, pp. 441–452, 2015.
[33] L. Gong et al., “ Non-rigid MR-TRUS image registration for image-
guided prostate biopsy using correlation ratio-based mutual information,” BioMed. Eng. OnLine, vol. 16, no. 8, pp. 1-21, 2017.
[34] J. N. Ratchford, S. Saidha et al., “Active MS is associated with
accelerated retinal ganglion cell/inner plexiform layer thinning,” Neurology, vol. 80, no. 1, pp. 47-54, 2013.
[35] M. Lorenzi, N. Ayache, G. B. Frisoni, and X. Pennec, “LCC-Demons:
a robust and accurate symmetric diffeomorphic registration
algorithm.,” Neuroimage, vol. 81, pp. 470–483, 2013.
[36] S. Reaungamornrat et al., “MIND Demons: Symmetric Diffeomorphic
Deformable Registration of MR and CT for Image-Guided Spine Surgery,” IEEE Trans. Med. Imaging, vol. 35, no. 11, pp. 2413–2424,
2016.