Non-Revenue Water: Model for Optimal Management in ... · Non-Revenue Water: Model for Optimal...
48
Non-Revenue Water: Model for Optimal Management in Developing Countries 1 Alan S. Wyatt RTI International North Carolina, USA Water Loss 2010 Sao Paulo, Brazil June 2010
-
Upload
hoangxuyen -
Category
Documents
-
view
230 -
download
0
Transcript of Non-Revenue Water: Model for Optimal Management in ... · Non-Revenue Water: Model for Optimal...

Non-Revenue Water: Model for Optimal Management in Developing Countries
1
Alan S. WyattRTI International
North Carolina, USA
Water Loss 2010Sao Paulo, Brazil
June 2010

2
1. Current Situation
2. ConceptualFramework
3. New Model Mathematics
4. Running the New Model
5.Results in 27 Countries 6. Conclusions

1. Current Situation
3
Typical water kiosk in African cities
Water supply in LDCs
• 900 million people without improved water
• 1.5 million children die each year from diahrrea
• More die from diarrhea than HIV/AIDs
• Most unserved are in peri-urban poor areas - where illegal connections are rampant
• Millenium development goals call for unserved to be cut in half by 2015
4
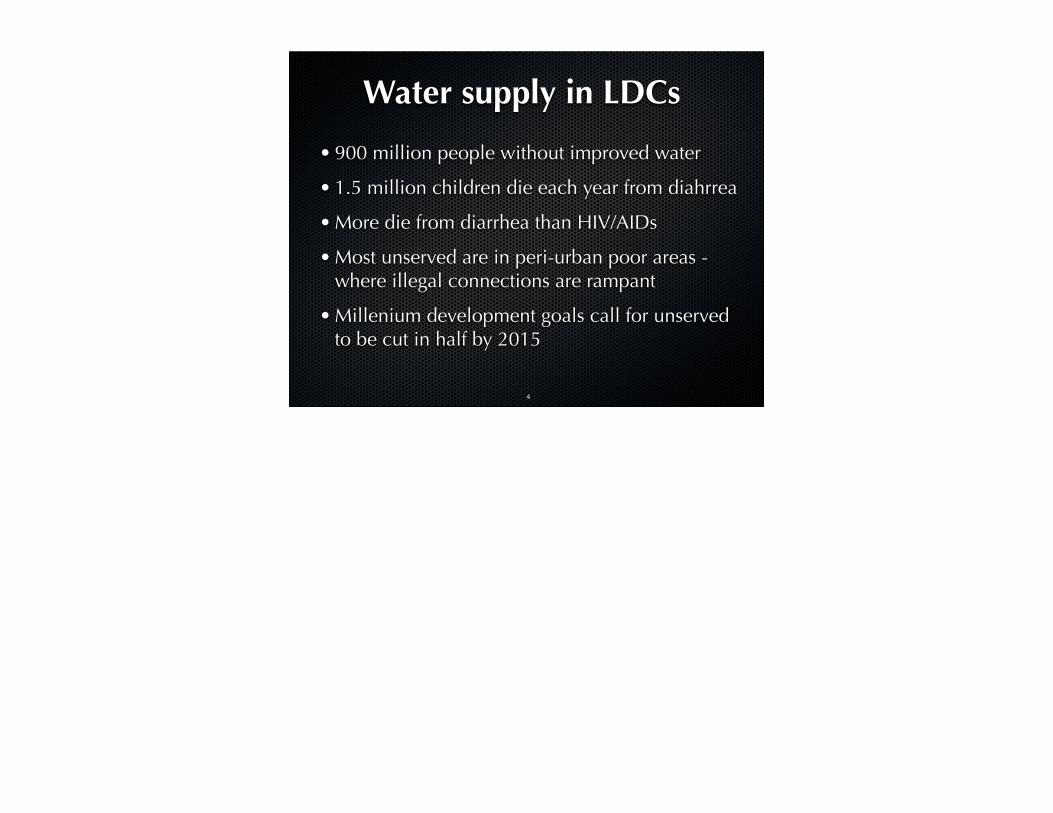
NRW: Major resource, but...
• 45 million m3/day leakage - could serve up to half the 900 million unserved
• 30 million m3/day not paid for - utility revenues could go up 13%-40%.
• Cost of NRW reduction far less than new water plants
• Few financial or political incentives to reduce or control NRW
• Target setting not rational or based on local conditions or financial realities
5
Existing tools
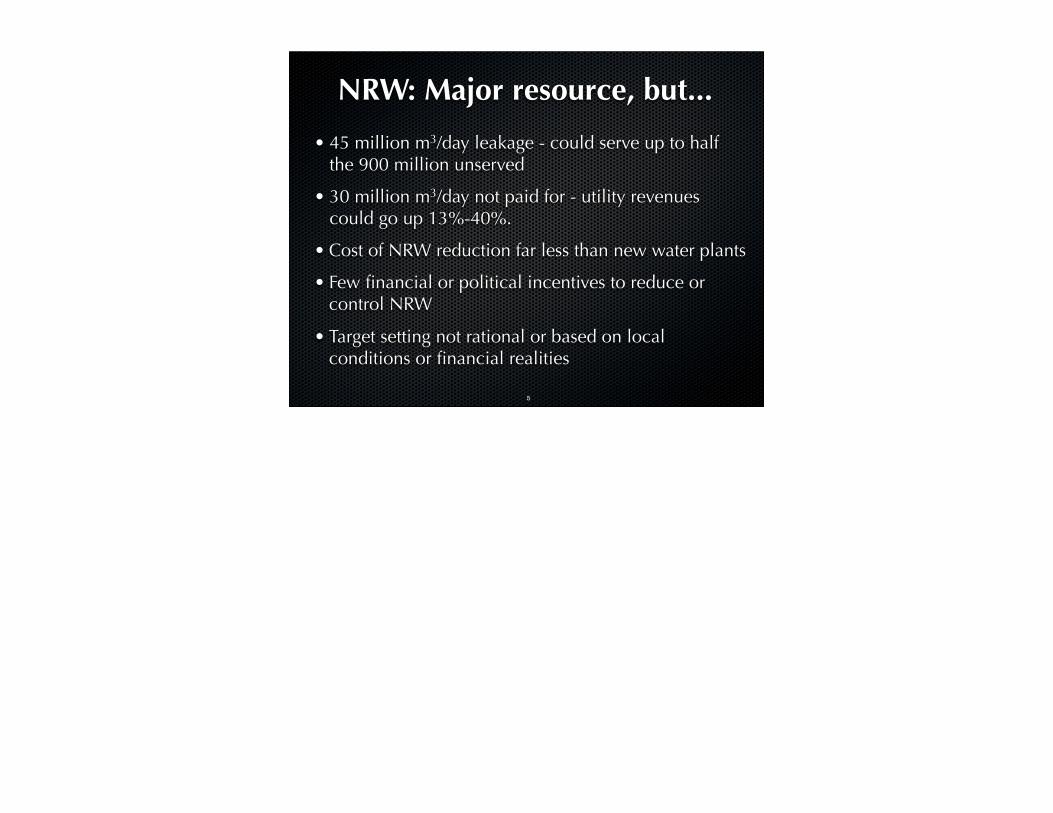
•Water Balance fundamental tool for all - has been adjusted for LDCs
•BABE, FAVAD, ELL, UARL and ILI = Good tools for developed countries leakage.
• Ignore commercial losses and capital cost savings.
•Concerns about UARL flow rates and use of ILI in developing countries
6

New Financial Model Enables:
• Utilites: Find optimum total losses, find zones where losses are furthest from optimal, set targets, plan reduction and control programs
• Ministries / Regulators: Set targets for NRW and prioritize among utilities. Arrange twinning and exchanges.
• National Policy-makers and Donors: Identify utlities for NRW assistance, and develop National NRW Guidelines & Programs
7

8
2. Conceptual Framework
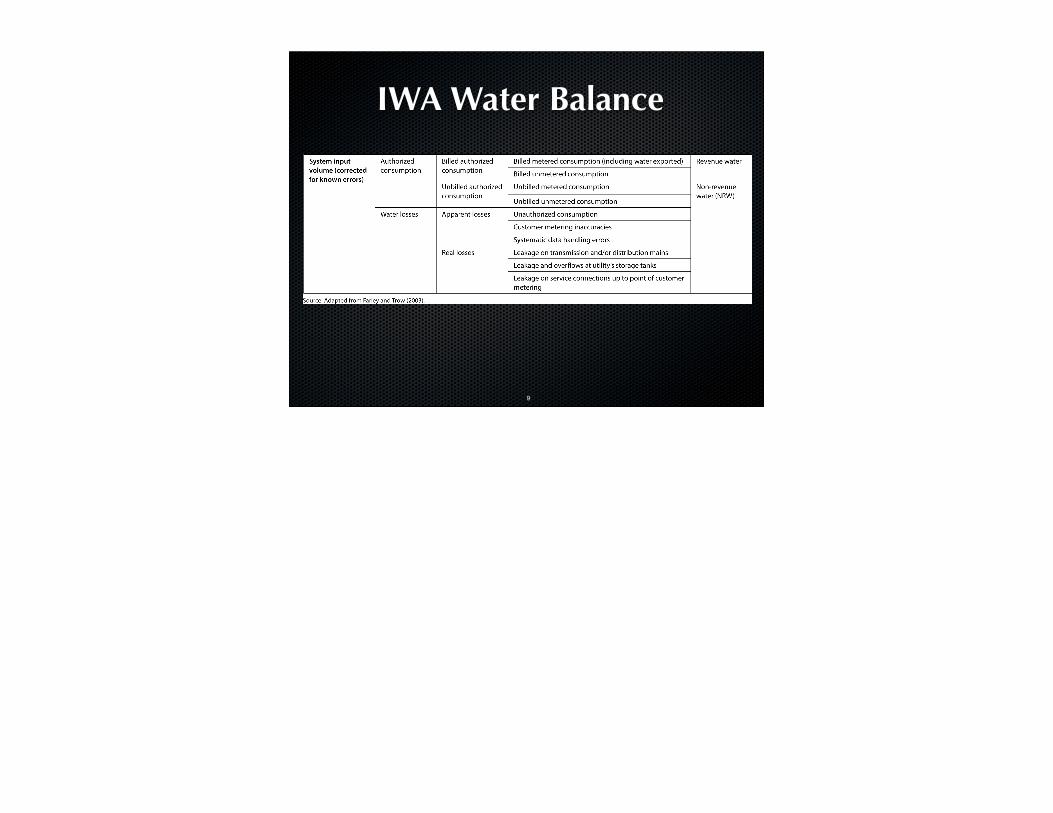
IWA Water Balance
9
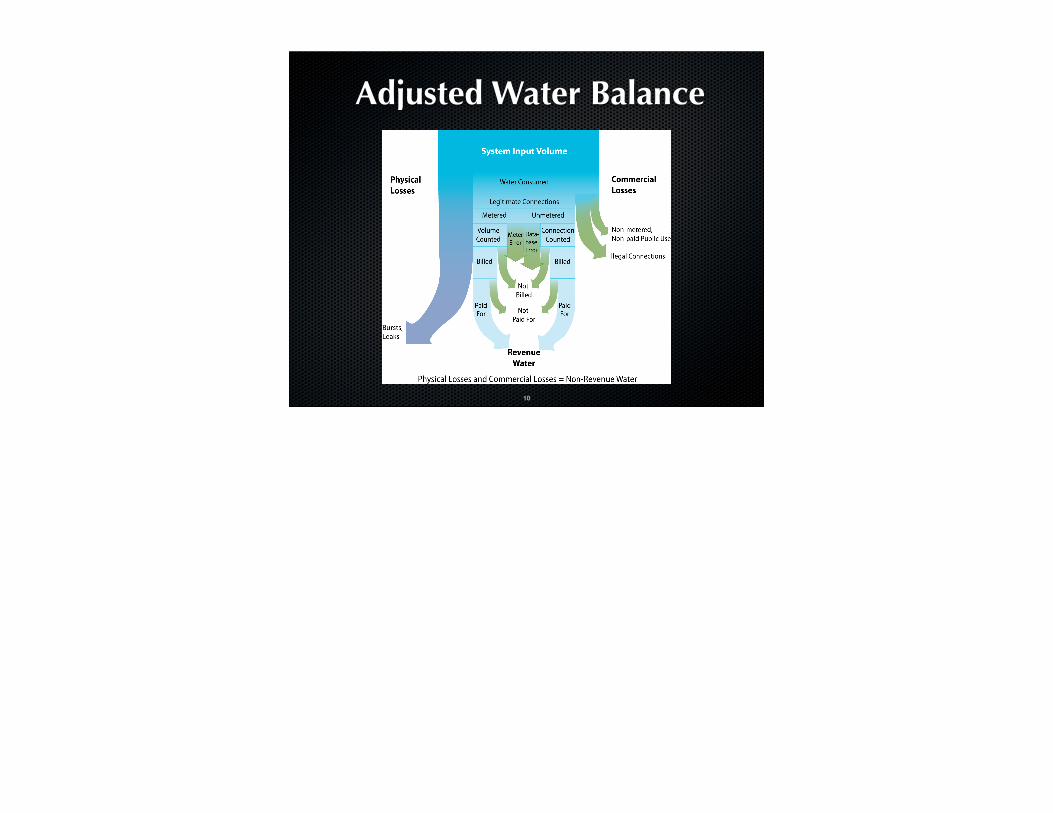
Adjusted Water Balance
10
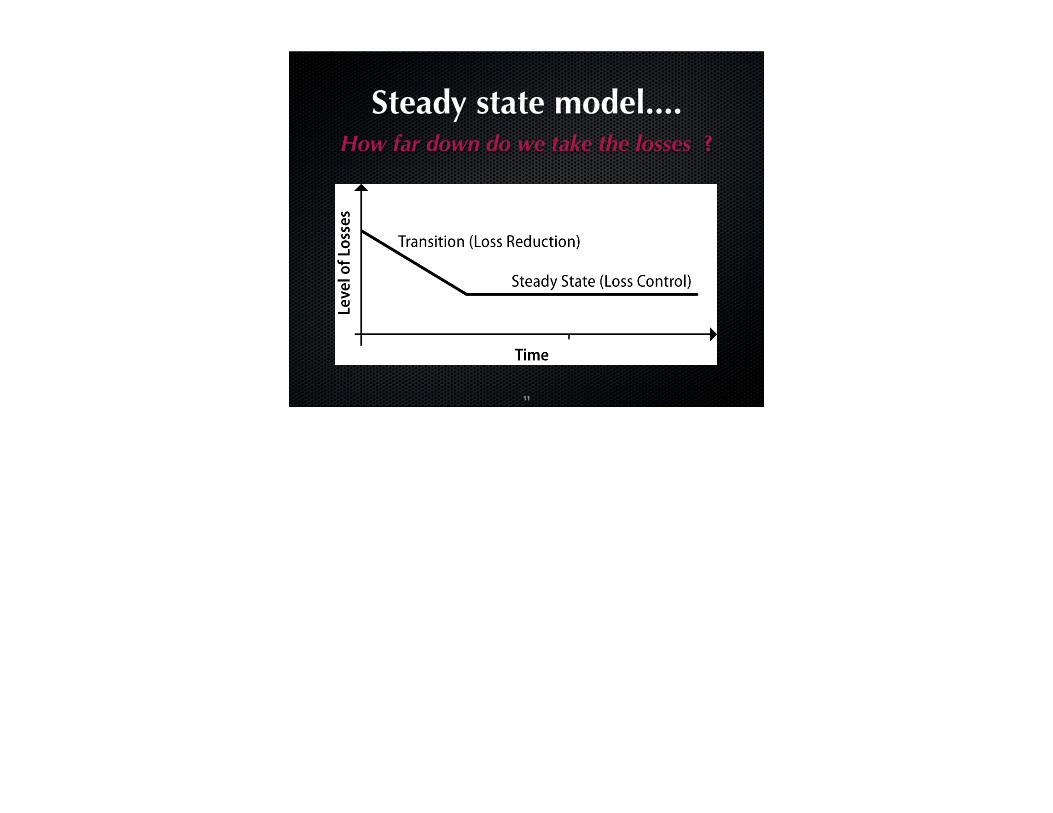
Steady state model....How far down do we take the losses ?
11
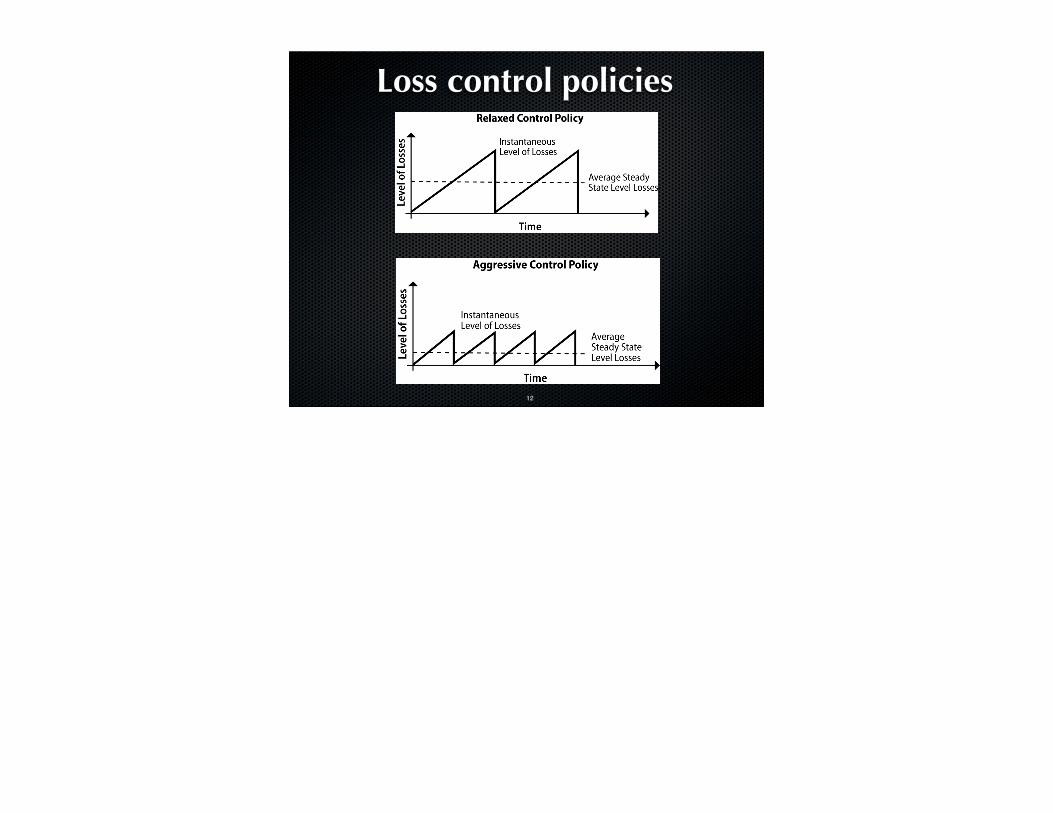
Loss control policies
12
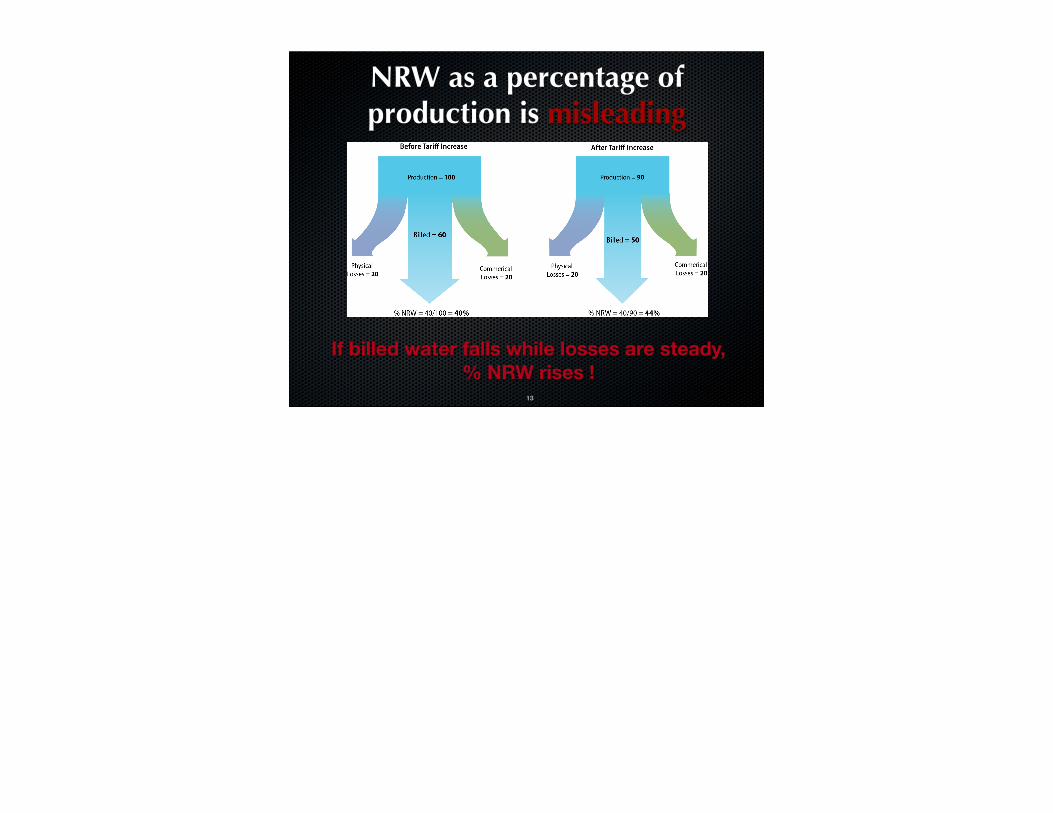
NRW as a percentage of production is misleading
13
If billed water falls while losses are steady, % NRW rises !

3. Model Mathematics
14

Mathematical Framework
15

Objective Function1. Maximize utility surplus(loss), based on decision
variables: specific level of losses, lp and lc
lp = Physical Losses / System Inputlc = Commercial Losses / Consumption
S = R − [ Cv + Cc + Cpl + Ccl ]
S = Annual Surplus (loss)R = Collected Revenue (lc)
Cv = Variable cost of water production (lp)Cc = Annualized present value of future Capital cost (lp)
Cpl = Cost of physical loss control program (lp)
16

2. Develop formula for each component in terms of lp and lc.
3. Differentiate formula for surplus with respect to lc, set to zero and solve for optimal lc, lc*
4. Differentiate formula for surplus with respect to lp, set to zero and solve for optimal lp, lp*
17
Optimality Conditions

Commercial Loss: Optimality
18
R=N q r(1- lc)
Ccl=M N s / 2 lc
lc* =(M s / q r K)1/2

Physical loss components
19

EconoLeak Model Parameters
20
Leakage = α + β Ps, m3 / km / dayα = Background + Reported Lossesβ = Unreported Losses (ALC)
!

Physical losses: Optimality condition
21

4. Running the Model
22
23
!
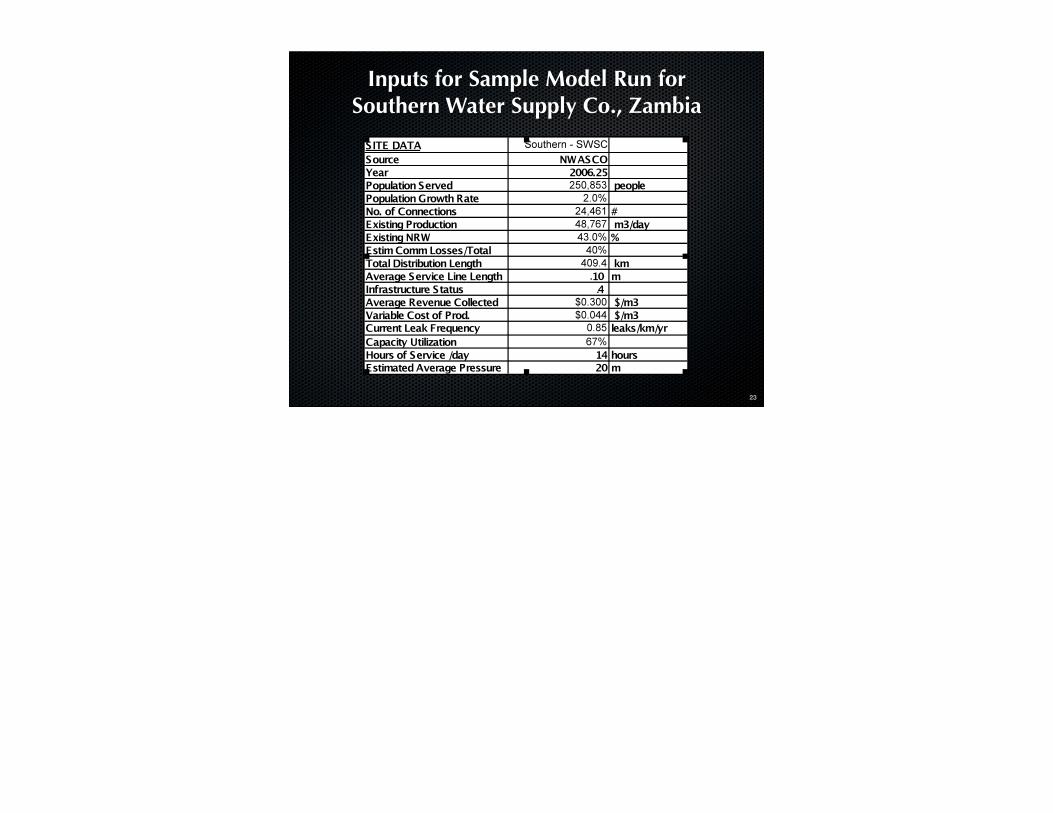
Inputs for Sample Model Run for Southern Water Supply Co., Zambia
24
!
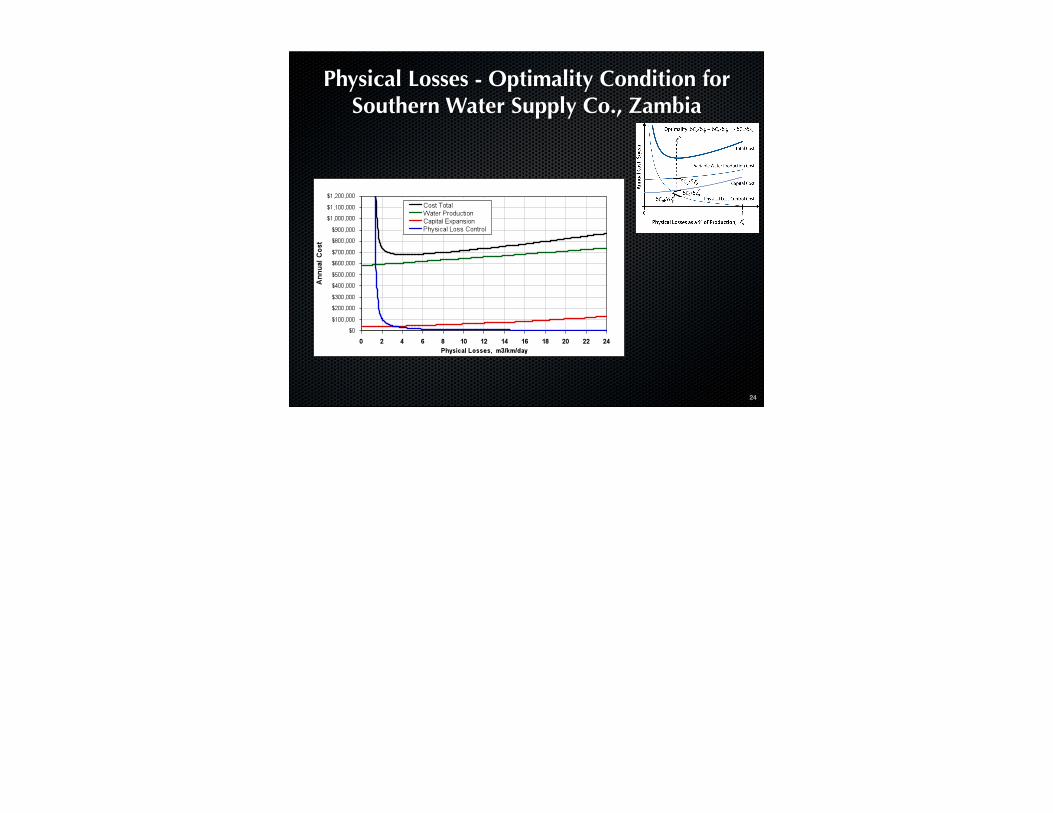
Physical Losses - Optimality Condition for Southern Water Supply Co., Zambia

25
Actual Conditions and Optimal Results for Southern Water Supply Co., Zambia
!

26
Optimal Results for Southern Water Supply Co., Zambia
!

Fig 15
27
Loss Components: Multiple Sites
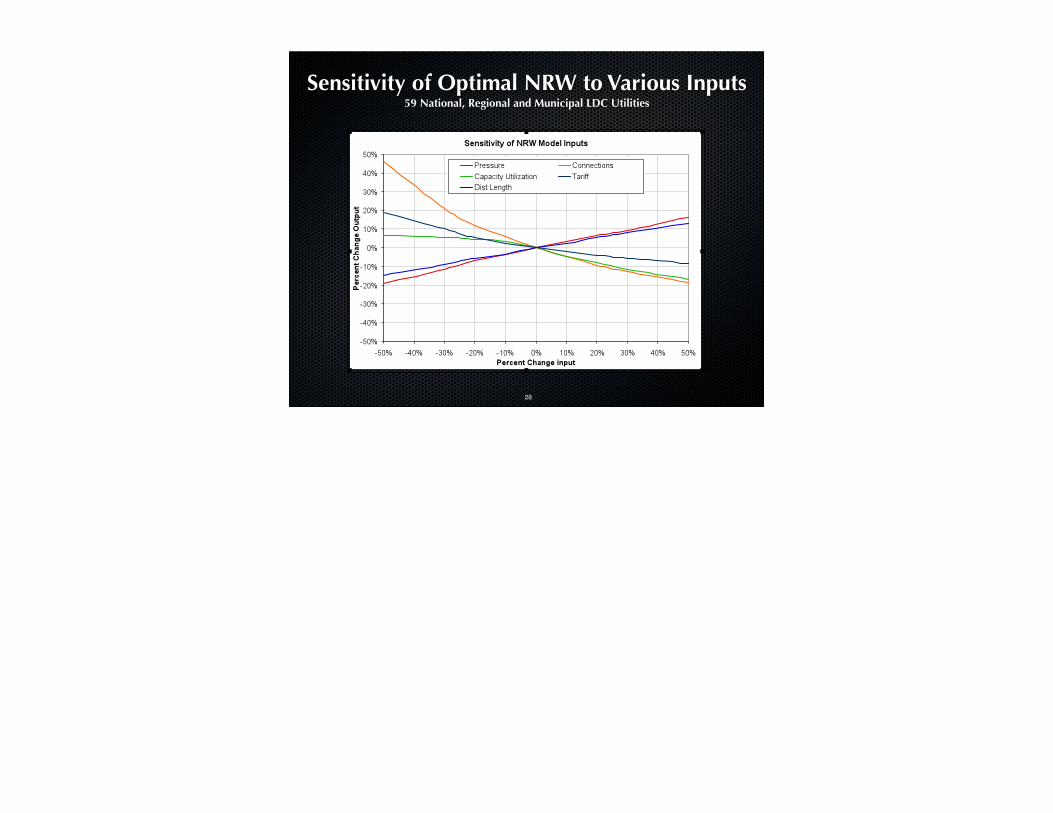
Sensitivity of Optimal NRW to Various Inputs 59 National, Regional and Municipal LDC Utilities
28
!
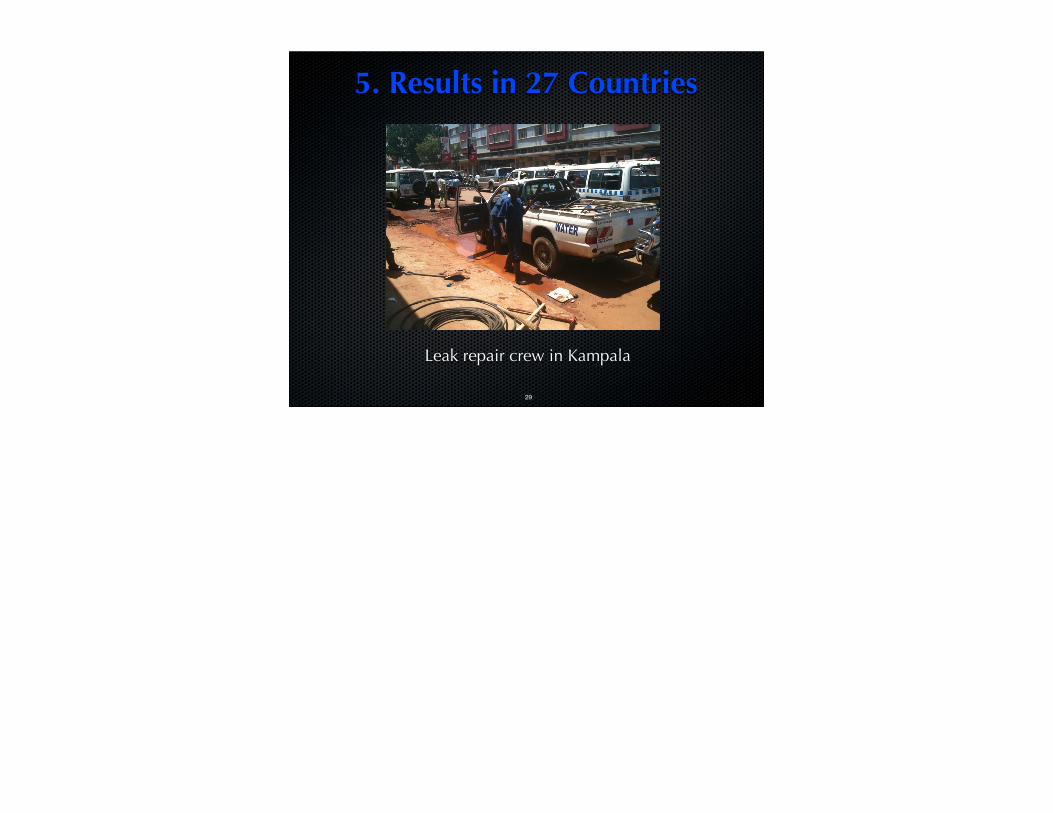
5. Results in 27 Countries
29
Leak repair crew in Kampala
30
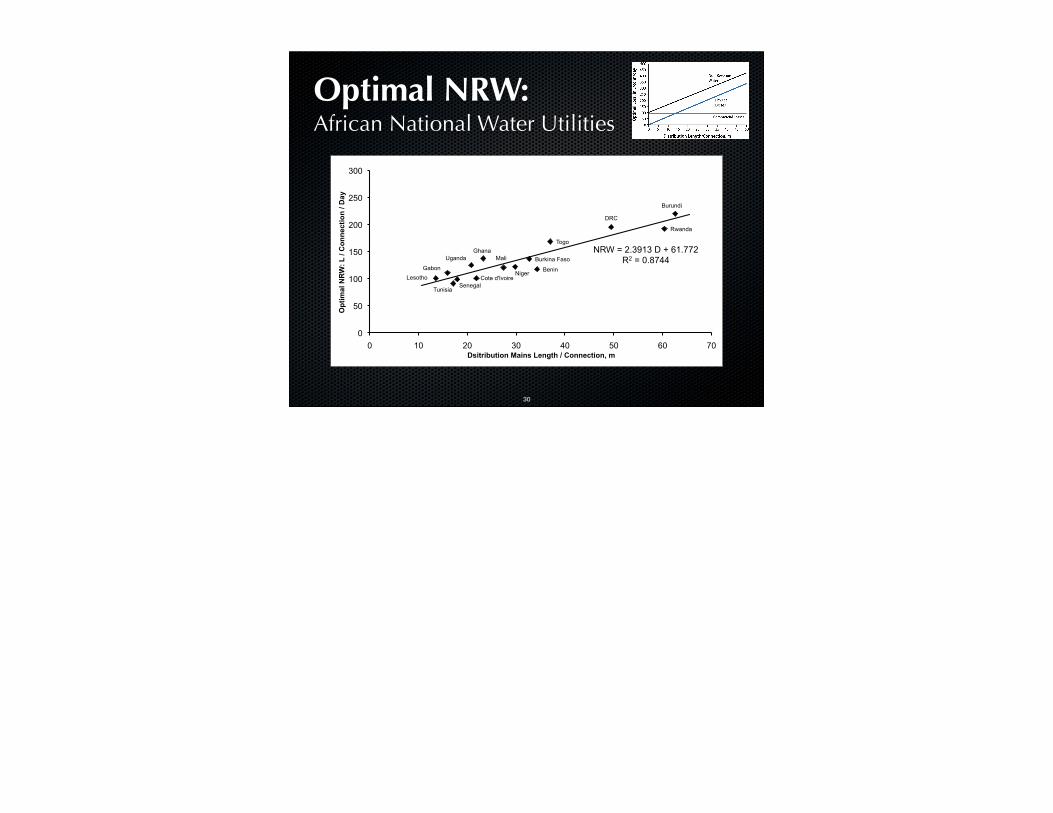
Optimal NRW: African National Water Utilities
DRC
Niger Cote d'Ivoire
Benin
Uganda
Senegal
Burkina Faso Ghana
Tunisia
Lesotho
Mali
Togo
Rwanda
Burundi
Gabon
NRW = 2.3913 D + 61.772 R2 = 0.8744
0
50
100
150
200
250
300
0 10 20 30 40 50 60 70 O
ptim
al N
RW
: L /
Con
nect
ion
/ Day
Dsitribution Mains Length / Connection, m
31
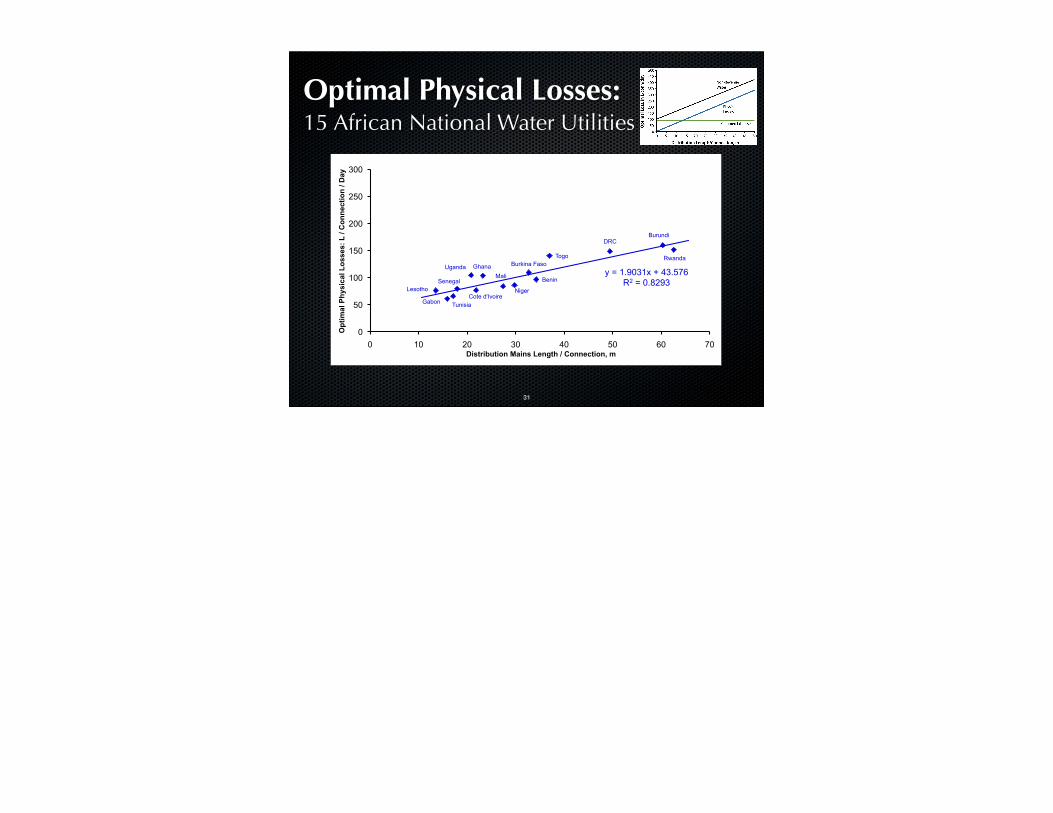
Optimal Physical Losses: 15 African National Water Utilities
DRC
Niger Cote d'Ivoire
Benin
Uganda
Senegal
Burkina Faso Ghana
Tunisia
Lesotho
Mali
Togo Rwanda
Burundi
Gabon
y = 1.9031x + 43.576 R2 = 0.8293
0
50
100
150
200
250
300
0 10 20 30 40 50 60 70 O
ptim
al P
hysi
cal L
osse
s: L
/ C
onne
ctio
n / D
ay
Distribution Mains Length / Connection, m
32
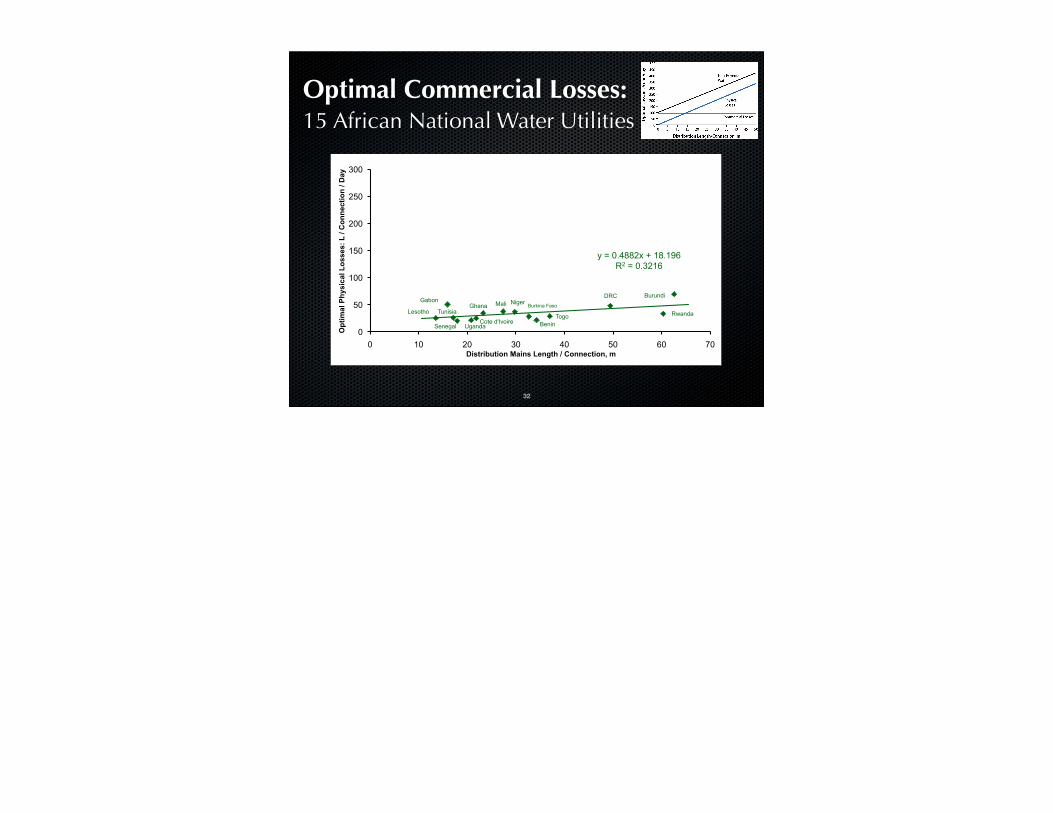
Optimal Commercial Losses: 15 African National Water Utilities
DRC Niger
Cote d'Ivoire Benin Uganda Senegal
Burkina Faso Ghana Tunisia Lesotho
Mali
Togo Rwanda
Burundi Gabon
y = 0.4882x + 18.196 R2 = 0.3216
0
50
100
150
200
250
300
0 10 20 30 40 50 60 70 O
ptim
al P
hysi
cal L
osse
s: L
/ C
onne
ctio
n / D
ay
Distribution Mains Length / Connection, m
33
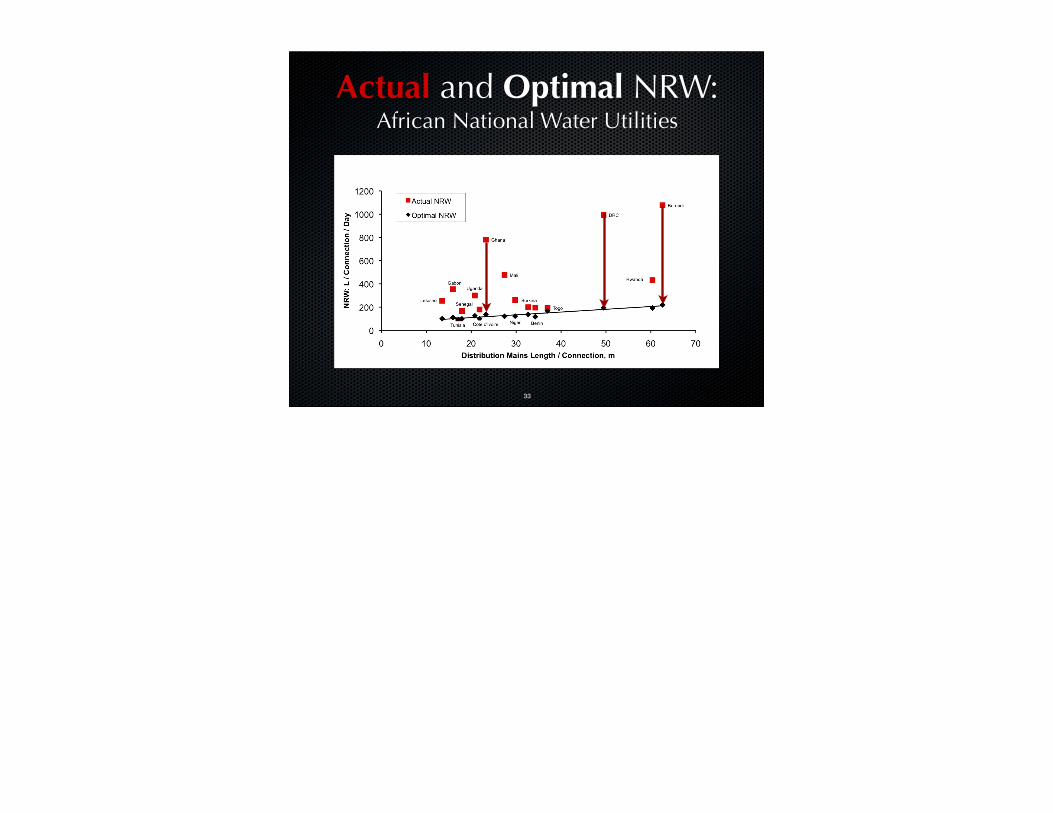
Actual and Optimal NRW: African National Water Utilities

34
y = 2.9384x + 71.254 R2 = 0.6905
0
50
100
150
200
250
300
0 10 20 30 40 50 60 70 O
ptim
al N
RW
, L/
Con
nect
ion/
Day
Distribution Mains Length / Connection, m
Optimal NRW: 44 LDC Municipal and Regional Utilities
35
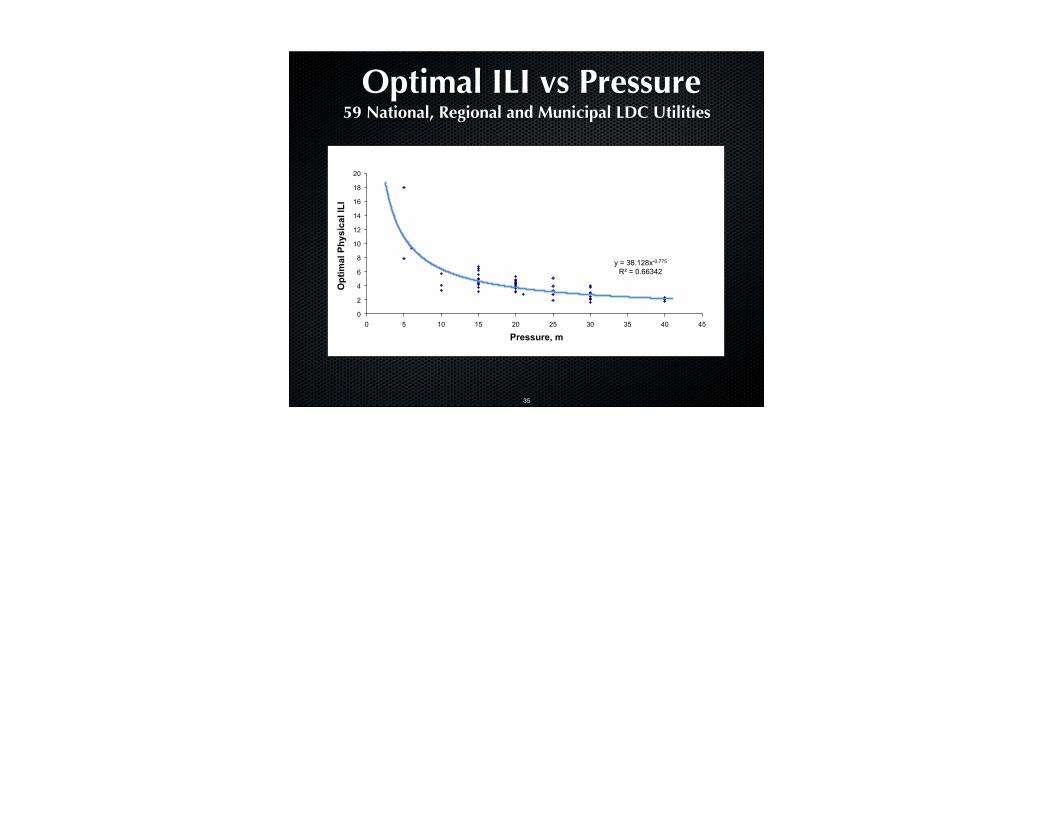
Optimal ILI vs Pressure59 National, Regional and Municipal LDC Utilities
y = 38.128x-0.775 R! = 0.66342
0
2
4
6
8
10
12
14
16
18
20
0 5 10 15 20 25 30 35 40 45
Opt
imal
Phy
sica
l ILI
Pressure, m

36
Optimal ILI vs Line Length59 National, Regional and Municipal LDC Utilities
0
2
4
6
8
10
12
14
16
18
20
0 10 20 30 40 50 60 70 O
ptim
al P
hysi
cal I
LI
Length per Connection, m
37
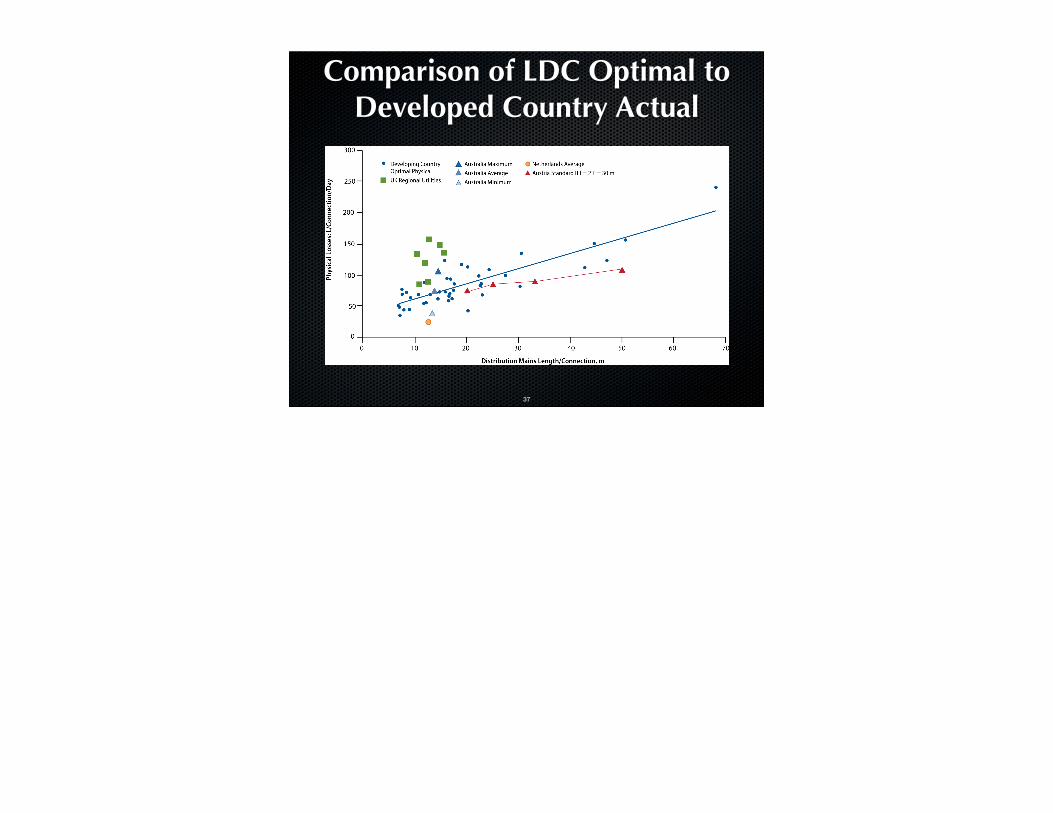
Comparison of LDC Optimal to Developed Country Actual

38
y = 23.877x-0.494 R2 = 0.9989
0
2
4
6
8
10
12
$0 $5 $10 $15 $20 $25 $30 $35 $40 R
epla
cem
ent P
erio
d, Y
ears
Monthly revenue per connection, 2005 $US
Optimal Meter Replacement Period44 LDC Municipal and Regional Utilities
39
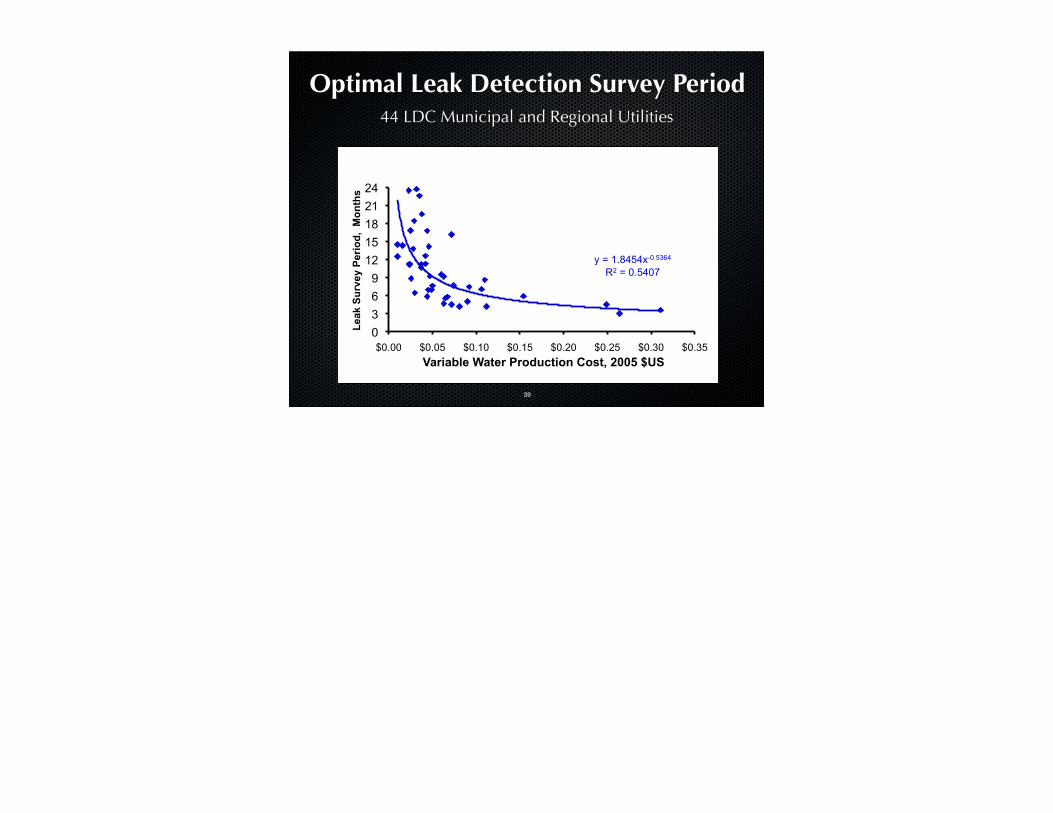
y = 1.8454x-0.5364 R2 = 0.5407
0 3 6 9
12 15 18 21 24
$0.00 $0.05 $0.10 $0.15 $0.20 $0.25 $0.30 $0.35 Le
ak S
urve
y P
erio
d, M
onth
s Variable Water Production Cost, 2005 $US
Optimal Leak Detection Survey Period44 LDC Municipal and Regional Utilities

40
Optimal NRW: Zambia Commercial Utilities, 2006-2007
Nkana
Lusaka Kafubu
Southern
Lukanga Mulonga
Chambesi
Chiapata
NorthWestern
Western
y = 2.2317x + 108.72 R2 = 0.8222
0
50
100
150
200
250
300
0 10 20 30 40 50 60 70
Opt
imal
NR
W,
L/C
onne
ctio
n/D
ay
Distribution Mains Length / Connection, m

41
Actual and Optimal NRW: Zambia Commercial Utilities 2006/2007
Nkana (B)
Lusaka (C) Kafubu (C)
Southern (B)
Lukanga (B)
Mulonga (C)
Chambesi (B)
Chipata (A)
NorthWest (A)
Western (B)
0
250
500
750
1000
1250
1500
1750
2000
2250
2500
0 10 20 30 40 50 60 70
Non
Rev
enue
Wat
er,
L/C
onne
ctio
n/D
ay
Distribution Mains Length / Connection, m
Actual
Optimal
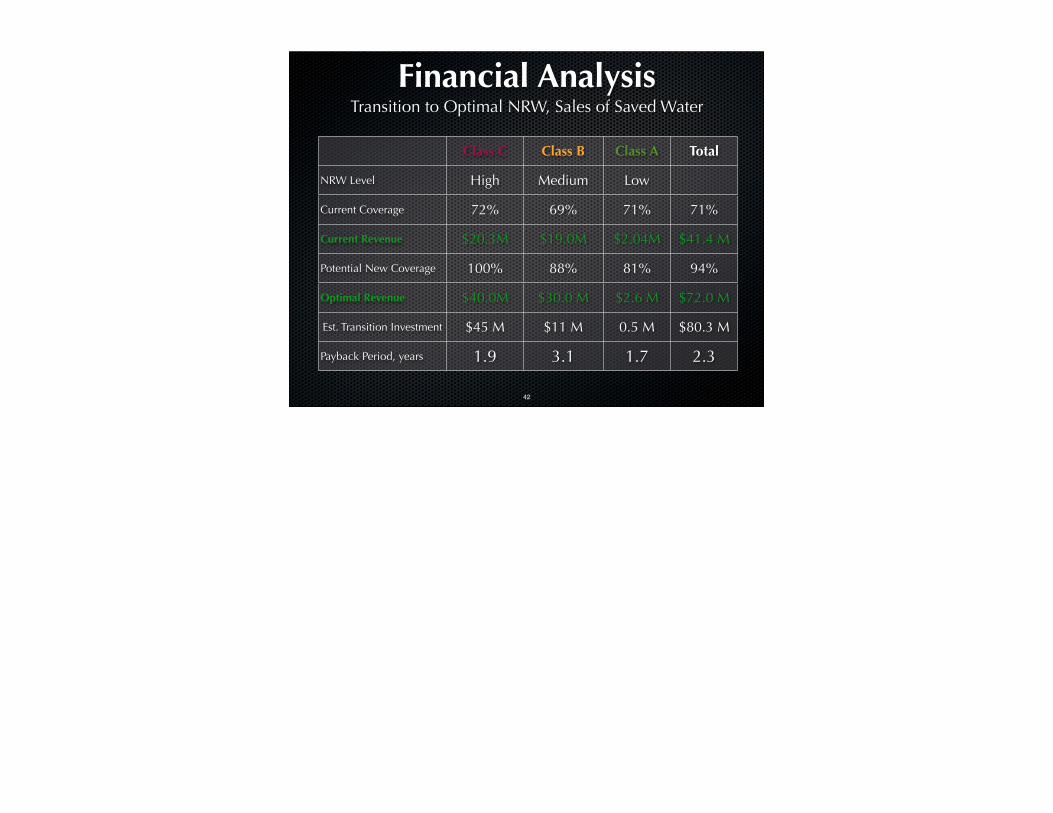
Financial AnalysisTransition to Optimal NRW, Sales of Saved Water
42
Class C Class B Class A Total
NRW Level High Medium Low
Current Coverage 72% 69% 71% 71%
Current Revenue $20.3M $19.0M $2.04M $41.4 M
Potential New Coverage 100% 88% 81% 94%
Optimal Revenue $40.0M $30.0 M $2.6 M $72.0 M
Est. Transition Investment $45 M $11 M 0.5 M $80.3 M
Payback Period, years 1.9 3.1 1.7 2.3

6. Conclusions
43
Water transport in peri-urban Uganda

44
The New Model .....•Produces good estimates of optimal losses, operational
guidelines, and information for financial assessment, without excessive data needs.
•Has a moderate to low sensitivity to model inputs.
•Includes commercial losses and capital savings, giving a more complete analysis
•Shows that large revenue increases are likely
•Helps utilities, policy makers and donors focus their efforts and prepare “bankable” projects.
45
Next Steps1) Country specific models 2) National programs including:
• NRW guidelines, • training, • incentives for NRW reduction and control,
new financing approaches, • performance-based contracts, • seminars, twinning and exchange programs.

46
The Future....
The new model can help countries: •save water, •increase utility revenue, •expand coverage •reach or pass MDGs•reduce health and economic impacts

Obrigado47
O Fim

48
Would you like to collaborate on model application or refinement ?
If you would like to see what the model shows for your utility, email [email protected]
I will send you a data template to complete and send back. I will send you the results. We can decide where to go from there.
If you have comments, suggestions, questions, PLEASE be in touch !