Non probability sampling
15
Reporter: Ma. Cora Antonette E. Yu Purposi ve samplin g Convenience sampling Purposive sampling Quota sampling Voluntary sampling Snowball sampling Dimension sampling Determination of sample size Non- probability Sampling
Transcript of Non probability sampling

Reporter: Ma. Cora Antonette
E. Yu
Purposive sampling
Convenience sampling
Purposive sampling
Quota sampling
Voluntary sampling
Snowball sampling
Dimension sampling
Determination of sample size
Non- probability Sampling
Non-Probability Sampling
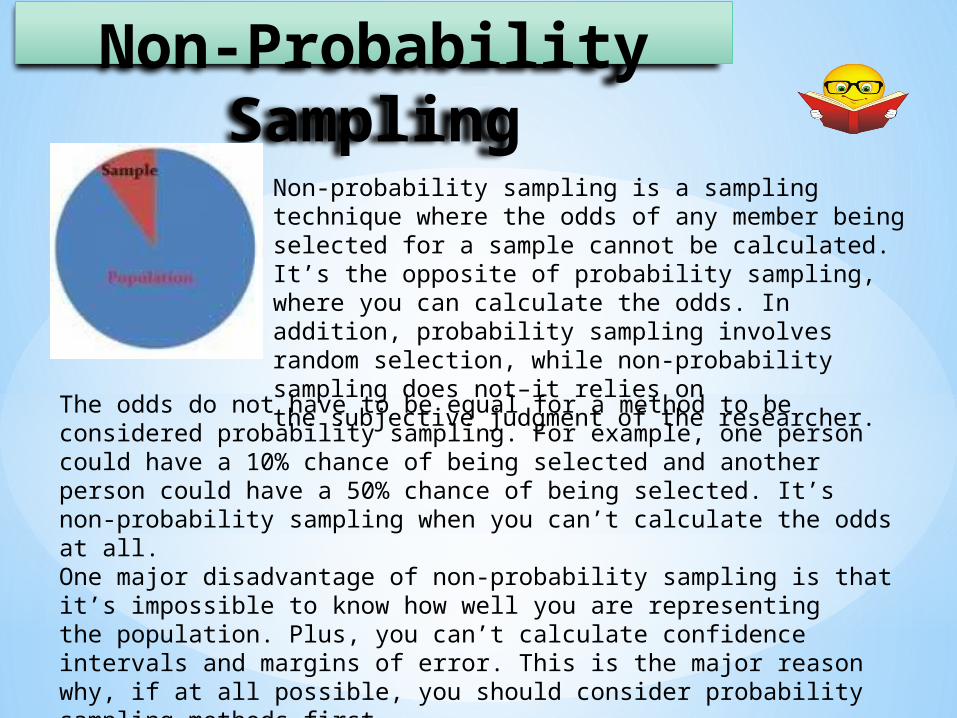
Non-probability sampling is a sampling technique where the odds of any member being selected for a sample cannot be calculated. It’s the opposite of probability sampling, where you can calculate the odds. In addition, probability sampling involves random selection, while non-probability sampling does not–it relies on the subjective judgment of the researcher.The odds do not have to be equal for a method to be
considered probability sampling. For example, one person could have a 10% chance of being selected and another person could have a 50% chance of being selected. It’s non-probability sampling when you can’t calculate the odds at all.One major disadvantage of non-probability sampling is that it’s impossible to know how well you are representing the population. Plus, you can’t calculate confidence intervals and margins of error. This is the major reason why, if at all possible, you should consider probability sampling methods first.
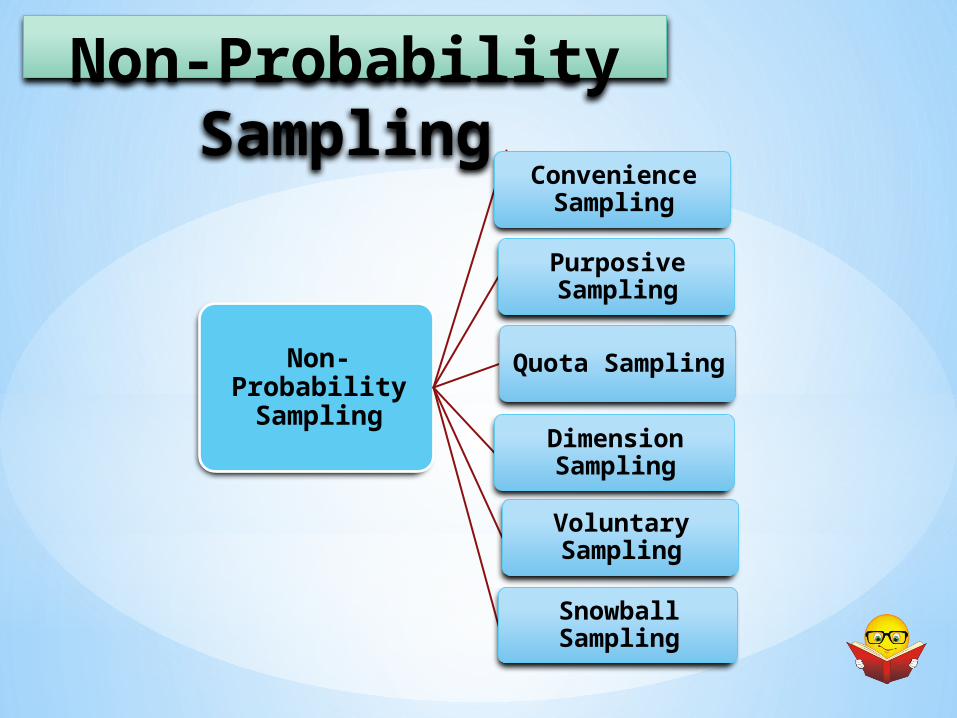
Non-Probability Sampling
Non-Probability Sampling
Quota Sampling
Purposive Sampling
Convenience Sampling
Dimension Sampling
Voluntary Sampling
Snowball Sampling
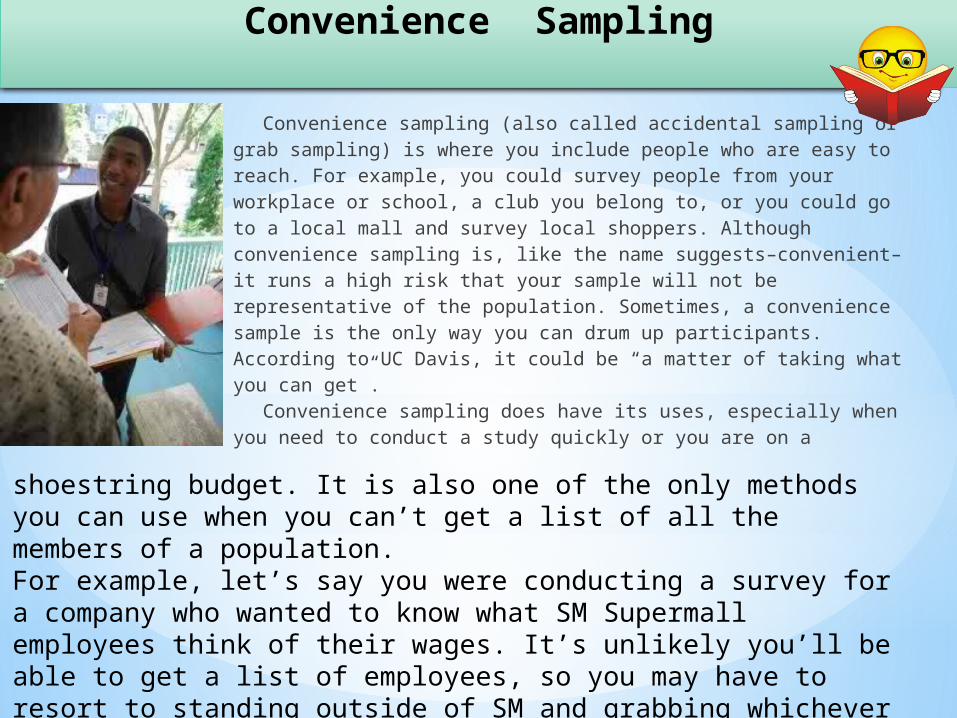
Convenience Sampling
Convenience sampling (also called accidental sampling or grab sampling) is where you include people who are easy to reach. For example, you could survey people from your workplace or school, a club you belong to, or you could go to a local mall and survey local shoppers. Although convenience sampling is, like the name suggests–convenient–it runs a high risk that your sample will not be representative of the population. Sometimes, a convenience sample is the only way you can drum up participants. According to UC Davis, it could be “a matter of taking what you can get”.
Convenience sampling does have its uses, especially when you need to conduct a study quickly or you are on a
shoestring budget. It is also one of the only methods you can use when you can’t get a list of all the members of a population. For example, let’s say you were conducting a survey for a company who wanted to know what SM Supermall employees think of their wages. It’s unlikely you’ll be able to get a list of employees, so you may have to resort to standing outside of SM and grabbing whichever employees come out of the door (hence the name “grab sampling”).
purposive Sampling
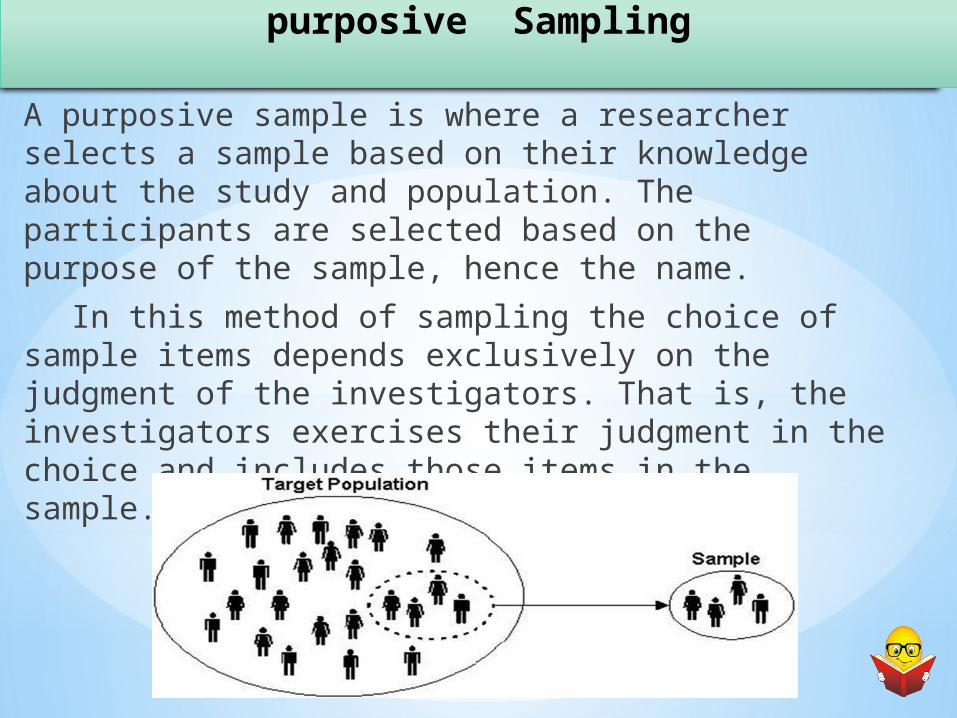
A purposive sample is where a researcher selects a sample based on their knowledge about the study and population. The participants are selected based on the purpose of the sample, hence the name.
In this method of sampling the choice of sample items depends exclusively on the judgment of the investigators. That is, the investigators exercises their judgment in the choice and includes those items in the sample.
Quota Sampling
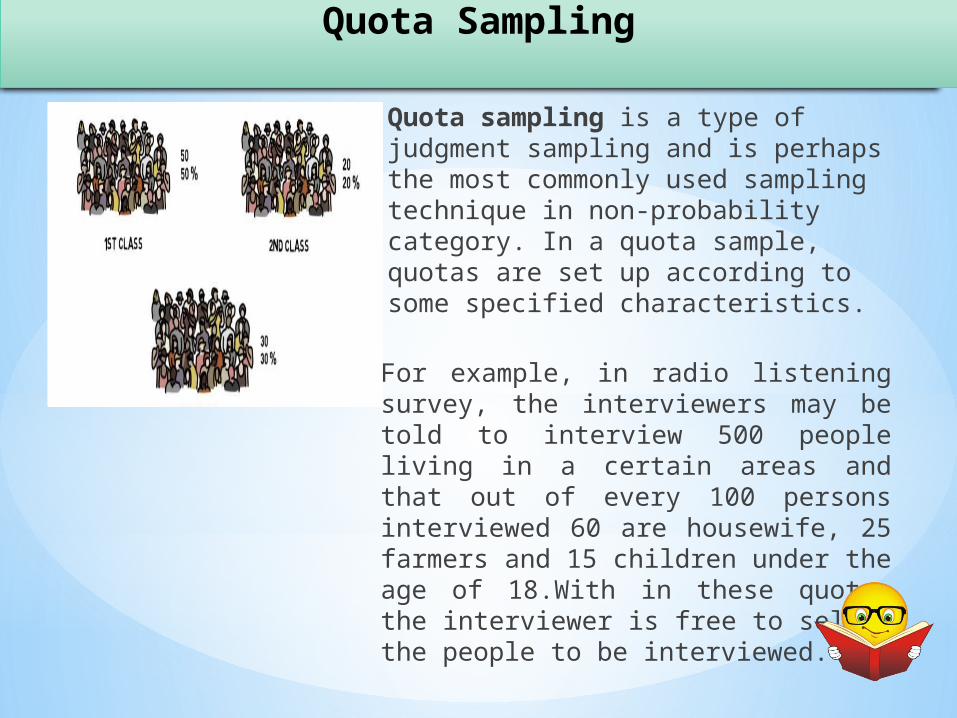
Quota sampling is a type of judgment sampling and is perhaps the most commonly used sampling technique in non-probability category. In a quota sample, quotas are set up according to some specified characteristics.
For example, in radio listening survey, the interviewers may be told to interview 500 people living in a certain areas and that out of every 100 persons interviewed 60 are housewife, 25 farmers and 15 children under the age of 18.With in these quotas the interviewer is free to select the people to be interviewed.
Dimensional sampling
Dimensional Sampling is an extension to quota sampling. The researcher takes into account several characteristics (e.g. gender, income, residence and education. The researcher must ensure that there is at least one person in the study representing each of the chosen characteristics.
For example, it may be important to include the responses of
people of different ages, then ensures that the sample includes respondents from each of the groups thus identified.
Voluntary sampling
A voluntary sample is one of the main types of non-probability sampling methods. A voluntary sample is made up of people who self-select into the survey. Often, these folks have a strong interest in the main topic of the survey.
For example, in the recent international pageant here in the Philippines, social media are busy looking for the next woman to be crowned Miss Universe 2017 through an on-line poll.
Snowball sampling
Snowball sampling is known as network or chain referral sampling.
The researcher identifies a small number of respondents who possess a specific set of characteristics of interest. Then these respondents will provide others who possess the same characteristics set. This can be useful for a population where sampling is difficult (ex. Gang members, rape victims or drug addicts)
Determination of sample size
The sample size is an important feature of any empirical study in which the goal is to make inferences about a population from a sample. In practice, the sample size used in study is determined based of the expense of data collection, and the need to have sufficient statistical power.
Different opinions have been expressed by experts for the selection of sample size (i.e 5%,10% or 25% of the population). There are no hard and fast rule can be laid down. However, according to the law of large number, the largest the sample size, the better the estimation, or the larger the sample, the closer the ‘true’ value of the population. It may also be pointed out that the sample size should neither be too large nor too small. It should be 'optimum' (efficiency, representativeness, reliability and flexibility).
Calculating the Sample Size (ss)
Before we can calculate a sample size, we need to determine a few things about the target population and the sample we need:
1. Population Size (N) — How many total people fit your demographic? For instance, if you want to know about mothers living in the US, your population size would be the total number of mothers living in the US. Don’t worry if you are unsure about this number. It is common for the population to be unknown or approximated.
2. Margin of Error (e) — No sample will be perfect, so you need to decide how much error to allow. The confidence interval determines how much higher or lower than the population mean you are willing to let your sample mean fall. If you’ve ever seen a political poll on the news, you’ve seen a confidence interval. It will look something like this: “68% of voters said yes to Proposition Z, with a margin of error of +/- 5%.”
3. Confidence Level (Z-score) — How confident do you want to be that the actual mean falls within your confidence interval? The most common confidence intervals are 90% confident, 95% confident, and 99% confident.
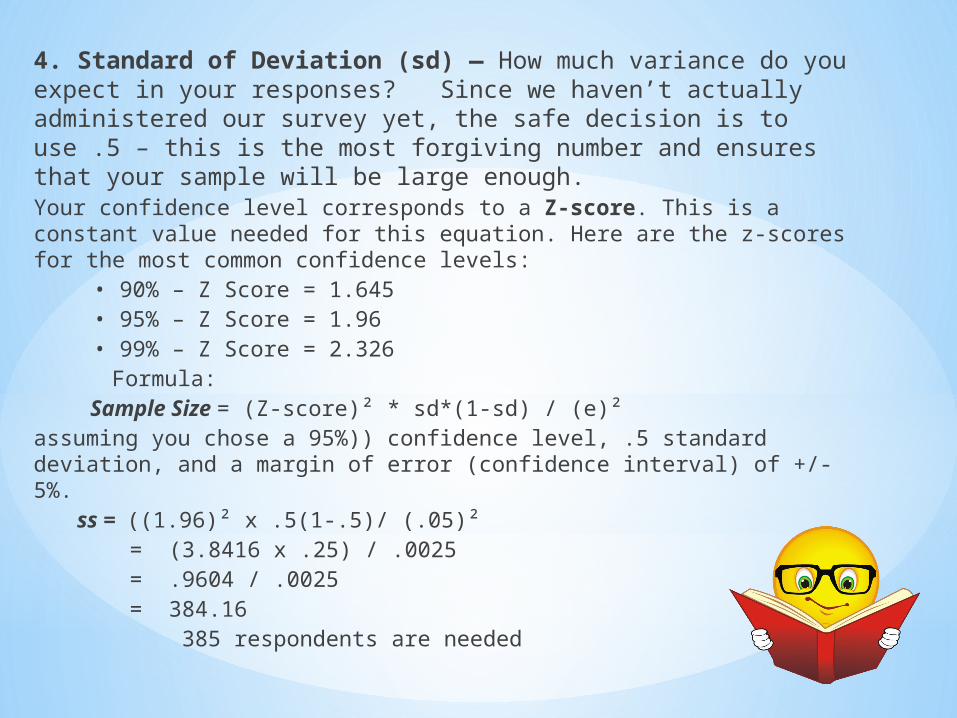
4. Standard of Deviation (sd) — How much variance do you expect in your responses? Since we haven’t actually administered our survey yet, the safe decision is to use .5 – this is the most forgiving number and ensures that your sample will be large enough.Your confidence level corresponds to a Z-score. This is a constant value needed for this equation. Here are the z-scores for the most common confidence levels:
• 90% – Z Score = 1.645• 95% – Z Score = 1.96• 99% – Z Score = 2.326
Formula: Sample Size = (Z-score)² * sd*(1-sd) / (e)²
assuming you chose a 95%)) confidence level, .5 standard deviation, and a margin of error (confidence interval) of +/- 5%.
ss = ((1.96)² x .5(1-.5)/ (.05)² = (3.8416 x .25) / .0025 = .9604 / .0025 = 384.16 385 respondents are needed
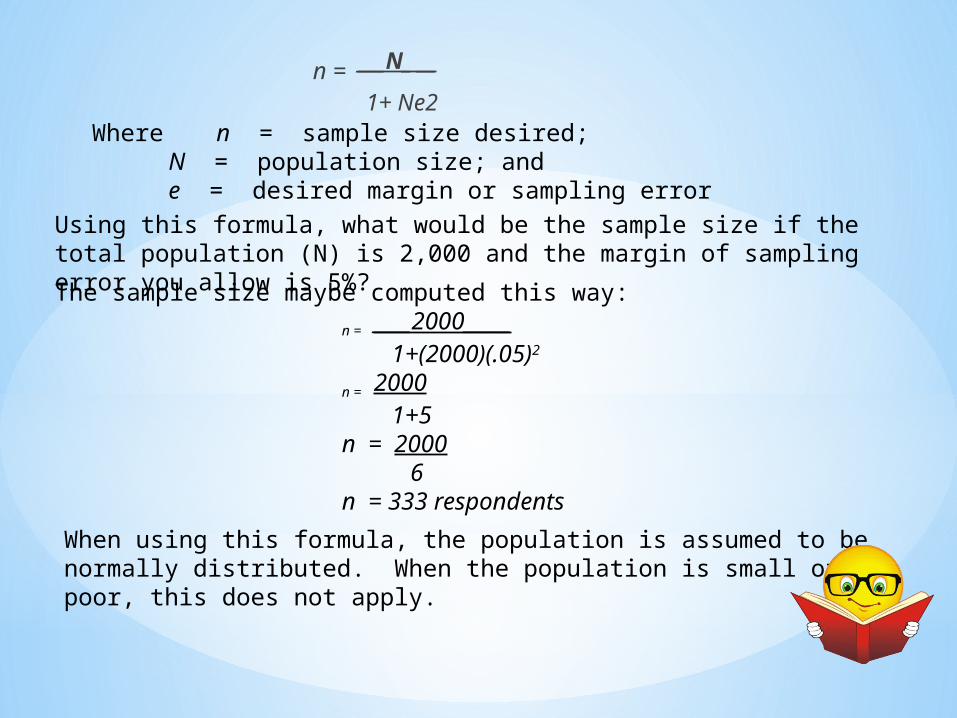
n = ___N_ __ 1+ Ne2
Where n = sample size desired; N = population size; and e = desired margin or sampling error
Using this formula, what would be the sample size if the total population (N) is 2,000 and the margin of sampling error you allow is 5%?The sample size maybe computed this way:
n = ____2000_____ 1+(2000)(.05)2
n = 2000 1+5
n = 2000 6
n = 333 respondentsWhen using this formula, the population is assumed to be normally distributed. When the population is small or poor, this does not apply.
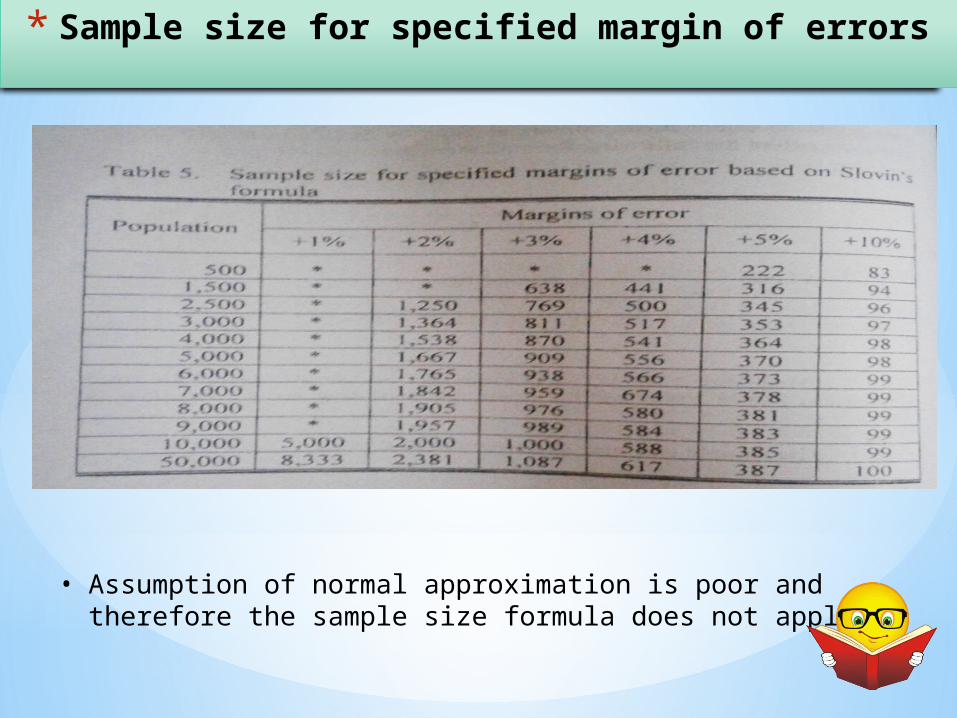
* Sample size for specified margin of errors
• Assumption of normal approximation is poor and therefore the sample size formula does not apply.