Non Performing Assets (NPA) and its impact on Equity Share Price of the Bank
21
1 NPAs and its impact on Equity Share Price of the Bank Authors: Saurabh Maheshwari Dr. Alok Mohan Sherry
-
Upload
saurabh-maheshwari -
Category
Documents
-
view
126 -
download
0
Transcript of Non Performing Assets (NPA) and its impact on Equity Share Price of the Bank

1
NPAs and its impact on Equity Share Price of the Bank
Authors:
Saurabh Maheshwari
Dr. Alok Mohan Sherry
2
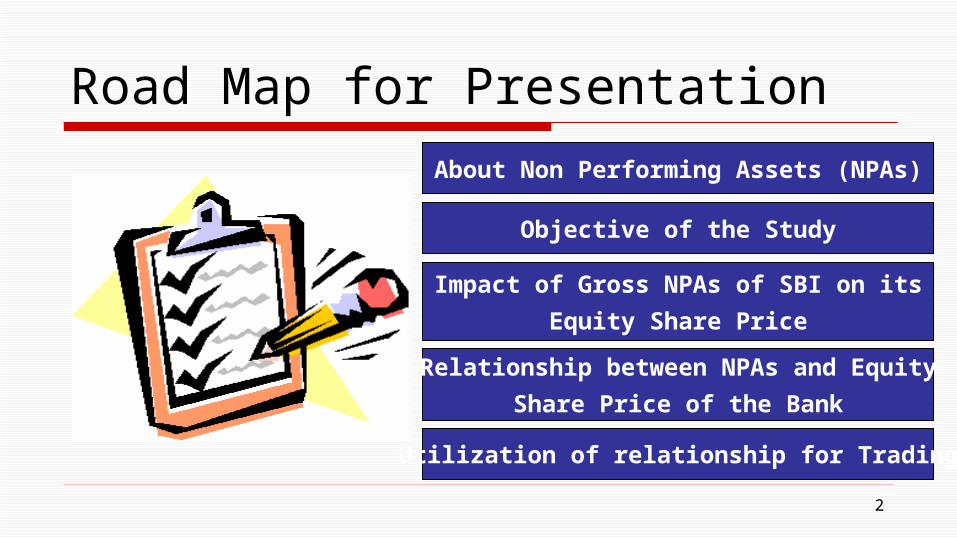
Road Map for Presentation
About Non Performing Assets (NPAs)
Objective of the Study
Utilization of relationship for Trading
Impact of Gross NPAs of SBI on its
Equity Share Price
Relationship between NPAs and Equity
Share Price of the Bank

3
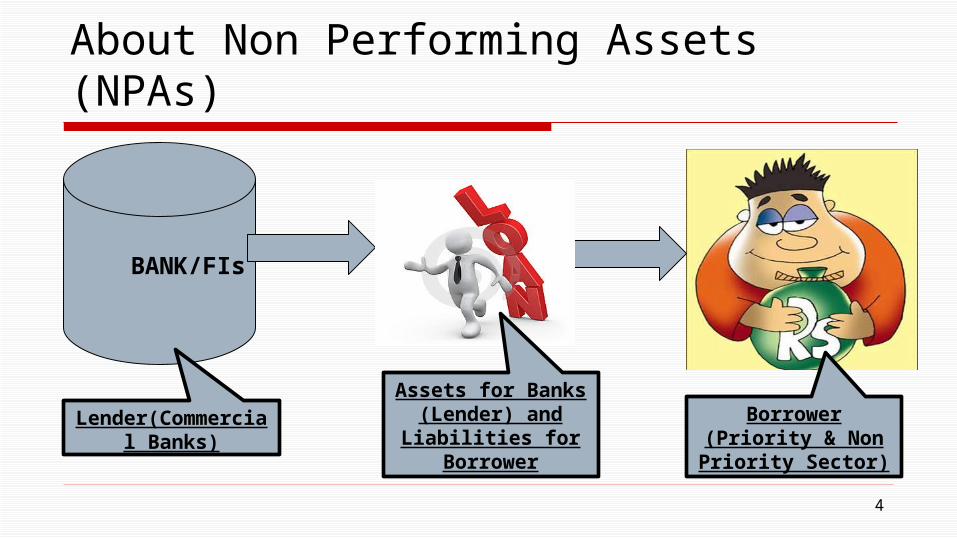
What is Non Performing Assets (NPAs)
4
About Non Performing Assets (NPAs)
BANK/FIs
Lender(Commercial Banks)
Borrower (Priority & Non Priority Sector)
Assets for Banks (Lender) and Liabilities for
Borrower
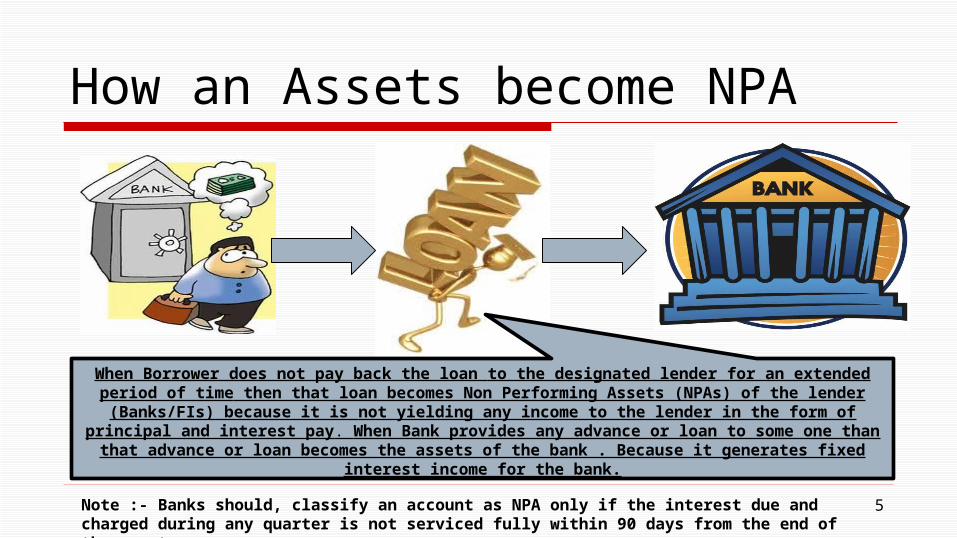
How an Assets become NPA
5
When Borrower does not pay back the loan to the designated lender for an extended period of time then that loan becomes Non Performing Assets (NPAs) of the lender
(Banks/FIs) because it is not yielding any income to the lender in the form of principal and interest pay. When Bank provides any advance or loan to some one than that
advance or loan becomes the assets of the bank . Because it generates fixed interest income for the bank.
Note :- Banks should, classify an account as NPA only if the interest due and charged during any quarter is not serviced fully within 90 days from the end of the quarter.
How an Assets become NPA……
6
An Asset or Loan or advance of the Bank given to borrower becomes Non Performing Asset where :-
Interest and/ or instalment of principal remain overdue for a period of more than 90 days in respect of a term loan
The account remains ‘out of order’ as indicated An account should be treated as 'out of order' if the outstanding balance remains continuously in excess of ththe e sanctioned limit/drawing power. In cases where the outstanding balance in principal operating account is less than the sanctioned limit/drawing power, but there are no credits continuously for 90 days as on the date of Balance Sheet or credits are not enough to cover the interest debited during the same period, these accounts should be treated as 'out of order’, in respect of an Overdraft/Cash Credit (OD/CC)
The bill remains overdue for a period of more than 90 days in the case of bills purchased and discounted
The instalment of principal or interest thereon remains overdue for two crop seasons for short duration crops
As per the Master Circular No. RBI/2011 – 12/66 DBOD.NO.BP.BC. 12 /21.04.048/2011 – 12 on Master Circular - Prudential norms on Income Recognition, Asset Classification and Provisioning pertaining to Advances issued by Reserve bank of India
How an Assets become NPA………..
7
The instalment of principal or interest thereon remains overdue for one crop season for long duration crops
The amount of liquidity facility remains outstanding for more than 90 days, in respect of a securitisation transaction undertaken in terms of guidelines on securitisation dated February 1, 2006
In respect of derivative transactions, the overdue receivables representing positive mark-to-market value of a derivative contract, if these remain unpaid for a period of 90 days from the specified due date for payment.
Note :- Banks should, classify an account as NPA only if the interest due and charged during any quarter is not serviced fully within 90 days from the end of the quarter.
Objective of the Study To Study the impact of NPAs on Equity
Share Price of the Bank Find the relationship between NPAs and
Equity Share Price of the Bank How this relationship may be utilized for
Trading Opportunities in the Capital Market
8
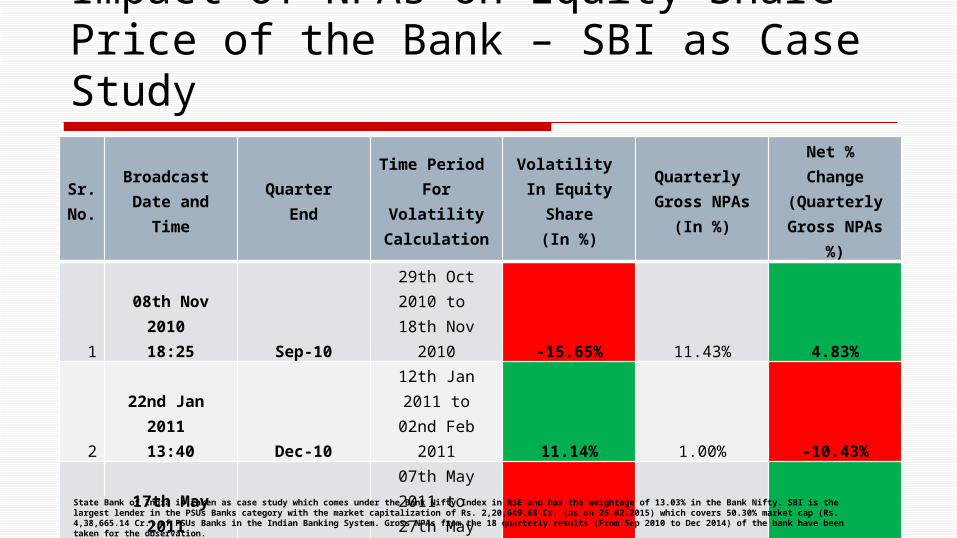
Impact of NPAs on Equity Share Price of the Bank – SBI as Case Study
9
Sr.No.
Broadcast Date and Time
Quarter End
Time Period For Volatility Calculation
Volatility In Equity Share
(In %)
Quarterly Gross NPAs
(In %)
Net % Change (Quarterly Gross
NPAs %)
108th Nov 2010
18:25 Sep-1029th Oct 2010 to
18th Nov 2010 -15.65% 11.43% 4.83%
2
22nd Jan 2011 13:40 Dec-10
12th Jan 2011 to02nd Feb 2011 11.14% 1.00% -10.43%
317th May 2011
13:08 Mar-1107th May 2011 to
27th May 2011 -19.48% 8.06% 7.06%
413th Aug 2011
13:51 Jun-1103rd Aug 2011 to
23rd Aug 2011 -13.12% 9.64% 1.58%
State Bank of India is taken as case study which comes under the Bank Nifty Index in NSE and has the weightage of 13.03% in the Bank Nifty. SBI is the largest lender in the PSUs Banks category with the market capitalization of Rs. 2,20,649.68 Cr. (as on 25.02.2015) which covers 50.30% market cap (Rs. 4,38,665.14 Cr.) of PSUs Banks in the Indian Banking System. Gross NPAs from the 18 quarterly results (From Sep 2010 to Dec 2014) of the bank have been taken for the observation.
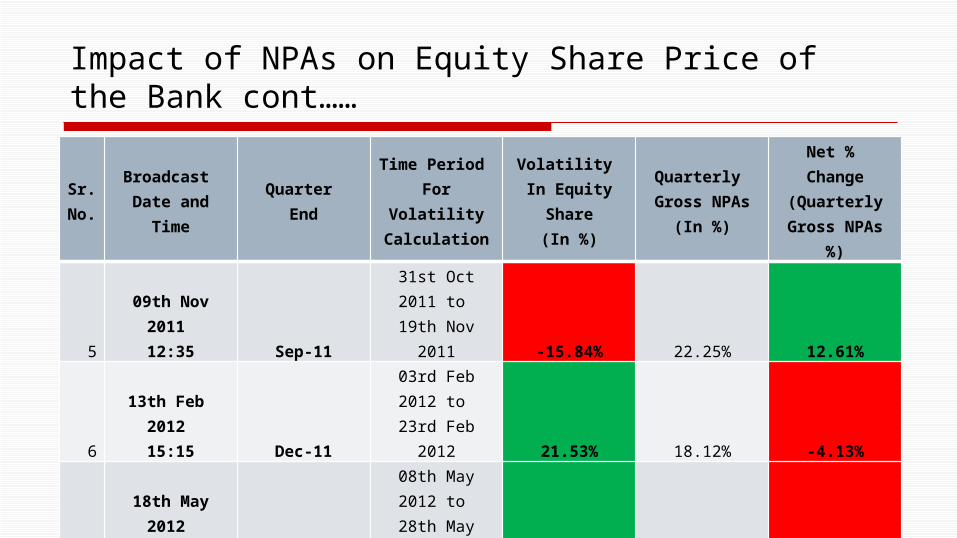
Impact of NPAs on Equity Share Price of the Bank cont……
10
Sr.No.
Broadcast Date and Time
Quarter End
Time Period For Volatility Calculation
Volatility In Equity Share
(In %)
Quarterly Gross NPAs
(In %)
Net % Change (Quarterly Gross
NPAs %)
509th Nov 2011
12:35 Sep-1131st Oct 2011 to 19th Nov 2011 -15.84% 22.25% 12.61%
6
13th Feb 2012 15:15 Dec-11
03rd Feb 2012 to 23rd Feb 2012 21.53% 18.12% -4.13%
718th May 2012
13:11 Mar-1208th May 2012 to
28th May 2012 16.91% -1.05% -19.17%
810th Aug 2012
18:54 Jun-1231st July 2012 to
20th Aug 2012 -11.03% 18.85% 19.90%
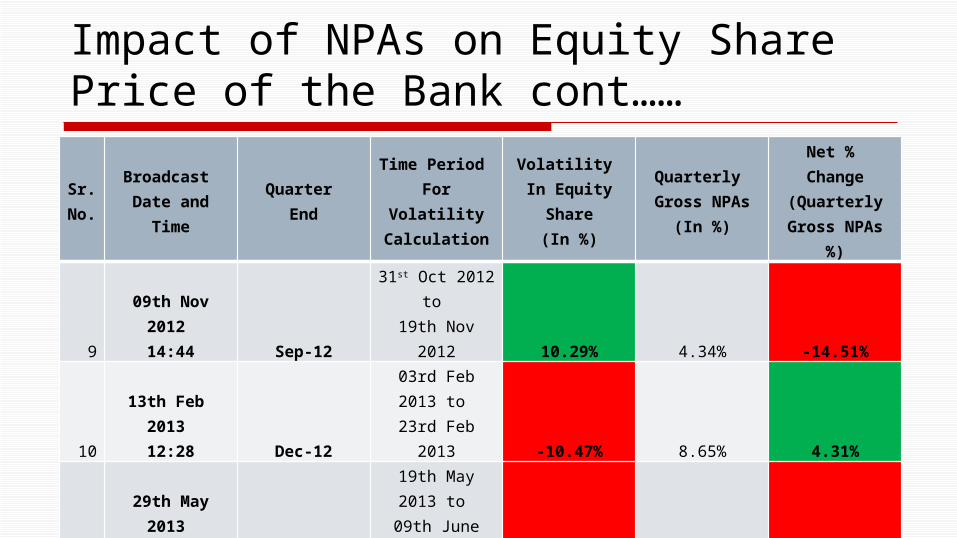
Impact of NPAs on Equity Share Price of the Bank cont……
11
Sr.No.
Broadcast Date and Time
Quarter End
Time Period For Volatility Calculation
Volatility In Equity Share
(In %)
Quarterly Gross NPAs
(In %)
Net % Change (Quarterly Gross
NPAs %)
909th Nov 2012
14:44 Sep-1231st Oct 2012 to 19th Nov 2012 10.29% 4.34% -14.51%
10
13th Feb 2013 12:28 Dec-12
03rd Feb 2013 to 23rd Feb 2013 -10.47% 8.65% 4.31%
1129th May 2013
11:25 Mar-1319th May 2013 to
09th June 2013 -18.83% 4.24% -4.41%
1216th Aug 2013
15:53 Jun-1306th Aug 2013 to
26th Aug 2013 -13.90% 18.95% 14.71%
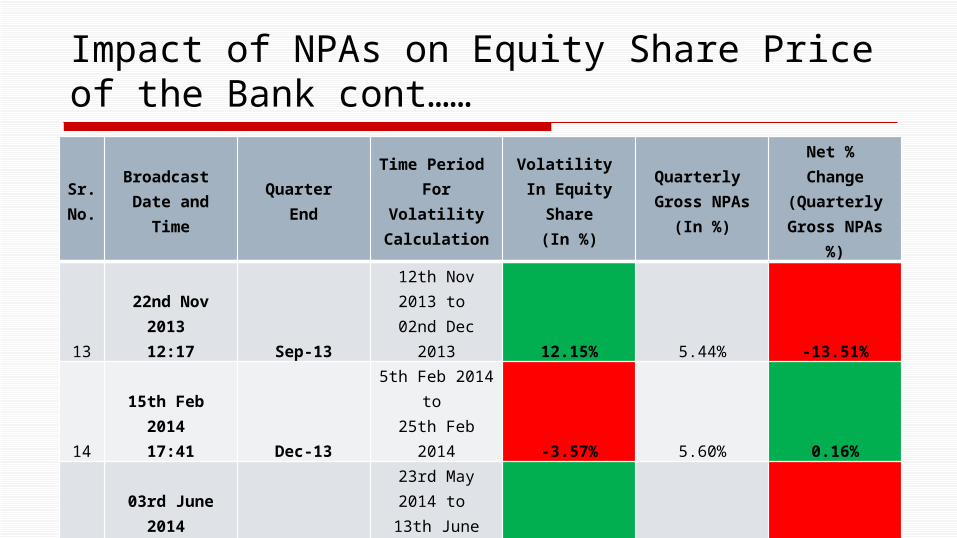
Impact of NPAs on Equity Share Price of the Bank cont……
12
Sr.No.
Broadcast Date and Time
Quarter End
Time Period For Volatility Calculation
Volatility In Equity Share
(In %)
Quarterly Gross NPAs
(In %)
Net % Change (Quarterly Gross
NPAs %)
1322nd Nov 2013
12:17 Sep-1312th Nov 2013 to
02nd Dec 2013 12.15% 5.44% -13.51%
14
15th Feb 2014 17:41 Dec-13
5th Feb 2014 to 25th Feb 2014 -3.57% 5.60% 0.16%
1503rd June 2014
13:57 Mar-14
23rd May 2014 to
13th June 2014 10.47% -9.14% -14.74%
1611th Aug 2014
16:01 Jun-1401st Aug 2014 to
21st Aug 2014 -5.43% -1.90% 7.24%
Impact of NPAs on Equity Share Price of the Bank cont……
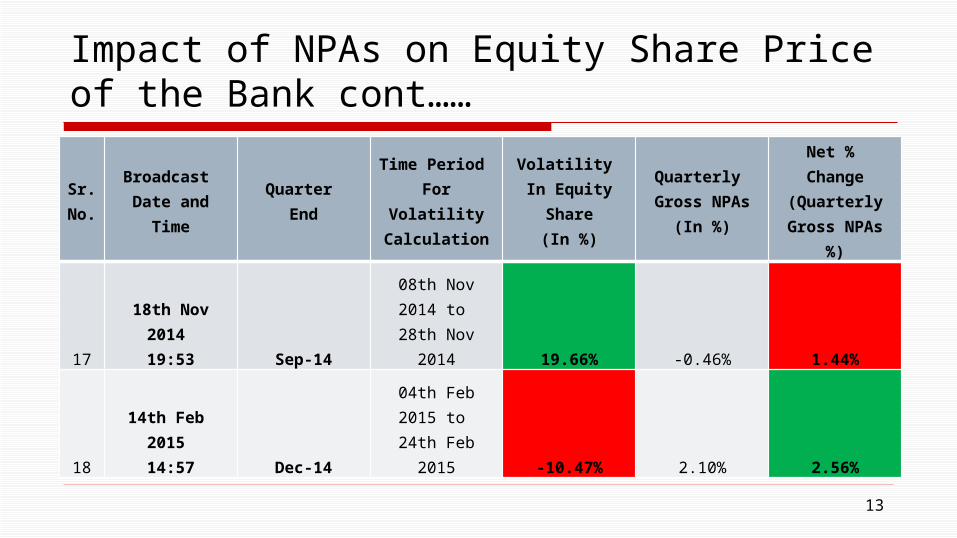
13
Sr.No.
Broadcast Date and Time
Quarter End
Time Period For Volatility Calculation
Volatility In Equity Share
(In %)
Quarterly Gross NPAs
(In %)
Net % Change (Quarterly Gross
NPAs %)
1718th Nov 2014
19:53 Sep-1408th Nov 2014 to
28th Nov 2014 19.66% -0.46% 1.44%
18
14th Feb 2015 14:57 Dec-14
04th Feb 2015 to 24th Feb 2015 -10.47% 2.10% 2.56%
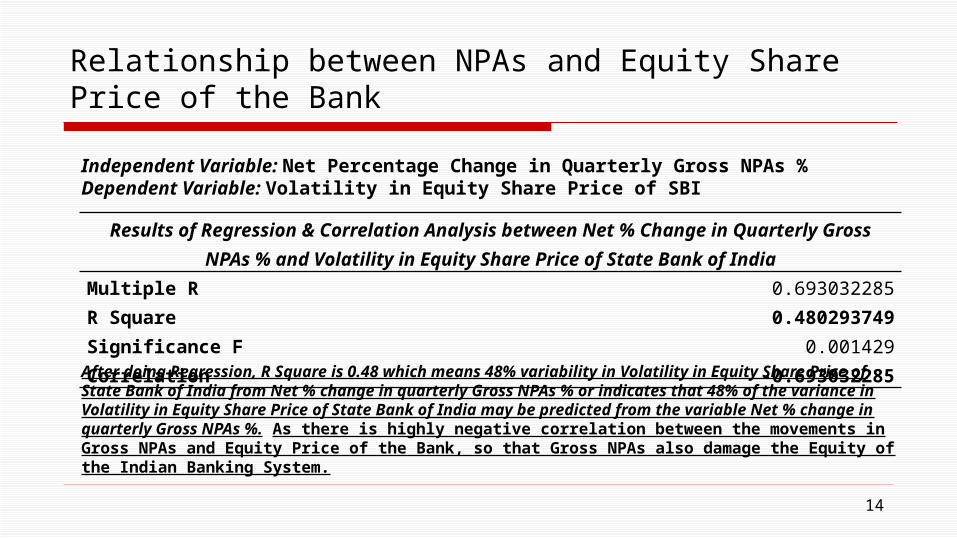
Relationship between NPAs and Equity Share Price of the Bank
14
Results of Regression & Correlation Analysis between Net % Change in Quarterly Gross NPAs % and Volatility in Equity Share Price of State Bank of India
Multiple R 0.693032285R Square 0.480293749Significance F 0.001429Correlation -0.693032285
After doing Regression, R Square is 0.48 which means 48% variability in Volatility in Equity Share Price of State Bank of India from Net % change in quarterly Gross NPAs % or indicates that 48% of the variance in Volatility in Equity Share Price of State Bank of India may be predicted from the variable Net % change in quarterly Gross NPAs %. As there is highly negative correlation between the movements in Gross NPAs and Equity Price of the Bank, so that Gross NPAs also damage the Equity of the Indian Banking System.
Independent Variable: Net Percentage Change in Quarterly Gross NPAs %Dependent Variable: Volatility in Equity Share Price of SBI
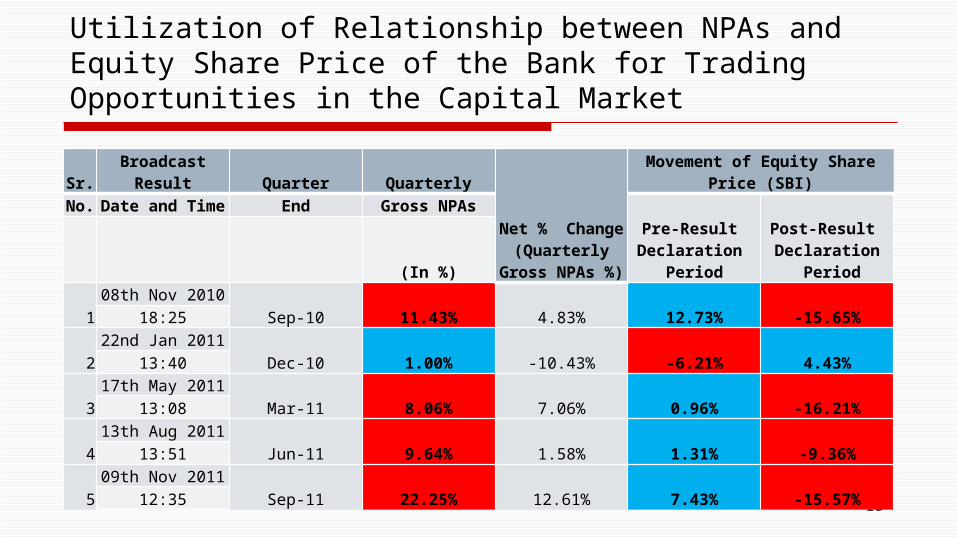
Utilization of Relationship between NPAs and Equity Share Price of the Bank for Trading Opportunities in the Capital Market
15
Sr. Broadcast Result Quarter Quarterly
Net % Change (Quarterly Gross
NPAs %)
Movement of Equity Share Price (SBI)
No. Date and Time End Gross NPAsPre-Result Declaration
Period
Post-Result Declaration
Period (In %)
1
08th Nov 2010
Sep-10 11.43% 4.83% 12.73% -15.65%18:25
2
22nd Jan 2011
Dec-10 1.00% -10.43% -6.21% 4.43%13:40
3
17th May 2011
Mar-11 8.06% 7.06% 0.96% -16.21%13:08
4
13th Aug 2011
Jun-11 9.64% 1.58% 1.31% -9.36%13:51
5
09th Nov 2011
Sep-11 22.25% 12.61% 7.43% -15.57%12:35
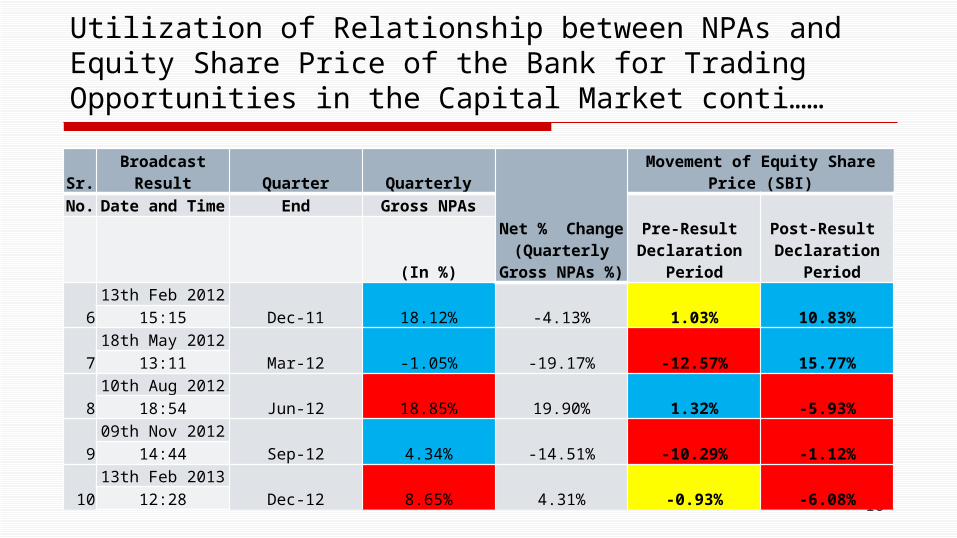
Utilization of Relationship between NPAs and Equity Share Price of the Bank for Trading Opportunities in the Capital Market conti……
16
Sr. Broadcast Result Quarter Quarterly
Net % Change (Quarterly Gross
NPAs %)
Movement of Equity Share Price (SBI)
No. Date and Time End Gross NPAsPre-Result Declaration
Period
Post-Result Declaration
Period (In %)
6
13th Feb 2012
Dec-11 18.12% -4.13% 1.03% 10.83%15:15
7
18th May 2012
Mar-12 -1.05% -19.17% -12.57% 15.77%13:11
8
10th Aug 2012
Jun-12 18.85% 19.90% 1.32% -5.93%18:54
9
09th Nov 2012
Sep-12 4.34% -14.51% -10.29% -1.12%14:44
10
13th Feb 2013
Dec-12 8.65% 4.31% -0.93% -6.08%12:28
Utilization of Relationship between NPAs and Equity Share Price of the Bank for Trading Opportunities in the Capital Market conti……
17
Sr. Broadcast Result Quarter Quarterly
Net % Change (Quarterly Gross
NPAs %)
Movement of Equity Share Price (SBI)
No. Date and Time End Gross NPAsPre-Result Declaration
Period
Post-Result Declaration
Period (In %)
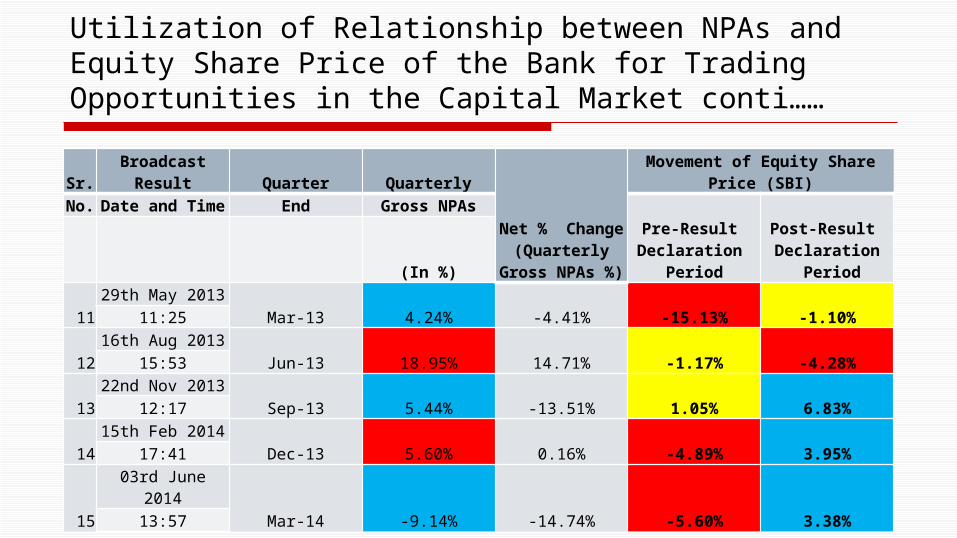
11
29th May 2013
Mar-13 4.24% -4.41% -15.13% -1.10%11:25
12
16th Aug 2013
Jun-13 18.95% 14.71% -1.17% -4.28%15:53
13
22nd Nov 2013
Sep-13 5.44% -13.51% 1.05% 6.83%12:17
14
15th Feb 2014
Dec-13 5.60% 0.16% -4.89% 3.95%17:41
15
03rd June 2014
Mar-14 -9.14% -14.74% -5.60% 3.38%13:57
Utilization of Relationship between NPAs and Equity Share Price of the Bank for Trading Opportunities in the Capital Market conti……
18
Sr. Broadcast Result Quarter Quarterly
Net % Change (Quarterly Gross
NPAs %)
Movement of Equity Share Price (SBI)
No. Date and Time End Gross NPAsPre-Result Declaration
Period
Post-Result Declaration
Period (In %)
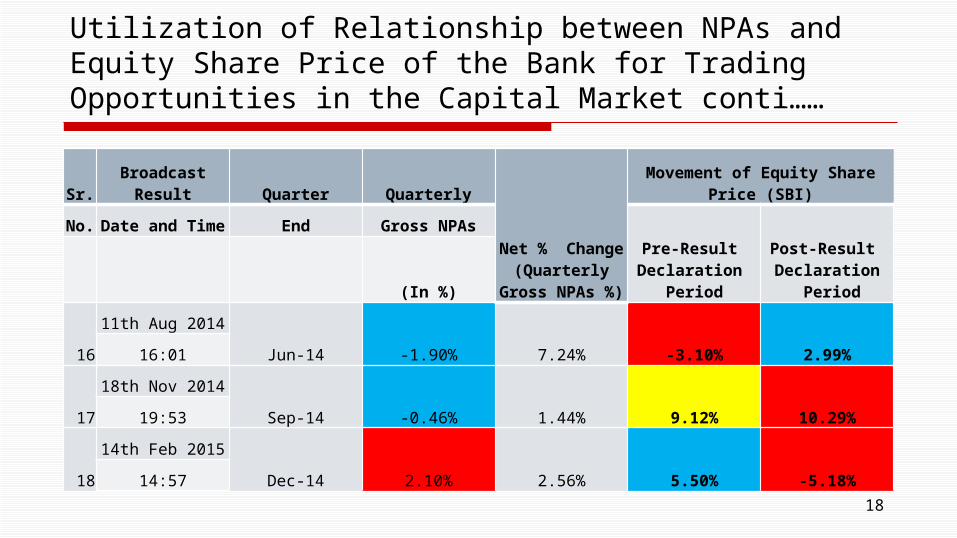
16
11th Aug 2014
Jun-14 -1.90% 7.24% -3.10% 2.99%16:01
17
18th Nov 2014
Sep-14 -0.46% 1.44% 9.12% 10.29%19:53
18
14th Feb 2015
Dec-14 2.10% 2.56% 5.50% -5.18%14:57
Observations
19Source :- http://dbie.rbi.org.in/DBIE/dbie.rbi?site=home
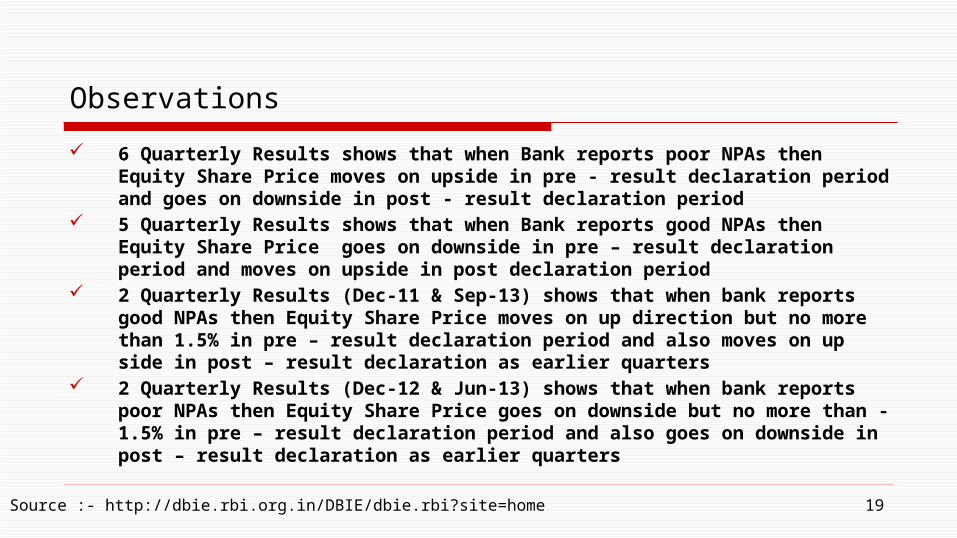
6 Quarterly Results shows that when Bank reports poor NPAs then Equity Share Price moves on upside in pre - result declaration period and goes on downside in post - result declaration period
5 Quarterly Results shows that when Bank reports good NPAs then Equity Share Price goes on downside in pre – result declaration period and moves on upside in post declaration period
2 Quarterly Results (Dec-11 & Sep-13) shows that when bank reports good NPAs then Equity Share Price moves on up direction but no more than 1.5% in pre – result declaration period and also moves on up side in post – result declaration as earlier quarters
2 Quarterly Results (Dec-12 & Jun-13) shows that when bank reports poor NPAs then Equity Share Price goes on downside but no more than -1.5% in pre – result declaration period and also goes on downside in post – result declaration as earlier quarters
Observations Conti……
20
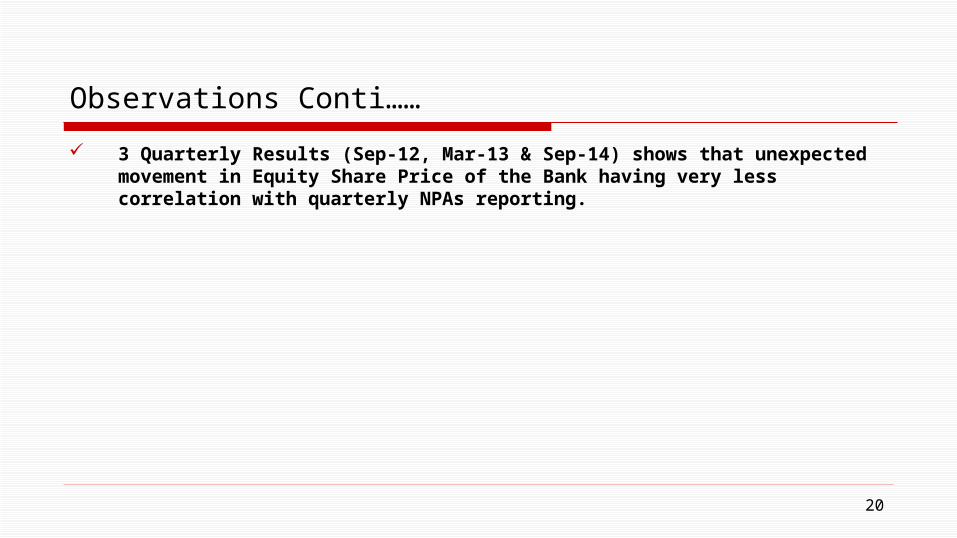
3 Quarterly Results (Sep-12, Mar-13 & Sep-14) shows that unexpected movement in Equity Share Price of the Bank having very less correlation with quarterly NPAs reporting.
21
Thanks
Saurabh MaheshwariDr. Alok Mohan Sherry