IRJET-Application of Geodesic Active Contours in iris Segmentation

www.elsevier.com/locate/media
Medical Image Analysis 11 (2007) 224–241
Non-parametric geodesic active regions: Method and evaluationfor cerebral aneurysms segmentation in 3DRA and CTA
Monica Hernandez a,*, Alejandro F. Frangi b,*
a Aragon Institute of Engineering Research (I3A), University of Zaragoza, Zaragoza, Spainb Computational Imaging Lab, Department of Technology, Pompeu Fabra University, Barcelona, Spain
Received 28 February 2006; received in revised form 21 December 2006; accepted 15 January 2007Available online 25 February 2007
Abstract
Segmentation of vascular structures is a difficult and challenging task. In this article, we present an algorithm devised for the segmen-tation of such structures. Our technique consists in a geometric deformable model with associated energy functional that incorporateshigh-order multiscale features in a non-parametric statistical framework. Although the proposed segmentation method is generic, it hasbeen applied to the segmentation of cerebral aneurysms in 3DRA and CTA. An evaluation study over 10 clinical datasets indicate thatthe segmentations obtained by our method present a high overlap index with respect to the ground-truth (91.13% and 73.31%, respec-tively) and that the mean error distance from the surface to the ground truth is close to the in-plane resolution (0.40 and 0.38 mm, respec-tively). Besides, our technique favorably compares to other alternative techniques based on deformable models, namely parametricgeodesic active regions and active contours without edges.� 2007 Elsevier B.V. All rights reserved.
Keywords: Cerebral aneurysm; Geodesic active regions; Differential invariants; Non-parametric probability estimation; Model selection; Evaluation
1. Introduction
A cerebral aneurysm is an abnormal enlargement of anyartery located in the brain. This pathology tends to appearat or near bifurcations of the arteries in the Circle of Willis,with more frequency at the anterior communicant (ACoA),posterior communicant (PCoA), middle cerebral (MCA),internal carotid (ICA), and basilar arteries (shown inFig. 1). The prevalence of unruptured cerebral aneurysmsis unknown, but prospective studies estimate it to be ashigh as the 6% of the population (Winn et al., 2002; Ward-law and White, 2000; Wiebers, 2003). Rupture, usuallyaccompanied with subarachnoid aneurismal hemorrhage(SAH), is the most serious complication. These events havean incidence of sudden death of 12.4% and rates of fatalityfrom 32% to 67% after the hemorrhage (Huang and van
1361-8415/$ - see front matter � 2007 Elsevier B.V. All rights reserved.
doi:10.1016/j.media.2007.01.002
* Corresponding authors. Tel./fax: +34 93 5421451.E-mail addresses: [email protected] (M. Hernandez), alejandro.frangi@
upf.ed (A.F. Frangi).
Gelder, 2002; Hop et al., 1997). Morbidity rates reach the10.9% due to intra cranial bruise, subsequent recurrentbleeding, stroke, hydrocephaly and vessel spasm (Raay-makers et al., 1998).
Patient specific 3D models of the aneurysm and the sur-rounding vascular tree have a significant role in interven-tional planning. For instance, the availability of suchmodels for morphological analysis or computational fluiddynamics (CFD) simulations enable the development ofshape indexes and hemodynamic parameters that betterserve to plan minimally invasive surgical procedures or topredict the risk of rupture (Ma et al., 2004; Raghavanet al., 2005; Rohde et al., 2005; Boissonnat et al., 2005;Cebral et al., 2005).
The purpose of this article is to present an automaticmethod for segmentation of cerebrovascular structureswith application to the segmentation of brain aneurysmsin 3D Rotational Angiography (3DRA) and ComputedTomography Angiography (CTA). Segmentation in3DRA is a difficult task due to noise, inhomogeneous

Fig. 1. The arteries of the Circle of Willis. Left, image of maximum intensity projection (MIP) from a magnetic resonance angiography (MRA) scan.Right, 3D model indicating the arteries of the Circle of Willis: anterior cerebral arteries (ACA) and segments (A1 and A2) connected by the anteriorcommunicant artery (ACoA), middle cerebral arteries (MCA), posterior communicant arteries (PCoA) connecting the internal carotid arteries (ICA) andthe basilar artery (BA), and vertebral arteries (VA). The images are courtesy of J.R. Cebral, George Mason University.
M. Hernandez, A.F. Frangi / Medical Image Analysis 11 (2007) 224–241 225
image gradient, and the presence of vessels of a wide rangeof sizes. In datasets acquired under low contrast dose,strong image artifacts appear close to the arteries andbones are visible within the same range of intensities thanvessels. Fig. 2 shows some examples of 3DRA images inthese situations. Segmentation in CTA is even more chal-lenging because of the presence of bone tissue in the imagewith intensity values that highly overlap with vessel tissues.As shown in Fig. 3, these images present high partial vol-ume artefacts specially in locations where the vessel is closeto or touching other vessels, the aneurysm, or the skull. Inthese locations, it is difficult or even impossible to visuallydistinguish among vessel background or bone tissues, spe-
Fig. 2. Examples of 3DRA images. (a) maximum intensity projection (MIP) oof an image acquired under standard protocol. (c) Slice of an image acquireacquired under low contrast dose showing bone tissue.
Fig. 3. Examples of CTA images. (a) maximum intensity projection (MIP) of ashowing a vessel located next to the aneurysm dome. (c) Slice showing a cereTurkish saddle next to the internal carotid arteries (ICA).
cially, in the location of the sphenoid bone that surroundsthe carotid grooves next to the Turkish saddle.
The method is based on a geometric deformable modelthat couples information from the image gradient and sta-tistics of the regions present in the image (Paragios, 2000).The novelty stems in the use of high-order differentialimage descriptors in a multiscale framework for non-para-metric estimation of regional descriptors for the main tissuetypes present in angiographic images. The probabilitiesassociated with each region are estimated using adaptiveParzen windows computed and k-nearest neighbors(kNN) pdf estimation. The non-parametric model is fittedto the specific application using cross-validation and
f a cerebral aneurysm located at the internal carotid artery (ICA). (b) Sliced under low contrast dose showing vessel artifacts. (d) Slice of an image
cerebral aneurysm located at the middle cerebral artery (MCA). (b) Slicebral aneurysm located next to bone tissue. (d) Slice showing part of the

226 M. Hernandez, A.F. Frangi / Medical Image Analysis 11 (2007) 224–241
feature selection techniques to achieve the best estimationfor each of the tissue classes. The method has been evalu-ated against manual segmentations and some of the tech-niques that are most related to our work.
The article is organized as follows: Section 2 surveys thestate-of-the-art most related to our work. Generalities ofthe proposed segmentation method are introduced in Sec-tion 3. Section 4 presents the details of the non-parametricmodel selection. The evaluation study is reported and dis-cussed in Section 5 and some concluding remarks are madein Section 6.
2. Related work
2.1. Statistical thresholding
Some of the recent approaches for 3D vascular segmen-tation are based on statistical thresholding. These tech-niques approximate the distribution of probabilities ofthe intensity values in the image by finite mixture models(FMM) estimated from the expectation maximization algo-rithm. The FMM allows obtaining a segmentation bymeans of an automatic global thresholding. These methodshave been applied to the segmentation of the cerebral vas-cular tree and cerebral aneurysms in time of flight (TOF)and phase contrast (PC) magnetic resonance angiography(MRA) (Wilson and Noble, 1999; Chung et al., 2004),and in 3D rotational angiography (3DRA) (Gan et al.,2005).
2.2. Deformable models
Most of the recent approaches for 3D vascular segmen-tation are based on deformable models. The model is rep-resented by a surface that deforms for recovering theshape of the vascular structure. Depending on the repre-sentation of the model, these approaches can be dividedinto parametric and geometric deformable models. Para-metric deformable models assume a predefined surfaceparameterization with fixed topology. In vascular analy-sis, cylindrical or line-like shapes parameterized by thevasculature centerlines are frequently used (Frangi et al.,1999; Krissian et al., 2000; Yim et al., 2001; de Bruijneet al., 2003; Aylward and Bullitt, 2002; Wink et al.,2004; Fridman et al., 2004; Volkau et al., 2005). In manycases, these models are not able to extract a complex arte-rial tree without substantial user interaction. Moreover,the tubular constraint usually prevents the model fromrepresenting pathological shapes as stenosis or largeaneurysms.
The use of geometric deformable models within the levelset framework (Osher and Sethian, 1988) has become verypopular in recent years. Their ability to handle changes oftopology and adapt to the shape of complex structuresmakes them a very suitable technique for the automaticsegmentation of complex vascular structures and, moreconcretely, of cerebral aneurysms.
In geometric deformable models solely based on gradi-ent information (Geodesic Active Contours, Caselleset al., 1997), the evolution of the deformable surfacestrongly depends on the image quality. Due to limited res-olution or artefacts present in medical imagery, the gradi-ent usually presents discontinuities at the boundaries andinside narrow locations of the objects. The evolving surfacesuffers from leakage in such places. Moreover, the curva-ture and edge constraints prevent the surface to evolvethrough narrow and twisted vessels. To deal with these lim-itations, some improvements to this model have been pro-posed in the literature for the segmentation of vascularstructures in MRA, 3DRA and CTA, that consist of smartinitializations of the model (Deschamps, 2001; Antigaet al., 2003; van Bemmel et al., 2003; Hernandez andFrangi, 2004), modifications in the energy functional (Lor-igo et al., 2000; Deschamps, 2001; Hernandez and Frangi,2004; Yan and Kassim, 2006; Manniesing et al., 2006; Hol-tzman-Gazit et al., 2006), or hybrid approaches (Chen andAmini, 2004).
2.3. Region-based geometric deformable models
Since the method of region competition proposed byZhu and Yuille (1996), there have been several works thatinclude statistical region-based information in the geomet-ric deformable model (Paragios, 2000; Yezzi et al., 1999;Chan and Vese, 2001; Aubert et al., 2003; Rousson et al.,2003; Pichon et al., 2004). In these different versions of geo-desic active regions (GAR), the surface is deformed accord-ing to an evolution equation that minimizes an energyfunctional depending not only on the gradient but alsoon region-based statistical information. In places withweak gradients, region-based information drives the evolu-tion of the surface thus avoiding non-desirable effects ofgradient-driven evolution. Some of these versions evencompletely drop gradient information. Thus, the segmenta-tion accuracy fully relies on region-based information(Chan and Vese, 2001; Rousson et al., 2003; Pichonet al., 2004).
The GAR model includes region-based statistical infor-mation defined in terms of the probability associated with aregion R. In the case of medical images, each region isassumed to be in correspondence with a tissue. The estima-tion of the probabilities for each tissue involves the defini-tion of the feature space that characterizes the image insidethe different tissues. In most previous attempts, the estima-tion of the probabilities is based on two main assumptions:image intensity is the most discriminant tissue descriptorand the statistics of the intensity distribution can bedescribed using parametric estimators. In particular, theprobabilities are usually modeled with a finite mixturemodel (Zhu and Yuille, 1996; Paragios, 2000) or even sim-pler assumptions (Yezzi et al., 1999; Chan and Vese, 2001;Aubert et al., 2003).
However, we believe that the use of high-order differentialimage information coupled with non-parametric estimators,
M. Hernandez, A.F. Frangi / Medical Image Analysis 11 (2007) 224–241 227
provide a richer description of the different tissues in med-ical imagery and, therefore, constitute a more genericframework for segmentation. Related ideas were intro-duced by van Ginneken et al. in the context of segmenta-tion with landmark-based statistical shape models andapplied to the segmentation of aortic aneurysms in CTA(van Ginneken et al., 2002; de Bruijne et al., 2003). In theseworks, a gray level appearance model at the boundaries ofthe objects is constructed based on the first-order multi-scale local jet of the image and the active shape model(ASM) is fitted using a k-nearest neighbors (kNN) classi-fier. Ordas et al. further extended this ASM technique toincorporate differential invariants with application to thesegmentation of cardiac MRI images (Ordas et al., 2003).None of these methods, however, were applied to 3Dimages or integrated into implicit deformable models.More related to our approach, Rousson et al. (2003)proposed an implicit deformable model for unsupervisedtexture segmentation that uses the structure tensor as tex-ture descriptor in an non-parametric framework. Pichonet al. (2004) proposed a statistical flow for generic imagesegmentation that considers the intensity and the gradientof the image as tissue descriptors and Parzen windows asnon-parametric estimator.
The present work introduces the idea of using a non-parametric model for the estimation of the probabilitiesassociated with each region in the Geodesic Active Regionsmodel. We are presenting the improved results of our pre-vious conference works (Hernandez et al., 2003; Hernandezand Frangi, 2004, 2005). This work differs from our previ-ous effort in the use of differential invariants for the defini-tion of the feature space and the presentation of a novelframework for the selection of the non-parametric model.We also include an evaluation on manually segmentedimages to analyze the performance of the proposed algo-rithm compared to other competing techniques.
3. Non-parametric geodesic active regions
In this section, we describe the proposed segmentationmethod. We begin by introducing the general GeodesicActive Regions model to finalize focusing on the detailsof the proposed non-parametric model for probabilityestimation.
3.1. Geodesic active region framework
Geometric deformable models unify parametric modelsfor curve and surface evolution and the level set method.These models borrow the idea from geodesic snakes (Kasset al., 1988) of evolving an initial curve or surface towardsa local minimum of an energy functional. Geodesic ActiveRegions (GAR), as introduced by Paragios (2000), incor-porates edge and statistical information into the energyfunctional.
Edge information is based on a function of the gradientthat is positive in homogeneous regions and zero at the
edges. This function helps the evolving interface stoppingat the boundaries of the regions. In our approach,
gðjrI jÞ ¼ 1
1þ jrrI j2ð1Þ
where $rI is the gradient of the image after convolutionwith a Gaussian of standard deviation r close to the in-plane resolution.
Statistical information is defined in terms of regiondescriptors, which are function of the probabilities associ-ated with each region. Thus, the descriptor of the innerregion is defined by
kinðxÞ ¼ � logðP inðxÞÞ ð2Þwhere Pin is the probability for a voxel x to belong to Xin.An analogous definition holds for the outer region.
In our approach, each region is assumed to be in corre-spondence with a single tissue. In our application, theimages usually present the inside tissue, that correspondsto the aneurysm and vessels, and one or two outside tissuesthat correspond to the background and bone. In the case ofimages with two regions, the probability of the inner regionis computed as P in ¼ P ðx 2 CvesselÞ and the probability out-side as P out ¼ Pðx 2 CbackÞ. In the case of images with threeregions, the probability outside is computed, under theassumption of independence, as P out ¼ P ðx 2 CbackÞþP ðx 2 CboneÞ.
In the definition of the energy functional, the region-based term depends on the partition of the image domain(X) provided at time t by the evolving interface. In the caseof a evolving surface S(t), the image domain X is dividedinto Xin(t) [ Xout(t) [ S(t) and the energy functional isdefined as
EðtÞ ¼ fZ
XinðtÞkinðxÞdxþ f
ZXoutðtÞ
koutðxÞdxþ gZ
SðtÞgðxÞda
ð3Þwhere da is the surface area element and, f and g controlthe contribution of the region-based and boundary infor-mation, respectively.
In order to compute the differential equation that drivesthe evolution of the surface, variational techniques areused. In our approach, region descriptors are time indepen-dent. Therefore, the gradient descent flow associated withthe minimization of E(t) is
oSðx; tÞot
¼ fðkout � kinÞN� gð�gKm þ hrg;NiÞN ð4Þ
where Km is the mean curvature of the evolving surface, �controls the contribution of the curvature to the evolution,and N is its outer unitary normal vector.
The level set method (Osher and Sethian, 1988) is usedto track the motion of the surface allowing topologicalchanges in the surface and avoiding numerical instabilities.Basically, the level set method consists in embedding theevolving surface in a manifold one dimension higher thanS implicitly represented by a function /. The surface S

228 M. Hernandez, A.F. Frangi / Medical Image Analysis 11 (2007) 224–241
can be reconstructed as the level set zero of /. If the man-ifold evolves following the equation:
/t þ fðkout � kinÞjr/j � gð�gKmjr/j þ rg � r/Þ ¼ 0 ð5Þthen the evolution of the level set zero of / is equivalent tothe evolution of S driven by Eq. (4).
Following this equation, the level sets associated with /evolve towards a local minimum of the energy functionaltrying to maximize the probability for the inner regioninside the zero level set and the probability for the outerregion outside having into account the gradient informa-tion at the boundaries also. The zero level set of the result-ing steady-state solution is a 3D model of thesegmentation.
3.2. Non-parametric description of tissue classes
For the estimation of the probabilities associated to theregion descriptors, we propose a non-parametric approach.The method, as any other supervised pattern recognitionmethod, involves the definition of a feature space that, inour application, describes the local structure of the imageinside the different tissues, and the selection of a non-para-metric technique for the estimation of the distribution ofthe different patterns of the local structure. The featurespace is defined from the set of differential invariants thatapproximates the local structure of the image up to sec-ond-order in a multiscale framework. Parzen windows isthe selected non-parametric estimation technique. Thus,our method takes into account not only the intensity distri-bution but also approximates to a higher degree the localstructure of the image. Moreover, the non-parametric tech-nique does not make any assumption about the distribu-tion of the local patterns that are learned directly fromthe image.
3.2.1. The image feature spaceDepending on the representation of the local structure
of the image, different feature spaces can be defined forprobability estimation. The differential invariants (Romenyet al., 1992) constitute a complete and irreducible set of dif-ferential operators appropriate for the description of thelocal image structure up to any desired order. As any otheralgebraic invariant can be reduced to a combination of ele-ments in this minimal set, local image properties can berepresented in terms of such invariants. Besides, the setof differential invariants provides a description of theimage geometrical structure independent to rigid transfor-mations. These properties make the differential invariantoperator set a good candidate for feature space in patternrecognition tasks. As a distinctive element with respect toour previous works, we propose to use this differentialinvariant representation for the definition of the featurespace.
Thus, for a point x, we associate the feature vector
fðxÞ ¼ ðfr0; . . . ; frd ÞðxÞ: ð6Þ
where each frn corresponds to the vector of differentialinvariants up to second-order computed at scale rn. In ten-sor notation,
frnðxÞ ¼ ðL; Lii; LiLi; LijLji; LiLijLjÞ ð7Þwhere L, Li, and Lij represent the image intensity and thefirst and second-order Gaussian derivatives computed atscale rn. The set of scales is chosen according to an expo-nential sampling, rn = r0 Æenq where q is a scale-samplingparameter, and n = 0, . . . ,d � 1, as suggested by the ScaleSpace theory (Lindeberg, 1998).
In our approach, the feature space includes up to sec-ond-order information in a multiscale framework. This ismainly motivated by the fact that we are interested in tubu-lar and blob-like objects, which can be nicely describedwith multiscale second-order information (Frangi et al.,1998; Krissian et al., 1997; Danielsson and Lin, 2001).Obviously, the method can be extended by using a higher(or lower) order differential invariant operator set.
3.2.2. Non-parametric probability estimation
The probability associated to a tissue or region R at apoint x is considered within a Bayesian framework as aconditional probability Pðx 2 RjfðxÞÞ, where f(x) is thevector of features used to characterize the local structureof the image. Different statistical models can be consideredfor the estimation of this conditional probability. Amongthem, the non-parametric models do not make any a priori
assumption about the features distribution that is learneddirectly from the image.
The most popular non-parametric estimation techniqueis Parzen windows (Parzen, 1962) as it is a consistent esti-mator of any continuous probability (Vapnik, 1998). Anytechnique based on the k-nearest neighbor (kNN) rule(Dasarathy, 1990) can be interpreted as an approximationof the Parzen windows, suitable to applications where thedomain of samples provides an sparse representation ofthe domain of all possible patterns. Assuming that pointswith similar local image structure belong to the same tissueclass, we propose to use a kNN estimator for the approxi-mation of the probability associated to a tissue.
Thus, in our approach, the estimation proceeds as fol-lows. For a voxel x, the feature vector f(x) is computedas in Eq. (6). Then, the k nearest feature vectors are foundin a training set according to the Euclidean distance. Theprobability for a voxel x to belong to a tissue class Ci iscomputed from the formula
Pðx 2 CijfðxÞÞ ¼P
x2Li\NkðxÞKcðfðxÞ; fðxÞÞPx2NkðxÞKcðfðxÞ; fðxÞÞ
ð8Þ
where Li represents the set of points in the training set thatbelong to the class Ci, NkðxÞ is the set of the k-nearestneighbors and Kc is a Gaussian kernel with standard devi-ation equal to the Euclidean distance to the kth nearestneighbor (i.e. c = jx0 � x[k]j where x[k] is the kth nearestneighbor).

M. Hernandez, A.F. Frangi / Medical Image Analysis 11 (2007) 224–241 229
The set of the parameters involved in the definition ofthe non-parametric model strongly depend on the specificimage modality and application. In our method, theparameters are estimated from the training sets, using cus-tomary techniques of pattern recognition for parameter fit-ting and model selection (Hastie et al., 2001). In the nextsection, we present our proposed framework used for train-ing set construction, parameter fitting, and model selection.
4. Optimal modeling of tissue classes from angiographic data
4.1. Angiography databases’ description
The 3DRA clinical datasets were acquired at InovaFairfax Hospital (Fairfax, Virginia, USA) using a PhilipsIntegris Biplane unit (Philips Medical Systems; Best, TheNetherlands). Rotational angiographies were performedusing a 6-s constant injection of contrast agent and a180-degree rotation with imaging at 15 frames per secondover 8 s for acquisition of 120 images. Each dataset wastransferred to a Philips Integris Workstation and recon-structed on a 128 · 128 · 128 image with a square field-of-view (FOV) of 54.04 mm yielding a voxel size of0.42 · 0.42 · 0.42 mm3.
The CTA clinical datasets were provided by Miguel Ser-vet Hospital (Zaragoza, Spain). The acquisition was per-formed using an Helical Elscint CT Twin scanner(Marconi; Haifa, Israel) with 120 kV/300 mA for theamplifier tube, 1.2-mm collimation with an helical pitchof 1 and slice spacing of 0.65 mm. The images were recon-structed on a 512 · 512 volume with a square FOV of20.8 cm yielding an in-plane resolution of 0.4 mm. A totalof 140 ml of non-ionic contrast fluid was intravenouslyadministrated (Omnitrast 300 mg; Schering, Berling, Ger-many) at a rate of 3 ml/s, starting the scanning 20 s afterthe onset of contrast administration.
4.2. Training set definition
In general, the selection of the candidates for training isof great importance in the learning stage of any supervisedpattern recognition method. Often, the overall perfor-mance of the method strongly depends on the selection ofthese candidates, that has to be carried out carefully aftera deep empirical study of the available data. It remainsan open issue how to develop a general methodology forthe construction of training sets that, associated to thepattern recognition method, would provide the learningsystem with minimal generalization error (Duin and Peka-lska, 2005). In our application, the construction of thetraining sets involves the selection of the image data sets,cropping in the locations of interest, image pre-processing,tissue labeling, and point sampling. Although some ofthese stages could be approached in a different way, wepropose a protocol for the selection of the datasets andpoint sampling that, according to our experience, providessatisfactory results in our application.
4.2.1. Training set in 3DRA
The protocol for training set construction in 3DRAbegins with the selection of a group of clinical datasets inthe most typical locations of the Circle of Willis. The max-imum dome sizes of the aneurysms presented in these data-sets cover a wide range of the sizes existing in the data base.Thus, the images selected for learning include vessel pat-terns from all the Circle of Willis and aneurysm patternscovering the most frequent sizes in the data base. In ourapplication, each of the candidate images has been selectedto represent a prototype case of cerebral aneurysm locatedat the anterior communicant (ACoA), posterior communi-cant (PCoA), middle cerebral (MCA), basilar and internalcarotid (ICA) arteries, respectively, resulting in a total of 5datasets.
The selected images are first cropped to exclude zero-intensity regions while preserving most of the vascular tree.Then, the cropped images are pre-processed using an aniso-tropic diffusion filter (Black et al., 1998). The use of aniso-tropic diffusion is intended to reduce noise while preservingimage features, thus improving labeling results. The filter iscomputed as the solution of the equation
oIot¼ divðg � rIÞ ð9Þ
where g is the edge function defined in Eq. (1). In our appli-cation, the number of iterations has been selected equal to5 and the stable value for the time step equal to 0.025.
At this point, vessel, background, and partial volumevoxels are labelled in the cropped images. During thedesign of the protocol for training set construction, severalalgorithms were considered for automatic labeling, as man-ual thresholding, region growing (Adams and Bischof,1994) or K-Means (Duda et al., 2001). Our approach usesK-Means as it is fully automatic, parameter independentand yields excellent segmentation results compared to man-ual labeling.
Finally, the training points are randomly selected fromvessel and background tissues, and the corresponding fea-ture vectors are computed and stored. In our application, atotal of 2000 points have been selected from each tissue andimage resulting in a training set of 20000 points. Thus, thetraining points represent a uniform sample of the local pat-terns presented in vessels of all locations and a wide rangeof widths, aneurysms of a wide range of sizes, and thebackground.
4.2.2. Training set in CTA
Compared to 3DRA, CTA has the additional challengeof the presence of bone structures in the image whose inten-sity values highly overlap with the intensities of vessel andaneurysm, especially in partial volume voxels. Moreover,most of the vessels and aneurysms in the Circle of Willisare in close proximity to the skull. Therefore, the variabil-ity of the local patterns increases in CTA with respect to3DRA depending on the presence of bone tissues in theimage and its proximity to the vessel tissues. Keeping this

Gen
eral
izat
ion
erro
r
Number of neighbors (k)
0.2
0.175
0.15
0.125
0.1
0.075
0.05
0.025
0100 90 80 70 60 50 40 30 20 10 1
3DRA
CTA
Fig. 4. Plot of the generalization error associated to the number ofneighbors, computed in ten different experiments for the 3DRA and CTAtraining sets.
230 M. Hernandez, A.F. Frangi / Medical Image Analysis 11 (2007) 224–241
in mind, the protocol for the construction of the trainingset proceeds as follows.
The protocol for training set construction in CTAbegins with the selection of a group of clinical datasets withcerebral aneurysms in the most typical locations observedin the database. The maximum dome sizes of the aneu-rysms presented in these datasets cover a wide range ofsizes existing in the data base. The images are cropped inseveral locations of interest including aneurysms, vesselsegments from all the Circle of Willis, and bone tissue nextto the middle and posterior circulation. In our application,a total of 10 datasets have been selected including the aneu-rysms, vessel segments from the ACA, ACoA, PCoA, ICA,and MCA, and bone tissue.
At this point, K-Means algorithm is considered for auto-matic labeling. The labels of vessel tissue are obtained fromcrops that do not include voxels at the bone tissue, as theK-Means labeling results more accurate. As in the case of3DRA, several algorithms were considered as alternativeto K-Means for automatic labeling (manual thresholdingand region growing). However, none of these algorithmsprovided satisfactory labeling in the crops involving bonetissue.
Finally, the vessel, background, bone, and partial vol-ume tissues are labelled in the cropped images. The trainingpoints are randomly selected from vessel, background andbone tissues, and the corresponding feature vector are com-puted and stored. This way, only correct samples are addedto the training set. In our application, 10000 points havebeen selected from vessel, background and bone tissues,resulting in a training set of 30 000 points.
4.3. Multiscale image features
The feature space depends on the scales in which thecomputations of the derivatives are performed. Since ves-sels appear in different sizes, it is important to introducea range of scales according to these vessel sizes in the fea-ture space. In our application, the minimum scale has beenset equal to the in-plane voxel size, with the number ofscales, d, equal to 10, and the scale-sampling parameter qequal to 0.2. With this parameter set, the minimum andmaximum scales range from 0.4 to 2.95 mm, which coversobjects from 0.8 to 6 mm, this is, from the thinnest arteriesof interest (PCoA) detected with the in-plane resolution, tothe thickest arteries (ICA) in the datasets.
4.4. Feature rescaling via z-scores
As the probabilities are computed from the Euclideandistance among feature vectors, the features in the trainingand test sets are previously converted into z-scores (Dudaet al., 2001). Thus, being the feature vector f and fi its ithcomponent, the z-score f i is computed from the formula
f i ¼fi � mi
sið10Þ
where mi and si are the mean and standard deviation of thesample of the ith feature in the training set.
4.5. Selection of the optimal number of neighbors
The number of neighbors k, is a parameter that controlsthe complexity of the non-parametric estimation model. Ask increases, the kNN model becomes more complex, beingable to estimate the distribution of more complicated struc-tures (low bias), but the generalization error increases andthe accuracy in the estimation falls (high error variance).
In our method, the number of neighbors is selected withusual model selection techniques from pattern recognitiontheory. This parameter is chosen among the ones that pro-vide an optimal model complexity with the minimal gener-alization error. Cross-validation (CV) is used for theselection of the generalization error
CVðkÞ ¼ 1
N
XN
i¼1
LCEðxiÞ ð11Þ
where N is the number of points in the training set and k isthe number of neighbors used to estimate P ðx 2 CijfðxÞÞand
LCEðxÞ ¼ �2X
i
dðCi ¼ CðxÞÞ logðP ðx 2 CijfðxÞÞÞ ð12Þ
is the cross-entropy loss function (Hastie et al., 2001),where Ci corresponds to a tissue class, CðxÞ correspondsto the label of x in the training set, and d corresponds toDirac’s delta function.
In our application, the generalization error associatedwith each training set has been estimated in ten differentexperiments using m-fold cross-validation with m = 10-folds. Fig. 4 shows the curves of the generalization errorfor the training sets in 3DRA and CTA as the modelcomplexity increases. In the case of 3DRA the generaliza-tion error shows an asymptotic behavior starting from 30

M. Hernandez, A.F. Frangi / Medical Image Analysis 11 (2007) 224–241 231
neighbors. In the case of CTA, the minimal generalizationerror is reached approximately from 20 to 30 neighbors andgradually increases if the model uses more than 30 neigh-bors in the estimation. Thus, we have considered the useof 30 neighbors for our non-parametric model.
4.6. Selection of the optimal features
In order to include a further improvement in our non-parametric estimation model, a feature selection is per-formed. Floating feature selection (Somol et al., 1999;Kudo and Sklansky, 2000) is used to find an optimal fea-ture subset of at most fmax features. The algorithm for fea-ture selection proceeds including the best two features andexcluding the worst feature from the current optimal subsetof features. The algorithm starts from an empty set andrepeats the process until the size of the optimal subset offeatures is fmax. This algorithm is more effective thansequential feature selection as it incorporates both forward
Cla
ssifi
catio
n ra
te (J
)
Number of selected features
CTA
3DRA 1
0.98
0.96
0.94
0.92
0.9
0.88
0.86
0.84
0.82
0.85550454035302520151051
Fig. 5. Plot of the correct classification rate (J) associated to the numberof selected features computed in ten different experiments for 3DRA andCTA.
Freq
uenc
y (%
)
Features (grouped by invariant)
100
75
50
25
0Li Lij LjLij LijLiiLi LiL
3DRA
Fig. 6. Incidence of a feature in an optimal subset of 20 features for 3DRA (lefinvariant type and in ascending scale order.
and backward directions allowing to remove alreadyincluded features if that improves the performance.
The criterion for inclusion or exclusion of features isbased on the correct recognition rate that is estimated fromthe cross-validated generalization error
JðXÞ ¼ 1
1þ CV ðXÞ ð13Þ
where X is the current subset of features.In our application, the size of the optimal subset of
features, fmax, has been estimated from ten different exper-iments. Fig. 5 shows the curves of the correct classificationrate in 3DRA and CTA as the number of included featuresis increased. In the case of 3DRA, the optimal recognitionrate is reached for subsets of approximately 20 features. Inthe case of CTA, the optimal recognition rate is reached forsubsets including approximately 30 features. Thus, we haveconsidered the use of fmax = 20 in the case of 3DRA andfmax = 30 in the case of CTA.
Fig. 6 shows the incidence of a feature in these optimalsubsets. In the case of 3DRA, intensity features are themost frequent (100%), with respect to gradient features thathave an incidence of less than the 30% in all cases. Regard-ing second-order-based features, those computed at lowscales are more frequent that the ones computed at largescales, and the presence of LiLijLj features prevails overthe others. In the case of CTA, the intensity and the gradi-ent features computed at low scales are more frequent thanthose computed at large scales. In this case, Lii features arethe least frequent and the frequence of LijLji features pre-vails over the other second-order-based features.
5. Evaluation
The evaluation of the accuracy of medical image seg-mentation algorithms is a challenging issue. Interactiveslice-by-slice delineation of contours by experts has oftenbeen used as ground-truth for evaluation (Pichon et al.,
Freq
uenc
y (%
)
Features (grouped by invariant)
100
75
50
25
0Li Lij LjLij LijLiiLi LiL
CTA
t) and 30 features for CTA (right). The plot shows the features grouped by

Table 2Locations and sizes of the CTA aneurysms selected for training andevaluation
Train 1 Train 2 Test
Location Size [mm] Location Size [mm] Location Size [mm]
ACoA 12.10 ACoA 9.90 ACoA-1 4.60ACoA 5.00 ACoA 6.00 ACoA-2 6.00ACoA 5.30 ACoA 4.40 PCoA 10.20ACoA 11.50 PCoA 4.50 MCA-1 6.80ACoA 4.30 PCoA 7.20 MCA-2 6.30PCoA 6.90 PCoA 5.90PCoA 6.00 MCA 8.70MCA 6.30 MCA 9.80MCA 8.40 MCA 6.40MCA 10.20 MCA 6.40
ACoA indicates the anterior communicant, PCoA the posterior commu-nicant, and MCA the middle cerebral artery, respectively. Sizes measuredover maximum intensity projections (MIP).
232 M. Hernandez, A.F. Frangi / Medical Image Analysis 11 (2007) 224–241
2004; Gan et al., 2005). For the quantification of the per-formance of segmentation algorithms, different overlapmeasures have been proposed in the literature, as volumet-ric overlap indexes or distance based coefficients. A reviewof these measurements for quantification is presented inGerig et al. (2001) and Pichon et al. (2004).
We propose an evaluation framework including a quan-titative study of the performance of our algorithm based onthe spatial overlap between the ground-truth and thesegmentations. To this end, two different dissimilarity mea-surements are used: (1) a volumetric overlap index derivedfrom the Kappa statistic (Zijdenbos et al., 1994 and (2) theabsolute surface distances from the ground-truth to themodel-based segmentations. The study also includes acomparison with the techniques that are most related toour work, and could compete in performance with our seg-mentation algorithm for our specific application.
5.1. Datasets
The evaluation study has been performed on a total of10 cerebral aneurysms, located at the Circle of Willis andselected from the 3DRA and CTA datasets described inSection 4.1. In order to assess if the datasets selected fortraining significantly influence the final outcome of thealgorithm, two different groups of datasets have been con-sidered in the learning stage of the algorithm. Tables 1 and2 show the location and sizes of the aneurysms selected fortraining and evaluation from the 3DRA and CTA databases, respectively.
5.2. Gold-standard and alternative techniques
The complexity of the cerebral vasculature and the highvariability of the structures in the proximities of the aneu-rysm, make manual segmentation of the whole vasculartree cumbersome. In the case of 3DRA, the manual seg-mentation was performed for the vascular structures withdiameter greater than 1 mm (�3 voxels). In the case ofCTA, the images were cropped into a region of interest(ROI) to include just the aneurysm and adjacent vesselsin the quantitative study. Manual segmentations were per-formed by one experienced observer twice. The observer
Table 1Locations and sizes of the 3DRA aneurysms selected for training andevaluation
Locations Train 1 size [mm] Train 2 size [mm] Test size [mm]
ACoA 5.59 9.64 9.38PCoA 5.86 5.74 6.91MCA 8.31 16.83 6.79basilar 6.18 7.35 8.39ICA 11.96 8.33 4.92
ACoA indicates the anterior communicant, PCoA the posterior commu-nicant, MCA the middle cerebral, and ICA the internal carotid artery,respectively. Sizes measured in mm over calibrated digital substractionangiographies (DSA).
traced the contour with a period of 1 month between thetracings using SNAP application (Yushkevich et al.,2005). To reduce intra-expert variability, an average seg-mentation was derived by calculating the average shapeof the manual segmentations using a shape based interpo-lator (Raya and Udupa, 1990). This average segmentationhas been regarded as the ground-truth in our quantitativestudy.
The evaluation study includes a comparison to somealternative techniques. We have considered K-Means andthe model-based techniques that have been proposed inthe literature for the segmentation of cerebral aneurysmsin 3DRA and CTA.
K-Means clustering (KM), has been used for automaticlabeling in the training stage of our algorithm. K-Means isan unsupervised classification method based on theminimization of the variance inside classes. In our imple-mentation, the images are first preprocessed using an aniso-tropic diffusion filter (Black et al., 1998) to improveclassification results. Three clusters (vessel, backgroundand partial volume) are considered in the case of 3DRA,and five clusters (vessel, background, bone, air and partialvolume) in the case of CTA.
Model-based techniques consist in the use of surface-based evolution methods associated with the minimizationof variational problems within the level set framework. Wehave considered the techniques that include region-basedinformation in the energy functional in three differentfashions.
Non-parametric geodesic active regions, is the techniquepresented in this work. For comparison, the evaluationstudy presents results over the non-parametric with featureselection (NP-FS-GAR) and the non-parametric withoutfeature selection (NP-GAR) models.
Parametric geodesic active regions (P-GAR), has beenused for the segmentation of cerebral aneurysms in3DRA (Deschamps, 2001). The energy functional dependson region and gradient information as defined in Eq. (3). In

M. Hernandez, A.F. Frangi / Medical Image Analysis 11 (2007) 224–241 233
our implementation, the probabilities of the region descrip-tors are assumed to be Gaussian, estimated from a Gauss-ian Mixture Model (GMM). As we found that theexpectation maximization (EM) algorithm presented con-vergence problems in our datasets, we estimated theGMM parameters from the segmentations achieved by K-Means.
Active contours without edges (ACWE) minimizes thevariance inside and outside the surface in evolution. In thismodel, the gradient information is dropped. Thus, theenergy functional depends only on region information.This energy, is defined as a simplification of the Mum-ford-Shah functional under the assumption of piecewiseconstant images. This method has been used for the seg-mentation of CTA in Holtzman-Gazit et al. (2006). Inour implementation, if the image presents two tissues, asingle surface is considered in the evolution (Chan andVese, 2001). In the case of three tissues, a multiphase ver-sion of this algorithm is used (Vese and Chan, 2002).
In our implementation, the same initialization has beenused for the three models consisting in N seed points ran-domly selected from the ground-truth. The parameters ofthe models are listed in Table 3. The common parametershave been set to equal values in all models. The numberof iterations, nit, has been set to be the needed to reach con-vergence. In each iteration, the time step Dt has been com-puted following the Courant–Friedrichs–Levy (CFL)Condition (Osher and Fedkiw, 2002). For efficiency, allthe computations have been performed in a narrow bandof the zero level set (Adalsteinsson and Sethian, 1995) ofwidth w. The level set function is reinitialized to a distancetransform using the method proposed by Krissian andWestin (2003).
5.3. Evaluation metrics
In our quantitative study, two different measures of dis-similarity are proposed to evaluate the accuracy of a seg-mentation by comparing the set of segmented voxels (S)with the set of ground-truth voxels (G). Two differentaspects of the segmentation accuracy have been considered.In order to compare the volumetric overlap between twosegmentations, we use the Dice Similarity Coefficient(DSC). In order to evaluate the accuracy between two seg-mentations having into account subvoxel precision, we use
Table 3Parameters involved in the model based techniques (non-parametric geodesic aactive contours without edges (ACWE)) and values used in the evaluation exp
Parameter Description
N Number of seed pointsf Region-based energy scalingg Gradient based energy scaling� Curvature scalingnit Number of iterationsDt Time stepw Narrow band amplitude
a metric derived from the point to surface distance within astatistical framework.
DSC is a special case of the Kappa statistic commonlyused in reliability analysis for multiple applications. DSCis defined as
DSCðS;GÞ ¼ 2 � jS \ GjjSj þ jGj ð14Þ
where jXj denotes the cardinality of the set X. DSC rangesfrom 0, if the objects do not overlap, to 1, if the overlap be-tween the two segmentations is maximal. This coefficienthas been extensively used for validation of segmentationalgorithms in different medical image modalities (Zijdenboset al., 1994; Zou and Warfield, 2004; Pichon et al., 2004;Gan et al., 2005).
For the computation of the DSC values, binary imageshave been used to represent the objects. In the case of K-Means, the objects have been represented by the clusterassociated to the vessel tissue. To obtain the binary imagesfrom model based segmentations, we have performed abinary thresholding of the distance map associated to thesegmentation.
In our application, DSC provides a global measure-ment of segmentation accuracy that penalizes for errorsin aneurysm and vessel segmentation and for the existenceof missegmented structures attached to the segmentation.We have found this event very frequent in our applica-tion, mainly in CTA cases where the aneurysm is nextto the bone or the crop includes the part of the internalcarotid artery (ICA) that goes trough the skull basis. Inthese cases, the DSC coefficient would not properly eval-uate the accuracy of the segmentations, as one accuratesegmentation of the vessel tissue with an attached pieceof bone, easily removed with surface editing, would pro-vide the same DSC coefficient than a very inaccurate seg-mentation. Besides, DSC is a voxel-wise volumetricmeasurement and, therefore, it does not have into accountthe subvoxel precision provided by model based tech-niques. For these reasons, a surface based metric is con-sidered complementary to the DSC index to provide adissimilarity measurement that also has into account sub-voxel precision.
In order to compare the distances between the ground-truth and the surfaces from model-based segmentations,we use the absolute surface distance with respect to the
ctive regions (NP-GAR), parametric geodesic active regions (P-GAR) anderiments
Model Value
NP-GAR, P-GAR, ACWE 100NP-GAR, P-GAR, ACWE 1.0NP-GAR, P-GAR 1.0NP-GAR, P-GAR, ACWE 0.25NP-GAR, P-GAR, ACWE Until convergenceNP-GAR, P-GAR, ACWE CFL conditionNP-GAR, P-GAR, ACWE 6 voxels

234 M. Hernandez, A.F. Frangi / Medical Image Analysis 11 (2007) 224–241
boundary points of the ground-truth (Fr(G)) within a sta-tistical framework
dx2FrðGÞðxÞ ¼ dðx; SÞ ð15Þ
In this equation, x denotes the coordinates of the center ofthe voxel and d(x,S) is the shortest Euclidean distance fromx to the surface S.
As pointed out by Pichon et al. (2004), d can be consid-ered as a random variable, D, which describes the discrep-ancy between the ground-truth G and the surface S. Thestatistical measures derived from this random variable,provide a quantitative interpretation about the perfor-mance of the evaluated model based technique. The consid-ered metrics are the probability of error, PE = P(D > 0),the mean of errors, lD>0 = mean(DjD > 0), the standarddeviation of errors, rD>0 = stdev(DjD > 0) and the errordistance of the worst f% voxels, Df = f � quantile (D).All this information allows to measure the accuracy ofmodel based segmentations with respect to the ground-truth.
5.4. Evaluation results and discussion
Prior to the evaluation results, we analyze the sensitivityof the training process to the training set. Fig. 7 shows theimage slices of the vessel probabilities associated to thetraining sets described in Section 5.1 for a test dataset in
Fig. 7. Comparison of the probabilities estimated with training sets generatedThe figure shows the original slice image, the probability for vessel associated tobetween both probabilities.
Fig. 8. Comparison of the probabilities estimated with training sets generatedfirst row shows the original slice image, the probability for vessel associated tobetween both probabilities. The second row shows the probability for bone asdifference between both probabilities.
3DRA (ACoA). From the figure, it can be appreciated thatboth probabilities are quite similar. The differences in theestimated probabilities are located at the partial volumevoxels in the transition between vessel and backgroundand the voxels belonging to the thinnest vessels, speciallyif those vessels present low contrast dose inside. These ves-sel features seem to lie at the decision boundary of the pat-tern recognition method for this application.
Fig. 8 shows the image slices of the vessel and boneprobabilities associated to the training sets described inSection 5.1 for a test dataset in CTA (PCoA). From the fig-ure, it can be appreciated that both probabilities are quitesimilar in the locations belonging to vessel tissue. The dif-ferences in the estimated probabilities are located at partialvolume voxels located in the transition between vessel andbackground and between bone and background. In thisapplication, the decision boundary includes partial volumefeatures, vessels with low contrast dose inside and vesselswith high contrast dose inside, and bone tissue with lowcalcification. These results are extensible to the rest of the3DRA and CTA data sets in the evaluation study.
The use of different data sets for training does not affectthe final segmentation accuracy in the places of partial vol-ume voxels as the geodesic active regions include both sta-tistical and gradient based information in the evolution ofthe model. As a result, the evaluation study provides verysimilar quantitative results for both learning sessions. For
from different samples associated with a 3DRA clinical dataset (ACoA).Train 1, the probability for vessel associated to Train 2 and the difference
from different samples associated with a CTA clinical dataset (PCoA). TheTrain 1, the probability for vessel associated to Train 2 and the difference
sociated to Train 1, the probability for bone associated to Train 2 and the

Fig. 10. Image slices associated with a CTA clinical dataset (MCA-2). Thefirst row shows the original slice image, and manual and K-Meanssegmentations. In the manual segmentation, the vessel is labelled in whiteand the background in black. In the K-Means (KM) segmentation, thevessel is labelled in grey, the background in black and the partial volumevoxels in grey. The second and third rows show the probabilitiesassociated with our non-parametric technique with feature selection(NP-FS) and the parametric (P) model, respectively.
M. Hernandez, A.F. Frangi / Medical Image Analysis 11 (2007) 224–241 235
this reason, we proceed with the evaluation results associ-ated to the Train 1.
Fig. 9 shows the image slices of the manual and K-Means segmentations and the probabilities associated witha test dataset in 3DRA (basilar). The figure shows that K-Means segmentation is very similar to the ground-truthwith a discrepancy of only a few voxels. Comparing theprobabilities, vessel probabilities estimated with the non-parametric method are high in the voxels delineated bythe manual segmentation, and low elsewhere, with asmooth transition in the partial volume voxels. On theother hand, the probabilities for vessel estimated fromthe parametric model are high in the partial volume voxels.
Fig. 10 shows the image slices of the manual andK-Means segmentations and the probabilities associatedwith a test dataset in CTA (MCA-2). In this dataset,K-Means clustering misclassify the voxels with intensitieslocated in the transition between bone and background,as the intensity values in these places are in the same rangeas the vessel intensity values. Moreover, the parametricmodel presents high values of probability for vessel in suchproblematic locations. Contrarily, the non-parametricmodel seems to improve probability results specially inthe locations where the other algorithms fail.
Figs. 11 and 12 show the segmentations considered inthe evaluation study. In the case of the 3DRA datasets,our non-parametric method (NP-FS-GAR) seems to pro-vide the best performance through the testing datasets.The segmentation with K-Means (KM) is usually not ableto recover some of the vessels of interest (basilar).Although our non-parametric method uses K-Means fortraining, it is able to recover those vessels. In general, theperformance of K-Means in the rest of the vasculature isgood, although the algorithm fails in the cases of low con-trast dose (MCA). The model without edges (ACWE)seems to provide thicker segmentations than the ground-truth and our method. The quality of the segmentationsprovided by the parametric model (P-GAR) is, in general,
Fig. 9. Image slices associated with a 3DRA clinical dataset (basilar). Thsegmentations. In the manual segmentation, the vessel is labelled in white and tlabelled in white, the background in grey and the partial volume voxels in bparametric technique with feature selection (NP-FS) and the parametric (P) m
lower than the quality achieved by the other models(PCoA, MCA and basilar).
In the case of CTA datasets, our non-parametric model(NP-FS-GAR) seems to provide the segmentations withthe best quality in all cases. In the images with bone tissuenext to the aneurysm (PCoA and MCA-2), all the modelsare prone to lead the front evolution towards bone-back-ground transition areas thus segmenting parts of bone tis-sue attached to the aneurysm body. This problem is lessdramatic in our method as, in most of the cases, theattached piece of bone is usually smaller, and can easilybe removed with surface editing without affecting the over-all quality of the segmentation. K-Means (KM) usuallyincludes vessel and bone tissue in a single cluster (MCA-2) and vessel with low intensity and background tissue inthe same cluster (PCoA). In the images without bone tissue
e first row shows the original slice image, and manual and K-Meanshe background in black. In the K-Means (KM) segmentation, the vessel islack. The second row shows the probabilities associated with our non-odel, respectively.

Fig. 11. Comparison of the 3DRA segmented vascular models with the reference techniques considered in the evaluation study (ACoA, PCoA, MCA,basilar and ICA). The columns show the results from the manual, K-Means (KM), our non-parametric with feature selection (NP-FS-GAR), parametric(P-GAR) and active contour without edges (ACWE) methods, respectively.
236 M. Hernandez, A.F. Frangi / Medical Image Analysis 11 (2007) 224–241
(ACoA-1, ACoA-2 and MCA-1), K-Means, the non-para-metric (NP-FS-GAR) and the parametric (P-GAR) modelsseem to perform similar (except for the segmentation of thethin vessel in MCA-1) and the model without edges(ACWE) seems to provide thicker segmentations.
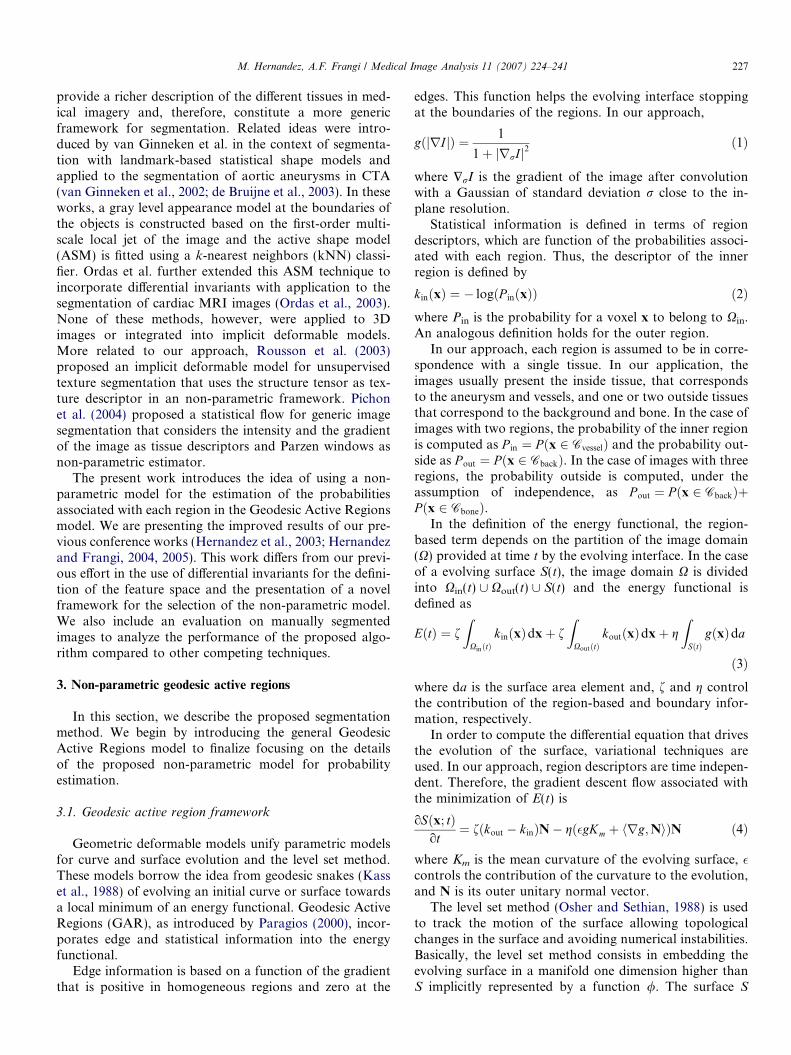
Fig. 13 and Table 4, present the DSC values for the seg-mentations considered in the evaluation study when com-pared to the ground-truth. As a further comparison,Table 5 shows the results of the statistical study over theerror distance between manual and model based segmenta-tions. Both tables present the mean and the standard devi-ation of the statistical values computed for each methodover the 3DRA and CTA data sets separately.
In the 3DRA evaluation set, the best average overlapindex is achieved by our non-parametric method with fea-ture selection (NP-FS-GAR), with a DSC average of91.13%. The overlap index in the case without feature selec-tion (NP-GAR) is slightly lower than the case with featureselection in all datasets (DSC average = 90.05%). InFig. 13, it is shown that all the segmentations providedby our technique, produce DSC values greater than the70%, which indicates an excellent agreement with theground-truth in all cases (Zijdenbos et al., 1994). In cases
involving small vessels (basilar) or high partial volumeeffects (PCoA and MCA), the parametric model (P-GAR)usually achieve the worst overlap indexes (DSC aver-age = 69.03%). In cases of high partial volume effectsinvolving bone tissue, the overlap index in K-Means(KM) is low (DSC = 46.74%). In all cases, the methodwithout edges provides segmentations thicker than theground truth. As result, the DSC average equals to 77.39%.
In Table 5, our non-parametric method with featureselection (NP-FS-GAR) has the lowest probability of error(PE = 16.16%) while the parametric model (P-GAR) andthe model without edges (ACWE) have the highest proba-bility of error (41.93% and 36.64%, respectively). The low-est mean distance error corresponds to our method, that isclose to the in-plane resolution (0.40 mm). Besides, in ourmodel, the 95% of the points have a distance to the groundtruth less than two voxels (0.76 mm). On the other hand,the value of D0.95 for the parametric model (P-GAR) andthe model without edges (ACWE) are equal to 0.97 and1.06 mm, respectively.
In the CTA evaluation set, the quality of the segmenta-tions strongly depends on the presence of bone tissue in thedataset that is evaluated, as shown in Fig. 13. The DSC

Fig. 12. Comparison of the CTA segmented vascular models with the reference techniques considered in the evaluation study (ACoA-I, ACoA-II, PCoA,MCA-I, and MCA-II). The columns show the results from the manual, K-Means (KM), our non-parametric with feature selection (NP-FS-GAR),parametric (P-GAR), and active contour without edges (ACWE) methods, respectively.
DS
C
KMNP-FS-GAR
NP-GARP-GARACWE
1
0.9
0.8
0.7
0.6
0.5
0.4
0.3
0.2
0.1
0ICAbasilarMCAPCoAACoA
3DRA
DS
C
KMNP-FS-GAR
NP-GARP-GARACWE
1
0.9
0.8
0.7
0.6
0.5
0.4
0.3
0.2
0.1
0MCA-2MCA-1PCoAACoA-2ACoA-1
CTA
Fig. 13. DSC values for the methods considered in the evaluation study: K-Means (KM), our non-parametric geodesic active regions with and withoutfeature selection (NP-FS-GAR and NP-GAR), parametric geodesic active regions (P-GAR), and Active Contours Without Edges (ACWE). The left figurepresents the results for the 3DRA and the right figure for the CTA datasets, respectively.
M. Hernandez, A.F. Frangi / Medical Image Analysis 11 (2007) 224–241 237
coefficient indicates an excellent overlap, with the sametrends appreciated in the 3DRA evaluation set, if the imagepresents just vessel and background tissues (ACoA-1 and
MCA-1), or the bone tissue is not located in vessel proxim-ities (ACoA-2). However, in the cases with bone tissuelocated next to the vessel tissue (PCoA and MCA-2), the
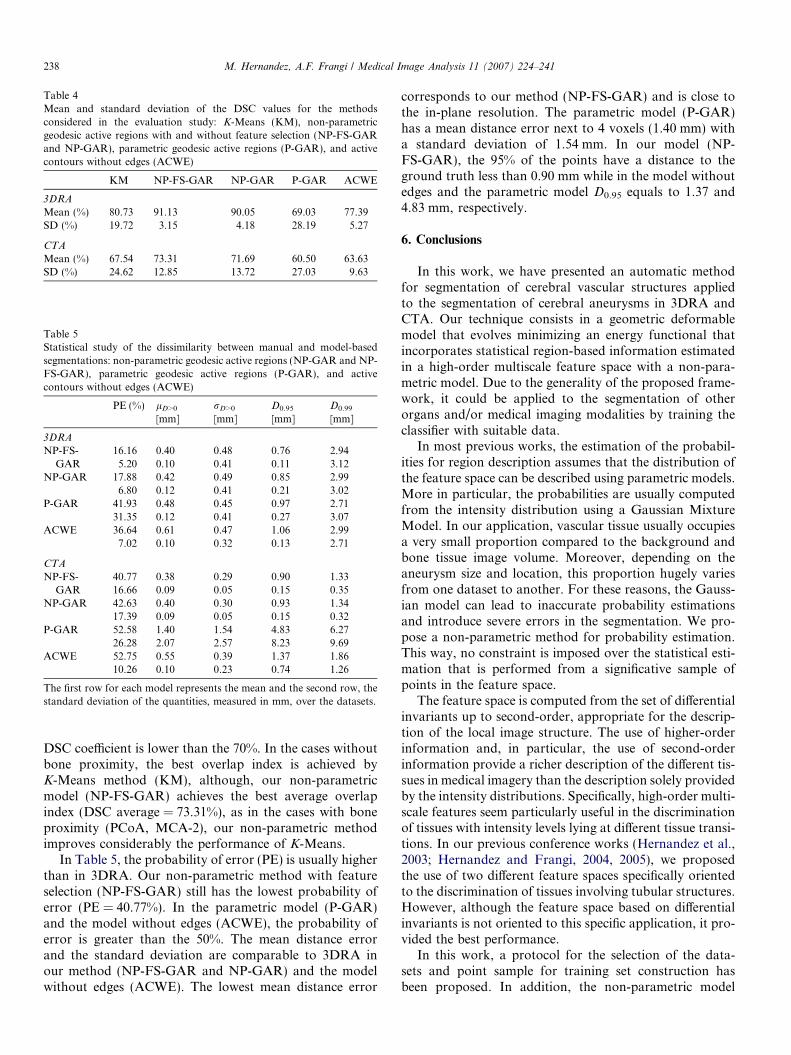
Table 4Mean and standard deviation of the DSC values for the methodsconsidered in the evaluation study: K-Means (KM), non-parametricgeodesic active regions with and without feature selection (NP-FS-GARand NP-GAR), parametric geodesic active regions (P-GAR), and activecontours without edges (ACWE)
KM NP-FS-GAR NP-GAR P-GAR ACWE
3DRA
Mean (%) 80.73 91.13 90.05 69.03 77.39SD (%) 19.72 3.15 4.18 28.19 5.27
CTA
Mean (%) 67.54 73.31 71.69 60.50 63.63SD (%) 24.62 12.85 13.72 27.03 9.63
Table 5Statistical study of the dissimilarity between manual and model-basedsegmentations: non-parametric geodesic active regions (NP-GAR and NP-FS-GAR), parametric geodesic active regions (P-GAR), and activecontours without edges (ACWE)
PE (%) lD>0
[mm]rD>0
[mm]D0.95
[mm]D0.99
[mm]
3DRA
NP-FS-GAR
16.16 0.40 0.48 0.76 2.945.20 0.10 0.41 0.11 3.12
NP-GAR 17.88 0.42 0.49 0.85 2.996.80 0.12 0.41 0.21 3.02
P-GAR 41.93 0.48 0.45 0.97 2.7131.35 0.12 0.41 0.27 3.07
ACWE 36.64 0.61 0.47 1.06 2.997.02 0.10 0.32 0.13 2.71
CTA
NP-FS-GAR
40.77 0.38 0.29 0.90 1.3316.66 0.09 0.05 0.15 0.35
NP-GAR 42.63 0.40 0.30 0.93 1.3417.39 0.09 0.05 0.15 0.32
P-GAR 52.58 1.40 1.54 4.83 6.2726.28 2.07 2.57 8.23 9.69
ACWE 52.75 0.55 0.39 1.37 1.8610.26 0.10 0.23 0.74 1.26
The first row for each model represents the mean and the second row, thestandard deviation of the quantities, measured in mm, over the datasets.
238 M. Hernandez, A.F. Frangi / Medical Image Analysis 11 (2007) 224–241
DSC coefficient is lower than the 70%. In the cases withoutbone proximity, the best overlap index is achieved byK-Means method (KM), although, our non-parametricmodel (NP-FS-GAR) achieves the best average overlapindex (DSC average = 73.31%), as in the cases with boneproximity (PCoA, MCA-2), our non-parametric methodimproves considerably the performance of K-Means.
In Table 5, the probability of error (PE) is usually higherthan in 3DRA. Our non-parametric method with featureselection (NP-FS-GAR) still has the lowest probability oferror (PE = 40.77%). In the parametric model (P-GAR)and the model without edges (ACWE), the probability oferror is greater than the 50%. The mean distance errorand the standard deviation are comparable to 3DRA inour method (NP-FS-GAR and NP-GAR) and the modelwithout edges (ACWE). The lowest mean distance error
corresponds to our method (NP-FS-GAR) and is close tothe in-plane resolution. The parametric model (P-GAR)has a mean distance error next to 4 voxels (1.40 mm) witha standard deviation of 1.54 mm. In our model (NP-FS-GAR), the 95% of the points have a distance to theground truth less than 0.90 mm while in the model withoutedges and the parametric model D0.95 equals to 1.37 and4.83 mm, respectively.
6. Conclusions
In this work, we have presented an automatic methodfor segmentation of cerebral vascular structures appliedto the segmentation of cerebral aneurysms in 3DRA andCTA. Our technique consists in a geometric deformablemodel that evolves minimizing an energy functional thatincorporates statistical region-based information estimatedin a high-order multiscale feature space with a non-para-metric model. Due to the generality of the proposed frame-work, it could be applied to the segmentation of otherorgans and/or medical imaging modalities by training theclassifier with suitable data.
In most previous works, the estimation of the probabil-ities for region description assumes that the distribution ofthe feature space can be described using parametric models.More in particular, the probabilities are usually computedfrom the intensity distribution using a Gaussian MixtureModel. In our application, vascular tissue usually occupiesa very small proportion compared to the background andbone tissue image volume. Moreover, depending on theaneurysm size and location, this proportion hugely variesfrom one dataset to another. For these reasons, the Gauss-ian model can lead to inaccurate probability estimationsand introduce severe errors in the segmentation. We pro-pose a non-parametric method for probability estimation.This way, no constraint is imposed over the statistical esti-mation that is performed from a significative sample ofpoints in the feature space.
The feature space is computed from the set of differentialinvariants up to second-order, appropriate for the descrip-tion of the local image structure. The use of higher-orderinformation and, in particular, the use of second-orderinformation provide a richer description of the different tis-sues in medical imagery than the description solely providedby the intensity distributions. Specifically, high-order multi-scale features seem particularly useful in the discriminationof tissues with intensity levels lying at different tissue transi-tions. In our previous conference works (Hernandez et al.,2003; Hernandez and Frangi, 2004, 2005), we proposedthe use of two different feature spaces specifically orientedto the discrimination of tissues involving tubular structures.However, although the feature space based on differentialinvariants is not oriented to this specific application, it pro-vided the best performance.
In this work, a protocol for the selection of the data-sets and point sample for training set construction hasbeen proposed. In addition, the non-parametric model

M. Hernandez, A.F. Frangi / Medical Image Analysis 11 (2007) 224–241 239
has been fitted to the specific application using cross-val-idation and feature selection techniques to achieve thebest estimation for each of the tissue classes associatedto the learning system. The process used for trainingset generation and parameter fitting implicitly determinesthe decision boundary of our method. It remains an openissue how to construct the training set with the highestgeneralization power for our application, due to the highvariability of patterns existing in the feature space. In the3DRA datasets, the decision boundary includes partialvolume features and vessels with low contrast doseinside. In the case of CTA datasets, the decision bound-ary includes partial volume features, vessels with lowcontrast dose inside, aneurysm with high contrast doseinside, and bone tissue with low calcification. The seg-mentations are robust in the places of partial volumevoxels and inside the aneurysm dome since geodesicactive regions include both statistical and gradient basedinformation in the evolution of the model. However,depending on the samples used for training, the segmen-tations could perform different in the segmentation ofthin vessels or bone tissue. Nevertheless, these arteriesare usually of low interest in both clinical and technicalapplications (like computational fluid dynamics or mor-phological characterization) and, in the majority of thecases, bone tissue can be easily removed with surfaceediting tools.
The proposed methodology has been thoroughly eval-uated against manual segmentations as ground-truth andcompared to other techniques. The proposed method hasbeen applied to a total of 10 clinical datasets of cerebralaneurysms representing the most typical morphologiesobserved in our 3DRA and CTA data bases in the mostfrequent locations. Firstly, the influence of the selectionof the datasets for training in the performance of thelearning system has been shown in two representativeexamples. Secondly, a qualitative evaluation of the seg-mentation results has been visually assessed. For thequantitative analysis, both an overlap coefficient (DSC)and the statistics over the distance (D) from theground-truth to the surface have been computed. Withour technique (NP-FS-GAR), the average DSC indexeswere equal to 91.13% and 73.31% in 3DRA and CTA,respectively. The mean distance error was close to thein-plane resolution (0.40 and 0.38 mm, respectively) andthe 95% of the points of the model had a distance tothe ground truth less than 0.76 and 0.90 mm, respec-tively. In comparison, the average DSC indexes for theactive contours without edges model (ACWE) were equalto 77.39% and 63.63%, respectively and the average dis-tance to the ground truth were equal to 0.61 and0.55 mm, respectively. The quantities computed fromthe parametric geodesic active contours (P-GAR) indi-cated a much lower performance. Thus, both quantita-tively and qualitatively, our technique has proven toyield more accurate results when compared to these othercompeting techniques.
Acknowledgments
The authors would like to acknowledge to Dr. C.M.Putman from Inova Fairfax Hospital and J.R. Cebralfrom George Mason University (Fairfax, Virginia,USA) for providing the 3DRA datasets and interestingconversations during this work. The authors would alsolike to acknowledge to Dr. R.Barrena and Dr. G. Her-nandez from the Aragon Institute of Health Sciences(Zaragoza, Spain) for providing the CTA datasets andclinical background. Thanks also to G. Sapiro from theUniversity of Minnesota for interesting conversations atthe beginning of this work, and to X. Mellado from theUniversity Pompeu Fabra for the development of thecode underpinning this work. The initial phase of this re-search has been partially supported by the ISCIII IM3Network (G03/185) and Fundacion MAPFRE Medicina.MH has been supported by the scholarship FPU-AP2001-1678. AFF is supported by a Ramon y Cajal Fellowshipboth from the Spanish MEC and acknowledges supportfrom MEC TEC2006-03617, ISCIII FIS2004/40676, andCDTI CENIT-CDTEAM grants. Finally, the authorswould like to acknowledge to the anonymous reviewersfor their useful comments and suggestions to improve thismanuscript.
References
Adalsteinsson, D., Sethian, J.A., 1995. A fast level set method forpropagating interfaces. J. Comput. Phys. 118, 269–277.
Adams, R., Bischof, L., 1994. Seeded region growing. IEEE Trans.Pattern Anal. Mach. Intell. 16 (6), 641–647.
Antiga, L., Ene-Iordache, B., Remuzzi, A., 2003. Computational geom-etry for patient-specific reconstruction and meshing of blood vesselsfrom MR and CT angiography. IEEE Trans. Med. Imaging 22 (5),674–684.
Aubert, G., Barlaud, M., Faugeras, O., Jehan-Besson, S., 2003. Imagesegmentation using active contorus: calculus of variations or shapegradients. SIAM J. Appl. Math. 63 (6), 2128–2154.
Aylward, S.R., Bullitt, E., 2002. Initialization, noise, singularities, andscale in height ridge traversal for tubular object centerline extraction.IEEE Trans. Med. Imaging 21 (2), 61–75.
Black, M.J., Sapiro, G., Marimont, D.H., Heeger, D., 1998. Robustanisotropic diffusion. IEEE Trans. Image Process. 7 (3), 421–432.
Boissonnat, J.D., Chaine, R., Frey, P., Malandain, G., Salmon, S., Saltel,E., Thiriet, M., 2005. From arteriographies to computational flow insaccular aneurisms: the INRIA experience. Med. Image Anal. 9, 133–143.
Caselles, V., Kimmel, R., Sapiro, G., 1997. Geodesic active contours. Int.J. Comput. Vision 22 (1), 61–79.
Cebral, J.R., Castro, M.A., Appanaboyina, S., Putman, C., Millan, D.,Frangi, A.F., 2005. Efficient pipeline for image-based patient-specificanalysis of cerebral aneurysm hemodynamics: technique and sensitiv-ity. IEEE Trans. Med. Imaging 24 (4), 457–467.
Chan, T., Vese, L., 2001. Active contours without edges. IEEE Trans.Image Process. 10 (2), 266–277.
Chen, J., Amini, A.A., 2004. Quantifying 3D vascular structures in MRAimages using hybrid pde and geometric deformable models. IEEETrans. Med. Imaging 23 (10), 1251–1261.
Chung, A.C.S., Noble, J.A., Summers, P., 2004. Vascular segmentation ofphase contrast magnetic resonance angiograms based on statisticalmixture modeling and local phase coherence. IEEE Trans. Med.Imaging 23 (12), 1490–1507.

240 M. Hernandez, A.F. Frangi / Medical Image Analysis 11 (2007) 224–241
Danielsson, P.E., Lin, Q., 2001. A new shape space for second order 3D-variations. Proceedings of the 4th International Workshop on Visualform. In: Lecture Notes in Computer Science (LNCS), vol. 2059.Springer-Verlag, Berlin, Germany, pp. 145–154.
Dasarathy, B., 1990. Nearest Neighbor Pattern Classification Techniques.IEEE Computer Society Press, Los Alamitos, CA.
de Bruijne, M., van Ginneken, B., Niessen, W.J., Viergever, M.A., 2003.Active shape model segmentation using a non-linear appearancemodel: application to 3D AAA segmentation. Technical Report UU-CS-2003-13, Institute of Information and Computing Sciences,Utrecht University.
Deschamps, T., 2001. Curve and shape extraction with minimal path andlevel-sets techniques. Applications to 3D medical imaging. Ph.D.thesis, University of Paris-Dauphine, France.
Duda, R.O., Hart, P.E., Stork, D.G., 2001. Pattern Classification. J.Wiley.
Duin, R., Pekalska, E., 2005. Open issues in pattern recognition.Computer Recognition Systems (CORES 2005). Springer-Verlag,Berlin, pp. 27–42.
Frangi, A.F., Niessen, W.J., Vincken, K.L., Viergever, M.A., 1998.Multiscale vessel enhancement filtering. Medical Image Computingand Computer-Assisted Intervention (MICCAI 1998). In: LectureNotes in Computer Science (LNCS), vol. 1496. Springer-Verlag,Berlin, Germany, pp. 130–137.
Frangi, A.F., Niessen, W.J., Hoogeveen, R.M., van Walsum, T.,Viergever, M.A., 1999. Model-based quantitation of 3-D magneticresonance angiographic images. IEEE Trans. Med. Imaging 18 (10),946–956.
Fridman, Y., Pizer, S.M., Aylward, S., Bullitt, E., 2004. Extractingbranching tubular object geometry via cores. Med. Image Anal. 8 (3),176–196.
Gan, R., Wong, W.C.K., Chung, A.C.S., 2005. Statistical cerebrovascularsegmentation in three-dimensional rotational angiography based onmaximum intensity projections. Med. Phys. 32 (9), 3017–3028.
Gerig, G., Jomier, M., Chakos, M., 2001. Valmet: a new validation toolfor assessing and improving 3D object segmentation. Medical ImageComputing and Computer-Assisted Intervention (MICCAI 2001). In:Lecture Notes in Computer Science (LNCS), vol. 2208. Springer-Verlag, Berlin, Germany, pp. 516–523.
Hastie, T., Tibshirani, R., Friedman, J., 2001. The Elements of StatisticalLearning. Data Mining, Inference and Prediction. Springer-Verlag.
Hernandez, M., Frangi, A.F., 2004. Geodesic active regions using non-parametric statistical regional description and their application toaneurysm segmentation from CTA. Medical Imaging and AugmentedReality (MIAR 2004). In: Lecture Notes in Computer Science (LNCS),vol. 3150. Springer-Verlag, Berlin, Germany, pp. 94–102.
Hernandez, M., Frangi, A.F., 2005. Brain aneurysm segmentation in CTAand 3DRA using geodesic active regions based on second orderprototype features and non-parametric density estimation. In: Pro-ceedings of SPIE Medical Imaging 2005: Physiology, Function, andStructure from Medical Images, vol. 5747, pp. 514–525.
Hernandez, M., Sapiro, G., Frangi, A.F., 2003. Three-dimensionalsegmentation of brain aneurysms in CTA using non-parametricregion-based information and implicit deformable models: methodand evaluation. Medical Image Computing and Computer-AssistedIntervention (MICCAI 2003). In: Lecture Notes in Computer Science(LNCS), vol. 2479. Springer-Verlag, Berlin, Germany, pp. 594–602.
Holtzman-Gazit, M., Kimmel, R., Peled, N., Goldsher, D., 2006.Segmentation of thin structures in volumetric medical images. IEEETrans. Med. Imaging 15 (2), 354–363.
Hop, J.W., Rinkel, G.J., Algra, A., van Gijn, J., 1997. Case-fatality ratesand functional outcome after subarachnoid hemorrhage: a systematicreview. Stroke 28, 660–664.
Huang, J., van Gelder, J.M., 2002. The probability of sudden death fromrupture of intracranial aneurysms: a meta-analysis. J. Neruosurg. 51(5), 1101–1105.
Kass, M., Witkin, A., Terzopoulos, D., 1988. Snakes: active contourmodels. Int. J. Comput. Vision 1 (4), 321–331.
Krissian, K., Westin, C.F., 2003. Fast and accurate redistancing for levelset methods. In: Computer Aided Systems Theory (EUROCAST’03),pp. 48–51.
Krissian, K., Malandain, G., Ayache, N., 1997. Directional anisotropicdiffusion applied to segmentation of vessels in 3D images. Scale-SpaceTheory in Computer Vision (Scale-Space’97) Utrecht. In: The Neth-erlands, Lecture Notes in Computer Science (LNCS), vol. 1252.Springer-Verlag, Berlin, Germany, pp. 345–348.
Krissian, K., Malandain, G., Ayache, N., Vaillant, R., Trousset, Y., 2000.Model based detection of tubular structures in 3D images. Comput.Vis. Image Underst. 80 (2), 130–171.
Kudo, M., Sklansky, J., 2000. Comparison of algorithms that selectfeatures for pattern classifiers. Pattern Recogn. 33, 25–41.
Lindeberg, T., 1998. Feature detection with automatic scale selection. Int.J. Comput. Vision 30 (2), 77–116.
Lorigo, L.M., Faugeras, O., Grimson, W.E.L., Keriven, R., Kikinis, R.,Nabavi, A., Westin, C.F., 2000. Codimension-two geodesic activecontours for the segmentation of tubular structures. In: IEEEConference on Computer Vision and Pattern Recognition, vol. 1,2000, pp. 444–451.
Ma, B., Harbaugh, R.E., Raghavan, M.L., 2004. Three-dimensionalgeometrical characterization of cerebral aneurysms. Ann. Biomed.Eng. 32, 264–273.
Manniesing, R., Velthuis, B.K., van Leeuwen, M.S., van der Schaaf, I.C.,van Laar, P.J., Niessen, W.J., 2006. Level set based cerebral vascu-lature segmentation and diameter quantification in CT angiography.Med. Image Anal. 10, 200–214.
Ordas, S., Boisrobert, L., Huguet, M., Frangi, A., 2003. Cardiac mrisegmentation using 2d-asm with optimal invariant features. In: IEEEComputers in Cardiology, vol. 30, pp. 633–636.
Osher, S., Fedkiw, R.P., 2002. Level Set Methods and Dynamic ImplicitSurfaces. Springer-Verlag.
Osher, S., Sethian, J.A., 1988. Fronts propagating with curvature-dependent speed: Algorithms based on Hamilton–Jacobi formulations.J. Comput. Phys. 79, 12–49.
Paragios, N., 2000. Geodesic active regions and level set methods:contributions and applications in artificial vision. Ph.D. thesis,University of Nice Sophia-Antipolis, France.
Parzen, E., 1962. On estimation of a probability density function andmode. Ann. Math. Stat. 33, 1065–1976.
Pichon, E., Tannenbaum, A., Kikinis, R., 2004. A statistically based flowfor image segmentation. Med. Image Anal. 8, 267–274.
Raaymakers, T.W., Rinkel, G.J., Limburg, M., Algra, A., 1998. Mortalityand morbidity of surgery for unruptured intracranial aneurysms: ameta-analysis. Stroke 29 (8), 1531–1538.
Raghavan, M.L., Ma, B., Harbaugh, R.E., 2005. Quantified aneurysmshape and aneurysm rupture. J. Neruosurg. 102 (2), 355–362.
Raya, S.P., Udupa, J.K., 1990. Shape-based interpolation of multidimen-sional objects. IEEE Trans. Image Process. 9 (1), 32–42.
Rohde, S., Lahmann, K., Beck, J., Nafe, R., Yan, B., Raabe, A.,Berkefeld, J., 2005. Fourier analysis of intracranial aneurysms:towards an objective and quantitative evaluation of the shape ofaneurysms. Neuroradiology 47 (2), 121–126.
ter Haar Romeny, B.M., Florack, L.M.J., Koenderink, J.J., Viergever,M.A., 1992. Scale-space: its natural operators and differential invar-iants. Information Processing in Medical Imaging. In: Lecture Notes inComputer Science (LNCS), vol. 511. Springer-Verlag, Berlin, Ger-many, pp. 239–255.
Rousson, M., Brox, T., Deriche, R., 2003. Active unsupervised texturesegmentation on a diffusion based feature space. IEEE Comput. Vis.Pattern Recognit.
Somol, P., Pudil, P., Novovicova, J., Paclik, P., 1999. Adaptive floatingsearch methods in feature selection. Pattern Recogn. Lett. 20, 1157–1163.
van Bemmel, C.M., Spreeuwers, L.J., Viergever, M.A., Niessen, W.J.,2003. Level-set-based artery-vein separation in blood pool agentCE-MR angiograms. IEEE Trans. Med. Imaging 22 (10), 1224–1234.

M. Hernandez, A.F. Frangi / Medical Image Analysis 11 (2007) 224–241 241
van Ginneken, B., Frangi, A.F., Staal, J.J., ter Haar Romeny, B.M.,Viergever, M.A., 2002. Active shape model segmentation with optimalfeatures. IEEE Trans. Med. Imaging 21 (8), 924–933.
Vapnik, V.N., 1998. Statistical Learning Theory. J. Wiley.Vese, L.A., Chan, T.F., 2002. A multiphase level set framework for image
segmentation using the Mumford and Shah model. Int. J. Comput.Vision 50 (3), 271–293.
Volkau, I., Weili, Z., Baimouratov, R., Aziz, A., Nowinski, W.L., 2005.Geometric modeling of the human normal cerebral arterial system.IEEE Trans. Med. Imaging 24 (4), 529–539.
Wardlaw, J.M., White, P.M., 2000. The detection and management ofunruptured intracranial aneurysms. Brain 123, 205–221.
Wiebers, D., 2003. Unruptured intracranial aneurysms: natural history,clinical outcome, and risks of surgical and endovascular treatment.Lancet 362 (9378), 103–110.
Wilson, D.L., Noble, J.A., 1999. An adaptive segmentation algorithm fortime-of-flight MRA data. IEEE Trans. Med. Imaging 18 (10), 938–945.
Wink, O., Niessen, W.J., Viergever, M.A., 2004. Multiscale vesseltracking. IEEE Trans. Med. Imaging 23 (1), 130–133.
Winn, H.R., Jane, J.A., Taylor, J., Kaiser, D., Britz, G.W., 2002.Prevalence of asymptomatic incidental aneurysms: review of 4568arteriograms. J. Neruosurg. 97 (1), 240.
Yan, P., Kassim, A.A., 2006. Segmentation of volumetric MRA images byusing capillary active contour. Med. Image Anal. 10 (3), 317–329.
Yezzi, A., Tsai, A., Willsky, A., 1999. A statistical approach to snakes forbimodal and trimodal imagery. In: Proceedings of the Seventh IEEEInternational Conference on Computer Vision, vol. 2, 1999, pp. 898–903.
Yim, P.J., Cebral, J.R., Mullick, R., Marcos, H.B., Choyke, P.L., 2001.Vessel surface reconstruction with a tubular deformable model. IEEETrans. Med. Imaging 20 (12), 1411–1421.
Yushkevich, P.A., Piven, J., Cody, H., Ho, S., Gee, J.C., Gerig, G., 2005.User-guided level set segmentation of anatomical structures with ITK-SNAP. Insight J. 1 (special issue on ISC/NA-MIC/MICCAI Work-shop on Open-Source Software).
Zhu, S.C., Yuille, A., 1996. Region competition: unifying snakes, regiongrowing, and Bayes/MDL for multiband image segmentation. IEEETrans. Pattern Anal. Mach. Intell. 18 (9), 884–900.
Zijdenbos, A., Dawant, B., Margolin, R., 1994. Morphometric analysis ofwhite matter lesions in MR images: method and validation. IEEETrans. Med. Imaging 13 (4), 716–724.
Zou, K.H., Warfield, S.K., 2004. Statistical validation of image segmen-tation quality based on a spatial overlap index. Acad. Radiol. 11 (2),178–189.