Rotational Equilibrium & Dynamics 8-2: Equilibrium & Center of Mass.
Contemporary Engineering Sciences, Vol. 2, 2009, no. 6, 283 - 298
Non-Equilibrium Molecular Dynamics
Investigation of Parameters Affecting Planar
Nanochannel Flows
F. Sofos, T. E. Karakasidis and A. Liakopoulos
Hydromechanics and Environmental Engineering Laboratory, School of Engineering, University of Thessaly, 38834 Pedion Areos, Volos, Greece
[email protected], [email protected], [email protected]
Abstract
We present non-equilibrium molecular dynamics simulations of planar Poiseuille flow of liquid argon. Density, velocity, temperature and strain rate profiles across the channel are investigated for channels of width in the range 0.9-17.1nm. In channels of small width (0.9-2nm) the fluid is fully ordered in distinct layers. This ordering persists close to the walls even for wider channels and it is further affected by wall/fluid interaction characteristics while the fluid becomes homogeneous in the central part of the channel. Non-homogeneity in the central part of wider channels is observed only for low average fluid density. Fluid velocity can be successfully fitted by parabolas as system temperature, the magnitude of the external force and channel width increase or when the average fluid density decreases. Temperature distribution across the channel is uniform for fluid strain rates below a critical value. Keywords: nanochannel flow, Poiseuille flow, non-equilibrium molecular dynamics. 1 Introduction
Scaling down components and systems to the nanoscale has been the key of evolution in many fields of science and technology in the past decade. Nanotechnology brought within reach the vision of building up systems and structures from atoms and molecules via nano-particles, nano-tubes, and nano-layers. Within the field of nanotechnology, nanofluidics has emerged as an
284 F. Sofos, T. E. Karakasidis and A. Liakopoulos important subfield with applications primarily in the area of biomedical and environmental science and technology. For example, moving minute amounts of fluids at a controlled rate is of great interest in the medical field and presents a challenge in technological terms. In meeting these challenges, experimental studies and fabrication techniques are important but, obviously, studying devices and materials on the smallest possible scale with reliable simulation techniques can provide a useful insight on phenomena that could not be studied experimentally [9].
For systems in equilibrium, molecular dynamics (MD) has emerged as the dominant simulation technique at the atomic scale. The main idea behind classical MD is the calculation of the interactions between atoms and the solution of Newton’s equations of motion for each particle in order to extract thermodynamic properties, such as pressure and transport properties, like shear viscosity, bulk viscosity, thermal conductivity, etc. [19]. In addition, MD serves as a complement to experiment, since it is a reliable means of tracking the microscopic phenomena taking place at the atomic level. For atomic systems far from equilibrium, such as liquid flows, non-equilibrium molecular dynamics (NEMD) offers an effective simulation method as well as an alternative method for the calculation of transport properties of liquids [7]. During recent years, NEMD techniques have dominated the field of nano-fluidics simulations [14].
Passing from the microscopic to the macroscopic methods of analysis presents fundamental conceptual, methodological and practical difficulties. Classical non-relativistic fluid dynamics and heat transfer are based on the continuum assumption, the assumption of local thermodynamic equilibrium, and the associated conservation laws of mass, momentum and energy. For Newtonian fluids the conservation of momentum principle coupled with a linear constitutive law, where stresses are linear functions of the rate of strain, lead to the Navier-Stokes equations. If any of those “built-in” assumptions breaks down, a deviation between atomistic simulation results and continuum theory predictions will emerge [17-18].
Within both frameworks (atomistic and macroscopic), simulation of planar Poiseuille flow presents probably the best “vehicle” for establishing the range of applicability of continuum-based theories. Researchers have thoroughly dealt with the question whether the classical Navier-Stokes equations are valid in channels of small widths. Density profiles reveal strong oscillations in the number of fluid atoms at layers adjacent to the walls. There exists inhomogeneity of the fluid in the channel, which is not accounted for in the classical hydrodynamics treatment of Poiseuille flow. Travis et al. [16], Travis and Gubbins [17], and, more recently, Hansen and Ottesen [13], note that Navier-Stokes hydrodynamic prediction for the velocity profile breaks down at small channel widths below 5.1 molecular diameters (σ is the length scale parameter and is about 1.5nm for liquid argon). Karniadakis et al [9] gave an excellent review on density and velocity profiles and how they are affected by wall-fluid interaction, the structure of the walls, and the channel width. Somers and Davis [22] presented an early full analysis of density and velocity profiles for channel widths from 2.0σ to 8.0σ (0.6nm to 2.35nm). A number of more recent publications [1, 6, 15-16, 24] provide detailed studies of
Non-equilibrium molecular dynamics 285 density and velocity profiles at various temperatures, densities and levels of external driving forces for channel widths from 4.0σ to 100.0σ (1.2nm to 30nm).
Another critical aspect in nano- and micro-flows is the existence or not of slip at the solid boundary. Koplik et al. [12] made one of the first attempts to study molecular slip with NEMD while Hansen and Ottesen [13], Heinbuch and Fischer [24], and Galea and Attard [23], concluded that the no-slip condition breaks down in small channel widths. Interesting aspects of the problem arise in examining how the wall structure affects velocity slip. Wall roughness and interface wettability of the walls are examined in [2, 8, 23].
Temperature profiles in NEMD simulations of channel flow show a deviation from the continuum-theory predictions, i.e., uniform profile when viscous dissipation is negligible and quartic profile when viscous dissipation is accounted for. Todd and Evans [4] use a quartic plus a quadratic term in order to fit temperature profiles obtained by NEMD simulation. Akhmatskaya et al. [6] extract the temperature profile for channel width of 5.1σ (≈1.5nm). Near the walls, they report a rise in temperature and in the middle of the channel fluid temperature is constant, though higher than the wall temperature. In [9] temperature exhibits a jump at layers adjacent to the walls. This jump is steeper at higher external force values. This phenomenon takes place because atoms near the walls encounter great changes in kinetic energy due to the thermostat applied to the walls. Nagayama and Cheng [8] have also found profiles with a rise in temperature values near the walls where for high external applied forces the profiles have an M-shape. Delhommele and Evans [10] extract the temperature profile for a 4.0σ-wide ideal atomic system and find a flat profile for two different external applied forces, while the same authors in [11] present flat temperature profiles in simulations of real fluids, such as ethane and methane, in a 10.2σ (≈3.0nm) channel.
The detailed investigation and categorization of all possible parameters that affect nano-flow phenomena is of particular interest. At the atomic scale, the effect of wall on fluid atoms is strong and the continuum theory breaks down. In this work, we examine the flow properties of a simple liquid, argon, at channel widths that extend from 0.9nm to 17.1nm. For each channel, we examined three distinct cases of system temperature, external forces of various magnitude, various values that characterize wall stiffness and wall/fluid interaction and various average fluid density values in order to understand their effect on density, streaming velocity, strain rate and temperature profiles. Mean pressure is kept constant in every channel under examination and carefully selected Nosé-Hoover thermostats are invoked for the wall atoms in order to keep the average temperature across the channel constant.
The paper is organized as follows. In section 2 details on the molecular system modeled are presented. Results are shown and discussed in section 3, and section 4 contains concluding remarks. 2 Molecular system modeling
The Non-Equilibrium Molecular Dynamics (NEMD) technique is used to simulate planar Poiseuille flow of liquid argon. The geometry of the system under
286 F. Sofos, T. E. Karakasidis and A. Liakopoulos examination is presented schematically in Figure 1. The walls consist of two atomic layers arranged on fcc lattice. We have also employed three-layer fcc wall models (which demand more simulation time) and we obtained the same results. Atomic interactions (liquid/liquid, solid/solid, liquid/solid) are described by Lennard-Jones 12-6 type potentials ))r(σ)rε((σ)(ru ijijij
LJ 6124 // −= (1)
with parameters σ = 0.3405 nm and fluid Bkε = 119.8 Κ (argon parameters). We examine various wall/fluid interactions in order to report on the effect of wall interaction of fluid parameters ( wall fluidε ε =1.2, wall fluidε ε =1.0 and
wall fluidε ε =0.75). The cut-off radius for the LJ potential in all simulations is rc=2.5σ.
The mean fluid density is kept constant ρ=1078 3kg m , or, ρ*=0.642 3−σ (number of fluid atoms fN = 576) in all simulations, but we also examine cases where ρ*=0.481 ( fN = 432) and ρ*=0.321 ( fN = 288). Details on the geometric system characteristics for the various cases studied are summarized in Table 1. Dimensions Lx and Ly (Lx=Ly=3.615 nm) and the number of wall atoms ( wN = 288) are kept constant.
Wall atoms are kept bound around their original fcc lattice positions by an elastic spring force ( ( ) )eqK t= − −F r r , where r(t) is the position vector of an atom at time t, req is its initial lattice position vector and K is the spring constant. In this work we used K = 57.15, 150 and 500 2ε σ . Periodic boundary conditions are used along the x- and y- directions.
An external driving force extF , ranging from 0.018 to 3.6 pN, is applied along the x- direction to every fluid particle during the simulation. The wall atoms absorb the increase in kinetic energy of the fluid atoms, which is caused by the application of the external force. Nosé-Hoover thermostats at the thermal walls are applied in order to keep the system’s temperature constant. Evans and Holian [5] and Holian and Voter [3] provide a detailed description of the use of Nosé-Hoover thermostats. We employ two independent thermostats one for the upper wall and another for the lower wall in order to achieve better thermalisation of the wall atoms.
It should be noted that the external applied force induces an amount of energy to the system, which may lead to non-linearities. Binder et al. [14] in a detailed review of EMD and NEMD techniques explain why one can’t use large external driving forces in nano-flow simulations. As the force magnitude increases, the flow becomes too fast, the system’s response becomes non-linear and strong temperature variations appear. In addition, the flow reaches non-linearities if one keeps the force constant and simply increases the channel width. For this reason, the amplitudes of the external applied forces vary in this work, depending on the width of the channel under examination.
Non-equilibrium molecular dynamics 287 The simulation step for the system is 10-2 ps. In the beginning, fluid atoms
are located on fcc sites. Atoms are given appropriate initial velocities in order to reach the desired temperature. The system reaches equilibrium state after a run of 2x10⁶ time steps. Then, NEMD simulations are performed with duration of 2x10⁵ time steps. 3 Results and discussion
In order to compute the number density, streaming velocity, strain rate and temperature profiles, the channel is divided into n bins along the z-direction, each one of volume Lx x Ly x (h/n). The instantaneous fluid number density is expressed as the number of atoms located in each bin at a specific time step. This number of atoms is averaged over the total simulation time and a time-averaged value for each bin is extracted. To extract the streaming velocity profiles, mean velocity is computed at each bin for each time step and all these values are averaged. Parabolic fits are applied to velocity profiles and they are used in the extraction of the respective strain rate profiles. Temperature values are also averaged in time in each bin and they are used to construct the temperature profile across the channel. 3.1 Density profiles
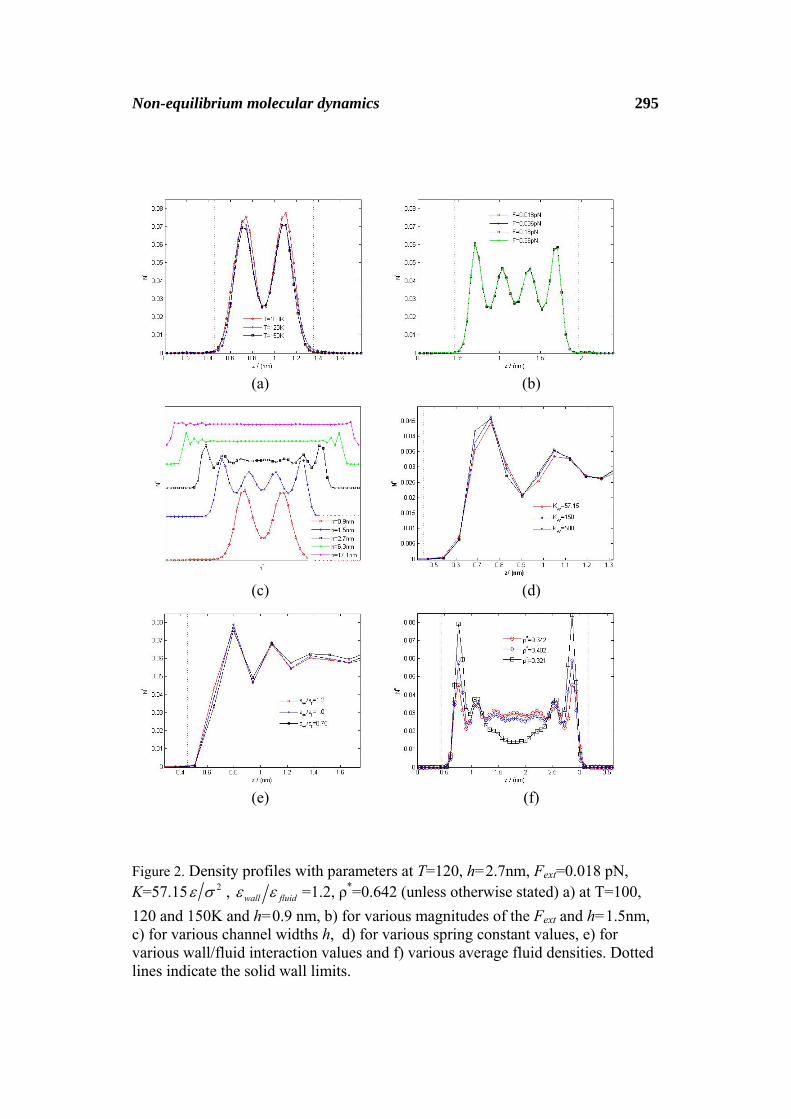
We examine the effect of temperature on density profile in Figure 2(a). For h=0.9 nm, we observe that fluid atoms are ordered in two distinct layers, symmetrical with respect to the midplane of the channel. The positions of the peaks in number density are equidistant, at about 1σ, from each other and from the innermost solid wall density peak. The fluid density peak value decreases as temperature increases. Similar ordering in the fluid has been reported in [22] in channels of width of 2.5 and 2.75σ (0.73nm and 0.8nm, respectively).
The effect of the magnitude of the external applied force is summarized in Figure 2(b). Four peaks are developed in the number density profile at distances of about 1σ (1.3nm) from each other and neither their width nor their strength is affected by a change in the magnitude of the external driving force, at least in the range studied in the present work. This is in agreement with the results reported in [8].
In Figure 2(c) we examine the effect of channel width, h, on density profile. In small channels (1.0 ~< h ~< 5nm) the strong influence of the walls extents over all or most of the fluid atoms and this fact results in oscillations on the density profile. It is clear that as h increases (5.0 ~< h ~< 50nm) homogeneity is induced in the interior of the channel, while there is always a region of fluid non-homogeneity for about 1-1.5σ from each wall. As channel dimensions increase, this non-homogeneity region becomes non-significant, i.e., for h=50nm the non-homogeneity region is only 4-6% of the available channel width.
The wall spring constant K is also a parameter that affects fluid ordering. The value of the spring constant is an indication of wall atoms stiffness, i.e., the walls become stiffer when K value is greater. As a result, wall atoms oscillate in a
288 F. Sofos, T. E. Karakasidis and A. Liakopoulos greater way around their equilibrium positions when K is smaller. In the zoomed diagram of Figure 2(d) near the lower channel wall we obtain a fluid atoms peak on the density profile on the left, followed by one peak of smaller amplitude until the profile becomes homogeneous near the channel centerline (see Figure 2(c) for h=2.7 nm). We observe that the leftmost density peak is broader and of smaller amplitude as K decreases, as also found in [20], and we attribute this to the fact that, at smaller K values, wall atoms oscillate more and fluid atoms are more possible to approach closer to the walls.
We examine the effect of various wall/fluid interactions wall fluidε ε on density profile in Figure 2(e). As the ratio wall fluidε ε increases, fluid atoms are attracted to the walls and wall surface becomes hydrophilic, while as wall fluidε ε decreases, fluid atoms are less attracted to the walls and wall surface becomes hydrophobic [21]. The resulting density profiles present a peak on the left which approaches closer to the wall when wall fluidε ε =1.2 (hydrophilic), compared to
wall fluidε ε =1.0 or 0.75 (hydrophobic). Average fluid density also affects fluid ordering in a significant way (Figure
2(f)). We observe that as average fluid density decreases, the amplitudes of the leftmost and the rightmost peaks at the density profile increase significantly and fluid atoms are ordered near the walls. Moreover, for ρ*= 0.321 (the smaller density value studied, where Nf=288) there exists strong inhomogeneity in the interior of the channel, while homogeneity is induced for ρ*= 0.642 (Nf=576) and ρ*= 0.481 (Nf=432). It seems that for ρ*= 0.321 fluid atoms are attracted by the wall atoms and tend to “stick” close to the walls, as there do not encounter strong attractive forces from other fluid atoms. On the contrary, for ρ*= 0.642 there is a significant number of fluid atoms in the channel that interact with each other and this fact helps them spread over the whole extend of the channel.
Having studied all parameters (T, Fext, K, wall fluidε ε and ρ*) for every channel width h, (we have examined all cases, but we do not present all diagrams here) we come to the conclusion that every parameter has a different impact on the density profile. In general, for a given h, an increase in system temperature leads to smoother density profiles, the effect of Fext is negligible and a decrease in average fluid density results in an increase of fluid inhomogeneity. On the other hand, the wall spring constant K and the ratio wall fluidε ε affect only channels of
smaller widths (h ~< 5nm). For h ~> 5nm, the effect of these two parameters extends only in a small region close to the walls (about 1-1.5σ) and is negligible in the remaining of the channel.
3.2 Velocity profiles
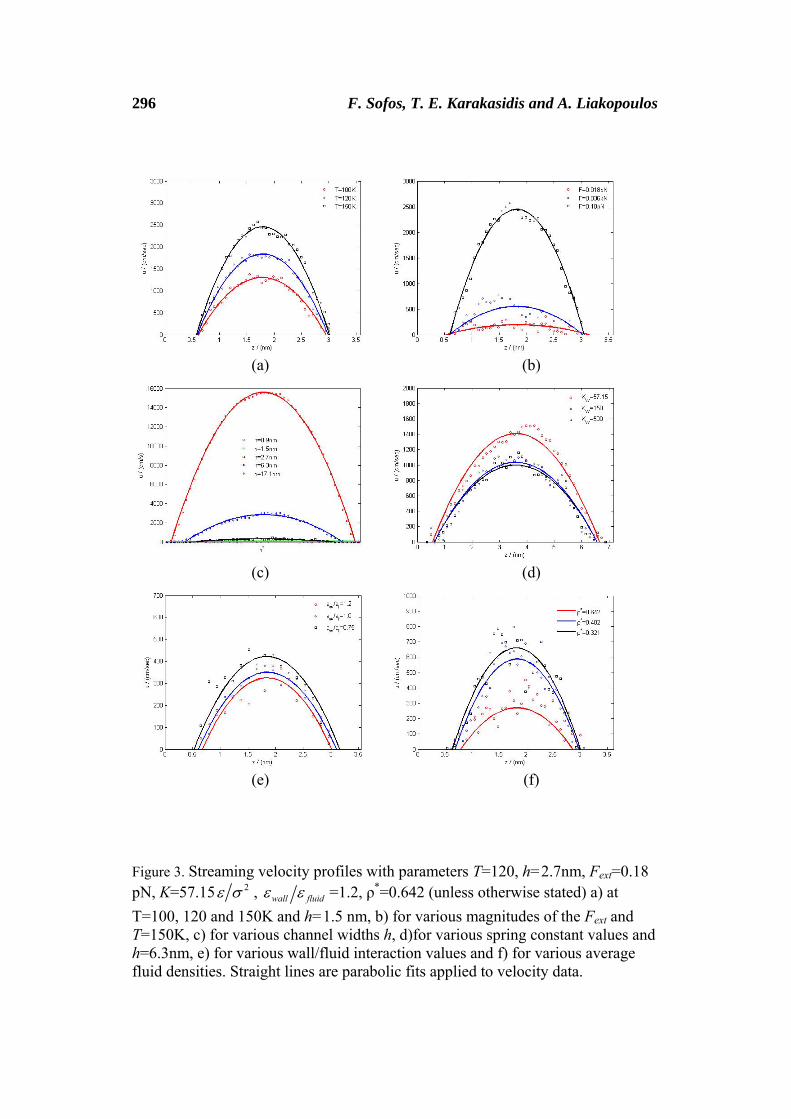
The effect of temperature on streaming velocity profile for the h=2.7nm channel is shown in Figure 3(a), where it is obvious that an increase in temperature results in an increase on fluid mobility and, as a result, in maximum and average velocity values. An increase in Fext is also a parameter that can increase maximum and average velocity values (Figure 3(b)).
Non-equilibrium molecular dynamics 289 In order to compare velocity behavior as a function of the channel width,
we present the velocity profiles of Figure 3(c) for the same T, Fext, K, wall fluidε ε , ρ* and rc. It is of interest to notice that for the same magnitude of the external force, we obtain velocity values close to zero for h=1-2nm and, in contradistinction, close to 16000 cm/s for h=17.1nm. We remind here that as the height of the channel increases, the number of fluid atoms increases proportionally, and given that Fext is applied to every fluid particle individually, we have a huge amount of energy induced in the h=17.1nm channel and this fact results in the large velocity difference between the two channels. Moreover, as shown in the density profiles (Figure 2(c)), the effect of channel walls is significant at h=0.9nm and negligible at h=17.1nm and this is a factor that also affects velocity values inside the nano-channels (small velocities at small channel widths).
As far as the value of the spring constant K is concerned, we observe (Figure 3(d)) that greater velocity values are obtained when K=57.15 2ε σ (less stiff walls) compared to K=150 and 500 2ε σ . Moreover, the velocity profile is quite similar at K=150 and 500 2ε σ . It seems that as walls become stiffer, velocity values are no longer affected by the spring constant. On the other hand, when wall/fluid interaction wall fluidε ε decreases, greater velocity values are obtained on the velocity profile (Figure 3(e)). This fact reveals that at hydrophilic surfaces ( wall fluidε ε =1.2), maximum and mean velocity values are smaller compared to hydrophobic surfaces ( wall fluidε ε =1.0 or 0.75) and this is consistent with [8].
Increased velocity values are also observed when average fluid density decreases (Figure 3(f)). This can be explained by the fact that in low densities, fluid atoms present increased mobility due to the available channel space and the reduced repulsive forces they encounter from the small number of other fluid atoms. In high densities, velocity values are smaller as fluid atoms movement is more possible to be obstructed from the simultaneous movement of their neighboring fluid atoms.
Straight lines in Figs. 3(a-f) are parabolic fits applied to streaming velocity data. Parabolic fits are not very successful when h<2nm, where, as we have seen from the respective density profiles, the fluid is strongly homogeneous and the continuum theory breaks down [13, 15-16], but they seem satisfying for h>2nm. However, when the magnitude of the Fext increases significantly we obtain satisfying parabolic fits even when h<2nm.
To summarize, fluid streaming velocity values increase in channels of all widths when T and Fext increase and ρ* decreases. Channel width is the dominant parameter that affects the shape of the profile, while the effect of K and wall fluidε ε
is significant only in channels of small width (h ~< 5nm) and is negligible for
h ~> 5nm. This is consistent with the results taken from the previous section
290 F. Sofos, T. E. Karakasidis and A. Liakopoulos (density profiles) since we have seen that K and wall fluidε ε affect only a narrow
region close to the walls for h ~> 5nm and not the remaining channel regions. 3.3 Strain rate
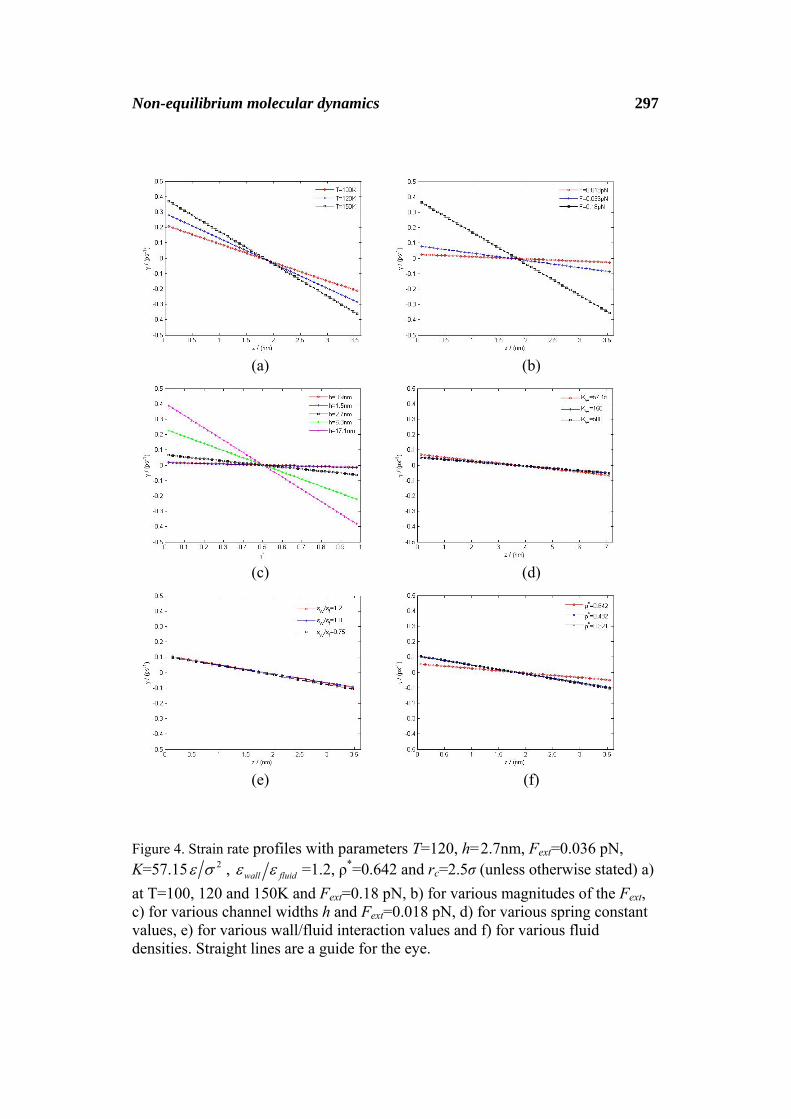
The strain rate γ for planar Poiseuille flow is given by ( )xdu z dzγ = and it
is expected to be a linear function of z, since we have seen that parabolic fits to all velocity profiles are obtained [15]. Parabolic fits for h<2nm, as mentioned in the velocity profiles section, are accurate within statistical errors.
An increase in temperature results in an increase in the respective strain rate profiles, as shown in Figure 4(a). Significant is the effect of an increase in the magnitude of Fext (Figure 4(b)) where we observe that the strain rate is high when Fext=0.18 pN and this is an indication that non-linear phenomena have been induced in the system. Strain rate profiles are not significantly affected when the spring constant K varies from 57.15 to 500 2ε σ (Figure 4(d)), when wall/fluid interaction ratio wall fluidε ε varies from 0.75 to 1.2 (Figure 4(e)) and when the LJ cut-off radius rc varies from 2.5 to 3.5 (Figure 4(f)). However, we obtain increased strain rates as the average fluid density increases (Figure 4(g)), since in lower densities we observed greater velocity values (see Figure 4(e)).
It is of interest to report on strain rate profiles as a function of channel width (Figure 4(c)) for the same T, Fext, K and wall fluidε ε . We observe that strain rates are close to zero for 0<h<10nm, but increase significantly at h=6.3 and 17.1 nm. As we have seen in the velocity section before, as Fext is applied to every fluid particle individually, we have a huge amount of energy induced in the h=17.1nm channel compared to the h=0.9nm channel.
Strain rate profiles, since they are extracted from the respective velocity profiles, they are also affected by the same parameters (as shown in the previous section). Thus, strain rates increase when T and Fext increase and ρ* decreases, while the effect of K and wall fluidε ε is significant only in channels of small width
(h ~< 5nm) and are negligible for h ~> 5nm. 3.4 Temperature profile
Temperature is calculated in each bin across the channel using
3
2n,i
1 1
(v v )3
binNAr
bin in ibin B
mTN k = =
= −∑∑(2)
where, binN is the number of fluid atoms in the bin examined, i=1,2,3 denotes the x,y,z component of the atomic velocity ,vn i , vi is the ith component of the mean macroflow velocity, Bk is the Boltzman constant, and Arm is argon atom mass.
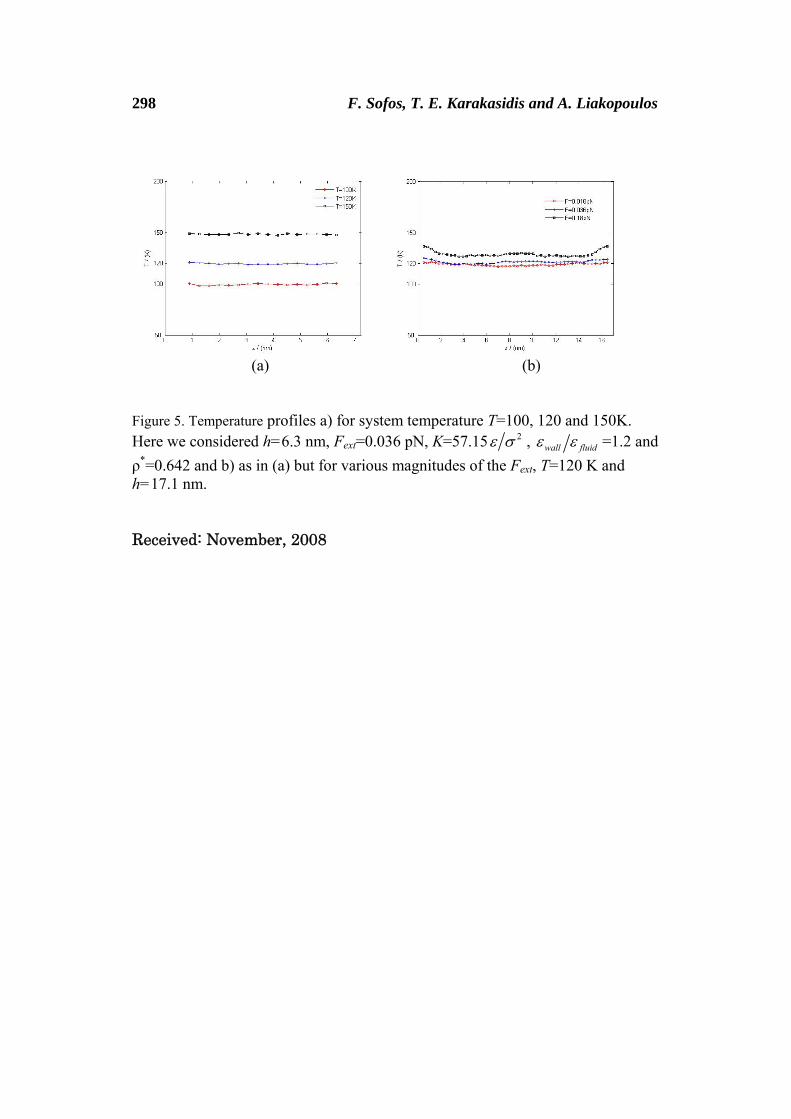
Non-equilibrium molecular dynamics 291 In Figure 5(a), the calculated fluid temperature distribution for h=6.3nm is
presented. We can see that for each system temperature (the temperature value imposed at the wall’s thermostats, 100, 120, or 150K), the temperature profile is approximately flat at this temperature value. We obtain similar flat behavior when we vary system parameters such as channel width h, the wall atoms spring constant K, the wall/fluid interaction ratio wall fluidε ε and the average fluid density ρ*. However, in Figure 5(b), for h=17.1nm and external forces above 0.036 pN, temperature profiles are not uniform and show a rise in the middle of the channel and near the solid walls. Similar behavior is reported on [8] when the external force that drives the flow becomes large. We attribute this behaviour to the fact that at large channel widths, in combination with external forces of large magnitude, strain rates inside the nanochannel increase (as shown in the previous section) and the system has non-linear response.
4 Conclusions We have presented non-equilibrium molecular dynamics simulations of
planar Poiseuille nano-flow of liquid argon. Channel walls are maintained at constant temperature by the use of appropriate Nosé-Hoover thermostats. The effect of system temperature, applied driving force, wall spring constant, wall/fluid interaction ratio and average fluid density on the distribution of fluid density, velocity, strain rate and temperature across the channel is studied for channel width, h, in the range 0.9nm-17.1nm. The results show that when downsizing to the nanoworld the influence of parameters as the ones mentioned above becomes important, leading to behavior different than expected from continuum theory.
The fluid is ordered in distinct layers for h ~< 2nm. For h ~> 2nm density profiles are uniform in most of the inner channel area but ordering persists very close to the wall (at distances about 1σ) even for the h=17.1nm channel. When system temperature increases, the amplitude of the oscillations in the density profile diminishes and tends to a constant value, especially in the middle layers. The magnitude of the external applied force that drives the flow has no significant effect on fluid ordering, at least in the range studied here. The effect of wall stiffness (the value of the wall spring constant K) is important for small channel widths, where we observe that as K decreases, fluid atoms approach closer to the wall layer. As the channel width increases, this effect is negligible, at least in the range of K values studied here. For greater wall/fluid interaction (hydrophilic surfaces) fluid atoms also approach closer to the wall limit compared to an hydrophobic surface (small wall/fluid interaction), and this effect is also minimized in channels of width h ~> 5nm. More fluid atoms are ordered near the walls when average fluid density decreases for every h studied.
Velocity profiles are significantly affected by system temperature, the magnitude of the external driving force and the average fluid density for every h studied, while they are slightly affected by the value of the wall spring constant
292 F. Sofos, T. E. Karakasidis and A. Liakopoulos and the wall/fluid interaction ratio for h ~> 5nm. Parabolic fits for the velocity profiles can be accomplished for channel widths h>2nm and for a great range of external forces, while in smaller channel widths (h<2nm) velocity profiles show deviation from the parabolic behavior expected by continuum theory and can be parabolically fitted only when driving forces of large magnitude (above 0.36 pN) are applied to the system. The application of high-magnitude forces, however, induces system non-linearities, as shown by the strain rate profiles presented. Strain rates are also significantly affected by the increase of the channel width.
As far as temperature profiles are concerned, uniform temperature profiles are maintained across the channels in most cases studied in this work. Deviations from uniformity are observed only in greater channel widths (h=17.1nm) when the external forces applied are of greater magnitude (above 0.036 pN), where strong non-llinearities are present (as was shown by the respective strain rate profile).
The atomistic model presented in this work seems capable of reproducing the Poiseuille nano-flow characteristics. Channel width seems to be the conquering parameter that affects nano-flows, while the contribution of other parameters (such as temperature, external forces, fluid density, wall stiffness, wall/fluid interaction) is not negligible at the nanoscale. These parameters may not be taken into account at the macroscale, but their effect should be beared in mind on the investigation and the design of nanofluidic systems.
Acknowledgement. This research project (PENED) is co-financed by E.U.-European Social Fund (75%) and the Greek Ministry of Development-GSRT (25%). References [1] A.S. Ziarani and A.A. Mohammad, A molecular dynamics study of
perturbed Poiseuille flow in a nanochannel, Microfluidic Nanofluidic, 2 (2005), 12-20.
[2] A.S. Ziarani and A.A. Mohammad, Molecular dynamics study of velocity slip in microchannels, Proceedings of the 17th IASTED International Conference Modelling and Simulation, Montreal, Canada, 2006.
[3] B. L. Holian and A. F. Voter, Thermostatted molecular dynamics: How to avoid the Toda demon hidden in Nosé-Hoover dynamics, Physical Review E, 52 (1995), 2338-2347.
[4] B.D. Todd and D.J. Evans, Temperature profile for Poiseuille flow, Physical Review E, 55 (1997), 2800-2807.
[5] D.J. Evans and B.L. Holian, The Nosé-Hoover thermostat, Journal of Chemical Physics, 83 (1985), 4069-4074.
[6] E. Akhmatskaya, B D. Todd, P.J. Daivis, D.J. Evans, K.E. Gubbins, and L. A. Pozhar, A study of viscosity inhomogeneity in porous media, Journal of Chemical Physics, 106 (1997), 4684-4695.
Non-equilibrium molecular dynamics 293 [7] F. Sofos, Τ.E. Karakasidis, and A. Liakopoulos, Transport properties of
liquid argon in krypton nanochannels: Anisotropy and non-homogeneity introduced by the solid walls, International Journal of Heat & Mass Transfer, 52 (2009), 735-743.
[8] G. Nagayama and P. Cheng, Effects of interface wettability on microscale flow by molecular dynamics simulation, International Journal of Heat and Mass Transfer, 47 (2004), 501-513.
[9] G.E. Karniadakis, A. Beskok, and N. Aluru, Microflows and Nanoflows: Fundamentals and Simulation, Springer, New York, 2002.
[10] J. Delhommele and D.J. Evans, Configurational temperature profile in confined liquids. I. Atomic fluid, Journal of Chemical Physics, 114 (2001), 6229-6235.
[11] J. Delhommele and D.J. Evans, Configurational temperature profile in confined liquids. II. Molecular fluids, Journal of Chemical Physics 114 (2001), 6236-6241.
[12] J. Koplik, J.R. Banavar, and J.F. Willemsen, Molecular dynamics of fluid flow at solid surfaces, Physics of Fluids A, 1 (1989), 781-794.
[13] J.S. Hansen and J.T. Ottesen, Molecular dynamics simulations of oscillatory flows in microfluidic channels, Microfluidic Nanofluidic, 2 (2006), 301-307.
[14] K. Binder, J. Horbach, W. Kob, W. Paul, and F. Varnik, Molecular dynamics simulations, Journal of Physics: Condensed Matter, 16 (2004), 429-453.
[15] K.P. Travis and K.E. Gubbins, Poiseuille flow of Lennard-Jones fluids in narrow slit pores, Journal of Chemical Physics, 112 (2000), 1984-1994.
[16] K.P. Travis, B.D. Todd, and D.J. Evans, Departure from Navier-Stokes hydrodynamics in confined liquids, Physical Review E, 55 (1997), 4288-4295.
[17] M. Gad-el-Hak, Gas and liquid transport at the microscale, Heat Transfer Engineering 27, 4 (2006), 13-29.
[18] M. Gad-el-Hak, Liquids: The holy grail of microfluidic modeling, Physics of Fluids, 17 (2005), 100612.
[19] M.P. Allen and T.J. Tildesley, Computer Simulation of Liquids, Clarendon Press, Oxford, 1987.
[20] N.V. Priezjev, Effect of surface roughness on rate-dependent slip in simple fluids, Journal of Chemical Physics, 127 (2007), 144708.
[21] R.S. Voronov, D.V. Papavassiliou, and L.L. Lee, Boundary slip and wetting properties of interfaces: Correlation of the contact angle with the slip length, Journal of Chemical Physics, 124 (2006), 204701.
[22] S.A. Somers and H.T. Davis, Microscopic dynamics of fluids confined between smooth and atomically structured solid surfaces, Journal of Chemical Physics, 96 (1991), 5389-5407.
[23] T.M. Galea and P. Attard, Molecular dynamics study of the effect of atomic roughness on the slip length at the fluid-solid boundary during shear flow, Langmuir, 20 (2004), 3477-3482.
[24] U. Heinbuch and J. Fischer, Liquid flow in pores: Slip, no-slip, or multilayer sticking, Physical Review A, 40 (1989), 1144-1146.
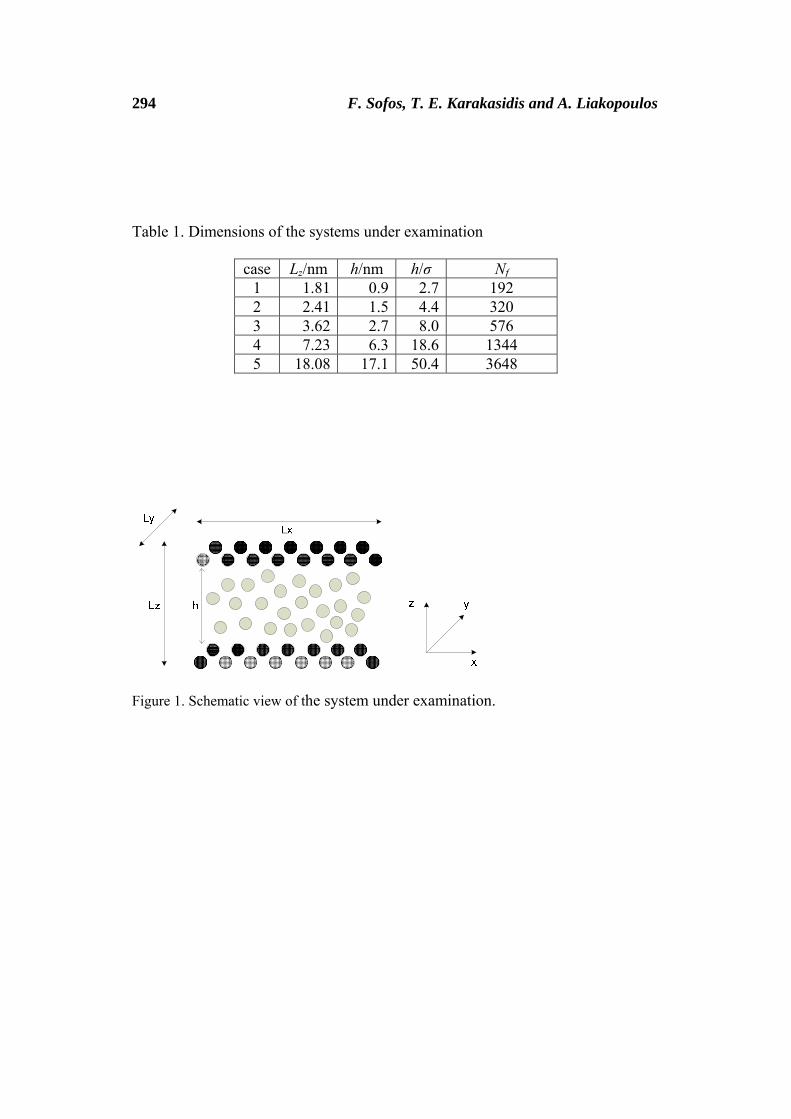
294 F. Sofos, T. E. Karakasidis and A. Liakopoulos Table 1. Dimensions of the systems under examination
case Lz/nm h/nm h/σ Nf 1 1.81 0.9 2.7 192 2 2.41 1.5 4.4 320 3 3.62 2.7 8.0 576 4 7.23 6.3 18.6 1344 5 18.08 17.1 50.4 3648
Figure 1. Schematic view of the system under examination.
Non-equilibrium molecular dynamics 295
(a) (b)
(c) (d)
(e) (f)
Figure 2. Density profiles with parameters at T=120, h=2.7nm, Fext=0.018 pN, K=57.15 2ε σ , wall fluidε ε =1.2, ρ*=0.642 (unless otherwise stated) a) at T=100, 120 and 150K and h=0.9 nm, b) for various magnitudes of the Fext and h=1.5nm, c) for various channel widths h, d) for various spring constant values, e) for various wall/fluid interaction values and f) various average fluid densities. Dotted lines indicate the solid wall limits.
296 F. Sofos, T. E. Karakasidis and A. Liakopoulos
(a) (b)
(c) (d)
(e) (f)
Figure 3. Streaming velocity profiles with parameters T=120, h=2.7nm, Fext=0.18 pN, K=57.15 2ε σ , wall fluidε ε =1.2, ρ*=0.642 (unless otherwise stated) a) at T=100, 120 and 150K and h=1.5 nm, b) for various magnitudes of the Fext and T=150K, c) for various channel widths h, d)for various spring constant values and h=6.3nm, e) for various wall/fluid interaction values and f) for various average fluid densities. Straight lines are parabolic fits applied to velocity data.
Non-equilibrium molecular dynamics 297
(a) (b)
(c) (d)
(e) (f)
Figure 4. Strain rate profiles with parameters T=120, h=2.7nm, Fext=0.036 pN, K=57.15 2ε σ , wall fluidε ε =1.2, ρ*=0.642 and rc=2.5σ (unless otherwise stated) a) at T=100, 120 and 150K and Fext=0.18 pN, b) for various magnitudes of the Fext, c) for various channel widths h and Fext=0.018 pN, d) for various spring constant values, e) for various wall/fluid interaction values and f) for various fluid densities. Straight lines are a guide for the eye.
298 F. Sofos, T. E. Karakasidis and A. Liakopoulos
(a) (b)
Figure 5. Temperature profiles a) for system temperature T=100, 120 and 150K. Here we considered h=6.3 nm, Fext=0.036 pN, K=57.15 2ε σ , wall fluidε ε =1.2 and ρ*=0.642 and b) as in (a) but for various magnitudes of the Fext, T=120 K and h=17.1 nm. Received: November, 2008