Non-destructive Testing of Composite Fibre Materials with ...
11
Non-destructive Testing of Composite Fibre Materials with Hyperspectral Imaging – Evaluative Studies in the EU H2020 FibreEUse Project Yijun Yan 1 , Member, IEEE, Jinchang Ren 1* , Senior Member, IEEE, Huan Zhao 2 , James F.C. Windmill 2 , Senior Member, IEEE, Winifred Ijomah 3 , Jesper de Wit 4 , and Justus von Freeden 5 1 National Subsea Centre, Robert Gordon University, Aberdeen, U.K. 2 Dept. of Electronic and Electrical Engineering, University of Strathclyde, Glasgow, U.K. 3 Dept of Design, Manufacturing & Engineering Management, University of Strathclyde, Glasgow, U.K. 4 INVENT GmbH, Christian-Pommer-Straße 47,38112 Braunschweig, Germany 5 Fraunhofer Institute for Machine Tools and Forming Technology IWU, Hermann-Münch-Str. 1, 38440 Wolfsburg, Germany Abstract: Through capturing spectral data from a wide frequency range along with the spatial information, hyperspectral imaging (HSI) can detect minor differences in terms of temperature, moisture and chemical composition. Therefore, HSI has been successfully applied in various applications, including remote sensing for security and defense, precision agriculture for vegetation and crop monitoring, food/drink, and pharmaceuticals quality control. However, for condition monitoring and damage detection in carbon fibre reinforced polymer (CFRP), the use of HSI is a relatively untouched area, as existing non-destructive testing (NDT) techniques focus mainly on delivering information about physical integrity of structures but not on material composition. To this end, HSI can provide a unique way to tackle this challenge. In this paper, with the use of a near-infrared HSI camera, applications of HSI for the non-destructive inspection of CFRP products are introduced, taking the EU H2020 FibreEUse project as the background. Technical challenges and solutions on three case studies are presented in detail, including adhesive residues detection, surface damage detection and Cobot based automated inspection. Experimental results have fully demonstrated the great potential of HSI and related vision techniques for NDT of CFRP, especially the potential to satisfy the industrial manufacturing environment. Index Terms—Hyperspectral imaging (HSI); non-destructive inspection; carbon fibre reinforced polymer (CFRP); H2020. 1 INTRODUCTION Due to the unique characteristics of lightweight, high stiffness/strength and damping resistant, carbon fibre reinforced polymer composites (CFRP) has been widely used as structural materials in many areas such as aerospace, marine, transport, sports and civil engineering industries [1, 2], as illustrated in Fig. 1(a). Composites are relatively young and intrinsically durable materials, but composite-based components or products have a limited lifetime, which is usually less than 20-30 years, e.g. 20-25 years for a wind turbine [3], and ~10 years on average for recreational boats and car bodies [4]. Considering the continuously and quickly rising demand for composites in industrial manufacturing, correct waste management of End-of-life (EoL) CFRP becomes urgent and vital. Landfilling of EoL composites is still the most popular waste management strategy, which is a relatively cheap option, but it is not the most optimal way and doesn’t comply with the Waste Framework Directive (2008/98/EC). In the future, the landfilling will become unviable because of the higher legislation-driven cost. Several countries, e.g., Germany and Austria, have already forbidden landfilling of composite waste, and other EU countries will follow suit soon. For the EoL composites, remanufacturing and reuse is the best solution, which can not only comply with environmental regulations, but also benefit both end users and stake holders. However, many barriers have affected the application of this solution, such as the negative perception of recycled products, lack of suitable business models, immature recycling techniques, limited synergistic use of available inspection, and repair and reprocessing technologies et al. To address all these challenges, an EU H2020 project, FibreEUse, is funded, aiming to develop effective recycling, remanufacturing, inspection solutions and profitable reuse options for EoL (a) (b) Fig. 1. (a) CFRP production in Europe for different industries, (b) the concept of FibreEUse, source: http://fibreeuse.eu/ Civil engineering 5% Pressure vessels 5% Wind turbine 14% Aerospace 30% Marine 2% Automotive 11% Moulding and compound 12% Sports/Leisure 14% Other 7% CFRP
Transcript of Non-destructive Testing of Composite Fibre Materials with ...

Non-destructive Testing of Composite Fibre
Materials with Hyperspectral Imaging – Evaluative
Studies in the EU H2020 FibreEUse Project
Yijun Yan1, Member, IEEE, Jinchang Ren1*, Senior Member, IEEE, Huan Zhao2, James F.C. Windmill2, Senior
Member, IEEE, Winifred Ijomah3, Jesper de Wit4, and Justus von Freeden5
1 National Subsea Centre, Robert Gordon University, Aberdeen, U.K. 2 Dept. of Electronic and Electrical Engineering, University of Strathclyde, Glasgow, U.K.
3 Dept of Design, Manufacturing & Engineering Management, University of Strathclyde, Glasgow, U.K. 4 INVENT GmbH, Christian-Pommer-Straße 47,38112 Braunschweig, Germany
5 Fraunhofer Institute for Machine Tools and Forming Technology IWU, Hermann-Münch-Str. 1, 38440 Wolfsburg, Germany
Abstract: Through capturing spectral data from a wide frequency range along with the spatial information, hyperspectral imaging
(HSI) can detect minor differences in terms of temperature, moisture and chemical composition. Therefore, HSI has been
successfully applied in various applications, including remote sensing for security and defense, precision agriculture for vegetation
and crop monitoring, food/drink, and pharmaceuticals quality control. However, for condition monitoring and damage detection in
carbon fibre reinforced polymer (CFRP), the use of HSI is a relatively untouched area, as existing non-destructive testing (NDT)
techniques focus mainly on delivering information about physical integrity of structures but not on material composition. To this
end, HSI can provide a unique way to tackle this challenge. In this paper, with the use of a near-infrared HSI camera, applications
of HSI for the non-destructive inspection of CFRP products are introduced, taking the EU H2020 FibreEUse project as the
background. Technical challenges and solutions on three case studies are presented in detail, including adhesive residues detection,
surface damage detection and Cobot based automated inspection. Experimental results have fully demonstrated the great potential
of HSI and related vision techniques for NDT of CFRP, especially the potential to satisfy the industrial manufacturing environment.
Index Terms—Hyperspectral imaging (HSI); non-destructive inspection; carbon fibre reinforced polymer (CFRP); H2020.
1 INTRODUCTION
Due to the unique characteristics of lightweight, high
stiffness/strength and damping resistant, carbon fibre
reinforced polymer composites (CFRP) has been widely used
as structural materials in many areas such as aerospace,
marine, transport, sports and civil engineering industries [1,
2], as illustrated in Fig. 1(a). Composites are relatively young
and intrinsically durable materials, but composite-based
components or products have a limited lifetime, which is
usually less than 20-30 years, e.g. 20-25 years for a wind
turbine [3], and ~10 years on average for recreational boats
and car bodies [4]. Considering the continuously and quickly
rising demand for composites in industrial manufacturing,
correct waste management of End-of-life (EoL) CFRP
becomes urgent and vital. Landfilling of EoL composites is
still the most popular waste management strategy, which is a
relatively cheap option, but it is not the most optimal way and
doesn’t comply with the Waste Framework Directive
(2008/98/EC). In the future, the landfilling will become
unviable because of the higher legislation-driven cost.
Several countries, e.g., Germany and Austria, have already
forbidden landfilling of composite waste, and other EU
countries will follow suit soon.
For the EoL composites, remanufacturing and reuse is the
best solution, which can not only comply with environmental
regulations, but also benefit both end users and stake holders.
However, many barriers have affected the application of this
solution, such as the negative perception of recycled products,
lack of suitable business models, immature recycling
techniques, limited synergistic use of available inspection,
and repair and reprocessing technologies et al. To address all
these challenges, an EU H2020 project, FibreEUse, is funded,
aiming to develop effective recycling, remanufacturing,
inspection solutions and profitable reuse options for EoL
(a) (b)
Fig. 1. (a) CFRP production in Europe for different industries, (b) the concept of FibreEUse, source: http://fibreeuse.eu/
Civil engineering
5%
Pressure vessels
5% Wind turbine
14%
Aerospace30%Marine
2%
Automotive11%
Moulding and
compound12%
Sports/Leisure14%
Other7%
CFRP

composites, see in Fig. 1(b), through the integration of
innovative remanufacturing technologies.
During the remanufacturing process, the EoL products
will be disjointed into individual components (Fig. 2), which
are then refurbished and reused in new products afterwards.
As one of the most important modules in this workflow, non-
destructive testing is crucially required to provide a reliable
and efficient inspection to assess the condition of the
composites in the remanufacturing chain.
Existing non-intrusive inspection techniques include
visual inspection, ultrasonic testing, and thermal imaging [5].
Visual inspection is performed in optical wavelengths that are
suitable for the human eyes, which is a fast and affordable
inspection method as it doesn’t require additional NDT
instruments. However, it is labour intensive, and unreliable
for small defects compared to an instrumented inspection. To
tackle these difficulties, Red (R), Green (G) and Blue (B)
based RGB colour camera was used for improved damage
detection and fault localization [6]. However, its performance
can still be easily affected by various weather and lighting
conditions [7]. Ultrasonic testing can detect the internal flaws
by analysing the sending and the receiving pulsed echo
between one and/or multiple transducer(s). It is an efficient
and safe technique, but it sometimes suffers in dealing with
non-smooth and complex geometry surfaces, pretentious to
subjective and objective factors [8]. Thermal imaging is a
thermoelastic effect based inspection technique, where
defects in the testing region is expected to present a higher
temperature response [9]. This technique requires sensitive
and expensive instrumentation, and highly skilled technician
to run the instruments [5]. Moreover, the conduction and
convection processes may also affect the temperature
variations, leading to a barrier to localise the inspection [10].
In general, these techniques mostly extract information about
physical integrity of the structures rather than the material
composition from the objects. To this end, HSI has provided
a unique solution to tackle this challenge.
HSI is actually an emerging technique that integrates
imaging technique and spectroscopy, enabling the acquisition
of spectral data from a wide frequency range along with the
spatial information. Thus, it can detect minor differences in
terms of temperature, moisture and chemical composition,
making it a unique solution for nonintrusive inspection far
beyond conventional techniques [11]. HSI has been applied
successfully in wide range of applications such as food and
drinks [12, 13], remote sensing[14, 15], clinical medicine
[16], and art verification [17], etc. However, its application in
(re)manufacturing is rare, except some limited works for
plastic characterisation [18, 19] and defect detection from
wind turbine blades [8]. As an emerging application, applying
HSI for non-destructive inspection on fibre composites is
presented in this paper, where three case studies are covered,
including adhesives residues detection, surface damage
detection, and robot integrated industrial inspection.
FRP products usually comprise FRP components or a
combination of CFRP and metal components via adhesive
bonding. For reuse purpose, these EoL FRP products need be
disassembled with the adhesive bond being separated.
However, adhesive residues will still adhere to the surface of
the components and structures, which will be cleaned by laser
treatment whilst the surface will be refurbished before the
next bond. Although laser treatment has the potential
advantage to clean the remnants adhesive, it has the risk of
thermally degradation of the joint section. To monitor the
surface condition such as the residual adhesive, and grinding
defect caused during the laser treatment in real time, an NDT
method is highly needed. To tackle with this issue, HSI will
be introduced, and its usefulness will be demonstrated as our
first case study.
After the process of adhesive removal, the condition of
each EoL component is decisive for their reuse. Components
with irreparable damages cannot be reused and thus need to
be recycled by thermal or mechanical processes. Components
with minor damages can be repaired. For other undamaged
components, surface treatments or coating can be applied to
increase the perceived quality. Therefore, it is important to
evaluate the damage cases of these components, which can
help to determine the correct repair or refurbish strategies in
order to maintain the structure integrity. This will form our
second case study, where HSI and computer vision will be
used for surface damage detection and assessment.
In the manufacturing process, robotic systems become
more and more widely adopted for industrial automation. For
the industrial deployment of the HSI camera, an automatic
HSI inspection system with human-robot interaction is
proposed and trialled as our third case study. This system is
integrated by a HSI camera and an industrial robotic
manipulator, i.e., the KUKA KR06 R900, where the long arm
of the robot can enable large-scale inspection of the
components for satisfying real industrial needs.
The remaining paper is organised as follows: Section 2
describes the concept of the HSI based inspection system.
Section 3 discusses the data acquisition and data processing
of the system. Section 4 details the three case studies. Finally,
some concluding remarks and future directions are
summarised in Section 5.
2. HYPERSPECTRAL IMAGING INSPECTION SYSTEM
Fig. 3 depicts the concept of the hyperspectral imaging
inspection system for the (re)manufacture industry, which is
composed of three core modules, i.e. Imaging module,
Machine-to-Machine (M2M) interaction Module, and
Human-to-Machine (H2M) collaboration module. In the
Imaging module, the optical sensors such as visible (VIS),
near-infrared (NIR), and short-wave infrared (SWIR)
hyperspectral cameras can provide a continuous spectral
information over a certain spectral range, along with a good
spatial resolution. M2M can actually provide a continuous
information flow between the imaging devices and computer
Fig. 2. Illustration of separation of bonded parts.

vision algorithms for data processing and analysis. Hereby,
the sensors, onsite data acquisition machine, offsite data
storage devices and cloud data processing units can connect
and communicate to each other via the industrial IoT (mostly
based on wireless network). In addition, H2M collaboration
is also a very important module. Here, human workers,
hyperspectral cameras and the specifically designed
compliant robots can work together in carrying out complex
and unstructured inspection tasks at the remanufacturing and
repair production lines.
Within the M2M techniques, data processing is
considered as the enabling technology and covers three
streams, i.e., data pre-processing, artificial intelligence (AI)
and smart decision making. Data pre-processing is a vital step
after data acquisition for data calibration and enhancement,
which can produce high quality data for easy understanding
and improved analysis via data visualization and analytics.
According to the practical needs of different NDT tasks, data
pre-processing sometimes needs to be incorporated into AI,
where spectral correction and spatial denoising techniques are
needed for improving the data quality, as well as image
stitching and registration techniques for data fusion and full-
scale representation.
The main AI techniques include but not limited to feature
extraction, machine learning, computer vision and
automation, etc. One of the biggest issues with analysing
hyperspectral data is the large number of variables involved,
leading to the curse of dimensionality or Hugh’s phenomenon.
A high number of variables necessitates a considerable
number of samples thus the corresponding memory and
processing capacity, and it may also lead to overfitting of the
classifiers when training the model. To address this issue,
feature extraction is needed for dimension reduction and
more effectively characterisation of the data.
Machine learning algorithms have been widely applied in
numerous industrial applications, which are usually built
upon the sample data (also known as training data) before
being utilised to make any estimates or predictions. The
purpose of automation is to implement the monotonous tasks
such as data acquisition by machines (i.e., KUKA robots), in
order to reduce the human intervention and increase the
efficiency and productivity.
Computer vision can be considered as an integration of
feature extraction, machine learning and automation, which
can provide imaging-based automatic inspection, big data
process control and robotic implementation. The outcomes of
these techniques are eventually used for decision making
such as classification, regression, detection and optimization.
The proposed hyperspectral imaging inspection system can
be employed for generic condition monitoring and asset
management for the repair and remanufacturing of CFRP
materials. Relevant applications can be found in the detection
of defects such as contamination, scratch, and grinding defect,
recognition of adhesive residual, classification of impact
damage types, and quality grading of coating.
3. TECHNIQUES AND METHODOLOGIES
In this section, the standard progress of data acquisition in
the lab environment and data pre-processing techniques are
introduced. Those techniques are not only used in this work
but also applicable in many other HSI applications.
3.1 Data acquisition
In our three case studies, the hyperspectral data is
acquired by two hyperspectral systems, where a visible (VIS)
hyperspectral system is used for surface damage detection
and a near-infrared (NIR) hyperspectral system for residual
adhesive detection. Both systems can be incorporated into the
robotic platform for H2M collaborations.
Fig. 3. Hyperspectral imaging inspection system for condition assessment in manufacturing and remanufacturing sectors, where M2M
and H2M denote Machine-to-Machine and Human-to-Machine interactions, respectively.

The two hyperspectral systems both operate in the push-
broom mode, where the lens of the camera face downwards
and scan only a single line at a time. Each scan produces a
two-dimensional image representing the spatial line in one
dimension and the full spectrum of each pixel in the other.
Two 20W Tungsten halogen lights are used for illumination.
For the first two case studies, the samples to be scanned are
moved with a translational stage underneath the camera in a
constant speed. With a working distance of 25cm, the speed
of the translational stage is set to 16mm/s and the maximum
length of the scanning path is 20cm to form a 3D hypercube.
For the last case study, the translational stage is replaced by
the KUKA robot arm, and the implementation detail will be
discussed in Section 4.3.
The VIS imaging system contains a CCD camera,
Hamamatsu ORCA-03G, and a spectrograph of Specim V8E.
This system covers a spectral range of 400-950nm with a
spectral resolution of 2nm. In addition, 4-fold spatial and
spectral binning were applied in order to reduce the noise as
well as to increase the camera’s light sensitivity. This also
results in an image with 336 pixels per line and each pixel
contains 256 spectral responses.
The NIR imaging is done by the Innospec Red Eye 1.7
system covering a spectral range of 950-1700 nm with a
spectral resolution of 10 nm. Without binning an image with
320 pixels per line and 256 active spectral bands is produced.
3.2 Data pre-processing
3.1.1 Spectral calibration
The illumination conditions may fluctuate in a hypercube
or apparently among several datasets over the scan lines
during the data acquisition procedure. To reduce the influence
of difference in camera quantum and physical configuration
of imaging systems, accurate calibrations for HSI system are
necessary to guarantee the stability and acceptability of the
extracted hyperspectral data. As a result, light calibration
below is essential for converting the raw radiance spectrum s
to the reflectance spectra r to eliminate such incoherence and
maintain the effect of the light conditions consistent.
Recording the camera’s shot noise without any light exposure
to the camera will give us a dark reference spectrum d, and
recording an optimally reflective white surface (e.g.,
Spectralon with Lambertian scattering) will produce a white
reference w. The light sensitivity to the current illumination
can be estimated to normalise the signal by:
𝑟 =𝑠 − 𝑑
𝑤 − 𝑑 (1)
3.1.2 Spectral correction
As the extracted spectra depends not only on chemical
absorption but also on physical light scattering, according to
the objects’ surface structure. Therefore, spectral correction
is needed, after spectral calibration, to transfer the spectra to
the Standard Normal Variate (SNV) [20] for minimising the
errors caused by scattering. For any pixel with a reflectance
spectrum 𝑟𝑠 in the HSI 𝐷 ∈ ℜ𝐼×𝐽×𝐵 at the location (𝑖, 𝑗)
where 𝑖 ∈ 1: 𝐼, 𝑗 ∈ 1: 𝐽, the process of SNV is defined by:
𝑟𝑠 = 𝐷(𝑖, 𝑗, 𝑏1:𝐵) (2)
𝑟𝑠(𝑆𝑁𝑉) =𝑟𝑠 − 𝜇
𝜎 (3)
𝜇 =1
𝐼 × 𝐽∑ 𝑟𝑠
𝐼∗𝐽
𝑠=1
(4)
𝜎 = √1
𝐼 × 𝐽∑(𝑟𝑠 − 𝜇)2
𝐼∗𝐽
𝑠=1
(5)
where 𝐷(𝑖, 𝑗, 𝑏1:𝐵) represents a spectral vector with a length
of B at location (𝑖, 𝑗); 𝜇 and 𝜎 denote the mean and standard
deviation of all pixels in 𝑟𝑠.
3.1.3 Spatial denoising Apart from the spectral degradation, the acquired data can
also be degraded by instrumental noises such as thermal noise,
quantisation noise and shot noise in the spatial domain. As a
result, spatial denoising is needed to mitigate the noise.
Herein, the bilateral filtering as a nonlinear approach that
allows edge-preserved noise removal is employed. For a 3D
hypercube, an improved joint bilateral filtering (JBF) [21] is
used for spatially smoothing the data. Given a HSI data 𝐷 ∈
ℜ𝐼×𝐽×𝐵, I and J are the spatial size of D and B is the number
of spectral bands. The JBF result of the input data D at the
location (i,j) of band b can be obtained by:
𝐷𝐽𝐵𝐹(𝑖, 𝑗, 𝑏) =1
𝑘(𝑖, 𝑗)∑ (𝐺𝜎𝑑
(𝑖 − 𝑝, 𝑗 − 𝑞) ×(𝑝,𝑞)∈𝑤
(6)
𝐺𝜎𝑟(𝐼𝑃𝐶1(𝑖, 𝑗) − 𝐼𝑃𝐶1(𝑝, 𝑞))𝐷(𝑝, 𝑞, 𝑏))
where 𝑤 is a local window centered at (𝑖, 𝑗) with a size of
(2𝜎𝑑 + 1) × (2𝜎𝑟 + 1) pixels.
The normalisation factor 𝑘 is defined by
𝑘(𝑖, 𝑗) = ∑ (𝐺𝜎𝑑(𝑖 − 𝑝, 𝑗 − 𝑞)
(𝑝,𝑞)∈𝑤
× 𝐺𝜎𝑟(𝐷𝑃𝐶1(𝑖, 𝑗) − 𝐷𝑃𝐶1(𝑝, 𝑞)))
(7)
where 𝐷𝑃𝐶1 is the first principal component derived from the
principal component analysis (PCA), and (𝑝, 𝑞) denotes the
spatial location of a pixel in the local window 𝑤.
The kernels for domain and range filtering are given by:
𝐺𝜎𝑑(𝑖 − 𝑝, 𝑗 − 𝑞) = 𝑒𝑥𝑝 (−
(𝑖 − 𝑝)2 + (𝑗 − 𝑞)2
2σ𝑑2 ) (8)
𝐺𝜎𝑟(𝐷𝑃𝐶1(𝑖, 𝑗) − 𝐷𝑃𝐶1(𝑝, 𝑞))
= 𝑒𝑥𝑝 (−(𝐷𝑃𝐶1(𝑖, 𝑗) − 𝐷𝑃𝐶1(𝑝, 𝑞))
2
2σ𝑟2
) (9)
where 𝜎𝑑 and 𝜎𝑟 decide the neighbourhood window and the
contributed weights of the pixels, respectively [22].
4. CASE STUDIES AND DISCUSSIONS
In this section, three case studies are presented to show
the potential of proposed HSI based NDT of fibre materials,
including specific AI techniques introduced in the context.
4.1 Case study 1: Adhesive’s residues detection
4.1.1 Experimental materials
In the first study, three samples are used, which are single
Aluminium (Al), adhesive bonded CFRP-CFRP and adhesive
bonded CFRP-AI tensile shear samples (Table 1). CFRP
composites are fabricated from automotive grade continuous
fibre reinforced epoxy resin with the carbon fibres.

4.1.2 Experimental results
After data acquisition, two pre-processing steps are
carried out, which include spectral calibration (Eq. (1)) and
spectral correction (Eqs. (2-5)). To visualise the spectral
characteristics of the surface conditions of the three samples,
an image at the wavelength of 1267 nm is shown in Fig. 4,
where the average spectral profiles over the whole bands of
the selected regions of interest (ROI) are also platted for
comparison in Fig. 4(a-c).
For the Al sample, three regions, i.e., normal region,
grinding region and grinding defect region, are compared
with different spectrums. For the normal region, the intensity
is low as the surface is furbished and has a relatively lower
reflectance. The lowest intensity on its normalised reflectance
can be found between 1333nm and 1600nm. For the grinding
region, it has high reflectivity, which leads to high reflectance
and appears white on the colour image. Its normalised
reflectance has the highest intensity between 1333nm and
1600nm, with a standard deviation lower than that of the other
two regions in the range of 996-1333nm. Due to poor laser
treatment, some defects are caused in the grinding region. The
defect region has a lower reflectivity than the other grinding
region, which looks grey on the colour image. Its normalised
reflectance is in between of other two regions in the spectral
range of 1333- 1600nm. Although its profile has the similar
trend to the normal region within 996-1333nm, there are still
some gaps between the two spectra, which shows their
difference. Therefore, it can be concluded that NIR spectra is
able to differ the furbished (normal) region, grinding region
and grinding defect region.
In Fig. 4(b), four representative regions are highlighted in
differently coloured boxes on the colour image. The blue and
yellow boxes denote the normal region and the adhesive
region on the Al side, respectively. The red and purple boxes
are the normal region and the adhesive region on the CFRP
side, respectively. In the colour image, it can hardly recognise
the adhesive residual on the materials. However, apparent
difference between the normal region and the adhesive region
can be seen on the spectral profile. As seen in Fig. 4 (b), the
wavelength 1147nm is an important turning point: the Al-
normal region (blue line) has a lower reflectance before
1147nm but higher reflectance afterward than the Al-
adhesive region (yellow line). On the contrary, opposite
reflectance trends of the CFRP- normal region (red line) and
the CFRP-adhesive region (purple line) are shown. In
addition, the spectral profile of the Al-normal region (blue
line) and the CFRP normal region (red line) can be well
distinguished. The Al-adhesive region and the CFRP-
adhesive region have similar spectral reflectance throughout
the whole wavelength. These findings can validate the two
capabilities of HSI, i.e., material identification and detection
of adhesive residual.
Similarly, Fig. 4(c) presents four spectral profiles of two
pairs of CFRP samples, which include two adhesive regions
(yellow and purple boxes) and two normal regions (red and
blue boxes). As can be seen, in each pair of samples, the
spectral profiles show a high degree of similarity. However,
the spectral profiles from the two pairs are much different,
which indicate the inter-class dissimilarity between the
normal and adhesive regions. Again, this finding also
validates that HSI can potentially characterise different
components/materials. Thus, it is tested for distinguishing the
adhesive residual in this study, which can benefit the laser
treatment during the disassembly stage and provide useful
information for the grading of adhesive cleaning and other
surface conditions.
4.2 Case study 2: Surface damage detection
4.2.1 Experimental materials
In the second study, three kinds of CFRP specimens,
manufactured by Resin Transfer Moulding (RTM) and Bulk
Moulding Compound (BMC), were intentionally damaged by
two types of impactors, while all the experiments are repeated
three times. In the RTM process, fibre preform is laid in a
two-part, matched, closed mould, before the thermoset is
injected into the closed mould under low to moderate pressure
(a)
(b)
(c)
Fig. 4. Normalized spectra of different regions on the Al (a), CFRP+Al
(b), and CFRP+CFRP (c). To the left are the colour images and to the
right are the averaged spectrums from selected ROIs.
1412 nm
996 nm 1333 nm
1412 nm
996 nm1333 nm
1147 nm
1412 nm
996 nm1333 nm
1147 nm
Table 1 Illustration of tensile shear samples and their dimension information.
Material Thickness
(mm)
CFRP+CFRP 4.48
CFRP+Al 5.6
Al 3.22

[23]. For the BMC process, it is usually done by applying
pressure and heat to the mould where a bulky mixture of
fibres, resin paste and fillers is placed [24]. In our experiment,
the first sample is manufactured via RTM using endless
carbon fibre textile and epoxy matrix. The second sample is
produced via BMC using new carbon long fibres, i.e., 45%
fibre content with 25mm fibre length. The third sample is also
manufactured by BMC using thermal recycled carbon long
fibres i.e., 45% fibre content with 25mm fibre length. For a
compact presentation, the three samples are named by RTM,
BMC and rBMC respectively in the remaining paper. The
experimental setup consists of a down pipe with a height of 2
meters. Each falling body has a weight of 607 g, which results
in an impact energy of 11.9 joule. The impact test setup and
results of the impact tests are shown in Fig. 5.
4.2.2 Optimised data acquisition
During the experiments, it is found that taking advantage
of diffusion scattering and reflection of light can actually
highlight the damaged regions even in the raw data. When the
imaging camera vertically faces downwards the sample, the
damaged region on the sample surface is hardly seen by the
naked eyes. This is because the lights from two lamps form
an even diffuse reflection on the surface of the sample when
the image is acquired. Therefore, the camera may capture
many unwanted textures on the surface, as shown in Table
2(b). By changing the placing angle between the sample and
the movable stage, we can make the angle of incidence close
to the angle of the reflection. This can bring in two benefits:
1) the camera can accurately record the light from lamp1 (Fig.
5(d)), and the surface can be captured in a good condition; 2)
the diffusion scattering on the damaged region(s) can be
enlarged so that the camera captures less light from those
regions. On the other hand, lamp2 is also useful in this setting
as it can further enlarge the diffusion scattering on the
damaged region. Thus, the contrast between the damaged
regions and the background can be enhanced in the captured
data. Some damaged regions (Table 2(a)) that cannot be seen
physically in conventional settings (Table 2(b)), now become
clearly visible in the newly acquired data (Table 2(c)). The
placing angle is dependent on the practical experimental
settings, though we use 30° in our experiments. Afterwards,
the acquired data will be translated back into the normal
dimension by the cosine law. Some visualised results are
shown in Table 2 to further illustrate how this process works.
4.2.3 Damage detection framework
Accurate distinguishing the types of damage is always of
interest for determining the suitable repairing strategy for the
damaged fibre composites. As such, an integrated HSI based
damage detection system with machine learning and
computer vision technologies is proposed. This is a multi-
stage image processing framework (Fig. 6) that is composed
of three key modules, i.e., pre-processing, saliency detection
and feature output. It can detect the damaged regions and
calculate the roundness (Rd) and rate of the major axis vs. the
minor axis (RMM), see in Eqs. (10-11), as detailed below.
After data acquisition, two pre-processing steps are
carried out, which include spectral calibration and spatial
denoising, following the same procedure defined in Eq. (1)
and Eqs. (6-9), respectively. Afterwards, ROI extraction is
implemented from the first principal component of the
hypercube through a saliency detection module [25] for
generating a gray-scale saliency map of the damaged regions.
In the feature extraction step, a hard threshold is applied
to convert the saliency map to a binary image, where the ROI
will be highlighted as white pixels with the background in
black. The boundary of ROI can be approximated by an
ellipse with the associated parameters determined, including
Fig. 6. Illustration of image processing framework.
(a)
(b)
(d) General data acquisition
(e) New data acquisition
(c)
Fig. 5. Illustration of (a) Impact test setup, (b) Pointed body impactor, (c) Wedge-shaped body impactor, (d) general data acquisition and (e) new data
acquisition in the second case study.
Table 2 Visual comparison between phone captured data
(a), general (b) and new (c) data acquisition manners.
Point body impactor Wedge-shape body impactor
(a)
(b)
(c)

the roundness, length of the major axis and the minor axis that
has the same normalised second central moments as the ROI.
𝑅𝑑 =𝑎 ∙ 4𝜋
𝑝2 (10)
𝑅𝑀𝑀 =𝑚𝑎𝑗𝑜𝑟 𝑎𝑥𝑖𝑠
𝑚𝑖𝑛𝑜𝑟 𝑎𝑥𝑖𝑠 (11)
where a and p denote the area and perimeter of the ROI,
respectively.
4.2.4 Experimental results
To validate the usefulness of our damage detection system,
we show examples of damage detection in Fig. 7, in which
the colour images captured by a phone camera presented in
columns (a) and (e) for visual comparison. The ground truth
annotated by the domain experts are shown in columns (b)
and (f). The damage detection results from the acquired HSI
image are given in columns (c) and (g). The extracted features
Material (a)
Visible data
(b)
Ground truth
(c)
Detected result
(d)
Feature extraction
(e)
Visible data
(f)
Ground truth
(g)
Detected result
(h)
Feature extraction R
TM
Precision 98.07% Recall 99.49% Precision 87.46% Recall 21.71%
Precision 92.18% Recall 97.74% Precision 99.82% Recall 16.10%
Precision 98.66% Recall 91.43% Precision 63.47% Recall 29.87%
BM
C
Precision 99.06% Recall 93.80% Precision 83.41% Recall 46.42%
Precision 98.77% Recall 94.54% Precision 96.11% Recall 28.06%
Precision 97.43% Recall 98.42% Precision 95.13% Recall 35.12%
RC
Y
Precision 99.66% Recall 82.07% Precision 97.67% Recall 65.27%
Precision 97.96% Recall 96.58% Precision 87.85% Recall 52.85%
Precision 93.25% Recall 97.86% Precision 77.11% Recall 75.80%
Overall Precision 97.23% Recall 94.66% Precision 87.56% Recall 41.24%
Fig. 7. Illustrated results of damage detection: (a) damage (in red circle) caused by pointed body impactor, (b) ground truth of (a), (c) detection result
of (a) and corresponding features (d); (e) damage (in red circle) caused by wedge-shaped body impactor, (f) ground truth of (e), (g) detection result of (e)
and (h) corresponding parametric metrics.

are illustrated on the HSI acquired data in columns (d) and
(h), with the boundaries highlighted in yellow, the ellipse of
the ROI shown in blue, and the major axis and the minor axis
illustrated in red and green, respectively. In addition, the
damage regions caused by the point body impactor and the
wedge-shaped body impactor on the three materials are
highlighted by red circles and red rectangles, respectively.
As shown in Fig. 7(a) and Fig. 7(e), the point body
impactor causes a round-shape surface sag, and the wedge-
shaped body impactor causes two bar-shape surface sag on
the three materials. The bar-shape damage is hardly seen on
the surface of RTM and BMC samples but is clear shown on
the surface of RCY. This is because RTM and BMC are
manufactured by original fibres, but RCY is manufactured by
recycled BMC materials. As a result, the stiffness of RTM
and BMC is higher than that of RCY. Another finding from
Fig. 7 is that the damage region appears more clearly in the
HSI than in the image from the phone camera, especially for
the defects on the RTM and BMC materials. This has
validated the efficacy of HSI than colour imaging in this
context.
For quantitative evaluation, pixel-level precision and
recall values are calculated when comparing the damage
detection results with the manually defined ground truth as:
𝑃𝑟𝑒𝑐𝑖𝑠𝑖𝑜𝑛 =𝑇𝑝
𝑇𝑝 + 𝐹𝑝 (12)
𝑅𝑒𝑐𝑎𝑙𝑙 =𝑇𝑝
𝑇𝑝 + 𝐹𝑛 (13)
where 𝑇𝑝 , 𝐹𝑝, and 𝐹𝑛 refer respectively to the number of
correctly detected foreground pixels of the damage region,
incorrectly detected foreground pixels (false alarms), and
incorrectly detected background pixels (or missing pixels
from the damage region) [25].
In the developed image processing framework, damages
caused by the pointed body impactor can always be detected,
with the precision and recall values over 90% (sometimes
~100%) in most cases. Nevertheless, it still has difficulty to
detect damages caused by the wedge-shaped body as a whole
on the surface of all materials. There are two main reasons: 1)
the limited impact energy of 11.9 joule is not strong enough
to make visible damages on the surface, 2) the complex nature
of the surface texture has made the surface damage hardly
visible. As a result, although the average detection precisions
for BMC, RTM and RCY can reach 91.55%, 83.58% and
87.54%, the average recall values are only 36.53%, 22.56%
and 64.64%, respectively. As seen in Fig. 7 (d), the damages
on the RCY are often quite fully detectable because the
recycled BMC material has a lower stiffness, making it more
vulnerable to the impact and resulting in more visible surface
damages. Therefore, its recall value is much higher than BMC
and RTM.
Finally, the overall precision and recall measures for the
two kinds of damages are obtained by the weighted average
of all samples. For the pointed body damage and the wedge-
shape body damage, the overall precision values on the three
materials are 97.23% and 87.56%, respectively, with the
overall recall values becoming 94.66% and 41.24%. Again, a
high precision with a low recall value indicates that the HSI
based integrated solution has a high reliability of positioning
the impact damage. However, it fails to detect the whole
region of the damage, especially for the wedge-shape body or
complicated geometric damages.
After damage detection, the representative features of the
damage regions i.e., roundness and the RMM can be extracted
and plotted in Fig. 8 for visual comparison. With satisfied
measures of the precision and recall, the RMM values for
point body damage are consistently close to 1. The roundness
varies from 0.65 to 1, and this is because the shape formed by
the damaged region is not always round. For the wedge-shape
body damages, due to a high precision and a low recall, both
the RMM and roundness have large variance, where RMM ∈
[3.8, 8.8] and roundness ∈ [0.13, 0.35] . However, the
features of these two damages are still very distinguishable,
which again shows the capacity of HSI in NDT on the fibre
material, and its potential for facilitating smart decision-
making of requested repairing strategies.
(a)
(b)
(d) (c)
Fig. 9. Illustration of the body structure (a), sharp impactor (b), round
impactor (c), and sample surface with damages (d), all dimensions in mm.
Fig. 8. Scatter plot of damage features.

4.3 Case study 3: Cobot based automatic inspection
4.3.1 Experimental materials
In the third study, a large automotive body structure
sample that is made of UD-fibre (0°), biaxial fabric (0°/90°,
−45°/45°) and a unsaturated polyester resin is damaged by a
sharp impactor and a round impactor (Fig. 9). The
experimental setup consists of a down tube with a height of
5.6 meters. The falling body has a mass of 2kg, which results
in an impact energy of 109.8 joule. As seen in Fig. 9(d), the
damage caused by the sharp impactor is noticeable, but the
damage caused by round impactor is almost invisible.
4.3.2 Experimental equipment
In addition to the two HSI cameras, a robotic manipulator,
the KR06 R900 [26] from KUKA is used in this case study,
mainly for its universality in many industrial applications..
The robot is a 6-axis serial manipulator, with characteristics
and working envelop shown in Fig. 10 (a) and (b).The real
setting in the lab environment is shown in Fig. 10 (c), where
the large automotive body structure is fixed to a holder
mounted on the robot. The working distance between the
camera and the sample surface is 25 cm. The movement of
the robot is manipulated by an accompanying controller.
During the camera scanning, the robot will drag the sample
moving along Axis2 with a speed of 16𝑚𝑚/𝑠. A laptop will
record the hyperspectral data into the ‘ENVI’ format. The
proposed system can also be implemented with any other
serial manipulators such as Asea Brown Boveri (ABB) [27]
and Stäubli [28].
4.3.3 Image stitching
Due to the limitation of the field of view, each scan can
only cover a spatial dimension of 15 cm. As the width of the
car body sample is 28 cm, dual scanning is needed to cover
the whole surface. To represent the sample surface as a whole,
a simple image stitching method is used in this study. Let the
spatial dimension of scanned HSI data be 𝑥 ∗ 𝑦. The spatial
dimension of the overall surface will be (2𝑥 − ∆𝑥) ∗ 𝑦. In
this study, x is decided by the spatial resolution of the HSI
camera, which is 320 pixels. y is decided by the scanning path,
or 620 pixels in total. ∆𝑥 is manually decided as 110 pixels in
this study. To this end, the dimension of sample surface turns
to be 530*620 pixels.
4.3.4 Experimental results
For visualisation purpose, image stitching is first applied
to each HSI band, before conducting the PCA on the
hypercube to extract the most representative features from the
data. The 1st PCA component is shown in Fig. 11.
In Fig. 11(a), regions #1 and #2 highlight damages caused
by sharp impactor, and regions #3 and #4 highlight damages
caused by round impactor. In Fig. 11(b), regions #1-#4 are
the corresponding healthy regions in Fig. 11(a). For the sharp
impactor, it can break the fibre into the contacted region and
deform the fibre in the surrounding regions. Therefore, it will
make the damaged surface more sensitive to the light and
(a) (b)
Fig. 11. Visualized 1st PCA component of sample front surface with damage (a) and without damage (b).
Damage caused by sharp impactor
Damage caused by round impactor
Region 1
Region 3
Region 2
Region 4
Region 1
Region 3
Region 2
Region 4
Parameters Values
Weight 55kg
Axis1 ±170° Axis2 −190°/45° Axis3 −120°/156° Axis4 ±185° Axis5 ±120° Axis6 ±350°
(a) (b) (c)
Fig. 10. Cobot system in the lab environment, (a) robot characteristics for KUKA KR06 R900, (b) working envelope with dimensions comprised
during operation, (c) laboratorial cobot workplace.
produce higher reflectance. As seen in Fig. 11, compared with
healthy regions, impactor-contacted regions show a bright
colour, with many white dots formed on deformed regions in
the PCA domain. For round impactor, it won’t break the fibre
but will deform it in a larger area. As a result, there are only
sparse white dots showing in the PCA domain.
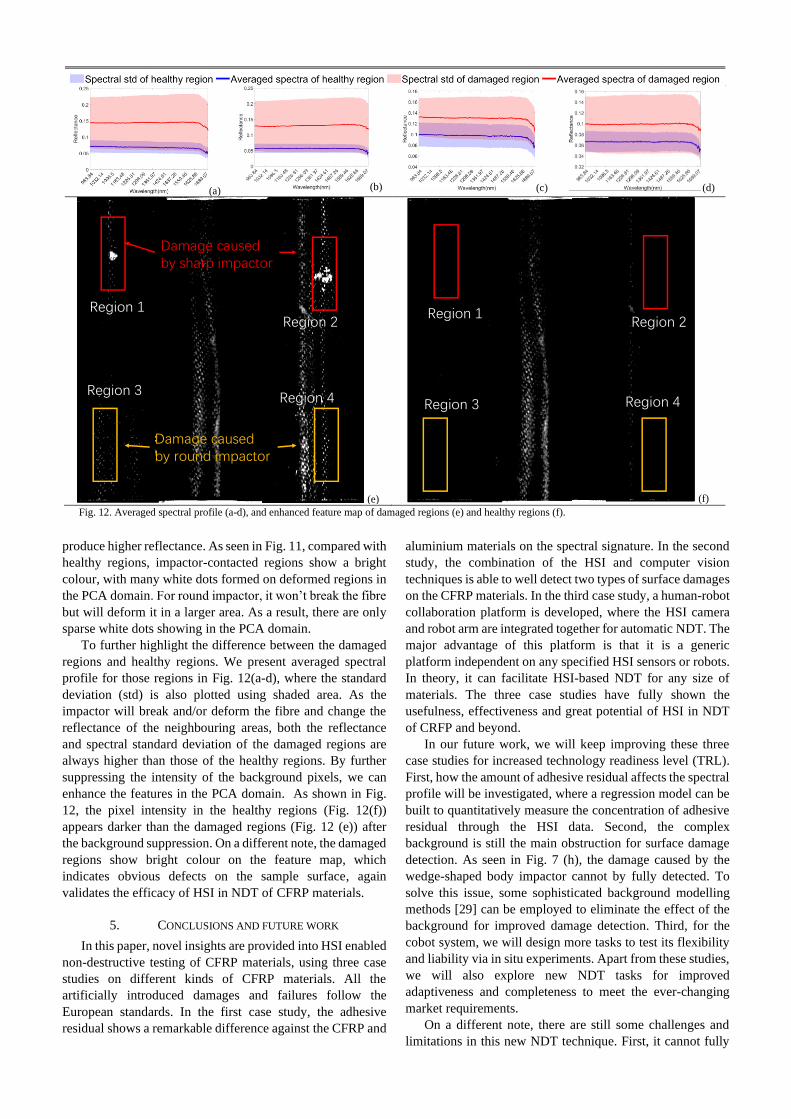
To further highlight the difference between the damaged
regions and healthy regions. We present averaged spectral
profile for those regions in Fig. 12(a-d), where the standard
deviation (std) is also plotted using shaded area. As the
impactor will break and/or deform the fibre and change the
reflectance of the neighbouring areas, both the reflectance
and spectral standard deviation of the damaged regions are
always higher than those of the healthy regions. By further
suppressing the intensity of the background pixels, we can
enhance the features in the PCA domain. As shown in Fig.
12, the pixel intensity in the healthy regions (Fig. 12(f))
appears darker than the damaged regions (Fig. 12 (e)) after
the background suppression. On a different note, the damaged
regions show bright colour on the feature map, which
indicates obvious defects on the sample surface, again
validates the efficacy of HSI in NDT of CFRP materials.
5. CONCLUSIONS AND FUTURE WORK
In this paper, novel insights are provided into HSI enabled
non-destructive testing of CFRP materials, using three case
studies on different kinds of CFRP materials. All the
artificially introduced damages and failures follow the
European standards. In the first case study, the adhesive
residual shows a remarkable difference against the CFRP and
aluminium materials on the spectral signature. In the second
study, the combination of the HSI and computer vision
techniques is able to well detect two types of surface damages
on the CFRP materials. In the third case study, a human-robot
collaboration platform is developed, where the HSI camera
and robot arm are integrated together for automatic NDT. The
major advantage of this platform is that it is a generic
platform independent on any specified HSI sensors or robots.
In theory, it can facilitate HSI-based NDT for any size of
materials. The three case studies have fully shown the
usefulness, effectiveness and great potential of HSI in NDT
of CRFP and beyond.
In our future work, we will keep improving these three
case studies for increased technology readiness level (TRL).
First, how the amount of adhesive residual affects the spectral
profile will be investigated, where a regression model can be
built to quantitatively measure the concentration of adhesive
residual through the HSI data. Second, the complex
background is still the main obstruction for surface damage
detection. As seen in Fig. 7 (h), the damage caused by the
wedge-shaped body impactor cannot by fully detected. To
solve this issue, some sophisticated background modelling
methods [29] can be employed to eliminate the effect of the
background for improved damage detection. Third, for the
cobot system, we will design more tasks to test its flexibility
and liability via in situ experiments. Apart from these studies,
we will also explore new NDT tasks for improved
adaptiveness and completeness to meet the ever-changing
market requirements.
On a different note, there are still some challenges and
limitations in this new NDT technique. First, it cannot fully
(a) (b) (c) (d)
(e) (f)
Fig. 12. Averaged spectral profile (a-d), and enhanced feature map of damaged regions (e) and healthy regions (f).
Damage caused by sharp impactor
Damage caused by round impactor
Region 1
Region 3
Region 2
Region 4
Region 1
Region 3
Region 2
Region 4

detect the inner damage such as delamination and void. This
limitation can be mitigated by integrating other NDT
techniques such as ultrasonic testing and thermography.
Second, the push-bloom style of imaging is time consuming,
which will be a barrier to the practical application. This
problem can be solved by using snapshot hyperspectral
cameras such as Cubert [30] and Specim [31], etc.
ACKNOWLEDGEMENT
This work was supported in part by the EU H2020 grant
730323 (FibreEUse).
REFERENCES
[1] Y. Yan, et al., "FibreEUse: a funded project towards the
reuse of the end-of-life fibre reinforced composites with
nondestructive inspection," in Int. Conf. in Commu., Signal
Proc., and Systems, 2019, pp. 1541-1547: Springer.
[2] M. Ramakrishnan, et al., "Overview of fibre optic sensor
technologies for strain/temperature sensing applications in
composite materials," Sensors, vol. 16, no. 1, p. 99, 2016.
[3] J. Beauson and P. Brøndsted, "Wind turbine blades: an
end of life perspective," in MARE-WINT: Springer, Cham, pp.
421-432, 2016.
[4] M. Önal and G. Neşer, "End-of-life alternatives of glass
reinforced polyester boat hulls compared by LCA," Adv.
Compos. Lett., vol. 27, no. 4, id: 096369351802700402, 2018.
[5] S. Gholizadeh, "A review of non-destructive testing
methods of composite materials," Procedia Struct. Integr.,
vol. 1, pp. 50-57, 2016.
[6] F. P. G. Márquez and A. M. P. Chacón, "A review of non-
destructive testing on wind turbines blades," Renew. Energ.,
vol. 161, pp. 998-1010, 2020.
[7] R. Bossi and V. Giurgiutiu, "Nondestructive testing of
damage in aerospace composites," in Polymer composites in
the aerospace industry: Elsevier, 2015, pp. 413-448.
[8] P. Rizk, et al., "Defect detection using hyperspectral
imaging technology on wind turbine blade," Rem. Sens. Appl.:
Soc. and Environ., p. 100522, 2021.
[9] M. Barus et al., "NDT-based design of joint material for
the detection of bonding defects by infrared thermography,"
NDT & E Int., vol. 93, pp. 157-163, 2018.
[10] A. Tesauro, C. Pavese, and K. Branner, "Rotor blade
online monitoring and fault diagnosis technology research,"
DTU Wind Energy, 2014.
[11] X. Li, et al., "Hyperspectral imaging and their
applications in the nondestructive quality assessment of fruits
and vegetables," in Hyperspectral imaging in agric., food and
environ.: IntechOpen, 2017.
[12] Y. Yan, et al., "Nondestructive phenolic compounds
measurement and origin discrimination of peated barley malt
using near-infrared hyperspectral imagery and machine
learning," IEEE Trans. Instrum. Meas., in press, 2021.
[13] T. Qiao, et al., "Singular spectrum analysis for improving
hyperspectral imaging based beef eating quality evaluation,"
Comput. Electron. Agr., vol. 115, pp. 21-25, 2015.
[14] H. Sun, et al., "Superpixel based feature specific sparse
representation for spectral-spatial classification of
hyperspectral images," Remote Sens-basel, vol. 11, no. 5, p.
536, 2019.
[15] F. Cao et al., "Sparse representation-based augmented
multinomial logistic extreme learning machine with weighted
composite features for spectral-spatial classification of
hyperspectral images," IEEE T. Geosci. Remote, no. 99, pp.
1-17, 2018.
[16] S. Md Noor, et al., "Hyperspectral image enhancement
and mixture deep-learning classification of corneal
epithelium injuries," Sensors, vol. 17, no. 11, p. 2644, 2017.
[17] M. Sun, et al., "What’s wrong with the murals at the
Mogao Grottoes: a near-infrared hyperspectral imaging
method," Sci Rep-UK, vol. 5, p. 14371, 2015.
[18] M. Balsi, S. Esposito, and M. Moroni, "Hyperspectral
characterization of marine plastic litters," in IEEE Int.
Workshop on Metro. for the Sea; 2018, pp. 28-32: IEEE.
[19] B. Galdón‐Navarro, et al., "Comparison of latent
variable‐based and artificial intelligence methods for
impurity detection in PET recycling from NIR hyperspectral
images," J. Chemometr., vol. 32, no. 1, p. e2980, 2018.
[20] Å. Rinnan, et al., "Review of the most common pre-
processing techniques for near-infrared spectra," TrAC-Trend.
Anal. Chem., vol. 28, no. 10, pp. 1201-1222, 2009.
[21] T. Qiao et al., "Joint bilateral filtering and spectral
similarity-based sparse representation: a generic framework
for effective feature extraction and data classification in
hyperspectral imaging," Pattern Recogn., vol. 77, pp. 316-
328, 2018.
[22] C. Tomasi and R. Manduchi, "Bilateral filtering for gray
and colour images," in 6th Int. Conf. Compu. Vis., 1998, pp.
839-846: IEEE.
[23] M.-C. Tanzi, S. Farè, and G. Candiani, Foundations of
biomaterials engineering. Academic Press, 2019.
[24] M. O. Seydibeyoglu, et al., Fibre technology for fibre-
reinforced composites. Woodhead Publishing, 2017.
[25] Y. Yan et al., "Unsupervised image saliency detection
with Gestalt-laws guided optimization and visual attention
based refinement," Pattern Recogn., vol. 79, pp. 65-78, 2018.
[26] K. AGILUS. https://www.kuka.com/en-
gb/products/robotics-systems/industrial-robots/kr-agilus.
(accessed 11 Auguest 2021).
[27] P. Urhal, et al., "Robot assisted additive manufacturing:
A review," Robot. Com-Int. Manuf., vol. 59, pp. 335-345,
2019.
[28] S. Mousavi, et al., "Dynamic modeling and stability
prediction in robotic machining," Int. J. Adv. Manuf. Tech.,
vol. 88, no. 9-12, pp. 3053-3065, 2017.
[29] B. Garcia-Garcia, et al., "Background subtraction in real
applications: Challenges, current models and future
directions," Comput. Sci. Rev., vol. 35, p. 100204, 2020.
[30] L. Deng, Y. Yan, H. Gong, F. Duan, and R. Zhong, "The
effect of spatial resolution on radiometric and geometric
performances of a UAV-mounted hyperspectral 2D imager,"
ISPRS J. Photogramm., vol. 144, pp. 298-314, 2018.
[31] J. Behmann et al., "Specim IQ: evaluation of a new,
miniaturized handheld hyperspectral camera and its
application for plant phenotyping and disease detection,"
Sensors, vol. 18, no. 2, p. 441, 2018.