
Non-Banking Financial Institutions · 2007-11-27 · Non-Banking Financial Institutions Chapter V...
32
Non-Banking Financial Institutions Chapter V Introduction 5.1 Non-banking financial institutions (NBFIs), a heterogeneous group of diverse institutions, form an integral part of the Indian financial system providing a range of financial services. This is an important segment of financial institutions in India apart from commercial and co-operative banks. Within the non-banking financial institutions, development finance institutions (DFIs) are mostly Government-owned and have been the traditional providers of long-term project loans. Other non- banking institutions include a wide variety of intermediaries such as insurance companies, non- bank financial companies (NBFCs), primary dealers (PDs) and capital market intermediaries such as mutual funds. 5.2 Historically, all-India financial institutions (AIFIs or FIs) have played a very important role in providing medium and long-term credit to various sectors of the economy. However, in the changed operating environment, the relative significance of AIFIs has declined, especially after the conversion of two major financial institutions (IDBI and ICICI) into banks. NBFCs, incorporated under the Companies Act, 1956, are actively engaged in lease finance, hire purchase finance, investments in securities, grants of loans, including bills discounting, insurance, stock broking, merchant banking and housing finance. Primary dealers in the Government securities market constitute a systemically important segment of the NBFCs. The structure of the PD system underwent significant changes during 2006-07 as they were allowed to diversify into other businesses and wind up their step-down subsidiaries, if any. As a result of the restructuring, the number of stand-alone PDs reduced to 8 during 2006-07 from 17 in the previous year. Most of the PDs are promoted by banks. 5.3 NBFIs form a diverse group not only in terms of size and nature of incorporation, but functionally as well. Apart from enhancing competition in the financial system, these institutions play a crucial role in broadening the access of a vast section of the population to financial services by offering a variety of products and services. The overlap between products offered by banks and non-banking institutions is increasing by the day calling for a closer co-ordination in the regulation of banks and non-banks. The role that some of the FIs play acquired greater significance in view of the emergence of financial inclusion as one of the major policy objectives since they can play a critical role as an instrument of credit delivery, particularly in the small scale and retail sectors. 5.4 Given the importance of the NBFC sector, the Reserve Bank is examining the issue of smooth flow of bank finance to NBFCs in order to develop them into a financially strong sector with improved skills and technology. In view of the increased need to support financing of the SME sector and agri- related activities and taking into account the critical role that NBFCs can play as an instrument of credit delivery, the Small Industries Development Bank of India (SIDBI) and the National Bank for Agriculture and Rural Development (NABARD) have agreed to evolve a viable credit dispensation arrangement to provide resource support to NBFCs catering to the needs of the SME and agriculture sectors. These institutions would also evolve appropriate mechanisms, in consultation with NBFCs, to address their needs in this regard and provide support in terms of their capacity building to develop expertise for financing the SME and agricultural sectors. 5.5 Regulatory initiatives in respect of FIs during 2006-07 focussed mainly on strengthening the prudential guidelines relating to income recognition, asset classification and provisioning. Financial assistants sanctioned by FIs grew at a lower rate as compared with last year, while the disbursements witnessed a sharp rise. However, their balance sheets expanded at a significantly higher rate. Sharp growth in net interest income as well as non-interest income coupled with decline in operating expenses resulted in higher profits for the FIs. Asset quality of FIs improved significantly during the year. The capital adequacy ratio, in general, continued to be significantly higher than the minimum prescribed. 5.6 The focus of regulatory measures in respect to NBFCs was on diversifying their areas of businesses by allowing them to issue co-branded cards and distribute mutual fund products, regulation of systemically important NBFCs, fair
Transcript of Non-Banking Financial Institutions · 2007-11-27 · Non-Banking Financial Institutions Chapter V...

Non-Banking Financial Institutions
Chapter V
Introduction
5.1 Non-banking financial institutions (NBFIs),a heterogeneous group of diverse institutions, forman integral part of the Indian financial systemproviding a range of financial services. This is animportant segment of financial institutions in Indiaapart from commercial and co-operative banks.Within the non-banking financial institutions,development finance institutions (DFIs) are mostlyGovernment-owned and have been the traditionalproviders of long-term project loans. Other non-banking institutions include a wide variety ofintermediaries such as insurance companies, non-bank financial companies (NBFCs), primarydealers (PDs) and capital market intermediariessuch as mutual funds.
5.2 Historically, all-India financial institutions(AIFIs or FIs) have played a very important role inproviding medium and long-term credit to varioussectors of the economy. However, in the changedoperating environment, the relative significance ofAIFIs has declined, especially after the conversionof two major financial institutions (IDBI and ICICI)into banks. NBFCs, incorporated under theCompanies Act, 1956, are actively engaged in leasefinance, hire purchase finance, investments insecurities, grants of loans, including billsdiscounting, insurance, stock broking, merchantbanking and housing finance. Primary dealers in theGovernment securities market constitute asystemically important segment of the NBFCs. Thestructure of the PD system underwent significantchanges during 2006-07 as they were allowed todiversify into other businesses and wind up theirstep-down subsidiaries, if any. As a result of therestructuring, the number of stand-alone PDsreduced to 8 during 2006-07 from 17 in the previousyear. Most of the PDs are promoted by banks.
5.3 NBFIs form a diverse group not only interms of size and nature of incorporation, butfunctionally as well. Apart from enhancingcompetition in the financial system, these institutionsplay a crucial role in broadening the access of a vastsection of the population to financial services byoffering a variety of products and services. Theoverlap between products offered by banks and
non-banking institutions is increasing by the daycalling for a closer co-ordination in the regulationof banks and non-banks. The role that some ofthe FIs play acquired greater significance in viewof the emergence of financial inclusion as one ofthe major policy objectives since they can play acritical role as an instrument of credit delivery,particularly in the small scale and retail sectors.
5.4 Given the importance of the NBFC sector,the Reserve Bank is examining the issue of smoothflow of bank finance to NBFCs in order to developthem into a financially strong sector with improvedskills and technology. In view of the increased needto support financing of the SME sector and agri-related activities and taking into account the criticalrole that NBFCs can play as an instrument of creditdelivery, the Small Industries Development Bank ofIndia (SIDBI) and the National Bank for Agricultureand Rural Development (NABARD) have agreed toevolve a viable credit dispensation arrangement toprovide resource support to NBFCs catering to theneeds of the SME and agriculture sectors. Theseinstitutions would also evolve appropriatemechanisms, in consultation with NBFCs, to addresstheir needs in this regard and provide support interms of their capacity building to develop expertisefor financing the SME and agricultural sectors.
5.5 Regulatory initiatives in respect of FIs during2006-07 focussed mainly on strengthening theprudential guidelines relating to income recognition,asset classification and provisioning. Financialassistants sanctioned by FIs grew at a lower rate ascompared with last year, while the disbursementswitnessed a sharp rise. However, their balance sheetsexpanded at a significantly higher rate. Sharp growthin net interest income as well as non-interest incomecoupled with decline in operating expenses resultedin higher profits for the FIs. Asset quality of FIsimproved significantly during the year. The capitaladequacy ratio, in general, continued to besignificantly higher than the minimum prescribed.
5.6 The focus of regulatory measures in respectto NBFCs was on diversifying their areas ofbusinesses by allowing them to issue co-brandedcards and distribute mutual fund products,regulation of systemically important NBFCs, fair

practices code and corporate governance. There hasbeen a marked shift in the policy stance of regulatingnon-deposit taking NBFCs having an asset size ofRs.100 crore and above due to their systemicimportance. The assets/liabilities of NBFCs[excluding Residuary Non-banking Companies(RNBCs)] expanded at a much higher rate of 26.9per cent during 2006-07 as compared with themoderate rise of 5.1 per cent during 2005-06. Thefinancial performance of NBFCs turned aroundduring 2006-07 entirely on account of sharp rise infund based income, which offset the sharp rise inoperating expenditure and financial expenditure. Asa result both operating profits and net profitwitnessed a rise. The asset quality also improvedsignificantly. The proportion of NBFCs with CRARabove 30 per cent as also with CRAR of less than 12per cent declined over the year.
5.7 The Primary dealer (PD) system underwentsignificant changes during 2006-07. In order todiversify the risks inherent in the PD business, PDswere permitted to diversify into other business lineswhile retaining the requirement of maintainingpredominance in Government securities business.Concomitantly, with a view to ensuring that thebalance sheets of the PDs do not get affected by thespillover of risks from other businesses/subsidiaries and that the PDs are focused on theirprimary dealership activities, it was decided thatPDs would not be permitted to set up step-downsubsidiaries. Those PDs that already had step-downsubsidiaries (in India and abroad) were advised torestructure the ownership pattern of thosesubsidiaries. In compliance with these guidelines,five PDs, which either had step-down subsidiariesor undertook businesses other than those specificallypermitted, restructured their operations.
5.8 The income earned by PDs increasedsharply during 2006-07. However, the increase inexpenditure was significantly higher than theincrease in income. As a result, net profits of PDsdeclined by 20 per cent. The CRAR of PDs was muchin excess of the stipulated minimum of 15 per centof aggregate risk weighted assets.
5.9 The present chapter is organised into foursections. The policy developments, businessoperations and financial performance of financialinstitutions are set out in Section 2. Section 3 focuseson the regulatory measures and the financialperformance of NBFCs. The last section of theChapter deals with the policy developments relatingto primary dealers and their operations.
2. Financial Institutions5.10 Over the years, a wide range of FIs came intoexistence to cater to the medium to long-termfinancing requirements of different sectors of theeconomy. Based on the major activity undertakenby them, AIFIs are classified into three broadcategories. First, there exist the term-lendinginstitutions, viz., Industrial Finance CorporationIndia Ltd. (IFCI), Industrial Investment Bank of IndiaLtd. (IIBI), Export-Import Bank of India (EXIM Bank)and Tourism Finance Corporation of India (TFCI).Second, there are refinance institutions such asNABARD, SIDBI and National Housing Bank (NHB),which extend refinance to banks as well as NBFIs.In the third category are the investment institutionssuch as LIC, which deploy their assets largely inmarketable securities. State/regional levelinstitutions are a distinct group and comprisevarious State Financial Corporations (SFCs), StateIndustrial and Development Corporations (SIDCs)and North Eastern Development FinanceCorporation Ltd. (NEDFi). Some of these FIs havebeen notified as Public Financial Institutions by theGovernment of India under Section 4A of theCompanies Act, 1956.
5.11 As at end-March 2007, there were seven FIsbeing regulated by the Reserve Bank, viz., EXIMBank, IFCI, IIBI, NABARD, NHB, SIDBI and TFCI.Of these, five FIs (EXIM Bank, IFCI, NABARD, NHB,SIDBI) were under the full-fledged regulation andsupervision of the Reserve Bank. FIs not acceptingpublic deposits but having asset size of Rs.500 croreand above are subject to limited off-site supervisionby the Reserve Bank. TFCI belongs to this category,while IIBI is in the process of voluntary winding-up. The exemption given to IFCI from NBFCregulations was withdrawn in August 2007 and itis now being regulated as a systemically importantnon-deposit taking non-banking financial company(NBFC-ND-SI).
Regulatory Initiatives for Financial Institutions
5.12 In continuation with the policy initiativesundertaken by the Reserve Bank in recent yearsfor progressive upgradation of the regulatorynorms for FIs in convergence with the normsacross the financial sector, a number of measureswere undertaken during 2006-07.
Income Recognition, Asset Classification andProvisioning
5.13 Norms for income recognition, assetclassification and provisioning concerning
165
Non-Banking Financial Institutions

166
Report on Trend and Progress of Banking in India, 2006-07
Government guaranteed exposures were modifiedduring 2006-07. Previously, asset classification andprovisioning requirements in respect of StateGovernment guaranteed exposures were contingentupon the invocation of the Government guarantee.Pursuant to the recommendations of the TechnicalGroup on Refinancing Institutions (Chairman: ShriG P Muniappan), the asset classification andprovisioning requirements were de-linked from theinvocation of Government guarantee. With effectfrom March 31, 2007, State Governmentguaranteed advances and investments in StateGovernment guaranteed securities attract the assetclassification and provisioning norms if the interestand/or principal or any other amount due to the FIremains overdue for more than 90 days. However,the period of default in respect of agriculturalactivity is related to the agricultural cycle insteadof 90 days. The credit facilities backed by guaranteeof the Central Government, though overdue, maybe treated as NPA only when the Governmentrepudiates its guarantee when invoked. Thisprovision for exemption from classification ofCentral Government guaranteed advances as NPA,however, is not applicable in the case of incomerecognition, where the existing norms continue.
Reduction in Regulatory Forbearance
5.14 Previously, certain public sector banks(PSU banks) were given relaxation from theprudential norms in respect of their restructuredinvestment in IFCI Ltd. on a year-to-year basis fromthe year 2002-03. This relaxation was withdrawnduring the year and the PSU banks were advised tomark to market their restructured investment inIFCI as on June 30, 2007. These banks have beenallowed to phase out the necessary provisioningon a quarterly basis in respect of their restructuredinvestment in IFCI Ltd. over four-quarters on a
pro-rata basis, ensuring that the full provision ismade by March 31, 2008.
Strengthening of Regulatory Focus on SIDBI
5.15 A number of measures were undertaken fortightening the regulatory focus on SIDBI, particularlywith regard to its exposure to SFCs. The risk weighton SIDBI’s exposure to SFCs was raised from 100per cent to 125 per cent. SIDBI was advised to makefull provisions in respect of the SFCs that haddefaulted even after restructuring/one-timesettlement (OTS) package was extended to them andnot to sanction refinance to those SFCs that continueto show negative net worth. Furthermore, in view ofthe large exposure of SIDBI to SFCs, which are proneto risks, SIDBI was advised to follow the normsapplicable to banks in asset classification andprovisioning in respect of its exposure to SFCs whichinvolved a change to ‘borrower-wise’ classificationfrom that of ‘facility-wise’ classification applicableto FIs. SIDBI has also been advised to ensure thatall SFCs follow uniform accounting standardssimilar to those followed by banks.
Operations of Financial Institutions
5.16 Financial assistance sanctioned anddisbursed by FIs continued to expand during2006-07. While sanctions grew at a lower rate ascompared with the last year, disbursementswitnessed a sharp rise. The slowdown in sanctionswas accounted for mainly by all-India term-lendinginstitutions, especially SIDBI. Financial assistancesanctioned and disbursed by specialised financialinstitutions accelerated. In the case of investmentinstitutions, while financial assistance sanctioneddecelerated, financial assistance disbursedaccelerated sharply accounted for mainly by LIC(Table V.1 and Appendix Table V.1).
Table V.1: Financial Assistance Sanctioned and Disbursed by Financial Institutions(Amount in Rs. crore)
Item Amount Percentage Variation
2005-06 2006-07 2005-06 2006-07
S D S D S D S D
1 2 3 4 5 6 7 8 9
i) All-India Term-lending Institutions* 11,975 9,287 12,234 10,679 31.4 47.1 2.2 15.0ii) Specialised Financial Institutions# 133 88 245 120 19.0 22.0 84.0 36.0iii) Investment Institutions@ 15,558 11,771 18,759 27,857 49.0 31.0 20.6 136.0Total Assistance by FIs (i+ii+iii) 27,666 21,146 31,238 38,656 41.0 38.0 12.9 82.8
S : Sanctions. D : Disbursements. * : Relating to IFCI, SIDBI and IIBI.# : Relating to IVCF, ICICI Venture and TFCI. @ : Relating to LIC, GIC and erstwhile subsidiaries (NIA,UIIC & OIC).Note : All data are provisional.Source : Respective Financial Institutions.

167
Non-Banking Financial Institutions
Table V.2: Liabilities and Assets ofFinancial Institutions
(As at end-March)
(Amount in Rs. crore)
Item Amount PercentageVariation
2006 2007 2005-06 2006-07
1 2 3 4 5
Liabilities1. Capital 5,431 4,888 1.9 -10.0
(3.7) (2.9)
2. Reserves 15,211 15,886 8.1 4.4(10.5) (9.5)
3. Bonds and 67,145 72,766 11.6 8.4Debentures (46.2) (43.5)
4. Deposits 14,520 21,998 8.7 51.5(10.0) (13.2)
5. Borrowings 18,950 22,401 8.8 18.2(13.0) (13.4)
6. Other Liabilities 24,217 29178 0.5 20.5(16.7) (17.5)
Total Liabilities/Assets 1,45,474 1,67,117 8.2 14.9(100.0) (100.0)
Assets1. Cash and Bank 9,915 10,125 -39.9 2.1
Balance (6.8) (6.1)
2. Investments 10423 8,922 -23.5 -14.4(7.7) (5.3)
3. Loans and Advances 1,11,441 1,32,424 21.3 18.8(76.6) (79.2)
4. Bills Discounted/ 1,810 1,922 72.7 6.2Rediscounted (1.2) (1.2)
5. Fixed Assets 1,088 1,489 -5.0 36.9(0.8) (1.0)
6. Other Assets 10,797 12,235 5.2 13.3(7.4) (7.3)
Note : 1. Data pertain to six FIs, viz., IFCI Ltd., TFCI Ltd.NABARD, NHB, SIDBI and EXIM Bank. IIBI Ltd. wasunder voluntary winding up as on March 31, 2007. Dataincluding IIBI Ltd. are only for the year ended March31, 2006.
2. Figures in parentheses are percentages to totalliabilities/assets.
Source : Balance sheets of respective FIs, unaudited off-sitereturns for NHB and audited limited supervisory returnfor TFCI Ltd.
5.17 Financial assistance sanctioned anddisbursed (in absolute terms) by AIFIs, after showinga decline between 2000-01 and 2004-05, increasedin the last two years. In contrast to the trendwitnessed in the last few years, the disbursementsduring 2006-07, were larger than the sanctions(Chart V.1).
Assets and Liabilities of FIs
5.18 The combined balance sheets of FIs during2006-07 expanded at a higher rate of 14.9 per centcompared with 8.2 per cent in the previous year. Onthe liabilities side, the resources raised by way ofbonds and debentures, which form the majorconstituent with 43.5 per cent share, increased at alower rate of 8.4 per cent compared with 11.6 percent during 2005-06 (Table V.2). Deposits andborrowings with their respective shares of about 13per cent each, registered a much sharper increaseduring the year. The growth in deposits during theyear was far more pronounced at 51.5 per cent incomparison with the modest increase of 8.7 per centin the past year. On the assets side, loans andadvances portfolio continued to expand, albeit withsome moderation in sync with the sharp creditgrowth by the banking sector. Investment portfolioof FIs declined by 14.4 per cent over and above thedecline of 23.5 per cent in the previous year.
Resources Mobilised by FIs
5.19 AIFIs raised resources during 2006-07 inboth rupee and foreign currency. Rupee resources
include both long-term and short-term funds.While long-term rupee resources consist of bondsand borrowings, short-term resources compriseof commercial paper (CP), term deposits, inter-corporate deposits (ICDs), certificate of deposits(CDs) and borrowings from the term moneymarket. Foreign currency resources mainlyinclude bonds and borrowings.
5.20 Resources raised by FIs during 2006-07were higher than those raised during 2005-06.

168
Report on Trend and Progress of Banking in India, 2006-07
Table V.3: Resources Mobilised by Financial Institutions(As at end-March)
(Amount in Rs. crore)
Institution Total Resources Raised Total
Long-term Short-term Foreign Currency TotalOutstanding
2006 2007 2006 2007 2006 2007 2006 2007 2006 2007
1 2 3 4 5 6 7 8 9 10 11
TFCI – – 66 – – – 66 – 390 331
EXIM Bank 3,260 3,212 1,124 3,249 3,063 4,159 7,446 10,620 15,836 21,137
SIDBI 2,610 572 420 1,274 459 331 3,489 2,176 11,030 10,928
NABARD 8,395 10,899 – – – – 8,395 10,899 23,313 31,260
NHB 5,342 9,682 1,220 3,079 – – 6,562 12,761 16,344 18,475
Total 19,607 24,365 2,764 7,602 3,522 4,490 25,958 36,456 66,913 82,131
– : Nil/Negligible.Note : Long-term rupee resources comprise borrowings by way of bonds/debentures, while short-term resources comprise CPs, term deposits,
ICDs, CDs and borrowing from the term money. Foreign currency resources comprise largely bonds and borrowings in the internationalmarket.
Source : Balance Sheets of respective FIs.
Both short-term and long-term rupee resourcesincreased. Resources raised in foreign currencyalso increased significantly. NHB mobilised thelargest amount of resources, followed by NABARD,EXIM Bank and SIDBI (Table V.3 and AppendixTable V.2). IFCI and IIBI continued to be barredfrom mobilising fresh resources on account oftheir poor financial performance.
5.21 Resources raised by FIs from the moneymarket during 2006-07 were significantly higherthan those raised during 2005-06. In all, however,FIs utilised just 17.3 per cent of the umbrella limitsanctioned; the utilisation was 13.1 per centduring the previous year (Table V.4).
Table V.4: Resources Raised by FinancialInstitutions from the Money Market
(Amount in Rs. crore)
Instrument 2004-05 2005-06 2006-07
1 2 3 4
A. Total 3,339 1,977 3,293i) Term Deposit 705 44 89
ii) Term Money 175 – – iii) Inter-corporate Deposits 477 – – iv) Certificate of Deposits 233 2 663 v) Commercial Paper 1,749 1,931 2,540
Memo:
B. Umbrella limit 13,001 15,157 19,001
C. Utilisation of Umbrella limit 25.7 13.1 17.3(A as percentage of B)
– : Nil/Negligible.Source : Balance sheets of respective FIs.
Sources and Uses of Funds
5.22 Total sources/deployment of funds of FIsincreased sharply by 80.0 per cent to Rs.1,80,862crore during 2006-07. Significantly, 45.6 per centof the funds by FIs were generated internally and48.6 per cent from external sources while 5.8 percent of resources were generated through othersources. A large part of the funds raised were usedfor fresh deployments (58.8 per cent as against71.9 per cent last year). The repayment of pastborrowing registered a sharp rise, constituting31.2 per cent of total deployments as against 14.3per cent in the previous year. Interest paymentsincreased sharply during the year (Table V.5 andAppendix Table V.3).
Cost and Maturity of Borrowings
5.23 The weighted average cost of resourcesof IFCI and TFCI declined marginally during2006-07, while that of EXIM Bank, SIDBI,NABARD and NHB increased (Table V.6 andAppendix Table V.4). The weighted average maturityof resources of TFCI and NHB declined, while itincreased in the case of IFCI, EXIM Bank, SIDBIand NABARD.
Lending Interest Rates
5.24 While NHB maintained its Prime LendingRate (PLR), EXIM Bank, TFCI and SIDBI raisedthe rate during the year (Table V.7).

169
Non-Banking Financial Institutions
previous year, the operating expenses of FIsregistered a decline of 55.9 per cent during theyear. As a result, the operating profit increasedsharply by 73.6 per cent during the year. This wasalso reflected in the significant increase in netprofit of FIs, despite higher provisions earmarkedfor taxation (Table V.8).
Table V.7: PLR Structure of SelectFinancial Institutions
(per cent)
Effective From NHB EXIM Bank TFCI SIDBI
1 2 3 4 5
March 2006 10.5 11.5 10.5 11.5March 2007 10.5 12.5 11.0 12.0
Source : Respective FIs.
Table V.8: Financial Performance of SelectAll-India Financial Institutions*
(Amount in Rs. crore)
Item 2005-06 2006-07 Variation
Amount Percent-age
1 2 3 4 5
A) Income (a+b) 9,599 11,478 1,879 19.6a) Interest Income 8,246 9,565 1,319 16.0
(85.9) (83.3)b) Non-Interest Income 1,353 1,913 560 41.4
(14.1) (16.7)
B) Expenditure (a+b) 7,606 7,811 205 2.7a) Interest Expenditure 5,691 6,967 1,276 22.4
(74.8) (89.2)b) Operating Expenses 1,915 844 -1,071 -55.9
(25.2) (10.8)of which: Wage Bill 372 462 90 24.2
C) Provisions for Taxation 591 990 399 67.5
D) ProfitOperating Profit (PBT) 1,993 3,460 1,467 73.6Net Profit (PAT) 1,402 2,470 1,068 76.2
E) Financial Ratios@Operating Profit (PBT) 1.4 2.1Net Profit (PAT) 1.0 1.5Income 6.6 6.9Interest Income 5.7 5.7Other Income 0.9 1.1Expenditure 5.2 4.7Interest expenditure 3.9 4.2Other Operating Expenses 1.3 0.5Wage Bill 0.3 0.3Provisions 0.4 0.6Spread (Net Interest Income) 1.8 1.6
* : IFCI, IIBI, TFCI, NABARD, NHB, SIDBI and EXIM Bank.@ : As percentage of total assets. Note : Figures in brackets are percentage shares in the respective
total.Source : Balance sheets of respective FIs, unaudited off-site
returns for NHB and audited limited supervisory returnfor TFCI Ltd.
Table V.5: Pattern of Sources and Deploymentof Funds of Financial Institutions*
(Amount in Rs. crore)
Item 2005-06 2006-07 PercentageVariation
2005-06 2006-07
1 2 3 4 5
A) Sources of Funds 1,00,455 1,80,862 17.9 80.0(i+ii+iii) (100.0) (100.0)(i) Internal 63,557 82,441 18.7 29.7
(63.3) (45.6)(ii) External 33,475 87,844 15.7 162.4
(33.3) (48.6)(iii) Others@ 3,424 10,578 23.7 208.9
(3.4) (5.8)
B) Deployment of Funds 1,00,455 1,80,862 17.9 80.0(i+ii+iii) (100.0) (100.0)(i) Fresh Deployments 72,273 1,06,295 35.6 47.1
(71.9) (58.8)(ii) Repayment of past 14,402 56,436 -28.1 291.9
Borrowings (14.3) (31.2)(iii) Other Deployments 13,781 18,132 15.6 31.6
(13.7) (10.0)of which :Interest Payments 4,502 5,567 -2.1 23.7
(4.5) (3.1)
* : IFCI, TFCI, NABARD, NHB, SIDBI and EXIM Bank.@ : Includes cash and balances with banks (cash in hand), balances
with the Reserve Bank and other banks.Note : Figures in brackets are percentages to total.Source : Respective FIs.
Financial Performance of Financial Institutions
5.25 Net interest income of select all-India FIsincreased to Rs.2,598 crore during 2006-07 fromRs.2,555 crore during 2005-06. In line with thetrend in the previous year, non-interest income ofFIs increased significantly during the year.However, in contrast to the sharp increase in the
Table V.6: Weighted Average Cost and Maturityof Rupee Resources Raised by Way of Bonds/
Debentures by Select AIFIs
Institution Weighted Average Weighted Averagecost (per cent) Maturity in years
2005-06 2006-07 2005-06 2006-07
1 2 3 4 5
IFCI 7.8 7.6 7.2 8.6TFCI 10.1 9.9 5.2 4.3EXIM Bank 6.9 7.3 4.6 4.9SIDBI 5.9 6.5 3.9 4.5NABARD 5.8 8.7 3.5 5.0NHB 6.4 7.5 2.2 2.0
Source : Respective FIs.

170
Report on Trend and Progress of Banking in India, 2006-07
(Table V.11). IFCI, IIBI, TFCI and SIDBI reducedtheir assets in the doubtful category to less thanRs.10 crore during 2006-07, while there were nodoubtful assets in the case of IFCI. None of theFIs had any assets in the ‘loss’ asset category atend-March 2007.
Capital Adequacy
5.29 The capital adequacy ratio of FIs continuedto be significantly higher than the minimumstipulated norm of 9 per cent (Table V.12). TheCRAR of IFCI and TFCI increased significantly
5.26 Although interest income of all FIs combinedtogether as percentage of total assets remainedunchanged at 5.7 per cent during 2006-07,interest income as percentage of working fundsdeclined for IFCI and TFCI, while it increased forother FIs (Table V.9). The non-interest income tototal assets ratio increased during 2006-07 to 1.1per cent at the aggregate level from 0.9 per centin the previous year. At individual FI level, thenon-interest income as a percentage of totalworking funds increased significantly for IFCI,while it remained negative for NABARD during theyear. Operating profit as percentage of averageworking funds improved for IFCI and SIDBIduring 2006-07. This ratio was the highest forIFCI, followed by TFCI and SIDBI. Return onaverage assets of IFCI, TFCI and SIDBI improvedduring the year. Net profit per employee of SIDBIincreased during the year. Net profit per employeein respect of EXIM Bank during 2006-07 was morethan Rs.1 crore.
Soundness Indicators
Asset Quality
5.27 In absolute terms, net NPAs of EXIM Bankand NABARD increased during 2006-07, whilethose of SIDBI declined sharply (Table V.10).However, in terms of net NPA to net loans ratio,the asset quality of SIDBI improved sharply, whilethat of EXIM Bank improved marginally.
5.28 Improvement in asset quality was alsoobserved in terms of a substantial increase instandard assets of all the major FIs, except TFCI
Table V.9: Select Financial Parameters of Financial Institutions(As at end-March)
(Per cent)
Institution Interest Income/ Non-interest Operating Return on Net ProfitAverage Income/Average Profits/Average Average per Employee
Working Funds Working Funds Working Funds Assets (Rs. crore)
2006 2007 2006 2007 2006 2007 2006 2007 2006 2007
1 2 3 4 5 6 7 8 9 10 11
IFCI 11.3 8.3 2.3 8.2 6.7 10.2 -0.6 5.8 -0.2 ..IIBI 11.0 – 8.4 – -1.4 – .. – -0.1 –TFCI 10.2 9.3 0.2 0.8 4.0 3.9 1.9 2.3 0.4 ..EXIM Bank 7.6 8.1 0.6 0.5 2.1 1.7 1.5 1.3 1.4 1.4NABARD 6.3 6.8 -0.1 -0.2 2.1 1.8 1.8 1.6 0.2 0.2NHB* 6.2 6.8 0.2 0.1 1.1 0.9 0.5 0.5 1.1 ..SIDBI 6.2 7.1 0.2 0.4 3.4 3.8 2.0 2.2 0.3 0.4
– : Nil/Negligible. .. : Not Available. * : Position as at end-June.Source : Balance sheets of respective FIs, unaudited off-site returns for NHB and audited limited supervisory return for TFCI Ltd.
Table V.10: Net Non-Performing Assets(As at end-March)
(Amount in Rs. crore)
Institution Net NPAs Net NPAs/ Net Loans(per cent)
2006 2007 2006 2007
1 2 3 4 5
IFCI 667 – 9.1 –
IIBI 132 – 13.1 –
TFCI 15 – 3.0 –
EXIM Bank 105 115 0.6 0.5
NABARD – 23 – –
NHB* – – – –
SIDBI 261 22 1.9 0.1
– : Nil/Negligible.* : Position as at end-June.Source : Balance sheets of respective FIs, unaudited off-site
returns for NHB and audited limited supervisory returnfor TFCI Ltd.

171
Non-Banking Financial Institutions
Table V.11: Asset Classification of Financial Institutions(Amount in Rs. crore)
At end-March
Institution Standard Sub-Standard Doubtful Loss
2006 2007 2006 2007 2006 2007 2006 2007
1 2 3 4 5 6 7 8 9
IFCI 6,635 6,791 54 – 613 – – –IIBI 874 – 14 – 118 – – –TFCI 546 399 – – 15 – – –EXIM Bank 17,692 22,772 105 108 – 7 – –NABARD 58,088 69,485 – 18 – 5 – –NHB* 16,241 18,917 – – – – – –SIDBI 13,001 15,511 1 17 260 5 – –
– : Nil/Negligible. * : Position as at end-June.Source : Balance sheets of FIs.
during the year due to improved profitability ofthese institutions. The CRAR of NHB improvedmarginally, while that of EXIM Bank, NABARDand SIDBI declined during the year.
3. Non-Banking Financial Companies
5.30 Amendment to the Reserve Bank of IndiaAct, 1934 in 1997 gave comprehensive powers tothe Reserve Bank to regulate the NBFCs. Theamended Act, inter alia, provided for compulsoryregistration of all NBFCs. NBFCs can be classifiedinto two broad categories, viz ., (i) NBFCsaccepting public deposit and (ii) NBFCs notaccepting/holding public deposit.
5.31 This section focuses mainly on the regulatoryand supervisory initiatives of the Reserve Bank
Table V.12: Capital Adequacy Ratio of Select Financial Institutions*(Per cent)
Institution As at end-March
2001 2002 2003 2004 2005 2006 2007
1 2 3 4 5 6 7 8
IFCI 6.2 3.1 1.0 -17.0 -23.4 -27.9 14.0IIBI 13.9 9.2 -11.0 -20.1 -41.1 -64.2 –TFCI 18.6 18.5 19.8 22.8 27.4 34.9 40.9EXIM Bank 23.8 33.1 26.9 23.5 21.6 18.4 16.4NABARD 38.5 36.9 39.1 39.4 38.8 34.4 27.0NHB@ 16.8 22.1 27.9 30.5 22.5 22.3 24.0SIDBI 28.1 45.0 44.0 51.6 50.7 43.2 37.5
* : Net of provisioning and write-offs.@ : Position as at end-June.Source : Respective balance sheets of FIs.
during the year. The operations of NBFCs andRNBCs are dealt with separately in view of theirdiverse nature. Besides, operations of NBFCs notaccepting public deposits but having asset size ofRs.100 crore and above have also been analysedseparately considering the systemic implicationsfor their operations.
Regulatory and Supervisory Initiatives
5.32 The Reserve Bank has been strengtheningthe regulatory and supervisory framework forNBFCs since 1997 with the objective of makingthe NBFC sector vibrant and healthy. These effortswere pursued further during 2006-07. During theyear, a major thrust was on strengthening theregulatory framework with regard to systemically

172
Report on Trend and Progress of Banking in India, 2006-07
important non-banking financial companies so asto reduce the regulatory gaps. Systemicallyimportant non-deposit taking NBFCs were alsodefined and prudential norms were specified forthese entities. Some of the major regulatory andsupervisory initiatives taken during the year areset out below.
Reclassification of NBFCs
5.33 Until December 6, 2006, NBFCs wereclassified as equipment leasing, hire-purchase,investment companies and loan companies.Pursuant to the announcement made in the Mid-Term Review of Annual Policy Statement for theyear 2006-07 to re-group the companies engagedin financing real/physical assets supportingeconomic activity such as automobiles, generalpurpose industrial machinery and the like as assetfinancing companies, all NBFCs were advised onDecember 6, 2006 that the re-classification of thecategories of NBFCs would be as asset financecompanies (AFC), investment companies andloan companies.
5.34 AFC is defined as any company which is afinancial institution carrying on as its principalbusiness of financing the physical assetssupporting productive/economic activity such asautomobiles, tractors, generator sets, earthmoving and material handling equipments,moving on own power and general purposeindustrial machines. Principal business for thispurpose is defined as aggregate of financing real/physical assets supporting economic activity andincome arising therefrom not less than 60 per centof the total assets and total income, respectively.Since the classification for the purpose of incomerecognition, asset classification and provisioningnorms is based on asset specification, the extantprudential norms will continue as hitherto. Thecompanies satisfying the above conditions havebeen advised to approach the Regional Office ofthe Reserve Bank in the jurisdiction in which theirRegistered Office is located, along with the originalcertificate of registration (CoR) issued by theReserve Bank to recognise their classification asasset finance companies. Their request must besupported by their Statutory Auditor’s certificateindicating the asset/income pattern of thecompany as on March 31, 2006. The change inclassification would be incorporated in thecertificate of registration issued by the ReserveBank as NBFC-Asset Finance Company (NBFC-
D-AFC), if accepting deposits and NBFC-ND-AFC,if not accepting deposits.
Financial Regulation of Systemically ImportantNBFCs and Banks’ Relationship with Them
5.35 The application of different levels ofregulations to the activities of banks and NBFCs,and even among different categories of NBFCs,had given rise to some issues relating to unevencoverage of regulations. The Reserve Bank had,therefore, set up an Internal Group to examinethe issues relating to level playing field, regulatoryconvergence and regulatory arbitrage in thefinancial sector. Based on the recommendationsof the Internal Group and taking intoconsideration the feedback received thereon, arevised framework to address the issuespertaining to the overall regulation of systemicallyimportant NBFCs (NBFCs-ND-SI) and therelationship between banks and NBFCs was putin place on December 12, 2006.
5.36 All NBFCs–ND with an asset size of Rs.100crore and more as per the last audited balancesheet are now considered as systemicallyimportant NBFCs–ND (NBFC-ND-SI). NBFCs–ND–SI are required to maintain a minimum CRAR of10 per cent. No NBFC–ND–SI is allowed to (i) lendto any single borrower/group of borrowersexceeding 15 per cent / 25 per cent of its ownedfund; (ii) invest in the shares of another company/single group of companies exceeding 15 per cent/ 25 per cent of its owned fund; and (iii) lend andinvest (loans/investments taken together)exceeding 25 per cent of its owned fund to a singleparty and 40 per cent of its owned fund to a singlegroup of parties.
5.37 If the additional exposure is on account ofinfrastructure loan and/or investment, then theNBFCs are allowed to exceed the prescribed limitof credit/investment for single party or a singlegroup of parties, i.e., 5 per cent for any singleparty and 10 per cent for a single group of parties.In addition to the single party and a single groupof parties exposure norms prescribed for NBFCs-D and NBFCs-ND-SI, AFCs are permitted toexceed the exposure to a single party and a singlegroup of parties up to a further 5 percentagepoints of their owned fund in exceptionalcircumstances with the approval of their boards.NBFCs-ND-SI not accessing public funds bothdirectly and indirectly may apply to the ReserveBank for an appropriate dispensation, consistent

173
Non-Banking Financial Institutions
with the spirit of the exposure limits. Taking intoaccount the likelihood that some of the NBFCsmay not be in compliance with some of theelements of the revised regulatory framework, itwas decided to provide for a transition period upto end-March 2007. Accordingly, NBFCs wererequired to comply with all elements of the revisedframework with effect from April 1, 2007.
5.38 The residuary non-banking companies(RNBCs) and primary dealers (PDs) are subjectto a separate set of regulations. The Reserve Bankhad constituted an Internal Group to review theexisting guidelines applicable to these entities inthe light of the revised guidelines and examinethe need for prescribing supplementary guidelineswhich will be issued separately. Till such time,these entities will continue to be governed by theexisting regulations.
5.39 Government owned NBFCs are exemptedfrom certain provisions of Non-Banking FinancialCompanies Prudential Norms (Reserve Bank)Directions, 1998, at present. There is, however, aproposal to bring all deposit-taking andsystemically important Government ownedcompanies under the provisions of the Directions,1998. However, the date from which they are tofully comply with the regulatory framework willbe decided later. These companies were, therefore,required to prepare a roadmap for compliancewith the various elements of the NBFC regulations,in consultation with the Government, and submitit to the Reserve Bank by March 31, 2007.
5.40 With a view to ensuring adherence tocompliance with the regulatory framework forsystemically important non-deposit taking/holdingNBFCs (NBFC-ND-SI) as on December 12, 2006,such companies were advised on April 27, 2007to put in place a system for submission of anannual statement of capital funds and risk assetratio, among others, as at end of March every year.The first such return was required to be submittedfor the year ended March 31, 2007. The returnmay be submitted within a period of three monthsfrom the close of the financial year, every year.
Exposure Norms and Risk Weights
5.41 The Reserve Bank amended the Non-Banking Financial Companies Prudential Norms(Reserve Bank) Directions, 1998. Under theamended directions, NBFCs were advised onSeptember 20, 2006 that while calculating the
aggregate of funded exposure of a borrower forthe purpose of assignment of risk weight, they may‘net-off ’ against the total outstanding exposure tothe borrower advances collateralised by cashmargins/security deposits/caution money againstwhich the right to set off is available.
Securitisation Companies and ReconstructionCompanies
5.42 On March 29, 2004, the Reserve Bankincreased, the minimum owned fund requirementfor commencing the business of securitisation orasset reconstruction to an amount not less than 15per cent of the total financial assets acquired or tobe acquired by the securitisation company orreconstruction company on an aggregate basis orRs.100 crore, whichever is lower, irrespective ofwhether the assets are transferred to a trust set upfor the purpose of securitisation or not. Thesecuritisation companies/reconstruction companieswere directed that they may invest the amount ofowned fund in the security receipts issued by thetrust set up for the purpose of securitisation. It was,however, decided on September 20, 2006 thatSecuritisation Companies or ReconstructionCompanies shall invest in Security Receipts anamount not less than 5 per cent issued under eachscheme with immediate effect. In the case ofSecuritisation Companies or ReconstructionCompanies which have already issued the SecurityReceipts, such companies should achieve theminimum subscription limit in Security Receiptsunder each scheme, within a period of six monthsfrom the date of notification.
5.43 The Reserve Bank on October 19, 2006directed that a securitisation company orreconstruction company, which has obtained acertificate of registration (CoR) from the ReserveBank under Section 3 of the Securitisation andReconstruction of Financial Assets andEnforcement of Security Interest (SARFAESI) Act,2002 should commence business within sixmonths from the date of grant of CoR. The ReserveBank may, on an application made by thesecuritisation company or reconstructioncompany, grant extension of time forcommencement of business beyond six months,on merits, but in no case, such extension of timeshall exceed 12 months from the date of grant ofcertificate of registration. Those securitisationcompanies or reconstruction companies, whichhad already obtained a CoR from the Reserve

174
Report on Trend and Progress of Banking in India, 2006-07
Bank under Section 3 of the Act and did notcommence business, were required to commencebusiness within a period of six months from thedate of the notification of the Directions.
Continuation of Business of NBFI -Submissionof Statutory Auditors Certificate
5.44 It was observed that there were NBFCswhich were not engaged in the business of non-banking financial institution (NBFI) but still heldthe CoR, even though they were not required/eligibleto hold the CoR granted by the Reserve Bank. Inorder to ensure that only NBFCs which are actuallyengaged in the business of NBFI hold CoR, NBFCswere advised on September 21, 2006 that theyshould submit a certificate from their statutoryauditors every year to the effect that they continueto undertake the business of NBFI requiring theholding of CoR under Section 45-IA of the RBI Act,1934. The certificate from the statutory auditorsin this regard is required to be submitted to theRegional Office of the Reserve Bank under whosejurisdiction the NBFC is registered, latest by June30, every year with reference to the position of thecompany as on March 31 of that year.
Definition of Principal Business
5.45 The term ‘principal business’ in the caseof NBFIs has not been defined in law. However,the Reserve Bank decided to describe principalbusiness for the purpose of identification of anNBFC. It was clarified on October 19, 2006 thatthe business of non-banking financial institutionmeans a company engaged in the business offinancial institution as contained in Section 45I(a) of the RBI Act, 1934. For this purpose, thedefinition of ‘principal business’ given, vide PressRelease of April 8, 1999 is to be followed, whichstates that a company will be treated as a non-banking financial company if its financial assetsare more than 50 per cent of its total assets (nettedoff by intangible assets) and income from financialassets is more than 50 per cent of the grossincome. Both these tests are required to besatisfied as the determinant factors for principalbusiness of a company. In the case of an existingcompany, which has been granted the CoR by theReserve Bank to carry on NBFI, it is possible thatits business profile has undergone a change overa period of time. In the case of new companies,since these companies cannot commence businessof NBFI without obtaining CoR, the Reserve Bank
grants CoR on the basis of their intention to engagein the business of NBFI. However, such anintention may not materialise. Hence, it is possible,that there are companies holding the CoR tocommence/carry on the business of NBFI withoutactually undertaking NBFI activity. It was for thisreason that the submission of auditor’s certificatein support of commencement/continuance of thebusiness of NBFI and fulfilling the criteria of theprincipal business was prescribed.
Guidelines on Fair Practices Code
5.46 NBFCs were advised on September 28,2006 to prescribe the broad guidelines on fairpractices that are to be framed and approved bythe boards of directors of all non-banking financialcompanies (including RNBCs). The fair practicescode so framed and approved by the board ofdirectors is to be published and disseminated onthe website of the company, if any, for theinformation of the public. The salient features ofthe guidelines are: (i) loan application formsshould include necessary information whichaffects the interest of the borrower, so that ameaningful comparison with the terms andconditions offered by other NBFCs can be madeand informed decision can be taken by theborrower; (ii) NBFCs should devise a system ofgiving acknowledgment for receipt of all loanapplications and preferably the timeframe, withinwhich loan applications will be disposed off,should also be indicated; (iii) NBFCs shouldconvey in writing to the borrower by means ofsanction letter or otherwise, the amount of loansanctioned, along with the terms and conditionsincluding annualised rate of interest and methodof application thereof and keep the acceptance ofthese terms and conditions by the borrower onits record; (iv) NBFCs should give notice to theborrower of any change in the terms andconditions including disbursement schedule,interest rates, service charges and prepaymentcharges, among others; (v) decision to recall/accelerate payment or performance under theagreement should be in consonance with the loanagreement; (vi) NBFCs should release all securitieson repayment of all dues or on realisation of theoutstanding amount of loan subject to anylegitimate right or lien for any other claim NBFCsmay have against borrower; (vii) NBFCs shouldrefrain from interference in the affairs of theborrower except for the purposes provided in theterms and conditions of the loan agreement; (viii) in

175
Non-Banking Financial Institutions
case of receipt of request from the borrower fortransfer of borrowal account, the consent orotherwise, i.e., objection of the NBFC, if any,should be conveyed within 21 days from the dateof receipt of request; (ix) in the matter of recoveryof loans, NBFCs should not resort to undueharassment; and (x) the boards of directors ofNBFCs should also put in place the appropriategrievance redressal mechanism within theorganisation to resolve disputes in this regard.
Prior Public Notice about Change in Control/Management
5.47 NBFCs, including RNBCs, were advisedfrom time to time that whenever there was changeof management and control of NBFCs, prior publicnotice should be given 30 days before effectingthe sale, or transfer of the ownership by sale ofshares, or transfer of control, or by way ofamalgamation/merger of an NBFC with anotherNBFC or a non-financial company by the NBFCand also by the transferor, or the transferee. Thematter was reviewed and NBFCs, includingRNBCs, were advised on October 27, 2006 thatsuch prior public notice shall be given by theNBFC and also by the transferor or the transfereeor jointly by the parties concerned.
Distribution of Mutual Fund Products by NBFCs/Issue of Co-branded Credit Cards
5.48 With a view to strengthening the NBFCsthrough diversification and pursuant to theannouncement made in the Mid-Term Review ofAnnual Policy Statement for the year 2006-07 onOctober 31, 2006, it was decided on December 4,2006 to allow NBFCs, selectively, to market anddistribute mutual fund products as agents ofmutual funds, with prior approval of the ReserveBank, for an initial period of two years. It wasalso decided on December 4, 2006 to allowNBFCs, selectively, registered with the ReserveBank to issue co-branded credit cards withscheduled commercial banks, without risksharing, with prior approval of the Bank, for aninitial period of two years. NBFCs fulfilling thefollowing minimum requirements are eligible toapply: (i) minimum net owned fund of Rs.100crore; (ii) the company should have made netprofit as per the last two years audited balancesheets; (iii) the percentage of net NPAs to netadvances of the NBFC as per the last auditedbalance sheet should not be more than 3 per cent;
and (iv) the non-deposit-taking NBFCs (NBFCs-ND) should have CRAR of 10 per cent and deposit-taking NBFCs (NBFCs-D) should have CRAR of12 per cent or 15 per cent, as applicable to thecompany. In addition, for distributing mutual fundproducts, the NBFC (i) should comply with theSEBI guidelines/regulations; (ii) should not adoptany restrictive practice of forcing its customersto go in for a particular mutual fund productsponsored by it; (iii) and the customers shouldbe allowed to exercise their own choice. In thecase of co-branded credit card business, the roleof the NBFC under the tie-up arrangement shouldbe limited only to marketing and distribution ofthe co-branded credit cards and the co-brandedcredit card issuing bank would be subject to allthe instructions/guidelines issued by its concernedregulatory authority. The guidelines would bereviewed after two years.
Cover for Public Deposits – Creation of FloatingCharge on Liquid Assets
5.49 All NBFCs accepting/holding publicdeposits were advised in February 2005 to createfloating charge on the statutory liquid assetsinvested in terms of Section 45-IB of the RBI Act,1934, in favour of their depositors. In view of thepractical difficulties expressed by the NBFCs increating charge on the statutory liquid assets infavour of a large number of depositors, it wasdecided in January 2007 that NBFCs accepting/holding public deposits may create the floatingcharge on the statutory liquid assets, in favour oftheir depositors, through the mechanism of ‘TrustDeed’. The charge is required to be registered withthe Registrar of Companies and the informationin this regard is required to be furnished to thetrustees and the Reserve Bank. A copy each ofthe ‘Draft Trust Deed’ containing the details andthe ‘Trustee Guidelines’ was sent for the guidanceof the NBFCs. They were further advised to put asystem in place latest by March 31, 2007.
Submission of Returns by Mutual BenefitFinancial Companies (MBFCs) and MutualBenefit Companies (MBCs)
5.50 The Ministry of Company Affairs took overthe entire regulation of Mutual Benefit FinancialCompanies (Notified Nidhis) and Mutual BenefitCompanies (Potential Nidhis). Accordingly, theposition regarding submission of annual returnsby MBFCs and MBCs was reviewed by the Reserve

176
Report on Trend and Progress of Banking in India, 2006-07
Bank and it was decided on January 4, 2007 notto call for annual return, audited balance sheetand profit and loss account, auditor’s certificateand other particulars as contained in the Non-Banking Financial Companies Acceptance ofPublic Deposits (Reserve Bank) Directions, 1998from MBFCs and MBCs. However, if the applicationof MBCs (Potential Nidhis) for grant of nidhi statusis rejected by the Ministry of Company Affairs, theprovisions of the Directions, 1998 as applicable toNBFCs would apply to such companies.
Prudential Norms
5.51 In terms of the provisions of the prescribedregulatory framework for systemically importantnon-deposit taking NBFCs, as on December 12,2006, the Non-Banking Financial CompaniesPrudential Norms (Reserve Bank) Directions,1998 were required to be amended. It was,however, felt that a separate set of prudentialnorms directions in supersession of the extantNon-Banking Financial Companies PrudentialNorms (Reserve Bank) Directions, 1998 may beissued for deposit taking NBFCs (includingRNBCs) and non-deposit taking NBFCs foroperational convenience. Accordingly, two sets ofprudential norms directions, viz., Non-BankingFinancial (Deposit Accepting or Holding)Companies Prudential Norms (Reserve Bank)Directions, 2007 for deposit taking NBFCs(including RNBCs) and Non-Banking Financial(Non- Deposit Accepting or Holding) CompaniesPrudential Norms (Reserve Bank) Directions,2007 for non-deposit taking NBFCs were issuedin February 2007.
5.52 Further, all deposit taking NBFCs andRNBCs with total assets of Rs.100 crore and abovewere advised to submit the return on capitalmarket exposure on a monthly basis within sevendays of the close of the month. The first suchreturn based on revised criteria was required tobe submitted for the month ended April 30, 2007.NBFCs with deposits of Rs 50 crore and abovewere advised to continue to submit return oncapital market exposure as hitherto beingsubmitted by them till the month ended March31, 2007, after which they are required to followthe revised instructions.
Misuse of Bank Finance for Hoarding
5.53 Concerns were expressed that some of thecorporates/entities were hoarding foodgrains
possibly using the resources borrowed from theNBFCs. Accordingly, NBFCs-ND-SI (all non-deposit taking NBFCs with asset size of Rs.100crore and above) were advised on February 23,2007 to undertake a scrutiny of their financialexposures to large borrowers for procurement offoodgrains and also consider quick scrutiny ofthe accounts on whom they have large exposureto confirm to themselves that funds were notdiverted for procurement of foodgrains with aview to hoarding.
Advertisement in Electronic Media
5.54 NBFCs were advised in May 2005 toexplicit ly include in their advertisementssoliciting deposits issued in print or electronicmedia (including websites) a statement to theeffect that ‘the Reserve Bank does not accept anyresponsibility or guarantee about the presentposition as to the financial soundness of thecompany or for the correctness of any of thestatements or representations made or opinionsexpressed by the company and for repayment ofdeposits/discharge of the liabilities by thecompany’. It is possible that the advertisementreleased by NBFCs accepting deposits purely forpromoting its business may attract deposits. Inthe interest of depositors in the context of suchadvertisements and draw attention of thedepositors to the above provision, a suitableprovision was incorporated in the Non-BankingFinancial Companies Acceptance of PublicDeposits (Reserve Bank) Directions, 1998 onApril 4, 2007 advising NBFCs that where anyadvertisement is displayed in electronic mediasuch as TV, even without soliciting deposits, itshould incorporate a caption/band in suchadvertisements indicating the following: (i) ‘Asregards deposit taking activity of the company,the investors may refer to the advertisement inthe newspaper/information furnished in theapplication form for soliciting public deposits’;(ii) ‘The company is having a valid Certificate ofRegistration issued by the Reserve Bank of Indiaunder section 45-IA of the Reserve Bank of IndiaAct, 1934. However, the Reserve Bank does notaccept any responsibility or guarantee about thepresent position as to the financial soundnessof the company or for the correctness of any ofthe statements or representations made oropinions expressed by the company and forrepayment of deposits/discharge of the liabilitiesby the company’.

177
Non-Banking Financial Institutions
Ceiling on Rate of Interest
5.55 In the Annual Policy Statement for the year2007-08, released in April 2007, anannouncement was made regarding increase inthe ceiling on the rate of interest payable by NBFCs(other than RNBCs) on deposits by 150 basispoints to 12.5 per cent per annum. Accordingly,the maximum interest rate payable on publicdeposits by NBFCs was revised to 12.5 per centper annum from April 24, 2007. This is themaximum permissible rate an NBFC can pay onits public deposits; NBFCs are free to offer lowerrates. The new rate of interest will be applicableto fresh public deposits and renewals of maturedpublic deposits. The ceiling rate of interest of 12.5per cent per annum is also applicable to thedeposits accepted/renewed by Miscellaneous Non-Banking Companies (Chit Fund Companies).
Guidelines on Corporate Governance
5.56 Corporate governance is the key toprotecting the interests of the stakeholders in thecorporate sector. NBFCs are no exception as theytoo are corporate entities. In order to enableNBFCs to adopt best practices and ensure greatertransparency in their operations, guidelines wereproposed on May 8, 2007 for consideration of theboards of directors of all deposit taking NBFCswith deposit size of Rs.20 crore and above, andall non-deposit taking NBFCs with asset size ofRs.100 crore and above (NBFCs-ND-SI). Theguidelines relate to constitution of audit,nomination and risk management committees,disclosure and transparency and connectedlending relationship.
5.57 An NBFC having assets of Rs.50 crore andabove as per its last audited balance sheet isalready required to constitute an audit committee,consisting of not less than three members of itsboard of directors. An NBFC-D with deposit sizeof Rs.20 crore may also consider constituting anaudit committee on similar lines. With respect tothe constitution of nomination committee, theguidelines require that it is necessary to ensurethat the general character of the management orthe proposed management of the NBFC is notprejudicial to the interest of its present and futuredepositors. In view of the interest evinced byvarious entities in this segment, it is desirable thatNBFC-D with deposit size of Rs.20 crore andabove and NBFC-ND-SI form a nominationcommittee to ensure ‘fit and proper’ status of
proposed/existing directors. For risk managementcommittee, the guidelines require that in orderto manage risk on an integrated basis, a riskmanagement committee be constituted. Themarket risk for NBFCs with public deposit ofRs.20 crore and above or having an asset size ofRs.100 crore or above as on the date of lastaudited balance sheet is addressed by the AssetLiability Management Committee (ALCO)constituted to monitor the asset liability gap andstrategise action to mitigate the risk associated.The guidelines also require that the followinginformation should be put up by NBFCs to theboards of directors at regular intervals as may beprescribed by it in this regard: (i) progress madein putting in place a progressive risk managementsystem, and risk management policy and strategyfollowed; and (ii) conformity with corporategovernance standards, viz., in composition ofvarious committees, their role and functions,periodicity of the meetings and compliance withcoverage and review functions.
5.58 Alongwith the above, instructions onconnected lending relationship were also releasedwhich relate to credit facilities to the directors, loansand advances to relatives of the NBFC’s directorsor to the directors of other companies and theirrelatives and other entities and timeframe forrecovery of such loans, among others.
Complaints About Excessive Interest Charged byNBFCs
5.59 In view of several complaints regardinglevying of excessive interest and charges on certainloans and advances by NBFCs, they were advisedon May 24, 2007 to lay down appropriate internalprinciples and procedures in determininginterest rates and processing and other charges,even though interest rates are not regulated bythe Reserve Bank. NBFCs were advised to keepin view the guidelines on Fair Practice Code abouttransparency in respect of terms and conditionsof loans.
Profile of NBFCs (Including RNBCs)
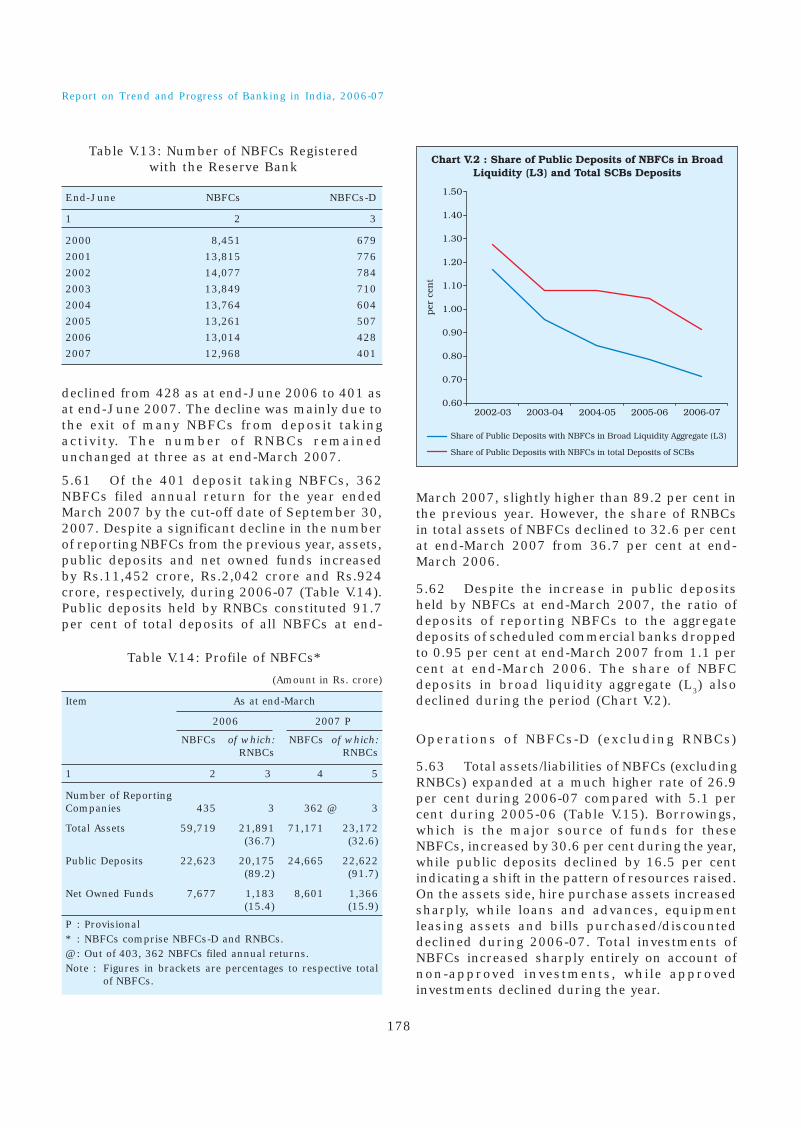
5.60 Total number of NBFCs registered with theReserve Bank, consisting of NBFCs-D (Deposittaking NBFCs), RNBCs, mutual benefit companies(MBCs), miscellaneous non-banking companies(MNBCs) and Nidhi companies, declined from13,014 at end-June 2006 to 12,968 at end-June2007 (Table V.13). The number of NBFCs-D
178
Report on Trend and Progress of Banking in India, 2006-07
declined from 428 as at end-June 2006 to 401 asat end-June 2007. The decline was mainly due tothe exit of many NBFCs from deposit takingactivity. The number of RNBCs remainedunchanged at three as at end-March 2007.
5.61 Of the 401 deposit taking NBFCs, 362NBFCs filed annual return for the year endedMarch 2007 by the cut-off date of September 30,2007. Despite a significant decline in the numberof reporting NBFCs from the previous year, assets,public deposits and net owned funds increasedby Rs.11,452 crore, Rs.2,042 crore and Rs.924crore, respectively, during 2006-07 (Table V.14).Public deposits held by RNBCs constituted 91.7per cent of total deposits of all NBFCs at end-
Table V.13: Number of NBFCs Registeredwith the Reserve Bank
End-June NBFCs NBFCs-D
1 2 3
2000 8,451 679
2001 13,815 776
2002 14,077 784
2003 13,849 710
2004 13,764 604
2005 13,261 507
2006 13,014 428
2007 12,968 401
March 2007, slightly higher than 89.2 per cent inthe previous year. However, the share of RNBCsin total assets of NBFCs declined to 32.6 per centat end-March 2007 from 36.7 per cent at end-March 2006.
5.62 Despite the increase in public depositsheld by NBFCs at end-March 2007, the ratio ofdeposits of reporting NBFCs to the aggregatedeposits of scheduled commercial banks droppedto 0.95 per cent at end-March 2007 from 1.1 percent at end-March 2006. The share of NBFCdeposits in broad liquidity aggregate (L3) alsodeclined during the period (Chart V.2).
Operations of NBFCs-D (excluding RNBCs)
5.63 Total assets/liabilities of NBFCs (excludingRNBCs) expanded at a much higher rate of 26.9per cent during 2006-07 compared with 5.1 percent during 2005-06 (Table V.15). Borrowings,which is the major source of funds for theseNBFCs, increased by 30.6 per cent during the year,while public deposits declined by 16.5 per centindicating a shift in the pattern of resources raised.On the assets side, hire purchase assets increasedsharply, while loans and advances, equipmentleasing assets and bills purchased/discounteddeclined during 2006-07. Total investments ofNBFCs increased sharply entirely on account ofnon-approved investments, while approvedinvestments declined during the year.
Table V.14: Profile of NBFCs*
(Amount in Rs. crore)
Item As at end-March
2006 2007 P
NBFCs of which: NBFCs of which:RNBCs RNBCs
1 2 3 4 5
Number of ReportingCompanies 435 3 362 @ 3
Total Assets 59,719 21,891 71,171 23,172 (36.7) (32.6)
Public Deposits 22,623 20,175 24,665 22,622 (89.2) (91.7)
Net Owned Funds 7,677 1,183 8,601 1,366 (15.4) (15.9)
P : Provisional* : NBFCs comprise NBFCs-D and RNBCs.@: Out of 403, 362 NBFCs filed annual returns.Note : Figures in brackets are percentages to respective total
of NBFCs.

179
Non-Banking Financial Institutions
5.64 Among NBFC groups, asset f inancecompanies (AFCs) held the largest share in totalassets/liabilities (51.5 per cent), followed by hirepurchase finance companies (35.7 per cent), loancompanies (8.7 per cent) and investmentcompanies (3.4 per cent) (Table V.16). The shareof equipment leasing companies declined tobelow 1 per cent subsequent upon the re -classification of NBFCs. The relative significanceof various NBFC groups reflected largely thepattern of their borrowings as depositsconstituted a small share (4.3 per cent) of theirtotal liabilities. Of the total deposits held by allNBFCs, hire purchase finance companies heldthe largest share in total deposits of NBFCs (81.0per cent), followed distantly by AFCs with a 9.1per cent share.
Deposits
Profile of Public Deposits of Different Categoriesof NBFCs-D
5.65 Continuing the trend of the previous year,public deposits held by all groups of NBFCsdeclined during 2006-07 (Table V.17). Depositsof equipment leasing companies and investmentcompanies declined by 73.5 per cent and 44.1 percent, respectively. The decline was, however, of arelatively low order in the case of deposits of hirepurchase companies (18.7 per cent).
Size-wise Classification of NBFCs Deposits
5.66 Deposits held by NBFCs range from lessthan Rs.0.5 crore to above Rs.50 crore
Table V.15: Consolidated Balance Sheet of NBFCs-D(Amount in Rs. crore)
Item As at End-March Variation
2005-06 2006-07
2006 2007 P Absolute Per cent Absolute Per cent
1 2 3 4 5 6 7
Liabilities 1. Paid-up Capital 1,827 2,289 -379 -17.2 462 25.3 (4.8) (4.8) 2. Reserves and Surplus 5,625 5,969 1,081 23.8 344 6.1
(14.9) (12.4) 3. Public Deposits 2,447 2,042 -1,478 37.7 -405 -16.5
(6.5) (4.3) 4. Borrowings 24,942 32,563 1,897 8.2 7,621 30.6
(65.9) (67.8) 5. Other Liabilities 2,987 5,136 704 30.8 2,149 72.0
(7.9) (10.7)
Total Liabilities / Assets 37,828 47,999 1,824 5.1 10,171 26.91. Investments 4,326 7,508 369 9.3 3,182 73.5
(11.4) (15.6) i) Approved Securities @ 292 241 -1,945 -87.0 -51 -17.3ii) Other Investments 4,034 7,267 2,314 134.6 3,232 80.1
2. Loans and Advances 10,686 10,602 -2,063 -16.2 -84 -0.8 (28.2) (22.1)3. Hire Purchase Assets 20,008 26,048 5,608 38.9 6,040 30.2
(52.9) (54.3)4. Equipment Leasing Assets 1,502 1,334 -523 -25.8 -168 -11.2
(4.0) (2.8) 5. Bill Business 44 6 -427 -90.6 -38 -85.7
(0.1) (0.0) 6. Other Assets 1,261 2,500 -1,140 -47.5 1,239 98.3
(3.3) (5.2)
P : Provisional.@ : SLR assets comprise ‘approved securities’ and ‘unencumbered term deposits’ in scheduled commercial banks.Note : Figures in brackets are percentages to total liabilities/assets.Source : Annual Returns.

180
Report on Trend and Progress of Banking in India, 2006-07
Table V.16: Major Components of Liabilities of NBFCs-D–Group Wise
(Amount in Rs. crore)
NBFC Group Liabilities Deposits Borrowings
2005-06 2006-07 P 2005-06 2006-07 P 2005-06 2006-07 P
1 2 3 4 5 6 7
Asset Finance @ – 24,718 – 186 – 19,091 (51.5) (9.1) (58.6)
Equipment Leasing 3,497 325 164 43 2,309 128 (9.2) (0.7) (6.7) (2.1) (9.3) (0.4)
Hire Purchase 28,845 17,156 2,035 1,654 19,493 10,478 (76.3) (35.7) (83.2) (81.0) (78.2) (32.2)
Investment 1,610 1,633 81 45 697 133 (4.3) (3.4) (3.3) (2.2) (2.8) (0.4)
Loan 3,876 4,167 167 114 2,442 2,733 (10.2) (8.7) (6.8) (5.6) (9.8) (8.4)
Total 37,828 47,999 2,447 2,042 24,942 32,563
P : Provisional – : Not applicable.@ : New classification of NBFCs, viz. asset finance company (AFC) became effective since December 2006. Companies financing
real/physical assets for productive/economic activities are re-classified as AFCs.Note : Figures in brackets are percentages to respective totals.Source : Annual Returns.
(Table V.18). The number of NBFCs and depositsheld by NBFCs in all deposit sizes declinedduring 2006-07, except for the deposit-class ‘morethan Rs.20 crore and up to Rs.50 crore’. Thoughthe number of NBFCs with deposits size of ‘Rs.20crore and above’ declined to 11 in 2006-07 from
13 in 2005-06, their share in total deposits heldby all NBFCs increased to 82.5 per cent from78.3 per cent. The remaining 348 companieswith deposit size of less than Rs.20 crore heldabout 18 per cent of total public deposits of theNBFC sector.
Table V.17: Public Deposits held by NBFCs-D – Group-wise(Amount in Rs. crore)
NBFC Group As at end-March Percentage
Number of NBFCs Public DepositsVariation
2006 2007 2006 2007 P 2006-07
1 2 3 4 5 6
Asset Finance @ – 72 – 186 – (9.1)
Equipment Leasing 37 28 164 43 -73.5 (6.7) (2.1)
Hire Purchase 339 231 2,035 1,654 -18.7 (83.2) (81.0)
Investment 5 3 81 45 -44.1 (3.3) (2.2)
Loan 51 25 167 114 -32.0 (6.8) (5.6)
Total 432 359 2,447 2,042 -16.5
P : Provisional. – : Not applicable.@ : New classification of NBFCs viz. asset finance company (AFC) became effective since December 2006. Companies financing
real/physical assets for productive/economic activities are re-classified as AFCs.Note : Figures in brackets are percentages in respective totals.Source : Annual Returns.

181
Non-Banking Financial Institutions
Region-Wise Composition of Deposits Held byNBFCs
5.67 Following the trend of the previous year,deposits held by NBFCs across all the regionsdeclined during 2006-07 (Table V.19). As in theprevious year, the Southern region accounted forthe largest share of deposits (79.3 per cent),followed by the Northern region and the Westernregion. The presence of NBFCs in the North-Eastern region reduced to nil during the year.Among the metropolitan cities, Chennai emergedat the top in terms of amount of deposits held,while Delhi ranked first in terms of number ofNBFCs.
Interest Rate on Public Deposits with NBFCs
5.68 The share of deposits contracted by NBFCsin the interest rates up to 10 per cent increased(89.5 per cent from 83.6 per cent), while thosecontracted in other interest rate ranges declinedduring the year (Table V.20).
Maturity Pattern of Public Deposits
5.69 Deposits with the maturity period of up to2 years and between 3-5 years declined duringthe year. Deposits in the maturity bucket of ‘morethan 2 and up to 3 years’ increased marginally,while deposits in the maturity bucket of ‘5 yearsand above’ increased significantly at end-March
Table V.18: Range of Deposits held by NBFCs-D
(Amount in Rs. crore)
Deposit Range As at end-March
No. of NBFCs Amount of Deposit
2006 2007 2006 2007 P
1 2 3 4 5
1. Less than Rs. 0.5 crore 255 218 39 30 (1.6) (1.5)2. More than Rs. 0.5 crore and up to Rs. 2 crore 107 89 100 83 (4.1) (4.1)3. More than Rs.2 crore and up to Rs.10 crore 42 34 182 152 (7.4) (7.4)4. More than Rs.10 crore and up to Rs.20 crore 15 7 211 93 (8.6) (4.6)5. More than Rs.20 crore and up to Rs.50 crore 3 4 102 151
(4.2) (7.4)6. Rs.50 crore and above 10 7 1,813 1,533 (74.1) (75.1)Total (1 to 6) 432 359 2,447 2,042
P : Provisional.Note : Figures in brackets represent percentages in the respective totals.Source : Annual Returns.
Table V.19: Public Deposits held byNBFCs-D – Region-wise
(Amount in Rs. crore)
As at end-March
Region 2006 2007 P
Number Amount Number Amount
1 2 3 4 5
1. Central 63 34 59 27 (1.4) (1.3)
2. Eastern 12 59 8 21 (2.4) (1.0)
3. North-Eastern 1 0 0 0 (0.0) (0.0)
4. Northern 215 333 191 288 (13.6) (14.1)
5. Southern 114 1,917 78 1,620 (78.3) (79.3)
6. Western 27 104 23 86 (4.2) (4.2)
Total (1 to 6) 432 2,447 359 2,042
Memo:Metropolitan cities:1. Mumbai 13 94 10 782. Chennai 69 1,740 41 1,5163. Kolkata 9 46 6 214. New Delhi 73 240 69 219Total (1 to 4) 164 2,120 126 1,834
P : Provisional.Note : Figures in brackets are percentages in the respective totals.Source: Annual Returns.

182
Report on Trend and Progress of Banking in India, 2006-07
Table V.20: Distribution of Public Deposits ofNBFCs-D According to Rate of Interest
(Amount in Rs. crore)
Interest Range As at end-March
2006 2007 P
1 2 3
Up to 10 per cent 2,047 1,828 (83.6) (89.5)More than 10 per cent and up to 12 per cent 318 195
(13.0) (9.6)12 per cent and above 82 19 (3.4) (0.9)Total 2,447 2,042
P : Provisional.Note : Figures in brackets are percentages to the respective totals.Source: Annual Returns.
2007. As a result, their share in total depositsincreased (Table V.21).
5.70 The spread between the maximum interestrate on public sector bank deposits of ‘one to threeyear’ maturity and the interest rate offered byNBFCs on deposits with the same maturitynarrowed to 1.50 percentage points at end-March2007 from 4.25 percentage points at end-March2006 (Table V.22). Subsequently, however, theceiling interest rate for NBFCs was revisedupwards to 12.50 per cent with effect from April24, 2007 as a result of which the spread haswidened to 3.00 percentage points.
Table V.22: Spread in Deposit Interest Rates ofBanks and NBFCs
(Per cent)
Interest Rate As at end-March
2002 2003 2004 2005 2006 2007
1 2 3 4 5 6 7
1. Maximum interestrate on public sectorbank deposits of1-3 year maturity 8.50 6.75 6.75 6.50 6.75 9.50
2. Ceiling interest ratefor NBFCs 12.50 11.00 11.00 11.00 11.00 11.00
3. Spread (2-1) 4.00 4.25 4.25 4.50 4.25 1.50
Borrowings by NBFCs-D
5.71 The outstanding borrowings by NBFCsincreased by 30.6 per cent during 2006-07(Table V.23). Borrowings by equipment leasing andhire purchase companies and investmentcompanies declined, partly reflecting thereclassification of NBFCs, while those by loancompanies increased during the year. AFCs heldthe largest share of borrowings of all NBFCs,followed by hire purchase companies.
5.72 Borrowings by NBFCs from externalsources, and from banks and f inancialinstitutions increased sharply by 95.9 per centand 52.6 per cent, respectively, during 2006-07(Table V.24). Borrowings from other sources grew
Table V.21: Maturity Pattern of Public Depositsheld by NBFCs-D
(Amount in Rs. crore)
Maturity Period@ As at end-March
2006 2007 P
1 2 3
1. Less than 1 year 878 695(35.9) (34.1)
2. More than 1 and up to 2 years 648 473(26.5) (23.2)
3. More than 2 and up to 3 years 559 560(22.8) (27.4)
4. More than 3 and up to 5 years 360 234(14.7) (11.4)
5. 5 years and above 3 80(0.1) (3.9)
Total 2,447 2,042
@ : Based on the of residual maturity of outstanding deposits.P : Provisional.Note : Figures in brackets are percentages to the respective totals.Source: Annual Returns.
Table V.23: Borrowings by NBFCs-D – Group-wise (Amount in Rs. crore)
NBFC Group As at end-March Percentage
No. of NBFCs Total BorrowingsVariation
2006 2007 P 2006 2007 P 2006-07
1 2 3 4 5 6
Asset Finance @ – 72 – 19,091 – (58.6)
Equipment Leasing 37 28 2,309 128 -94.4 (9.3) (0.4)
Hire Purchase 339 231 19,493 10,478 -46.2 (78.2) (32.2)
Investment Companies 5 3 697 133 -80.9 (2.8) (0.4)
Loan Companies 51 25 2,442 2,732 11.9 (9.8) (8.4)
Total 432 359 24,942 32,563 30.6
P : Provisional. – : Not applicable.@ : New classification of NBFCs, viz., asset finance company (AFC)
became effective since December 2006. Companies financingreal/physical assets for productive/economic activities are re-classified as AFCs.
Note : Figures in brackets are percentages to total borrowings.Source : Annual Returns.

183
Non-Banking Financial Institutions
by 39.8 per cent during the year. However,borrowings from the Government declinedsharply during 2006-07. Borrowings from theGovernment relate to one State-owned NBFCoperating in the southern region.
Assets of NBFCs-D5.73 The decline in the assets of equipmentleasing and hire purchase companies reflects the
reclassification of the NBFCs. Loans and advancesas well as investments increased during the year.The sharp decline in total advances andinvestments of equipment leasing companies andhire purchase companies reflected thereclassification of NBFCs (Table V.25). At end-March 2007, 55 per cent of total loans andadvances and 32.1 per cent of investments by allNBFCs were held by asset finance companies.
Table V.24: Sources of Borrowings by NBFCs-D – Group-wise
(Amount in Rs. crore)
NBFC Group As at end-March
Government External Banks and Financial Debentures Others TotalSources @ Institutions
2006 2007 P 2006 2007 P 2006 2007 P 2006 2007 P 2006 2007 P 2006 2007 P
1 2 3 4 5 6 7 8 9 10 11 12 13
Asset Finance # .. .. .. 975 . . 9,148 . . 5,808 . . 3,159 .. 19,091Equipment Leasing – – 284 – 1,404 39 338 – 283 89 2,309 128 (-97.2) (-68.6) (-94.4)Hire Purchase – – 329 225 7,113 4,203 7,165 1,847 4,886 4,203 19,493 10,478
(-31.4) (-40.9) (-74.2) (-14.0) (-46.2)Investment 533 – – – – – 9 7 155 126 697 133
(84.0) (-22.1) (-18.7) (-80.2)Loan 110 25 – – 1,263 1,531 930 1,115 141 61 2,442 2,732
(-77.0) – (21.3) (20.0) (-56.9) (-11.9)Total 643 25 613 1,201 9,779 14,923 8,442 8,777 5,465 7,637 24,942 32,563
(-96.1) (95.9) (52.6) (4.0) (39.8) (30.6)
P : Provisional. .. : Not applicable. – : Nil/negligible.@ : Comprises of (i) Foreign Government, (ii) Foreign Authority, and (iii) Foreign Citizen or Person.# : New classification of NBFCs, viz., asset finance company (AFC) became effective since December 2006. Companies financing real/physical
assets for productive/economic activities are reclassified as AFCs.Note : Figures in brackets are percentage variations over the previous year.Source : Annual Returns.
Table V.25: Major Components of Assets of NBFCs-D – Group-wise
(Amount in Rs. crore)
NBFC Group As at end-March
Assets Advances Investment
2006 2007 P 2006 2007 P 2006 2007 P
1 2 3 4 5 6 7
Asset Finance @ – 24,718 – 20,882 – 2,413(51.5) (55.0) (32.1)
Equipment Leasing 3,497 325 3,150 252 366 56(9.2) (0.7) (9.8) (0.7) (8.5) (0.7)
Hire Purchase 28,845 17,156 25,479 14,572 2,068 1,722(76.3) (35.7) (79.0) (38.4) (47.8) (22.9)
Investment 1,610 1,633 620 498 968 1,110(4.3) (3.4) (1.9) (1.3) (22.4) (14.8)
Loan 3,876 4,167 2,992 1,787 924 2,207(10.2) (8.7) (9.3) (4.7) (21.4) (29.4)
Total 37,828 47,999 32,241 37,991 4,326 7,508
P : Provisional. – : Not applicable.@ : New classification of NBFCs, viz., asset finance company (AFC) became effective since December 2006. Companies financing real/physical
assets for productive/economic activities are re-classified as AFCs.Note : Figures in brackets are percentages to respective totals.Source : Annual Returns.

184
Report on Trend and Progress of Banking in India, 2006-07
Table V.27: Distribution of Assets ofNBFCs-D- Activity-wise
(Amount in Rs. crore)
Activity As at Percentageend-March Variation
2006 2007 P 2005-06 2006-07 P
1 2 3 4 5
1. Loans and Inter- 10,686 10,602 -27.8 -0.8corporate deposits (28.2) (22.1)
2. Investments 4,326 7,508 -9.3 73.5(11.4) (15.6)
3. Hire Purchase 20,008 26,048 38.1 30.2(52.9) (54.3)
4. Equipment and 617 726 -21.3 17.7Leasing (1.6) (1.5)
5. Bills 44 6 -90.5 -85.7(0.1) (0.0)
6. Other assets 2,146 3,108 -39.1 44.8(5.7) (6.5)
Total (1 to 6) 37,828 47,999 -1.2 26.9
P : Provisional.Note : Figures in brackets are percentages in respective totals.Source : Annual Returns.
Distribution of NBFCs-D According to Asset Size
5.74 The asset size of NBFCs varies significantlyfrom less than Rs.25 lakh to more than Rs.500crore. The decline in the number of reportingcompanies (from 432 at end-March 2006 to 359at end-March 2007) was on account of a declinein the number of companies in all asset ranges,except the marginal rise in the ‘above Rs.500crore’ category. The asset holding patternremained skewed. Fifteen NBFCs with asset sizeof ‘above Rs.500 crore’ held 92.6 per cent of totalassets of all NBFCs, while the remaining 344NBFCs held 7.4 per cent of total assets at end-March 2007 (Table V.26).
Distribution of Assets of NBFCs – DType of Activity
5.75 While assets held in the form of investmentsand equipment leasing and other assets witnesseda sharp turnaround during 2006-07, assets in theform of hire purchase witnessed a slower growth.Assets in the form of loans and bills continued todecline during the year. Assets held in the hire-purchase activity accounted for the largest share(54.3 per cent), followed by loans and inter-corporate deposits (22.1 per cent), investments
Table V.26: NBFCs-D According to Asset Size(Amount in Rs. crore)
Asset size As at end-March
No. of reporting companies Assets
2006 2007 P 2006 2007 P
1 2 3 4 5
1. Less than Rs. 0.25 crore 10 8 1 1(0.0) (0.0)
2. More than Rs. 0.25 crore and up to Rs. 0.50 crore 35 28 1 3 11 (0.0) (0.0)
3. More than Rs. 0.50 crore and up to Rs. 2 crore 187 155 215 176 (0.6) (0.4)
4. More than Rs. 2 crore and up to Rs. 10 crore 119 97 551 418 (1.5) (0.9)
5. More than Rs. 10 crore and up to Rs. 50 crore 48 43 1,127 1,024 (3.0) (2.1)
6. More than Rs. 50 crore and up to Rs. 100 crore 7 5 473 339 (1.3) (0.7)
7. More than Rs. 100 crore and up to Rs. 500 crore 12 8 2,362 1,598 (6.2) (3.3)
8. Above Rs. 500 crore 14 15 33,085 44,433(87.5) (92.6)
Total (1 to 8) 432 359 37,828 47,999
P: Provisional.Note : Figures in brackets are percentages in respective totals.Source : Annual Returns.
(15.6 per cent) and equipment leasing (1.5 percent) (Table V.27).

185
Non-Banking Financial Institutions
Table V.29: Non-performing Assets of NBFCs-D
(Per cent)
End-March Gross NPAs to Net NPAs toGross Advances Net Advances
1 2 3
2001 11.5 5.62002 10.6 3.92003 8.8 2.72004 8.2 2.42005 5.7 2.52006 3.6 0.52007 P 1.9 0.4
P : Provisional.Source : Half - Yearly Returns.
Financial Performance of NBFCs-D
5.76 Financial performance of NBFCs turnedaround during 2006-07. This was entirely onaccount of sharp rise in fund based income (26.6per cent), which offset the sharp increase inoperating expenditure (33.1 per cent) and financialexpenditure (30.0 per cent). As a result, theoperating profits increased by 12.7 per cent andthe net profits by 1.8 per cent. The cost to incomeratio increased moderately (to 83.5 per cent in2006-07 from 81.6 per cent in 2005-06) (Table V.28).
5.77 While income as percentage of assetsdeclined marginally, expenditure (includingprovisions) as percentage of assets increasedmarginally, resulting in a decline in the net profitsto asset ratio (Chart V.3).
Soundness Indicators
Asset Quality of NBFCs-D
5.78 In continuation of the trend witnessedduring the last few years, gross NPAs (aspercentage of gross advances) as well as net NPAs(as percentage of net advances) of reportingNBFCs declined further during the year endedMarch 2007 (Table V.29).
5.79 Gross NPAs (as percentage of grossadvances) of equipment leasing and investmentcompanies increased during 2006-07, while thoseof loan companies and hire purchase companiesdeclined. Net NPAs (as percentage of net advances)also showed a decline in the case of equipmentleasing and loan companies (Table V.30).
Table V.28: Financial Performance of NBFCs-D(Amount in Rs. crore)
Indicator As at end-March Percentage Variation
2006 2007 P 2005-06 2006-07
1 2 3 4 5
A. Income (i+ii) 4,599 5,770 -0.1 25.4
(i) Fund Based 4,453 5,635 5.3 26.6(96.8) (97.7)
(ii) Fee-Based 147 134 -61.2 -8.3(3.2) (2.3)
B. Expenditure (i+ii+iii) 3,753 4,816 13.0 28.3
(i) Financial 2,144 2,787 0.3 30.0(57.1) (57.9)
of which:Interest Payment 541 540 – -0.2
(ii) Operating 945 1,257 31.6 33.1(25.2) (26.1)
(iii) Others 664 772 16.2(17.7) (16.0)
C. Tax Provisions 291 388 -17.6 33.3
D. Operating Profit (PBT) 847 954 -52.1 12.7
E. Net Profit (PAT) 556 566 -73.4 1.8
F. Total Assets 37,828 47,999 -1.2 26.9
G. Financial Ratios * i) Income 12.2 12.0 ii) Fund Income 11.8 11.7 iii) Fee Income 0.4 0.3 iv) Expenditure 9.9 10.0 v) Financial Expenditure 5.7 5.8 vi) Operating Expenditure 2.5 2.6 vii) Tax Provision 0.8 0.8 viii) Net Profit 1.5 1.2
H. Cost to Income Ratio 81.6 83.5
* : As percentage to total assets.P : Provisional.Note : Figures in brackets are percentages in respective totals.Source : Annual Returns.

186
Report on Trend and Progress of Banking in India, 2006-07
Table V.30: NPAs of NBFCs-D – Group-wise(Amount in Rs. crore)
NBFC Group Gross Gross NPAs Net Net NPAsEnd-March Advances Amount Per cent to Per cent Advances Amount Per cent to Per cent to
Gross to Assets Net AssetsAdvances Advances
1 2 3 4 5 6 7 8 9
Asset Finance @ 2007 P 11,799 258 2.2 2.1 11,525 -15 -0.1 -0.1
Equipment Leasing 2005 4,187 514 12.3 11.0 4,018 345 8.6 7.42006 2,878 69 2.4 2.2 2,786 -23 -0.8 -0.72007 P 1,035 41 4.0 3.7 973 -21 -2.1 -1.9
Hire Purchase 2005 15,900 610 3.8 3.6 15,544 253 1.6 1.52006 17,607 444 2.5 2.4 17,238 74 0.4 0.42007 P 18,079 321 1.8 1.6 17,842 83 0.5 0.4
Investment 2005 58 10 18.0 1.8 58 10 18.0 1.82006 59 0 0.4 0.0 59 0 0.4 0.02007 P 31 1 2.8 0.1 31 1 2.8 0.1
Loan 2005 1,955 117 6.0 5.1 1,772 -65 -3.7 -2.82006 690 252 36.5 19.3 483 45 9.3 3.42007 P 7,551 94 1.2 4.6 7,548 91 1.2 4.4
P : Provisional@ : New classification of NBFCs, viz., asset finance company (AFC) became effective since December 2006. Companies financing real/
physical assets for productive/economic activities are re-classified as AFCs.Source : Half-yearly returns of reporting NBFCs.
5.80 Asset quality of various types of NBFCs asreflected in the various categories of NPAs (sub-standard, doubtful and loss) remained broadly atthe previous year’s level, barring NPAs of loancompanies which declined significantly in allcategories (Table V.31).
Capital Adequacy Ratio
5.81 The capital to risk-weighted assets ratio(CRAR) norms were made applicable to NBFCsin 1998, in terms of which every deposit-takingNBFC is required to maintain a minimum capital,consisting of Tier-I and Tier-II capital, of not lessthan 12 per cent (15 per cent in the case ofunrated deposit-taking loan/investmentcompanies) of its aggregate risk-weighted assetsand of risk-adjusted value of off-balance sheetitems. Total of Tier-II capital, at any point of time,cannot exceed 100 per cent of Tier-I capital. Thenumber of NBFCs with less than the minimumregulatory CRAR of 12 per cent declined to 13 at
end-March 2007 from 37 at end-March 2006(Table V.32). At end-March 2007, 319 out of 332NBFCs had CRAR of 12 per cent or more asagainst 364 out of 401 NBFCs at end-March 2006.Number of NBFCs with CRAR more than 30 alsodeclined to 275 at end-March 2007 from 304 atend-March 2006.
5.82 Net owned fund (NOF) of NBFCs is theaggregate of paid-up capital and free reserves,netted by (i) the amount of accumulated losses;and (ii) deferred revenue expenditure; and(iii) other intangible assets, if any, and adjustedby investments in shares, and loans and advancesto (a) subsidiaries, (b) companies in the samegroup, and (c) other NBFCs (in excess of 10 percent of owned fund). Information about NOF cancomplement the information on CRAR. The ratioof public deposits to NOF in the case of equipmentleasing companies declined substantially duringthe year ended March 2007, while that of othercategory companies remained more or less at the

187
Non-Banking Financial Institutions
Table V.31: Classification of Assets of NBFCs-D – Group-wise
(Amount in Rs. crore)
NBFC Group/ Standard Sub-Standard Doubtful Loss Gross GrossEnd-March Assets Assets Assets Assets NPAs Advances
Amount per cent Amount per cent Amount per cent Amount per cent Amount per centto gross to gross to gross to gross to gross
advances advances advances advances advances
1 2 3 4 5 6 7 8 9 10 11 12
Asset Finance @2007 P 11,540 97.8 241 2.0 15 0.1 2 0.0 258 2.2 11,799
Equipment Leasing 2005 3,673 87.7 383 9.1 91 2.2 39 0.9 514 12.3 4,1872006 2,809 97.6 12 0.4 21 0.7 36 1.2 69 2.4 2.8782007 P 994 96.0 4 0.4 2 0.2 35 3.4 41 4.0 1.035
Hire Purchase 2005 15,290 96.2 386 2.4 130 0.8 94 0.6 610 3.8 15,9002006 28,170 97.5 184 0.6 47 0.3 212 0.8 444 1.6 17.6072007 P 17,759 98.4 185 1.0 51 0.3 85 0.5 321 1.8 18.079
Investment 2005 48 82.8 1 1.7 10 17.2 0 0.0 10 17.2 582006 59 99.6 0 0.0 0 0.2 0 0.2 0 0.4 592007 P 31 97.2 1 2.8 0 0.0 0 0.0 1 2.8 31
Loan 2005 1,837 94.0 14 0.7 42 2.1 61 3.1 117 6.0 1,9552006 438 63.5 19 2.7 99 14.3 134 19.4 252 36.5 6902007 P 6,913 98.7 9 0.1 78 1.1 8 0.1 94 1.3 7.551
P : Provisional@ : New classification of NBFCs, viz., asset finance company (AFC) became effective in December 2006. Companies financing real/
physical assets for productive/economic activities are re-classified as AFCs.Source : Half-yearly returns of reporting NBFCs.
previous year’s level. The ratio turned negative inrespect of equipment leasing companies becauseof negative net owned funds. The ratio of public
Table V.32: Capital Adequacy Ratio of NBFCs-D(Per cent)
CRAR Range As at end-March
2006 2007 P
EL HP LC/IC Total AFC EL HP LC/IC Total
1 2 3 4 5 6 7 8 9 10
1) Less than 12 per cent (a+b) 8 23 6 37 0 3 10 0 13a) Less than 9 per cent 8 23 6 37 0 3 10 0 13b) More than 9 and up to 12 per cent 0 0 0 0 0 0 0 0 0
2) More than 12 and up to 15 per cent 0 3 0 3 2 0 2 0 43) More than 15 and up to 20 per cent 0 11 0 11 2 1 7 1 114) More than 20 and up to 30 per cent 5 36 5 46 1 2 21 5 295) Above 30 per cent 24 257 23 304 36 19 200 20 275Total 37 330 34 401 41 25 240 26 332
P : Provisional.Note : AFC: Asset Finance Company; EL - Equipment Leasing; HP: Hire Purchase; LC/IC - Loan Companies/Investment Companies.Source : Half-Yearly Returns.
deposit to NOF for all NBFCs was 0.3 per cent atend-March 2007 as compared with 0.4 per centat end-March 2006 (Table V.33).

188
Report on Trend and Progress of Banking in India, 2006-07
5.83 Net owned funds of NBFCs range from lessthan Rs.25 lakh to above Rs.500 crore. Publicdeposits, as multiple of NOF, held by NBFCs inthe category of NOF of ‘more than Rs.50 croreand up to Rs.100 crore’ increased, while those byNBFCs in all other ranges of NOF generallydeclined (Table V.34).
Residuary Non-Banking Companies (RNBCs)
5.84 Assets of three RNBCs increased by 5.9 percent during the year ended March 2007. Their assetsin the form of unencumbered approved securitiesas well as bonds/debentures increased sharply, whilethose in investments in fixed deposits/certificate of
Table V.33: Net Owned Fund vis-à-vis Public Deposits of NBFCs-D – Group-wise
(Amount in Rs. crore)
NBFC Group Net Owned Funds Public Deposits Ratio of Public Deposits toNet Owned Funds
2005-06 2006-07 P 2005-06 2006-07 P 2005-06 2006-07 P
1 2 3 4 5 6 7
1. Asset Finance @ – 2,673 – 186 – 0.1
2. Equipment Leasing 542 -15 164 43 0.3 -2.9
3. Hire Purchase 4,106 3,159 2,035 1,654 0.5 0.5
4. Investment 766 822 81 45 0.1 0.1
5. Loan 1,080 596 167 114 0.2 0.2
Total (1 to 5) 6,494 7,235 2,447 2,042 0.4 0.3
P : Provisional – : Not applicable.@ : New classification of NBFCs, viz., asset finance company (AFC) became effective in December 2006. Companies financing real/
physical assetsfor productive/economic activities are re-classified as AFCs.Source : Annual Returns.
Table V.34: Range of Net Owned Fund vis-à-vis Public Deposits of NBFCs-D
(Amount in Rs. crore)
Ranges of Net Owned Fund As at end-March
2006 2007 P
No. of Net Owned Public No. of Net Owned PublicCompanies Funds Deposits Companies Funds Deposits
1 2 3 4 5 6 7
1. Up to Rs. 0.25 crore 26 -387 113 17 -279 146-(0.3) -(0.5)
2. More than Rs. 0.25 crore and up to Rs. 2 crore 295 208 140 243 171 96(0.7) (0.6)
3. More than Rs. 2 crore and up to Rs. 10 crore 73 316 180 62 284 129(0.6) (0.5)
4. More than Rs. 10 crore and up to Rs. 50 crore 21 486 417 21 473 268(0.9) (0.6)
5. More than Rs. 50 crore and up to Rs. 100 crore 3 224 5 2 125 45(0.0) (0.4)
6. More than Rs. 100 crore and up to Rs. 500 crore 9 2,095 877 8 1,729 686(0.4) (0.4)
7. Above Rs. 500 crore 5 3,552 716 6 4,733 671(0.2) (0.1)
Total 432 6,494 2447 359 7,235 2,042(0.4) (0.3)
P : ProvisionalNote : Figures in brackets are public deposit as multiple of respective net owned fund.Source : Annual Returns.

189
Non-Banking Financial Institutions
Table V.35: Profile of Residuary Non-Banking Companies
(Amount in Rs. crore)
Item As at end-March Per cent Variation
2006 2007 P 2005-06 2006-07
1 2 3 4 5
A. Assets (i to v) 21,891 23,172 14.9 5.9(i) Investment in Unencumbered Approved Securities 2,346 3,317 15.2 41.4(ii) Investment in Fixed deposits/Certificate of Deposits of
Scheduled Commercial Banks/Public Financial Institutions 6,090 5,604 24.9 -8.0(iii) Debentures/Bonds/Commercial Papers of Govt. Companies/
Public Sector Banks/Public Financial Institution/Corporations 9,577 11,700 3.8 22.2(iv) Other investments 1,658 1,156 1.2 -30.3(v) Other Assets 2,220 1,395 72.7 -37.2
B. Net Owned Funds 1,183 1,366 11.1 15.5
C. Total Income (i+ii) 1,620 1,893 5.7 16.9(i) Fund Income 1,616 1,886 5.6 16.7(ii) Fee Income 3 8 50.0 166.7
D. Total Expenses (i+ii+iii) 1,439 1,648 3.1 14.5(i) Financial Cost 1,165 1,230 -0.9 5.5(ii) Operating Cost 159 284 8.9 78.6(iii) Other cost 114 134 55.4 17.5
E. Provision for Taxation 22 44 -54.2 100.0
F. Operating Profit (PBT) 180 246 32.4 36.7
G. Net profit (PAT) 158 201 79.5 27.1
P : Provisional.Note : PBT - Profit Before Tax; PAT - Profit After Tax.Source : Annual Returns.
deposits of SCBs and other instruments registereda decline. Net owned funds of RNBCs increasedby 15.5 per cent during 2006-07 (Table V.35).
5.85 The increase in income of RNBCs during2006-07 was more than the increase inexpenditure, as a result of which the operatingprofit of RNBCs increased. The provision fortaxation also registered a sharp rise. As a result,net profit of RNBCs increased by only 27.1 percent during 2006-07 as compared with 79.5 percent during 2005-06.
Regional Pattern of Deposits of RNBCs
5.86 Of the three RNBCs, two are based in theEastern region (Kolkata) and one in the Centralregion. While public deposits held by RNBCs inthe Eastern region registered a marginal decline,those held in the Central region increasedmoderately. Of the four metropolitan cities,RNBCs held public deposits only in onemetropolitan city, i.e., Kolkata (Table V.36).
Investment Pattern of RNBCs
5.87 The investment pattern of RNBCs asprescribed in the Residuary Non-Banking (ReserveBank) Directions, 1987 was reviewed andmodified on March 31, 2006. The aggregateliability to depositor (ALD) was bifurcated undertwo heads, viz., aggregate liability to depositor(ALD) as on December 31, 2005 and incrementalALDs. Incremental ALDs are the liabilities to thedepositors exceeding the aggregate amount of theliabilities to the depositors as on December 31,2005. RNBCs were advised to invest, with effectfrom April 1, 2006, not less than 95 per cent ofthe ALD as on December 31, 2005 and the entireincremental ALD in the prescribed manner.RNBCs were also advised that on and from April1, 2007, the entire amount of ALD would beinvested in directed investments only and nodiscretionary investment would be allowed to bemade by them.
5.88 ALDs increased by 12.1 per cent during2006-07. The pattern of deployment of ALDs

190
Report on Trend and Progress of Banking in India, 2006-07
Table V.36: Public Deposits held by RNBCsRegion-wise
(Amount in Rs. crore)
Region As at end-March
2006 2007 P
No. of Amount No. of AmountRNBCs RNBCs
1 2 3 4 5
1. Northern – – – –2. North-Eastern – – – –3. Eastern 2 4,614 2 4,514
(23) (20)4. Central 1 15,561 1 18,108
(77) (80)5. Western – – – –6. Southern – – – –
Total (1 to 6) 3 20,175 3 22,622
Memo:Metropolitan Cities:1. Mumbai – – – –2. Chennai – – – –3. Kolkata 2 4,614 2 4,5144. New Delhi – – – –
Total (1 to 4) 2 4,614 2 4,514
– : Nil/Negligible. P: Provisional.Note : Figures in brackets are percentages to respective totals.Source : Annual Returns.
remained broadly unchanged during the year(Table V.37).
Non-Deposit Taking Systemically Important Non-Banking Finance Companies (NBFC- ND -SI)
5.89 Information based on the returns receivedfrom 173 non-deposit taking systemically
important NBFCs (with asset size of Rs.100 croreand above) for the year ended March 2007 showedan increase of 26.8 per cent in their liabilities/assets over the year ended March 2006. Unsecuredloans constituted the single largest source of fundsfor large sized NBFCs, followed by secured loansand reserves and surplus. This trend continuedduring the quarter ended June 2007 (Table V.38).
Borrowings
5.90 Total borrowings (secured and unsecured)by NBFCs-ND-SI increased by 21.4 per cent toRs.2,11,986 crore during the year ended March2007, constituting 66.7 per cent of their totalliabilities. During the quarter ended June 2007,the liabilities increased further by 6.4 per cent(Table V.39).
Application of Funds
5.91 The pattern of application of funds byNBFCs-ND-SI during the year ended March 2007showed significant variations over the previousyear. While unsecured loans had constituted thesingle largest item on the asset side during 2005-06 (38.4 per cent), secured loans constituted thelargest item on the asset side (41.5 per cent),followed by unsecured loans and long-terminvestments during 2006-07. This trendcontinued during the quarter ended June 2007(Table V.40).
Financial Performance
5.92 NBFCs-ND-SI earned a profit of Rs.7,460crore during the year ended March 2007, which was
Table V.37: Investment Pattern of Residuary Non-Banking Companies(Amount in Rs. crore)
Item End-March Per cent to ALDs
2006 2007 P 2006 2007 P
1 2 3 4 5
A. Aggregated Liabilities to the Depositors (ALD) 20,175 22,622 100.0 100.0
B. Investments (i to iv) 19,671 21,777 97.5 96.3(i) Unencumbered approved securities 2,346 3,317 11.6 14.7(ii) Fixed Deposits with banks 6,090 5,604 30.2 24.8(iii) Bonds or debentures or commercial paper of a Govt. company/
public sector bank/public financial institution/corporation 9,577 11,700 47.5 51.7(iv) Other investments 1,658 1,156 8.2 5.1
P: ProvisionalSource : Annual Returns.
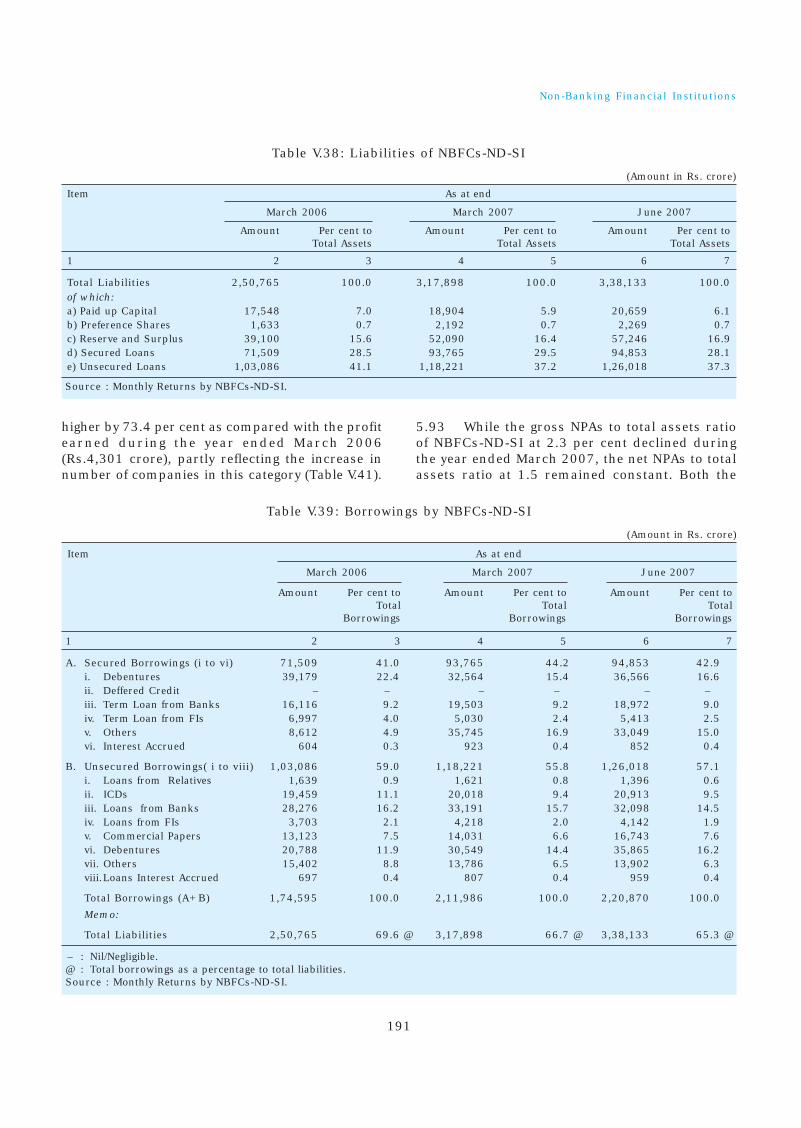
191
Non-Banking Financial Institutions
higher by 73.4 per cent as compared with the profitearned during the year ended March 2006(Rs.4,301 crore), partly reflecting the increase innumber of companies in this category (Table V.41).
5.93 While the gross NPAs to total assets ratioof NBFCs-ND-SI at 2.3 per cent declined duringthe year ended March 2007, the net NPAs to totalassets ratio at 1.5 remained constant. Both the
Table V.39: Borrowings by NBFCs-ND-SI
(Amount in Rs. crore)
Item As at end
March 2006 March 2007 June 2007
Amount Per cent to Amount Per cent to Amount Per cent to Total Total Total
Borrowings Borrowings Borrowings
1 2 3 4 5 6 7
A. Secured Borrowings (i to vi) 71,509 41.0 93,765 44.2 94,853 42.9i. Debentures 39,179 22.4 32,564 15.4 36,566 16.6ii. Deffered Credit – – – – – –iii. Term Loan from Banks 16,116 9.2 19,503 9.2 18,972 9.0iv. Term Loan from FIs 6,997 4.0 5,030 2.4 5,413 2.5v. Others 8,612 4.9 35,745 16.9 33,049 15.0vi. Interest Accrued 604 0.3 923 0.4 852 0.4
B. Unsecured Borrowings( i to viii) 1,03,086 59.0 1,18,221 55.8 1,26,018 57.1i. Loans from Relatives 1,639 0.9 1,621 0.8 1,396 0.6ii. ICDs 19,459 11.1 20,018 9.4 20,913 9.5iii. Loans from Banks 28,276 16.2 33,191 15.7 32,098 14.5iv. Loans from FIs 3,703 2.1 4,218 2.0 4,142 1.9v. Commercial Papers 13,123 7.5 14,031 6.6 16,743 7.6vi. Debentures 20,788 11.9 30,549 14.4 35,865 16.2vii. Others 15,402 8.8 13,786 6.5 13,902 6.3viii.Loans Interest Accrued 697 0.4 807 0.4 959 0.4
Total Borrowings (A+B) 1,74,595 100.0 2,11,986 100.0 2,20,870 100.0
Memo:
Total Liabilities 2,50,765 69.6 @ 3,17,898 66.7 @ 3,38,133 65.3 @
– : Nil/Negligible.@ : Total borrowings as a percentage to total liabilities.Source : Monthly Returns by NBFCs-ND-SI.
Table V.38: Liabilities of NBFCs-ND-SI
(Amount in Rs. crore)
Item As at end
March 2006 March 2007 June 2007
Amount Per cent to Amount Per cent to Amount Per cent to Total Assets Total Assets Total Assets
1 2 3 4 5 6 7
Total Liabilities 2,50,765 100.0 3,17,898 100.0 3,38,133 100.0of which: a) Paid up Capital 17,548 7.0 18,904 5.9 20,659 6.1b) Preference Shares 1,633 0.7 2,192 0.7 2,269 0.7c) Reserve and Surplus 39,100 15.6 52,090 16.4 57,246 16.9d) Secured Loans 71,509 28.5 93,765 29.5 94,853 28.1e) Unsecured Loans 1,03,086 41.1 1,18,221 37.2 1,26,018 37.3
Source : Monthly Returns by NBFCs-ND-SI.

192
Report on Trend and Progress of Banking in India, 2006-07
Table V.42: Gross and Net NPAs ofNBFCs-ND-SI
(Per cent)
Item As at end
March March June2006 2007 2007
1 2 3 4
1. Gross NPAs to Total Assets 4.3 2.3 2.02. Net NPAs to Total Assets 1.5 1.5 1.03. Gross NPAs to Total Credit Exposure 7.0 4.9 4.84. Net NPAs to Total Credit Exposure 3.2 1.9 1.9
Source : Monthly Returns by NBFCs-ND-SI.
ratios, however, declined further during thequarter ended June 2007 (Table V.42).
Table V.40: Select Indicators on Application of Funds by NBFCs-ND-SI(Amount in Rs. crore)
As at end
Item March 2006 March 2007 June 2007
Amount Per cent to Total Amount Per cent to Total Amount Per cent to TotalApplication of Application of Application of
Funds Funds Funds
1 2 3 4 5 6 7
Secured Loan 63,120 29.2 1,14,898 41.5 1,25,417 42.5Unsecured Loan 82,996 38.4 69,609 25.2 74,050 25.1Hire Purchase Assets 22,613 10.5 28,160 10.2 28,221 9.6Long-term Investment 30,817 14.3 43,309 15.7 47,350 16.0Current Investment 16,665 7.7 20,671 7.5 20,236 6.9Total 2,16,211 100.0 2,76,647 100.0 2,95,274 100.0
Memo:Capital Market Exposure 59,583 27.6 81,435 29.4 84,947 28.8
of which:Equity Market 27,467 12.7 34,196 12.4 31,658 10.7
Source : Monthly Returns by NBFCs-ND-SI.
4. Primary Dealers
5.94 The primary dealer (PD) system underwentsignificant changes during 2006-07. PDs, asunderwriters to the Government’s marketborrowing and market makers in Governmentsecurities, are exposed to significant market risk.In order to diversify the risks inherent in the PDbusiness, PDs were permitted to diversify intoother business lines while retaining therequirement of maintaining predominance inGovernment securities business. PDs were allowedto diversify their investments into corporate debt,equity and securitisation instruments, subject tocertain prudential limits so as to enable them todiversify their balance sheet risks. They were alsoallowed to offer certain fee based services.
5.95 Concomitantly, it was decided that PDswould not be permitted to set up step-downsubsidiaries. Those PDs that already had step-down subsidiaries (in India and abroad) wereadvised to restructure the ownership pattern ofthose subsidiaries. This was done to ensure thatthe balance sheet of the PD does not get affectedby the spillover of risks from other businesses/subsidiaries and that the business of the PDs isfocused on their primary dealership activities.Consequently, five out of eight stand-alone PDs,which either had step-down subsidiaries orundertook businesses other than those specificallypermitted, were required to restructure theiroperations.
Table V.41: Financial Performance ofNBFCs-ND-SI
(Amount in Rs. crore)
Item Year Ended Quarter Ended
Mar-06 Mar-07 Jun-07
Amount Per Amount Per Amount Percent cent cent
to tototal total
Assets Assets
1 2 3 4 5 6 7
Total Assets 2,50,765 100 3,17,898 100 3,38,133 100Total Income@ 18,342 7.3 31,281 9.8 8,772 2.6Total Expenses@ 11,874 4.7 20,552 6.5 6,329 1.9Net Profit@ 4,301 1.7 7,460 2.3 1,963 0.6
@ : Cumulative.Source : Monthly Returns by NBFCs-ND-SI.

193
Non-Banking Financial Institutions
5.96 In compliance with these guidelines, fivePDs, namely DSP Merrill Lynch Ltd. (DSPML),ICICI Securities Ltd. (ISEC), IDBI Capital MarketServices Ltd. (ICMS), Securities and TradingCorporation of India Ltd. (STCI) and KotakMahindra Capital Company Ltd. (KMCC)restructured their operations as they either hadstep-down subsidiaries or they were undertakingequity broking business, which were not permittedunder the guidelines. However, the approach tothe restructuring process followed by these PDswas different. KMCC transferred the PD businessto the parent bank (Kotak Mahindra Bank). ISECrestructured its subsidiaries so as to make themdirect subsidiaries of ICICI Bank, while retainingthe PD business with itself. It subsequentlyrenamed itself as ICICI Securities PrimaryDealership Ltd. (SEC-PD). STCI was restructuredby setting up another subsidiary, viz., STCIPrimary Dealer Ltd. (STCI-PD) to undertake PDbusiness. In the case of ICMS, IDBI Gilts Ltd, adirect subsidiary of IDBI Bank Ltd. was set up totake over the PD business from ICMS. DSPML wasrestructured by setting up another subsidiary inthe name of DSPML Securities Trading Ltd.(DSPMLST) for conducting the PD business.
5.97 During the year, the permitted structureof PD business was expanded to include banks,which fulfill certain minimum criteria subject tosafeguards. Nine banks, viz., Citibank N.A.,Standard Chartered Bank, HSBC Bank, Bank ofAmerica, J.P. Morgan Chase Bank, Bank ofBaroda, Canara Bank, Kotak Mahindra Bank andCorporation Bank were authorised to undertakePD business departmentally while discontinuingthe same from their respective subsidiaries/groupcompanies. One new bank, viz., HDFC Bank Ltd.,was authorised to undertake PD business fromApril 2, 2007.
5.98 Keeping in view the increasedresponsibility of PDs in the wake of the FRBMAct, 2003, changes were made in the system ofunderwriting the issues of dated Governmentsecurities by PDs. The revised system envisagesunderwriting the entire issue in an auction. Thetwin policy measures of expanding the permittedstructure of the PD system to include banks andrevising the scheme of underwriting havecontributed to successful debt management in thepost-FRBM scenario. Stand-alone PDs continuedto remain adequately capitalised. Although theCRAR of PDs at 33 per cent as on March 31, 2007
declined from the previous year’s level, it was muchin excess of the stipulated minimum of 15 per centof aggregate risk-weighted assets (Table V.43 andAppendix Table V.5).
Operations and Performance of PDs
5.99 During 2006-07, cumulative biddingcommitments in Treasury Bills auctions werefixed at 111 per cent of the issue amount underthe normal borrowing programme. The aggregatebids at Rs.2,07,711 crore were 3.2 times theTreasury Bills issuances of Rs.65,500 crore(under the normal/regular borrowing programme)and 1.1 times of the Treasury Bills issuances ofRs.1,85,000 crore [(under the normal/regularborrowing programme and market stabilisationscheme (MSS)]. Of the total bids of Rs.2, 07,111crore, bids amounting to Rs.70,951 crore wereaccepted. PDs are required to achieve a successratio of 40 per cent of bidding commitment inrespect of Treasury Bills auctions on a half-yearlybasis. The share of PDs in primary marketpurchases in Treasury Bills auctions (includingMSS) was marginally higher during 2006-07 at 38per cent as against 34 per cent during 2005-06.
5.100 In terms of the Fiscal Responsibility andBudget Management Act, 2003, the Reserve Bankwas precluded from participating in the primaryauctions of Central Government securities. ThePDs were, therefore, enjoined to underwrite the
Table V.43: Select Indicators of Primary Dealers(At end-March)
(Amount in Rs. crore)
Item 2005 2006 $ 2007
1 2 3 4
Total Assets* 13,953 10,749 13,557
Of which: 8,495 6,646 7,412Government Securities
Government securities 61 62 55as percentage of total assets
Total Capital Funds 5,992 4,229 4,026
CRAR (in per cent) 57 53 33
Liquidity Support Limit 3,000 3,000 3,000
No. of PDs 17 8 8
* : Net of current assets and liabilities$ : In view of the sharp reduction in the number of PDs
operating during 2006-07, the figures for 2005-06 and2006-07 are not strictly comparable. Comparable datafor 2005-06 are presented in column 3 for the eight PDsoperational during 2006-07.
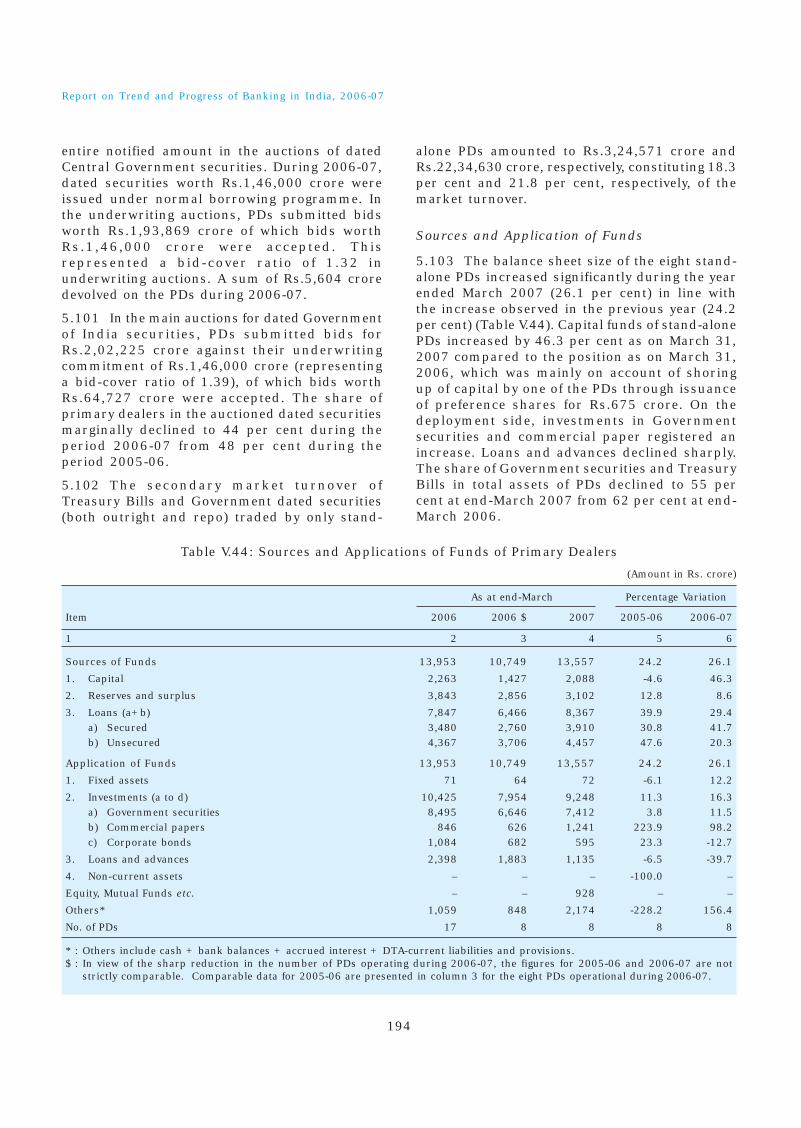
194
Report on Trend and Progress of Banking in India, 2006-07
Table V.44: Sources and Applications of Funds of Primary Dealers
(Amount in Rs. crore)
As at end-March Percentage Variation
Item 2006 2006 $ 2007 2005-06 2006-07
1 2 3 4 5 6
Sources of Funds 13,953 10,749 13,557 24.2 26.1
1. Capital 2,263 1,427 2,088 -4.6 46.3
2. Reserves and surplus 3,843 2,856 3,102 12.8 8.6
3. Loans (a+b) 7,847 6,466 8,367 39.9 29.4a) Secured 3,480 2,760 3,910 30.8 41.7b) Unsecured 4,367 3,706 4,457 47.6 20.3
Application of Funds 13,953 10,749 13,557 24.2 26.1
1. Fixed assets 71 64 72 -6.1 12.2
2. Investments (a to d) 10,425 7,954 9,248 11.3 16.3a) Government securities 8,495 6,646 7,412 3.8 11.5b) Commercial papers 846 626 1,241 223.9 98.2c) Corporate bonds 1,084 682 595 23.3 -12.7
3. Loans and advances 2,398 1,883 1,135 -6.5 -39.7
4. Non-current assets – – – -100.0 –
Equity, Mutual Funds etc. – – 928 – –
Others* 1,059 848 2,174 -228.2 156.4
No. of PDs 17 8 8 8 8
* : Others include cash + bank balances + accrued interest + DTA-current liabilities and provisions.$ : In view of the sharp reduction in the number of PDs operating during 2006-07, the figures for 2005-06 and 2006-07 are not
strictly comparable. Comparable data for 2005-06 are presented in column 3 for the eight PDs operational during 2006-07.
entire notified amount in the auctions of datedCentral Government securities. During 2006-07,dated securities worth Rs.1,46,000 crore wereissued under normal borrowing programme. Inthe underwriting auctions, PDs submitted bidsworth Rs.1,93,869 crore of which bids worthRs.1,46,000 crore were accepted. Thisrepresented a bid-cover ratio of 1.32 inunderwriting auctions. A sum of Rs.5,604 croredevolved on the PDs during 2006-07.
5.101 In the main auctions for dated Governmentof India securities, PDs submitted bids forRs.2,02,225 crore against their underwritingcommitment of Rs.1,46,000 crore (representinga bid-cover ratio of 1.39), of which bids worthRs.64,727 crore were accepted. The share ofprimary dealers in the auctioned dated securitiesmarginally declined to 44 per cent during theperiod 2006-07 from 48 per cent during theperiod 2005-06.
5.102 The secondary market turnover ofTreasury Bills and Government dated securities(both outright and repo) traded by only stand-
alone PDs amounted to Rs.3,24,571 crore andRs.22,34,630 crore, respectively, constituting 18.3per cent and 21.8 per cent, respectively, of themarket turnover.
Sources and Application of Funds
5.103 The balance sheet size of the eight stand-alone PDs increased significantly during the yearended March 2007 (26.1 per cent) in line withthe increase observed in the previous year (24.2per cent) (Table V.44). Capital funds of stand-alonePDs increased by 46.3 per cent as on March 31,2007 compared to the position as on March 31,2006, which was mainly on account of shoringup of capital by one of the PDs through issuanceof preference shares for Rs.675 crore. On thedeployment side, investments in Governmentsecurities and commercial paper registered anincrease. Loans and advances declined sharply.The share of Government securities and TreasuryBills in total assets of PDs declined to 55 percent at end-March 2007 from 62 per cent at end-March 2006.

195
Non-Banking Financial Institutions
Financial Performance of PDs
5.104 Income earned by stand-alone PDsincreased by 17 per cent during 2006-07, onaccount of significant increase in interest andother income. This rise in income was, however,much lower than that witnessed during theprevious year (204 per cent) in the previous year.However, PDs suffered marginal trading losses.The expenditure of the PDs recorded highergrowth at 49 per cent due to increase in bothinterest expenses and other expenses. As a resultof sharp increase in expenditure, net profits ofthe PDs declined by 20 per cent during 2006-07(Table V.45).
5.105 The number of PDs posting net profitdeclined to six during 2006-07 from eight in theprevious year. The decline in financial performanceof PDs was reflected in return on average assets(ROA), which declined from 4.3 per cent during2005-06 to 3.0 per cent during 2006-07, andreturn on net worth (RoNW), which declined
Table V.46: Financial Indicators ofPrimary Dealers
(Amount in Rs. crore)
Indicator 2005-06 2005-06 $ 2006-07
1 2 3 4
i) Net profit 749 557 444
ii) Average Assets 18,394 13,104 14,984
iii) Return on average assets 4.1 4.3 3.0(in per cent)
Capital Funds 5,992 4,229 4,026
No. of PDs 17 8 8
$ : In view of the sharp reduction in the number of PDs operatingduring 2006-07, the figures for 2005-06 and 2006-07 are notstrictly comparable. Comparable data for 2005-06 arepresented in column 3 for the eight PDs operational during2006-07.
Table V.45: Financial Performance of Primary Dealers
(Amount in Rs. crore)
Percentage Variation
Item 2005-06 2005-06 $ 2006-07 2005-06 2006-07
1 2 3 4 5 6
A. Income (i to iii) 2,153 1,661 1,950 204 17
i) Interest and discount 1,151 814 986 8 21ii) Trading Profit -47 46 -17 -108 -137iii) Other income 1,049 802 979 118 22
B. Expenses (i+ii) 1,150 884 1,314 42 49i) Interest 670 485 668 34 38ii) Administrative Costs 481 398 645 53 62
Profit Before Tax 1,003 778 636 -1142 -18
Profit After Tax 749 557 444 -512 -20
No. of PDs 17 8 8
$ : In view of the sharp reduction in the number of PDs operating during 2006-07, the figures for 2005-06 and 2006-07 are not strictlycomparable. Comparable data for 2005-06 are presented in column 3 for the eight PDs operational during 2006-07.
from 13.6 per cent during 2005-06 to 9.5 percent during 2006-07 (Table V.46 and AppendixTable V.6).