Non-alcoholic fatty liver disease - NICE
346
National Institute for Health and Care Excellence Final version Non-alcoholic fatty liver disease Assessment and management NICE guideline NG49 Methods, evidence and recommendations July 2016 . Developed by the National Guideline Centre, hosted by the Royal College of Physicians
Transcript of Non-alcoholic fatty liver disease - NICE
National Institute for Health and Care Excellence
Final version
Non-alcoholic fatty liver disease
Assessment and management
NICE guideline NG49
Methods, evidence and recommendations
July 2016
.
Developed by the National Guideline Centre, hosted by the Royal College of Physicians

NAFLD
Contents
National Institute for Health and Care Excellence 2016
NAFLD
Disclaimer
Healthcare professionals are expected to take NICE clinical guidelines fully into account when exercising their clinical judgement. However, the guidance does not override the responsibility of healthcare professionals to make decisions appropriate to the circumstances of each patient, in consultation with the patient and, where appropriate, their guardian or carer.
Copyright
National Institute for Health and Care Excellence 2016
ISBN 978-1-4731-1996-3
National Institute for Health and Care Excellence 2016
NAFLD
Contents
4
Contents
Guideline Development Group members ...................................................................................... 11
NGC technical team members ....................................................................................................... 11
Co-optees ....................................................................................................................................... 11
Acknowledgements .................................................................................................................... 13
1 Guideline summary ............................................................................................................. 14
1.1 Algorithm: Assessment and monitoring of NAFLD in adults, children and young people .. 14
1.2 Full list of recommendations ............................................................................................... 15
1.3 Key research recommendations .......................................................................................... 17
2 Introduction ....................................................................................................................... 18
3 Development of the guideline ............................................................................................. 20
3.1 What is a NICE clinical guideline? ........................................................................................ 20
3.2 Remit ................................................................................................................................... 20
3.3 Who developed this guideline? ........................................................................................... 21
3.3.1 What this guideline covers ..................................................................................... 21
3.3.2 What this guideline does not cover ........................................................................ 21
3.3.3 Relationships between the guideline and other NICE guidance ............................ 21
4 Methods ............................................................................................................................. 23
4.1 Developing the review questions and outcomes ................................................................ 24
4.2 Searching for evidence ........................................................................................................ 27
4.2.1 Clinical literature search ......................................................................................... 27
4.2.2 Health economic literature search ......................................................................... 28
4.3 Identifying and analysing evidence of effectiveness ........................................................... 28
4.3.1 Inclusion and exclusion criteria .............................................................................. 29
4.3.2 Type of studies ........................................................................................................ 29
4.3.3 Methods of combining evidence ............................................................................ 30
4.3.4 Appraising the quality of evidence by outcomes ................................................... 34
National Institute for Health and Care Excellence 2016
NAFLD
Contents
5
4.3.5 Assessing clinical importance ................................................................................. 40
4.3.6 Clinical evidence statements .................................................................................. 41
4.4 Identifying and analysing evidence of cost-effectiveness ................................................... 41
4.4.1 Literature review .................................................................................................... 41
4.4.2 Undertaking new health economic analysis ........................................................... 43
4.4.3 Cost-effectiveness criteria ...................................................................................... 44
4.4.4 In the absence of economic evidence .................................................................... 44
4.5 Developing recommendations ............................................................................................ 44
4.5.1 Research recommendations ................................................................................... 45
4.5.2 Validation process .................................................................................................. 45
4.5.3 Updating the guideline ........................................................................................... 45
4.5.4 Disclaimer ............................................................................................................... 46
4.5.5 Funding ................................................................................................................... 46
5 Risk factors for NAFLD ......................................................................................................... 47
5.1 Introduction ......................................................................................................................... 47
5.2 Review question: Which risk factors for NAFLD or severe NAFLD (NASH, fibrosis) aid in the identification of people who should be investigated further? ............................................ 47
5.3 Clinical evidence .................................................................................................................. 48
5.3.1 Risk factors for NAFLD ............................................................................................ 50
5.3.2 Risk factors for NASH .............................................................................................. 56
5.3.3 Risk factors for fibrosis ........................................................................................... 56
5.4 Economic evidence .............................................................................................................. 57
5.4.1 Published evidence ................................................................................................. 57
5.4.2 New cost-effectiveness analysis ............................................................................. 57
5.5 Evidence statements ........................................................................................................... 57
5.5.1 Clinical ..................................................................................................................... 57
5.5.2 Economic ................................................................................................................ 58
5.6 Recommendations and link to evidence ............................................................................. 59
6 Diagnosis of NAFLD ............................................................................................................. 61
National Institute for Health and Care Excellence 2016
NAFLD
Contents
6
6.1 Introduction ......................................................................................................................... 61
6.2 Review question: What is (are) the appropriate investigation(s) for diagnosing NAFLD in adults, young people and children? .................................................................................... 61
6.3 Clinical evidence .................................................................................................................. 62
6.4 Economic evidence .............................................................................................................. 75
6.4.1 Published evidence ................................................................................................. 75
6.4.2 Unit costs ................................................................................................................ 75
6.4.3 New cost-effectiveness analysis ............................................................................. 75
6.5 Evidence statements ........................................................................................................... 77
6.5.1 Clinical ..................................................................................................................... 77
6.5.2 Economic ................................................................................................................ 78
6.6 Recommendations and link to evidence ............................................................................. 78
7 Diagnosing the severity of NAFLD ........................................................................................ 86
7.1 Introduction ......................................................................................................................... 86
7.2 Review question: Which assessment tool is most accurate in identifying the severity or stage of NAFLD?................................................................................................................... 86
7.3 Clinical evidence .................................................................................................................. 87
7.4 Economic evidence ............................................................................................................ 111
7.4.1 Published literature .............................................................................................. 111
7.4.2 Unit costs .............................................................................................................. 114
7.4.3 New cost-effectiveness analysis ........................................................................... 114
7.5 Evidence statements ......................................................................................................... 117
7.5.1 Clinical ................................................................................................................... 117
7.5.2 Economic .............................................................................................................. 119
7.6 Recommendations and link to evidence ........................................................................... 120
8 Monitoring NAFLD progression ........................................................................................... 127
8.1 Introduction ....................................................................................................................... 127
8.2 Review question: How often should we monitor adults, young people and children with NAFLD or NASH (with or without fibrosis) to determine the risk of disease progression? ........................................................................................................................................... 127
National Institute for Health and Care Excellence 2016
NAFLD
Contents
7
8.3 Clinical evidence ................................................................................................................ 128
8.3.1 Fibrosis progression rate ...................................................................................... 131
8.3.2 Risk factors for change in NAFLD histology .......................................................... 132
8.4 Economic evidence ............................................................................................................ 136
8.4.1 Published literature .............................................................................................. 136
8.4.2 Unit costs .............................................................................................................. 136
8.4.3 New cost-effectiveness analysis ........................................................................... 136
8.5 Evidence statements ......................................................................................................... 136
8.5.2 Economic .............................................................................................................. 136
8.6 137
8.7 Recommendations and link to evidence ........................................................................... 137
9 Extra-hepatic conditions..................................................................................................... 140
9.1 Introduction ....................................................................................................................... 140
9.2 Review question: Should a diagnosis of NAFLD in adults, young people and children prompt assessment for additional extra-hepatic conditions and, if so, which? ............... 140
9.3 Clinical evidence ................................................................................................................ 141
9.4 Economic evidence ............................................................................................................ 158
9.4.1 Published literature .............................................................................................. 158
9.4.2 Unit costs .............................................................................................................. 158
9.5 Evidence statements ......................................................................................................... 158
9.5.1 Clinical ................................................................................................................... 158
9.5.2 Economic .............................................................................................................. 159
9.6 Recommendations and link to evidence ........................................................................... 160
10 Weight reduction interventions .......................................................................................... 164
10.1 Introduction ....................................................................................................................... 164
10.2 Review question: What is the clinical and cost-effectiveness of dietary interventions for weight reduction for adults, young people and children with NAFLD compared with standard care? ................................................................................................................... 164
10.3 Clinical evidence ................................................................................................................ 165
10.4 Economic evidence ............................................................................................................ 165
National Institute for Health and Care Excellence 2016
NAFLD
Contents
8
10.5 Evidence statements ......................................................................................................... 165
10.5.1 Clinical ................................................................................................................... 165
10.5.2 Economic .............................................................................................................. 165
10.6 Recommendations and link to evidence ........................................................................... 165
11 Dietary modification and supplements ............................................................................... 167
11.1 Introduction ....................................................................................................................... 167
11.2 Review question: What is the clinical and cost-effectiveness of dietary modifications or supplements for adults, young people and children with NAFLD compared with standard care? .................................................................................................................................. 167
11.3 Clinical evidence ................................................................................................................ 168
11.4 Economic evidence ............................................................................................................ 180
11.4.1 Published literature .............................................................................................. 180
11.4.2 Unit costs .............................................................................................................. 180
11.5 Evidence statements ......................................................................................................... 180
11.5.1 Clinical ................................................................................................................... 180
11.5.2 Economic .............................................................................................................. 181
11.6 Recommendations and link to evidence ........................................................................... 181
12 Exercise interventions ........................................................................................................ 184
12.1 Introduction ....................................................................................................................... 184
12.2 Review question: What is the clinical and cost-effectiveness of exercise programmes for adults, young people and children with NAFLD compared with standard care? .............. 184
12.3 Clinical evidence ................................................................................................................ 185
12.4 Economic evidence ............................................................................................................ 189
12.5 Evidence statements ......................................................................................................... 189
12.5.1 Clinical ................................................................................................................... 189
12.5.2 Economic .............................................................................................................. 189
12.6 Recommendations and link to evidence ........................................................................... 189
13 Lifestyle modification ......................................................................................................... 192
13.1 Introduction ....................................................................................................................... 192
13.2 Review question: What is the clinical and cost-effectiveness of lifestyle modification
National Institute for Health and Care Excellence 2016
NAFLD
Contents
9
programmes for diet and exercise interventions for adults, young people and children with NAFLD compared with diet alone, exercise alone or standard care? ....................... 192
13.3 Clinical evidence ................................................................................................................ 193
13.4 Economic evidence ............................................................................................................ 209
13.4.1 Published literature .............................................................................................. 209
13.4.2 Review of economic evidence from NICE public health guidance ....................... 209
13.5 Evidence statements ......................................................................................................... 209
13.5.1 Clinical ................................................................................................................... 209
13.5.2 Economic .............................................................................................................. 210
13.6 Recommendations and link to evidence ........................................................................... 210
14 Alcohol advice ................................................................................................................... 215
14.1 Introduction ....................................................................................................................... 215
14.2 Review question: Should people with NAFLD restrict their consumption of alcohol to below national recommended levels? .............................................................................. 215
14.3 Clinical evidence ................................................................................................................ 216
14.4 Economic evidence ............................................................................................................ 220
14.5 Evidence statements ......................................................................................................... 220
14.5.1 Clinical ................................................................................................................... 220
14.5.2 Economic .............................................................................................................. 220
14.6 Recommendations and link to evidence ........................................................................... 220
15 Fructose advice .................................................................................................................. 223
15.1 Introduction ....................................................................................................................... 223
15.2 Review question: Should people with NAFLD restrict their consumption of fructose or sugar? ................................................................................................................................ 223
15.3 Clinical evidence ................................................................................................................ 224
15.4 Economic evidence ............................................................................................................ 224
15.5 Evidence statements ......................................................................................................... 224
15.5.1 Clinical ................................................................................................................... 224
15.5.2 Economic .............................................................................................................. 224
15.6 Recommendations and link to evidence ........................................................................... 224
National Institute for Health and Care Excellence 2016
NAFLD
Contents
10
16 Caffeine advice .................................................................................................................. 226
16.1 Introduction ....................................................................................................................... 226
16.2 Review question: Should people with NAFLD modify their consumption of caffeine from coffee? ............................................................................................................................... 226
16.3 Clinical evidence ................................................................................................................ 227
16.4 Economic evidence ............................................................................................................ 231
16.5 Evidence statements ......................................................................................................... 231
16.5.1 Clinical ................................................................................................................... 231
16.5.2 Economic .............................................................................................................. 231
16.6 Recommendations and link to evidence ........................................................................... 231
17 Pharmacological interventions ........................................................................................... 233
17.1 Introduction ....................................................................................................................... 233
17.2 Review question: What is the clinical and cost-effectiveness of pharmacological interventions for adults, young people and children with NAFLD? .................................. 233
17.3 Clinical evidence ................................................................................................................ 234
17.4 Economic evidence ............................................................................................................ 301
17.4.1 Published literature .............................................................................................. 301
17.4.2 Unit costs .............................................................................................................. 303
17.5 Evidence statements ......................................................................................................... 303
17.5.1 Clinical ................................................................................................................... 303
17.5.2 Economic .............................................................................................................. 308
17.6 Recommendations and link to evidence ........................................................................... 308
18 Acronyms and abbreviations .............................................................................................. 315
19 Glossary ............................................................................................................................. 317
19.1 Guideline-specific terms .................................................................................................... 317
19.2 General terms .................................................................................................................... 319
20 Reference list ..................................................................................................................... 331

National Institute for Health and Care Excellence 2016
NAFLD
Acknowledgements
11
Guideline Development Group members
Name Role
Christopher Byrne Professor of Endocrinology and Metabolism, University of Southampton
Chris Day (Chair) Professor of Liver Medicine and Honorary Consultant Hepatologist, Newcastle University
David Fitzmaurice Professor of Primary Care, University of Birmingham
Irene McGill Patient/carer member
Kevin Moore Professor of Hepatology, University College London (until June 2015 due to health reasons)
Benjamin Mullish Specialist Trainee/Academic Clinical Fellow in Hepatology and Gastroenterology, Imperial College London
Philip Newsome Professor of Experimental Hepatology and Honorary Consultant Hepatologist, Birmingham University
Tanja Pardela Paediatric Liver Modern Matron, King’s College Hospital
Rachel Pryke General Practitioner Partner, Winyates Health Centre, Redditch
Jane Putsey Patient/carer member
Indra van Mourik Consultant Paediatric Hepatologist, Birmingham Children's Hospital NHS Foundation Trust
Bronwen Williams Gastroenterology and Hepatology Research Nurse, Hull Royal Infirmary
NGC technical team members
Name Role
Joanna Ashe Senior Information Scientist
Kate Ashmore Document Editor/Process Assistant (from April 2015)
Serena Carville Associate Director and Guideline Lead
Angela Cooper Senior Research Fellow (until December 2014)
Lefteris Floros Health Economist
Jessica Glen Senior Research Fellow (from December 2014)
Martin Harker Senior Health Economist
Qudsia Malik Senior Research Fellow
Amelia Unsworth Senior Project Manager (until October 2015)
Claire Wallnutt Information Scientist (from January 2015)
Natalie Wood Project Manager (from October 2015)
Giulia Zuodar Document Editor/Process Assistant (until April 2015)
Co-optees
Name Role
Ashley Guthrie Consultant Radiologist, Leeds Teaching Hospitals NHS Trust
Jill Johnson Specialist Dietitian, Queen Elizabeth Hospital Birmingham NHS Foundation
National Institute for Health and Care Excellence 2016
NAFLD
Acknowledgements
12
Name Role
Trust
Roy Sherwood Professor of Clinical Biochemistry, King's College London
Dina Tiniakos Clinical Senior Lecturer & Honorary Consultant Histopathologist, Newcastle University
Michael Trenell Professor of Movement & Metabolism & NIHR Senior Research Fellow, Newcastle University
National Institute for Health and Care Excellence 2016
NAFLD
Acknowledgements
13
Acknowledgements The development of this guideline was greatly assisted by the following people:
Hannah Carré, Project Administrator, NGC
Jill Cobb, Information Scientist, NGC
Emily Davies, Senior Research Fellow, NGC
Margherita Fanos, Research Fellow, NGC
Jessica Flynn, Office Manager, NGC
Lina Gulhane, Joint Head of Information Science & Knowledge Manager, NGC
Grace Marsden, Senior Health Economist, NGC
Grace Massey, Document Delivery, NGC
Paul Miller, Senior Information Scientist, NGC
Jill Parnham, Operations Director, NGC
Jacoby Patterson, Systematic Reviewer
Elizabeth Pearton, Information Scientist, NGC
Ben Pordes, Project Manager, NGC
Emma Pottinger, Research Fellow, NGC
Gill Ritchie, Associate Director, NGC
Julie Robinson, Document Delivery, NGC
Carlos Sharpin, Joint Head of Information Science/Research Fellow, NGC
Josh South, Administrator, NGC
Heather Stegenga, Research Fellow, NGC
Thomas Strong, Document Delivery, NGC
David Wonderling, Head of Health Economics, NGC
Ruth Wong, Information Scientist, NGC
National Institute for Health and Care Excellence 2016
NAFLD
Guideline summary
14
1 Guideline summary
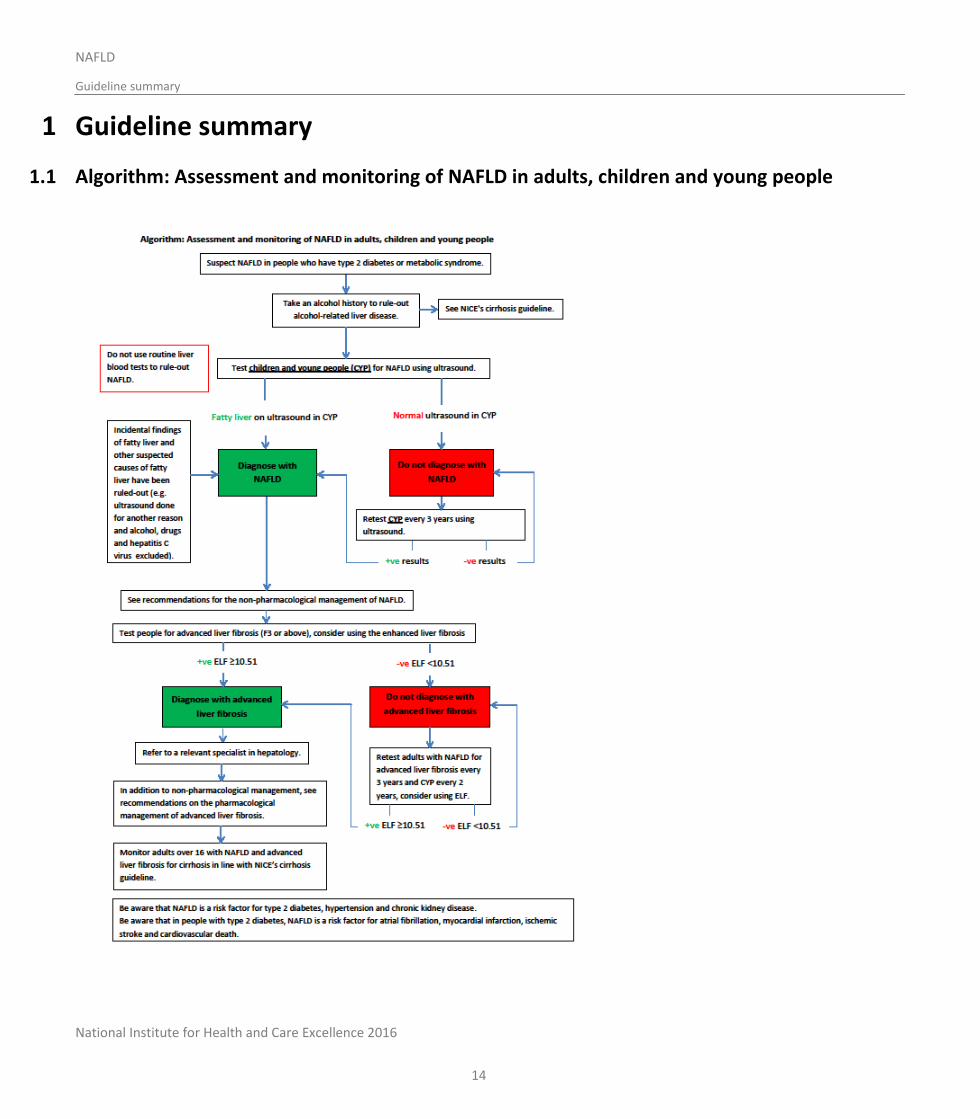
1.1 Algorithm: Assessment and monitoring of NAFLD in adults, children and young people
National Institute for Health and Care Excellence 2016
NAFLD
Guideline summary
15
1.2 Full list of recommendations
1. Be aware that non-alcoholic fatty liver disease (NAFLD) is more common in people who have:
type 2 diabetes or
metabolic syndrome.
2. Take an alcohol history to rule out alcohol-related liver disease. See also NICE’s cirrhosis guideline.
3. Do not use routine liver blood tests to rule out NAFLD.
4. Offer a liver ultrasound to test children and young people for NAFLD if they:
have type 2 diabetes or metabolic syndrome and
do not misuse alcohol.
5. Refer children with suspected NAFLD to a relevant paediatric specialist in hepatology in tertiary care.
6. Diagnose children and young people with NAFLD if:
ultrasound shows they have fatty liver and
other suspected causes of fatty liver have been ruled out.
7. Offer liver ultrasound to retest children and young people for NAFLD every 3 years if they:
have a normal ultrasound and
have type 2 diabetes or metabolic syndrome and
do not misuse alcohol.
8. Offer testing for advanced liver fibrosis to people with NAFLD.
9. Consider using the enhanced liver fibrosis (ELF) test in people who have been diagnosed with NAFLD to test for advanced liver fibrosis.
10. Do not use routine liver blood tests to assess for advanced liver fibrosis in people with NAFLD.
11. Diagnose people with advanced liver fibrosis if they have:
an ELF score of 10.51 or above and
NAFLD.
12. Refer adults and young people diagnosed with advanced liver fibrosis to a relevant specialist in hepatology.
13. Explain to people with an ELF score below 10.51 that:
they are unlikely to have advanced liver fibrosis and
reassessment for advanced liver fibrosis every 3 years for adults and every 2 years for children and young people is sufficient for regular monitoring and
no interim tests are needed.
National Institute for Health and Care Excellence 2016
NAFLD
Guideline summary
16
Give the person advice about lifestyle modifications they may be able to make (see recommendations 19-23)
14. Offer retesting for advanced liver fibrosis for people with an ELF score below 10.51:
every 3 years to adults
every 2 years to children and young people.
15. Consider using ELF for retesting people with advanced liver fibrosis.
16. Monitor adults and young people over 16 with NAFLD and advanced liver fibrosis for cirrhosis in line with NICE’s cirrhosis guideline.
17. Be aware that NAFLD is a risk factor for type 2 diabetes, hypertension and chronic kidney disease.
18. Be aware that in people with type 2 diabetes, NAFLD is a risk factor for atrial fibrillation, myocardial infarction, ischaemic stroke and death from cardiovascular causes.
19. Offer advice on physical activity and diet to people with NAFLD who are overweight or obese in line with NICE’s obesity and preventing excess weight gain guidelines.
20. Do not offer omega-3 fatty acids to adults with NAFLD because there is not enough evidence to recommend their use.
21. Explain to people with NAFLD that there is some evidence that exercise reduces liver fat content.
22. Consider the lifestyle interventions in NICE’s obesity guideline for people with NAFLD regardless of their BMI.
23. Explain to people with NAFLD who drink alcohol the importance of staying within the national recommended limits for alcohol consumption.
24. In secondary or tertiary care settings only, consider pioglitazonea,b or vitamin Eb for adults with advanced liver fibrosis, whether they have diabetes or not.
25. Before prescribing pioglitazonea,b or vitamin Eb to adults, take into account any comorbidities that they have and the risk of adverse events associated with these conditions.
26. In tertiary care settings only, consider vitamin Eb for children with advanced liver fibrosis, whether they have diabetes or not.
27. In secondary or tertiary care settings only, consider vitamin Eb for young people with advanced liver fibrosis, whether they have diabetes or not.
28. Offer to retest people with advanced liver fibrosis 2 years after they start a new pharmacological therapy to assess whether treatment is effective.
29. Consider using the ELF test to assess whether pharmacological therapy is effective.
30. If an adult’s ELF test score has risen, stop either vitamin E or pioglitazone and consider switching to the other pharmacological therapy.
31. If a child or young person’s ELF test score has risen, stop vitamin E.
32. Be aware that people with NAFLD who are taking statins should keep taking them.

National Institute for Health and Care Excellence 2016
NAFLD
Guideline summary
17
33. Only consider stopping statins if liver enzyme levels double within 3 months of starting statins, including in people with abnormal baseline liver blood results.
1.3 Key research recommendations Which non-invasive tests are most accurate and cost-effective in identifying non-alcoholic fatty liver disease (NAFLD) in adults with risk
factors, type 2 diabetes and metabolic syndrome?
Which non-invasive tests most accurately identify non-alcoholic steatohepatitis (NASH) in people with non-alcoholic fatty liver disease (NAFLD)?
Which non-invasive tests most accurately diagnose NAFLD and advanced liver fibrosis in children and young people?
What is the clinical and cost effectiveness of using probiotics or prebiotics to treat NAFLD in adults, young people and children?
What is the clinical and cost effectiveness of pharmacological therapy in children and young people with advanced liver fibrosis?
National Institute for Health and Care Excellence 2016
NAFLD
Introduction
18
2 Introduction
Background
Primary non-alcoholic fatty liver disease (NAFLD) is an excess of fat in the liver (steatosis) that is not a result of excessive alcohol consumption or other secondary causes. These secondary causes include, for example, side effects of certain medications, hepatitis C virus infection and particular endocrine conditions. NAFLD progresses from hepatic steatosis, through inflammatory non-alcoholic steatohepatitis (NASH), to fibrosis or cirrhosis. A proportion of people with NAFLD will die from liver failure or hepatocellular carcinoma (HCC), or need a liver transplant.
The prevalence of NAFLD in the general population is estimated at 20–30%.209,210,229 Around 2–3% of the population have NASH.229 NAFLD is more common in people who have central obesity (excessive abdominal fat), insulin resistance or type 2 diabetes, hypertension and dyslipidaemia. This group of chronic conditions is indicative of increased cardiovascular risk and together comprise ‘metabolic syndrome’.
The prevalence of NAFLD is increasingly placing a greater burden on healthcare resources.209,210,229 The rate of progression of NAFLD is variable; being overweight and having diabetes are associated with an increased risk of progressive disease. The average age of people with NASH is 40–50 years and for NASH-cirrhosis, 50–60 years. However, the emerging epidemic of childhood obesity means that increasing numbers of younger people have NAFLD, with some prevalence studies showing that up to 38% of obese children have evidence of NAFLD. With NAFLD progressing through its spectrum even in childhood, the age that people develop significant liver disease is likely to fall and early diagnosis and management are therefore important issues at all ages. There is currently no pharmacological treatment licensed for NAFLD.
Current practice
NAFLD is usually first suspected in primary care incidentally either by abnormal liver blood tests or an abnormal liver ultrasound appearance picked up as part of an investigation for an unrelated condition. The care pathway in primary care for someone with suspected NAFLD is unclear, and practice regarding further investigation and referral varies widely. NAFLD is increasingly being identified through case-finding in hospital outpatient departments for people with associated conditions such as diabetes, obesity or hypertension. However, this practice is not universal and there is no guidance about which people should be investigated for NAFLD or how this should be done. Once people with NAFLD have been referred to secondary care, their condition may be investigated further to determine whether or not they have progressive disease. However, as there is currently no guidance about whom or how to investigate these people, investigation tends to be ad hoc. As there is currently no licensed treatment for NAFLD, most people are discharged back to their GP. Some people are given advice on lifestyle, which is usually focused on achieving weight loss, but, again, in the absence of clear guidance, this is highly variable.
Need for and scope of the guideline
Guidance is needed for use in both primary and secondary care settings.
This guideline covers identifying, diagnosing and assessing disease severity in adults, children and young people with NAFLD. It also covers both pharmacological and non-pharmacological treatments, disease monitoring and the risk of extra-hepatic conditions associated with NAFLD.
The guideline does not cover the investigation of people with incidentally found abnormal liver blood tests, of which NAFLD is but 1 of the common causes, and does not cover the complications of NAFLD cirrhosis.
Some people with NAFLD may also have an additional aetiology of liver disease that may be equally as significant (or even more significant) as a cause of liver injury and fibrosis, for example, co-existing chronic viral hepatitis. However, specific details regarding assessment and management of such people are also outside of the scope of this guideline.
National Institute for Health and Care Excellence 2016
NAFLD
Introduction
19
Although HCC has been reported in people with NAFLD without cirrhosis, its likely very low incidence was not felt to merit consideration of the cost-effectiveness of surveillance for this complication.
NICE has produced guidance on the components of good patient experience in adult NHS services. All healthcare professionals should follow the recommendations in Patient experience in adult NHS services.
Although there are many causes of steatosis, and therefore a potentially wide differential diagnosis in practice, the principal difference is between primary, metabolic syndrome-related NAFLD and alcohol-related liver disease. Discriminating between these is reliant upon a detailed history and seeking corroboration from family members, where available, to ensure that any history of occult excessive alcohol consumption is excluded. An arbitrary threshold for ethanol consumption of <20 g/day for women and <30 g/day for men is adopted to sustain a diagnosis of NAFLD. For people with abnormal liver blood tests and either suspected or confirmed fatty liver, alternative causes must be excluded with a detailed drug history and laboratory tests for chronic viral hepatitis (HBVsAg and HCV serology), autoimmune liver disease (ANA, AMA, SMA, LKM1 antibodies, immunoglobulins) and other treatable metabolic diseases (haemochromatosis, Wilson’s disease, coeliac disease, alpha-1 antitrypsin deficiency). Importantly, 80% of people with NAFLD have normal standard liver blood tests.
National Institute for Health and Care Excellence 2016
NAFLD
Development of the guideline
20
3 Development of the guideline
3.1 What is a NICE clinical guideline?
NICE clinical guidelines are recommendations for the care of individuals in specific clinical conditions or circumstances within the NHS – from prevention and self-care through primary and secondary care to more specialised services. We base our clinical guidelines on the best available research evidence, with the aim of improving the quality of healthcare. We use predetermined and systematic methods to identify and evaluate the evidence relating to specific review questions.
NICE clinical guidelines can:
provide recommendations for the treatment and care of people by health professionals
be used to develop standards to assess the clinical practice of individual health professionals
be used in the education and training of health professionals
help patients to make informed decisions
improve communication between patient and health professional.
While guidelines assist the practice of healthcare professionals, they do not replace their knowledge and skills.
We produce our guidelines using the following steps:
Guideline topic is referred to NICE from the Department of Health.
Stakeholders register an interest in the guideline and are consulted throughout the development process.
The scope is prepared by the National Guideline Centre (NGC).
The NGC establishes a Guideline Development Group.
A draft guideline is produced after the group assesses the available evidence and makes recommendations.
There is a consultation on the draft guideline.
The final guideline is produced.
The NGC and NICE produce a number of versions of this guideline:
the ‘full guideline’ contains all the recommendations, plus details of the methods used and the underpinning evidence
the ‘NICE guideline’ lists the recommendations
‘information for the public’ is written using suitable language for people without specialist medical knowledge
NICE Pathways brings together all connected NICE guidance.
This version is the full version. The other versions can be downloaded from NICE at www.nice.org.uk.
3.2 Remit
NICE received the remit for this guideline from the Department of Health. NICE commissioned the NGC to produce the guideline.
The remit for this guideline is:
The management of liver disease (non-alcoholic).
National Institute for Health and Care Excellence 2016
NAFLD
Development of the guideline
21
3.3 Who developed this guideline?
A multidisciplinary Guideline Development Group (GDG) comprising health professionals and researchers as well as lay members developed this guideline (see the list of Guideline Development Group members and the acknowledgements).
The National Institute for Health and Care Excellence (NICE) funds the National Guideline Centre (NGC) and thus supported the development of this guideline. The GDG was convened by the NGC and chaired by Professor Chris Day in accordance with guidance from NICE.
The group met every 5 to 6 weeks during the development of the guideline. At the start of the guideline development process all GDG members declared interests including consultancies, fee-paid work, shareholdings, fellowships and support from the healthcare industry. At all subsequent GDG meetings, members declared arising conflicts of interest.
Members were either required to withdraw completely or for part of the discussion if their declared interest made it appropriate. The details of declared interests and the actions taken are shown in Appendix B.
Staff from the NGC provided methodological support and guidance for the development process. The team working on the guideline included a project manager, systematic reviewers (research fellows), health economists and information scientists. They undertook systematic searches of the literature, appraised the evidence, conducted meta-analysis and cost-effectiveness analysis where appropriate and drafted the guideline in collaboration with the GDG.
3.3.1 What this guideline covers
This guideline covers the assessment and management of non-alcoholic fatty liver disease (NAFLD) in adults, children and young people. For further details please refer to the scope in Appendix A and the review questions in Section 4.1.
3.3.2 What this guideline does not cover
This guideline does not cover people with secondary causes of fatty liver (for example, chronic hepatitis C infection, total parenteral nutrition treatment and drug-induced fatty liver), management of end-stage liver disease, hepatocellular carcinoma or liver transplant associated with NAFLD, and the assessment and management of cirrhosis.
3.3.3 Relationships between the guideline and other NICE guidance
Related NICE diagnostics guidance:
SonoVue (sulphur hexafluoride microbubbles) – contrast agent for contrast-enhanced ultrasound imaging of the liver. NICE diagnostics guidance 5 (2012).
Related NICE medical technology guidance:
Virtual Touch Quantification to diagnose and monitor liver fibrosis in chronic viral hepatitis B and C. NICE medical technology guidance MTG27 (2015).
Related NICE clinical guidelines:
Diabetes (type 1 and type 2) in children and young people: diagnosis and management. NICE guideline 18 (2015).
Suspected cancer: recognition and referral. NICE guideline 12 (2015).
Obesity: identification, assessment and management of overweight and obesity in children, young people and adults. NICE clinical guideline 189 (2014).
National Institute for Health and Care Excellence 2016
NAFLD
Development of the guideline
22
Chronic kidney disease: early identification and management of chronic kidney disease in adults in primary and secondary care. NICE clinical guideline 182 (2014).
Lipid modification: cardiovascular risk assessment and the modification of blood lipids for the primary and secondary prevention of cardiovascular disease. NICE clinical guideline 181 (2014).
Atrial fibrillation: the management of atrial fibrillation. NICE clinical guideline 180 (2014).
Hypertension: clinical management of primary hypertension in adults. NICE clinical guideline 127 (2011).
Alcohol-use disorders: diagnosis, assessment and management of harmful drinking and alcohol dependence. NICE clinical guideline 115 (2011).
Alcohol-use disorders: diagnosis and clinical management of alcohol-related physical complications. NICE clinical guideline 100 (2010).
Type 2 diabetes (update). NICE guideline. Publication expected December 2015.
Related NICE public health guidance:
Physical activity: brief advice for adults in primary care. NICE public health guidance 44 (2013).
Hepatitis B and C: ways to promote and offer testing to people at increased risk of infection. NICE public health guidance 43 (2012).
Walking and cycling: local measures to promote walking and cycling as forms of travel or recreation. NICE public health guidance 41 (2012).
Alcohol-use disorders: preventing harmful drinking. NICE public health guidance 24 (2010).
Promoting physical activity for children and young people. NICE public health guidance 17 (2009).
Related NICE guidance currently in development:
Cirrhosis: assessment and management of cirrhosis. NICE guideline. Publication expected July 2016.
National Institute for Health and Care Excellence 2016
NAFLD
Methods
23
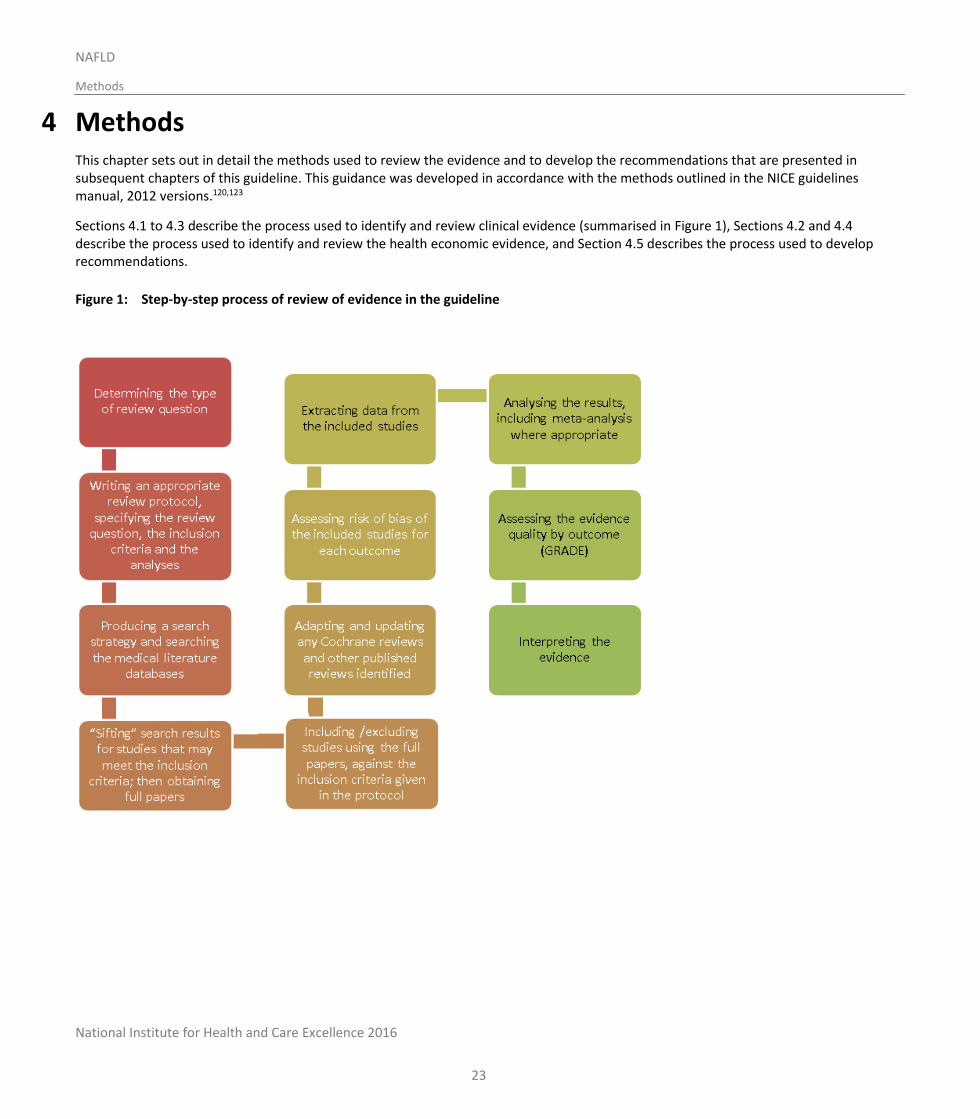
4 Methods This chapter sets out in detail the methods used to review the evidence and to develop the recommendations that are presented in subsequent chapters of this guideline. This guidance was developed in accordance with the methods outlined in the NICE guidelines manual, 2012 versions.120,123
Sections 4.1 to 4.3 describe the process used to identify and review clinical evidence (summarised in Figure 1), Sections 4.2 and 4.4 describe the process used to identify and review the health economic evidence, and Section 4.5 describes the process used to develop recommendations.
Figure 1: Step-by-step process of review of evidence in the guideline
National Institute for Health and Care Excellence 2016
NAFLD
Methods
24
4.1 Developing the review questions and outcomes
Review questions were developed using a PICO framework (patient, intervention, comparison and outcome) for intervention reviews; using a framework of population, index tests, reference standard and target condition for reviews of diagnostic test accuracy; and using population, presence or absence of factors under investigation (for example prognostic factors) and outcomes for prognostic reviews.
This use of a framework guided the literature searching process, critical appraisal and synthesis of evidence, and facilitated the development of recommendations by the GDG. The review questions were drafted by the NGC technical team and refined and validated by the GDG. The questions were based on the key clinical areas identified in the scope (Appendix A).
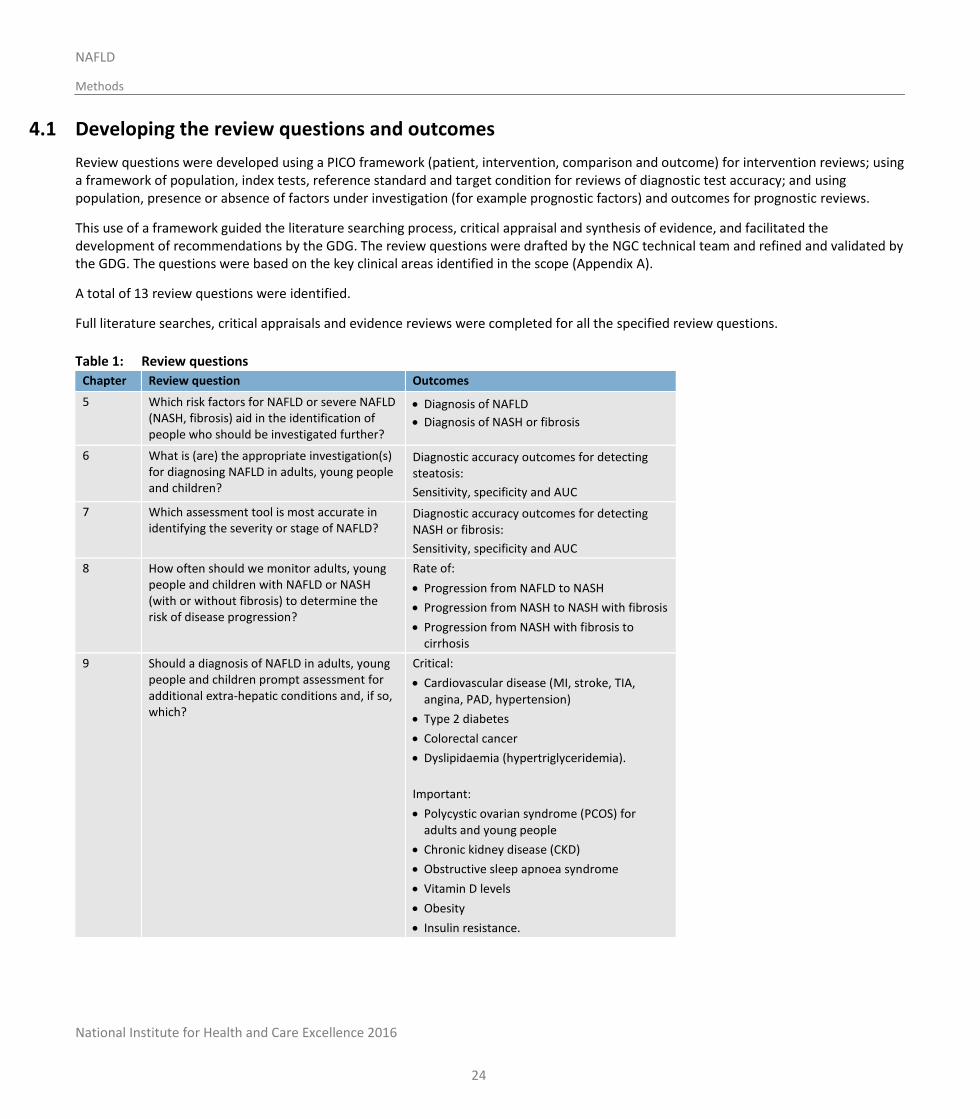
A total of 13 review questions were identified.
Full literature searches, critical appraisals and evidence reviews were completed for all the specified review questions.
Table 1: Review questions
Chapter Review question Outcomes
5 Which risk factors for NAFLD or severe NAFLD (NASH, fibrosis) aid in the identification of people who should be investigated further?
Diagnosis of NAFLD
Diagnosis of NASH or fibrosis
6 What is (are) the appropriate investigation(s) for diagnosing NAFLD in adults, young people and children?
Diagnostic accuracy outcomes for detecting steatosis:
Sensitivity, specificity and AUC
7 Which assessment tool is most accurate in identifying the severity or stage of NAFLD?
Diagnostic accuracy outcomes for detecting NASH or fibrosis:
Sensitivity, specificity and AUC
8 How often should we monitor adults, young people and children with NAFLD or NASH (with or without fibrosis) to determine the risk of disease progression?
Rate of:
Progression from NAFLD to NASH
Progression from NASH to NASH with fibrosis
Progression from NASH with fibrosis to cirrhosis
9 Should a diagnosis of NAFLD in adults, young people and children prompt assessment for additional extra-hepatic conditions and, if so, which?
Critical:
Cardiovascular disease (MI, stroke, TIA, angina, PAD, hypertension)
Type 2 diabetes
Colorectal cancer
Dyslipidaemia (hypertriglyceridemia).
Important:
Polycystic ovarian syndrome (PCOS) for adults and young people
Chronic kidney disease (CKD)
Obstructive sleep apnoea syndrome
Vitamin D levels
Obesity
Insulin resistance.
National Institute for Health and Care Excellence 2016
NAFLD
Methods
25
Chapter Review question Outcomes
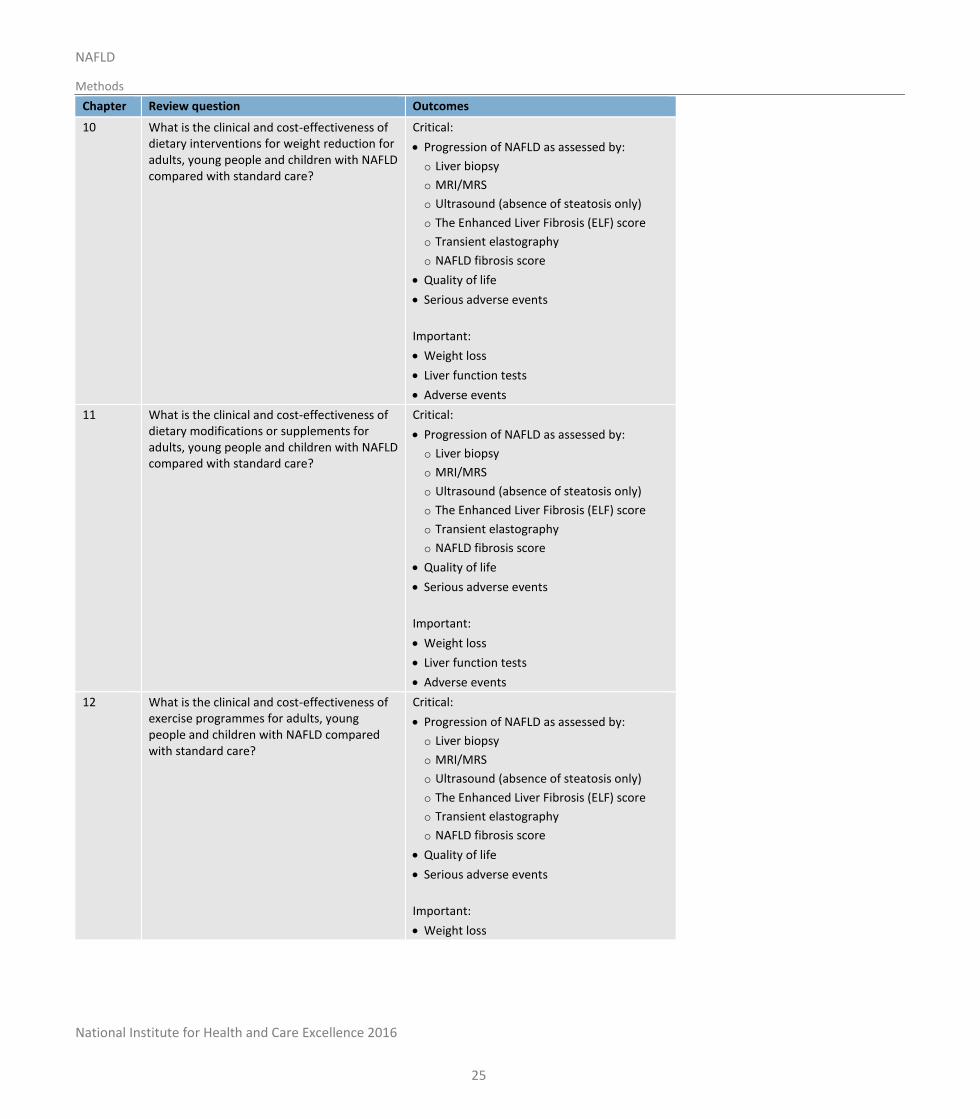
10 What is the clinical and cost-effectiveness of dietary interventions for weight reduction for adults, young people and children with NAFLD compared with standard care?
Critical:
Progression of NAFLD as assessed by:
o Liver biopsy
o MRI/MRS
o Ultrasound (absence of steatosis only)
o The Enhanced Liver Fibrosis (ELF) score
o Transient elastography
o NAFLD fibrosis score
Quality of life
Serious adverse events
Important:
Weight loss
Liver function tests
Adverse events
11 What is the clinical and cost-effectiveness of dietary modifications or supplements for adults, young people and children with NAFLD compared with standard care?
Critical:
Progression of NAFLD as assessed by:
o Liver biopsy
o MRI/MRS
o Ultrasound (absence of steatosis only)
o The Enhanced Liver Fibrosis (ELF) score
o Transient elastography
o NAFLD fibrosis score
Quality of life
Serious adverse events
Important:
Weight loss
Liver function tests
Adverse events
12 What is the clinical and cost-effectiveness of exercise programmes for adults, young people and children with NAFLD compared with standard care?
Critical:
Progression of NAFLD as assessed by:
o Liver biopsy
o MRI/MRS
o Ultrasound (absence of steatosis only)
o The Enhanced Liver Fibrosis (ELF) score
o Transient elastography
o NAFLD fibrosis score
Quality of life
Serious adverse events
Important:
Weight loss
National Institute for Health and Care Excellence 2016
NAFLD
Methods
26
Chapter Review question Outcomes
Liver function tests
Adverse events
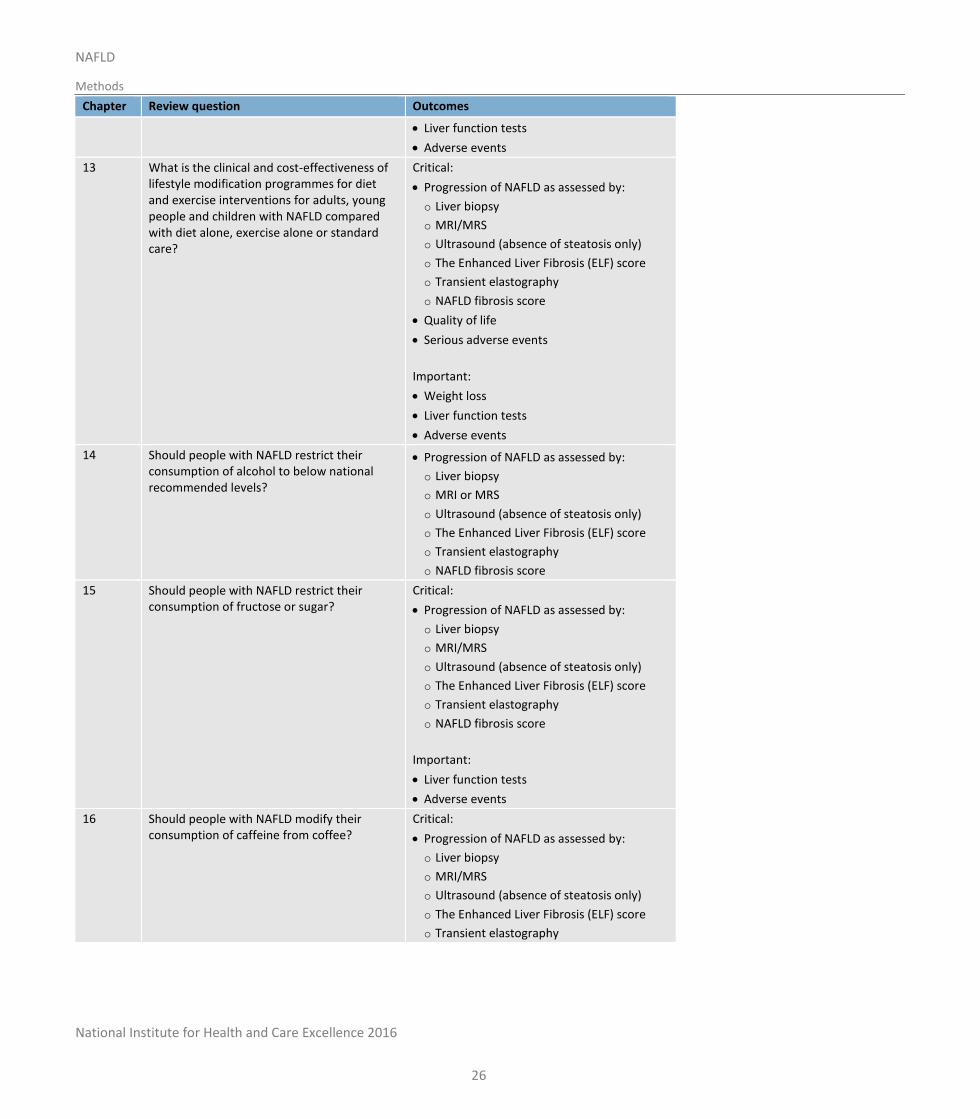
13 What is the clinical and cost-effectiveness of lifestyle modification programmes for diet and exercise interventions for adults, young people and children with NAFLD compared with diet alone, exercise alone or standard care?
Critical:
Progression of NAFLD as assessed by:
o Liver biopsy
o MRI/MRS
o Ultrasound (absence of steatosis only)
o The Enhanced Liver Fibrosis (ELF) score
o Transient elastography
o NAFLD fibrosis score
Quality of life
Serious adverse events
Important:
Weight loss
Liver function tests
Adverse events
14 Should people with NAFLD restrict their consumption of alcohol to below national recommended levels?
Progression of NAFLD as assessed by:
o Liver biopsy
o MRI or MRS
o Ultrasound (absence of steatosis only)
o The Enhanced Liver Fibrosis (ELF) score
o Transient elastography
o NAFLD fibrosis score
15 Should people with NAFLD restrict their consumption of fructose or sugar?
Critical:
Progression of NAFLD as assessed by:
o Liver biopsy
o MRI/MRS
o Ultrasound (absence of steatosis only)
o The Enhanced Liver Fibrosis (ELF) score
o Transient elastography
o NAFLD fibrosis score
Important:
Liver function tests
Adverse events
16 Should people with NAFLD modify their consumption of caffeine from coffee?
Critical:
Progression of NAFLD as assessed by:
o Liver biopsy
o MRI/MRS
o Ultrasound (absence of steatosis only)
o The Enhanced Liver Fibrosis (ELF) score
o Transient elastography
National Institute for Health and Care Excellence 2016
NAFLD
Methods
27
Chapter Review question Outcomes
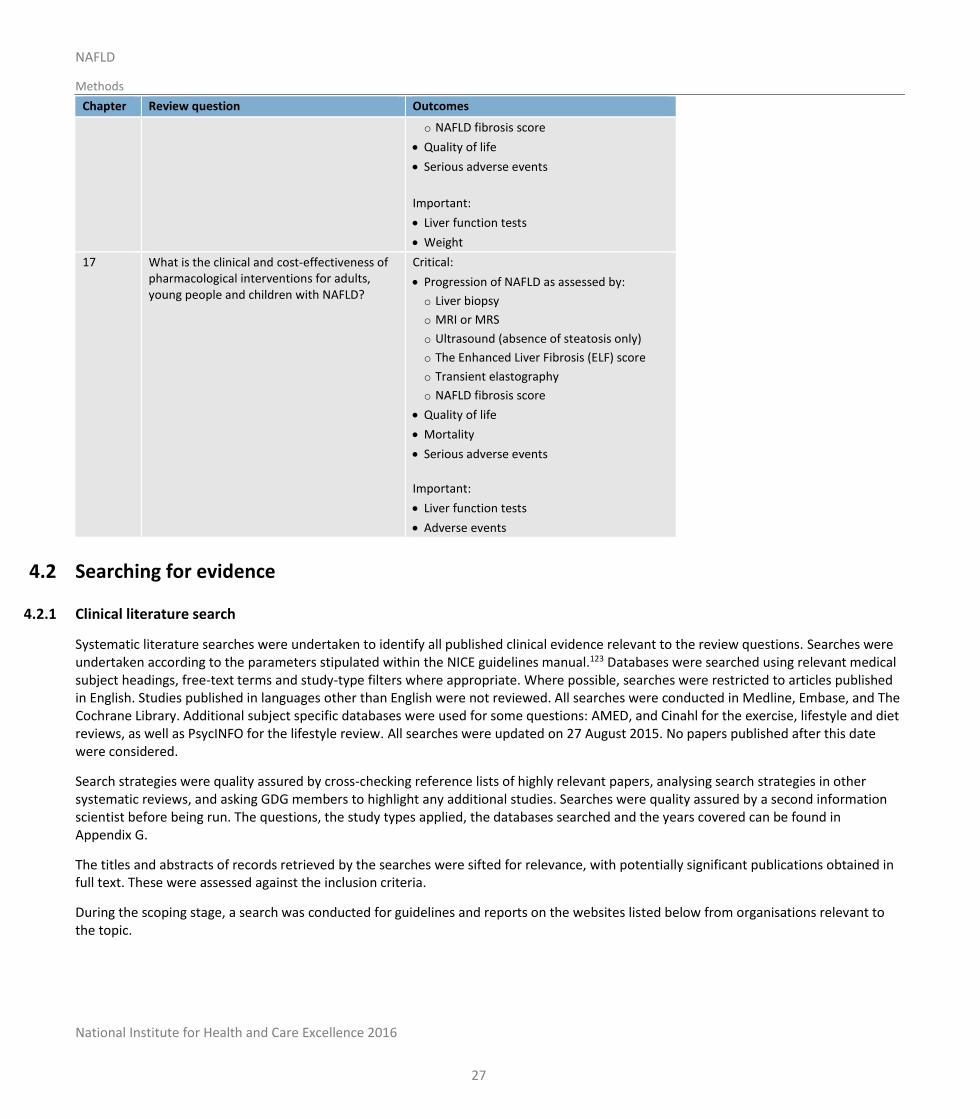
o NAFLD fibrosis score
Quality of life
Serious adverse events
Important:
Liver function tests
Weight
17 What is the clinical and cost-effectiveness of pharmacological interventions for adults, young people and children with NAFLD?
Critical:
Progression of NAFLD as assessed by:
o Liver biopsy
o MRI or MRS
o Ultrasound (absence of steatosis only)
o The Enhanced Liver Fibrosis (ELF) score
o Transient elastography
o NAFLD fibrosis score
Quality of life
Mortality
Serious adverse events
Important:
Liver function tests
Adverse events
4.2 Searching for evidence
4.2.1 Clinical literature search
Systematic literature searches were undertaken to identify all published clinical evidence relevant to the review questions. Searches were undertaken according to the parameters stipulated within the NICE guidelines manual.123 Databases were searched using relevant medical subject headings, free-text terms and study-type filters where appropriate. Where possible, searches were restricted to articles published in English. Studies published in languages other than English were not reviewed. All searches were conducted in Medline, Embase, and The Cochrane Library. Additional subject specific databases were used for some questions: AMED, and Cinahl for the exercise, lifestyle and diet reviews, as well as PsycINFO for the lifestyle review. All searches were updated on 27 August 2015. No papers published after this date were considered.
Search strategies were quality assured by cross-checking reference lists of highly relevant papers, analysing search strategies in other systematic reviews, and asking GDG members to highlight any additional studies. Searches were quality assured by a second information scientist before being run. The questions, the study types applied, the databases searched and the years covered can be found in Appendix G.
The titles and abstracts of records retrieved by the searches were sifted for relevance, with potentially significant publications obtained in full text. These were assessed against the inclusion criteria.
During the scoping stage, a search was conducted for guidelines and reports on the websites listed below from organisations relevant to the topic.
National Institute for Health and Care Excellence 2016
NAFLD
Methods
28
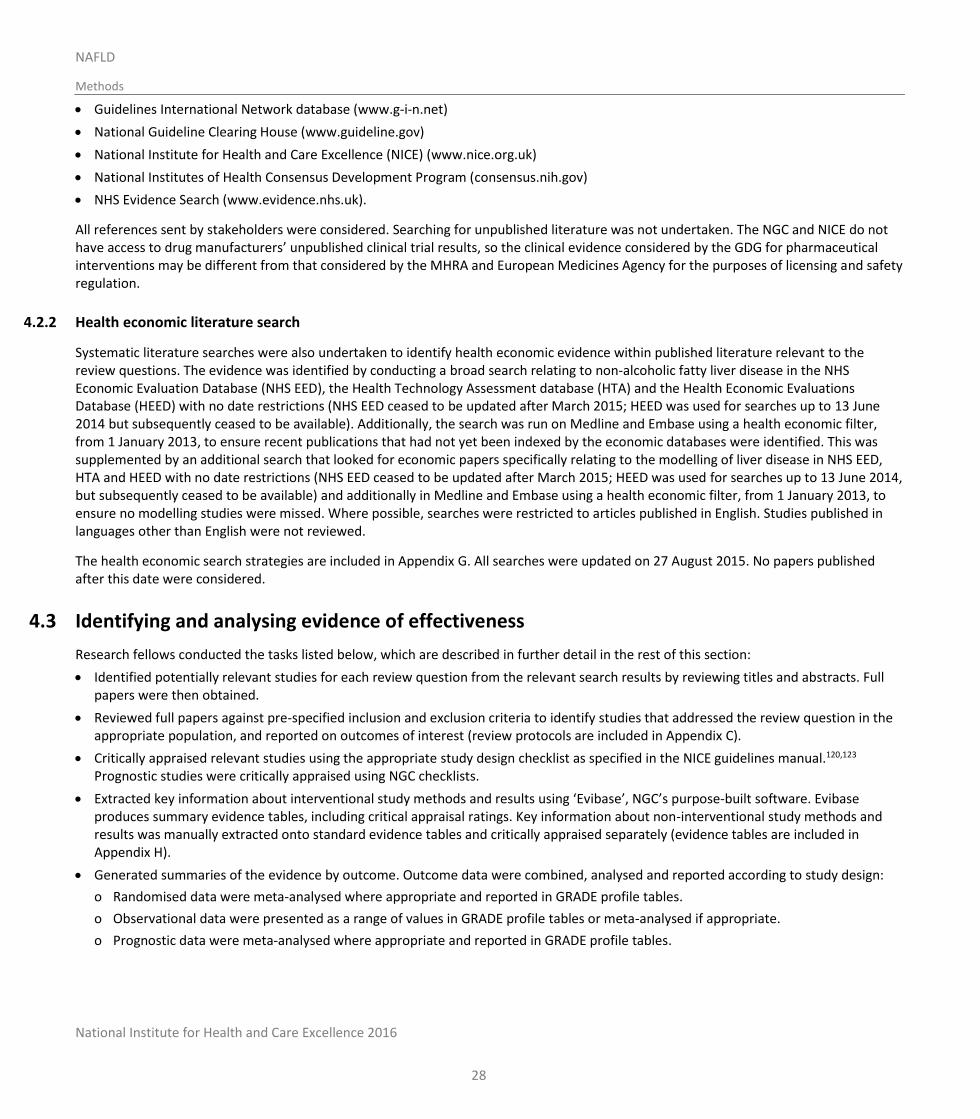
Guidelines International Network database (www.g-i-n.net)
National Guideline Clearing House (www.guideline.gov)
National Institute for Health and Care Excellence (NICE) (www.nice.org.uk)
National Institutes of Health Consensus Development Program (consensus.nih.gov)
NHS Evidence Search (www.evidence.nhs.uk).
All references sent by stakeholders were considered. Searching for unpublished literature was not undertaken. The NGC and NICE do not have access to drug manufacturers’ unpublished clinical trial results, so the clinical evidence considered by the GDG for pharmaceutical interventions may be different from that considered by the MHRA and European Medicines Agency for the purposes of licensing and safety regulation.
4.2.2 Health economic literature search
Systematic literature searches were also undertaken to identify health economic evidence within published literature relevant to the review questions. The evidence was identified by conducting a broad search relating to non-alcoholic fatty liver disease in the NHS Economic Evaluation Database (NHS EED), the Health Technology Assessment database (HTA) and the Health Economic Evaluations Database (HEED) with no date restrictions (NHS EED ceased to be updated after March 2015; HEED was used for searches up to 13 June 2014 but subsequently ceased to be available). Additionally, the search was run on Medline and Embase using a health economic filter, from 1 January 2013, to ensure recent publications that had not yet been indexed by the economic databases were identified. This was supplemented by an additional search that looked for economic papers specifically relating to the modelling of liver disease in NHS EED, HTA and HEED with no date restrictions (NHS EED ceased to be updated after March 2015; HEED was used for searches up to 13 June 2014, but subsequently ceased to be available) and additionally in Medline and Embase using a health economic filter, from 1 January 2013, to ensure no modelling studies were missed. Where possible, searches were restricted to articles published in English. Studies published in languages other than English were not reviewed.
The health economic search strategies are included in Appendix G. All searches were updated on 27 August 2015. No papers published after this date were considered.
4.3 Identifying and analysing evidence of effectiveness
Research fellows conducted the tasks listed below, which are described in further detail in the rest of this section:
Identified potentially relevant studies for each review question from the relevant search results by reviewing titles and abstracts. Full papers were then obtained.
Reviewed full papers against pre-specified inclusion and exclusion criteria to identify studies that addressed the review question in the appropriate population, and reported on outcomes of interest (review protocols are included in Appendix C).
Critically appraised relevant studies using the appropriate study design checklist as specified in the NICE guidelines manual.120,123 Prognostic studies were critically appraised using NGC checklists.
Extracted key information about interventional study methods and results using ‘Evibase’, NGC’s purpose-built software. Evibase produces summary evidence tables, including critical appraisal ratings. Key information about non-interventional study methods and results was manually extracted onto standard evidence tables and critically appraised separately (evidence tables are included in Appendix H).
Generated summaries of the evidence by outcome. Outcome data were combined, analysed and reported according to study design:
o Randomised data were meta-analysed where appropriate and reported in GRADE profile tables.
o Observational data were presented as a range of values in GRADE profile tables or meta-analysed if appropriate.
o Prognostic data were meta-analysed where appropriate and reported in GRADE profile tables.
National Institute for Health and Care Excellence 2016
NAFLD
Methods
29
o Diagnostic data studies were meta-analysed where appropriate or presented as a range of values in adapted GRADE profile tables
A sample of a minimum of 10% of the abstract lists of the first sifts by new reviewers and those for complex review questions (for example, prognostic reviews) were double-sifted by a senior research fellow and any discrepancies were rectified. All of the evidence reviews were quality assured by a senior research fellow. This included checking:
o papers were included or excluded appropriately
o a sample of the data extractions
o correct methods were used to synthesise data
o a sample of the risk of bias assessments.
4.3.1 Inclusion and exclusion criteria
The inclusion and exclusion of studies was based on the criteria defined in the review protocols, which can be found in Appendix C. Excluded studies by review question (with the reasons for their exclusion) are listed in Appendix M. The GDG was consulted about any uncertainty regarding inclusion or exclusion.
The key population inclusion criteria were:
Adults, children and young people with suspected or confirmed primary NAFLD.
No subgroups of people have been identified as needing specific consideration.
The key population exclusion criterion was:
People with secondary causes of fatty liver (for example, chronic hepatitis C infection, total parenteral nutrition treatment and drug-induced fatty liver).
Literature reviews, conference abstracts, posters, letters, editorials, comment articles, unpublished studies and studies not in English were excluded.
4.3.2 Type of studies
Randomised trials, non-randomised trials, and observational studies (including diagnostic or prognostic studies) were included in the evidence reviews as appropriate.
For most intervention reviews in this guideline, parallel randomised controlled trials (RCTs) were included because they are considered the most robust type of study design that could produce an unbiased estimate of the intervention effects. If non-randomised studies were appropriate for inclusion, for example, non-drug trials with no randomised evidence, the GDG identified a priori in the protocol the variables which must either be equivalent at baseline or that the analysis had to adjust for any baseline differences. If the study did not fulfil either criterion it was excluded. Please refer to Appendix C for full details on the study design of studies selected for each review question.
For diagnostic review questions, diagnostic RCTs, cross-sectional studies and retrospective studies were included. For prognostic review questions, prospective and retrospective cohort studies were included. Case–control studies were not included.
Qualitative research was not considered in this guideline as no review questions exploring outcomes that would require investigation of qualitative research were prioritised in the scope.
National Institute for Health and Care Excellence 2016
NAFLD
Methods
30
4.3.3 Methods of combining evidence
4.3.3.1 Data synthesis for intervention reviews
Where possible, meta-analyses were conducted using Cochrane Review Manager (RevMan5)1 software to combine the data given in all studies for each of the outcomes of interest for the review question.
Most analyses were stratified for age (under 18 years and 18 years or over), which meant that different studies with predominant age-groups in different age strata were not combined and analysed together. For some questions population was not stratified by age (diagnosis, assessment, extra-hepatic conditions, caffeine and the omega-3 section of the diet modification reviews) as the GDG felt that studies could be considered together in these instances and there was no clinical rationale for stratification.
The primary outcome for most of the reviews was progression of NAFLD. This could be as measured by a range of different techniques. For example:
liver biopsy
MRI or MRS
ultrasound (presence or absence of steatosis only)
the enhanced liver fibrosis (ELF) score
transient elastography
NAFLD fibrosis score.
The GDG felt that for liver biopsy progression measured using only the NAFLD activity score (NAS) by Brunt/Kleiner/NASH-CRN was acceptable and that progression of liver fat as measured by other methods such as ISHAK score would be excluded. It was acknowledged that papers could report progression of NAFLD by the means listed above as either dichotomous (for example, an improvement of 2 or more on the NAS) or continuous (mean and SD of NAFLD fibrosis score). With respect to ultrasound, the experience of the GDG was that whilst ultrasound is a useful tool for identifying whether there is steatosis of the liver or not, it is not an appropriate technique for quantifying the degree of fat within the liver because of wide inter-observer variability. Furthermore, the degree of hepatic steatosis cannot be interpreted as a marker of severity of NAFLD. As such, the GDG considered that measurement of the degree of steatosis on ultrasound should not be considered as a relevant outcome, and that the use of ultrasound should only be reported if it was used to indicate presence or absence of steatosis.
4.3.3.1.1 Analysis of different types of data
Dichotomous outcomes
Fixed-effects (Mantel-Haenszel) techniques (using an inverse variance method for pooling) were used to calculate risk ratios (relative risk) for the binary outcomes, which included:
progression of NAFLD (author thresholds of improvement/no improvement) as assessed by:
o liver biopsy
o MRI or MRS
o ultrasound (presence or absence of steatosis only)
o the enhanced liver fibrosis (ELF) score
o transient elastography
o NAFLD fibrosis score
serious adverse events
National Institute for Health and Care Excellence 2016
NAFLD
Methods
31
weight loss
liver blood tests (for example ALT levels, ALT/AST ratio)
adverse events.
The absolute risk difference was also calculated using GRADEpro56 software, using the median event rate in the control arm of the pooled results.
For binary variables where there were zero events in either arm or a less than 1% event rate, Peto odds ratios, rather than risk ratios were calculated. Peto odds ratios are more appropriate for data with a low number of events.
Where there was sufficient information provided, hazard ratios were calculated in preference for outcomes such as mortality where the time to the event occurring was important for decision-making.
Continuous outcomes
The continuous outcomes were analysed using an inverse variance method for pooling weighted mean differences. These outcomes included:
progression of NAFLD as assessed by:
o liver biopsy
o MRI or MRS
o the enhanced liver fibrosis (ELF) score
o transient elastography
o NAFLD fibrosis score
heath-related quality of life (HRQoL)
weight loss
liver blood tests (for example ALT levels, ALT/AST ratio).
Where the studies within a single meta-analysis had different scales of measurement, standardised mean differences were used (providing all studies reported either change from baseline or final values rather than a mixture of both), where each different measure in each study was ‘normalised’ to the standard deviation value pooled between the intervention and comparator groups in that same study.
The means and standard deviations of continuous outcomes are required for meta-analysis. However, in cases where standard deviations were not reported, the standard error was calculated if the p values or 95% confidence intervals (95% CI) were reported, and meta-analysis was undertaken with the mean and standard error using the generic inverse variance method in Cochrane Review Manager (RevMan5)1 software. Where p values were reported as ‘less than’, a conservative approach was undertaken. For example, if a p value was reported as ‘p ≤0.001’, the calculations for standard deviations were based on a p value of 0.001. If these statistical measures were not available then the methods described in Section 16.1.3 of the Cochrane Handbook (version 5.1.0, updated March 2011) were applied.
4.3.3.1.2 Generic inverse variance
If a study reported only the summary statistic and 95% CI the generic-inverse variance method was used to enter data into RevMan5.1 If the control event rate was reported this was used to generate the absolute risk difference in GRADEpro.56 If multivariate analysis was used to derive the summary statistic but no adjusted control event rate was reported no absolute risk difference was calculated.
4.3.3.1.3 Heterogeneity
Statistical heterogeneity was assessed for each meta-analysis estimate by considering the chi-squared test for significance at p<0.1 or an I-squared (I2) inconsistency statistic (with an I-squared value of more than 50% indicating significant heterogeneity) as well as the
National Institute for Health and Care Excellence 2016
NAFLD
Methods
32
distribution of effects. Where significant heterogeneity was present, predefined subgrouping of studies was carried out as per the review question protocols.
If the subgroup analysis resolved heterogeneity within all of the derived subgroups, then each of the derived subgroups were adopted as separate outcomes (providing at least 1 study remained in each subgroup. Assessments of potential differences in effect between subgroups were based on the chi-squared tests for heterogeneity statistics between subgroups. Any subgroup differences were interpreted with caution as separating the groups breaks the study randomisation and as such is subject to uncontrolled confounding.
If predefined strategies of subgrouping were unable to explain statistical heterogeneity within each derived subgroup, then a random effects (DerSimonian and Laird) model was employed to the entire group of studies in the meta-analysis. A random-effects model assumes a distribution of populations, rather than a single population. This leads to a widening of the confidence interval around the overall estimate, thus providing a more realistic interpretation of the true distribution of effects across more than 1 population. If, however, the GDG considered the heterogeneity was so large that meta-analysis was inappropriate, then the results were described narratively.
4.3.3.2 Data synthesis for prognostic factor reviews
Odds ratios (ORs), risk ratios (RRs), or hazard ratios (HRs), with their 95% CIs, for the effect of the pre-specified prognostic factors were extracted from the studies. Studies were only included if the confounders pre-specified by the GDG were either matched at baseline or were adjusted for in multivariate analysis.
Studies of lower risk of bias were preferred, taking into account the analysis and the study design. In particular, prospective cohort studies were preferred if they reported multivariable analyses that adjusted for key confounders identified by the GDG at the protocol stage for that outcome.
If more than 1 study covered the same combination of population, risk factor and outcome, and adjusted for the same key confounders, then meta-analysis was used to pool results. Meta-analysis was carried out using the generic inverse variance function on RevMan51 using fixed effects. Heterogeneity was assessed using the same criteria as for intervention studies, with an I² of 50–74% representing serious inconsistency and an I² of 75% or more representing very serious inconsistency. If serious or very serious heterogeneity existed, then subgrouping strategies were based on pre-specified subgrouping criteria as for interventional reviews. If subgrouping failed to explain heterogeneity, then the random-effects model was used. If subgrouping successfully explained heterogeneity then each of the subgroups was presented as a separate outcome (for example, mortality in people under 30 years and mortality in people 30 years and over) and a fixed-effects model was used.
Where evidence was not meta-analysed, because studies differed in population, outcome or risk factors, then no alternative pooling strategies were carried out, on the basis that such pooling would have little meaning. Results from single studies were presented.
4.3.3.3 Data synthesis for prognostic monitoring review
The monitoring review question (Chapter 8) was undertaken using a stepwise approach in agreement with the GDG. The information extracted from the papers included the number of patients with NAFLD, NAFL and NASH at initial biopsy, the average time between biopsies, and the numbers who had progressed, regressed or remained stable in fibrosis staging on the Brunt/CRN criteria. For papers with mixed NAFLD populations, the data are presented as a total and also separately for those with initial NASH and NAFL where possible. If the fibrosis progression rate was reported this was also included in the modified clinical evidence summary table (a calculation based on the difference between fibrosis stage at baseline and follow-up using the Brunt/CRN criteria, divided by the time in years between the 2 measurements). The GDG recognised that the fibrosis progression rate was useful in comparing the included studies as they each had very different average times between the biopsies. This additional information was available within 1 identified meta-analysis176 as the authors had contacted the authors of primary studies for further information and had calculated fibrosis progression scores specifically for people within the studies who started with no fibrosis at baseline. After discussion with the GDG these summary statistics were included in the evidence table. The mean fibrosis progression rate for the studies where it was possible to extract was calculated for NAFLD, NAFL and NASH populations and meta-analysed using the generic inverse variance method described in section 4.3.3.1.2.
National Institute for Health and Care Excellence 2016
NAFLD
Methods
33
The GDG was also interested in which population required more intensive monitoring. Clinical evidence was extracted from studies that listed multivariate analysis on factors associated with fibrosis progression. Following discussion it was felt most useful to present these grouped into factors from initial biopsy and at follow-up. These were presented in modified GRADE tables with quality assessments and forest plots. The GDG felt that the forest plots axis should be labelled so that the point estimate reflected those with the identified risk factor, rather than favouring those without, in order to ease understanding.
4.3.3.4 Data synthesis for diagnostic test accuracy reviews
For diagnostic test accuracy studies, a positive result on the index test was found if the patient had values of the measured quantity above or below a threshold value, and different thresholds could be used. Few of the diagnostic tests listed in the review protocols had widely acknowledged or commonly pre-specified thresholds, therefore results for all thresholds used were reported and the GDG agreed groups of threshold ranges to aid with presentation of results. Diagnostic test accuracy measures used in the analysis were: area under the receiver operating characteristics (ROC) curve (AUC), and, for different thresholds (if appropriate), sensitivity and specificity. The threshold of a diagnostic test is defined as the value at which the test can best differentiate between those with and without the target condition. In practice this varies amongst studies. If a test has a high sensitivity then very few people with the condition will be missed (few false negatives). For example, a test with a sensitivity of 97% will only miss 3% of people with the condition. Conversely, if a test has a high specificity then few people without the condition would be incorrectly diagnosed (few false positives). For example, a test with a specificity of 97% will only incorrectly diagnose 3% of people who do not have the condition as positive. For this guideline, sensitivity was considered more important than specificity. A high sensitivity (true positives) of a test can pick up the majority of the correct cases with NAFLD, NASH or fibrosis who may benefit from treatment (non-pharmacological or pharmacological) and ongoing monitoring; conversely, a high specificity (true negatives) can correctly exclude people without NAFLD, NASH or fibrosis who would not require management or monitoring. Coupled forest plots of sensitivity and specificity with their 95% CIs across studies (at various thresholds) were produced for each test, using RevMan5.1 In order to do this, 2×2 tables (the number of true positives, false positives, true negatives and false negatives) were directly taken from the study if given, or else were derived from raw data or calculated from the set of test accuracy statistics.
Diagnostic meta-analysis was conducted where appropriate, that is, when 3 or more studies were available per threshold. Test accuracy for the studies was pooled using the bivariate method for the direct estimation of summary sensitivity and specificity using a random-effects approach in WinBUGS software.2 See Appendix L for further details. The advantage of this approach is that it produces summary estimates of sensitivity and specificity that account for the correlation between the 2 statistics. Other advantages of this method have been described elsewhere. 155,199,200 The bivariate method uses logistic regression on the true positives, true negatives, false positives and false negatives reported in the studies. Overall sensitivity and specificity and confidence regions were plotted (using methods outlined by Novielli 2010131). Pooled sensitivity and specificity and their 95% CIs were reported in the clinical evidence summary tables. For scores with fewer than 3 studies, individual studies’ sensitivity and the paired specificity were reported where possible. If an even number of studies were reported the results of the study with the lower sensitivity value of the 2 middle studies was reported.
Heterogeneity or inconsistency amongst studies was visually inspected in the coupled forest plots and pooled diagnostic meta-analysis plots.
Area under the ROC curve (AUC) data for each study were also plotted on a graph, for each diagnostic test. The AUC describes the overall diagnostic accuracy across the full range of thresholds. The following criteria were used for evaluating AUCs:
≤0.50: worse than chance
0.50–0.60: very poor
0.61–0.70: poor
0.71–0.80: moderate
0.81–0.92: good
0.91–1.00: excellent or perfect test.
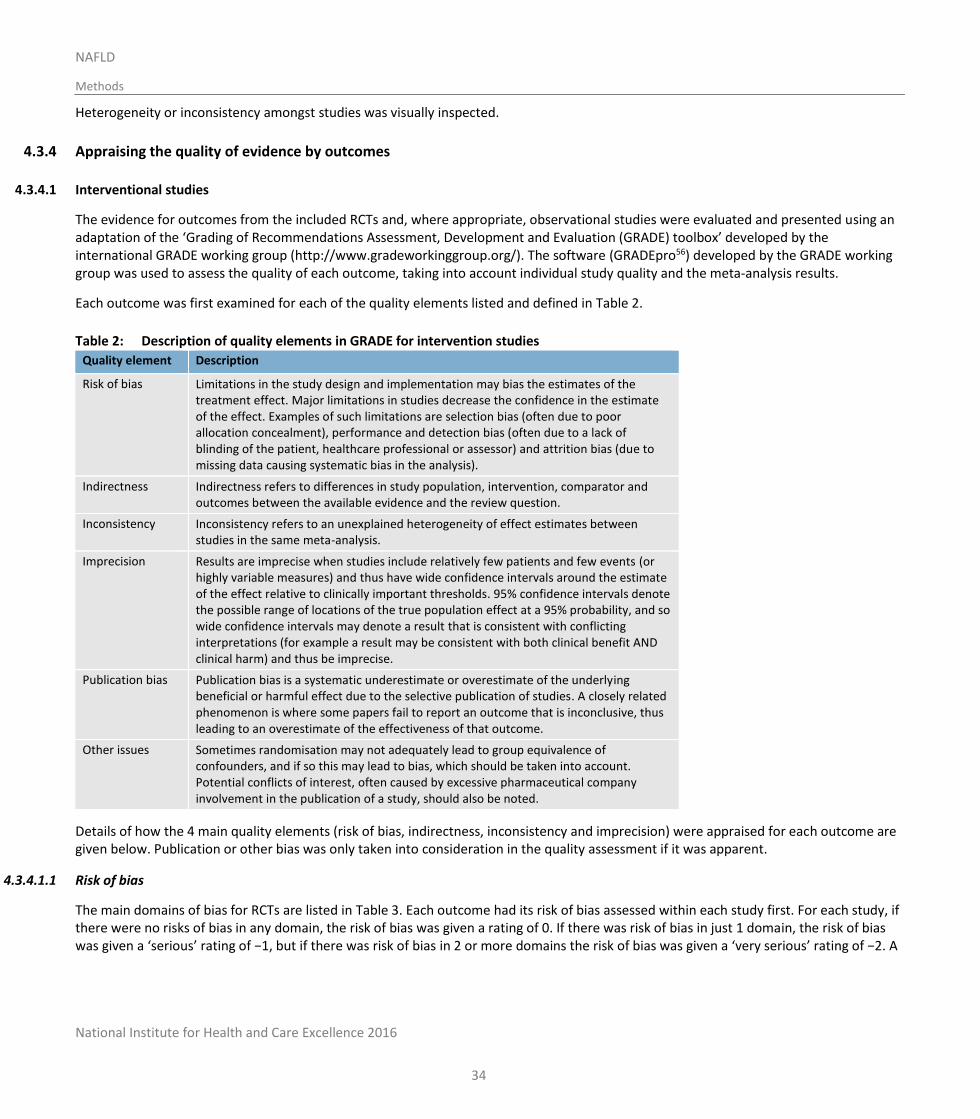
National Institute for Health and Care Excellence 2016
NAFLD
Methods
34
Heterogeneity or inconsistency amongst studies was visually inspected.
4.3.4 Appraising the quality of evidence by outcomes
4.3.4.1 Interventional studies
The evidence for outcomes from the included RCTs and, where appropriate, observational studies were evaluated and presented using an adaptation of the ‘Grading of Recommendations Assessment, Development and Evaluation (GRADE) toolbox’ developed by the international GRADE working group (http://www.gradeworkinggroup.org/). The software (GRADEpro56) developed by the GRADE working group was used to assess the quality of each outcome, taking into account individual study quality and the meta-analysis results.
Each outcome was first examined for each of the quality elements listed and defined in Table 2.
Table 2: Description of quality elements in GRADE for intervention studies
Quality element Description
Risk of bias Limitations in the study design and implementation may bias the estimates of the treatment effect. Major limitations in studies decrease the confidence in the estimate of the effect. Examples of such limitations are selection bias (often due to poor allocation concealment), performance and detection bias (often due to a lack of blinding of the patient, healthcare professional or assessor) and attrition bias (due to missing data causing systematic bias in the analysis).
Indirectness Indirectness refers to differences in study population, intervention, comparator and outcomes between the available evidence and the review question.
Inconsistency Inconsistency refers to an unexplained heterogeneity of effect estimates between studies in the same meta-analysis.
Imprecision Results are imprecise when studies include relatively few patients and few events (or highly variable measures) and thus have wide confidence intervals around the estimate of the effect relative to clinically important thresholds. 95% confidence intervals denote the possible range of locations of the true population effect at a 95% probability, and so wide confidence intervals may denote a result that is consistent with conflicting interpretations (for example a result may be consistent with both clinical benefit AND clinical harm) and thus be imprecise.
Publication bias Publication bias is a systematic underestimate or overestimate of the underlying beneficial or harmful effect due to the selective publication of studies. A closely related phenomenon is where some papers fail to report an outcome that is inconclusive, thus leading to an overestimate of the effectiveness of that outcome.
Other issues Sometimes randomisation may not adequately lead to group equivalence of confounders, and if so this may lead to bias, which should be taken into account. Potential conflicts of interest, often caused by excessive pharmaceutical company involvement in the publication of a study, should also be noted.
Details of how the 4 main quality elements (risk of bias, indirectness, inconsistency and imprecision) were appraised for each outcome are given below. Publication or other bias was only taken into consideration in the quality assessment if it was apparent.
4.3.4.1.1 Risk of bias
The main domains of bias for RCTs are listed in Table 3. Each outcome had its risk of bias assessed within each study first. For each study, if there were no risks of bias in any domain, the risk of bias was given a rating of 0. If there was risk of bias in just 1 domain, the risk of bias was given a ‘serious’ rating of −1, but if there was risk of bias in 2 or more domains the risk of bias was given a ‘very serious’ rating of −2. A
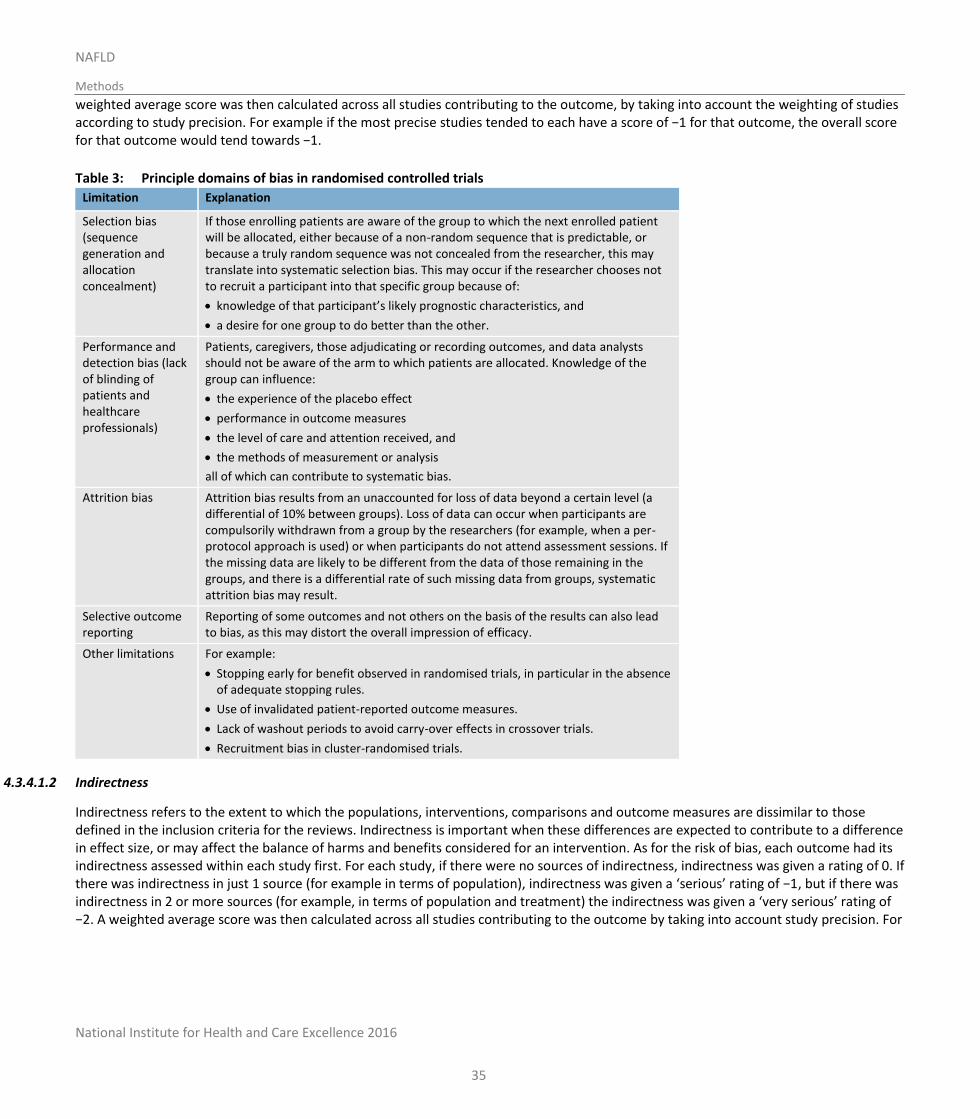
National Institute for Health and Care Excellence 2016
NAFLD
Methods
35
weighted average score was then calculated across all studies contributing to the outcome, by taking into account the weighting of studies according to study precision. For example if the most precise studies tended to each have a score of −1 for that outcome, the overall score for that outcome would tend towards −1.
Table 3: Principle domains of bias in randomised controlled trials
Limitation Explanation
Selection bias (sequence generation and allocation concealment)
If those enrolling patients are aware of the group to which the next enrolled patient will be allocated, either because of a non-random sequence that is predictable, or because a truly random sequence was not concealed from the researcher, this may translate into systematic selection bias. This may occur if the researcher chooses not to recruit a participant into that specific group because of:
knowledge of that participant’s likely prognostic characteristics, and
a desire for one group to do better than the other.
Performance and detection bias (lack of blinding of patients and healthcare professionals)
Patients, caregivers, those adjudicating or recording outcomes, and data analysts should not be aware of the arm to which patients are allocated. Knowledge of the group can influence:
the experience of the placebo effect
performance in outcome measures
the level of care and attention received, and
the methods of measurement or analysis
all of which can contribute to systematic bias.
Attrition bias Attrition bias results from an unaccounted for loss of data beyond a certain level (a differential of 10% between groups). Loss of data can occur when participants are compulsorily withdrawn from a group by the researchers (for example, when a per-protocol approach is used) or when participants do not attend assessment sessions. If the missing data are likely to be different from the data of those remaining in the groups, and there is a differential rate of such missing data from groups, systematic attrition bias may result.
Selective outcome reporting
Reporting of some outcomes and not others on the basis of the results can also lead to bias, as this may distort the overall impression of efficacy.
Other limitations For example:
Stopping early for benefit observed in randomised trials, in particular in the absence of adequate stopping rules.
Use of invalidated patient-reported outcome measures.
Lack of washout periods to avoid carry-over effects in crossover trials.
Recruitment bias in cluster-randomised trials.
4.3.4.1.2 Indirectness
Indirectness refers to the extent to which the populations, interventions, comparisons and outcome measures are dissimilar to those defined in the inclusion criteria for the reviews. Indirectness is important when these differences are expected to contribute to a difference in effect size, or may affect the balance of harms and benefits considered for an intervention. As for the risk of bias, each outcome had its indirectness assessed within each study first. For each study, if there were no sources of indirectness, indirectness was given a rating of 0. If there was indirectness in just 1 source (for example in terms of population), indirectness was given a ‘serious’ rating of −1, but if there was indirectness in 2 or more sources (for example, in terms of population and treatment) the indirectness was given a ‘very serious’ rating of −2. A weighted average score was then calculated across all studies contributing to the outcome by taking into account study precision. For
National Institute for Health and Care Excellence 2016
NAFLD
Methods
36
example, if the most precise studies tended to have an indirectness score of −1 each for that outcome, the overall score for that outcome would tend towards −1.
4.3.4.1.3 Inconsistency
Inconsistency refers to an unexplained heterogeneity of results for an outcome across different studies. When estimates of the treatment effect across studies differ widely, this suggests true differences in the underlying treatment effect, which may be due to differences in populations, settings or doses. When heterogeneity existed within an outcome (chi-squared p<0.1, or I2>50%), but no plausible explanation could be found, the quality of evidence for that outcome was downgraded. Inconsistency for that outcome was given a ‘serious’ score of −1 if the I2 was 50–74%, and a ‘very serious’ score of −2 if the I2 was 75% or more.
If inconsistency could be explained based on pre-specified subgroup analysis (that is, each subgroup had an I2<50%), the GDG took this into account and considered whether to make separate recommendations on new outcomes based on the subgroups defined by the assumed explanatory factors. In such a situation the quality of evidence was not downgraded for those emergent outcomes.
Since the inconsistency score was based on the meta-analysis results, the score represented the whole outcome and so weighted averaging across studies was not necessary.
4.3.4.1.4 Imprecision
The criteria applied for imprecision were based on the 95% CIs for the pooled estimate of effect, and the minimal important differences (MID) for the outcome. The MIDs are the threshold for appreciable benefits and harms, separated by a zone either side of the line of no effect where there is assumed to be no clinically important effect. If either end of the 95% CI of the overall estimate of effect crossed 1 of the MID lines, imprecision was regarded as serious and a ‘serious’ score of −1 was given. This was because the overall result, as represented by the span of the confidence interval, was consistent with 2 interpretations as defined by the MID (for example, both no clinically important effect and clinical benefit were possible interpretations). If both MID lines were crossed by either or both ends of the 95% CI then imprecision was regarded as very serious and a ‘very serious’ score of −2 was given. This was because the overall result was consistent with all 3 interpretations defined by the MID (no clinically important effect, clinical benefit and clinical harm). This is illustrated in Figure 2. As for inconsistency, since the imprecision score was based on the meta-analysis results, the score represented the whole outcome and so weighted averaging across studies was not necessary.
The position of the MID lines is ideally determined by values reported in the literature. ‘Anchor-based’ methods aim to establish clinically meaningful changes in a continuous outcome variable by relating or ‘anchoring’ them to patient-centred measures of clinical effectiveness that could be regarded as gold standards with a high level of face validity. For example, a MID for an outcome could be defined by the minimum amount of change in that outcome necessary to make patients feel their quality of life had ‘significantly improved’. MIDs in the literature may also be based on expert clinician or consensus opinion concerning the minimum amount of change in a variable deemed to affect quality of life or health. For binary variables, any MIDs reported in the literature will inevitably be based on expert consensus, as such MIDs relate to all-or-nothing population effects rather than measurable effects on an individual, and so are not amenable to patient-centred ‘anchor’ methods.
In the absence of values identified in the literature, the alternative approach to deciding on MID levels is the ‘default’ method, as follows:
For categorical outcomes the MIDs were taken to be RRs of 0.75 and 1.25. For ‘positive’ outcomes such as ‘patient satisfaction’, the RR of 0.75 is taken as the line denoting the boundary between no clinically important effect and a clinically significant harm, whilst the RR of 1.25 is taken as the line denoting the boundary between no clinically important effect and a clinically significant benefit. For ‘negative’ outcomes such as ‘bleeding’, the opposite occurs, so the RR of 0.75 is taken as the line denoting the boundary between no clinically important effect and a clinically significant benefit, whilst the RR of 1.25 is taken as the line denoting the boundary between no clinically important effect and a clinically significant harm.
For continuous outcome variables the MID was taken as half the median baseline standard deviation of that variable, across all studies in the meta-analysis. Hence the MID denoting the minimum clinically significant benefit was positive for a ‘positive’ outcome (for example, a quality of life measure where a higher score denotes better health), and negative for a ‘negative’ outcome (for example, a
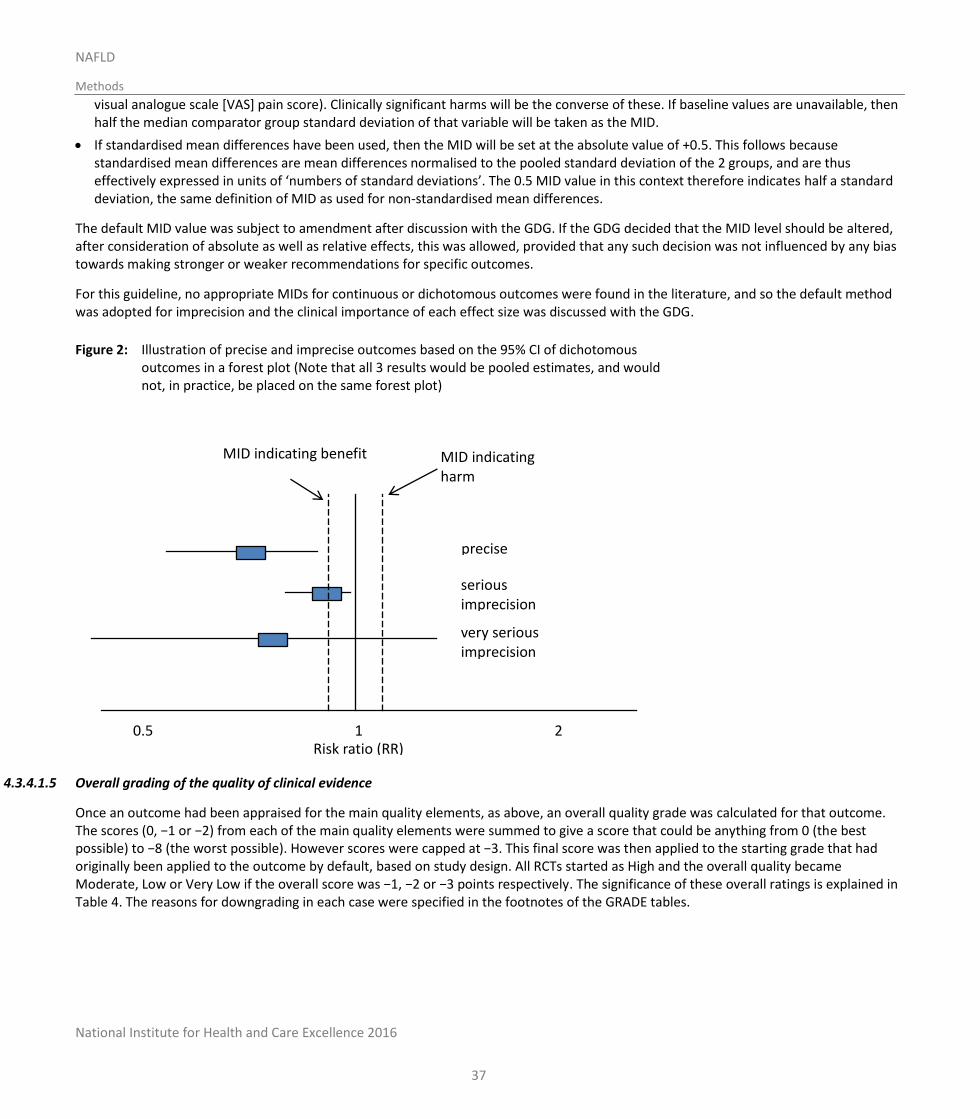
National Institute for Health and Care Excellence 2016
NAFLD
Methods
37
visual analogue scale [VAS] pain score). Clinically significant harms will be the converse of these. If baseline values are unavailable, then half the median comparator group standard deviation of that variable will be taken as the MID.
If standardised mean differences have been used, then the MID will be set at the absolute value of +0.5. This follows because standardised mean differences are mean differences normalised to the pooled standard deviation of the 2 groups, and are thus effectively expressed in units of ‘numbers of standard deviations’. The 0.5 MID value in this context therefore indicates half a standard deviation, the same definition of MID as used for non-standardised mean differences.
The default MID value was subject to amendment after discussion with the GDG. If the GDG decided that the MID level should be altered, after consideration of absolute as well as relative effects, this was allowed, provided that any such decision was not influenced by any bias towards making stronger or weaker recommendations for specific outcomes.
For this guideline, no appropriate MIDs for continuous or dichotomous outcomes were found in the literature, and so the default method was adopted for imprecision and the clinical importance of each effect size was discussed with the GDG.
Figure 2: Illustration of precise and imprecise outcomes based on the 95% CI of dichotomous outcomes in a forest plot (Note that all 3 results would be pooled estimates, and would not, in practice, be placed on the same forest plot)
4.3.4.1.5 Overall grading of the quality of clinical evidence
Once an outcome had been appraised for the main quality elements, as above, an overall quality grade was calculated for that outcome. The scores (0, −1 or −2) from each of the main quality elements were summed to give a score that could be anything from 0 (the best possible) to −8 (the worst possible). However scores were capped at −3. This final score was then applied to the starting grade that had originally been applied to the outcome by default, based on study design. All RCTs started as High and the overall quality became Moderate, Low or Very Low if the overall score was −1, −2 or −3 points respectively. The significance of these overall ratings is explained in Table 4. The reasons for downgrading in each case were specified in the footnotes of the GRADE tables.
1
2 0.5
MID indicating harm
MID indicating benefit
precise
serious imprecision
very serious imprecision
Risk ratio (RR)
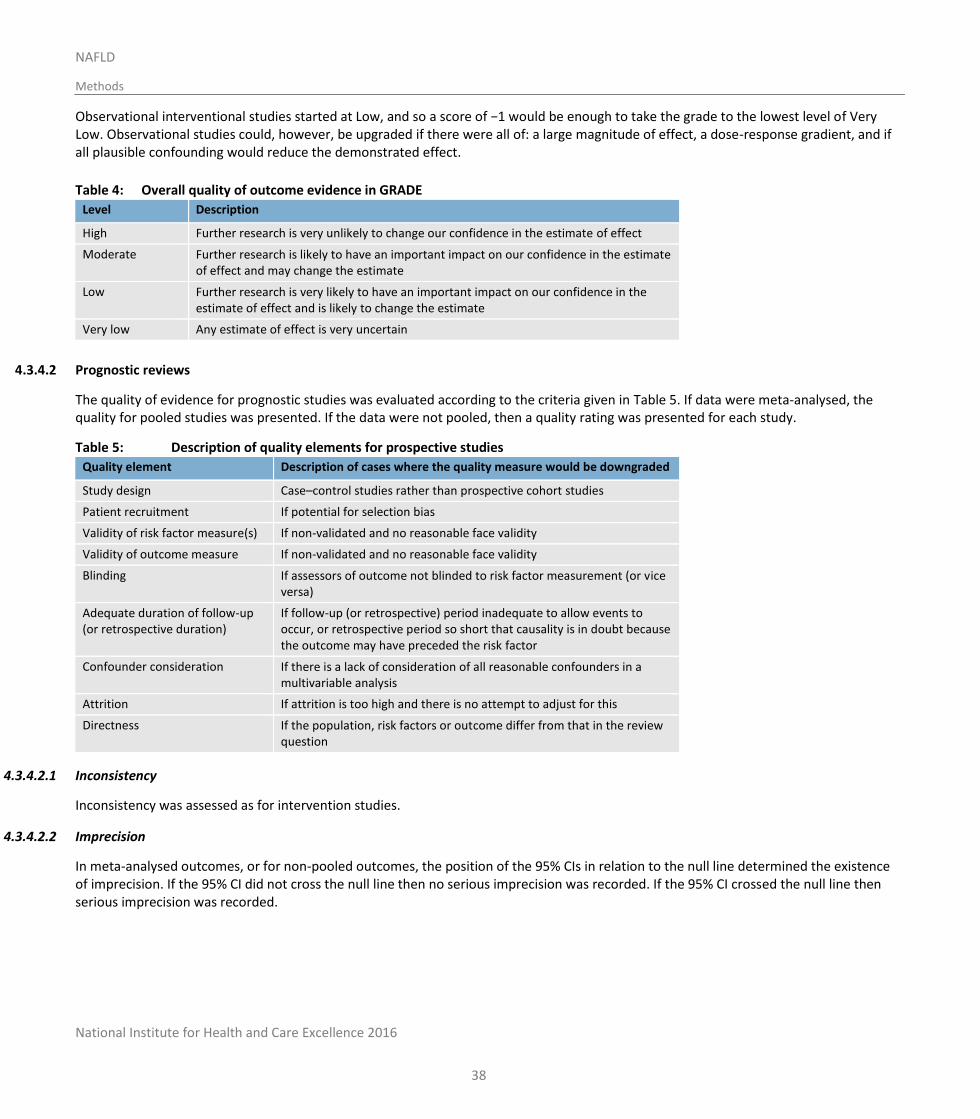
National Institute for Health and Care Excellence 2016
NAFLD
Methods
38
Observational interventional studies started at Low, and so a score of −1 would be enough to take the grade to the lowest level of Very Low. Observational studies could, however, be upgraded if there were all of: a large magnitude of effect, a dose-response gradient, and if all plausible confounding would reduce the demonstrated effect.
Table 4: Overall quality of outcome evidence in GRADE
Level Description
High Further research is very unlikely to change our confidence in the estimate of effect
Moderate Further research is likely to have an important impact on our confidence in the estimate of effect and may change the estimate
Low Further research is very likely to have an important impact on our confidence in the estimate of effect and is likely to change the estimate
Very low Any estimate of effect is very uncertain
4.3.4.2 Prognostic reviews
The quality of evidence for prognostic studies was evaluated according to the criteria given in Table 5. If data were meta-analysed, the quality for pooled studies was presented. If the data were not pooled, then a quality rating was presented for each study.
Table 5: Description of quality elements for prospective studies
Quality element Description of cases where the quality measure would be downgraded
Study design Case–control studies rather than prospective cohort studies
Patient recruitment If potential for selection bias
Validity of risk factor measure(s) If non-validated and no reasonable face validity
Validity of outcome measure If non-validated and no reasonable face validity
Blinding If assessors of outcome not blinded to risk factor measurement (or vice versa)
Adequate duration of follow-up (or retrospective duration)
If follow-up (or retrospective) period inadequate to allow events to occur, or retrospective period so short that causality is in doubt because the outcome may have preceded the risk factor
Confounder consideration If there is a lack of consideration of all reasonable confounders in a multivariable analysis
Attrition If attrition is too high and there is no attempt to adjust for this
Directness If the population, risk factors or outcome differ from that in the review question
4.3.4.2.1 Inconsistency
Inconsistency was assessed as for intervention studies.
4.3.4.2.2 Imprecision
In meta-analysed outcomes, or for non-pooled outcomes, the position of the 95% CIs in relation to the null line determined the existence of imprecision. If the 95% CI did not cross the null line then no serious imprecision was recorded. If the 95% CI crossed the null line then serious imprecision was recorded.
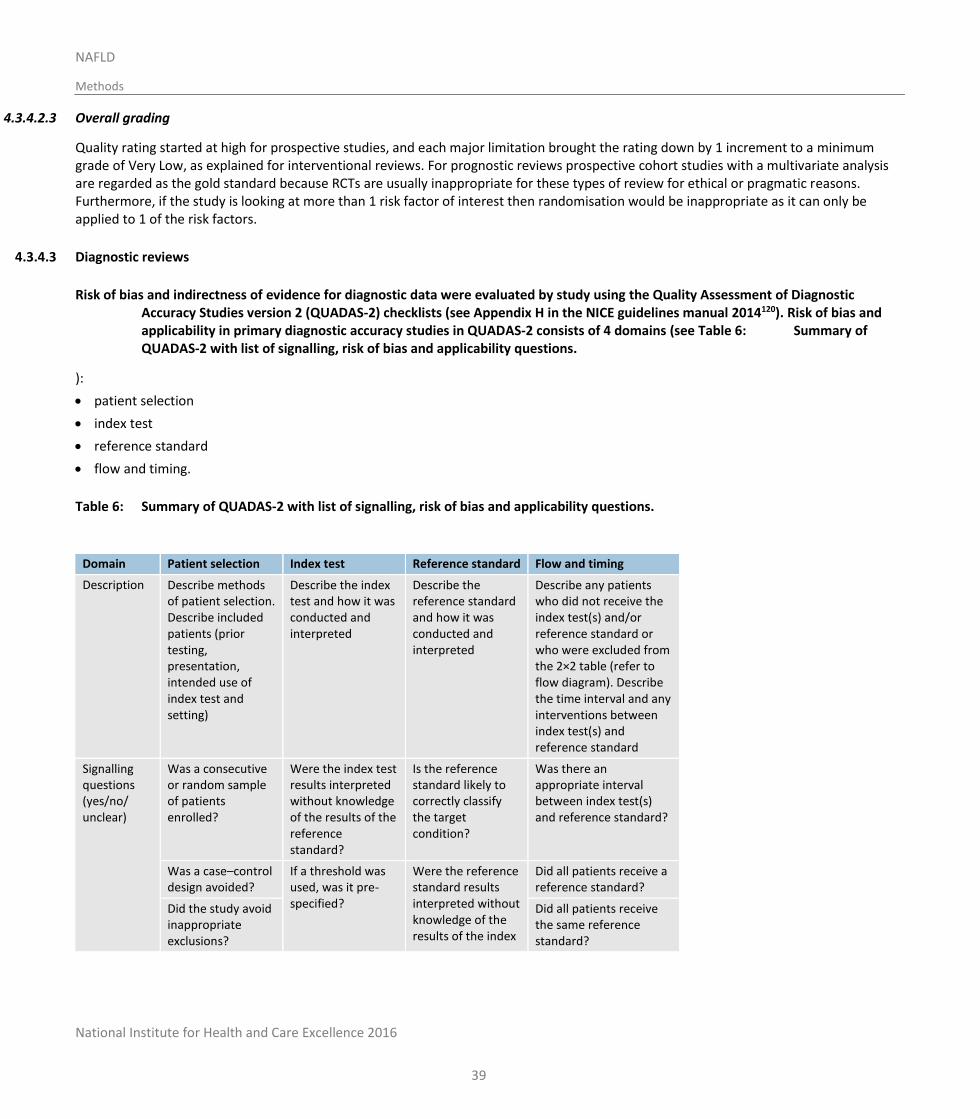
National Institute for Health and Care Excellence 2016
NAFLD
Methods
39
4.3.4.2.3 Overall grading
Quality rating started at high for prospective studies, and each major limitation brought the rating down by 1 increment to a minimum grade of Very Low, as explained for interventional reviews. For prognostic reviews prospective cohort studies with a multivariate analysis are regarded as the gold standard because RCTs are usually inappropriate for these types of review for ethical or pragmatic reasons. Furthermore, if the study is looking at more than 1 risk factor of interest then randomisation would be inappropriate as it can only be applied to 1 of the risk factors.
4.3.4.3 Diagnostic reviews
Risk of bias and indirectness of evidence for diagnostic data were evaluated by study using the Quality Assessment of Diagnostic Accuracy Studies version 2 (QUADAS-2) checklists (see Appendix H in the NICE guidelines manual 2014120). Risk of bias and applicability in primary diagnostic accuracy studies in QUADAS-2 consists of 4 domains (see Table 6: Summary of QUADAS-2 with list of signalling, risk of bias and applicability questions.
):
patient selection
index test
reference standard
flow and timing.
Table 6: Summary of QUADAS-2 with list of signalling, risk of bias and applicability questions.
Domain Patient selection Index test Reference standard Flow and timing
Description Describe methods of patient selection. Describe included patients (prior testing, presentation, intended use of index test and setting)
Describe the index test and how it was conducted and interpreted
Describe the reference standard and how it was conducted and interpreted
Describe any patients who did not receive the index test(s) and/or reference standard or who were excluded from the 2×2 table (refer to flow diagram). Describe the time interval and any interventions between index test(s) and reference standard
Signalling questions (yes/no/ unclear)
Was a consecutive or random sample of patients enrolled?
Were the index test results interpreted without knowledge of the results of the reference standard?
Is the reference standard likely to correctly classify the target condition?
Was there an appropriate interval between index test(s) and reference standard?
Was a case–control design avoided?
If a threshold was used, was it pre-specified?
Were the reference standard results interpreted without knowledge of the results of the index
Did all patients receive a reference standard?
Did the study avoid inappropriate exclusions?
Did all patients receive the same reference standard?
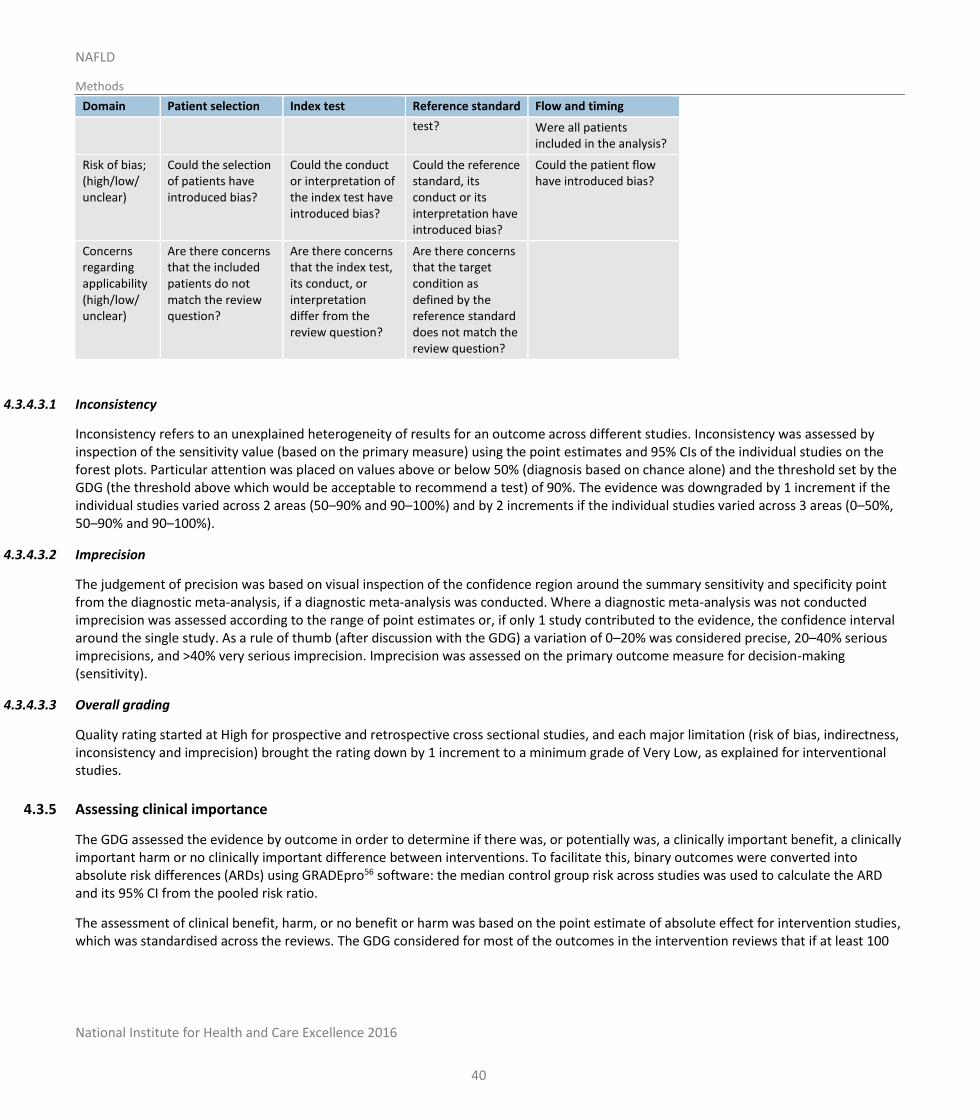
National Institute for Health and Care Excellence 2016
NAFLD
Methods
40
Domain Patient selection Index test Reference standard Flow and timing
test? Were all patients included in the analysis?
Risk of bias; (high/low/ unclear)
Could the selection of patients have introduced bias?
Could the conduct or interpretation of the index test have introduced bias?
Could the reference standard, its conduct or its interpretation have introduced bias?
Could the patient flow have introduced bias?
Concerns regarding applicability (high/low/ unclear)
Are there concerns that the included patients do not match the review question?
Are there concerns that the index test, its conduct, or interpretation differ from the review question?
Are there concerns that the target condition as defined by the reference standard does not match the review question?
4.3.4.3.1 Inconsistency
Inconsistency refers to an unexplained heterogeneity of results for an outcome across different studies. Inconsistency was assessed by inspection of the sensitivity value (based on the primary measure) using the point estimates and 95% CIs of the individual studies on the forest plots. Particular attention was placed on values above or below 50% (diagnosis based on chance alone) and the threshold set by the GDG (the threshold above which would be acceptable to recommend a test) of 90%. The evidence was downgraded by 1 increment if the individual studies varied across 2 areas (50–90% and 90–100%) and by 2 increments if the individual studies varied across 3 areas (0–50%, 50–90% and 90–100%).
4.3.4.3.2 Imprecision
The judgement of precision was based on visual inspection of the confidence region around the summary sensitivity and specificity point from the diagnostic meta-analysis, if a diagnostic meta-analysis was conducted. Where a diagnostic meta-analysis was not conducted imprecision was assessed according to the range of point estimates or, if only 1 study contributed to the evidence, the confidence interval around the single study. As a rule of thumb (after discussion with the GDG) a variation of 0–20% was considered precise, 20–40% serious imprecisions, and >40% very serious imprecision. Imprecision was assessed on the primary outcome measure for decision-making (sensitivity).
4.3.4.3.3 Overall grading
Quality rating started at High for prospective and retrospective cross sectional studies, and each major limitation (risk of bias, indirectness, inconsistency and imprecision) brought the rating down by 1 increment to a minimum grade of Very Low, as explained for interventional studies.
4.3.5 Assessing clinical importance
The GDG assessed the evidence by outcome in order to determine if there was, or potentially was, a clinically important benefit, a clinically important harm or no clinically important difference between interventions. To facilitate this, binary outcomes were converted into absolute risk differences (ARDs) using GRADEpro56 software: the median control group risk across studies was used to calculate the ARD and its 95% CI from the pooled risk ratio.
The assessment of clinical benefit, harm, or no benefit or harm was based on the point estimate of absolute effect for intervention studies, which was standardised across the reviews. The GDG considered for most of the outcomes in the intervention reviews that if at least 100
National Institute for Health and Care Excellence 2016
NAFLD
Methods
41
more participants per 1000 (10%) achieved the outcome of interest in the intervention group compared to the comparison group for a positive outcome then this intervention would be considered beneficial. The same point estimate but in the opposite direction applied for a negative outcome. For the critical outcome of mortality any reduction represented a clinical benefit. For adverse events 50 events or more per 1000 represented clinical harm. For continuous outcomes if the mean difference was greater than the minimally important difference (MID) then this resented a clinical benefit or harm. For outcomes such as mortality any reduction or increase was considered to be clinically important.
This assessment was carried out by the GDG for each critical outcome, and an evidence summary table was produced to compile the GDG’s assessments of clinical importance per outcome, alongside the evidence quality and the uncertainty in the effect estimate (imprecision).
4.3.6 Clinical evidence statements
Clinical evidence statements are summary statements that are included in each review chapter, and which summarise the key features of the clinical effectiveness evidence presented. The wording of the evidence statements reflects the certainty or uncertainty in the estimate of effect. The evidence statements are presented by outcome and encompass the following key features of the evidence:
The number of studies and the number of participants for a particular outcome.
An indication of the direction of clinical importance (if 1 treatment is beneficial or harmful compared to the other, or whether there is no difference between the 2 tested treatments).
A description of the overall quality of the evidence (GRADE overall quality).
4.4 Identifying and analysing evidence of cost-effectiveness
The GDG is required to make decisions based on the best available evidence of both clinical effectiveness and cost-effectiveness. Guideline recommendations should be based on the expected costs of the different options in relation to their expected health benefits (that is, their ‘cost-effectiveness’) rather than the total implementation cost.120 Thus, if the evidence suggests that a strategy provides significant health benefits at an acceptable cost per patient treated, it should be recommended even if it would be expensive to implement across the whole population.
Health economic evidence was sought relating to the key clinical issues being addressed in the guideline. Health economists:
Undertook a systematic review of the published economic literature.
Undertook new cost-effectiveness analysis in priority areas.
4.4.1 Literature review
The health economists:
Identified potentially relevant studies for each review question from the health economic search results by reviewing titles and abstracts. Full papers were then obtained.
Reviewed full papers against pre-specified inclusion and exclusion criteria to identify relevant studies (see below for details).
Critically appraised relevant studies using economic evaluations checklists as specified in the NICE guidelines manual.120,123
Extracted key information about the studies’ methods and results into economic evidence tables (included in Appendix I).
Generated summaries of the evidence in NICE economic evidence profile tables (included in the relevant chapter for each review question) – see below for details.
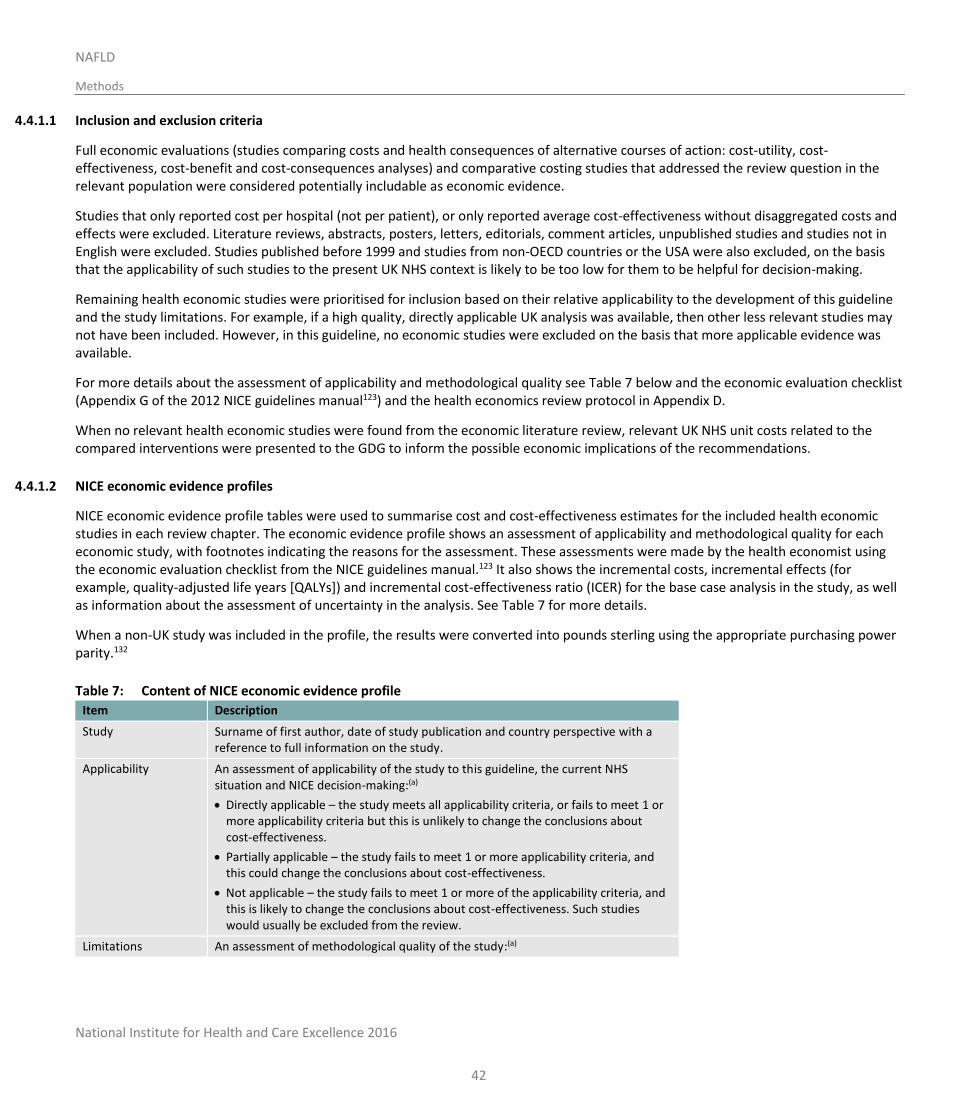
National Institute for Health and Care Excellence 2016
NAFLD
Methods
42
4.4.1.1 Inclusion and exclusion criteria
Full economic evaluations (studies comparing costs and health consequences of alternative courses of action: cost-utility, cost-effectiveness, cost-benefit and cost-consequences analyses) and comparative costing studies that addressed the review question in the relevant population were considered potentially includable as economic evidence.
Studies that only reported cost per hospital (not per patient), or only reported average cost-effectiveness without disaggregated costs and effects were excluded. Literature reviews, abstracts, posters, letters, editorials, comment articles, unpublished studies and studies not in English were excluded. Studies published before 1999 and studies from non-OECD countries or the USA were also excluded, on the basis that the applicability of such studies to the present UK NHS context is likely to be too low for them to be helpful for decision-making.
Remaining health economic studies were prioritised for inclusion based on their relative applicability to the development of this guideline and the study limitations. For example, if a high quality, directly applicable UK analysis was available, then other less relevant studies may not have been included. However, in this guideline, no economic studies were excluded on the basis that more applicable evidence was available.
For more details about the assessment of applicability and methodological quality see Table 7 below and the economic evaluation checklist (Appendix G of the 2012 NICE guidelines manual123) and the health economics review protocol in Appendix D.
When no relevant health economic studies were found from the economic literature review, relevant UK NHS unit costs related to the compared interventions were presented to the GDG to inform the possible economic implications of the recommendations.
4.4.1.2 NICE economic evidence profiles
NICE economic evidence profile tables were used to summarise cost and cost-effectiveness estimates for the included health economic studies in each review chapter. The economic evidence profile shows an assessment of applicability and methodological quality for each economic study, with footnotes indicating the reasons for the assessment. These assessments were made by the health economist using the economic evaluation checklist from the NICE guidelines manual.123 It also shows the incremental costs, incremental effects (for example, quality-adjusted life years [QALYs]) and incremental cost-effectiveness ratio (ICER) for the base case analysis in the study, as well as information about the assessment of uncertainty in the analysis. See Table 7 for more details.
When a non-UK study was included in the profile, the results were converted into pounds sterling using the appropriate purchasing power parity.132
Table 7: Content of NICE economic evidence profile
Item Description
Study Surname of first author, date of study publication and country perspective with a reference to full information on the study.
Applicability An assessment of applicability of the study to this guideline, the current NHS situation and NICE decision-making:(a)
Directly applicable – the study meets all applicability criteria, or fails to meet 1 or more applicability criteria but this is unlikely to change the conclusions about cost-effectiveness.
Partially applicable – the study fails to meet 1 or more applicability criteria, and this could change the conclusions about cost-effectiveness.
Not applicable – the study fails to meet 1 or more of the applicability criteria, and this is likely to change the conclusions about cost-effectiveness. Such studies would usually be excluded from the review.
Limitations An assessment of methodological quality of the study:(a)
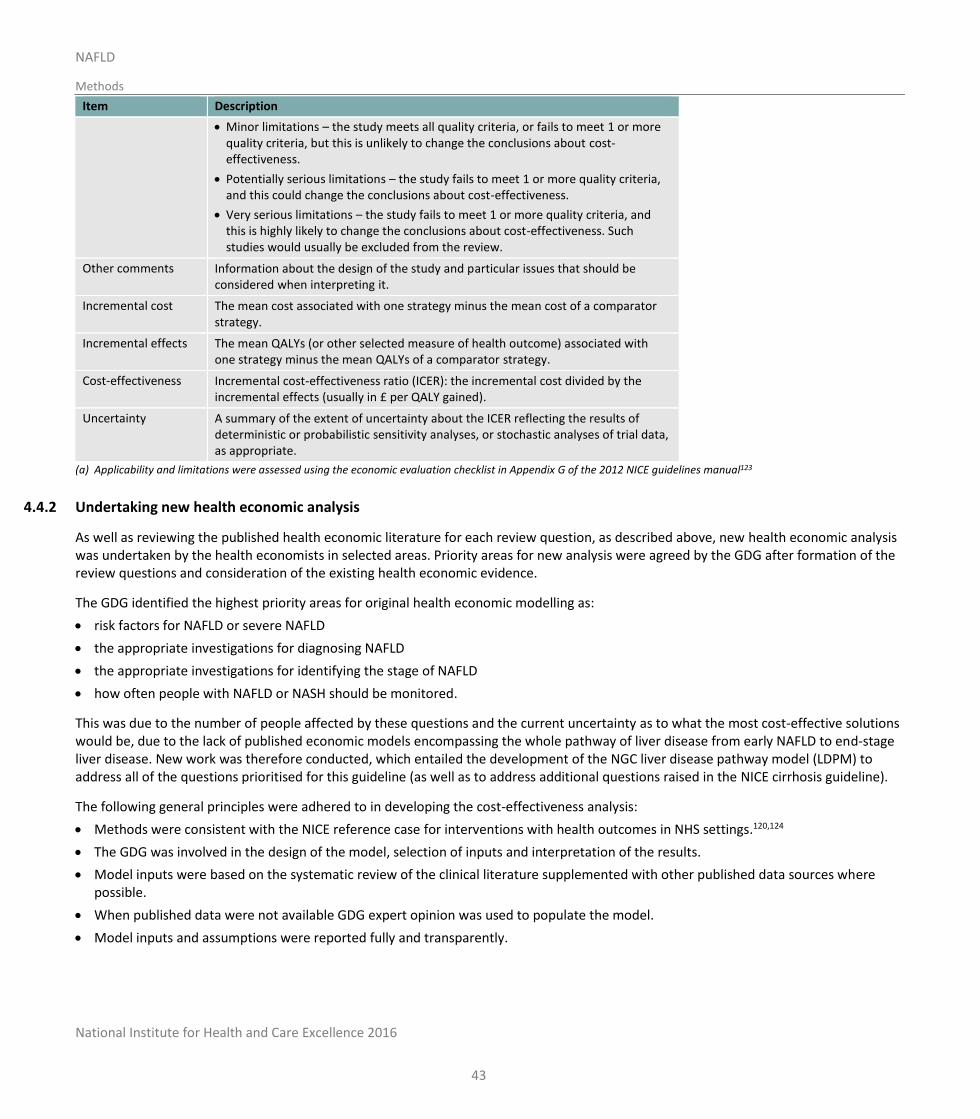
National Institute for Health and Care Excellence 2016
NAFLD
Methods
43
Item Description
Minor limitations – the study meets all quality criteria, or fails to meet 1 or more quality criteria, but this is unlikely to change the conclusions about cost-effectiveness.
Potentially serious limitations – the study fails to meet 1 or more quality criteria, and this could change the conclusions about cost-effectiveness.
Very serious limitations – the study fails to meet 1 or more quality criteria, and this is highly likely to change the conclusions about cost-effectiveness. Such studies would usually be excluded from the review.
Other comments Information about the design of the study and particular issues that should be considered when interpreting it.
Incremental cost The mean cost associated with one strategy minus the mean cost of a comparator strategy.
Incremental effects The mean QALYs (or other selected measure of health outcome) associated with one strategy minus the mean QALYs of a comparator strategy.
Cost-effectiveness Incremental cost-effectiveness ratio (ICER): the incremental cost divided by the incremental effects (usually in £ per QALY gained).
Uncertainty A summary of the extent of uncertainty about the ICER reflecting the results of deterministic or probabilistic sensitivity analyses, or stochastic analyses of trial data, as appropriate.
(a) Applicability and limitations were assessed using the economic evaluation checklist in Appendix G of the 2012 NICE guidelines manual123
4.4.2 Undertaking new health economic analysis
As well as reviewing the published health economic literature for each review question, as described above, new health economic analysis was undertaken by the health economists in selected areas. Priority areas for new analysis were agreed by the GDG after formation of the review questions and consideration of the existing health economic evidence.
The GDG identified the highest priority areas for original health economic modelling as:
risk factors for NAFLD or severe NAFLD
the appropriate investigations for diagnosing NAFLD
the appropriate investigations for identifying the stage of NAFLD
how often people with NAFLD or NASH should be monitored.
This was due to the number of people affected by these questions and the current uncertainty as to what the most cost-effective solutions would be, due to the lack of published economic models encompassing the whole pathway of liver disease from early NAFLD to end-stage liver disease. New work was therefore conducted, which entailed the development of the NGC liver disease pathway model (LDPM) to address all of the questions prioritised for this guideline (as well as to address additional questions raised in the NICE cirrhosis guideline).
The following general principles were adhered to in developing the cost-effectiveness analysis:
Methods were consistent with the NICE reference case for interventions with health outcomes in NHS settings.120,124
The GDG was involved in the design of the model, selection of inputs and interpretation of the results.
Model inputs were based on the systematic review of the clinical literature supplemented with other published data sources where possible.
When published data were not available GDG expert opinion was used to populate the model.
Model inputs and assumptions were reported fully and transparently.
National Institute for Health and Care Excellence 2016
NAFLD
Methods
44
The results were subject to sensitivity analysis and limitations were discussed.
The model was peer-reviewed by another health economist at the NGC.
Full methods for the cost-effectiveness analysis are described in Appendix N.
4.4.3 Cost-effectiveness criteria
NICE’s report ‘Social value judgements: principles for the development of NICE guidance’ sets out the principles that GDGs should consider when judging whether an intervention offers good value for money.122 In general, an intervention was considered to be cost-effective (given that the estimate was considered plausible) if either of the following criteria applied:
the intervention dominated other relevant strategies (that is, it was both less costly in terms of resource use and more clinically effective compared with all the other relevant alternative strategies), or
the intervention cost less than £20,000 per QALY gained compared with the next best strategy.
If the GDG recommended an intervention that was estimated to cost more than £20,000 per QALY gained, or did not recommend one that was estimated to cost less than £20,000 per QALY gained, the reasons for this decision are discussed explicitly in the ‘Recommendations and link to evidence’ section of the relevant chapter, with reference to issues regarding the plausibility of the estimate or to the factors set out in ‘Social value judgements: principles for the development of NICE guidance’.122
When QALYs or life years gained are not used in the analysis, results are difficult to interpret unless one strategy dominates the others with respect to every relevant health outcome and cost.
4.4.4 In the absence of economic evidence
When no relevant published health economic studies were found, and a new analysis was not prioritised, the GDG made a qualitative judgement about cost-effectiveness by considering expected differences in resource use between options and relevant UK NHS unit costs, alongside the results of the review of clinical effectiveness evidence.
The UK NHS costs reported in the guideline are those that were presented to the GDG and were correct at the time recommendations were drafted. They may have changed subsequently before the time of publication. However, we have no reason to believe they have changed substantially.
4.5 Developing recommendations
Over the course of the guideline development process, the GDG was presented with:
Evidence tables of the clinical and economic evidence reviewed from the literature. All evidence tables are in Appendices H and I.
Summaries of clinical and economic evidence and quality (as presented in Chapters 5–17).
Forest plots and diagnostic meta-analysis plots (Appendix K).
A description of the methods and results of the cost-effectiveness analysis undertaken for the guideline (Appendix N).
Recommendations were drafted on the basis of the GDG’s interpretation of the available evidence, taking into account the balance of benefits, harms and costs between different courses of action. This was either done formally in an economic model, or informally. Firstly, the net clinical benefit over harm (clinical effectiveness) was considered, focusing on the critical outcomes. When this was done informally, the GDG took into account the clinical benefits and harms when 1 intervention was compared with another. The assessment of net clinical benefit was moderated by the importance placed on the outcomes (the GDG’s values and preferences), and the confidence the GDG had in the evidence (evidence quality). Secondly, the GDG assessed whether the net clinical benefit justified any differences in costs between the alternative interventions.
National Institute for Health and Care Excellence 2016
NAFLD
Methods
45
When clinical and economic evidence was of poor quality, conflicting or absent, the GDG drafted recommendations based on its expert opinion. The considerations for making consensus-based recommendations include the balance between potential harms and benefits, the economic costs compared to the economic benefits, current practices, recommendations made in other relevant guidelines, patient preferences and equality issues. The consensus recommendations were agreed through discussions in the GDG. The GDG also considered whether the uncertainty was sufficient to justify delaying making a recommendation to await further research, taking into account the potential harm of failing to make a clear recommendation (see Section 4.5.1 below).
The GDG considered the appropriate ‘strength’ of each recommendation. This takes into account the quality of the evidence but is conceptually different. Some recommendations are ’strong’ in that the GDG believes that the vast majority of healthcare and other professionals and patients would choose a particular intervention if they considered the evidence in the same way that the GDG has. This is generally the case if the benefits clearly outweigh the harms for most people and the intervention is likely to be cost-effective. However, there is often a closer balance between benefits and harms, and some patients would not choose an intervention whereas others would. This may happen, for example, if some patients are particularly averse to some side effect and others are not. In these circumstances the recommendation is generally weaker, although it may be possible to make stronger recommendations about specific groups of patients.
The GDG focused on the following factors in agreeing the wording of the recommendations:
The actions health professionals need to take.
The information readers need to know.
The strength of the recommendation (for example the word ‘offer’ was used for strong recommendations and ‘consider’ for weak recommendations).
The involvement of patients (and their carers if needed) in decisions on treatment and care.
Consistency with NICE’s standard advice on recommendations about drugs, waiting times and ineffective interventions (see Section 9.2 in the 2014 NICE guidelines manual120).
The main considerations specific to each recommendation are outlined in the ‘Recommendations and link to evidence’ sections within each chapter.
4.5.1 Research recommendations
When areas were identified for which good evidence was lacking, the GDG considered making recommendations for future research. Decisions about inclusion were based on factors such as:
the importance to patients or the population
national priorities
potential impact on the NHS and future NICE guidance
ethical and technical feasibility.
4.5.2 Validation process
This guidance is subject to a 6-week public consultation and feedback as part of the quality assurance and peer review of the document. All comments received from registered stakeholders are responded to in turn and posted on the NICE website.
4.5.3 Updating the guideline
Following publication, and in accordance with the NICE guidelines manual, NICE will undertake a review of whether the evidence base has progressed significantly to alter the guideline recommendations and warrant an update.
National Institute for Health and Care Excellence 2016
NAFLD
Methods
46
4.5.4 Disclaimer
Healthcare providers need to use clinical judgement, knowledge and expertise when deciding whether it is appropriate to apply guidelines. The recommendations cited here are a guide and may not be appropriate for use in all situations. The decision to adopt any of the recommendations cited here must be made by practitioners in light of individual patient circumstances, the wishes of the patient, clinical expertise and resources.
The National Guideline Centre disclaims any responsibility for damages arising out of the use or non-use of this guideline and the literature used in support of this guideline.
4.5.5 Funding
The National Guideline Centre was commissioned by the National Institute for Health and Care Excellence to undertake the work on this guideline.
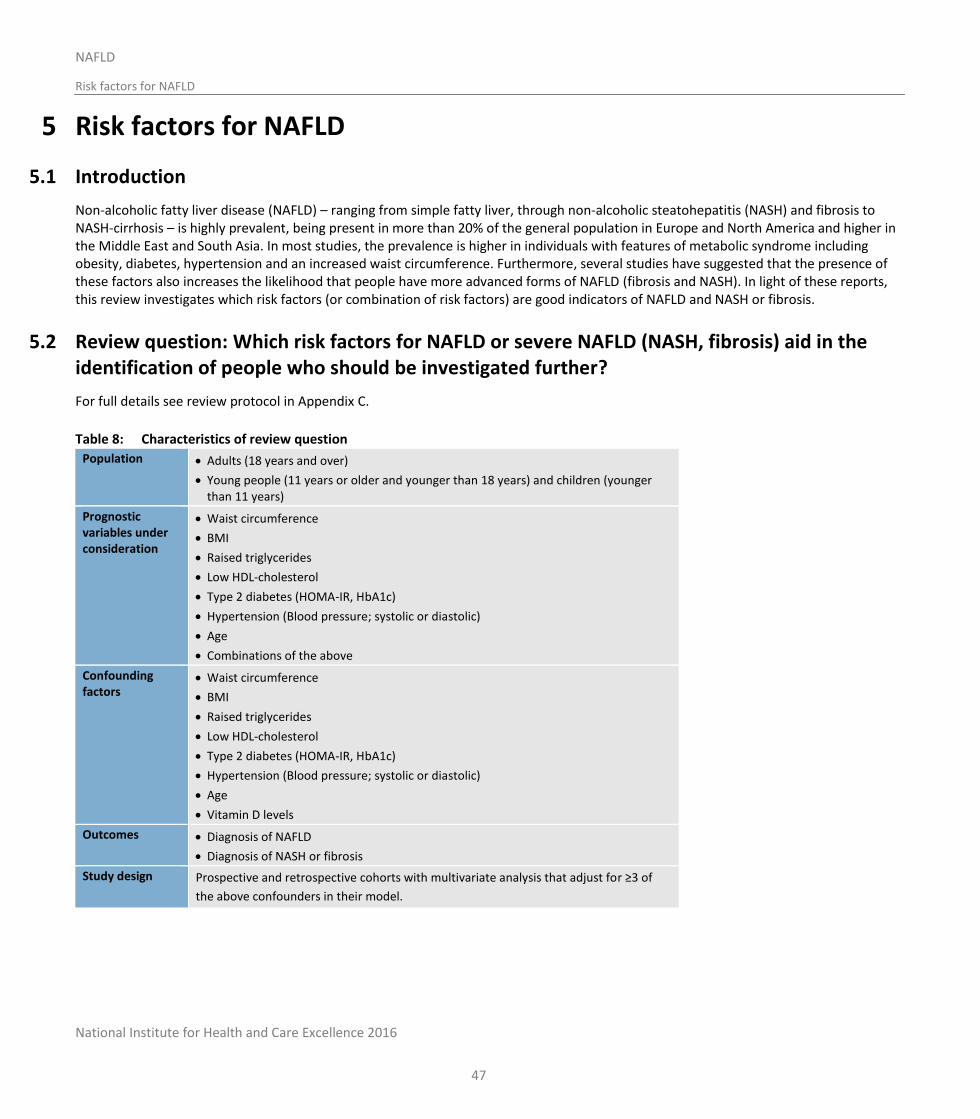
National Institute for Health and Care Excellence 2016
NAFLD
Risk factors for NAFLD
47
5 Risk factors for NAFLD
5.1 Introduction
Non-alcoholic fatty liver disease (NAFLD) – ranging from simple fatty liver, through non-alcoholic steatohepatitis (NASH) and fibrosis to NASH-cirrhosis – is highly prevalent, being present in more than 20% of the general population in Europe and North America and higher in the Middle East and South Asia. In most studies, the prevalence is higher in individuals with features of metabolic syndrome including obesity, diabetes, hypertension and an increased waist circumference. Furthermore, several studies have suggested that the presence of these factors also increases the likelihood that people have more advanced forms of NAFLD (fibrosis and NASH). In light of these reports, this review investigates which risk factors (or combination of risk factors) are good indicators of NAFLD and NASH or fibrosis.
5.2 Review question: Which risk factors for NAFLD or severe NAFLD (NASH, fibrosis) aid in the identification of people who should be investigated further?
For full details see review protocol in Appendix C.
Table 8: Characteristics of review question
Population Adults (18 years and over)
Young people (11 years or older and younger than 18 years) and children (younger than 11 years)
Prognostic variables under consideration
Waist circumference
BMI
Raised triglycerides
Low HDL-cholesterol
Type 2 diabetes (HOMA-IR, HbA1c)
Hypertension (Blood pressure; systolic or diastolic)
Age
Combinations of the above
Confounding factors
Waist circumference
BMI
Raised triglycerides
Low HDL-cholesterol
Type 2 diabetes (HOMA-IR, HbA1c)
Hypertension (Blood pressure; systolic or diastolic)
Age
Vitamin D levels
Outcomes Diagnosis of NAFLD
Diagnosis of NASH or fibrosis
Study design Prospective and retrospective cohorts with multivariate analysis that adjust for ≥3 of
the above confounders in their model.
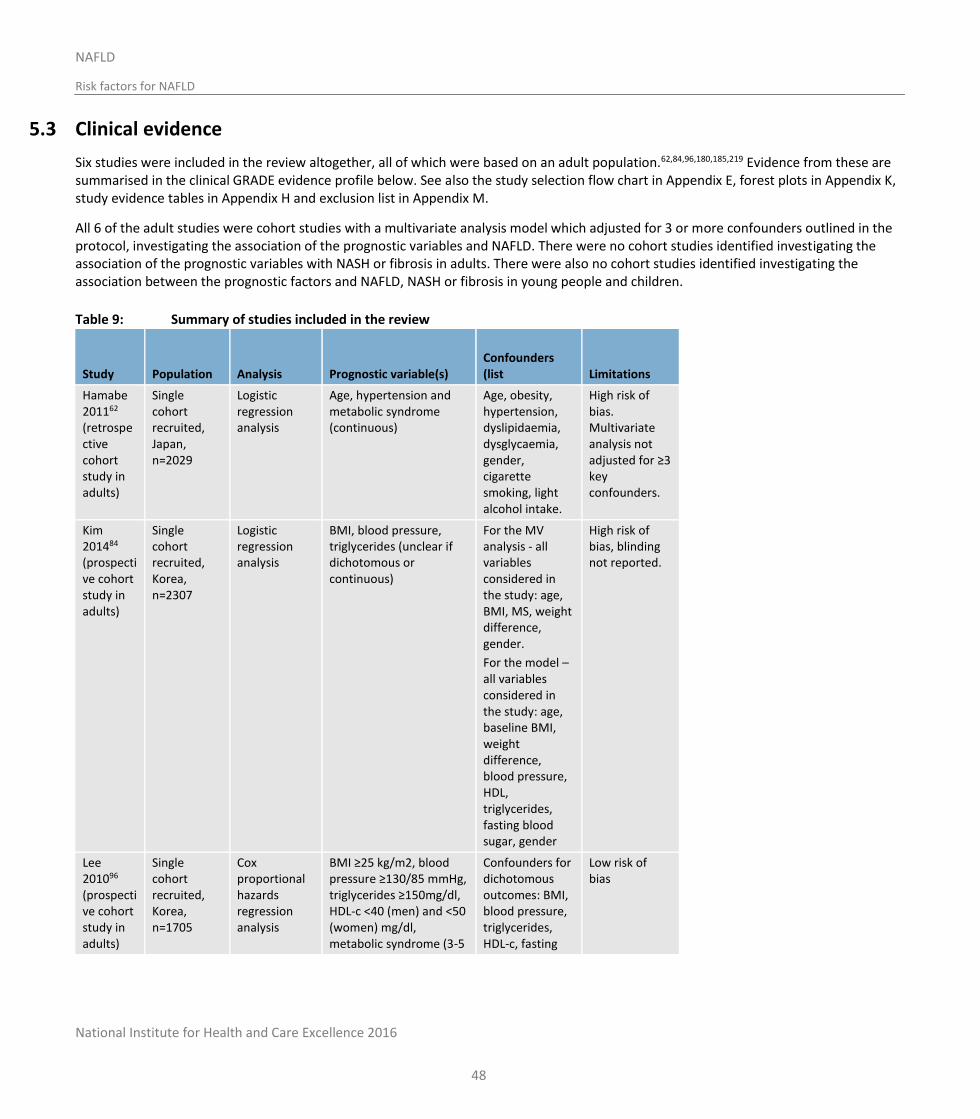
National Institute for Health and Care Excellence 2016
NAFLD
Risk factors for NAFLD
48
5.3 Clinical evidence
Six studies were included in the review altogether, all of which were based on an adult population.62,84,96,180,185,219 Evidence from these are summarised in the clinical GRADE evidence profile below. See also the study selection flow chart in Appendix E, forest plots in Appendix K, study evidence tables in Appendix H and exclusion list in Appendix M.
All 6 of the adult studies were cohort studies with a multivariate analysis model which adjusted for 3 or more confounders outlined in the protocol, investigating the association of the prognostic variables and NAFLD. There were no cohort studies identified investigating the association of the prognostic variables with NASH or fibrosis in adults. There were also no cohort studies identified investigating the association between the prognostic factors and NAFLD, NASH or fibrosis in young people and children.
Table 9: Summary of studies included in the review
Study Population
Analysis Prognostic variable(s)
Confounders (list Limitations
Hamabe 201162
(retrospective cohort study in adults)
Single cohort recruited, Japan, n=2029
Logistic regression analysis
Age, hypertension and metabolic syndrome (continuous)
Age, obesity, hypertension, dyslipidaemia, dysglycaemia, gender, cigarette smoking, light alcohol intake.
High risk of bias. Multivariate analysis not adjusted for ≥3 key confounders.
Kim 201484 (prospective cohort study in adults)
Single cohort recruited, Korea, n=2307
Logistic regression analysis
BMI, blood pressure, triglycerides (unclear if dichotomous or continuous)
For the MV analysis - all variables considered in the study: age, BMI, MS, weight difference, gender.
For the model – all variables considered in the study: age, baseline BMI, weight difference, blood pressure, HDL, triglycerides, fasting blood sugar, gender
High risk of bias, blinding not reported.
Lee 201096 (prospective cohort study in adults)
Single cohort recruited, Korea, n=1705
Cox proportional hazards regression analysis
BMI ≥25 kg/m2, blood pressure ≥130/85 mmHg, triglycerides ≥150mg/dl, HDL-c <40 (men) and <50 (women) mg/dl, metabolic syndrome (3-5
Confounders for dichotomous outcomes: BMI, blood pressure, triglycerides, HDL-c, fasting
Low risk of bias
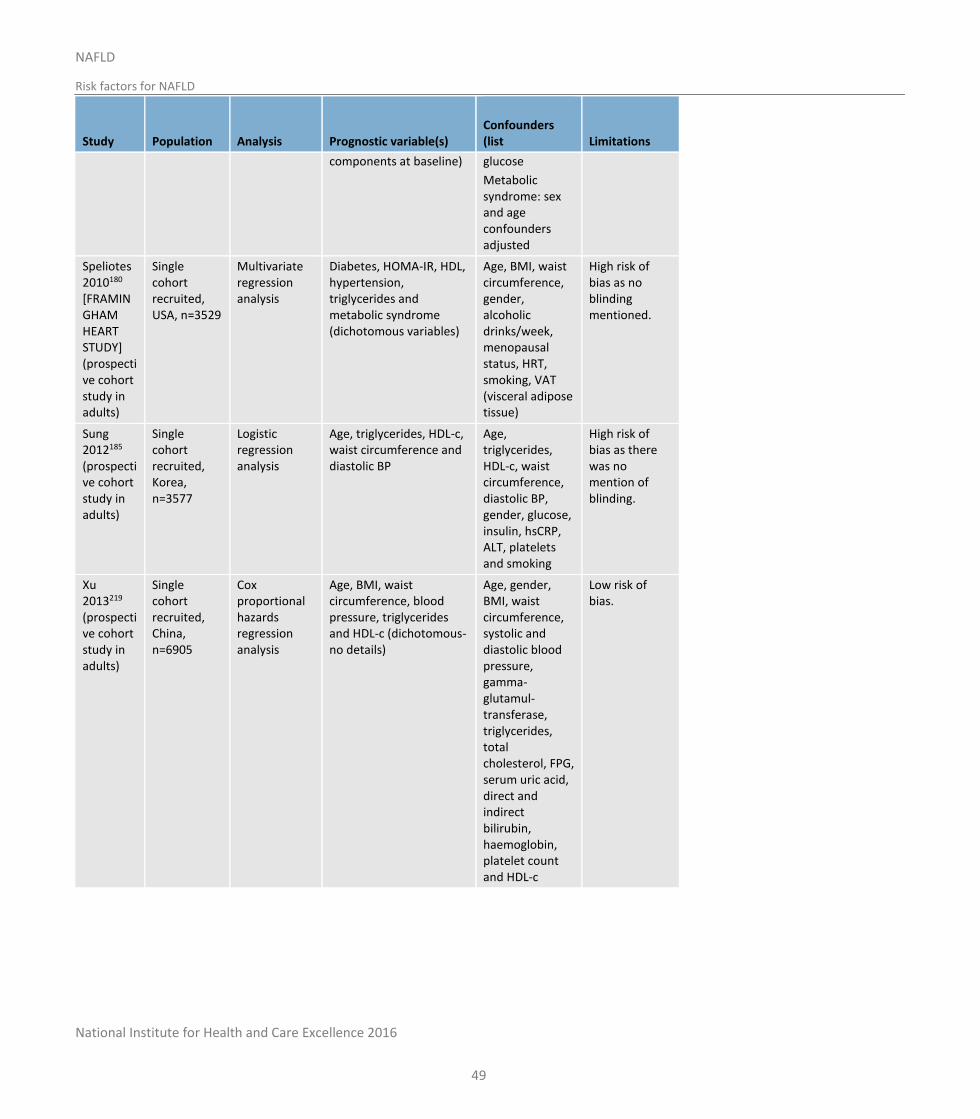
National Institute for Health and Care Excellence 2016
NAFLD
Risk factors for NAFLD
49
Study Population
Analysis Prognostic variable(s)
Confounders (list Limitations
components at baseline) glucose
Metabolic syndrome: sex and age confounders adjusted
Speliotes 2010180 [FRAMINGHAM HEART STUDY] (prospective cohort study in adults)
Single cohort recruited, USA, n=3529
Multivariate regression analysis
Diabetes, HOMA-IR, HDL, hypertension, triglycerides and metabolic syndrome (dichotomous variables)
Age, BMI, waist circumference, gender, alcoholic drinks/week, menopausal status, HRT, smoking, VAT (visceral adipose tissue)
High risk of bias as no blinding mentioned.
Sung 2012185 (prospective cohort study in adults)
Single cohort recruited, Korea, n=3577
Logistic regression analysis
Age, triglycerides, HDL-c, waist circumference and diastolic BP
Age, triglycerides, HDL-c, waist circumference, diastolic BP, gender, glucose, insulin, hsCRP, ALT, platelets and smoking
High risk of bias as there was no mention of blinding.
Xu 2013219 (prospective cohort study in adults)
Single cohort recruited, China, n=6905
Cox proportional hazards regression analysis
Age, BMI, waist circumference, blood pressure, triglycerides and HDL-c (dichotomous-no details)
Age, gender, BMI, waist circumference, systolic and diastolic blood pressure, gamma-glutamul-transferase, triglycerides, total cholesterol, FPG, serum uric acid, direct and indirect bilirubin, haemoglobin, platelet count and HDL-c
Low risk of bias.
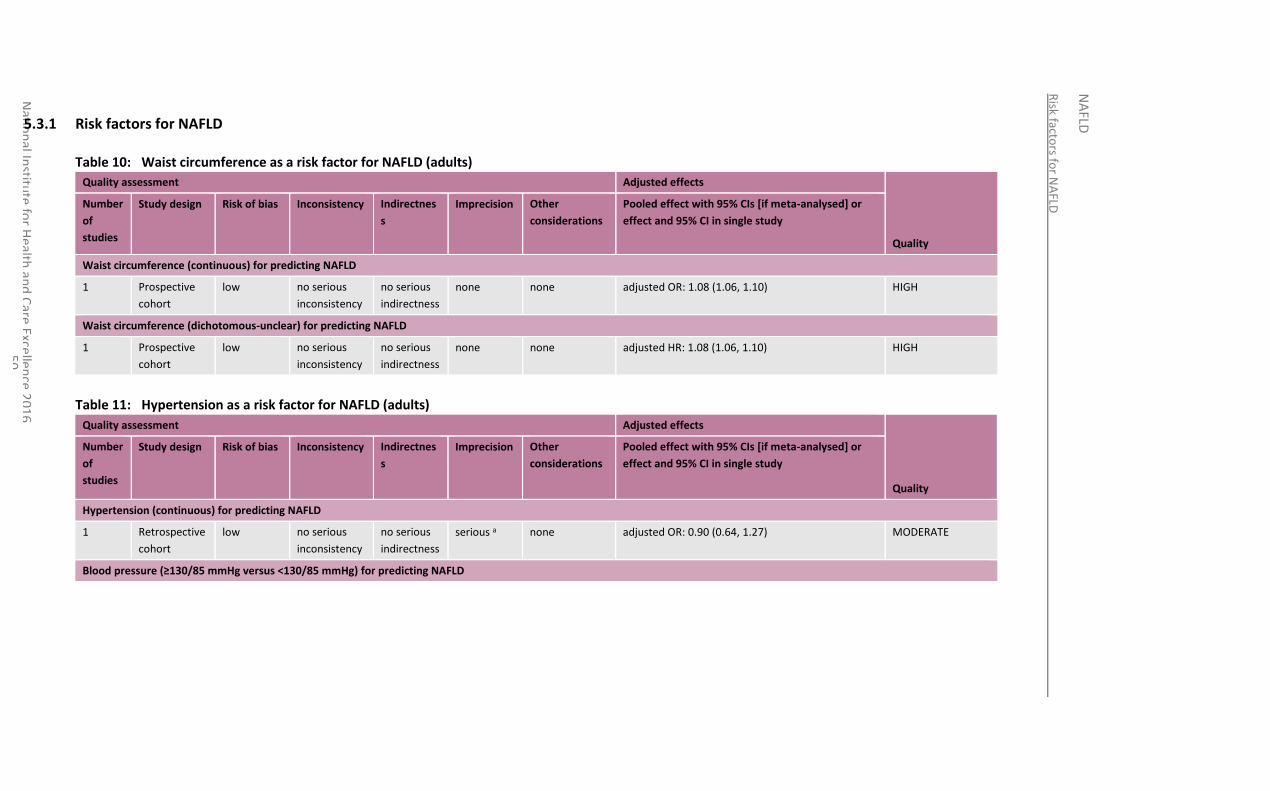
Risk facto
rs for N
AFLD
NA
FLD
Natio
nal In
stitute
for H
ealth an
d C
are Excellen
ce 20
16
5
0
5.3.1 Risk factors for NAFLD
Table 10: Waist circumference as a risk factor for NAFLD (adults)
Quality assessment Adjusted effects
Quality
Number
of
studies
Study design Risk of bias Inconsistency Indirectnes
s
Imprecision Other
considerations
Pooled effect with 95% CIs [if meta-analysed] or
effect and 95% CI in single study
Waist circumference (continuous) for predicting NAFLD
1 Prospective
cohort
low no serious
inconsistency
no serious
indirectness
none none adjusted OR: 1.08 (1.06, 1.10) HIGH
Waist circumference (dichotomous-unclear) for predicting NAFLD
1 Prospective
cohort
low no serious
inconsistency
no serious
indirectness
none none adjusted HR: 1.08 (1.06, 1.10) HIGH
Table 11: Hypertension as a risk factor for NAFLD (adults)
Quality assessment Adjusted effects
Quality
Number
of
studies
Study design Risk of bias Inconsistency Indirectnes
s
Imprecision Other
considerations
Pooled effect with 95% CIs [if meta-analysed] or
effect and 95% CI in single study
Hypertension (continuous) for predicting NAFLD
1 Retrospective
cohort
low no serious
inconsistency
no serious
indirectness
serious a none adjusted OR: 0.90 (0.64, 1.27) MODERATE
Blood pressure (≥130/85 mmHg versus <130/85 mmHg) for predicting NAFLD
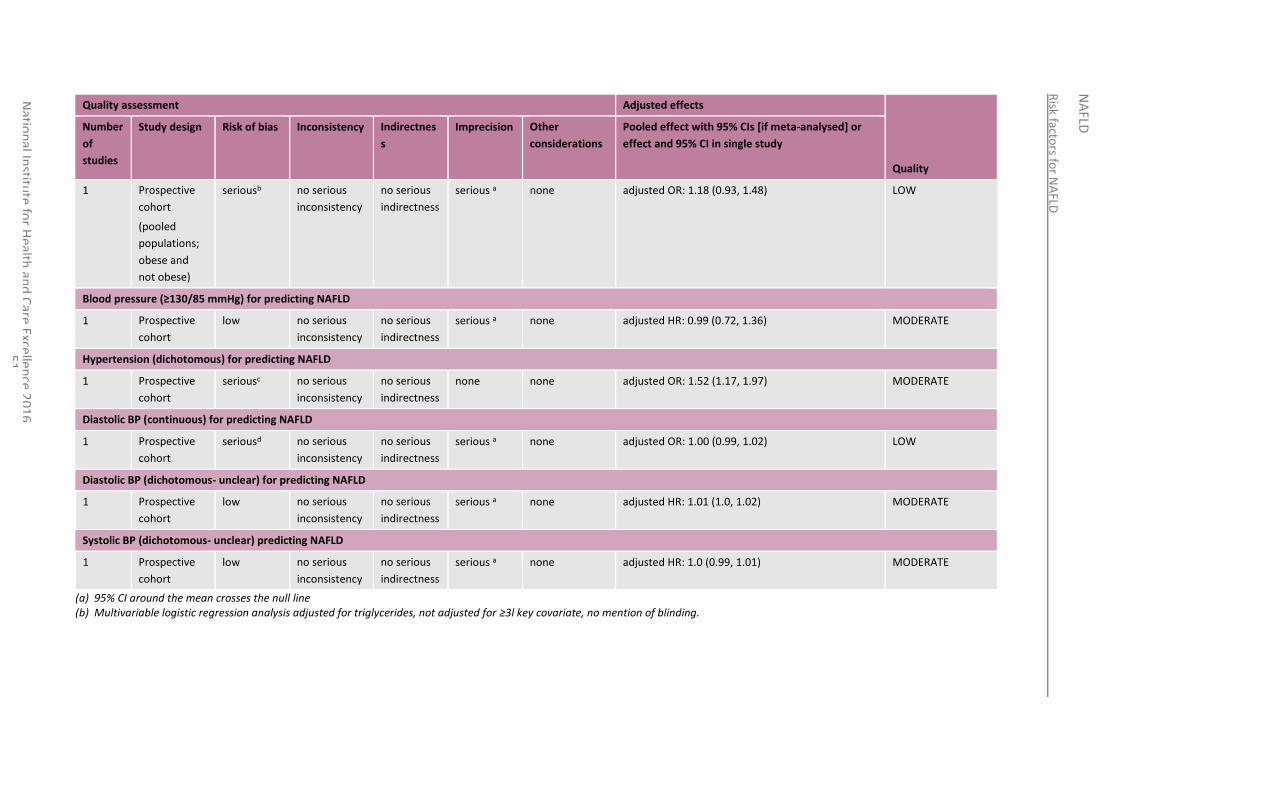
Risk facto
rs for N
AFLD
NA
FLD
Natio
nal In
stitute
for H
ealth an
d C
are Excellen
ce 20
16
5
1
Quality assessment Adjusted effects
Quality
Number
of
studies
Study design Risk of bias Inconsistency Indirectnes
s
Imprecision Other
considerations
Pooled effect with 95% CIs [if meta-analysed] or
effect and 95% CI in single study
1
Prospective
cohort
(pooled
populations;
obese and
not obese)
seriousb no serious
inconsistency
no serious
indirectness
serious a none adjusted OR: 1.18 (0.93, 1.48) LOW
Blood pressure (≥130/85 mmHg) for predicting NAFLD
1 Prospective
cohort
low no serious
inconsistency
no serious
indirectness
serious a none adjusted HR: 0.99 (0.72, 1.36) MODERATE
Hypertension (dichotomous) for predicting NAFLD
1 Prospective
cohort
seriousc no serious
inconsistency
no serious
indirectness
none none adjusted OR: 1.52 (1.17, 1.97) MODERATE
Diastolic BP (continuous) for predicting NAFLD
1 Prospective
cohort
seriousd no serious
inconsistency
no serious
indirectness
serious a none adjusted OR: 1.00 (0.99, 1.02) LOW
Diastolic BP (dichotomous- unclear) for predicting NAFLD
1 Prospective
cohort
low no serious
inconsistency
no serious
indirectness
serious a none adjusted HR: 1.01 (1.0, 1.02) MODERATE
Systolic BP (dichotomous- unclear) predicting NAFLD
1 Prospective
cohort
low no serious
inconsistency
no serious
indirectness
serious a none adjusted HR: 1.0 (0.99, 1.01) MODERATE
(a) 95% CI around the mean crosses the null line (b) Multivariable logistic regression analysis adjusted for triglycerides, not adjusted for ≥3l key covariate, no mention of blinding.
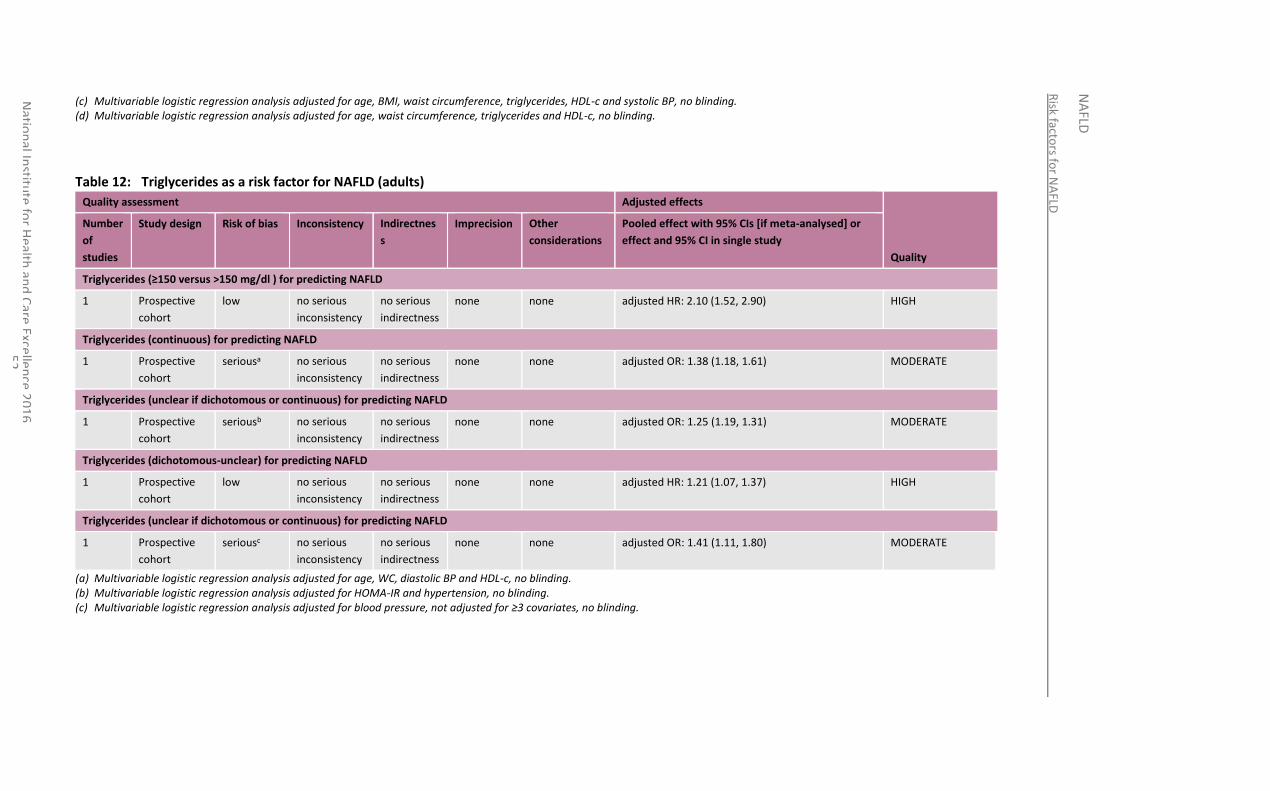
Risk facto
rs for N
AFLD
NA
FLD
Natio
nal In
stitute
for H
ealth an
d C
are Excellen
ce 20
16
5
2
(c) Multivariable logistic regression analysis adjusted for age, BMI, waist circumference, triglycerides, HDL-c and systolic BP, no blinding. (d) Multivariable logistic regression analysis adjusted for age, waist circumference, triglycerides and HDL-c, no blinding.
Table 12: Triglycerides as a risk factor for NAFLD (adults)
Quality assessment Adjusted effects
Quality
Number
of
studies
Study design Risk of bias Inconsistency Indirectnes
s
Imprecision Other
considerations
Pooled effect with 95% CIs [if meta-analysed] or
effect and 95% CI in single study
Triglycerides (≥150 versus >150 mg/dl ) for predicting NAFLD
1 Prospective
cohort
low no serious
inconsistency
no serious
indirectness
none none adjusted HR: 2.10 (1.52, 2.90) HIGH
Triglycerides (continuous) for predicting NAFLD
1 Prospective
cohort
seriousa no serious
inconsistency
no serious
indirectness
none none adjusted OR: 1.38 (1.18, 1.61) MODERATE
Triglycerides (unclear if dichotomous or continuous) for predicting NAFLD
1 Prospective
cohort
seriousb no serious
inconsistency
no serious
indirectness
none none adjusted OR: 1.25 (1.19, 1.31) MODERATE
Triglycerides (dichotomous-unclear) for predicting NAFLD
1 Prospective
cohort
low no serious
inconsistency
no serious
indirectness
none none adjusted HR: 1.21 (1.07, 1.37) HIGH
Triglycerides (unclear if dichotomous or continuous) for predicting NAFLD
1 Prospective
cohort
seriousc no serious
inconsistency
no serious
indirectness
none none adjusted OR: 1.41 (1.11, 1.80) MODERATE
(a) Multivariable logistic regression analysis adjusted for age, WC, diastolic BP and HDL-c, no blinding. (b) Multivariable logistic regression analysis adjusted for HOMA-IR and hypertension, no blinding. (c) Multivariable logistic regression analysis adjusted for blood pressure, not adjusted for ≥3 covariates, no blinding.
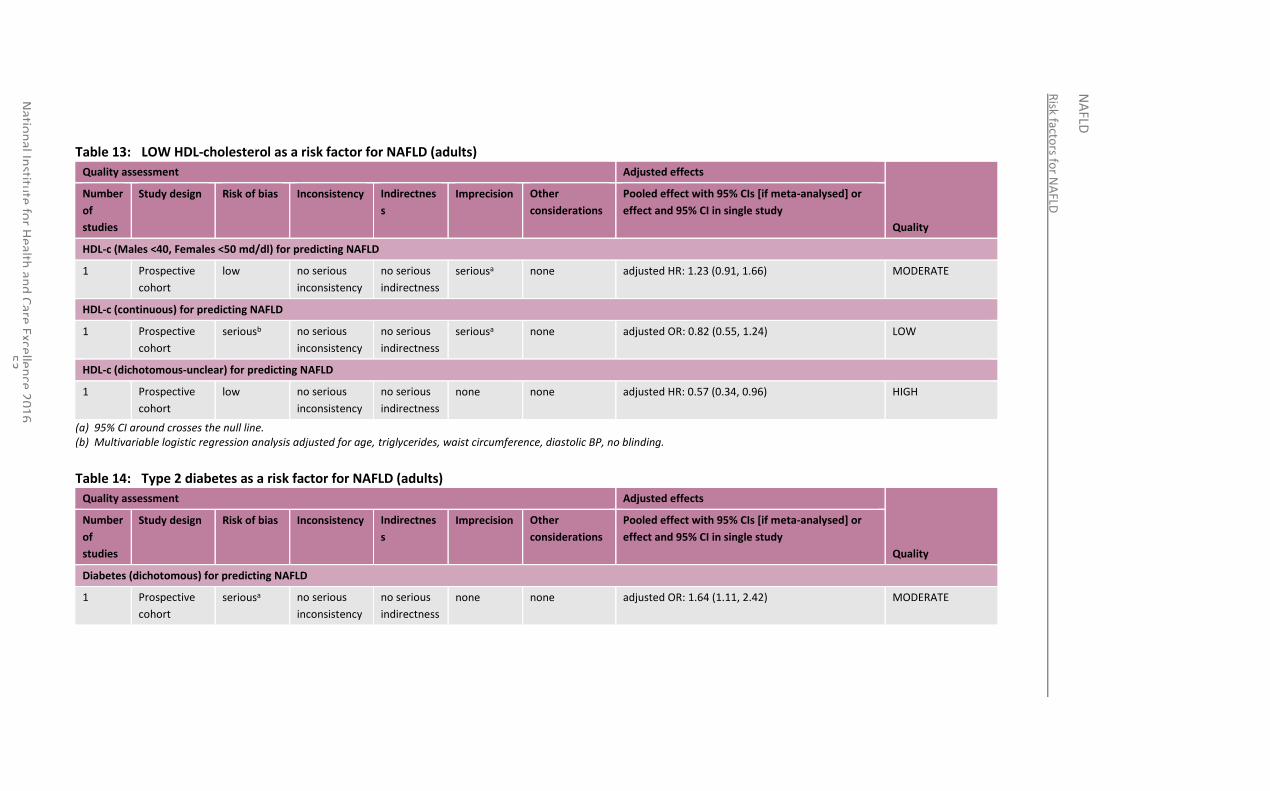
Risk facto
rs for N
AFLD
NA
FLD
Natio
nal In
stitute
for H
ealth an
d C
are Excellen
ce 20
16
5
3
Table 13: LOW HDL-cholesterol as a risk factor for NAFLD (adults)
Quality assessment Adjusted effects
Quality
Number
of
studies
Study design Risk of bias Inconsistency Indirectnes
s
Imprecision Other
considerations
Pooled effect with 95% CIs [if meta-analysed] or
effect and 95% CI in single study
HDL-c (Males <40, Females <50 md/dl) for predicting NAFLD
1 Prospective
cohort
low no serious
inconsistency
no serious
indirectness
seriousa none adjusted HR: 1.23 (0.91, 1.66) MODERATE
HDL-c (continuous) for predicting NAFLD
1 Prospective
cohort
seriousb no serious
inconsistency
no serious
indirectness
seriousa none adjusted OR: 0.82 (0.55, 1.24) LOW
HDL-c (dichotomous-unclear) for predicting NAFLD
1 Prospective
cohort
low no serious
inconsistency
no serious
indirectness
none none adjusted HR: 0.57 (0.34, 0.96) HIGH
(a) 95% CI around crosses the null line. (b) Multivariable logistic regression analysis adjusted for age, triglycerides, waist circumference, diastolic BP, no blinding.
Table 14: Type 2 diabetes as a risk factor for NAFLD (adults)
Quality assessment Adjusted effects
Quality
Number
of
studies
Study design Risk of bias Inconsistency Indirectnes
s
Imprecision Other
considerations
Pooled effect with 95% CIs [if meta-analysed] or
effect and 95% CI in single study
Diabetes (dichotomous) for predicting NAFLD
1 Prospective
cohort
seriousa no serious
inconsistency
no serious
indirectness
none none adjusted OR: 1.64 (1.11, 2.42) MODERATE
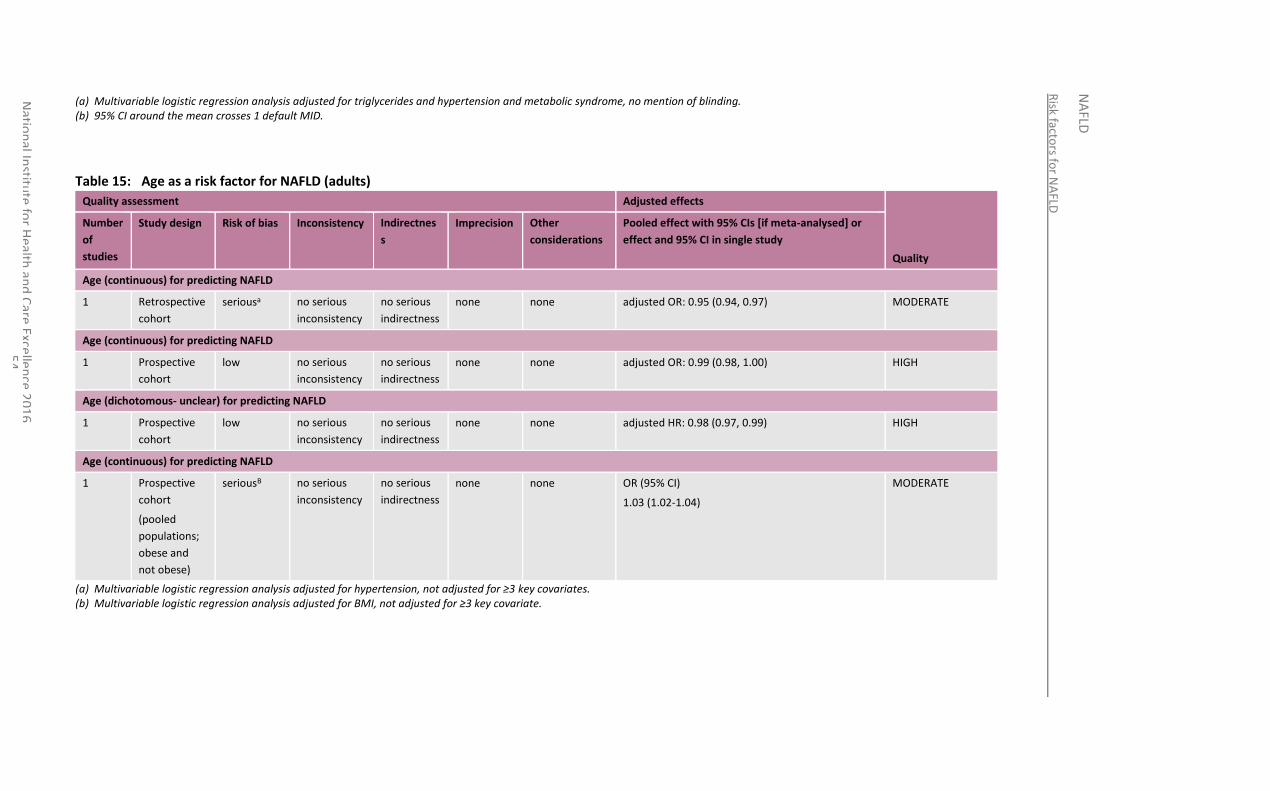
Risk facto
rs for N
AFLD
NA
FLD
Natio
nal In
stitute
for H
ealth an
d C
are Excellen
ce 20
16
5
4
(a) Multivariable logistic regression analysis adjusted for triglycerides and hypertension and metabolic syndrome, no mention of blinding. (b) 95% CI around the mean crosses 1 default MID.
Table 15: Age as a risk factor for NAFLD (adults)
Quality assessment Adjusted effects
Quality
Number
of
studies
Study design Risk of bias Inconsistency Indirectnes
s
Imprecision Other
considerations
Pooled effect with 95% CIs [if meta-analysed] or
effect and 95% CI in single study
Age (continuous) for predicting NAFLD
1 Retrospective
cohort
seriousa no serious
inconsistency
no serious
indirectness
none none adjusted OR: 0.95 (0.94, 0.97) MODERATE
Age (continuous) for predicting NAFLD
1 Prospective
cohort
low no serious
inconsistency
no serious
indirectness
none none adjusted OR: 0.99 (0.98, 1.00) HIGH
Age (dichotomous- unclear) for predicting NAFLD
1 Prospective
cohort
low no serious
inconsistency
no serious
indirectness
none none adjusted HR: 0.98 (0.97, 0.99) HIGH
Age (continuous) for predicting NAFLD
1
Prospective
cohort
(pooled
populations;
obese and
not obese)
seriousB no serious
inconsistency
no serious
indirectness
none none OR (95% CI)
1.03 (1.02-1.04)
MODERATE
(a) Multivariable logistic regression analysis adjusted for hypertension, not adjusted for ≥3 key covariates. (b) Multivariable logistic regression analysis adjusted for BMI, not adjusted for ≥3 key covariate.
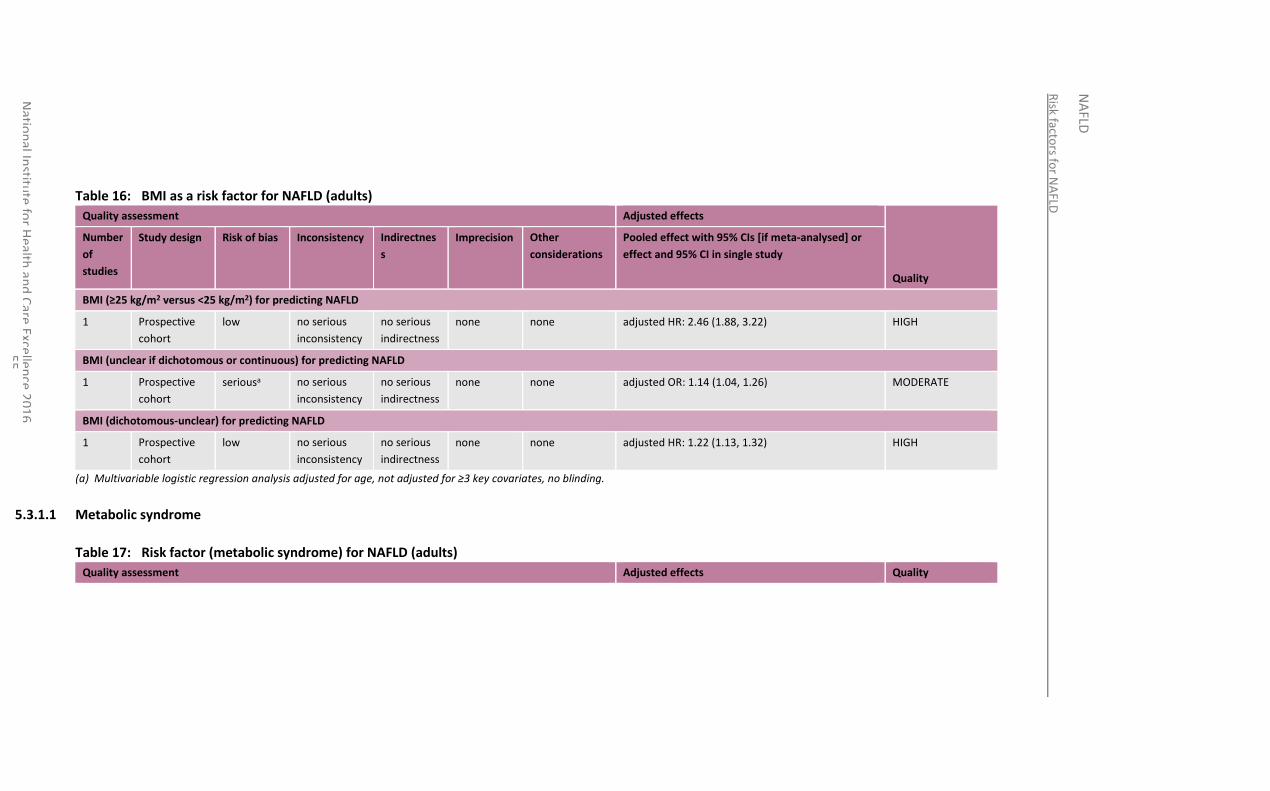
Risk facto
rs for N
AFLD
NA
FLD
Natio
nal In
stitute
for H
ealth an
d C
are Excellen
ce 20
16
5
5
Table 16: BMI as a risk factor for NAFLD (adults)
Quality assessment Adjusted effects
Quality
Number
of
studies
Study design Risk of bias Inconsistency Indirectnes
s
Imprecision Other
considerations
Pooled effect with 95% CIs [if meta-analysed] or
effect and 95% CI in single study
BMI (≥25 kg/m2 versus <25 kg/m2) for predicting NAFLD
1 Prospective
cohort
low no serious
inconsistency
no serious
indirectness
none none adjusted HR: 2.46 (1.88, 3.22) HIGH
BMI (unclear if dichotomous or continuous) for predicting NAFLD
1 Prospective
cohort
seriousa no serious
inconsistency
no serious
indirectness
none none adjusted OR: 1.14 (1.04, 1.26) MODERATE
BMI (dichotomous-unclear) for predicting NAFLD
1 Prospective
cohort
low no serious
inconsistency
no serious
indirectness
none none adjusted HR: 1.22 (1.13, 1.32) HIGH
(a) Multivariable logistic regression analysis adjusted for age, not adjusted for ≥3 key covariates, no blinding.
5.3.1.1 Metabolic syndrome
Table 17: Risk factor (metabolic syndrome) for NAFLD (adults)
Quality assessment Adjusted effects Quality
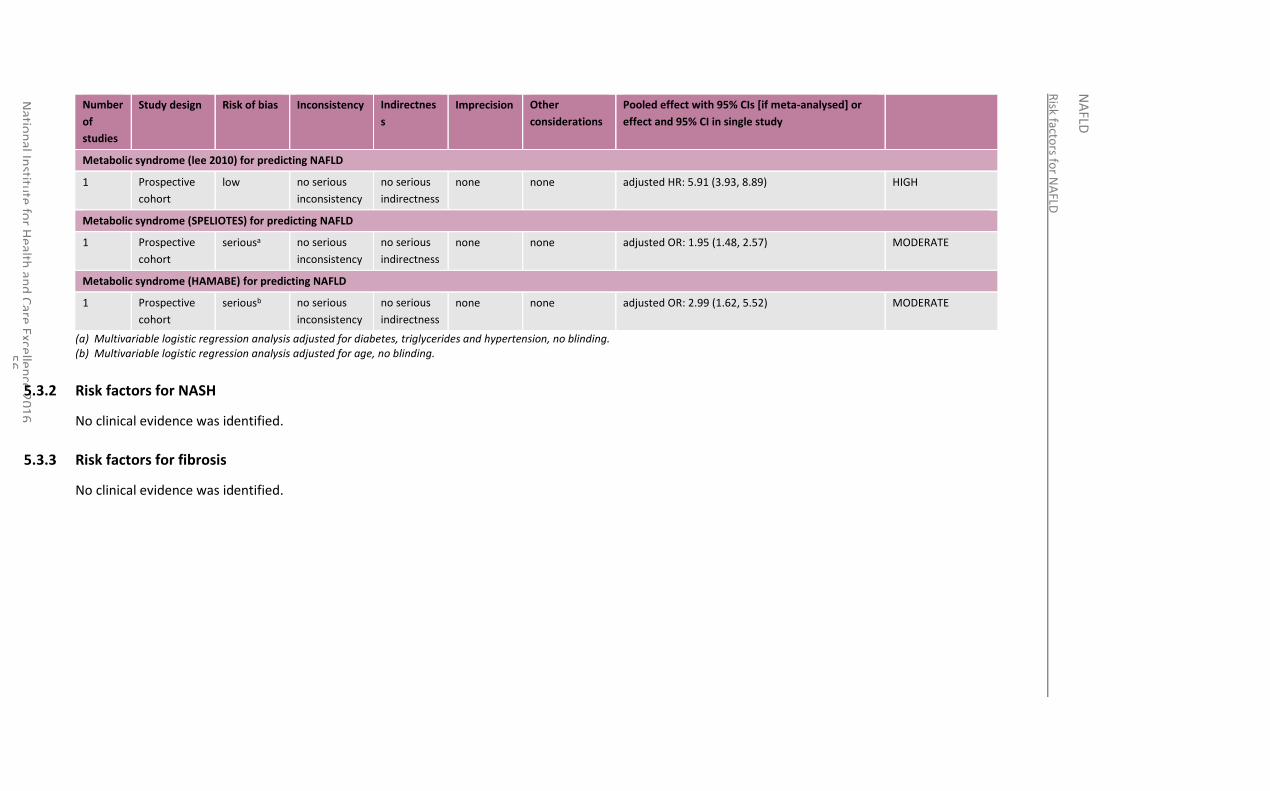
Risk facto
rs for N
AFLD
NA
FLD
Natio
nal In
stitute
for H
ealth an
d C
are Excellen
ce 20
16
5
6
Number
of
studies
Study design Risk of bias Inconsistency Indirectnes
s
Imprecision Other
considerations
Pooled effect with 95% CIs [if meta-analysed] or
effect and 95% CI in single study
Metabolic syndrome (lee 2010) for predicting NAFLD
1 Prospective
cohort
low no serious
inconsistency
no serious
indirectness
none none adjusted HR: 5.91 (3.93, 8.89) HIGH
Metabolic syndrome (SPELIOTES) for predicting NAFLD
1 Prospective
cohort
seriousa no serious
inconsistency
no serious
indirectness
none none adjusted OR: 1.95 (1.48, 2.57) MODERATE
Metabolic syndrome (HAMABE) for predicting NAFLD
1 Prospective
cohort
seriousb no serious
inconsistency
no serious
indirectness
none none adjusted OR: 2.99 (1.62, 5.52) MODERATE
(a) Multivariable logistic regression analysis adjusted for diabetes, triglycerides and hypertension, no blinding. (b) Multivariable logistic regression analysis adjusted for age, no blinding.
5.3.2 Risk factors for NASH
No clinical evidence was identified.
5.3.3 Risk factors for fibrosis
No clinical evidence was identified.
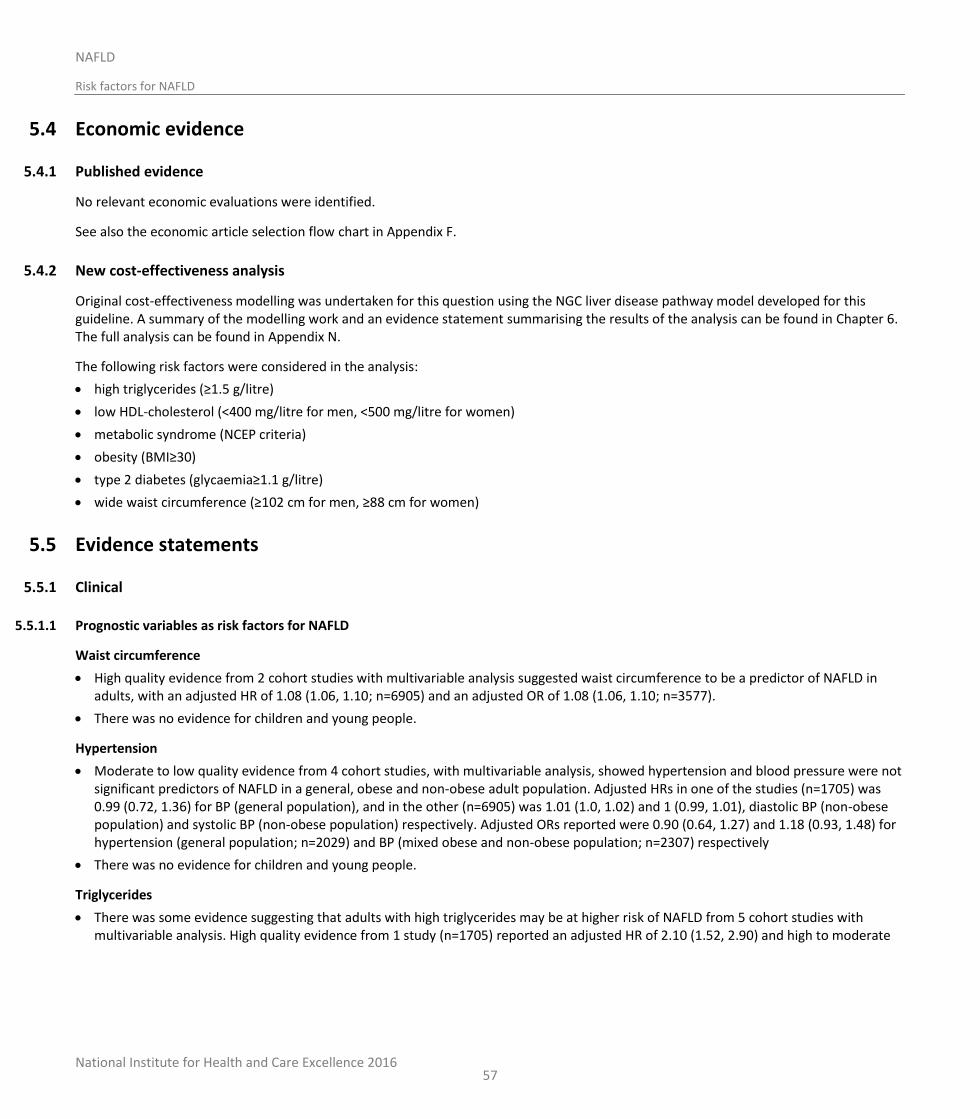
National Institute for Health and Care Excellence 2016
NAFLD
Risk factors for NAFLD
57
5.4 Economic evidence
5.4.1 Published evidence
No relevant economic evaluations were identified.
See also the economic article selection flow chart in Appendix F.
5.4.2 New cost-effectiveness analysis
Original cost-effectiveness modelling was undertaken for this question using the NGC liver disease pathway model developed for this guideline. A summary of the modelling work and an evidence statement summarising the results of the analysis can be found in Chapter 6. The full analysis can be found in Appendix N.
The following risk factors were considered in the analysis:
high triglycerides (≥1.5 g/litre)
low HDL-cholesterol (<400 mg/litre for men, <500 mg/litre for women)
metabolic syndrome (NCEP criteria)
obesity (BMI≥30)
type 2 diabetes (glycaemia≥1.1 g/litre)
wide waist circumference (≥102 cm for men, ≥88 cm for women)
5.5 Evidence statements
5.5.1 Clinical
5.5.1.1 Prognostic variables as risk factors for NAFLD
Waist circumference
High quality evidence from 2 cohort studies with multivariable analysis suggested waist circumference to be a predictor of NAFLD in adults, with an adjusted HR of 1.08 (1.06, 1.10; n=6905) and an adjusted OR of 1.08 (1.06, 1.10; n=3577).
There was no evidence for children and young people.
Hypertension
Moderate to low quality evidence from 4 cohort studies, with multivariable analysis, showed hypertension and blood pressure were not significant predictors of NAFLD in a general, obese and non-obese adult population. Adjusted HRs in one of the studies (n=1705) was 0.99 (0.72, 1.36) for BP (general population), and in the other (n=6905) was 1.01 (1.0, 1.02) and 1 (0.99, 1.01), diastolic BP (non-obese population) and systolic BP (non-obese population) respectively. Adjusted ORs reported were 0.90 (0.64, 1.27) and 1.18 (0.93, 1.48) for hypertension (general population; n=2029) and BP (mixed obese and non-obese population; n=2307) respectively
There was no evidence for children and young people.
Triglycerides
There was some evidence suggesting that adults with high triglycerides may be at higher risk of NAFLD from 5 cohort studies with multivariable analysis. High quality evidence from 1 study (n=1705) reported an adjusted HR of 2.10 (1.52, 2.90) and high to moderate
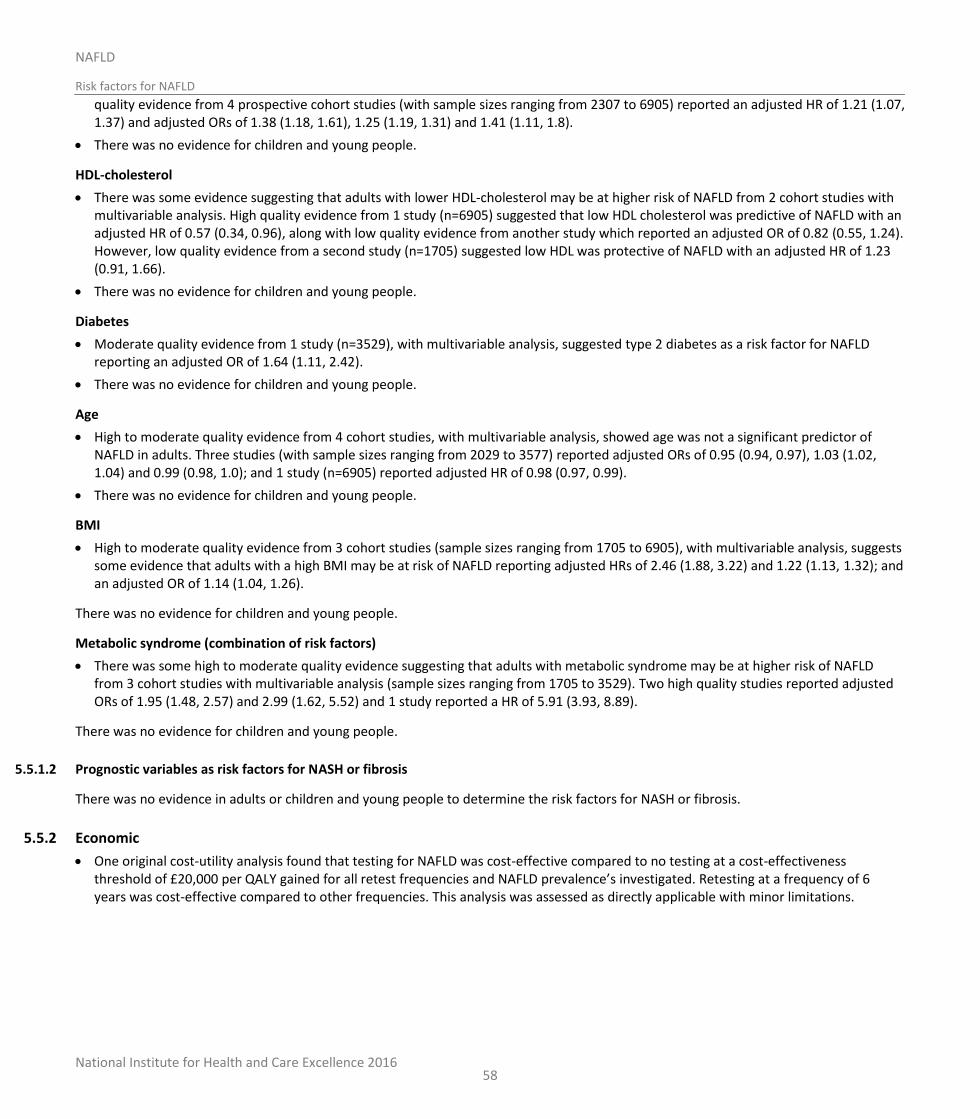
National Institute for Health and Care Excellence 2016
NAFLD
Risk factors for NAFLD
58
quality evidence from 4 prospective cohort studies (with sample sizes ranging from 2307 to 6905) reported an adjusted HR of 1.21 (1.07, 1.37) and adjusted ORs of 1.38 (1.18, 1.61), 1.25 (1.19, 1.31) and 1.41 (1.11, 1.8).
There was no evidence for children and young people.
HDL-cholesterol
There was some evidence suggesting that adults with lower HDL-cholesterol may be at higher risk of NAFLD from 2 cohort studies with multivariable analysis. High quality evidence from 1 study (n=6905) suggested that low HDL cholesterol was predictive of NAFLD with an adjusted HR of 0.57 (0.34, 0.96), along with low quality evidence from another study which reported an adjusted OR of 0.82 (0.55, 1.24). However, low quality evidence from a second study (n=1705) suggested low HDL was protective of NAFLD with an adjusted HR of 1.23 (0.91, 1.66).
There was no evidence for children and young people.
Diabetes
Moderate quality evidence from 1 study (n=3529), with multivariable analysis, suggested type 2 diabetes as a risk factor for NAFLD reporting an adjusted OR of 1.64 (1.11, 2.42).
There was no evidence for children and young people.
Age
High to moderate quality evidence from 4 cohort studies, with multivariable analysis, showed age was not a significant predictor of NAFLD in adults. Three studies (with sample sizes ranging from 2029 to 3577) reported adjusted ORs of 0.95 (0.94, 0.97), 1.03 (1.02, 1.04) and 0.99 (0.98, 1.0); and 1 study (n=6905) reported adjusted HR of 0.98 (0.97, 0.99).
There was no evidence for children and young people.
BMI
High to moderate quality evidence from 3 cohort studies (sample sizes ranging from 1705 to 6905), with multivariable analysis, suggests some evidence that adults with a high BMI may be at risk of NAFLD reporting adjusted HRs of 2.46 (1.88, 3.22) and 1.22 (1.13, 1.32); and an adjusted OR of 1.14 (1.04, 1.26).
There was no evidence for children and young people.
Metabolic syndrome (combination of risk factors)
There was some high to moderate quality evidence suggesting that adults with metabolic syndrome may be at higher risk of NAFLD from 3 cohort studies with multivariable analysis (sample sizes ranging from 1705 to 3529). Two high quality studies reported adjusted ORs of 1.95 (1.48, 2.57) and 2.99 (1.62, 5.52) and 1 study reported a HR of 5.91 (3.93, 8.89).
There was no evidence for children and young people.
5.5.1.2 Prognostic variables as risk factors for NASH or fibrosis
There was no evidence in adults or children and young people to determine the risk factors for NASH or fibrosis.
5.5.2 Economic
One original cost-utility analysis found that testing for NAFLD was cost-effective compared to no testing at a cost-effectiveness threshold of £20,000 per QALY gained for all retest frequencies and NAFLD prevalence’s investigated. Retesting at a frequency of 6 years was cost-effective compared to other frequencies. This analysis was assessed as directly applicable with minor limitations.
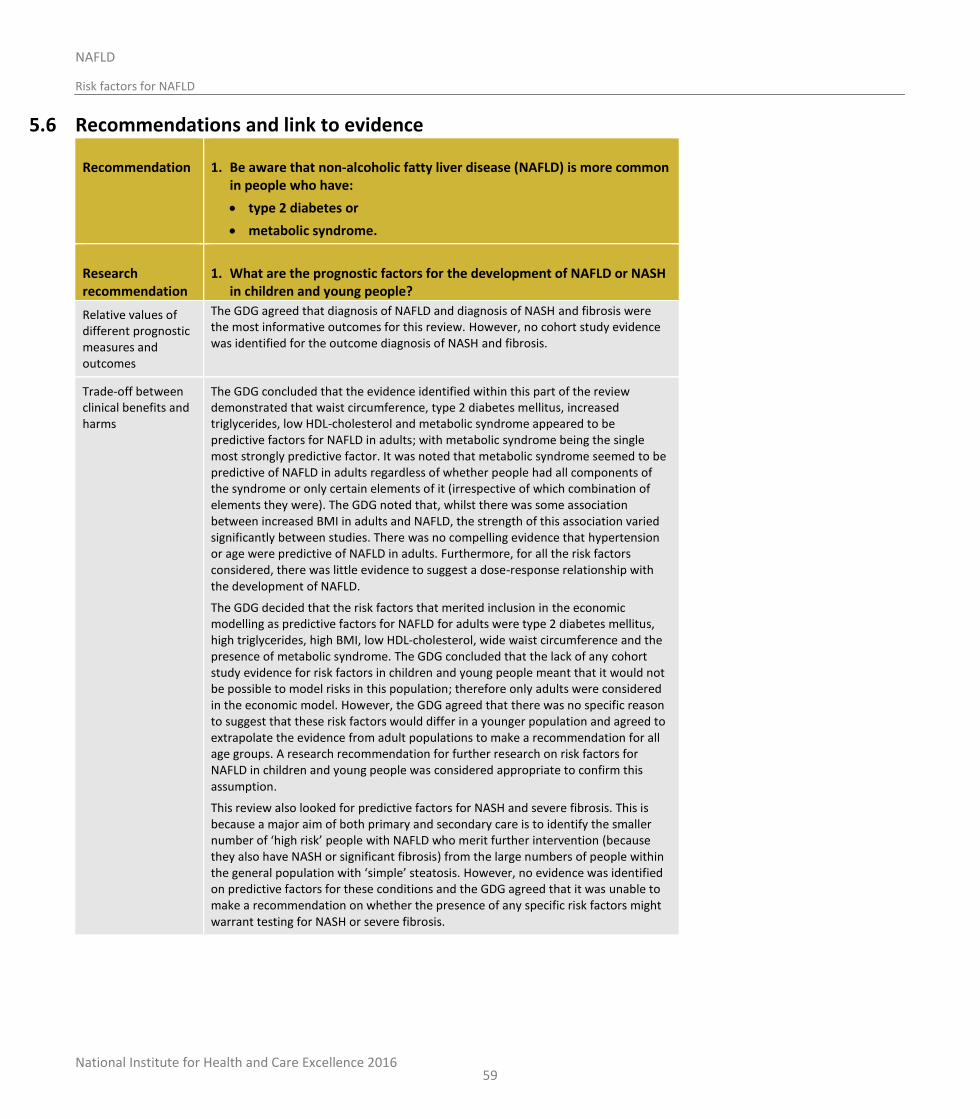
National Institute for Health and Care Excellence 2016
NAFLD
Risk factors for NAFLD
59
5.6 Recommendations and link to evidence
Recommendation 1. Be aware that non-alcoholic fatty liver disease (NAFLD) is more common in people who have:
type 2 diabetes or
metabolic syndrome.
Research recommendation
1. What are the prognostic factors for the development of NAFLD or NASH in children and young people?
Relative values of different prognostic measures and outcomes
The GDG agreed that diagnosis of NAFLD and diagnosis of NASH and fibrosis were the most informative outcomes for this review. However, no cohort study evidence was identified for the outcome diagnosis of NASH and fibrosis.
Trade-off between clinical benefits and harms
The GDG concluded that the evidence identified within this part of the review demonstrated that waist circumference, type 2 diabetes mellitus, increased triglycerides, low HDL-cholesterol and metabolic syndrome appeared to be predictive factors for NAFLD in adults; with metabolic syndrome being the single most strongly predictive factor. It was noted that metabolic syndrome seemed to be predictive of NAFLD in adults regardless of whether people had all components of the syndrome or only certain elements of it (irrespective of which combination of elements they were). The GDG noted that, whilst there was some association between increased BMI in adults and NAFLD, the strength of this association varied significantly between studies. There was no compelling evidence that hypertension or age were predictive of NAFLD in adults. Furthermore, for all the risk factors considered, there was little evidence to suggest a dose-response relationship with the development of NAFLD.
The GDG decided that the risk factors that merited inclusion in the economic modelling as predictive factors for NAFLD for adults were type 2 diabetes mellitus, high triglycerides, high BMI, low HDL-cholesterol, wide waist circumference and the presence of metabolic syndrome. The GDG concluded that the lack of any cohort study evidence for risk factors in children and young people meant that it would not be possible to model risks in this population; therefore only adults were considered in the economic model. However, the GDG agreed that there was no specific reason to suggest that these risk factors would differ in a younger population and agreed to extrapolate the evidence from adult populations to make a recommendation for all age groups. A research recommendation for further research on risk factors for NAFLD in children and young people was considered appropriate to confirm this assumption.
This review also looked for predictive factors for NASH and severe fibrosis. This is because a major aim of both primary and secondary care is to identify the smaller number of ‘high risk’ people with NAFLD who merit further intervention (because they also have NASH or significant fibrosis) from the large numbers of people within the general population with ‘simple’ steatosis. However, no evidence was identified on predictive factors for these conditions and the GDG agreed that it was unable to make a recommendation on whether the presence of any specific risk factors might warrant testing for NASH or severe fibrosis.
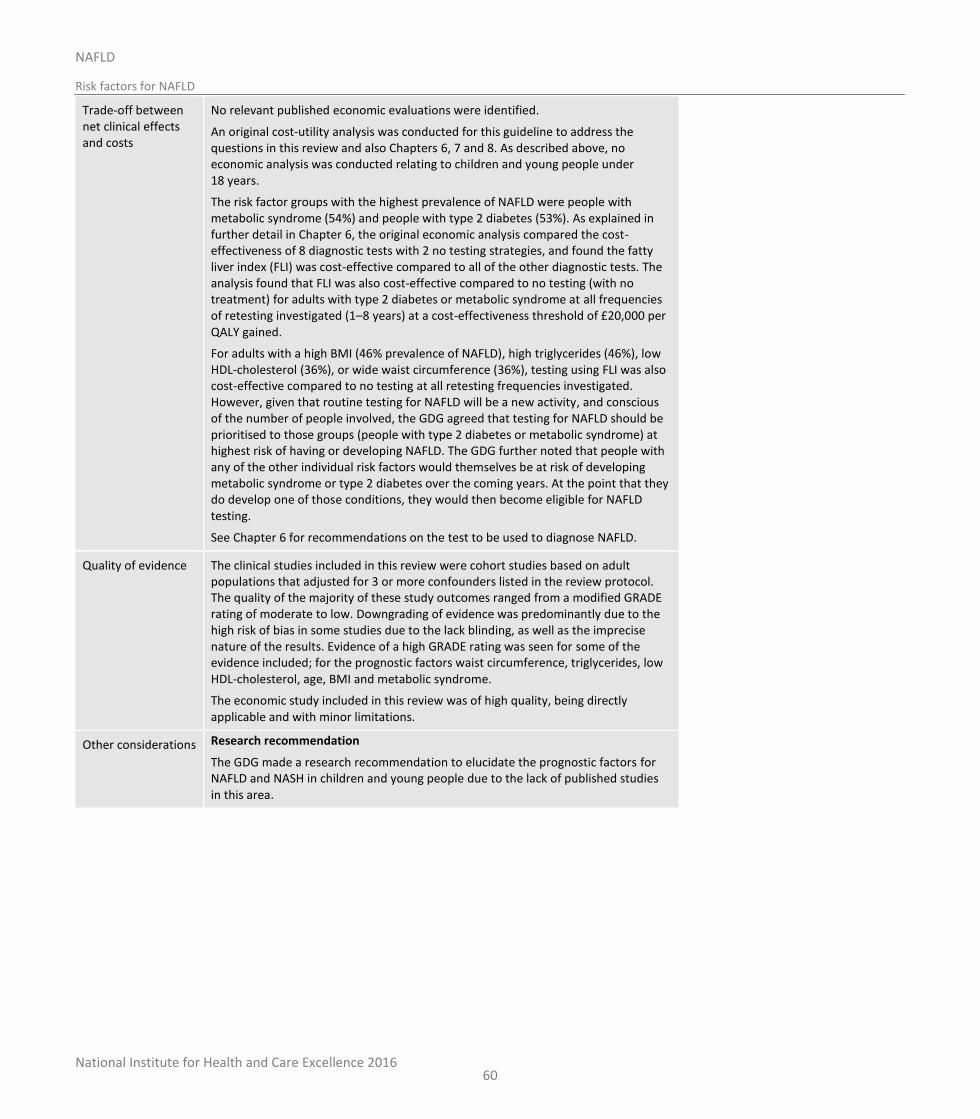
National Institute for Health and Care Excellence 2016
NAFLD
Risk factors for NAFLD
60
Trade-off between net clinical effects and costs
No relevant published economic evaluations were identified.
An original cost-utility analysis was conducted for this guideline to address the questions in this review and also Chapters 6, 7 and 8. As described above, no economic analysis was conducted relating to children and young people under 18 years.
The risk factor groups with the highest prevalence of NAFLD were people with metabolic syndrome (54%) and people with type 2 diabetes (53%). As explained in further detail in Chapter 6, the original economic analysis compared the cost-effectiveness of 8 diagnostic tests with 2 no testing strategies, and found the fatty liver index (FLI) was cost-effective compared to all of the other diagnostic tests. The analysis found that FLI was also cost-effective compared to no testing (with no treatment) for adults with type 2 diabetes or metabolic syndrome at all frequencies of retesting investigated (1–8 years) at a cost-effectiveness threshold of £20,000 per QALY gained.
For adults with a high BMI (46% prevalence of NAFLD), high triglycerides (46%), low HDL-cholesterol (36%), or wide waist circumference (36%), testing using FLI was also cost-effective compared to no testing at all retesting frequencies investigated. However, given that routine testing for NAFLD will be a new activity, and conscious of the number of people involved, the GDG agreed that testing for NAFLD should be prioritised to those groups (people with type 2 diabetes or metabolic syndrome) at highest risk of having or developing NAFLD. The GDG further noted that people with any of the other individual risk factors would themselves be at risk of developing metabolic syndrome or type 2 diabetes over the coming years. At the point that they do develop one of those conditions, they would then become eligible for NAFLD testing.
See Chapter 6 for recommendations on the test to be used to diagnose NAFLD.
Quality of evidence The clinical studies included in this review were cohort studies based on adult populations that adjusted for 3 or more confounders listed in the review protocol. The quality of the majority of these study outcomes ranged from a modified GRADE rating of moderate to low. Downgrading of evidence was predominantly due to the high risk of bias in some studies due to the lack blinding, as well as the imprecise nature of the results. Evidence of a high GRADE rating was seen for some of the evidence included; for the prognostic factors waist circumference, triglycerides, low HDL-cholesterol, age, BMI and metabolic syndrome.
The economic study included in this review was of high quality, being directly applicable and with minor limitations.
Other considerations Research recommendation
The GDG made a research recommendation to elucidate the prognostic factors for NAFLD and NASH in children and young people due to the lack of published studies in this area.
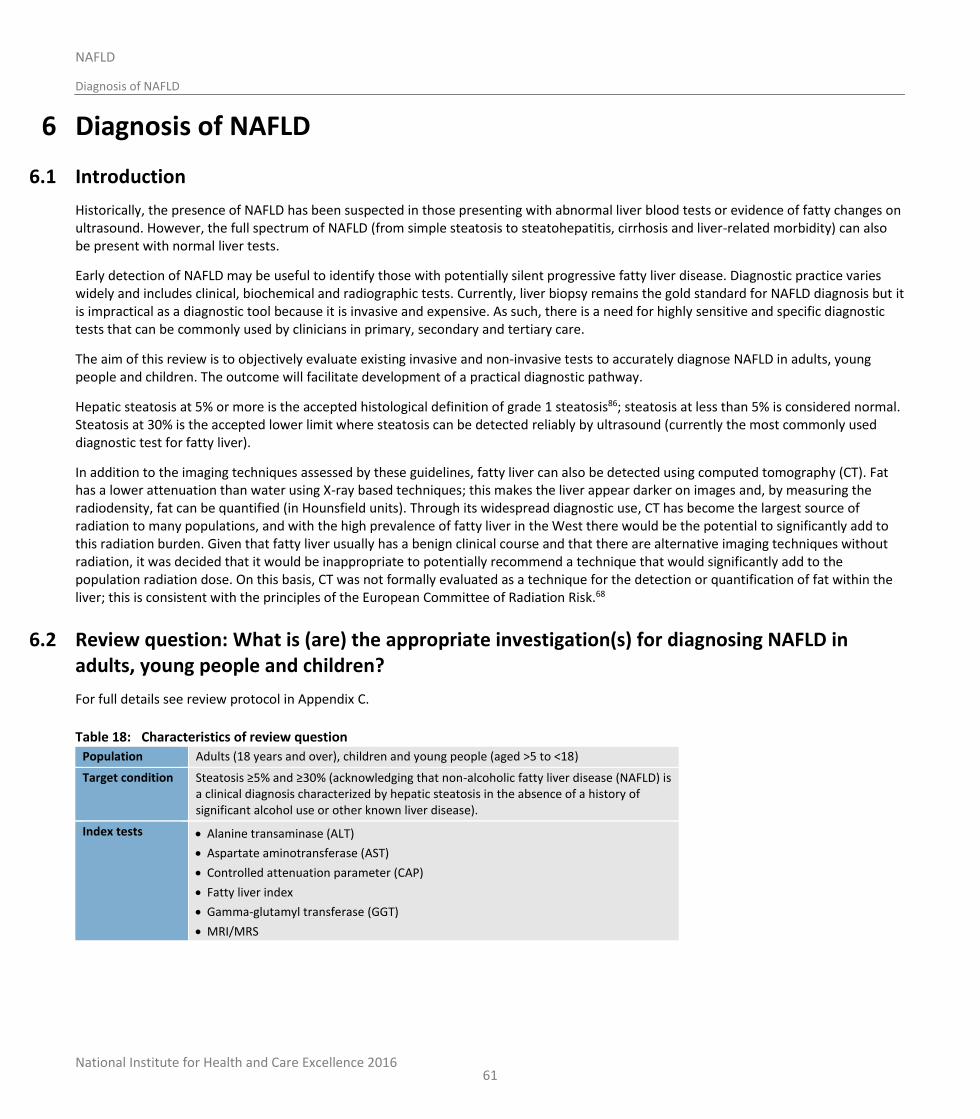
National Institute for Health and Care Excellence 2016
NAFLD
Diagnosis of NAFLD
61
6 Diagnosis of NAFLD
6.1 Introduction
Historically, the presence of NAFLD has been suspected in those presenting with abnormal liver blood tests or evidence of fatty changes on ultrasound. However, the full spectrum of NAFLD (from simple steatosis to steatohepatitis, cirrhosis and liver-related morbidity) can also be present with normal liver tests.
Early detection of NAFLD may be useful to identify those with potentially silent progressive fatty liver disease. Diagnostic practice varies widely and includes clinical, biochemical and radiographic tests. Currently, liver biopsy remains the gold standard for NAFLD diagnosis but it is impractical as a diagnostic tool because it is invasive and expensive. As such, there is a need for highly sensitive and specific diagnostic tests that can be commonly used by clinicians in primary, secondary and tertiary care.
The aim of this review is to objectively evaluate existing invasive and non-invasive tests to accurately diagnose NAFLD in adults, young people and children. The outcome will facilitate development of a practical diagnostic pathway.
Hepatic steatosis at 5% or more is the accepted histological definition of grade 1 steatosis86; steatosis at less than 5% is considered normal. Steatosis at 30% is the accepted lower limit where steatosis can be detected reliably by ultrasound (currently the most commonly used diagnostic test for fatty liver).
In addition to the imaging techniques assessed by these guidelines, fatty liver can also be detected using computed tomography (CT). Fat has a lower attenuation than water using X-ray based techniques; this makes the liver appear darker on images and, by measuring the radiodensity, fat can be quantified (in Hounsfield units). Through its widespread diagnostic use, CT has become the largest source of radiation to many populations, and with the high prevalence of fatty liver in the West there would be the potential to significantly add to this radiation burden. Given that fatty liver usually has a benign clinical course and that there are alternative imaging techniques without radiation, it was decided that it would be inappropriate to potentially recommend a technique that would significantly add to the population radiation dose. On this basis, CT was not formally evaluated as a technique for the detection or quantification of fat within the liver; this is consistent with the principles of the European Committee of Radiation Risk.68
6.2 Review question: What is (are) the appropriate investigation(s) for diagnosing NAFLD in adults, young people and children?
For full details see review protocol in Appendix C.
Table 18: Characteristics of review question
Population Adults (18 years and over), children and young people (aged >5 to <18)
Target condition Steatosis ≥5% and ≥30% (acknowledging that non-alcoholic fatty liver disease (NAFLD) is a clinical diagnosis characterized by hepatic steatosis in the absence of a history of significant alcohol use or other known liver disease).
Index tests Alanine transaminase (ALT)
Aspartate aminotransferase (AST)
Controlled attenuation parameter (CAP)
Fatty liver index
Gamma-glutamyl transferase (GGT)
MRI/MRS
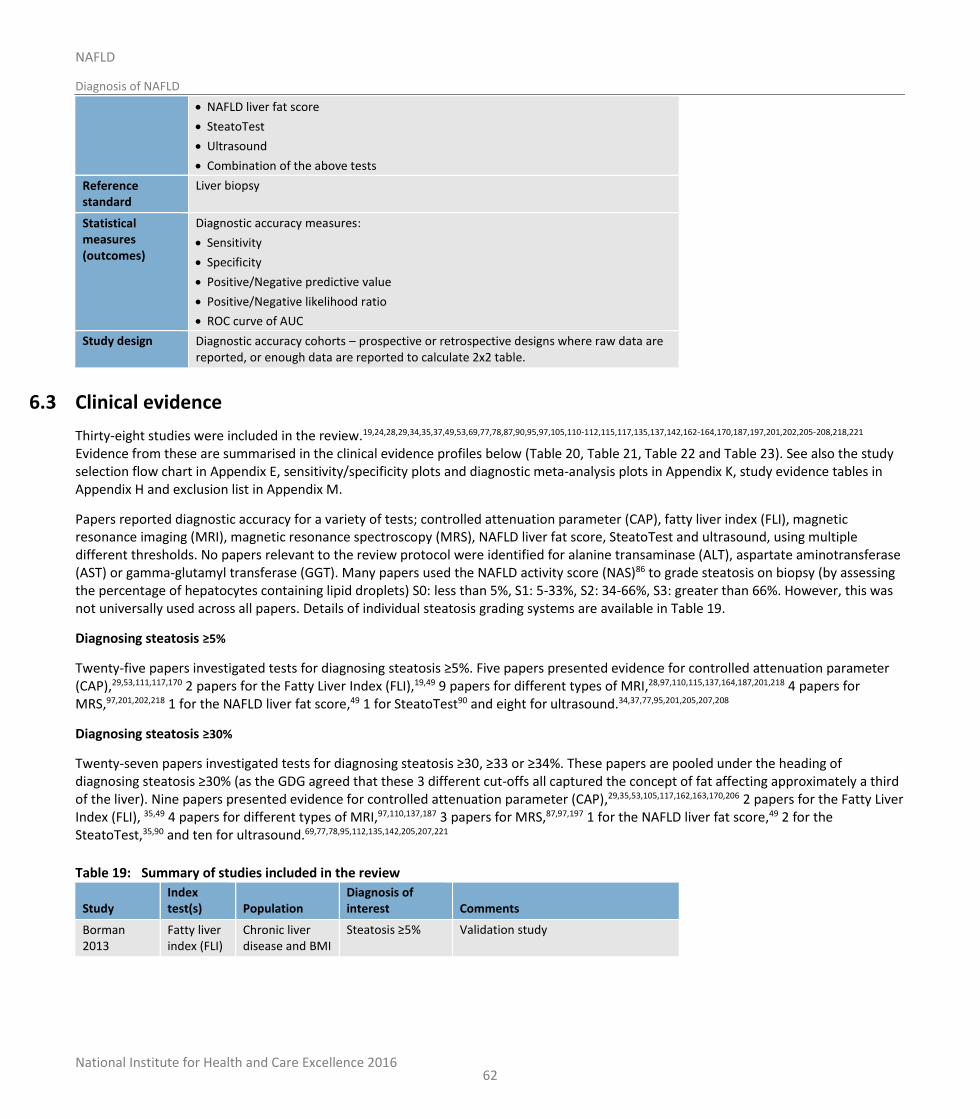
National Institute for Health and Care Excellence 2016
NAFLD
Diagnosis of NAFLD
62
NAFLD liver fat score
SteatoTest
Ultrasound
Combination of the above tests
Reference standard
Liver biopsy
Statistical measures (outcomes)
Diagnostic accuracy measures:
Sensitivity
Specificity
Positive/Negative predictive value
Positive/Negative likelihood ratio
ROC curve of AUC
Study design Diagnostic accuracy cohorts – prospective or retrospective designs where raw data are reported, or enough data are reported to calculate 2x2 table.
6.3 Clinical evidence
Thirty-eight studies were included in the review.19,24,28,29,34,35,37,49,53,69,77,78,87,90,95,97,105,110-112,115,117,135,137,142,162-164,170,187,197,201,202,205-208,218,221 Evidence from these are summarised in the clinical evidence profiles below (Table 20, Table 21, Table 22 and Table 23). See also the study selection flow chart in Appendix E, sensitivity/specificity plots and diagnostic meta-analysis plots in Appendix K, study evidence tables in Appendix H and exclusion list in Appendix M.
Papers reported diagnostic accuracy for a variety of tests; controlled attenuation parameter (CAP), fatty liver index (FLI), magnetic resonance imaging (MRI), magnetic resonance spectroscopy (MRS), NAFLD liver fat score, SteatoTest and ultrasound, using multiple different thresholds. No papers relevant to the review protocol were identified for alanine transaminase (ALT), aspartate aminotransferase (AST) or gamma-glutamyl transferase (GGT). Many papers used the NAFLD activity score (NAS)86 to grade steatosis on biopsy (by assessing the percentage of hepatocytes containing lipid droplets) S0: less than 5%, S1: 5-33%, S2: 34-66%, S3: greater than 66%. However, this was not universally used across all papers. Details of individual steatosis grading systems are available in Table 19.
Diagnosing steatosis ≥5%
Twenty-five papers investigated tests for diagnosing steatosis ≥5%. Five papers presented evidence for controlled attenuation parameter (CAP),29,53,111,117,170 2 papers for the Fatty Liver Index (FLI),19,49 9 papers for different types of MRI,28,97,110,115,137,164,187,201,218 4 papers for MRS,97,201,202,218 1 for the NAFLD liver fat score,49 1 for SteatoTest90 and eight for ultrasound.34,37,77,95,201,205,207,208
Diagnosing steatosis ≥30%
Twenty-seven papers investigated tests for diagnosing steatosis ≥30, ≥33 or ≥34%. These papers are pooled under the heading of diagnosing steatosis ≥30% (as the GDG agreed that these 3 different cut-offs all captured the concept of fat affecting approximately a third of the liver). Nine papers presented evidence for controlled attenuation parameter (CAP),29,35,53,105,117,162,163,170,206 2 papers for the Fatty Liver Index (FLI), 35,49 4 papers for different types of MRI,97,110,137,187 3 papers for MRS,87,97,197 1 for the NAFLD liver fat score,49 2 for the SteatoTest,35,90 and ten for ultrasound.69,77,78,95,112,135,142,205,207,221
Table 19: Summary of studies included in the review
Study Index test(s) Population
Diagnosis of interest Comments
Borman 2013
Fatty liver index (FLI)
Chronic liver disease and BMI
Steatosis ≥5% Validation study
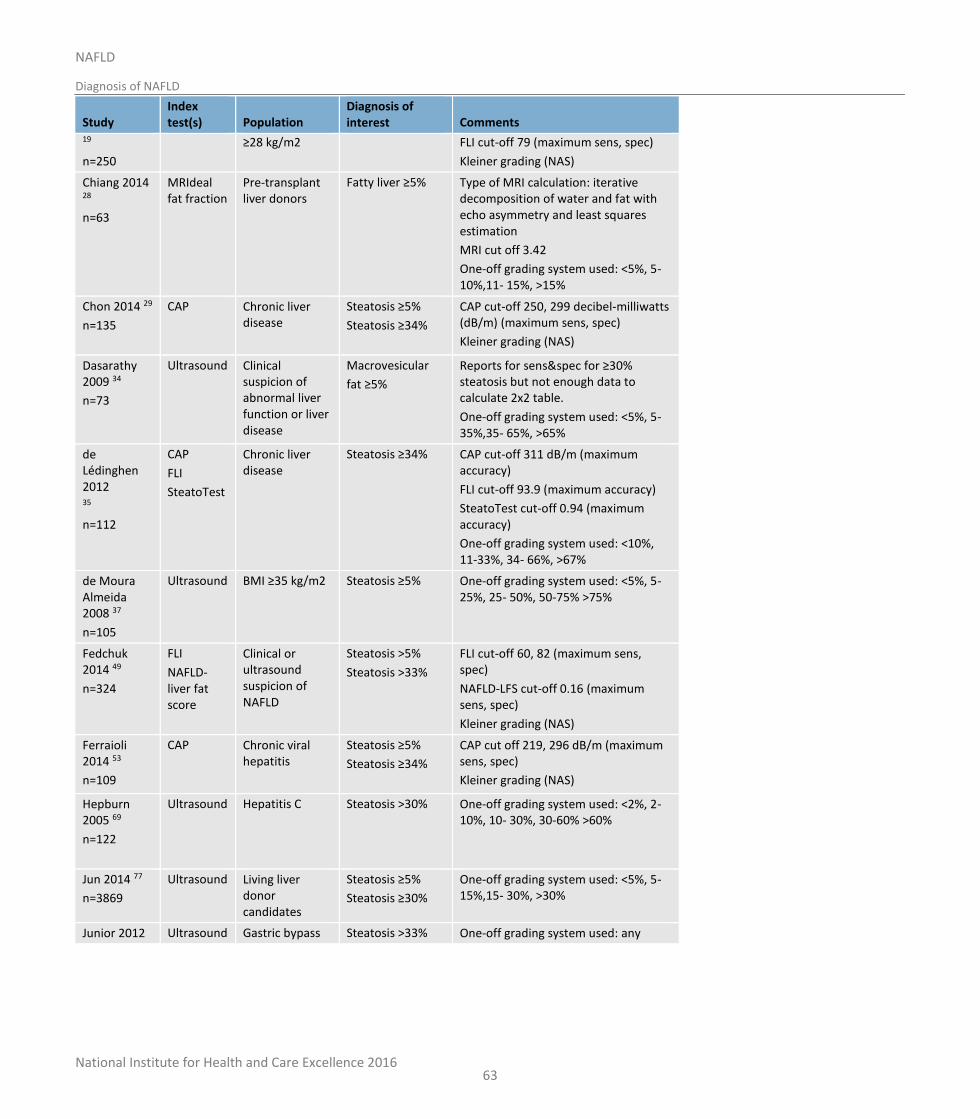
National Institute for Health and Care Excellence 2016
NAFLD
Diagnosis of NAFLD
63
Study Index test(s) Population
Diagnosis of interest Comments
19
n=250
≥28 kg/m2
FLI cut-off 79 (maximum sens, spec)
Kleiner grading (NAS)
Chiang 2014 28
n=63
MRIdeal fat fraction
Pre-transplant liver donors
Fatty liver ≥5% Type of MRI calculation: iterative decomposition of water and fat with echo asymmetry and least squares estimation
MRI cut off 3.42
One-off grading system used: <5%, 5-10%,11- 15%, >15%
Chon 2014 29
n=135
CAP
Chronic liver disease
Steatosis ≥5%
Steatosis ≥34%
CAP cut-off 250, 299 decibel-milliwatts (dB/m) (maximum sens, spec)
Kleiner grading (NAS)
Dasarathy 2009 34
n=73
Ultrasound Clinical suspicion of abnormal liver function or liver disease
Macrovesicular
fat ≥5%
Reports for sens&spec for ≥30% steatosis but not enough data to calculate 2x2 table.
One-off grading system used: <5%, 5-35%,35- 65%, >65%
de Lédinghen 2012 35
n=112
CAP
FLI
SteatoTest
Chronic liver disease
Steatosis ≥34%
CAP cut-off 311 dB/m (maximum accuracy)
FLI cut-off 93.9 (maximum accuracy)
SteatoTest cut-off 0.94 (maximum accuracy)
One-off grading system used: <10%, 11-33%, 34- 66%, >67%
de Moura Almeida 2008 37
n=105
Ultrasound BMI ≥35 kg/m2 Steatosis ≥5% One-off grading system used: <5%, 5-25%, 25- 50%, 50-75% >75%
Fedchuk 2014 49
n=324
FLI
NAFLD-liver fat score
Clinical or ultrasound suspicion of NAFLD
Steatosis >5%
Steatosis >33%
FLI cut-off 60, 82 (maximum sens, spec)
NAFLD-LFS cut-off 0.16 (maximum sens, spec)
Kleiner grading (NAS)
Ferraioli 2014 53
n=109
CAP Chronic viral hepatitis
Steatosis ≥5%
Steatosis ≥34%
CAP cut off 219, 296 dB/m (maximum sens, spec)
Kleiner grading (NAS)
Hepburn 2005 69
n=122
Ultrasound Hepatitis C Steatosis >30% One-off grading system used: <2%, 2-10%, 10- 30%, 30-60% >60%
Jun 2014 77
n=3869
Ultrasound Living liver donor candidates
Steatosis ≥5%
Steatosis ≥30%
One-off grading system used: <5%, 5-15%,15- 30%, >30%
Junior 2012 Ultrasound Gastric bypass Steatosis >33% One-off grading system used: any
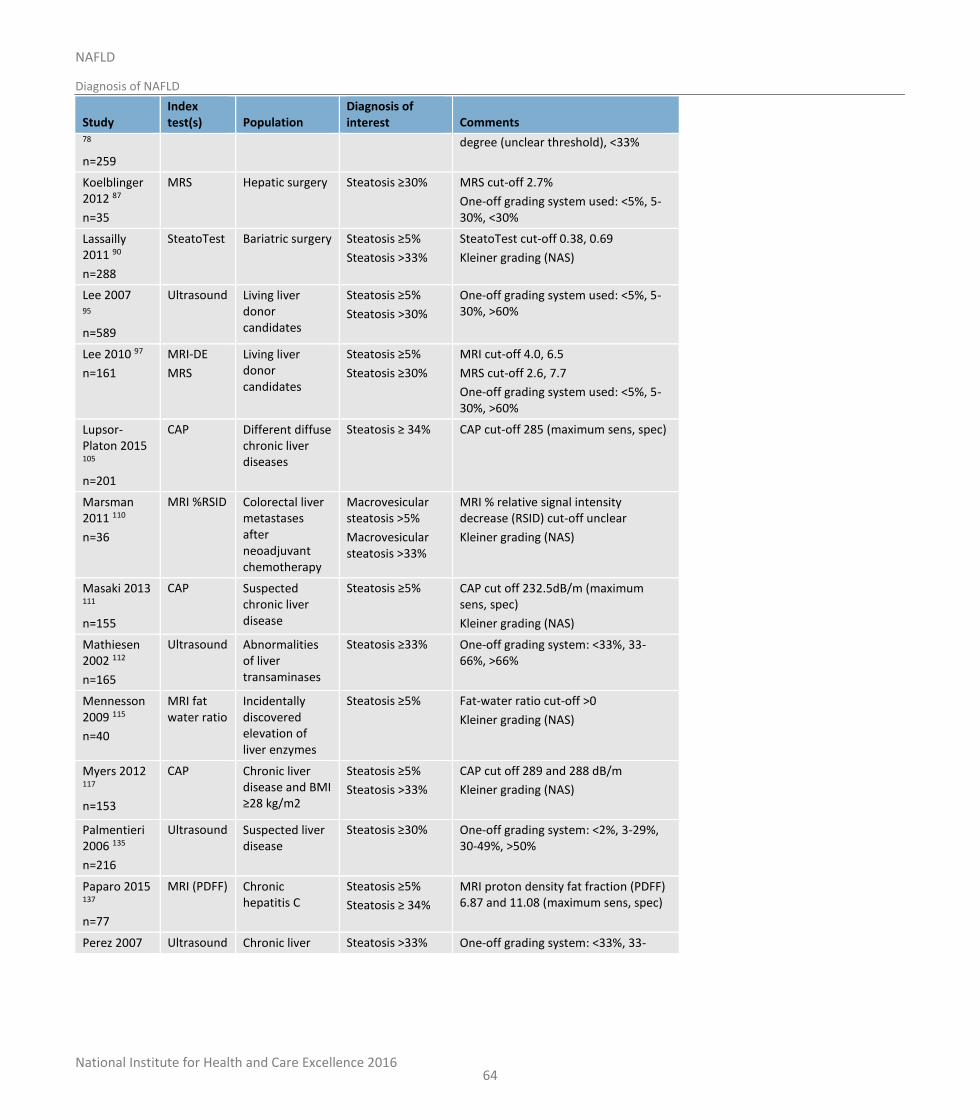
National Institute for Health and Care Excellence 2016
NAFLD
Diagnosis of NAFLD
64
Study Index test(s) Population
Diagnosis of interest Comments
78
n=259
degree (unclear threshold), <33%
Koelblinger 2012 87
n=35
MRS Hepatic surgery Steatosis ≥30%
MRS cut-off 2.7%
One-off grading system used: <5%, 5-30%, <30%
Lassailly 2011 90
n=288
SteatoTest Bariatric surgery Steatosis ≥5%
Steatosis >33%
SteatoTest cut-off 0.38, 0.69
Kleiner grading (NAS)
Lee 2007 95
n=589
Ultrasound Living liver donor candidates
Steatosis ≥5%
Steatosis >30%
One-off grading system used: <5%, 5-30%, >60%
Lee 2010 97
n=161
MRI-DE
MRS
Living liver donor candidates
Steatosis ≥5%
Steatosis ≥30%
MRI cut-off 4.0, 6.5
MRS cut-off 2.6, 7.7
One-off grading system used: <5%, 5-30%, >60%
Lupsor-Platon 2015 105
n=201
CAP Different diffuse chronic liver diseases
Steatosis ≥ 34% CAP cut-off 285 (maximum sens, spec)
Marsman 2011 110
n=36
MRI %RSID Colorectal liver metastases after neoadjuvant chemotherapy
Macrovesicular steatosis >5%
Macrovesicular steatosis >33%
MRI % relative signal intensity decrease (RSID) cut-off unclear
Kleiner grading (NAS)
Masaki 2013 111
n=155
CAP Suspected chronic liver disease
Steatosis ≥5%
CAP cut off 232.5dB/m (maximum sens, spec)
Kleiner grading (NAS)
Mathiesen 2002 112
n=165
Ultrasound Abnormalities of liver transaminases
Steatosis ≥33%
One-off grading system: <33%, 33-66%, >66%
Mennesson 2009 115
n=40
MRI fat water ratio
Incidentally discovered elevation of liver enzymes
Steatosis ≥5%
Fat-water ratio cut-off >0
Kleiner grading (NAS)
Myers 2012 117
n=153
CAP Chronic liver disease and BMI ≥28 kg/m2
Steatosis ≥5%
Steatosis >33%
CAP cut off 289 and 288 dB/m
Kleiner grading (NAS)
Palmentieri 2006 135
n=216
Ultrasound Suspected liver disease
Steatosis ≥30%
One-off grading system: <2%, 3-29%, 30-49%, >50%
Paparo 2015 137
n=77
MRI (PDFF) Chronic hepatitis C
Steatosis ≥5%
Steatosis ≥ 34%
MRI proton density fat fraction (PDFF) 6.87 and 11.08 (maximum sens, spec)
Perez 2007 Ultrasound Chronic liver Steatosis >33% One-off grading system: <33%, 33-
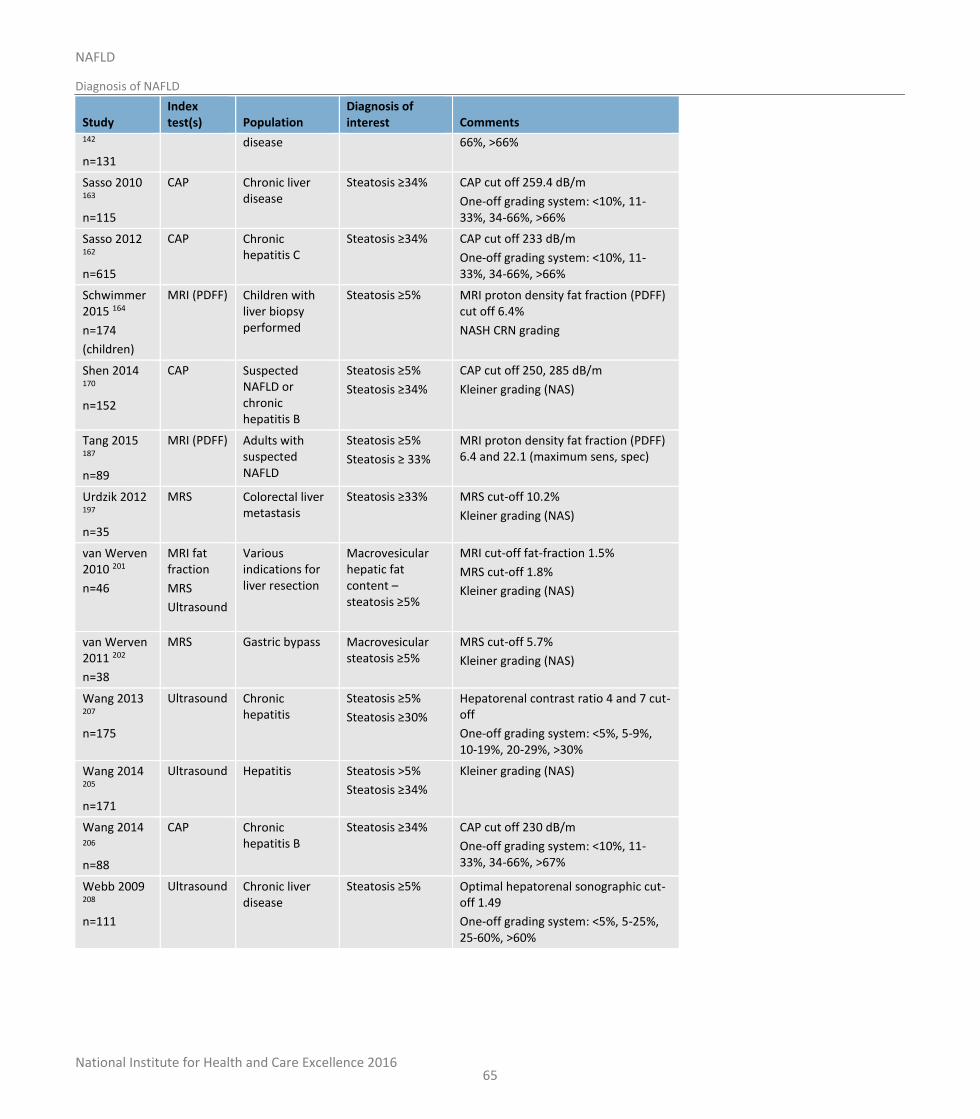
National Institute for Health and Care Excellence 2016
NAFLD
Diagnosis of NAFLD
65
Study Index test(s) Population
Diagnosis of interest Comments
142
n=131
disease 66%, >66%
Sasso 2010 163
n=115
CAP Chronic liver disease
Steatosis ≥34%
CAP cut off 259.4 dB/m
One-off grading system: <10%, 11-33%, 34-66%, >66%
Sasso 2012 162
n=615
CAP Chronic hepatitis C
Steatosis ≥34%
CAP cut off 233 dB/m
One-off grading system: <10%, 11-33%, 34-66%, >66%
Schwimmer 2015 164
n=174
(children)
MRI (PDFF) Children with liver biopsy performed
Steatosis ≥5% MRI proton density fat fraction (PDFF) cut off 6.4%
NASH CRN grading
Shen 2014 170
n=152
CAP Suspected NAFLD or chronic hepatitis B
Steatosis ≥5%
Steatosis ≥34%
CAP cut off 250, 285 dB/m
Kleiner grading (NAS)
Tang 2015 187
n=89
MRI (PDFF) Adults with suspected NAFLD
Steatosis ≥5%
Steatosis ≥ 33%
MRI proton density fat fraction (PDFF) 6.4 and 22.1 (maximum sens, spec)
Urdzik 2012 197
n=35
MRS Colorectal liver metastasis
Steatosis ≥33% MRS cut-off 10.2%
Kleiner grading (NAS)
van Werven 2010 201
n=46
MRI fat fraction
MRS
Ultrasound
Various indications for liver resection
Macrovesicular hepatic fat content – steatosis ≥5%
MRI cut-off fat-fraction 1.5%
MRS cut-off 1.8%
Kleiner grading (NAS)
van Werven 2011 202
n=38
MRS Gastric bypass Macrovesicular steatosis ≥5%
MRS cut-off 5.7%
Kleiner grading (NAS)
Wang 2013 207
n=175
Ultrasound Chronic hepatitis
Steatosis ≥5%
Steatosis ≥30%
Hepatorenal contrast ratio 4 and 7 cut-off
One-off grading system: <5%, 5-9%, 10-19%, 20-29%, >30%
Wang 2014 205
n=171
Ultrasound Hepatitis Steatosis >5%
Steatosis ≥34%
Kleiner grading (NAS)
Wang 2014 206
n=88
CAP Chronic hepatitis B
Steatosis ≥34%
CAP cut off 230 dB/m
One-off grading system: <10%, 11-33%, 34-66%, >67%
Webb 2009 208
n=111
Ultrasound Chronic liver disease
Steatosis ≥5%
Optimal hepatorenal sonographic cut-off 1.49
One-off grading system: <5%, 5-25%, 25-60%, >60%
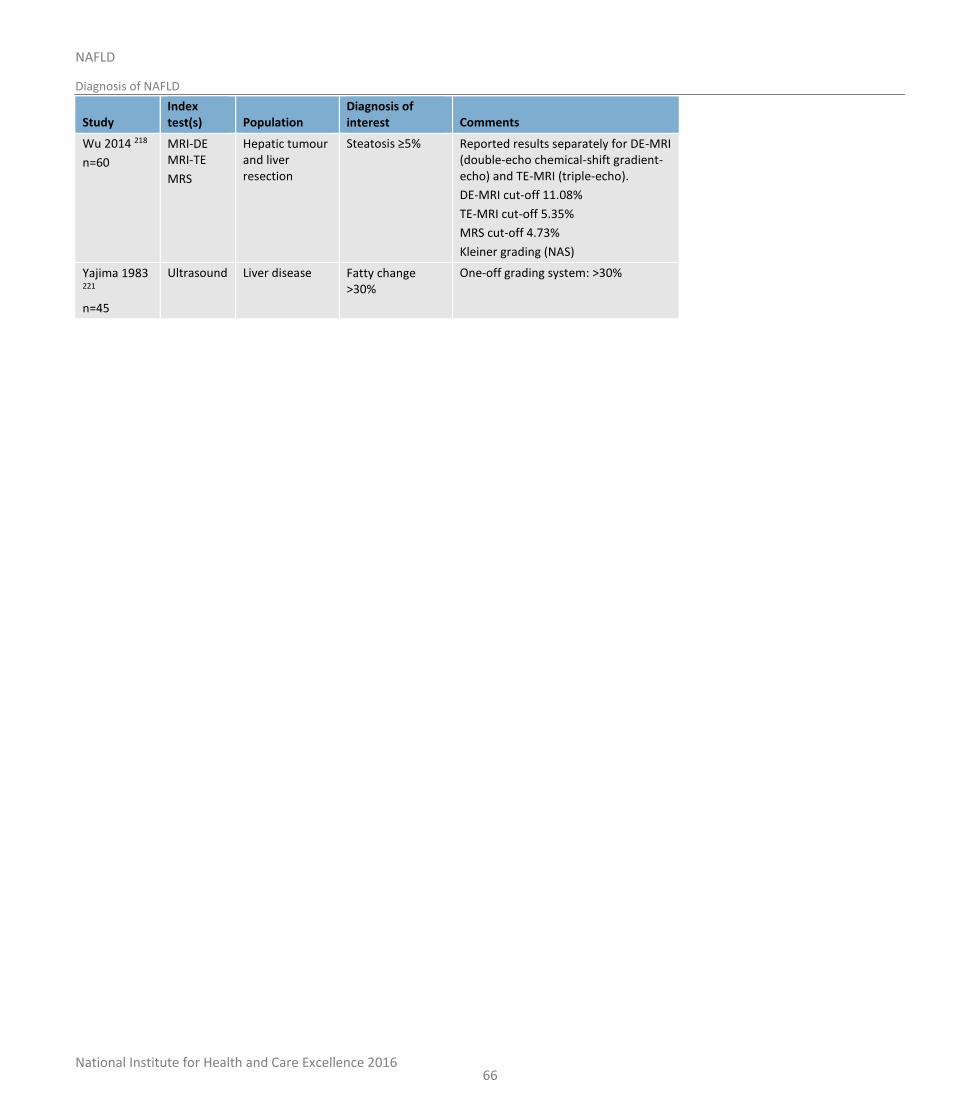
National Institute for Health and Care Excellence 2016
NAFLD
Diagnosis of NAFLD
66
Study Index test(s) Population
Diagnosis of interest Comments
Wu 2014 218
n=60
MRI-DE MRI-TE
MRS
Hepatic tumour and liver resection
Steatosis ≥5%
Reported results separately for DE-MRI (double-echo chemical-shift gradient-echo) and TE-MRI (triple-echo).
DE-MRI cut-off 11.08%
TE-MRI cut-off 5.35%
MRS cut-off 4.73%
Kleiner grading (NAS)
Yajima 1983 221
n=45
Ultrasound Liver disease Fatty change >30%
One-off grading system: >30%
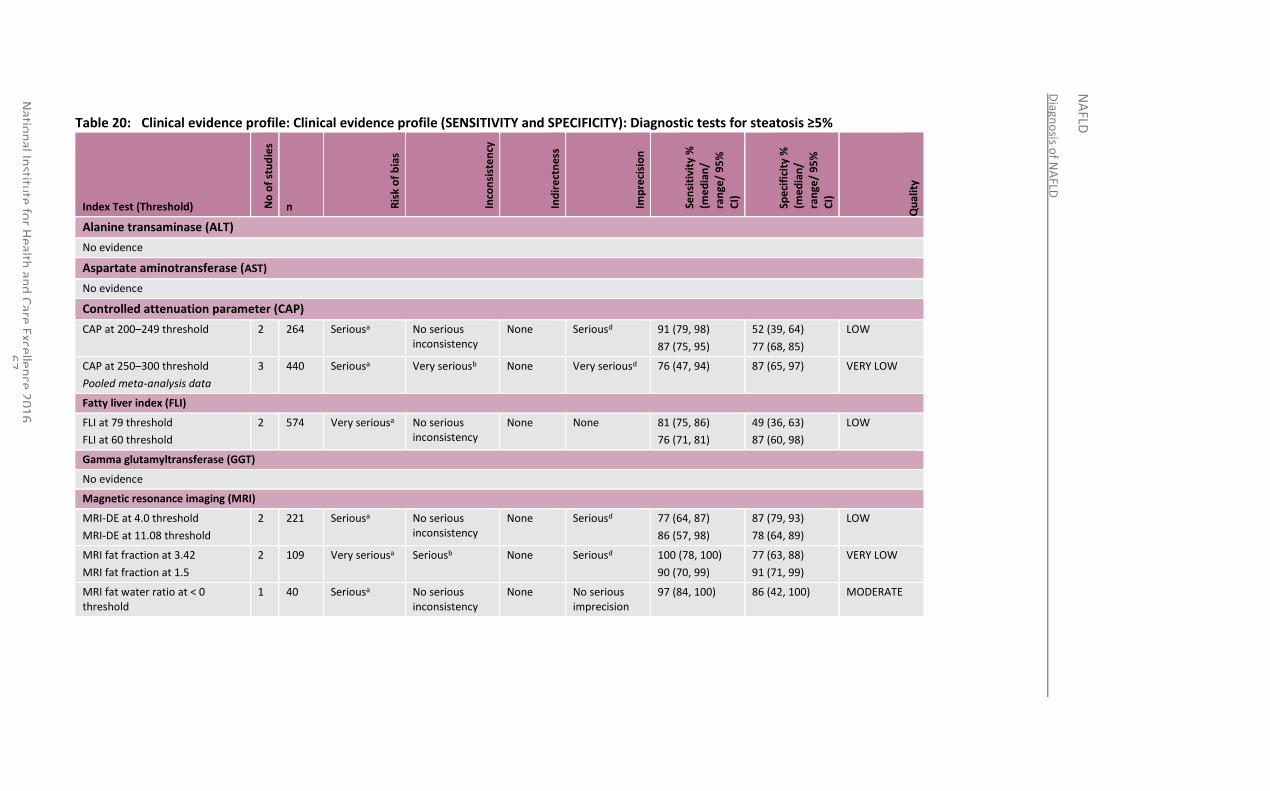
Diagn
osis o
f NA
FLD
NA
FLD
Natio
nal In
stitute
for H
ealth an
d C
are Excellen
ce 20
16
6
7
Table 20: Clinical evidence profile: Clinical evidence profile (SENSITIVITY and SPECIFICITY): Diagnostic tests for steatosis ≥5%
Index Test (Threshold) No
of
stu
die
s
n Ris
k o
f b
ias
Inco
nsi
ste
ncy
Ind
ire
ctn
ess
Imp
reci
sio
n
Sen
siti
vity
%
(me
dia
n/
ran
ge/
95
%
CI)
Spe
cifi
city
%
(me
dia
n/
ran
ge/
95
%
CI)
Qu
alit
y
Alanine transaminase (ALT)
No evidence
Aspartate aminotransferase (AST)
No evidence
Controlled attenuation parameter (CAP)
CAP at 200–249 threshold 2 264 Seriousa No serious inconsistency
None Seriousd 91 (79, 98)
87 (75, 95)
52 (39, 64)
77 (68, 85)
LOW
CAP at 250–300 threshold
Pooled meta-analysis data
3 440 Seriousa Very seriousb None Very seriousd 76 (47, 94) 87 (65, 97) VERY LOW
Fatty liver index (FLI)
FLI at 79 threshold
FLI at 60 threshold
2 574 Very seriousa No serious inconsistency
None None 81 (75, 86)
76 (71, 81)
49 (36, 63)
87 (60, 98)
LOW
Gamma glutamyltransferase (GGT)
No evidence
Magnetic resonance imaging (MRI)
MRI-DE at 4.0 threshold
MRI-DE at 11.08 threshold
2 221 Seriousa No serious inconsistency
None Seriousd 77 (64, 87)
86 (57, 98)
87 (79, 93)
78 (64, 89)
LOW
MRI fat fraction at 3.42
MRI fat fraction at 1.5
2 109 Very seriousa Seriousb None Seriousd 100 (78, 100)
90 (70, 99)
77 (63, 88)
91 (71, 99)
VERY LOW
MRI fat water ratio at < 0 threshold
1 40 Seriousa No serious inconsistency
None No serious imprecision
97 (84, 100) 86 (42, 100) MODERATE
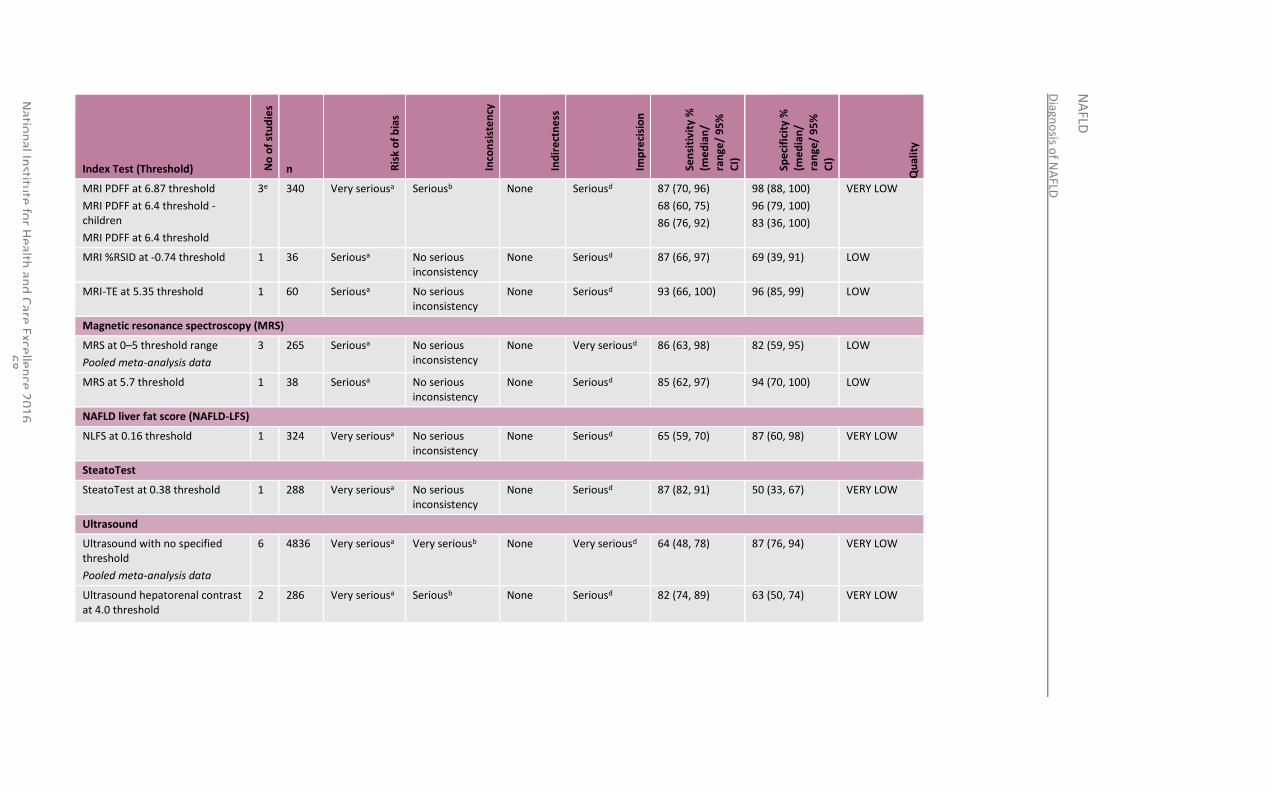
Diagn
osis o
f NA
FLD
NA
FLD
Natio
nal In
stitute
for H
ealth an
d C
are Excellen
ce 20
16
6
8
Index Test (Threshold) No
of
stu
die
s
n Ris
k o
f b
ias
Inco
nsi
ste
ncy
Ind
ire
ctn
ess
Imp
reci
sio
n
Sen
siti
vity
%
(me
dia
n/
ran
ge/
95
%
CI)
Spe
cifi
city
%
(me
dia
n/
ran
ge/
95
%
CI)
Qu
alit
y
MRI PDFF at 6.87 threshold
MRI PDFF at 6.4 threshold -children
MRI PDFF at 6.4 threshold
3e 340 Very seriousa Seriousb None Seriousd 87 (70, 96)
68 (60, 75)
86 (76, 92)
98 (88, 100)
96 (79, 100)
83 (36, 100)
VERY LOW
MRI %RSID at -0.74 threshold 1 36 Seriousa No serious inconsistency
None Seriousd 87 (66, 97) 69 (39, 91) LOW
MRI-TE at 5.35 threshold 1 60 Seriousa No serious inconsistency
None Seriousd 93 (66, 100) 96 (85, 99) LOW
Magnetic resonance spectroscopy (MRS)
MRS at 0–5 threshold range
Pooled meta-analysis data
3 265 Seriousa No serious inconsistency
None Very seriousd 86 (63, 98) 82 (59, 95) LOW
MRS at 5.7 threshold 1 38 Seriousa No serious inconsistency
None Seriousd 85 (62, 97) 94 (70, 100) LOW
NAFLD liver fat score (NAFLD-LFS)
NLFS at 0.16 threshold 1 324 Very seriousa No serious inconsistency
None Seriousd 65 (59, 70) 87 (60, 98) VERY LOW
SteatoTest
SteatoTest at 0.38 threshold 1 288 Very seriousa No serious inconsistency
None Seriousd 87 (82, 91) 50 (33, 67) VERY LOW
Ultrasound
Ultrasound with no specified threshold
Pooled meta-analysis data
6 4836 Very seriousa Very seriousb None Very seriousd 64 (48, 78) 87 (76, 94) VERY LOW
Ultrasound hepatorenal contrast at 4.0 threshold
2 286 Very seriousa Seriousb None Seriousd 82 (74, 89)
63 (50, 74)
VERY LOW
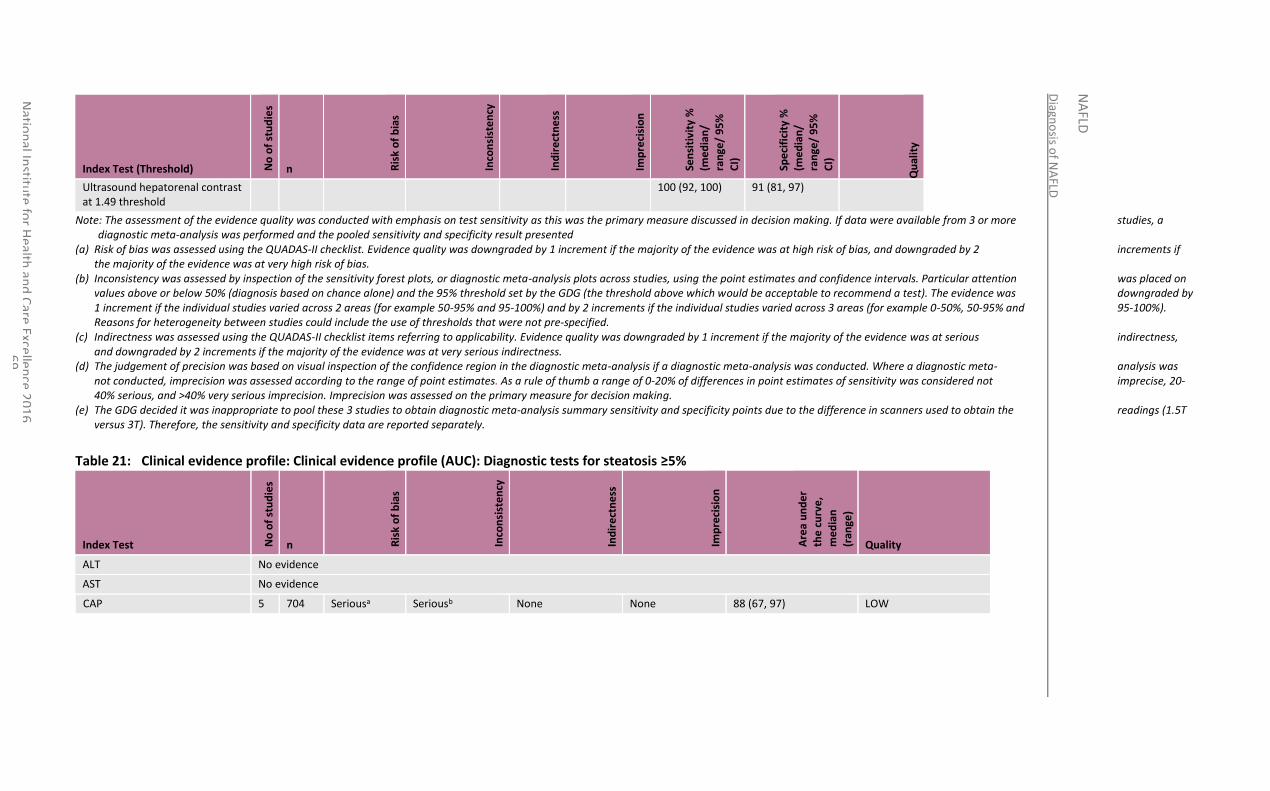
Diagn
osis o
f NA
FLD
NA
FLD
Natio
nal In
stitute
for H
ealth an
d C
are Excellen
ce 20
16
6
9
Index Test (Threshold) No
of
stu
die
s
n Ris
k o
f b
ias
Inco
nsi
ste
ncy
Ind
ire
ctn
ess
Imp
reci
sio
n
Sen
siti
vity
%
(me
dia
n/
ran
ge/
95
%
CI)
Spe
cifi
city
%
(me
dia
n/
ran
ge/
95
%
CI)
Qu
alit
y
Ultrasound hepatorenal contrast at 1.49 threshold
100 (92, 100) 91 (81, 97)
Note: The assessment of the evidence quality was conducted with emphasis on test sensitivity as this was the primary measure discussed in decision making. If data were available from 3 or more studies, a diagnostic meta-analysis was performed and the pooled sensitivity and specificity result presented
(a) Risk of bias was assessed using the QUADAS-II checklist. Evidence quality was downgraded by 1 increment if the majority of the evidence was at high risk of bias, and downgraded by 2 increments if the majority of the evidence was at very high risk of bias.
(b) Inconsistency was assessed by inspection of the sensitivity forest plots, or diagnostic meta-analysis plots across studies, using the point estimates and confidence intervals. Particular attention was placed on values above or below 50% (diagnosis based on chance alone) and the 95% threshold set by the GDG (the threshold above which would be acceptable to recommend a test). The evidence was downgraded by 1 increment if the individual studies varied across 2 areas (for example 50-95% and 95-100%) and by 2 increments if the individual studies varied across 3 areas (for example 0-50%, 50-95% and 95-100%). Reasons for heterogeneity between studies could include the use of thresholds that were not pre-specified.
(c) Indirectness was assessed using the QUADAS-II checklist items referring to applicability. Evidence quality was downgraded by 1 increment if the majority of the evidence was at serious indirectness, and downgraded by 2 increments if the majority of the evidence was at very serious indirectness.
(d) The judgement of precision was based on visual inspection of the confidence region in the diagnostic meta-analysis if a diagnostic meta-analysis was conducted. Where a diagnostic meta- analysis was not conducted, imprecision was assessed according to the range of point estimates. As a rule of thumb a range of 0-20% of differences in point estimates of sensitivity was considered not imprecise, 20-40% serious, and >40% very serious imprecision. Imprecision was assessed on the primary measure for decision making.
(e) The GDG decided it was inappropriate to pool these 3 studies to obtain diagnostic meta-analysis summary sensitivity and specificity points due to the difference in scanners used to obtain the readings (1.5T versus 3T). Therefore, the sensitivity and specificity data are reported separately.
Table 21: Clinical evidence profile: Clinical evidence profile (AUC): Diagnostic tests for steatosis ≥5%
Index Test No
of
stu
die
s
n Ris
k o
f b
ias
Inco
nsi
ste
ncy
Ind
ire
ctn
ess
Imp
reci
sio
n
Are
a u
nd
er
the
cu
rve
,
me
dia
n
(ran
ge)
Quality
ALT No evidence
AST No evidence
CAP 5 704 Seriousa Seriousb None None 88 (67, 97) LOW
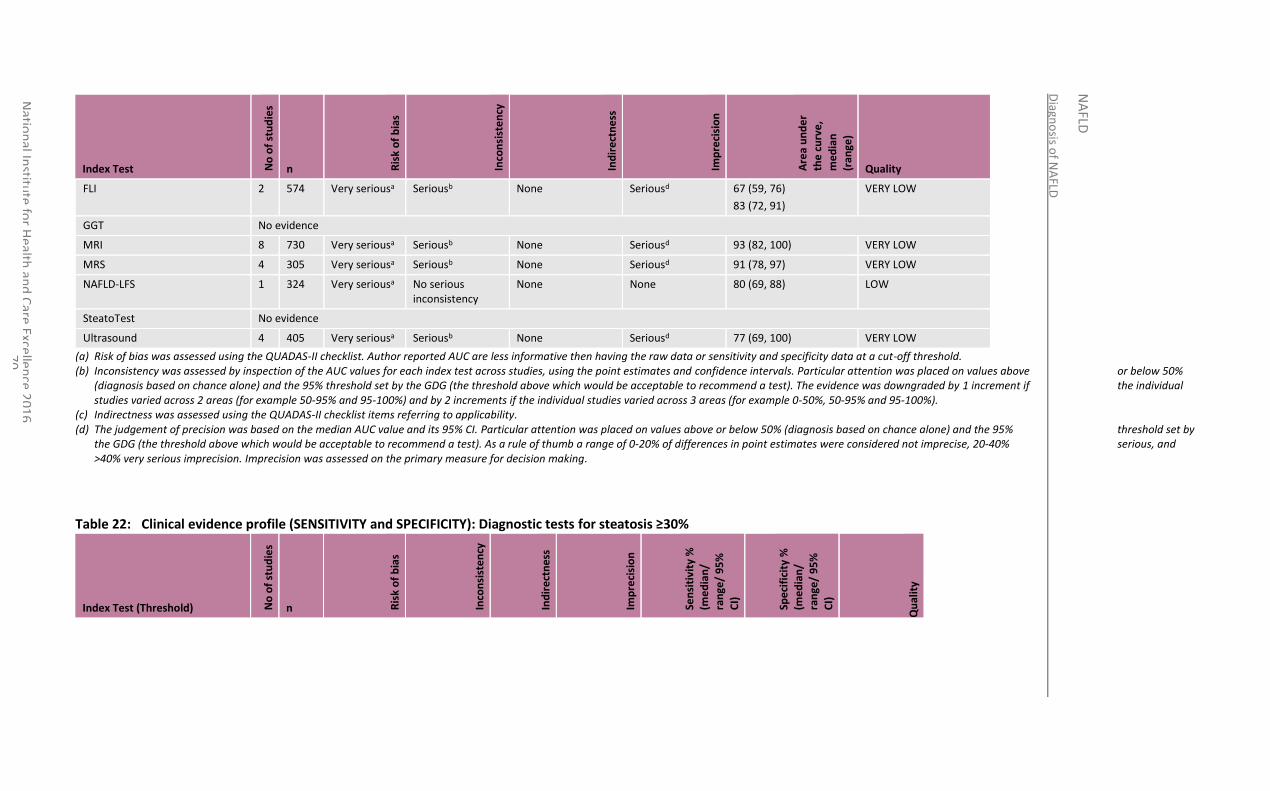
Diagn
osis o
f NA
FLD
NA
FLD
Natio
nal In
stitute
for H
ealth an
d C
are Excellen
ce 20
16
7
0
Index Test No
of
stu
die
s
n Ris
k o
f b
ias
Inco
nsi
ste
ncy
Ind
ire
ctn
ess
Imp
reci
sio
n
Are
a u
nd
er
the
cu
rve
,
me
dia
n
(ran
ge)
Quality
FLI 2 574 Very seriousa Seriousb None Seriousd 67 (59, 76)
83 (72, 91)
VERY LOW
GGT No evidence
MRI 8 730 Very seriousa Seriousb None Seriousd 93 (82, 100) VERY LOW
MRS 4 305 Very seriousa Seriousb None Seriousd 91 (78, 97) VERY LOW
NAFLD-LFS 1 324 Very seriousa No serious inconsistency
None None 80 (69, 88) LOW
SteatoTest No evidence
Ultrasound 4 405 Very seriousa Seriousb None Seriousd 77 (69, 100) VERY LOW
(a) Risk of bias was assessed using the QUADAS-II checklist. Author reported AUC are less informative then having the raw data or sensitivity and specificity data at a cut-off threshold. (b) Inconsistency was assessed by inspection of the AUC values for each index test across studies, using the point estimates and confidence intervals. Particular attention was placed on values above or below 50%
(diagnosis based on chance alone) and the 95% threshold set by the GDG (the threshold above which would be acceptable to recommend a test). The evidence was downgraded by 1 increment if the individual studies varied across 2 areas (for example 50-95% and 95-100%) and by 2 increments if the individual studies varied across 3 areas (for example 0-50%, 50-95% and 95-100%).
(c) Indirectness was assessed using the QUADAS-II checklist items referring to applicability. (d) The judgement of precision was based on the median AUC value and its 95% CI. Particular attention was placed on values above or below 50% (diagnosis based on chance alone) and the 95% threshold set by
the GDG (the threshold above which would be acceptable to recommend a test). As a rule of thumb a range of 0-20% of differences in point estimates were considered not imprecise, 20-40% serious, and >40% very serious imprecision. Imprecision was assessed on the primary measure for decision making.
Table 22: Clinical evidence profile (SENSITIVITY and SPECIFICITY): Diagnostic tests for steatosis ≥30%
Index Test (Threshold) No
of
stu
die
s
n Ris
k o
f b
ias
Inco
nsi
ste
ncy
Ind
ire
ctn
ess
Imp
reci
sio
n
Sen
siti
vity
%
(me
dia
n/
ran
ge/
95
%
CI)
Spe
cifi
city
%
(me
dia
n/
ran
ge/
95
%
CI)
Qu
alit
y
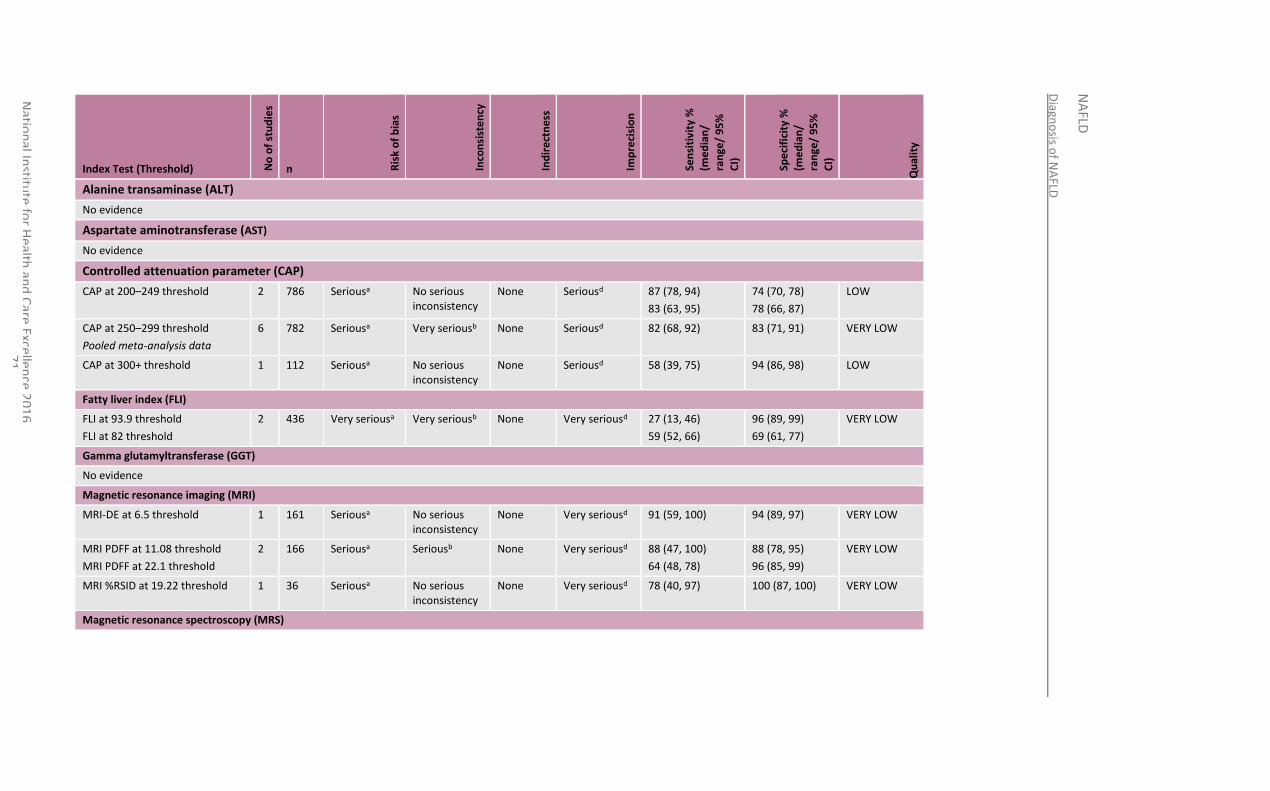
Diagn
osis o
f NA
FLD
NA
FLD
Natio
nal In
stitute
for H
ealth an
d C
are Excellen
ce 20
16
7
1
Index Test (Threshold) No
of
stu
die
s
n Ris
k o
f b
ias
Inco
nsi
ste
ncy
Ind
ire
ctn
ess
Imp
reci
sio
n
Sen
siti
vity
%
(me
dia
n/
ran
ge/
95
%
CI)
Spe
cifi
city
%
(me
dia
n/
ran
ge/
95
%
CI)
Qu
alit
y
Alanine transaminase (ALT)
No evidence
Aspartate aminotransferase (AST)
No evidence
Controlled attenuation parameter (CAP)
CAP at 200–249 threshold 2 786 Seriousa No serious inconsistency
None Seriousd 87 (78, 94)
83 (63, 95)
74 (70, 78)
78 (66, 87)
LOW
CAP at 250–299 threshold
Pooled meta-analysis data
6 782 Seriousa Very seriousb None Seriousd 82 (68, 92) 83 (71, 91) VERY LOW
CAP at 300+ threshold 1 112 Seriousa No serious inconsistency
None Seriousd 58 (39, 75) 94 (86, 98) LOW
Fatty liver index (FLI)
FLI at 93.9 threshold
FLI at 82 threshold
2 436 Very seriousa Very seriousb None Very seriousd 27 (13, 46)
59 (52, 66)
96 (89, 99)
69 (61, 77)
VERY LOW
Gamma glutamyltransferase (GGT)
No evidence
Magnetic resonance imaging (MRI)
MRI-DE at 6.5 threshold 1 161 Seriousa No serious inconsistency
None Very seriousd 91 (59, 100) 94 (89, 97) VERY LOW
MRI PDFF at 11.08 threshold
MRI PDFF at 22.1 threshold
2 166 Seriousa Seriousb None Very seriousd 88 (47, 100)
64 (48, 78)
88 (78, 95)
96 (85, 99)
VERY LOW
MRI %RSID at 19.22 threshold 1 36 Seriousa No serious inconsistency
None Very seriousd 78 (40, 97) 100 (87, 100) VERY LOW
Magnetic resonance spectroscopy (MRS)
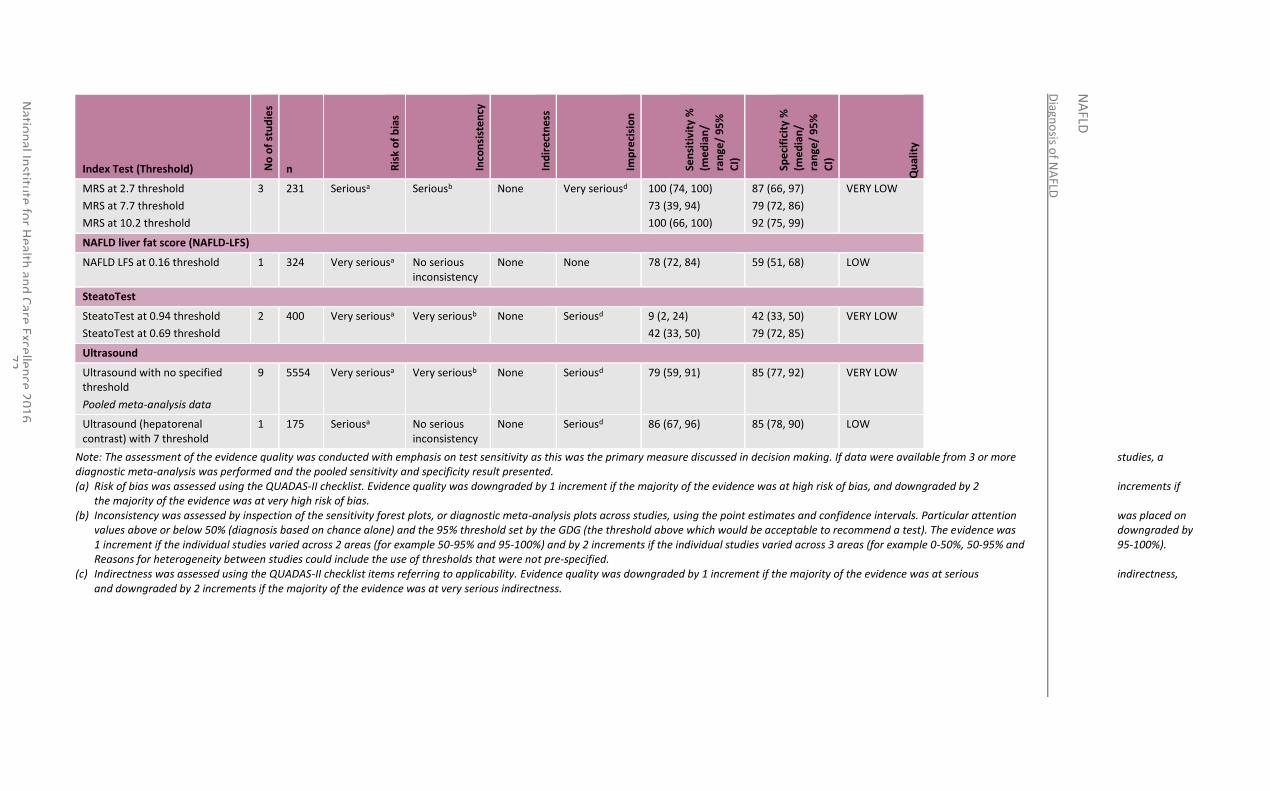
Diagn
osis o
f NA
FLD
NA
FLD
Natio
nal In
stitute
for H
ealth an
d C
are Excellen
ce 20
16
7
2
Index Test (Threshold) No
of
stu
die
s
n Ris
k o
f b
ias
Inco
nsi
ste
ncy
Ind
ire
ctn
ess
Imp
reci
sio
n
Sen
siti
vity
%
(me
dia
n/
ran
ge/
95
%
CI)
Spe
cifi
city
%
(me
dia
n/
ran
ge/
95
%
CI)
Qu
alit
y
MRS at 2.7 threshold
MRS at 7.7 threshold
MRS at 10.2 threshold
3 231 Seriousa Seriousb None Very seriousd 100 (74, 100)
73 (39, 94)
100 (66, 100)
87 (66, 97)
79 (72, 86)
92 (75, 99)
VERY LOW
NAFLD liver fat score (NAFLD-LFS)
NAFLD LFS at 0.16 threshold 1 324 Very seriousa No serious inconsistency
None None 78 (72, 84) 59 (51, 68) LOW
SteatoTest
SteatoTest at 0.94 threshold
SteatoTest at 0.69 threshold
2 400 Very seriousa Very seriousb None Seriousd 9 (2, 24)
42 (33, 50)
42 (33, 50)
79 (72, 85)
VERY LOW
Ultrasound
Ultrasound with no specified threshold
Pooled meta-analysis data
9 5554 Very seriousa Very seriousb None Seriousd 79 (59, 91) 85 (77, 92) VERY LOW
Ultrasound (hepatorenal contrast) with 7 threshold
1 175 Seriousa No serious inconsistency
None Seriousd 86 (67, 96) 85 (78, 90) LOW
Note: The assessment of the evidence quality was conducted with emphasis on test sensitivity as this was the primary measure discussed in decision making. If data were available from 3 or more studies, a diagnostic meta-analysis was performed and the pooled sensitivity and specificity result presented. (a) Risk of bias was assessed using the QUADAS-II checklist. Evidence quality was downgraded by 1 increment if the majority of the evidence was at high risk of bias, and downgraded by 2 increments if
the majority of the evidence was at very high risk of bias. (b) Inconsistency was assessed by inspection of the sensitivity forest plots, or diagnostic meta-analysis plots across studies, using the point estimates and confidence intervals. Particular attention was placed on
values above or below 50% (diagnosis based on chance alone) and the 95% threshold set by the GDG (the threshold above which would be acceptable to recommend a test). The evidence was downgraded by 1 increment if the individual studies varied across 2 areas (for example 50-95% and 95-100%) and by 2 increments if the individual studies varied across 3 areas (for example 0-50%, 50-95% and 95-100%). Reasons for heterogeneity between studies could include the use of thresholds that were not pre-specified.
(c) Indirectness was assessed using the QUADAS-II checklist items referring to applicability. Evidence quality was downgraded by 1 increment if the majority of the evidence was at serious indirectness, and downgraded by 2 increments if the majority of the evidence was at very serious indirectness.
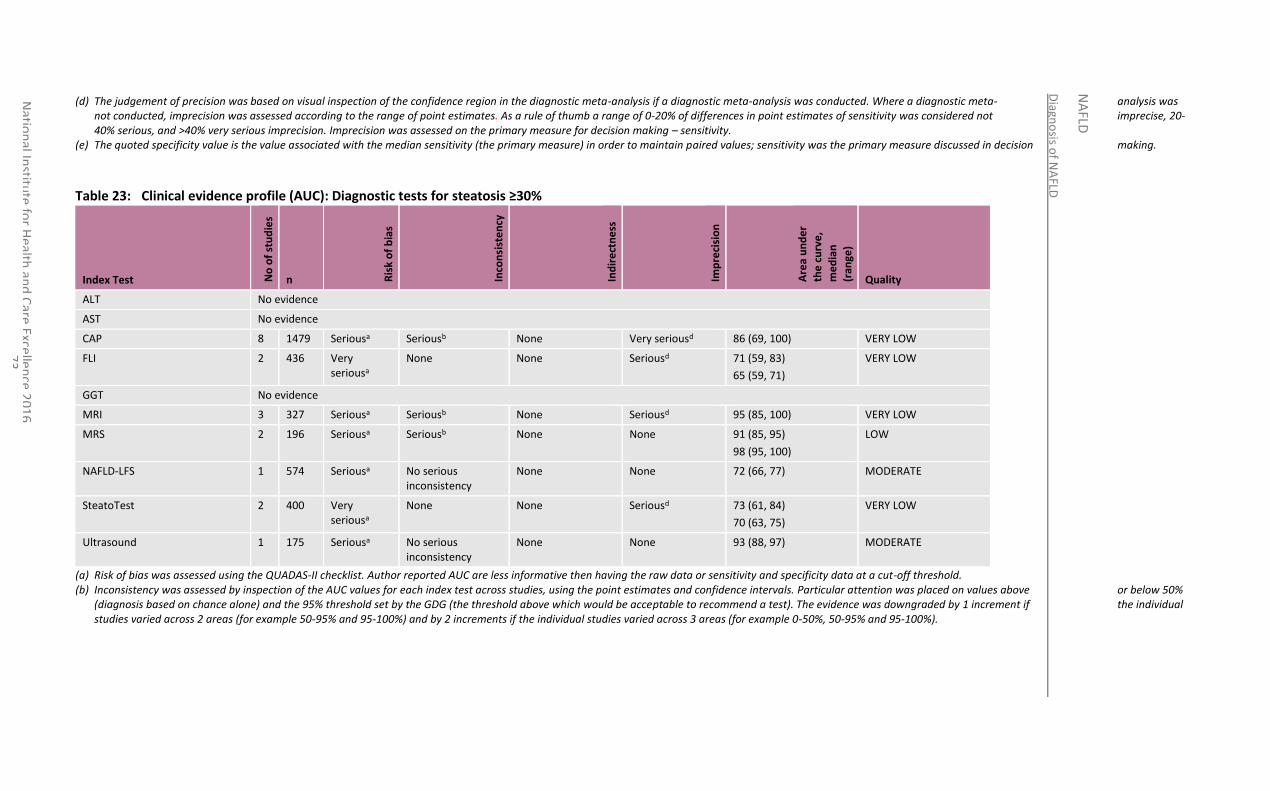
Diagn
osis o
f NA
FLD
NA
FLD
Natio
nal In
stitute
for H
ealth an
d C
are Excellen
ce 20
16
7
3
(d) The judgement of precision was based on visual inspection of the confidence region in the diagnostic meta-analysis if a diagnostic meta-analysis was conducted. Where a diagnostic meta- analysis was not conducted, imprecision was assessed according to the range of point estimates. As a rule of thumb a range of 0-20% of differences in point estimates of sensitivity was considered not imprecise, 20-40% serious, and >40% very serious imprecision. Imprecision was assessed on the primary measure for decision making – sensitivity.
(e) The quoted specificity value is the value associated with the median sensitivity (the primary measure) in order to maintain paired values; sensitivity was the primary measure discussed in decision making.
Table 23: Clinical evidence profile (AUC): Diagnostic tests for steatosis ≥30%
Index Test No
of
stu
die
s n R
isk
of
bia
s
Inco
nsi
ste
ncy
Ind
ire
ctn
ess
Imp
reci
sio
n
Are
a u
nd
er
the
cu
rve
,
me
dia
n
(ran
ge)
Quality
ALT No evidence
AST No evidence
CAP 8 1479 Seriousa Seriousb None Very seriousd 86 (69, 100) VERY LOW
FLI 2 436 Very seriousa
None None Seriousd 71 (59, 83)
65 (59, 71)
VERY LOW
GGT No evidence
MRI 3 327 Seriousa Seriousb None Seriousd 95 (85, 100) VERY LOW
MRS 2 196 Seriousa Seriousb None None 91 (85, 95)
98 (95, 100)
LOW
NAFLD-LFS 1 574 Seriousa No serious inconsistency
None None 72 (66, 77) MODERATE
SteatoTest 2 400 Very seriousa
None None Seriousd 73 (61, 84)
70 (63, 75)
VERY LOW
Ultrasound 1 175 Seriousa No serious inconsistency
None None 93 (88, 97) MODERATE
(a) Risk of bias was assessed using the QUADAS-II checklist. Author reported AUC are less informative then having the raw data or sensitivity and specificity data at a cut-off threshold. (b) Inconsistency was assessed by inspection of the AUC values for each index test across studies, using the point estimates and confidence intervals. Particular attention was placed on values above or below 50%
(diagnosis based on chance alone) and the 95% threshold set by the GDG (the threshold above which would be acceptable to recommend a test). The evidence was downgraded by 1 increment if the individual studies varied across 2 areas (for example 50-95% and 95-100%) and by 2 increments if the individual studies varied across 3 areas (for example 0-50%, 50-95% and 95-100%).
Diagn
osis o
f NA
FLD
NA
FLD
Natio
nal In
stitute
for H
ealth an
d C
are Excellen
ce 20
16
7
4
(c) Indirectness was assessed using the QUADAS-II checklist items referring to applicability. (d) The judgement of precision was based on the median AUC value and its 95% CI. Particular attention was placed on values above or below 50% (diagnosis based on chance alone) and the 95% threshold set by
the GDG (the threshold above which would be acceptable to recommend a test). The evidence was downgraded by 1 increment if the confidence interval varied across 2 areas (for example 50- 95% and 95-100%) and by 2 increments if the confidence interval varied across 3 areas (for example 0-50%, 50-95% and 95-100%).
National Institute for Health and Care Excellence 2016
NAFLD
Diagnosis of NAFLD
75
6.4 Economic evidence
6.4.1 Published evidence
No relevant economic evaluations were identified.
See also the economic article selection flow chart in Appendix F.
6.4.2 Unit costs
See Table 61 in Appendix N.
6.4.3 New cost-effectiveness analysis
Original cost-effectiveness modelling was undertaken for this question using the NGC liver disease pathway model developed for this guideline. A summary is included here. An evidence statement summarising the results of the analysis can be found below. The full analysis can be found in Appendix N.
6.4.3.1 Aim and structure
The aim of the health economic modelling for this question was to determine the most cost-effective diagnostic test to detect 5% steatosis and whom to test (according to specific risk factors). Within the scope of the model was also to examine the cost-effectiveness of the various retest frequencies for every risk factor group. For these purposes a lifetime health state transition (Markov) model was constructed, following the NICE reference case,124 which depicted the patient pathway of liver disease from the development of early steatosis to liver transplant.
The diagnostic strategies compared were:
CAP at 200–249
fatty liver index at 60
MRI PDFF at 6.87
MRS at 0–5
liver fat score at 0.16
SteatoTest at 0.38
ultrasound
liver biopsy
no test – treat all
no test – no treatment.
The population was adults with suspected NAFLD, categorised into the following subgroups:
Obese (BMI≥30)
Wide waist circumference (≥102cm for men, ≥88cm for women)
Diabetes (glyceamia≥110mg/dl)
Low HDL (<40mg/dl men, <50mg/dl women)
High triglycerides (≥150mg/dl)
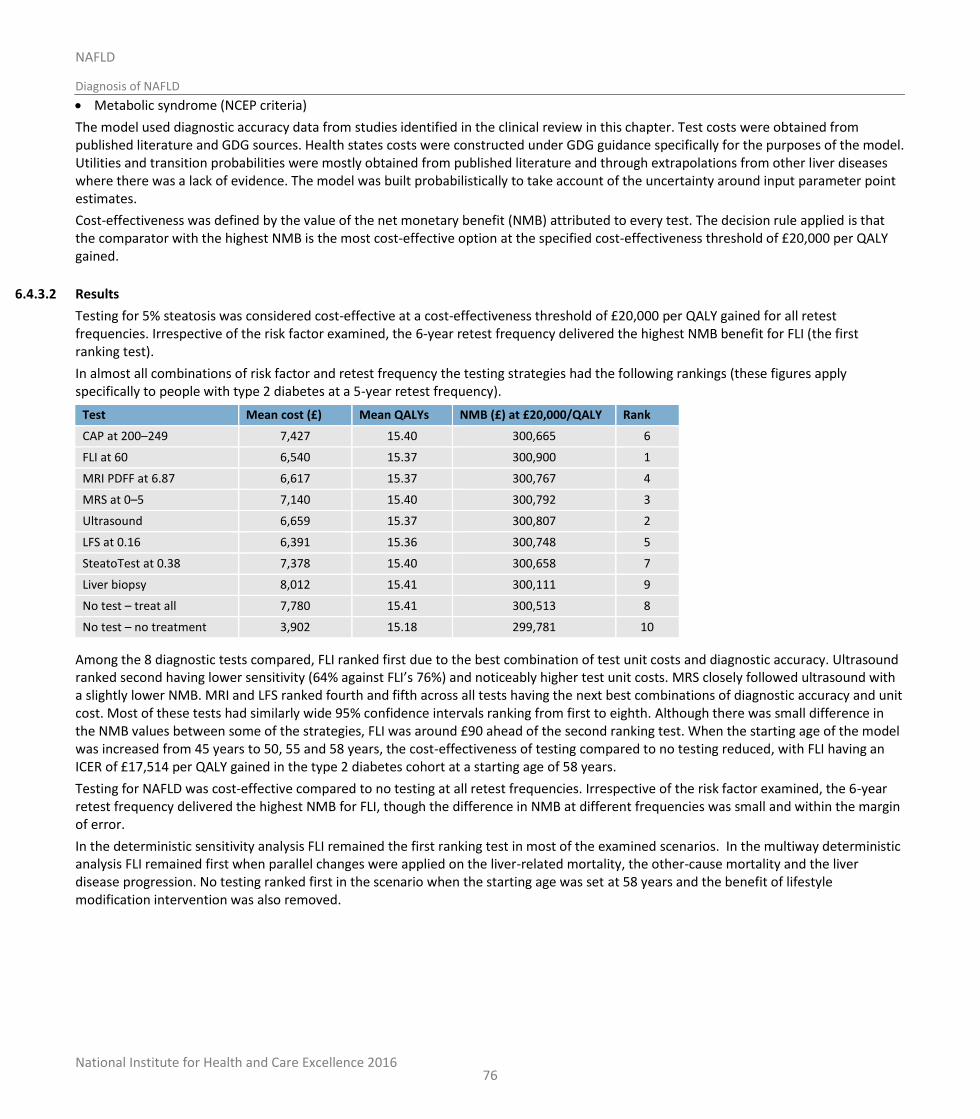
National Institute for Health and Care Excellence 2016
NAFLD
Diagnosis of NAFLD
76
Metabolic syndrome (NCEP criteria)
The model used diagnostic accuracy data from studies identified in the clinical review in this chapter. Test costs were obtained from published literature and GDG sources. Health states costs were constructed under GDG guidance specifically for the purposes of the model. Utilities and transition probabilities were mostly obtained from published literature and through extrapolations from other liver diseases where there was a lack of evidence. The model was built probabilistically to take account of the uncertainty around input parameter point estimates.
Cost-effectiveness was defined by the value of the net monetary benefit (NMB) attributed to every test. The decision rule applied is that the comparator with the highest NMB is the most cost-effective option at the specified cost-effectiveness threshold of £20,000 per QALY gained.
6.4.3.2 Results
Testing for 5% steatosis was considered cost-effective at a cost-effectiveness threshold of £20,000 per QALY gained for all retest frequencies. Irrespective of the risk factor examined, the 6-year retest frequency delivered the highest NMB benefit for FLI (the first ranking test).
In almost all combinations of risk factor and retest frequency the testing strategies had the following rankings (these figures apply specifically to people with type 2 diabetes at a 5-year retest frequency).
Test Mean cost (£) Mean QALYs NMB (£) at £20,000/QALY Rank
CAP at 200–249 7,427 15.40 300,665 6
FLI at 60 6,540 15.37 300,900 1
MRI PDFF at 6.87 6,617 15.37 300,767 4
MRS at 0–5 7,140 15.40 300,792 3
Ultrasound 6,659 15.37 300,807 2
LFS at 0.16 6,391 15.36 300,748 5
SteatoTest at 0.38 7,378 15.40 300,658 7
Liver biopsy 8,012 15.41 300,111 9
No test – treat all 7,780 15.41 300,513 8
No test – no treatment 3,902 15.18 299,781 10
Among the 8 diagnostic tests compared, FLI ranked first due to the best combination of test unit costs and diagnostic accuracy. Ultrasound ranked second having lower sensitivity (64% against FLI’s 76%) and noticeably higher test unit costs. MRS closely followed ultrasound with a slightly lower NMB. MRI and LFS ranked fourth and fifth across all tests having the next best combinations of diagnostic accuracy and unit cost. Most of these tests had similarly wide 95% confidence intervals ranking from first to eighth. Although there was small difference in the NMB values between some of the strategies, FLI was around £90 ahead of the second ranking test. When the starting age of the model was increased from 45 years to 50, 55 and 58 years, the cost-effectiveness of testing compared to no testing reduced, with FLI having an ICER of £17,514 per QALY gained in the type 2 diabetes cohort at a starting age of 58 years.
Testing for NAFLD was cost-effective compared to no testing at all retest frequencies. Irrespective of the risk factor examined, the 6-year retest frequency delivered the highest NMB for FLI, though the difference in NMB at different frequencies was small and within the margin of error.
In the deterministic sensitivity analysis FLI remained the first ranking test in most of the examined scenarios. In the multiway deterministic analysis FLI remained first when parallel changes were applied on the liver-related mortality, the other-cause mortality and the liver disease progression. No testing ranked first in the scenario when the starting age was set at 58 years and the benefit of lifestyle modification intervention was also removed.
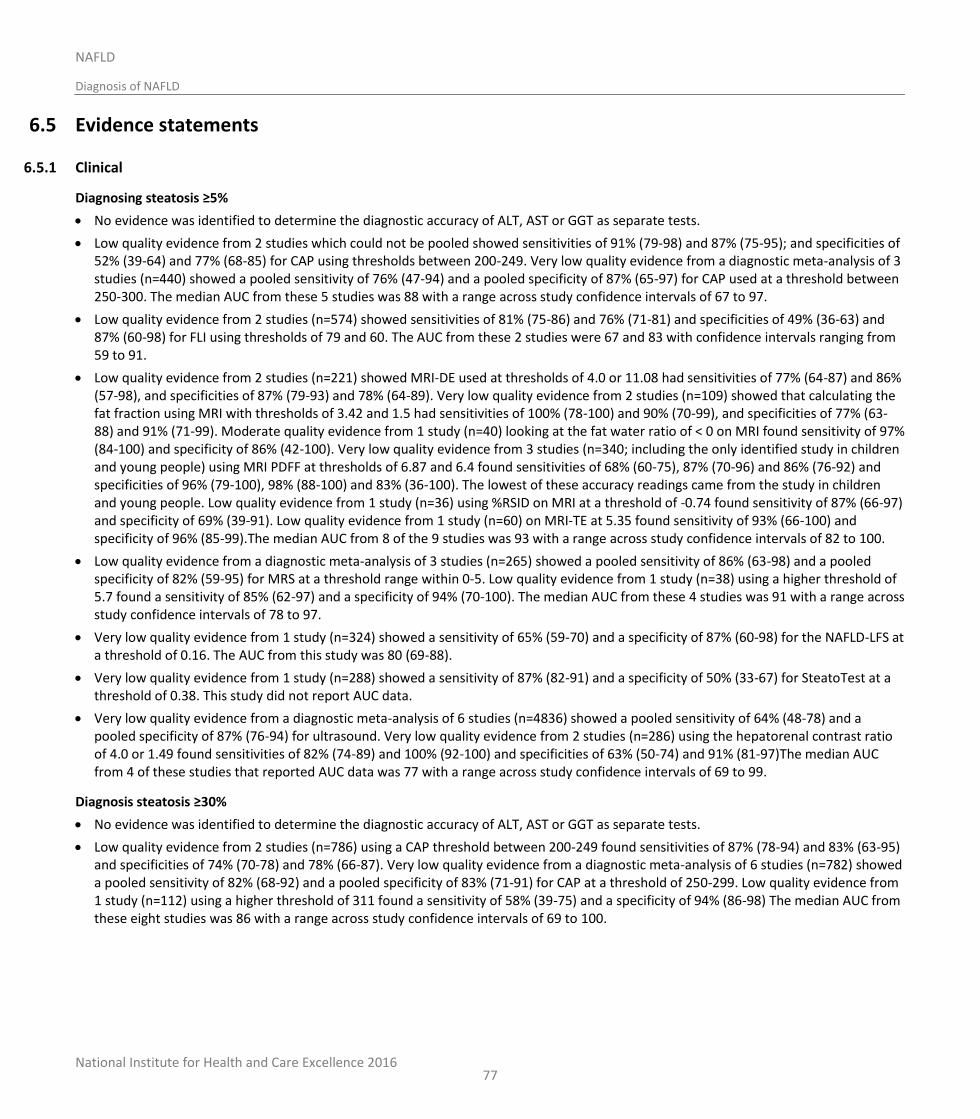
National Institute for Health and Care Excellence 2016
NAFLD
Diagnosis of NAFLD
77
6.5 Evidence statements
6.5.1 Clinical
Diagnosing steatosis ≥5%
No evidence was identified to determine the diagnostic accuracy of ALT, AST or GGT as separate tests.
Low quality evidence from 2 studies which could not be pooled showed sensitivities of 91% (79-98) and 87% (75-95); and specificities of 52% (39-64) and 77% (68-85) for CAP using thresholds between 200-249. Very low quality evidence from a diagnostic meta-analysis of 3 studies (n=440) showed a pooled sensitivity of 76% (47-94) and a pooled specificity of 87% (65-97) for CAP used at a threshold between 250-300. The median AUC from these 5 studies was 88 with a range across study confidence intervals of 67 to 97.
Low quality evidence from 2 studies (n=574) showed sensitivities of 81% (75-86) and 76% (71-81) and specificities of 49% (36-63) and 87% (60-98) for FLI using thresholds of 79 and 60. The AUC from these 2 studies were 67 and 83 with confidence intervals ranging from 59 to 91.
Low quality evidence from 2 studies (n=221) showed MRI-DE used at thresholds of 4.0 or 11.08 had sensitivities of 77% (64-87) and 86% (57-98), and specificities of 87% (79-93) and 78% (64-89). Very low quality evidence from 2 studies (n=109) showed that calculating the fat fraction using MRI with thresholds of 3.42 and 1.5 had sensitivities of 100% (78-100) and 90% (70-99), and specificities of 77% (63-88) and 91% (71-99). Moderate quality evidence from 1 study (n=40) looking at the fat water ratio of < 0 on MRI found sensitivity of 97% (84-100) and specificity of 86% (42-100). Very low quality evidence from 3 studies (n=340; including the only identified study in children and young people) using MRI PDFF at thresholds of 6.87 and 6.4 found sensitivities of 68% (60-75), 87% (70-96) and 86% (76-92) and specificities of 96% (79-100), 98% (88-100) and 83% (36-100). The lowest of these accuracy readings came from the study in children and young people. Low quality evidence from 1 study (n=36) using %RSID on MRI at a threshold of -0.74 found sensitivity of 87% (66-97) and specificity of 69% (39-91). Low quality evidence from 1 study (n=60) on MRI-TE at 5.35 found sensitivity of 93% (66-100) and specificity of 96% (85-99).The median AUC from 8 of the 9 studies was 93 with a range across study confidence intervals of 82 to 100.
Low quality evidence from a diagnostic meta-analysis of 3 studies (n=265) showed a pooled sensitivity of 86% (63-98) and a pooled specificity of 82% (59-95) for MRS at a threshold range within 0-5. Low quality evidence from 1 study (n=38) using a higher threshold of 5.7 found a sensitivity of 85% (62-97) and a specificity of 94% (70-100). The median AUC from these 4 studies was 91 with a range across study confidence intervals of 78 to 97.
Very low quality evidence from 1 study (n=324) showed a sensitivity of 65% (59-70) and a specificity of 87% (60-98) for the NAFLD-LFS at a threshold of 0.16. The AUC from this study was 80 (69-88).
Very low quality evidence from 1 study (n=288) showed a sensitivity of 87% (82-91) and a specificity of 50% (33-67) for SteatoTest at a threshold of 0.38. This study did not report AUC data.
Very low quality evidence from a diagnostic meta-analysis of 6 studies (n=4836) showed a pooled sensitivity of 64% (48-78) and a pooled specificity of 87% (76-94) for ultrasound. Very low quality evidence from 2 studies (n=286) using the hepatorenal contrast ratio of 4.0 or 1.49 found sensitivities of 82% (74-89) and 100% (92-100) and specificities of 63% (50-74) and 91% (81-97)The median AUC from 4 of these studies that reported AUC data was 77 with a range across study confidence intervals of 69 to 99.
Diagnosis steatosis ≥30%
No evidence was identified to determine the diagnostic accuracy of ALT, AST or GGT as separate tests.
Low quality evidence from 2 studies (n=786) using a CAP threshold between 200-249 found sensitivities of 87% (78-94) and 83% (63-95) and specificities of 74% (70-78) and 78% (66-87). Very low quality evidence from a diagnostic meta-analysis of 6 studies (n=782) showed a pooled sensitivity of 82% (68-92) and a pooled specificity of 83% (71-91) for CAP at a threshold of 250-299. Low quality evidence from 1 study (n=112) using a higher threshold of 311 found a sensitivity of 58% (39-75) and a specificity of 94% (86-98) The median AUC from these eight studies was 86 with a range across study confidence intervals of 69 to 100.
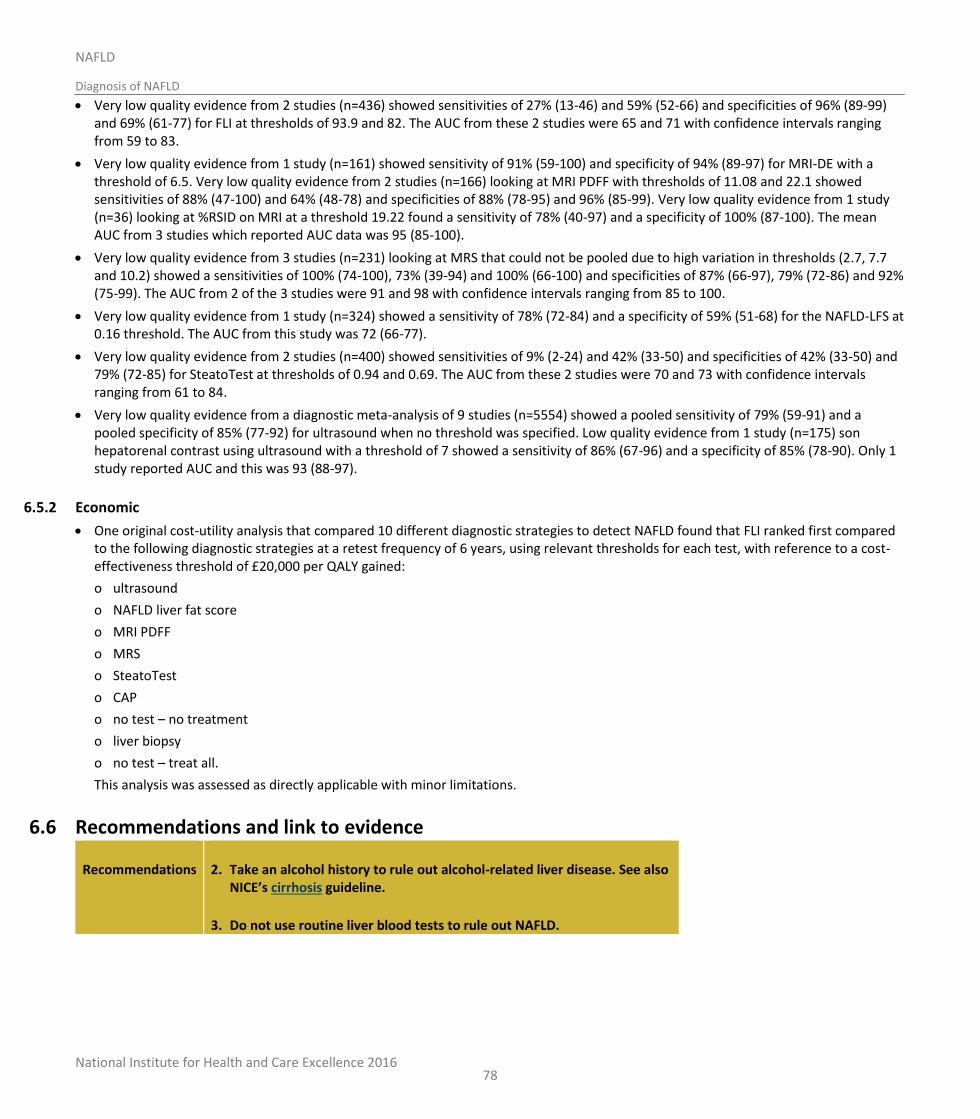
National Institute for Health and Care Excellence 2016
NAFLD
Diagnosis of NAFLD
78
Very low quality evidence from 2 studies (n=436) showed sensitivities of 27% (13-46) and 59% (52-66) and specificities of 96% (89-99) and 69% (61-77) for FLI at thresholds of 93.9 and 82. The AUC from these 2 studies were 65 and 71 with confidence intervals ranging from 59 to 83.
Very low quality evidence from 1 study (n=161) showed sensitivity of 91% (59-100) and specificity of 94% (89-97) for MRI-DE with a threshold of 6.5. Very low quality evidence from 2 studies (n=166) looking at MRI PDFF with thresholds of 11.08 and 22.1 showed sensitivities of 88% (47-100) and 64% (48-78) and specificities of 88% (78-95) and 96% (85-99). Very low quality evidence from 1 study (n=36) looking at %RSID on MRI at a threshold 19.22 found a sensitivity of 78% (40-97) and a specificity of 100% (87-100). The mean AUC from 3 studies which reported AUC data was 95 (85-100).
Very low quality evidence from 3 studies (n=231) looking at MRS that could not be pooled due to high variation in thresholds (2.7, 7.7 and 10.2) showed a sensitivities of 100% (74-100), 73% (39-94) and 100% (66-100) and specificities of 87% (66-97), 79% (72-86) and 92% (75-99). The AUC from 2 of the 3 studies were 91 and 98 with confidence intervals ranging from 85 to 100.
Very low quality evidence from 1 study (n=324) showed a sensitivity of 78% (72-84) and a specificity of 59% (51-68) for the NAFLD-LFS at 0.16 threshold. The AUC from this study was 72 (66-77).
Very low quality evidence from 2 studies (n=400) showed sensitivities of 9% (2-24) and 42% (33-50) and specificities of 42% (33-50) and 79% (72-85) for SteatoTest at thresholds of 0.94 and 0.69. The AUC from these 2 studies were 70 and 73 with confidence intervals ranging from 61 to 84.
Very low quality evidence from a diagnostic meta-analysis of 9 studies (n=5554) showed a pooled sensitivity of 79% (59-91) and a pooled specificity of 85% (77-92) for ultrasound when no threshold was specified. Low quality evidence from 1 study (n=175) son hepatorenal contrast using ultrasound with a threshold of 7 showed a sensitivity of 86% (67-96) and a specificity of 85% (78-90). Only 1 study reported AUC and this was 93 (88-97).
6.5.2 Economic
One original cost-utility analysis that compared 10 different diagnostic strategies to detect NAFLD found that FLI ranked first compared to the following diagnostic strategies at a retest frequency of 6 years, using relevant thresholds for each test, with reference to a cost-effectiveness threshold of £20,000 per QALY gained:
o ultrasound
o NAFLD liver fat score
o MRI PDFF
o MRS
o SteatoTest
o CAP
o no test – no treatment
o liver biopsy
o no test – treat all.
This analysis was assessed as directly applicable with minor limitations.
6.6 Recommendations and link to evidence
Recommendations 2. Take an alcohol history to rule out alcohol-related liver disease. See also NICE’s cirrhosis guideline.
3. Do not use routine liver blood tests to rule out NAFLD.
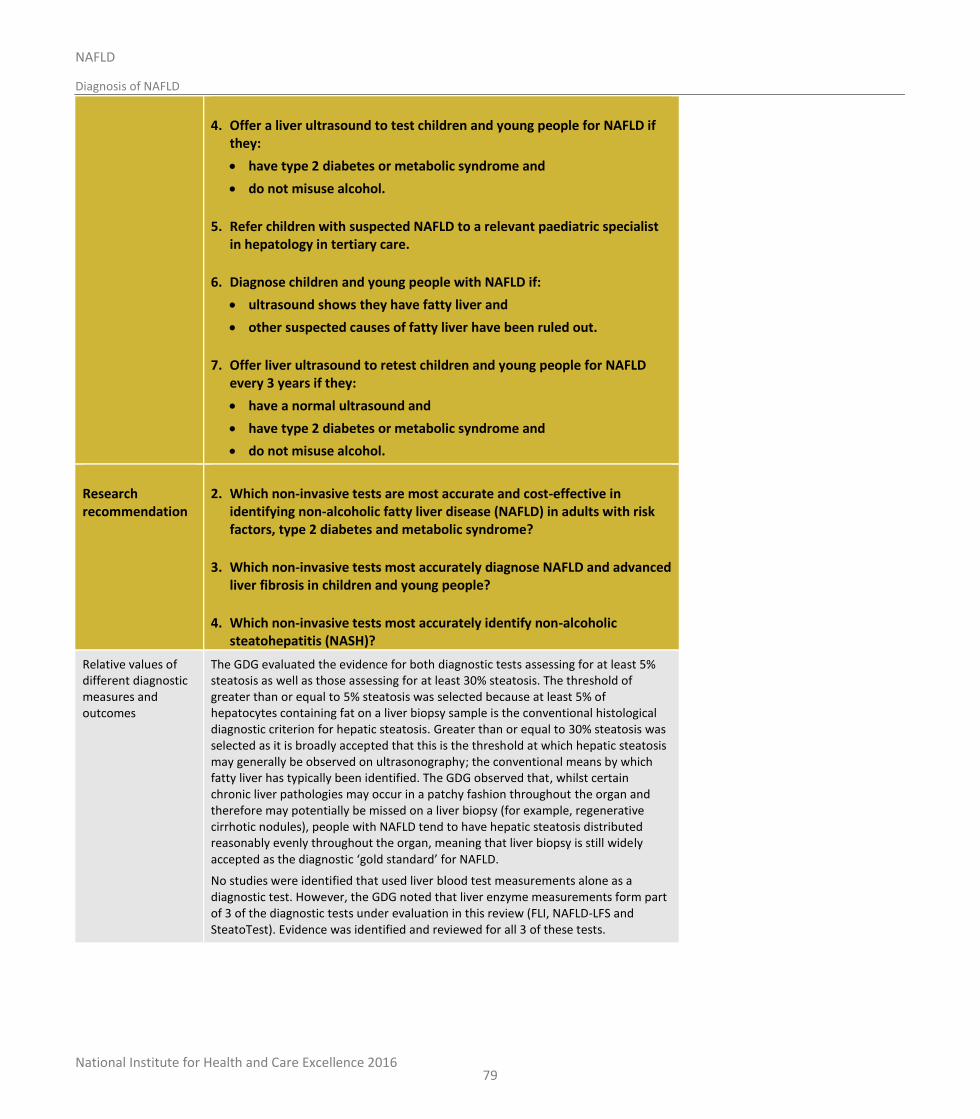
National Institute for Health and Care Excellence 2016
NAFLD
Diagnosis of NAFLD
79
4. Offer a liver ultrasound to test children and young people for NAFLD if they:
have type 2 diabetes or metabolic syndrome and
do not misuse alcohol.
5. Refer children with suspected NAFLD to a relevant paediatric specialist in hepatology in tertiary care.
6. Diagnose children and young people with NAFLD if:
ultrasound shows they have fatty liver and
other suspected causes of fatty liver have been ruled out.
7. Offer liver ultrasound to retest children and young people for NAFLD every 3 years if they:
have a normal ultrasound and
have type 2 diabetes or metabolic syndrome and
do not misuse alcohol.
Research recommendation
2. Which non-invasive tests are most accurate and cost-effective in identifying non-alcoholic fatty liver disease (NAFLD) in adults with risk factors, type 2 diabetes and metabolic syndrome?
3. Which non-invasive tests most accurately diagnose NAFLD and advanced liver fibrosis in children and young people?
4. Which non-invasive tests most accurately identify non-alcoholic steatohepatitis (NASH)?
Relative values of different diagnostic measures and outcomes
The GDG evaluated the evidence for both diagnostic tests assessing for at least 5% steatosis as well as those assessing for at least 30% steatosis. The threshold of greater than or equal to 5% steatosis was selected because at least 5% of hepatocytes containing fat on a liver biopsy sample is the conventional histological diagnostic criterion for hepatic steatosis. Greater than or equal to 30% steatosis was selected as it is broadly accepted that this is the threshold at which hepatic steatosis may generally be observed on ultrasonography; the conventional means by which fatty liver has typically been identified. The GDG observed that, whilst certain chronic liver pathologies may occur in a patchy fashion throughout the organ and therefore may potentially be missed on a liver biopsy (for example, regenerative cirrhotic nodules), people with NAFLD tend to have hepatic steatosis distributed reasonably evenly throughout the organ, meaning that liver biopsy is still widely accepted as the diagnostic ‘gold standard’ for NAFLD.
No studies were identified that used liver blood test measurements alone as a diagnostic test. However, the GDG noted that liver enzyme measurements form part of 3 of the diagnostic tests under evaluation in this review (FLI, NAFLD-LFS and SteatoTest). Evidence was identified and reviewed for all 3 of these tests.
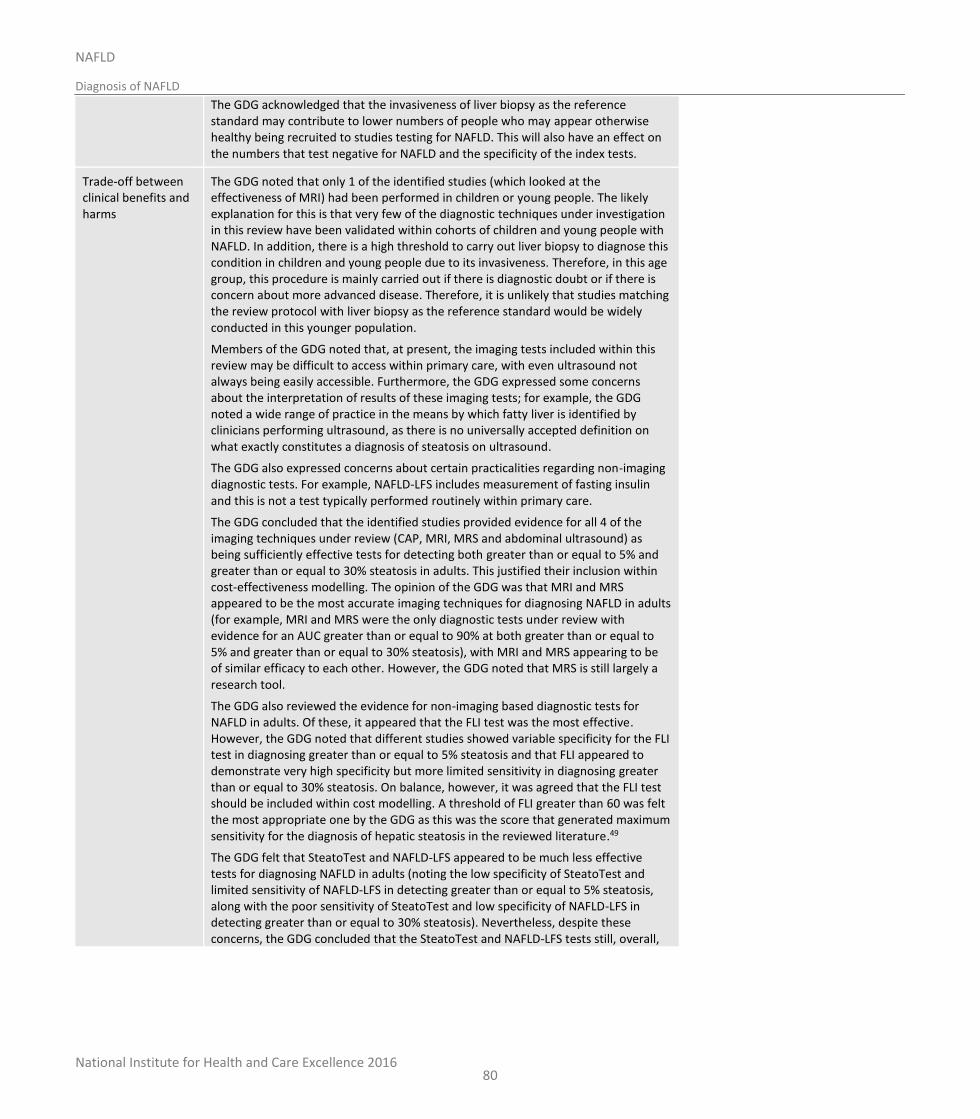
National Institute for Health and Care Excellence 2016
NAFLD
Diagnosis of NAFLD
80
The GDG acknowledged that the invasiveness of liver biopsy as the reference standard may contribute to lower numbers of people who may appear otherwise healthy being recruited to studies testing for NAFLD. This will also have an effect on the numbers that test negative for NAFLD and the specificity of the index tests.
Trade-off between clinical benefits and harms
The GDG noted that only 1 of the identified studies (which looked at the effectiveness of MRI) had been performed in children or young people. The likely explanation for this is that very few of the diagnostic techniques under investigation in this review have been validated within cohorts of children and young people with NAFLD. In addition, there is a high threshold to carry out liver biopsy to diagnose this condition in children and young people due to its invasiveness. Therefore, in this age group, this procedure is mainly carried out if there is diagnostic doubt or if there is concern about more advanced disease. Therefore, it is unlikely that studies matching the review protocol with liver biopsy as the reference standard would be widely conducted in this younger population.
Members of the GDG noted that, at present, the imaging tests included within this review may be difficult to access within primary care, with even ultrasound not always being easily accessible. Furthermore, the GDG expressed some concerns about the interpretation of results of these imaging tests; for example, the GDG noted a wide range of practice in the means by which fatty liver is identified by clinicians performing ultrasound, as there is no universally accepted definition on what exactly constitutes a diagnosis of steatosis on ultrasound.
The GDG also expressed concerns about certain practicalities regarding non-imaging diagnostic tests. For example, NAFLD-LFS includes measurement of fasting insulin and this is not a test typically performed routinely within primary care.
The GDG concluded that the identified studies provided evidence for all 4 of the imaging techniques under review (CAP, MRI, MRS and abdominal ultrasound) as being sufficiently effective tests for detecting both greater than or equal to 5% and greater than or equal to 30% steatosis in adults. This justified their inclusion within cost-effectiveness modelling. The opinion of the GDG was that MRI and MRS appeared to be the most accurate imaging techniques for diagnosing NAFLD in adults (for example, MRI and MRS were the only diagnostic tests under review with evidence for an AUC greater than or equal to 90% at both greater than or equal to 5% and greater than or equal to 30% steatosis), with MRI and MRS appearing to be of similar efficacy to each other. However, the GDG noted that MRS is still largely a research tool.
The GDG also reviewed the evidence for non-imaging based diagnostic tests for NAFLD in adults. Of these, it appeared that the FLI test was the most effective. However, the GDG noted that different studies showed variable specificity for the FLI test in diagnosing greater than or equal to 5% steatosis and that FLI appeared to demonstrate very high specificity but more limited sensitivity in diagnosing greater than or equal to 30% steatosis. On balance, however, it was agreed that the FLI test should be included within cost modelling. A threshold of FLI greater than 60 was felt the most appropriate one by the GDG as this was the score that generated maximum sensitivity for the diagnosis of hepatic steatosis in the reviewed literature.49
The GDG felt that SteatoTest and NAFLD-LFS appeared to be much less effective tests for diagnosing NAFLD in adults (noting the low specificity of SteatoTest and limited sensitivity of NAFLD-LFS in detecting greater than or equal to 5% steatosis, along with the poor sensitivity of SteatoTest and low specificity of NAFLD-LFS in detecting greater than or equal to 30% steatosis). Nevertheless, despite these concerns, the GDG concluded that the SteatoTest and NAFLD-LFS tests still, overall,
National Institute for Health and Care Excellence 2016
NAFLD
Diagnosis of NAFLD
81
had sufficient sensitivity and specificity to merit inclusion within the cost modelling.
The results of the base case scenario of original economic model demonstrated that FLI was the most cost-effective test to use to diagnose NAFLD in adults who had type 2 diabetes or metabolic syndrome. Ultrasound was the next most cost-effective option after FLI, with all non-invasive testing strategies being close in terms of cost-effectiveness. However, concerns were discussed regarding the confidence intervals for the specificity of the FLI and it was agreed that, as a targeted case finding recommendation, it would not be appropriate to make a recommendation that could potentially misdiagnose a large number of people. The GDG discussed the disconnect between making a recommendation detailing in whom to suspect NAFLD (Chapter 5 on risk factors) but then not being able to recommend a specific test to confirm or disconfirm suspicion of NAFLD. However given the concerns about large numbers of false positive misdiagnoses that could occur if the FLI performed at its lowest confidence interval (60%) a recommendation for a specific test to investigate NAFLD could not be made. The GDG were anxious to note that this potentially left primary care practitioners with no guidance on how to progress with patients they suspect have NAFLD, other than if fatty liver is discovered on incidental findings (e.g. ultrasound) when investigating for other health issues. In order to highlight the importance of finding this group of people who may now consequently not present until they have advanced liver disease, missing the opportunity for disease management, the GDG made high-priority research recommendations to identify the most accurate non-invasive tests to diagnose NAFLD in adults.
The GDG discussed whether a recommendation was still warranted for children and young people. They expressed concern that FLI was not validated in children and young people and, as waist circumference (1 of the 3 components of the FLI) is not a reliable predictor of NAFLD in children and young people, agreed that it was not appropriate to extrapolate the evidence from the adult population for this particular test. Ultrasound is the next most cost-effective option and the GDG agreed it was widely accepted as an appropriate diagnostic tool for children and young people as there was no clinical reason to believe that the performance would differ in a younger population. As the prevalence of type 2 diabetes and metabolic syndrome, and hence NAFLD, is considerably lower in children and young people, it was agreed that ultrasound could be considered as a test for NAFLD in those who have type 2 diabetes or metabolic syndrome and do not misuse alcohol. It was agreed that as the health benefits of identifying NAFLD in children, where present, would extend over a longer time-horizon than adults, this test should be offered to children in which NAFLD is suspected. However, due to the uncertain evidence base, it was agreed that a research recommendation was also warranted for this population.
The GDG was informed, by evidence from the review in Chapter 5, on risk factors for NAFLD and the economic model for the frequency of retesting for presence of NAFLD in those who had a negative test result. This review suggested that it may be appropriate to consider retesting adults with NAFLD and the aforementioned risk factors every 6 years. The GDG considered whether this retesting frequency would be appropriate in children and young people. However, there was concern that children and young people are rapidly developing and experiencing hormonal changes which may affect their risk of developing NAFLD. Furthermore, type and volume of food intake and type and frequency of physical activity undertaken changes immensely in younger people over short periods of time. For these reasons, the GDG agreed that a recommendation for retesting every 3 years in children and young people was warranted, based on expert opinion, so as not to miss the development of NAFLD.
National Institute for Health and Care Excellence 2016
NAFLD
Diagnosis of NAFLD
82
Trade-off between net clinical effects and costs
No relevant published economic evaluations were identified.
Original cost-utility analysis was conducted for this guideline to address the questions in this review and also Chapters 5, 7 and 8.
This analysis found that FLI was the most cost-effective of the 8 diagnostic tests and 2 non-testing strategies being compared for adults, followed by ultrasound, MRS and MRI. The GDG noted that the cost-effectiveness of all the tests was similar, as the overall difference in future health (in QALYs) for a person following the addition of testing with 1 or other of these different tests was small. A probabilistic sensitivity analysis showed that 5 of the 8 tests (along with not testing and not treating anyone for NAFLD) could be the preferred strategy within the bounds of 95% confidence. The probabilistic sensitivity analysis conducted showed FLI was the preferred option in 34% of simulations for metabolic syndrome with 6 years retesting, with MRI being preferred in 26% and no testing being most cost-effective in 15%.
The model showed that the difference in the cost-effectiveness of different retesting intervals was small, but 6-yearly retesting was favoured for the base case (ICERs for people with type 2 diabetes: £13,538 per QALY gained for 6-yearly retesting compared to 7-yearly retesting, but £66,451 per QALY gained for 5-yearly testing compared to 6-yearly testing; with similar figures for metabolic syndrome).
The GDG noted that the cost of conducting FLI is very small, and the difference in costs between strategies largely consists of the treatments given and additional further tests undertaken by people after they are diagnosed with NAFLD. The average health benefit per person is also small. However, the model does assume in the no testing strategy that, not only are people not tested at the start, but they will not be tested for NAFLD, advanced fibrosis or cirrhosis at any later stage, and they will not need to receive any treatment (and so incur any cost) unless and until they reach the stage of symptomatic decompensated cirrhosis. This is likely to be a cautious assumption, diminishing the effectiveness of testing compared to no testing.
The GDG also considered the practical feasibility of offering alternative diagnostic tests. The GDG noted that FLI could be easily conducted by GPs in primary care, without referring individuals to secondary care for initial testing. In contrast, ultrasound is not routinely accessible in most primary care practices, and so a recommendation to use ultrasound for diagnosis would require the referral of a very large number of people to secondary services. Since such services do not currently have spare ultrasound capacity, this would require a large upfront increase in ultrasound equipment and personnel in order to fulfil such a recommendation. MRI has the same disadvantages, but more so, as an upfront increase in capacity would be even more expensive. In addition, it is likely that some people would either be unwilling to be referred or would not take up their appointment in secondary care, and so a strategy where consultation and testing can be conducted in a GP surgery within a single visit is likely to maximise the number of people taking up the offer of diagnostic testing. Therefore, not only is FLI the most cost-effective of the diagnostic tests, it would also be the easiest to practically implement.
The GDG explored the robustness of the results of the original economic analysis by conducting extensive sensitivity analyses.
The base case assumes a very modest benefit from a lifestyle modification programme (see Chapter 13), involving a benefit to quality of life during the year of the intervention, but no lasting benefit. The effect of not offering lifestyle modification was modelled, and testing was still preferred to no testing. It was noted that a similar programme would probably be already offered to patients with the
National Institute for Health and Care Excellence 2016
NAFLD
Diagnosis of NAFLD
83
underlying condition and no NAFLD. However, the GDG considered that the current national uptake of such advice is poor and the GDG considered that people are more likely to take up a lifestyle modification intervention if they are also diagnosed having NAFLD and, in addition, benefit more from it.
In the base case, it was assumed that people offered a test would not require an additional GP appointment since this could be conducted during a routine appointment as part of the management of their underlying condition (such as type 2 diabetes). However, this was tested by adding in the cost of an additional appointment in each testing cycle for people receiving diagnostic tests to take into account the extra time needed to discuss the purpose, benefits and limitations of NAFLD testing with the patient. This made a small difference to overall costs but did not alter the order of ranking of the strategies.
The parameter of NAFLD prevalence in every risk factor group was also discussed since there was a recorded variation in its values depending on the selected source. In order to avoid using contradictory prevalence data, a single source, which reported data for all risk factors, was selected. However, it was noted that although the true values of this parameter could be indeed lower or higher, the effect of lowering or increasing the prevalence on the results was small to moderate.
The GDG also noted the relatively high proportion of deaths of people in the model from liver-related causes. The GDG believe this is consistent with recent studies following up the causes of death of people with NAFLD,13,44,232 but was aware that this is a higher death rate than is typically reported in national mortality statistics. The GDG believe that this is likely to be due to systematic underreporting of liver problems as a cause of death, combined with a higher rate of death from liver-related causes in people with type 2 diabetes than in the general population (2.5 times the average rate36). Additionally, the fact that deaths from liver-related causes continue to rise, whilst deaths from other causes (notably cardiovascular disease) continue to fall; this model predicts that deaths from liver-related causes will continue to rise in the future. The GDG was also aware that people with NAFLD typically have a higher risk of death from cardiovascular causes than the general population (HR 1.55 according to 1 recent study44). As the rates of other (not liver-related) death in this model were taken from the general (age-related) population, these may underestimate the risk of other-cause death. To test the possible impact of these factors, sensitivity analyses were undertaken decreasing liver-related mortality rates; increasing other-cause mortality rates; decreasing the progression of people from each stage of NAFLD or fibrosis to the next, thus lowering the number of people with cirrhosis and so dying from cirrhosis; and combinations of these. Only when the transition from advanced fibrosis to cirrhosis was decreased by half did no testing become cost-effective compared to testing.
Finally, the GDG noted that the age for starting the model was set at 45 in the base case, in line with the average age of people receiving diagnostic tests in the studies included in the clinical review of accuracy of the diagnostic tests. However, this may be lower than would be expected for people with metabolic syndrome or type 2 diabetes. The NICE Type 2 diabetes guideline NG28 used an age of average diagnosis for type 2 diabetes of 57.8 years. If the starting age is increased in the economic model, testing (using FLI) becomes decreasingly cost-effective compared to no testing. The ICER for FLI compared to no testing at 58 years is £17,514 per QALY gained. If additional variations are made to the model favouring no testing (such as increasing the number of GP appointments or removing the effect of lifestyle modification), then that increases this ICER further, and makes FLI less cost-effective. In considering these analyses, the GDG noted that testing is cost-effective at a
National Institute for Health and Care Excellence 2016
NAFLD
Diagnosis of NAFLD
84
threshold of £20,000 per QALY under the base case conditions it pre-specified, but not under all sensitivity analyses; in particular, if the average age of people when first tested was to be increased to 58 or higher while also removing the lifestyle modification intervention from the patient pathway. As a result, the GDG cannot be absolutely sure if a strategy of testing everyone with type 2 diabetes or metabolic syndrome for NAFLD would be cost-effective for those specific populations. Therefore, due to the variation in the cost-effectiveness results for all tests under these scenarios and the pre-specified uncertainty in the underlying evidence base (FLI diagnostic accuracy, including uncertainty in the specificity), testing for NAFLD was not recommended.
No economic analysis was conducted relating to children and young people under 18 years due to a lack of data on the diagnostic accuracy of tests for NAFLD in under 18s. However, the GDG noted that children and young people have a longer potential life ahead of them, and hence successful treatment due to early identification would be expected to lead to a greater potential future benefit in terms of QALYs gained compared to adults. Combined with the considerations noted above of potential faster progression of liver disease in this group, the GDG considered that this was likely to make it cost-effective to retest children and young people at risk of NAFLD more frequently than for adults.
Quality of evidence Many of the included studies included large numbers of people with NAFLD, although the quality of the assessed evidence was all low or very low by GRADE criteria. Much of the evidence was assessed as being at serious or very serious risk of bias due to issues with patient selection, unclear reporting on whether the index test results were interpreted without knowledge of biopsy findings, lack of pre-specified thresholds for the index tests and unclear timing between index test and biopsy. Further adding to the downgrading of the evidence was the imprecision around the effects and heterogeneity of results.
In addition, the GDG observed that the identified studies used a range of thresholds to maximise diagnostic accuracy within their study populations, with the thresholds rarely pre-specified. This may reflect that some of the diagnostic methods being assessed are relatively new technologies, which operators are still learning to use and for which normal ranges have not yet fully been defined. The following ranges of thresholds were used for each test:
When diagnosing steatosis greater than or equal to 5%: CAP: 219–289 dB/m (median 250); FLI: 60–79; MRI: 0–5.7 % (median 3.42); MRS: 1.8–4.73 (median 2.6); NAFLD-LFS: 0.16; SteatoTest: 0.38; ultrasound: unclear threshold interpretations.
When diagnosing steatosis greater than or equal to 30%: CAP: 230–311 dB/m (medians 285 and 288); FLI: 82–93.9; MRI: 6.5 %; MRS: 2.7–10.2 (median 7.7); NAFLD-LFS: 0.16; SteatoTest: 0.69–0.94; ultrasound: unclear threshold interpretations.
The original economic analysis developed for this guideline was of high quality, being directly applicable and with minor limitations.
Other considerations Although there are many causes for steatosis and consequently a potentially wide differential diagnosis in practice, the principal differential is between primary, metabolic syndrome-related NAFLD and alcohol-related liver disease. Discriminating these is reliant upon a detailed history and seeking corroboration from family members where available to ensure that any history of occult excessive alcohol consumption is excluded. Ethanol consumption below a threshold determined by the prevailing low risk drinking advice in a country (possibly in line with WHO
National Institute for Health and Care Excellence 2016
NAFLD
Diagnosis of NAFLD
85
descriptions of hazardous drinking levels) is adopted to sustain a diagnosis of NAFLD. It was noted this guidance issued by the chief medical officer has recently changed for the UK. For people with abnormal liver blood tests and either suspected or confirmed fatty liver, alternative causes must be excluded with a detailed drug history and laboratory tests for chronic viral hepatitis (HBVsAg and HCV serology), autoimmune liver disease (ANA, AMA, SMA, LKM1 antibodies, immunoglobulins) and other treatable metabolic diseases (haemochromatosis, Wilson’s disease, coeliac disease, alpha-1 antitrypsin deficiency). The GDG agreed that it would be expected that clinicians using these guidelines would apply their clinical discretion regarding the appropriate degree of further investigation for possible alternate causes for the finding of fatty liver, based on the specific clinical scenario, before confirming a diagnosis of NAFLD.
The GDG discussed the issue of the role of liver blood tests in assessing for presence of NAFLD. Specifically, the GDG noted that even though NAFLD is a very common cause of abnormal liver blood tests, published data have demonstrated that the majority of people with NAFLD (more than70%) in fact have normal serum liver enzyme levels.20 The GDG’s shared experience was that many clinicians have the misperception that the finding of a person having normal liver blood tests is incompatible with them having NAFLD. The GDG agreed it was important to emphasise in the recommendations that clinicians should not rely on liver blood tests to rule out NAFLD.
The GDG noted that, although alcohol-related liver disease is considered to be rare in children and young people, the risks of alcohol intake should still be considered in a paediatric population and should be part of the clinical consultation; therefore, hazardous drinking should be taken into account when diagnosing NAFLD.
Research recommendation
The GDG made 3 high-priority research recommendation to; identify the most accurate non-invasive tests to diagnose NAFLD in adults, a separate research recommendation for children and young people and a further research recommendation for the diagnosis of advanced fibrosis. See Appendix Q for further details.
It was highlighted that a research recommendation that would contribute to the evidence base for a diagnosis of NAFLD in adults would potentially make the evidence base sufficiently robust to inform future updates of this guideline and would be high priority to inform the current gap in the pathway for adults.
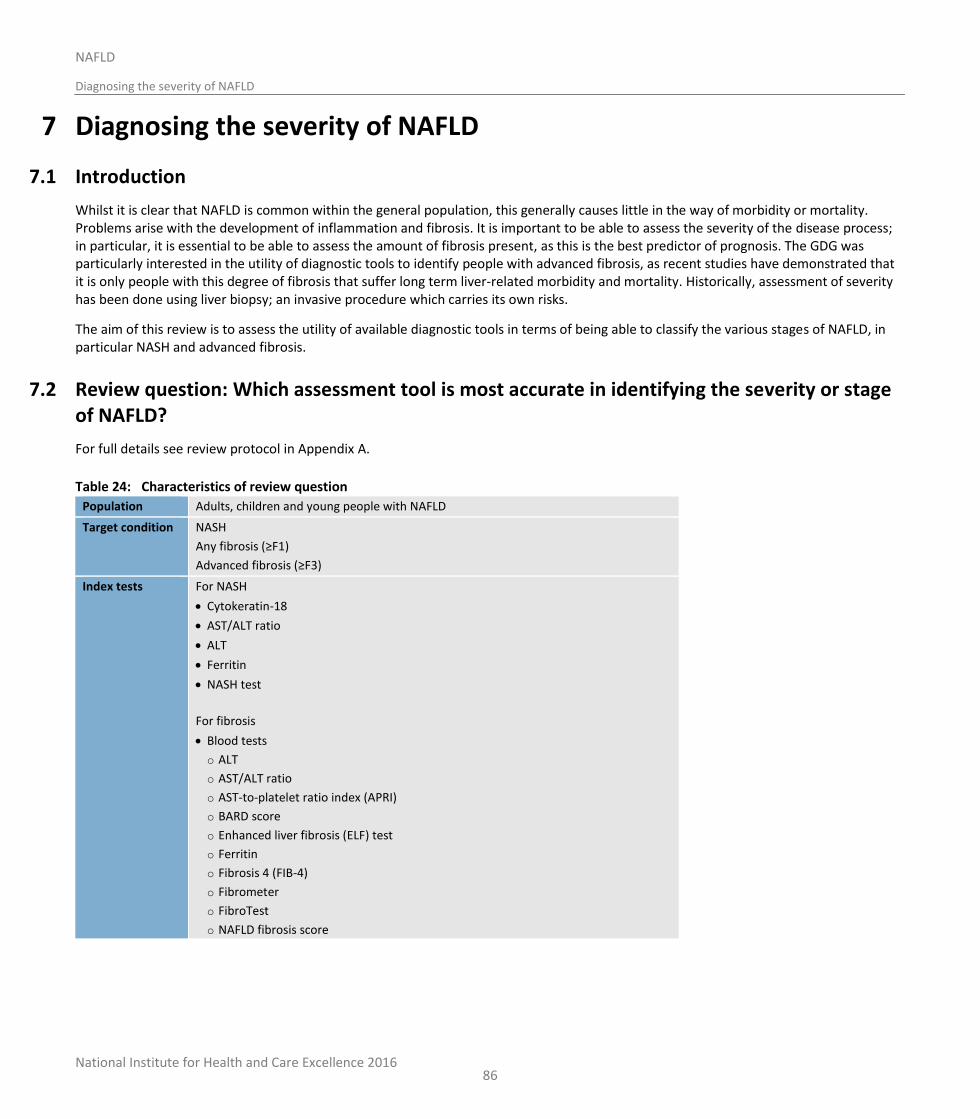
National Institute for Health and Care Excellence 2016
NAFLD
Diagnosing the severity of NAFLD
86
7 Diagnosing the severity of NAFLD
7.1 Introduction
Whilst it is clear that NAFLD is common within the general population, this generally causes little in the way of morbidity or mortality. Problems arise with the development of inflammation and fibrosis. It is important to be able to assess the severity of the disease process; in particular, it is essential to be able to assess the amount of fibrosis present, as this is the best predictor of prognosis. The GDG was particularly interested in the utility of diagnostic tools to identify people with advanced fibrosis, as recent studies have demonstrated that it is only people with this degree of fibrosis that suffer long term liver-related morbidity and mortality. Historically, assessment of severity has been done using liver biopsy; an invasive procedure which carries its own risks.
The aim of this review is to assess the utility of available diagnostic tools in terms of being able to classify the various stages of NAFLD, in particular NASH and advanced fibrosis.
7.2 Review question: Which assessment tool is most accurate in identifying the severity or stage of NAFLD?
For full details see review protocol in Appendix A.
Table 24: Characteristics of review question
Population Adults, children and young people with NAFLD
Target condition NASH
Any fibrosis (≥F1)
Advanced fibrosis (≥F3)
Index tests For NASH
Cytokeratin-18
AST/ALT ratio
ALT
Ferritin
NASH test
For fibrosis
Blood tests
o ALT
o AST/ALT ratio
o AST-to-platelet ratio index (APRI)
o BARD score
o Enhanced liver fibrosis (ELF) test
o Ferritin
o Fibrosis 4 (FIB-4)
o Fibrometer
o FibroTest
o NAFLD fibrosis score
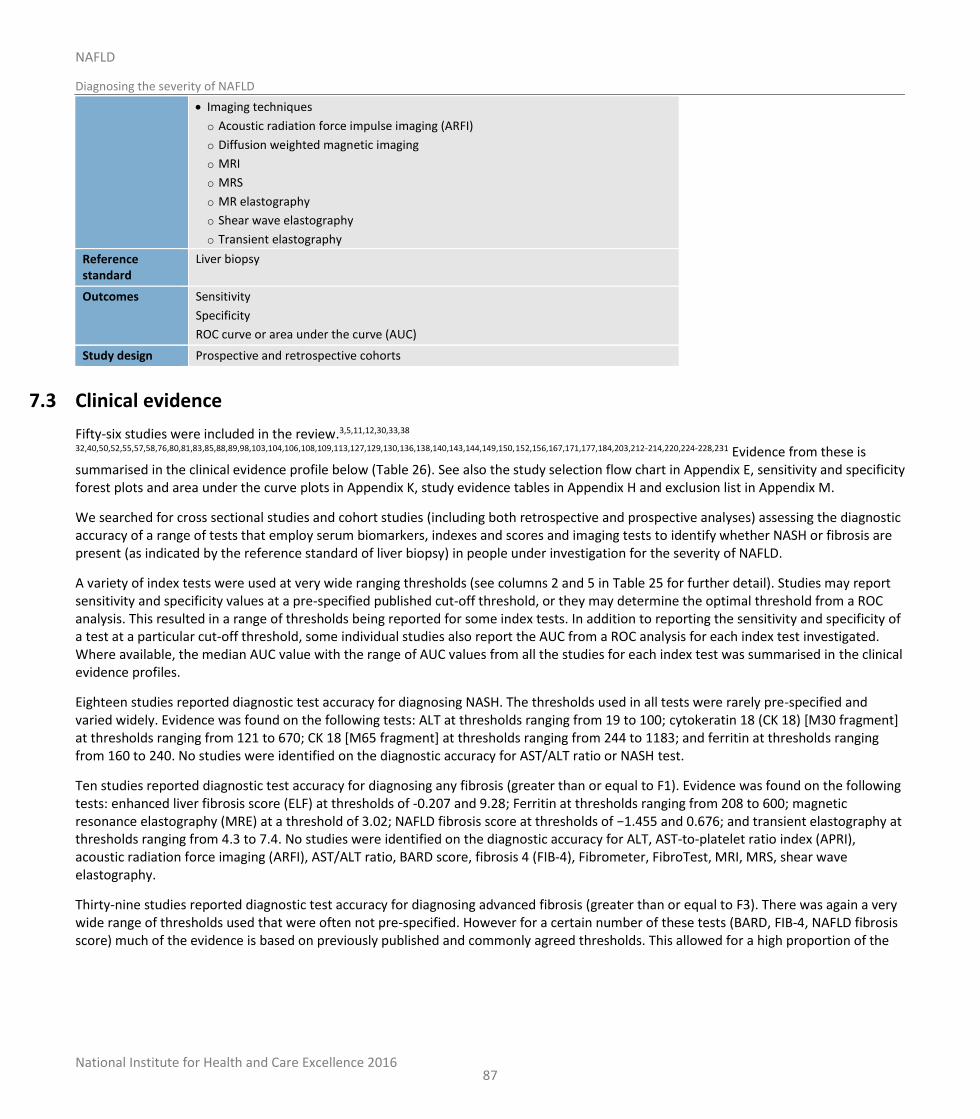
National Institute for Health and Care Excellence 2016
NAFLD
Diagnosing the severity of NAFLD
87
Imaging techniques
o Acoustic radiation force impulse imaging (ARFI)
o Diffusion weighted magnetic imaging
o MRI
o MRS
o MR elastography
o Shear wave elastography
o Transient elastography
Reference standard
Liver biopsy
Outcomes Sensitivity
Specificity
ROC curve or area under the curve (AUC)
Study design Prospective and retrospective cohorts
7.3 Clinical evidence
Fifty-six studies were included in the review.3,5,11,12,30,33,38 32,40,50,52,55,57,58,76,80,81,83,85,88,89,98,103,104,106,108,109,113,127,129,130,136,138,140,143,144,149,150,152,156,167,171,177,184,203,212-214,220,224-228,231 Evidence from these is summarised in the clinical evidence profile below (Table 26). See also the study selection flow chart in Appendix E, sensitivity and specificity forest plots and area under the curve plots in Appendix K, study evidence tables in Appendix H and exclusion list in Appendix M.
We searched for cross sectional studies and cohort studies (including both retrospective and prospective analyses) assessing the diagnostic accuracy of a range of tests that employ serum biomarkers, indexes and scores and imaging tests to identify whether NASH or fibrosis are present (as indicated by the reference standard of liver biopsy) in people under investigation for the severity of NAFLD.
A variety of index tests were used at very wide ranging thresholds (see columns 2 and 5 in Table 25 for further detail). Studies may report sensitivity and specificity values at a pre-specified published cut-off threshold, or they may determine the optimal threshold from a ROC analysis. This resulted in a range of thresholds being reported for some index tests. In addition to reporting the sensitivity and specificity of a test at a particular cut-off threshold, some individual studies also report the AUC from a ROC analysis for each index test investigated. Where available, the median AUC value with the range of AUC values from all the studies for each index test was summarised in the clinical evidence profiles.
Eighteen studies reported diagnostic test accuracy for diagnosing NASH. The thresholds used in all tests were rarely pre-specified and varied widely. Evidence was found on the following tests: ALT at thresholds ranging from 19 to 100; cytokeratin 18 (CK 18) [M30 fragment] at thresholds ranging from 121 to 670; CK 18 [M65 fragment] at thresholds ranging from 244 to 1183; and ferritin at thresholds ranging from 160 to 240. No studies were identified on the diagnostic accuracy for AST/ALT ratio or NASH test.
Ten studies reported diagnostic test accuracy for diagnosing any fibrosis (greater than or equal to F1). Evidence was found on the following tests: enhanced liver fibrosis score (ELF) at thresholds of -0.207 and 9.28; Ferritin at thresholds ranging from 208 to 600; magnetic resonance elastography (MRE) at a threshold of 3.02; NAFLD fibrosis score at thresholds of −1.455 and 0.676; and transient elastography at thresholds ranging from 4.3 to 7.4. No studies were identified on the diagnostic accuracy for ALT, AST-to-platelet ratio index (APRI), acoustic radiation force imaging (ARFI), AST/ALT ratio, BARD score, fibrosis 4 (FIB-4), Fibrometer, FibroTest, MRI, MRS, shear wave elastography.
Thirty-nine studies reported diagnostic test accuracy for diagnosing advanced fibrosis (greater than or equal to F3). There was again a very wide range of thresholds used that were often not pre-specified. However for a certain number of these tests (BARD, FIB-4, NAFLD fibrosis score) much of the evidence is based on previously published and commonly agreed thresholds. This allowed for a high proportion of the
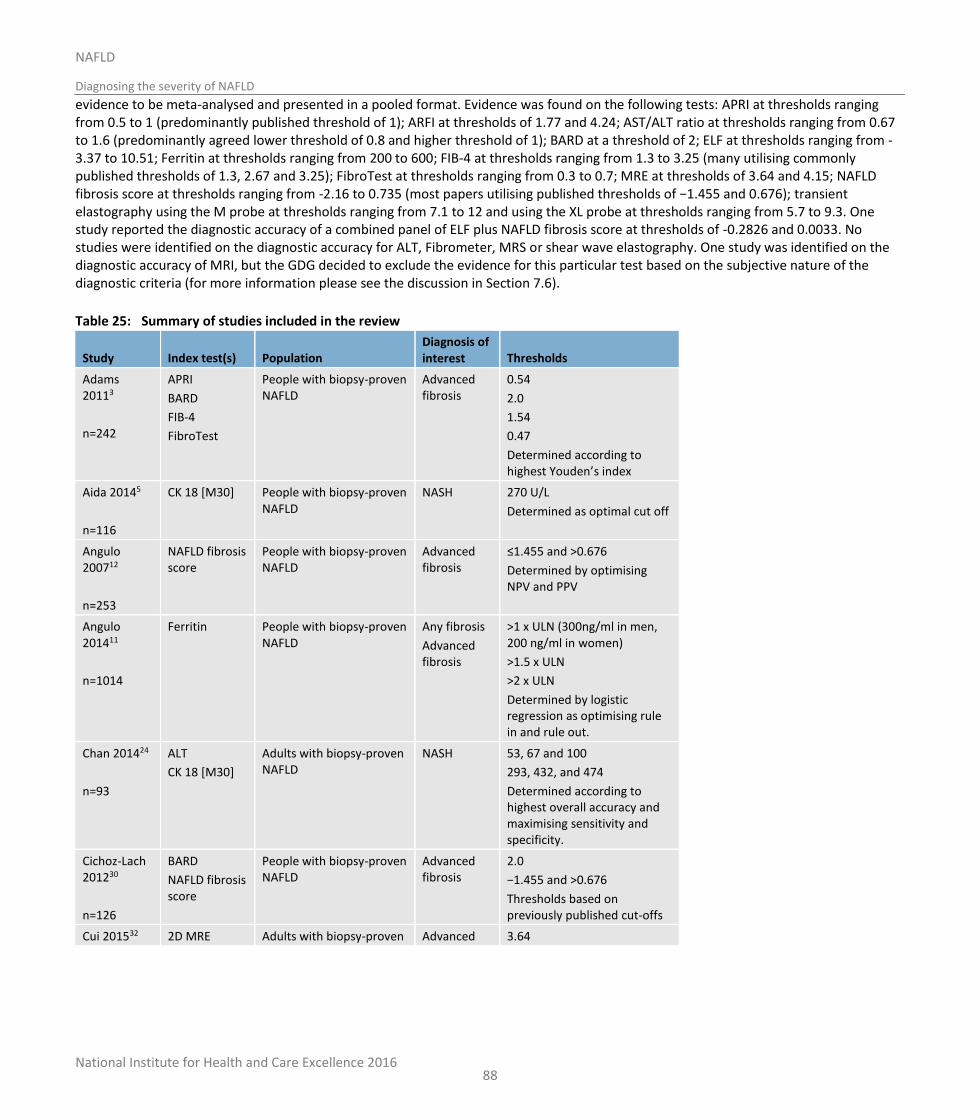
National Institute for Health and Care Excellence 2016
NAFLD
Diagnosing the severity of NAFLD
88
evidence to be meta-analysed and presented in a pooled format. Evidence was found on the following tests: APRI at thresholds ranging from 0.5 to 1 (predominantly published threshold of 1); ARFI at thresholds of 1.77 and 4.24; AST/ALT ratio at thresholds ranging from 0.67 to 1.6 (predominantly agreed lower threshold of 0.8 and higher threshold of 1); BARD at a threshold of 2; ELF at thresholds ranging from -3.37 to 10.51; Ferritin at thresholds ranging from 200 to 600; FIB-4 at thresholds ranging from 1.3 to 3.25 (many utilising commonly published thresholds of 1.3, 2.67 and 3.25); FibroTest at thresholds ranging from 0.3 to 0.7; MRE at thresholds of 3.64 and 4.15; NAFLD fibrosis score at thresholds ranging from -2.16 to 0.735 (most papers utilising published thresholds of −1.455 and 0.676); transient elastography using the M probe at thresholds ranging from 7.1 to 12 and using the XL probe at thresholds ranging from 5.7 to 9.3. One study reported the diagnostic accuracy of a combined panel of ELF plus NAFLD fibrosis score at thresholds of -0.2826 and 0.0033. No studies were identified on the diagnostic accuracy for ALT, Fibrometer, MRS or shear wave elastography. One study was identified on the diagnostic accuracy of MRI, but the GDG decided to exclude the evidence for this particular test based on the subjective nature of the diagnostic criteria (for more information please see the discussion in Section 7.6).
Table 25: Summary of studies included in the review
Study Index test(s) Population Diagnosis of interest Thresholds
Adams 20113
n=242
APRI
BARD
FIB-4
FibroTest
People with biopsy-proven NAFLD
Advanced fibrosis
0.54
2.0
1.54
0.47
Determined according to highest Youden’s index
Aida 20145
n=116
CK 18 [M30] People with biopsy-proven NAFLD
NASH 270 U/L
Determined as optimal cut off
Angulo 200712
n=253
NAFLD fibrosis score
People with biopsy-proven NAFLD
Advanced fibrosis
≤1.455 and >0.676
Determined by optimising NPV and PPV
Angulo 201411
n=1014
Ferritin People with biopsy-proven NAFLD
Any fibrosis
Advanced fibrosis
>1 x ULN (300ng/ml in men, 200 ng/ml in women)
>1.5 x ULN
>2 x ULN
Determined by logistic regression as optimising rule in and rule out.
Chan 201424
n=93
ALT
CK 18 [M30]
Adults with biopsy-proven NAFLD
NASH 53, 67 and 100
293, 432, and 474
Determined according to highest overall accuracy and maximising sensitivity and specificity.
Cichoz-Lach 201230
n=126
BARD
NAFLD fibrosis score
People with biopsy-proven NAFLD
Advanced fibrosis
2.0
−1.455 and >0.676
Thresholds based on previously published cut-offs
Cui 201532 2D MRE Adults with biopsy-proven Advanced 3.64
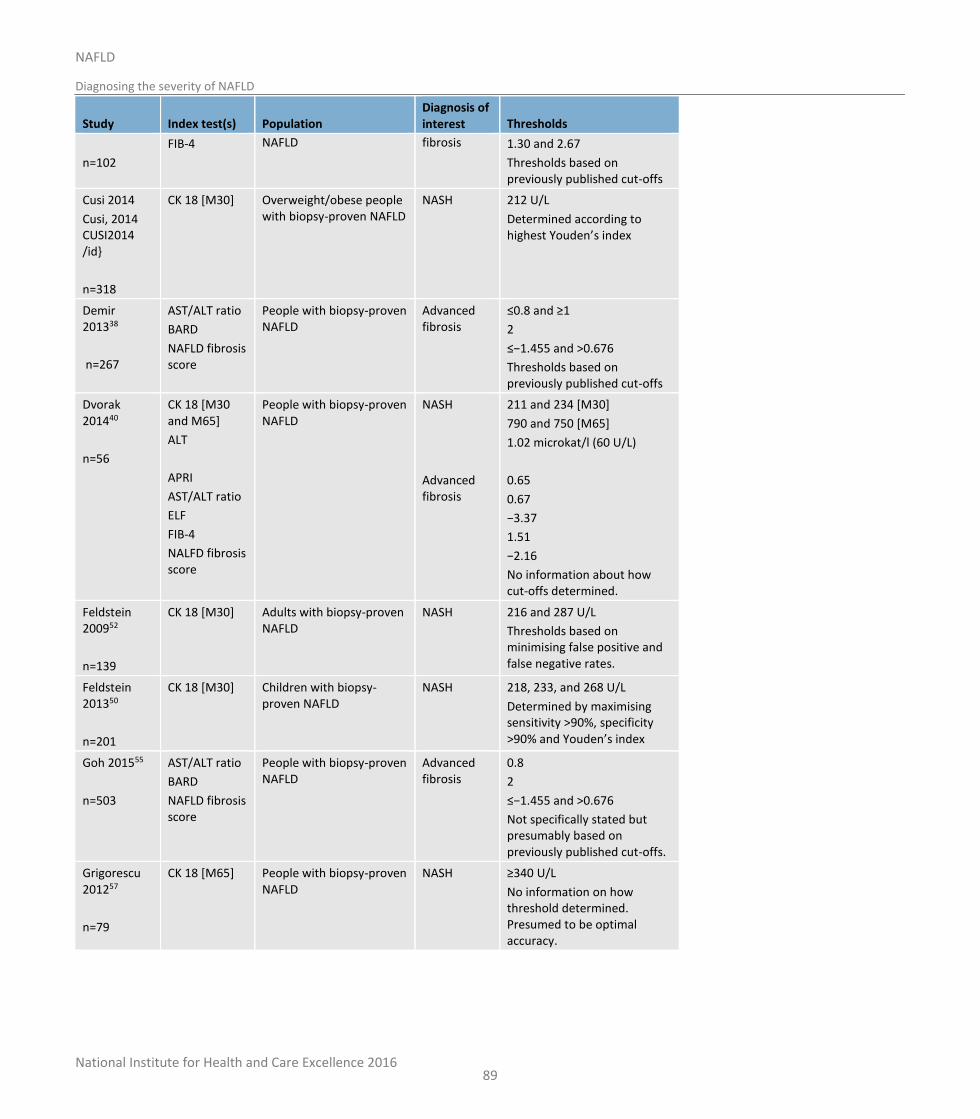
National Institute for Health and Care Excellence 2016
NAFLD
Diagnosing the severity of NAFLD
89
Study Index test(s) Population Diagnosis of interest Thresholds
n=102
FIB-4 NAFLD fibrosis 1.30 and 2.67
Thresholds based on previously published cut-offs
Cusi 2014
Cusi, 2014 CUSI2014 /id}
n=318
CK 18 [M30] Overweight/obese people with biopsy-proven NAFLD
NASH 212 U/L
Determined according to highest Youden’s index
Demir 201338
n=267
AST/ALT ratio
BARD
NAFLD fibrosis score
People with biopsy-proven NAFLD
Advanced fibrosis
≤0.8 and ≥1
2
≤−1.455 and >0.676
Thresholds based on previously published cut-offs
Dvorak 201440
n=56
CK 18 [M30 and M65]
ALT
APRI
AST/ALT ratio
ELF
FIB-4
NALFD fibrosis score
People with biopsy-proven NAFLD
NASH
Advanced fibrosis
211 and 234 [M30]
790 and 750 [M65]
1.02 microkat/l (60 U/L)
0.65
0.67
−3.37
1.51
−2.16
No information about how cut-offs determined.
Feldstein 200952
n=139
CK 18 [M30] Adults with biopsy-proven NAFLD
NASH 216 and 287 U/L
Thresholds based on minimising false positive and false negative rates.
Feldstein 201350
n=201
CK 18 [M30] Children with biopsy-proven NAFLD
NASH 218, 233, and 268 U/L
Determined by maximising sensitivity >90%, specificity >90% and Youden’s index
Goh 201555
n=503
AST/ALT ratio
BARD
NAFLD fibrosis score
People with biopsy-proven NAFLD
Advanced fibrosis
0.8
2
≤−1.455 and >0.676
Not specifically stated but presumably based on previously published cut-offs.
Grigorescu 201257
n=79
CK 18 [M65] People with biopsy-proven NAFLD
NASH ≥340 U/L
No information on how threshold determined. Presumed to be optimal accuracy.
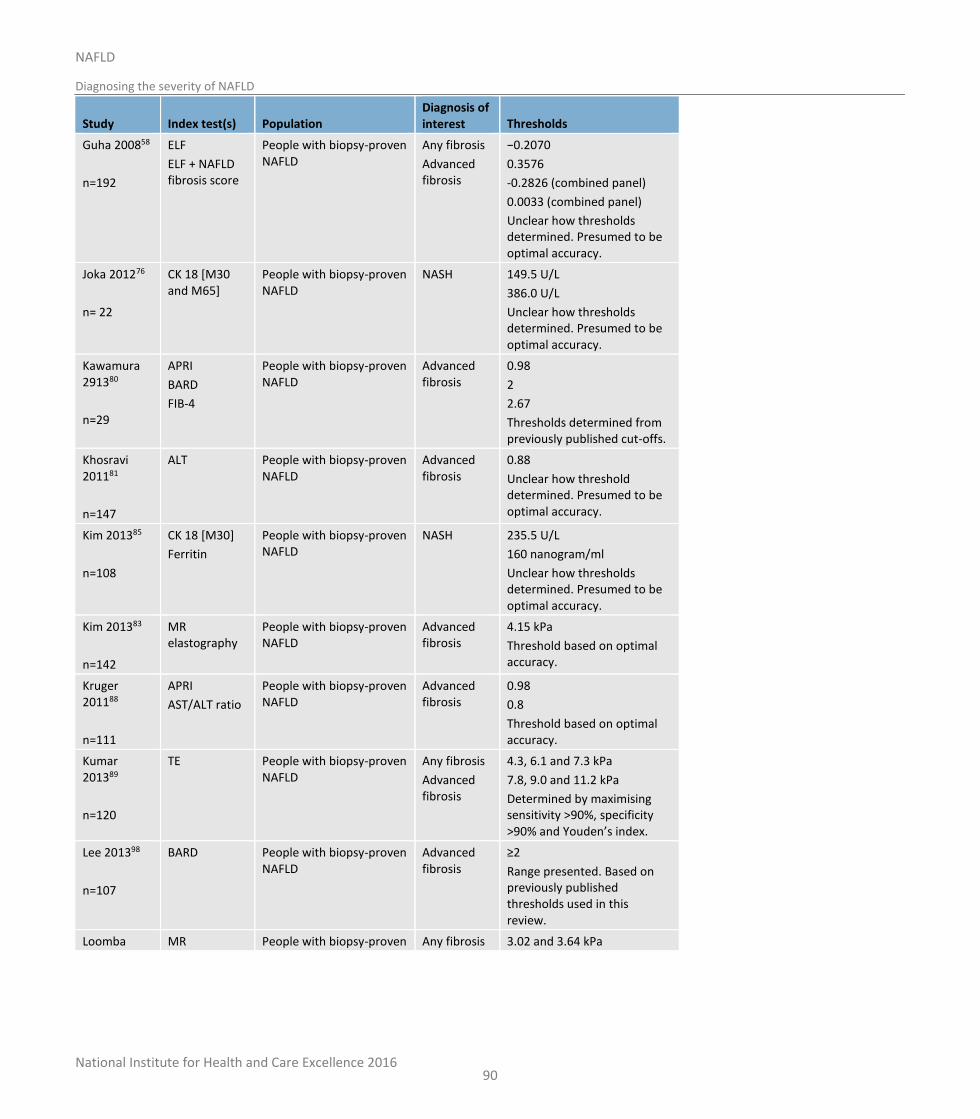
National Institute for Health and Care Excellence 2016
NAFLD
Diagnosing the severity of NAFLD
90
Study Index test(s) Population Diagnosis of interest Thresholds
Guha 200858
n=192
ELF
ELF + NAFLD fibrosis score
People with biopsy-proven NAFLD
Any fibrosis
Advanced fibrosis
−0.2070
0.3576
-0.2826 (combined panel)
0.0033 (combined panel)
Unclear how thresholds determined. Presumed to be optimal accuracy.
Joka 201276
n= 22
CK 18 [M30 and M65]
People with biopsy-proven NAFLD
NASH 149.5 U/L
386.0 U/L
Unclear how thresholds determined. Presumed to be optimal accuracy.
Kawamura 291380
n=29
APRI
BARD
FIB-4
People with biopsy-proven NAFLD
Advanced fibrosis
0.98
2
2.67
Thresholds determined from previously published cut-offs.
Khosravi 201181
n=147
ALT People with biopsy-proven NAFLD
Advanced fibrosis
0.88
Unclear how threshold determined. Presumed to be optimal accuracy.
Kim 201385
n=108
CK 18 [M30]
Ferritin
People with biopsy-proven NAFLD
NASH
235.5 U/L
160 nanogram/ml
Unclear how thresholds determined. Presumed to be optimal accuracy.
Kim 201383
n=142
MR elastography
People with biopsy-proven NAFLD
Advanced fibrosis
4.15 kPa
Threshold based on optimal accuracy.
Kruger 201188
n=111
APRI
AST/ALT ratio
People with biopsy-proven NAFLD
Advanced fibrosis
0.98
0.8
Threshold based on optimal accuracy.
Kumar 201389
n=120
TE People with biopsy-proven NAFLD
Any fibrosis
Advanced fibrosis
4.3, 6.1 and 7.3 kPa
7.8, 9.0 and 11.2 kPa
Determined by maximising sensitivity >90%, specificity >90% and Youden’s index.
Lee 201398
n=107
BARD People with biopsy-proven NAFLD
Advanced fibrosis
≥2
Range presented. Based on previously published thresholds used in this review.
Loomba MR People with biopsy-proven Any fibrosis 3.02 and 3.64 kPa
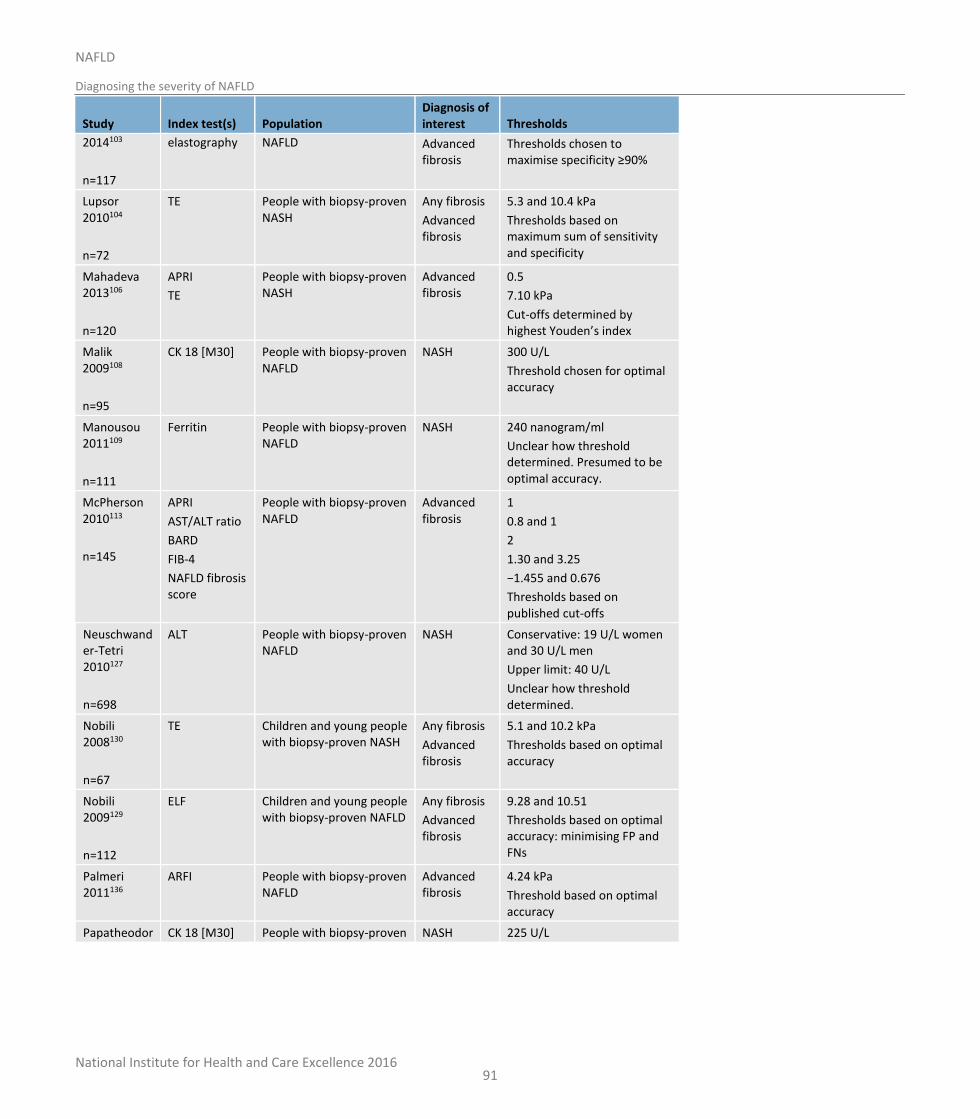
National Institute for Health and Care Excellence 2016
NAFLD
Diagnosing the severity of NAFLD
91
Study Index test(s) Population Diagnosis of interest Thresholds
2014103
n=117
elastography NAFLD Advanced fibrosis
Thresholds chosen to maximise specificity ≥90%
Lupsor 2010104
n=72
TE People with biopsy-proven NASH
Any fibrosis
Advanced fibrosis
5.3 and 10.4 kPa
Thresholds based on maximum sum of sensitivity and specificity
Mahadeva 2013106
n=120
APRI
TE
People with biopsy-proven NASH
Advanced fibrosis
0.5
7.10 kPa
Cut-offs determined by highest Youden’s index
Malik 2009108
n=95
CK 18 [M30] People with biopsy-proven NAFLD
NASH 300 U/L
Threshold chosen for optimal accuracy
Manousou 2011109
n=111
Ferritin People with biopsy-proven NAFLD
NASH 240 nanogram/ml
Unclear how threshold determined. Presumed to be optimal accuracy.
McPherson 2010113
n=145
APRI
AST/ALT ratio
BARD
FIB-4
NAFLD fibrosis score
People with biopsy-proven NAFLD
Advanced fibrosis
1
0.8 and 1
2
1.30 and 3.25
−1.455 and 0.676
Thresholds based on published cut-offs
Neuschwander-Tetri 2010127
n=698
ALT People with biopsy-proven NAFLD
NASH Conservative: 19 U/L women and 30 U/L men
Upper limit: 40 U/L
Unclear how threshold determined.
Nobili 2008130
n=67
TE Children and young people with biopsy-proven NASH
Any fibrosis
Advanced fibrosis
5.1 and 10.2 kPa
Thresholds based on optimal accuracy
Nobili 2009129
n=112
ELF Children and young people with biopsy-proven NAFLD
Any fibrosis
Advanced fibrosis
9.28 and 10.51
Thresholds based on optimal accuracy: minimising FP and FNs
Palmeri 2011136
ARFI People with biopsy-proven NAFLD
Advanced fibrosis
4.24 kPa
Threshold based on optimal accuracy
Papatheodor CK 18 [M30] People with biopsy-proven NASH 225 U/L
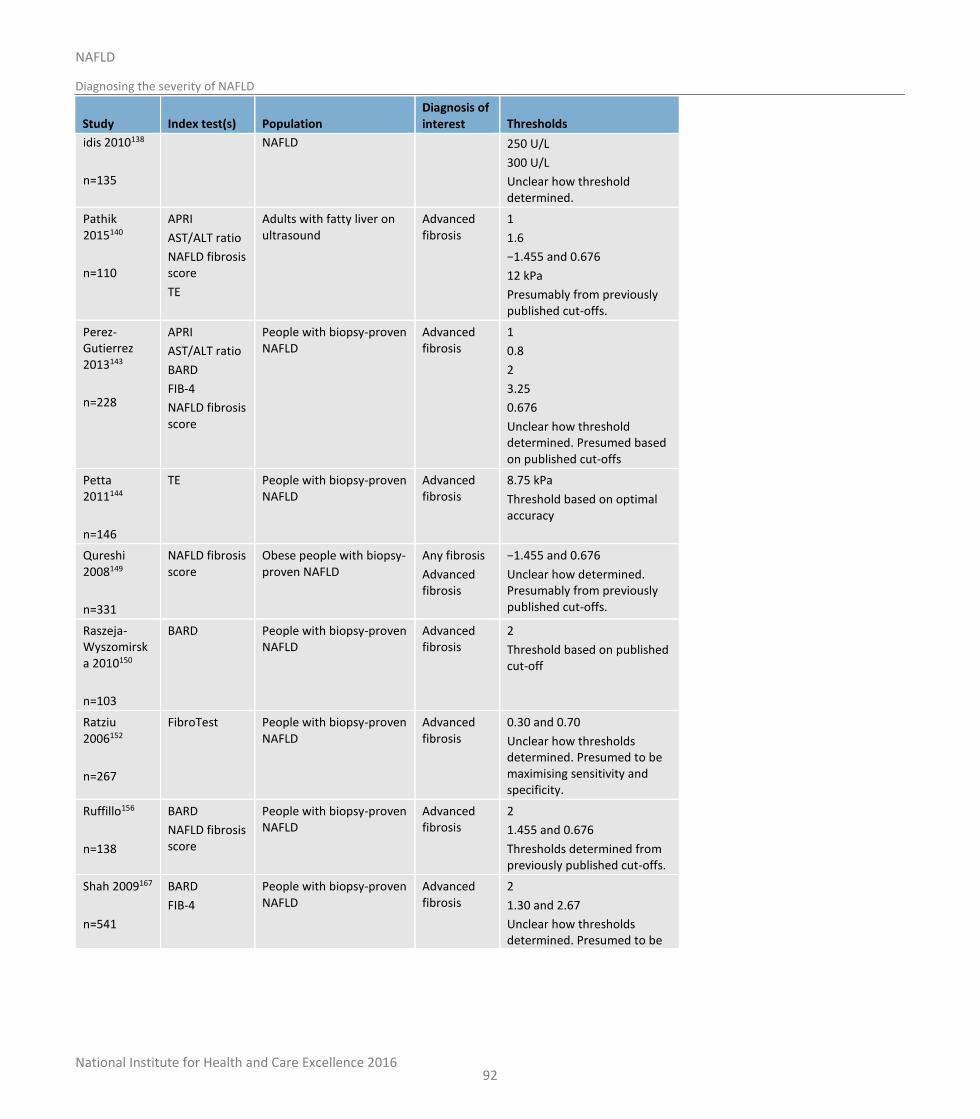
National Institute for Health and Care Excellence 2016
NAFLD
Diagnosing the severity of NAFLD
92
Study Index test(s) Population Diagnosis of interest Thresholds
idis 2010138
n=135
NAFLD 250 U/L
300 U/L
Unclear how threshold determined.
Pathik 2015140
n=110
APRI
AST/ALT ratio
NAFLD fibrosis score
TE
Adults with fatty liver on ultrasound
Advanced fibrosis
1
1.6
−1.455 and 0.676
12 kPa
Presumably from previously published cut-offs.
Perez-Gutierrez 2013143
n=228
APRI
AST/ALT ratio
BARD
FIB-4
NAFLD fibrosis score
People with biopsy-proven NAFLD
Advanced fibrosis
1
0.8
2
3.25
0.676
Unclear how threshold determined. Presumed based on published cut-offs
Petta 2011144
n=146
TE People with biopsy-proven NAFLD
Advanced fibrosis
8.75 kPa
Threshold based on optimal accuracy
Qureshi 2008149
n=331
NAFLD fibrosis score
Obese people with biopsy-proven NAFLD
Any fibrosis
Advanced fibrosis
−1.455 and 0.676
Unclear how determined. Presumably from previously published cut-offs.
Raszeja-Wyszomirska 2010150
n=103
BARD People with biopsy-proven NAFLD
Advanced fibrosis
2
Threshold based on published cut-off
Ratziu 2006152
n=267
FibroTest People with biopsy-proven NAFLD
Advanced fibrosis
0.30 and 0.70
Unclear how thresholds determined. Presumed to be maximising sensitivity and specificity.
Ruffillo156
n=138
BARD
NAFLD fibrosis score
People with biopsy-proven NAFLD
Advanced fibrosis
2
1.455 and 0.676
Thresholds determined from previously published cut-offs.
Shah 2009167
n=541
BARD
FIB-4
People with biopsy-proven NAFLD
Advanced fibrosis
2
1.30 and 2.67
Unclear how thresholds determined. Presumed to be
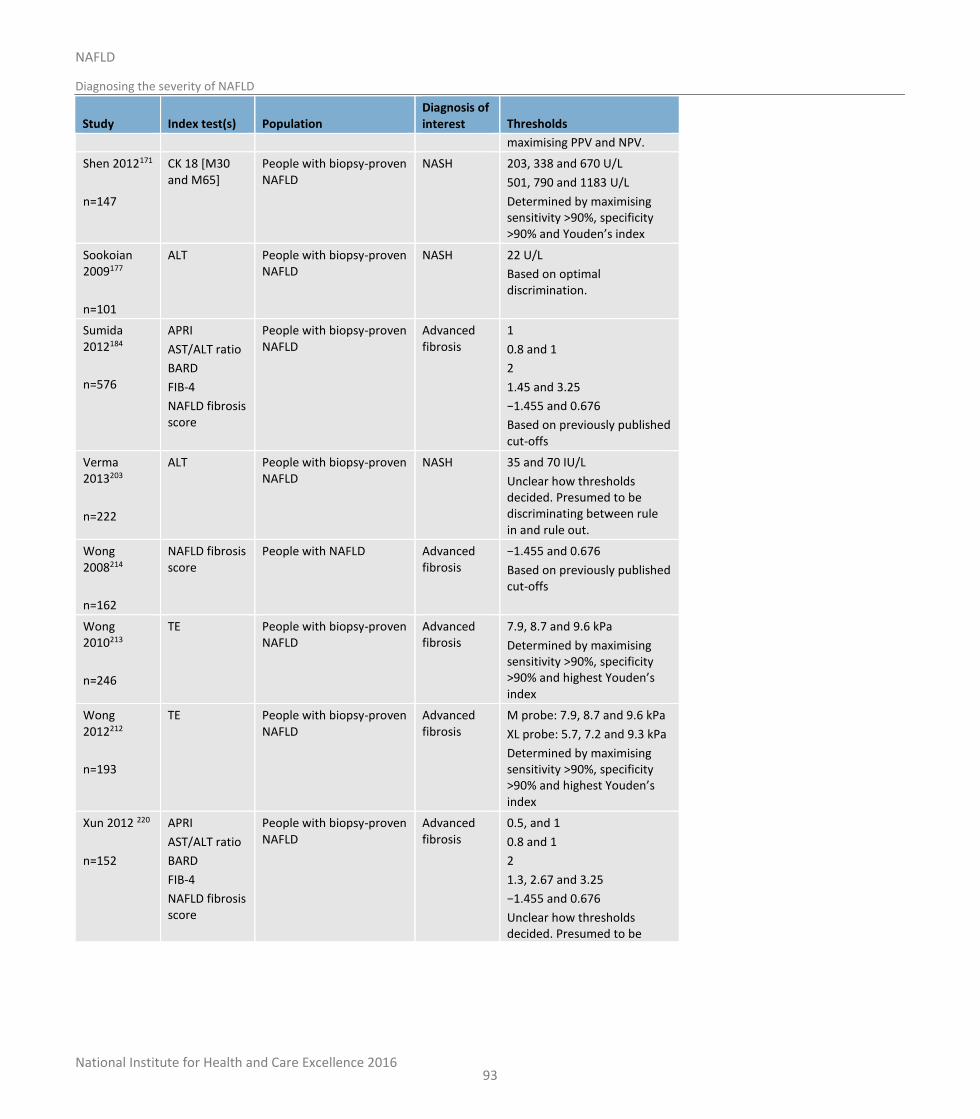
National Institute for Health and Care Excellence 2016
NAFLD
Diagnosing the severity of NAFLD
93
Study Index test(s) Population Diagnosis of interest Thresholds
maximising PPV and NPV.
Shen 2012171
n=147
CK 18 [M30 and M65]
People with biopsy-proven NAFLD
NASH 203, 338 and 670 U/L
501, 790 and 1183 U/L
Determined by maximising sensitivity >90%, specificity >90% and Youden’s index
Sookoian 2009177
n=101
ALT People with biopsy-proven NAFLD
NASH 22 U/L
Based on optimal discrimination.
Sumida 2012184
n=576
APRI
AST/ALT ratio
BARD
FIB-4
NAFLD fibrosis score
People with biopsy-proven NAFLD
Advanced fibrosis
1
0.8 and 1
2
1.45 and 3.25
−1.455 and 0.676
Based on previously published cut-offs
Verma 2013203
n=222
ALT People with biopsy-proven NAFLD
NASH
35 and 70 IU/L
Unclear how thresholds decided. Presumed to be discriminating between rule in and rule out.
Wong 2008214
n=162
NAFLD fibrosis score
People with NAFLD Advanced fibrosis
−1.455 and 0.676
Based on previously published cut-offs
Wong 2010213
n=246
TE People with biopsy-proven NAFLD
Advanced fibrosis
7.9, 8.7 and 9.6 kPa
Determined by maximising sensitivity >90%, specificity >90% and highest Youden’s index
Wong 2012212
n=193
TE People with biopsy-proven NAFLD
Advanced fibrosis
M probe: 7.9, 8.7 and 9.6 kPa
XL probe: 5.7, 7.2 and 9.3 kPa
Determined by maximising sensitivity >90%, specificity >90% and highest Youden’s index
Xun 2012 220
n=152
APRI
AST/ALT ratio
BARD
FIB-4
NAFLD fibrosis score
People with biopsy-proven NAFLD
Advanced fibrosis
0.5, and 1
0.8 and 1
2
1.3, 2.67 and 3.25
−1.455 and 0.676
Unclear how thresholds decided. Presumed to be
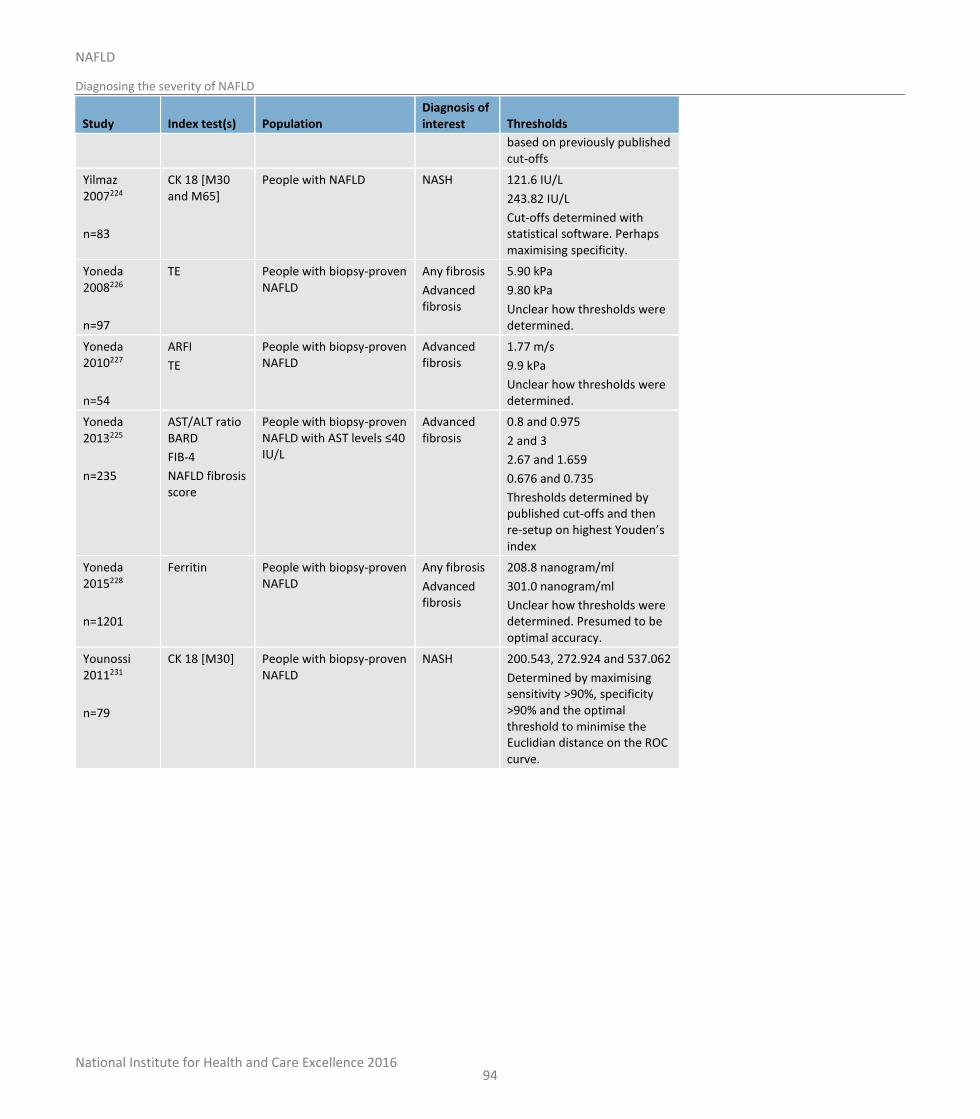
National Institute for Health and Care Excellence 2016
NAFLD
Diagnosing the severity of NAFLD
94
Study Index test(s) Population Diagnosis of interest Thresholds
based on previously published cut-offs
Yilmaz 2007224
n=83
CK 18 [M30 and M65]
People with NAFLD NASH 121.6 IU/L
243.82 IU/L
Cut-offs determined with statistical software. Perhaps maximising specificity.
Yoneda 2008226
n=97
TE People with biopsy-proven NAFLD
Any fibrosis
Advanced fibrosis
5.90 kPa
9.80 kPa
Unclear how thresholds were determined.
Yoneda 2010227
n=54
ARFI
TE
People with biopsy-proven NAFLD
Advanced fibrosis
1.77 m/s
9.9 kPa
Unclear how thresholds were determined.
Yoneda 2013225
n=235
AST/ALT ratio BARD
FIB-4
NAFLD fibrosis score
People with biopsy-proven NAFLD with AST levels ≤40 IU/L
Advanced fibrosis
0.8 and 0.975
2 and 3
2.67 and 1.659
0.676 and 0.735
Thresholds determined by published cut-offs and then re-setup on highest Youden’s index
Yoneda 2015228
n=1201
Ferritin People with biopsy-proven NAFLD
Any fibrosis
Advanced fibrosis
208.8 nanogram/ml
301.0 nanogram/ml
Unclear how thresholds were determined. Presumed to be optimal accuracy.
Younossi 2011231
n=79
CK 18 [M30] People with biopsy-proven NAFLD
NASH 200.543, 272.924 and 537.062
Determined by maximising sensitivity >90%, specificity >90% and the optimal threshold to minimise the Euclidian distance on the ROC curve.
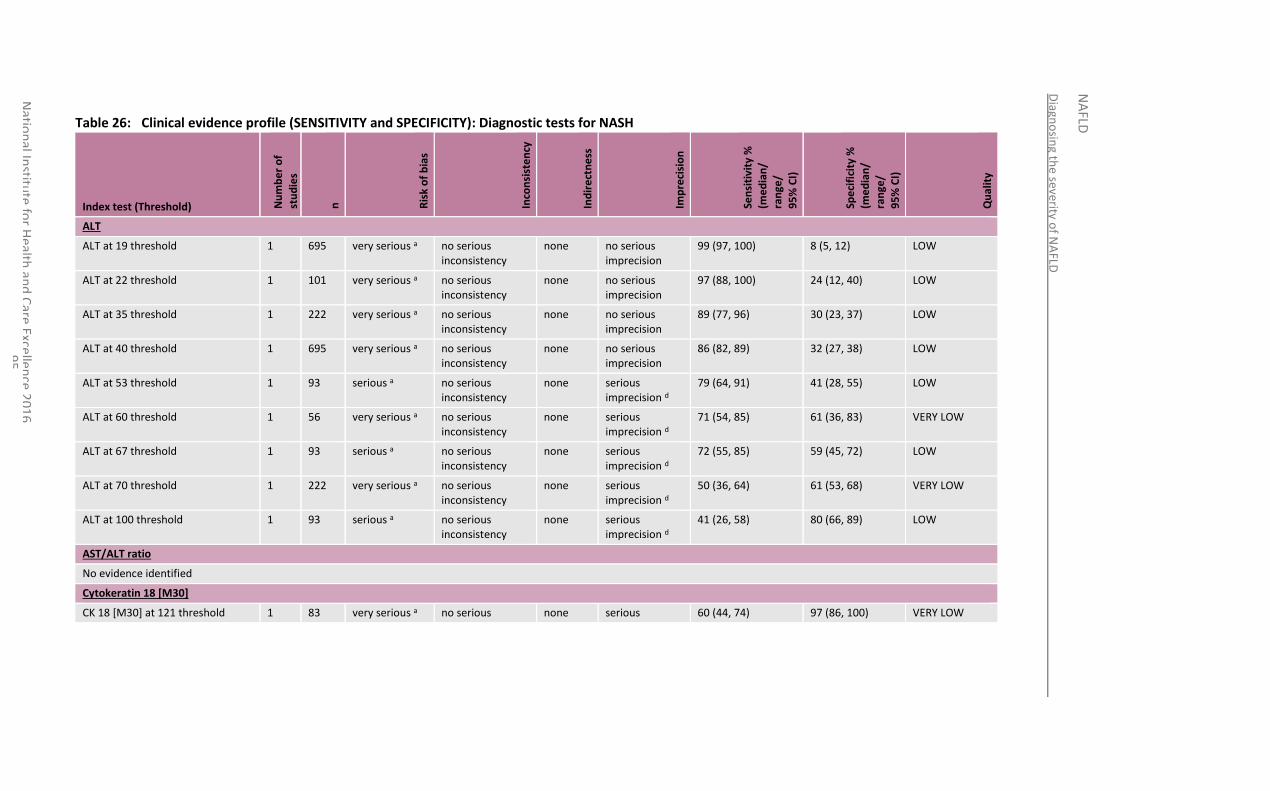
Diagn
osin
g the severity o
f NA
FLD
NA
FLD
Natio
nal In
stitute
for H
ealth an
d C
are Excellen
ce 20
16
9
5
Table 26: Clinical evidence profile (SENSITIVITY and SPECIFICITY): Diagnostic tests for NASH
Index test (Threshold) Nu
mb
er
of
stu
die
s
n
Ris
k o
f b
ias
Inco
nsi
ste
ncy
Ind
ire
ctn
ess
Imp
reci
sio
n
Sen
siti
vity
%
(me
dia
n/
ran
ge/
95
% C
I)
Spe
cifi
city
%
(me
dia
n/
ran
ge/
95
% C
I)
Qu
alit
y
ALT
ALT at 19 threshold 1 695 very serious a no serious inconsistency
none no serious imprecision
99 (97, 100) 8 (5, 12) LOW
ALT at 22 threshold 1 101 very serious a no serious inconsistency
none no serious imprecision
97 (88, 100) 24 (12, 40) LOW
ALT at 35 threshold 1 222 very serious a no serious inconsistency
none no serious imprecision
89 (77, 96) 30 (23, 37) LOW
ALT at 40 threshold 1 695 very serious a no serious inconsistency
none no serious imprecision
86 (82, 89) 32 (27, 38) LOW
ALT at 53 threshold 1 93 serious a no serious inconsistency
none serious imprecision d
79 (64, 91) 41 (28, 55) LOW
ALT at 60 threshold 1 56 very serious a no serious inconsistency
none serious imprecision d
71 (54, 85) 61 (36, 83) VERY LOW
ALT at 67 threshold 1 93 serious a no serious inconsistency
none serious imprecision d
72 (55, 85) 59 (45, 72) LOW
ALT at 70 threshold 1 222 very serious a no serious inconsistency
none serious imprecision d
50 (36, 64) 61 (53, 68) VERY LOW
ALT at 100 threshold 1 93 serious a no serious inconsistency
none serious imprecision d
41 (26, 58) 80 (66, 89) LOW
AST/ALT ratio
No evidence identified
Cytokeratin 18 [M30]
CK 18 [M30] at 121 threshold 1 83 very serious a no serious none serious 60 (44, 74) 97 (86, 100) VERY LOW
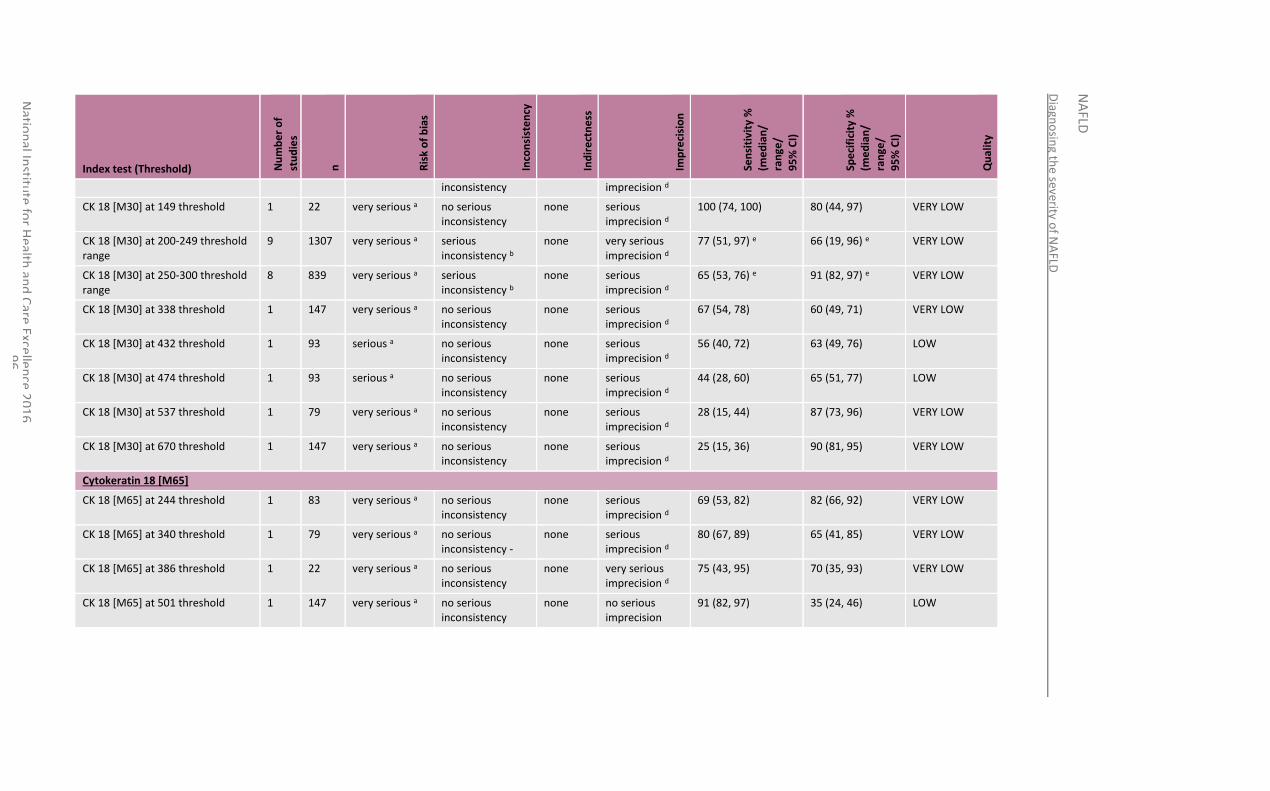
Diagn
osin
g the severity o
f NA
FLD
NA
FLD
Natio
nal In
stitute
for H
ealth an
d C
are Excellen
ce 20
16
9
6
Index test (Threshold) Nu
mb
er
of
stu
die
s
n
Ris
k o
f b
ias
Inco
nsi
ste
ncy
Ind
ire
ctn
ess
Imp
reci
sio
n
Sen
siti
vity
%
(me
dia
n/
ran
ge/
95
% C
I)
Spe
cifi
city
%
(me
dia
n/
ran
ge/
95
% C
I)
Qu
alit
y
inconsistency imprecision d
CK 18 [M30] at 149 threshold 1 22 very serious a no serious inconsistency
none serious imprecision d
100 (74, 100) 80 (44, 97) VERY LOW
CK 18 [M30] at 200-249 threshold range
9 1307 very serious a serious inconsistency b
none very serious imprecision d
77 (51, 97) e 66 (19, 96) e VERY LOW
CK 18 [M30] at 250-300 threshold range
8 839 very serious a serious inconsistency b
none serious imprecision d
65 (53, 76) e 91 (82, 97) e VERY LOW
CK 18 [M30] at 338 threshold 1 147 very serious a no serious inconsistency
none serious imprecision d
67 (54, 78) 60 (49, 71) VERY LOW
CK 18 [M30] at 432 threshold 1 93 serious a no serious inconsistency
none serious imprecision d
56 (40, 72) 63 (49, 76) LOW
CK 18 [M30] at 474 threshold 1 93 serious a no serious inconsistency
none serious imprecision d
44 (28, 60) 65 (51, 77) LOW
CK 18 [M30] at 537 threshold 1 79 very serious a no serious inconsistency
none serious imprecision d
28 (15, 44) 87 (73, 96) VERY LOW
CK 18 [M30] at 670 threshold 1 147 very serious a no serious inconsistency
none serious imprecision d
25 (15, 36) 90 (81, 95) VERY LOW
Cytokeratin 18 [M65]
CK 18 [M65] at 244 threshold 1 83 very serious a no serious inconsistency
none serious imprecision d
69 (53, 82) 82 (66, 92) VERY LOW
CK 18 [M65] at 340 threshold 1 79 very serious a no serious inconsistency -
none serious imprecision d
80 (67, 89) 65 (41, 85) VERY LOW
CK 18 [M65] at 386 threshold 1 22 very serious a no serious inconsistency
none very serious imprecision d
75 (43, 95) 70 (35, 93) VERY LOW
CK 18 [M65] at 501 threshold 1 147 very serious a no serious inconsistency
none no serious imprecision
91 (82, 97) 35 (24, 46) LOW
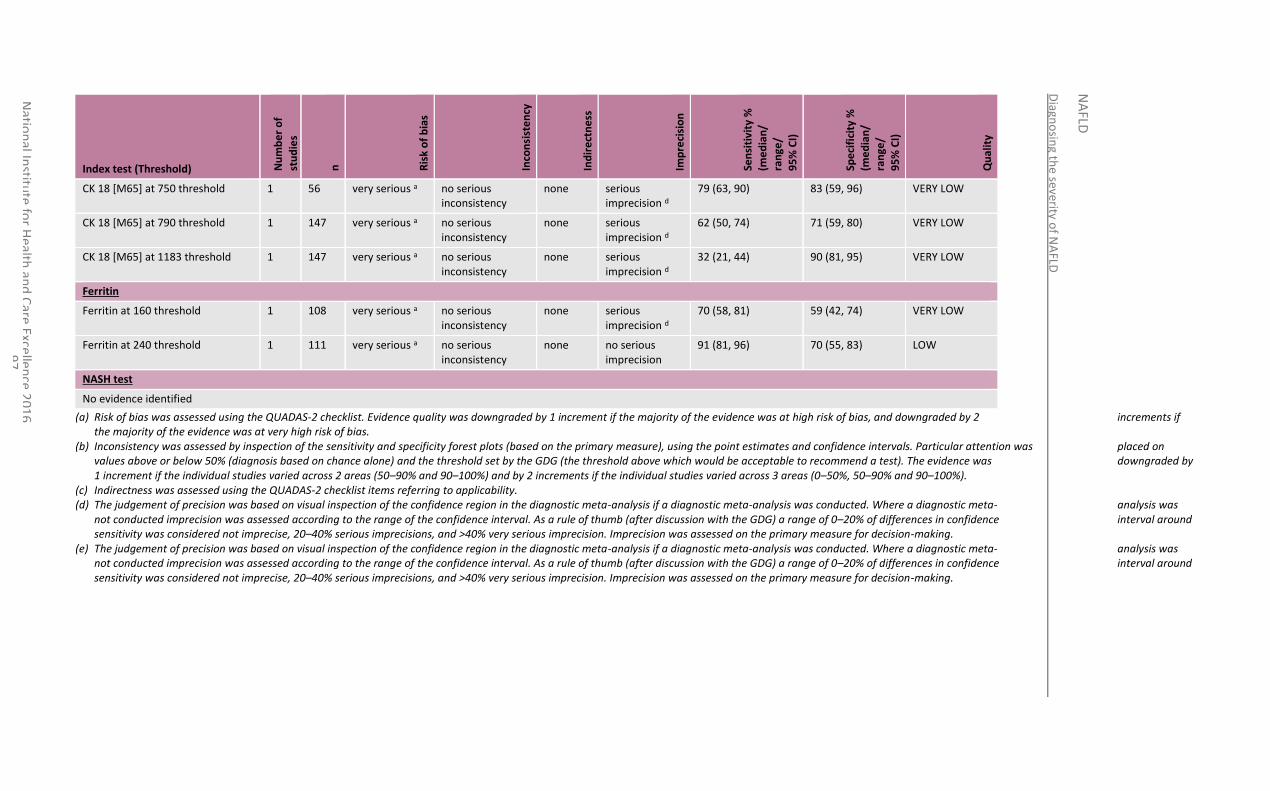
Diagn
osin
g the severity o
f NA
FLD
NA
FLD
Natio
nal In
stitute
for H
ealth an
d C
are Excellen
ce 20
16
9
7
Index test (Threshold) Nu
mb
er
of
stu
die
s
n
Ris
k o
f b
ias
Inco
nsi
ste
ncy
Ind
ire
ctn
ess
Imp
reci
sio
n
Sen
siti
vity
%
(me
dia
n/
ran
ge/
95
% C
I)
Spe
cifi
city
%
(me
dia
n/
ran
ge/
95
% C
I)
Qu
alit
y
CK 18 [M65] at 750 threshold 1 56 very serious a no serious inconsistency
none serious imprecision d
79 (63, 90) 83 (59, 96) VERY LOW
CK 18 [M65] at 790 threshold 1 147 very serious a no serious inconsistency
none serious imprecision d
62 (50, 74) 71 (59, 80) VERY LOW
CK 18 [M65] at 1183 threshold 1 147 very serious a no serious inconsistency
none serious imprecision d
32 (21, 44) 90 (81, 95) VERY LOW
Ferritin
Ferritin at 160 threshold 1 108 very serious a no serious inconsistency
none serious imprecision d
70 (58, 81) 59 (42, 74) VERY LOW
Ferritin at 240 threshold 1 111 very serious a no serious inconsistency
none no serious imprecision
91 (81, 96) 70 (55, 83) LOW
NASH test
No evidence identified
(a) Risk of bias was assessed using the QUADAS-2 checklist. Evidence quality was downgraded by 1 increment if the majority of the evidence was at high risk of bias, and downgraded by 2 increments if the majority of the evidence was at very high risk of bias.
(b) Inconsistency was assessed by inspection of the sensitivity and specificity forest plots (based on the primary measure), using the point estimates and confidence intervals. Particular attention was placed on values above or below 50% (diagnosis based on chance alone) and the threshold set by the GDG (the threshold above which would be acceptable to recommend a test). The evidence was downgraded by 1 increment if the individual studies varied across 2 areas (50–90% and 90–100%) and by 2 increments if the individual studies varied across 3 areas (0–50%, 50–90% and 90–100%).
(c) Indirectness was assessed using the QUADAS-2 checklist items referring to applicability. (d) The judgement of precision was based on visual inspection of the confidence region in the diagnostic meta-analysis if a diagnostic meta-analysis was conducted. Where a diagnostic meta- analysis was
not conducted imprecision was assessed according to the range of the confidence interval. As a rule of thumb (after discussion with the GDG) a range of 0–20% of differences in confidence interval around sensitivity was considered not imprecise, 20–40% serious imprecisions, and >40% very serious imprecision. Imprecision was assessed on the primary measure for decision-making.
(e) The judgement of precision was based on visual inspection of the confidence region in the diagnostic meta-analysis if a diagnostic meta-analysis was conducted. Where a diagnostic meta- analysis was not conducted imprecision was assessed according to the range of the confidence interval. As a rule of thumb (after discussion with the GDG) a range of 0–20% of differences in confidence interval around sensitivity was considered not imprecise, 20–40% serious imprecisions, and >40% very serious imprecision. Imprecision was assessed on the primary measure for decision-making.
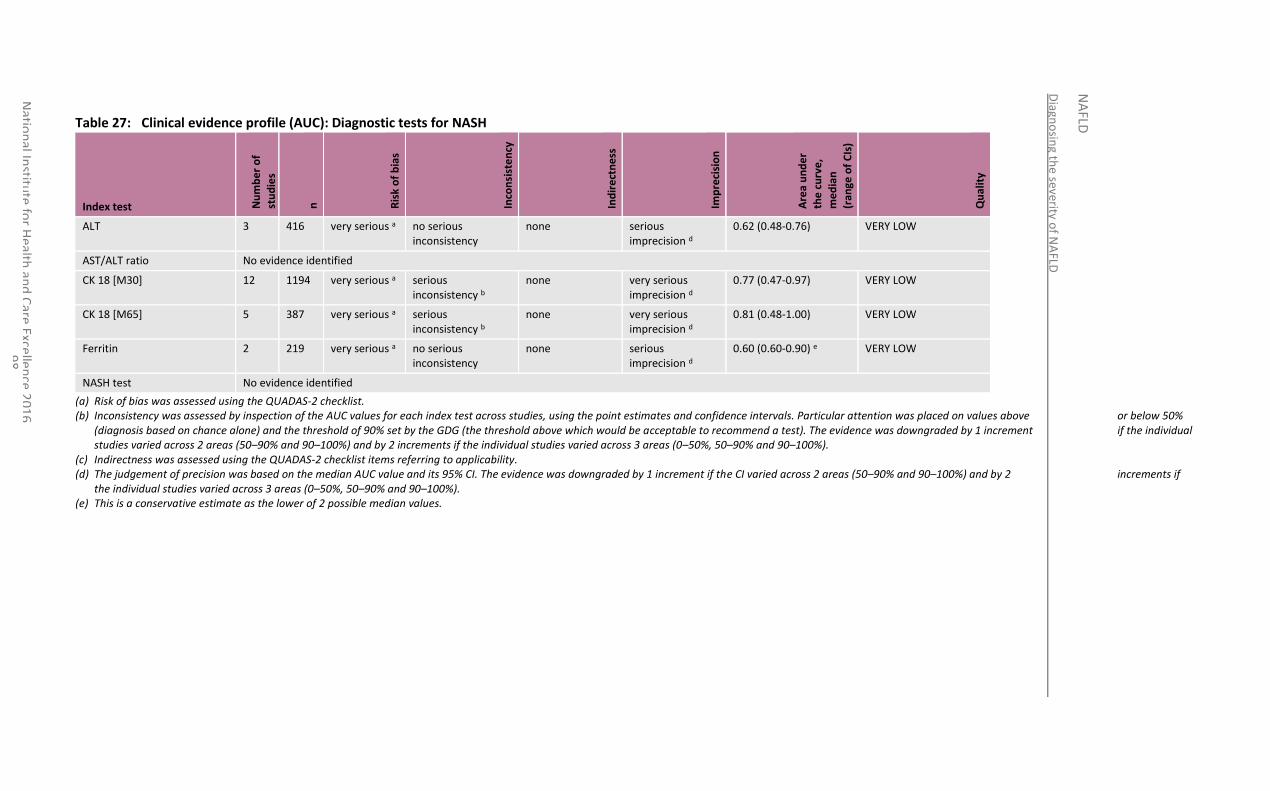
Diagn
osin
g the severity o
f NA
FLD
NA
FLD
Natio
nal In
stitute
for H
ealth an
d C
are Excellen
ce 20
16
9
8
Table 27: Clinical evidence profile (AUC): Diagnostic tests for NASH
Index test Nu
mb
er
of
stu
die
s
n
Ris
k o
f b
ias
Inco
nsi
ste
ncy
Ind
ire
ctn
ess
Imp
reci
sio
n
Are
a u
nd
er
the
cu
rve
,
me
dia
n
(ran
ge o
f C
Is)
Qu
alit
y
ALT 3 416 very serious a no serious inconsistency
none serious imprecision d
0.62 (0.48-0.76) VERY LOW
AST/ALT ratio No evidence identified
CK 18 [M30] 12 1194 very serious a serious inconsistency b
none very serious imprecision d
0.77 (0.47-0.97) VERY LOW
CK 18 [M65] 5 387 very serious a serious inconsistency b
none very serious imprecision d
0.81 (0.48-1.00) VERY LOW
Ferritin 2 219 very serious a no serious inconsistency
none serious imprecision d
0.60 (0.60-0.90) e VERY LOW
NASH test No evidence identified
(a) Risk of bias was assessed using the QUADAS-2 checklist. (b) Inconsistency was assessed by inspection of the AUC values for each index test across studies, using the point estimates and confidence intervals. Particular attention was placed on values above or below 50%
(diagnosis based on chance alone) and the threshold of 90% set by the GDG (the threshold above which would be acceptable to recommend a test). The evidence was downgraded by 1 increment if the individual studies varied across 2 areas (50–90% and 90–100%) and by 2 increments if the individual studies varied across 3 areas (0–50%, 50–90% and 90–100%).
(c) Indirectness was assessed using the QUADAS-2 checklist items referring to applicability. (d) The judgement of precision was based on the median AUC value and its 95% CI. The evidence was downgraded by 1 increment if the CI varied across 2 areas (50–90% and 90–100%) and by 2 increments if
the individual studies varied across 3 areas (0–50%, 50–90% and 90–100%). (e) This is a conservative estimate as the lower of 2 possible median values.
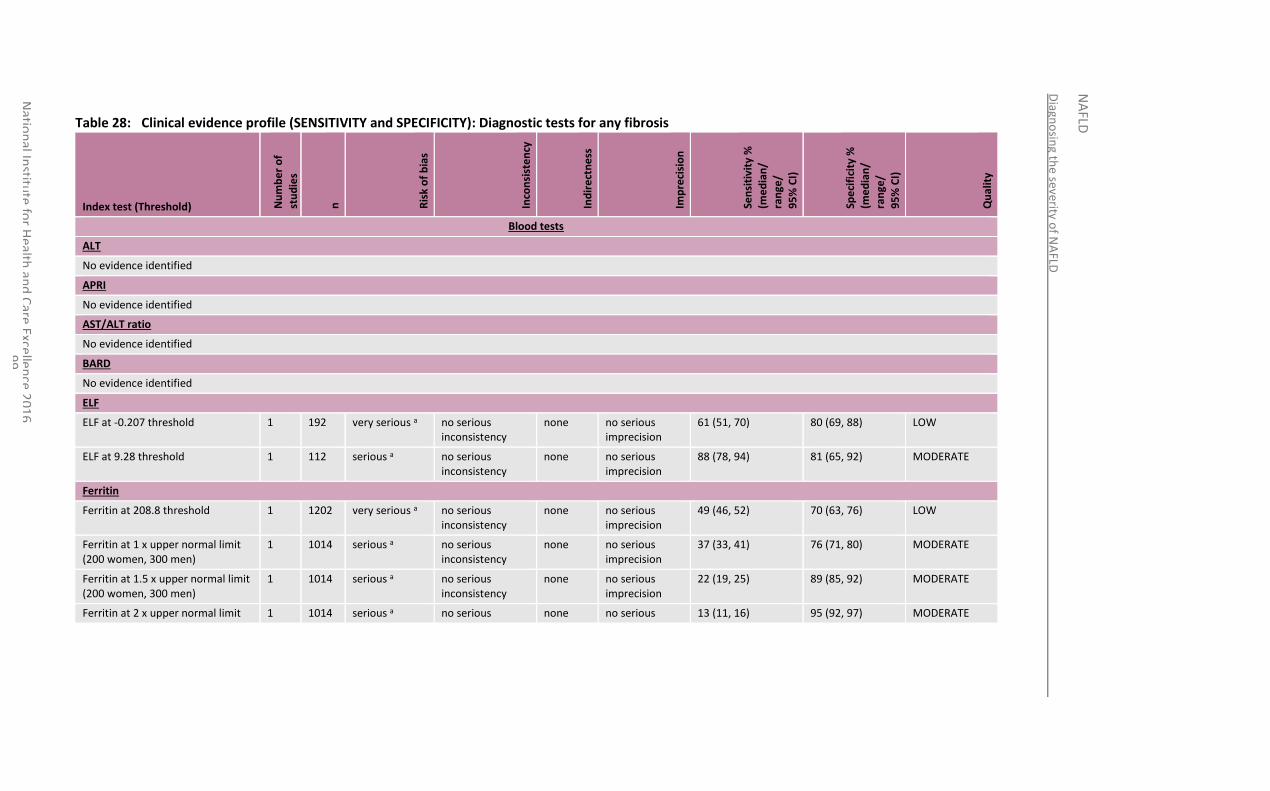
Diagn
osin
g the severity o
f NA
FLD
NA
FLD
Natio
nal In
stitute
for H
ealth an
d C
are Excellen
ce 20
16
9
9
Table 28: Clinical evidence profile (SENSITIVITY and SPECIFICITY): Diagnostic tests for any fibrosis
Index test (Threshold) Nu
mb
er
of
stu
die
s
n
Ris
k o
f b
ias
Inco
nsi
ste
ncy
Ind
ire
ctn
ess
Imp
reci
sio
n
Sen
siti
vity
%
(me
dia
n/
ran
ge/
95
% C
I)
Spe
cifi
city
%
(me
dia
n/
ran
ge/
95
% C
I)
Qu
alit
y
Blood tests
ALT
No evidence identified
APRI
No evidence identified
AST/ALT ratio
No evidence identified
BARD
No evidence identified
ELF
ELF at -0.207 threshold 1 192 very serious a no serious inconsistency
none no serious imprecision
61 (51, 70) 80 (69, 88) LOW
ELF at 9.28 threshold 1 112 serious a no serious inconsistency
none no serious imprecision
88 (78, 94) 81 (65, 92) MODERATE
Ferritin
Ferritin at 208.8 threshold 1 1202 very serious a no serious inconsistency
none no serious imprecision
49 (46, 52) 70 (63, 76) LOW
Ferritin at 1 x upper normal limit (200 women, 300 men)
1 1014 serious a no serious inconsistency
none no serious imprecision
37 (33, 41) 76 (71, 80) MODERATE
Ferritin at 1.5 x upper normal limit (200 women, 300 men)
1 1014 serious a no serious inconsistency
none no serious imprecision
22 (19, 25) 89 (85, 92) MODERATE
Ferritin at 2 x upper normal limit 1 1014 serious a no serious none no serious 13 (11, 16) 95 (92, 97) MODERATE
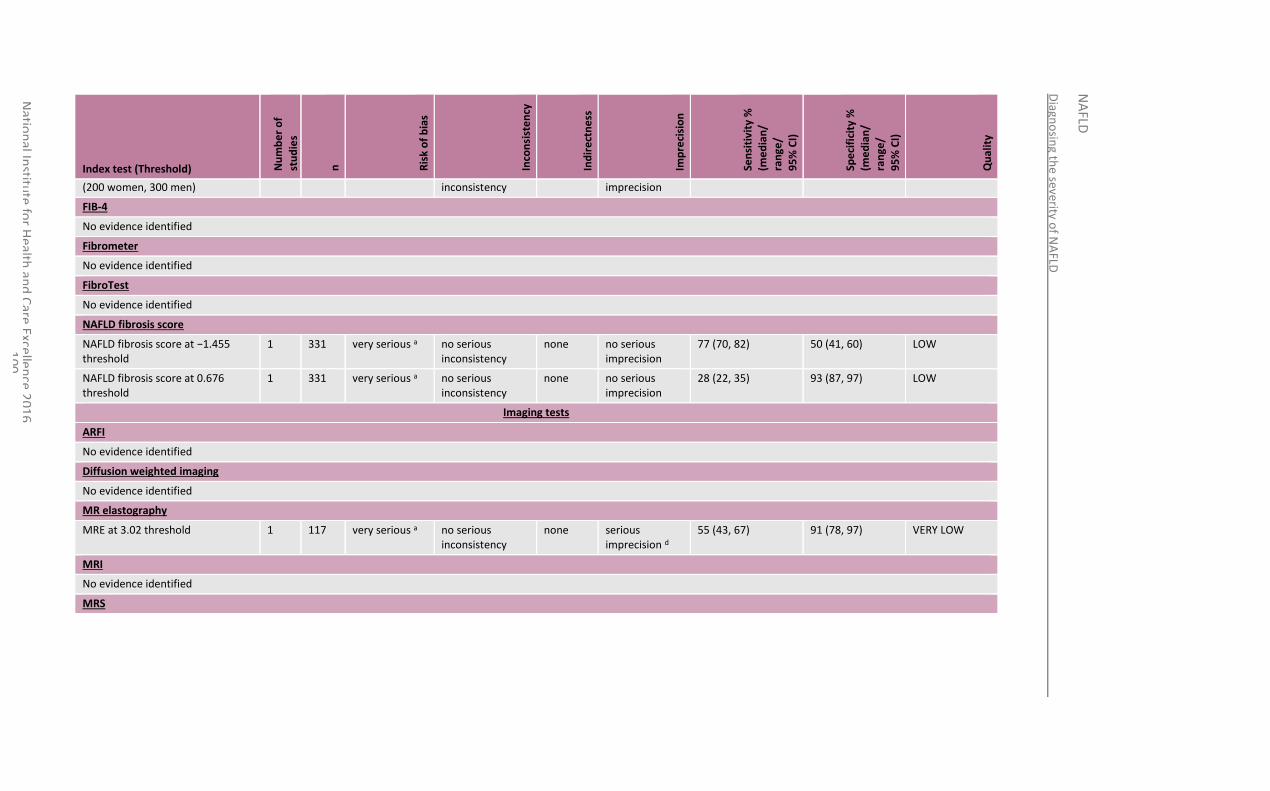
Diagn
osin
g the severity o
f NA
FLD
NA
FLD
Natio
nal In
stitute
for H
ealth an
d C
are Excellen
ce 20
16
1
00
Index test (Threshold) Nu
mb
er
of
stu
die
s
n
Ris
k o
f b
ias
Inco
nsi
ste
ncy
Ind
ire
ctn
ess
Imp
reci
sio
n
Sen
siti
vity
%
(me
dia
n/
ran
ge/
95
% C
I)
Spe
cifi
city
%
(me
dia
n/
ran
ge/
95
% C
I)
Qu
alit
y
(200 women, 300 men) inconsistency imprecision
FIB-4
No evidence identified
Fibrometer
No evidence identified
FibroTest
No evidence identified
NAFLD fibrosis score
NAFLD fibrosis score at −1.455 threshold
1 331 very serious a no serious inconsistency
none no serious imprecision
77 (70, 82) 50 (41, 60) LOW
NAFLD fibrosis score at 0.676 threshold
1 331 very serious a no serious inconsistency
none no serious imprecision
28 (22, 35) 93 (87, 97) LOW
Imaging tests
ARFI
No evidence identified
Diffusion weighted imaging
No evidence identified
MR elastography
MRE at 3.02 threshold 1 117 very serious a no serious inconsistency
none serious imprecision d
55 (43, 67) 91 (78, 97) VERY LOW
MRI
No evidence identified
MRS
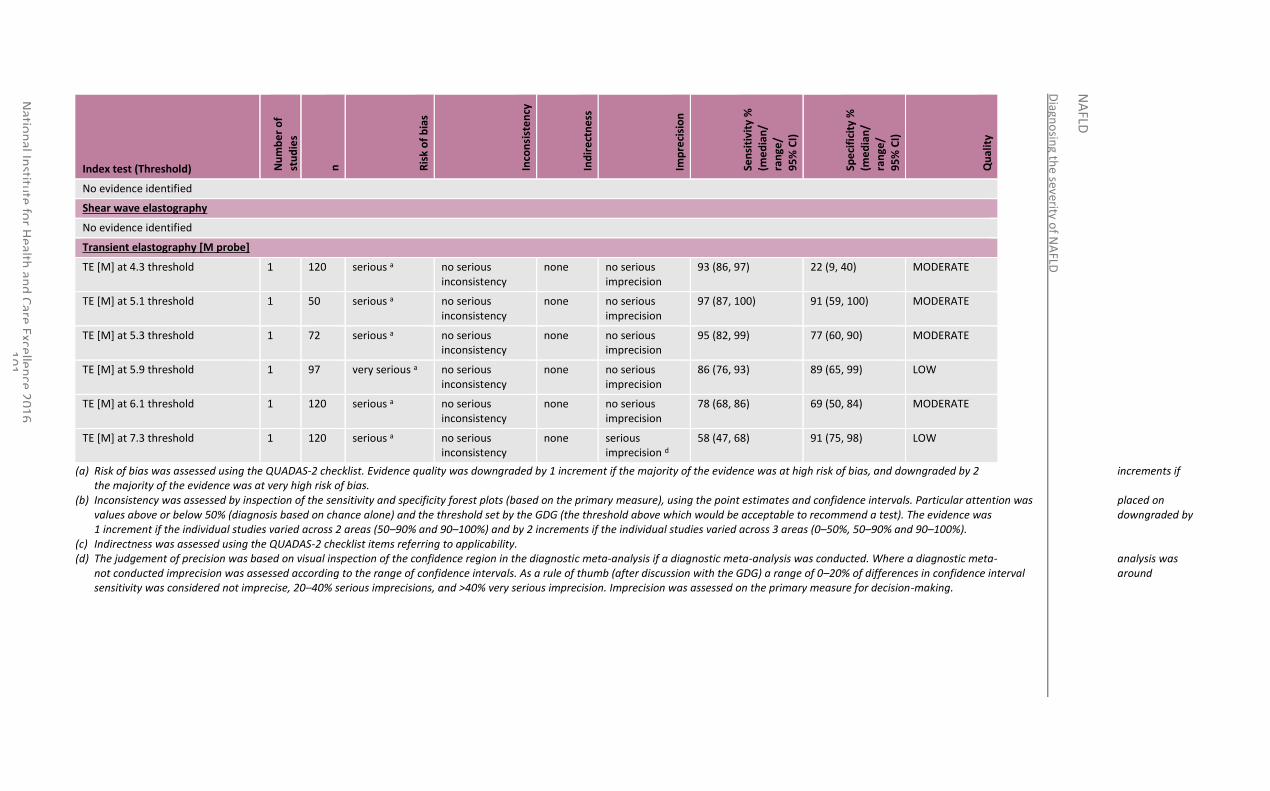
Diagn
osin
g the severity o
f NA
FLD
NA
FLD
Natio
nal In
stitute
for H
ealth an
d C
are Excellen
ce 20
16
1
01
Index test (Threshold) Nu
mb
er
of
stu
die
s
n
Ris
k o
f b
ias
Inco
nsi
ste
ncy
Ind
ire
ctn
ess
Imp
reci
sio
n
Sen
siti
vity
%
(me
dia
n/
ran
ge/
95
% C
I)
Spe
cifi
city
%
(me
dia
n/
ran
ge/
95
% C
I)
Qu
alit
y
No evidence identified
Shear wave elastography
No evidence identified
Transient elastography [M probe]
TE [M] at 4.3 threshold 1 120 serious a no serious inconsistency
none no serious imprecision
93 (86, 97) 22 (9, 40) MODERATE
TE [M] at 5.1 threshold 1 50 serious a no serious inconsistency
none no serious imprecision
97 (87, 100) 91 (59, 100) MODERATE
TE [M] at 5.3 threshold 1 72 serious a no serious inconsistency
none no serious imprecision
95 (82, 99) 77 (60, 90) MODERATE
TE [M] at 5.9 threshold 1 97 very serious a no serious inconsistency
none no serious imprecision
86 (76, 93) 89 (65, 99) LOW
TE [M] at 6.1 threshold 1 120 serious a no serious inconsistency
none no serious imprecision
78 (68, 86) 69 (50, 84) MODERATE
TE [M] at 7.3 threshold 1 120 serious a no serious inconsistency
none serious imprecision d
58 (47, 68) 91 (75, 98) LOW
(a) Risk of bias was assessed using the QUADAS-2 checklist. Evidence quality was downgraded by 1 increment if the majority of the evidence was at high risk of bias, and downgraded by 2 increments if the majority of the evidence was at very high risk of bias.
(b) Inconsistency was assessed by inspection of the sensitivity and specificity forest plots (based on the primary measure), using the point estimates and confidence intervals. Particular attention was placed on values above or below 50% (diagnosis based on chance alone) and the threshold set by the GDG (the threshold above which would be acceptable to recommend a test). The evidence was downgraded by 1 increment if the individual studies varied across 2 areas (50–90% and 90–100%) and by 2 increments if the individual studies varied across 3 areas (0–50%, 50–90% and 90–100%).
(c) Indirectness was assessed using the QUADAS-2 checklist items referring to applicability. (d) The judgement of precision was based on visual inspection of the confidence region in the diagnostic meta-analysis if a diagnostic meta-analysis was conducted. Where a diagnostic meta- analysis was
not conducted imprecision was assessed according to the range of confidence intervals. As a rule of thumb (after discussion with the GDG) a range of 0–20% of differences in confidence interval around sensitivity was considered not imprecise, 20–40% serious imprecisions, and >40% very serious imprecision. Imprecision was assessed on the primary measure for decision-making.
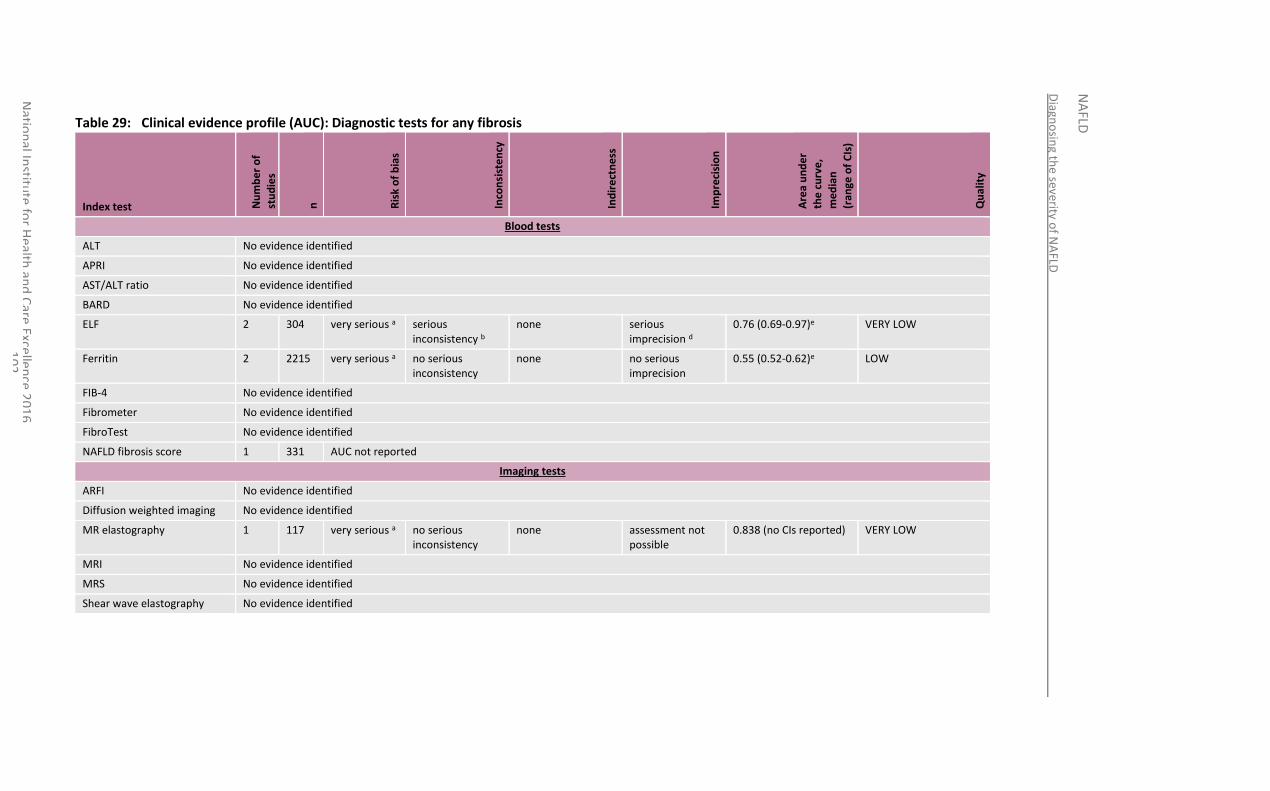
Diagn
osin
g the severity o
f NA
FLD
NA
FLD
Natio
nal In
stitute
for H
ealth an
d C
are Excellen
ce 20
16
1
02
Table 29: Clinical evidence profile (AUC): Diagnostic tests for any fibrosis
Index test Nu
mb
er
of
stu
die
s
n
Ris
k o
f b
ias
Inco
nsi
ste
ncy
Ind
ire
ctn
ess
Imp
reci
sio
n
Are
a u
nd
er
the
cu
rve
,
me
dia
n
(ran
ge o
f C
Is)
Qu
alit
y
Blood tests
ALT No evidence identified
APRI No evidence identified
AST/ALT ratio No evidence identified
BARD No evidence identified
ELF 2 304 very serious a serious inconsistency b
none serious imprecision d
0.76 (0.69-0.97)e VERY LOW
Ferritin 2 2215 very serious a no serious inconsistency
none no serious imprecision
0.55 (0.52-0.62)e LOW
FIB-4 No evidence identified
Fibrometer No evidence identified
FibroTest No evidence identified
NAFLD fibrosis score 1 331 AUC not reported
Imaging tests
ARFI No evidence identified
Diffusion weighted imaging No evidence identified
MR elastography 1 117 very serious a no serious inconsistency
none assessment not possible
0.838 (no CIs reported) VERY LOW
MRI No evidence identified
MRS No evidence identified
Shear wave elastography No evidence identified
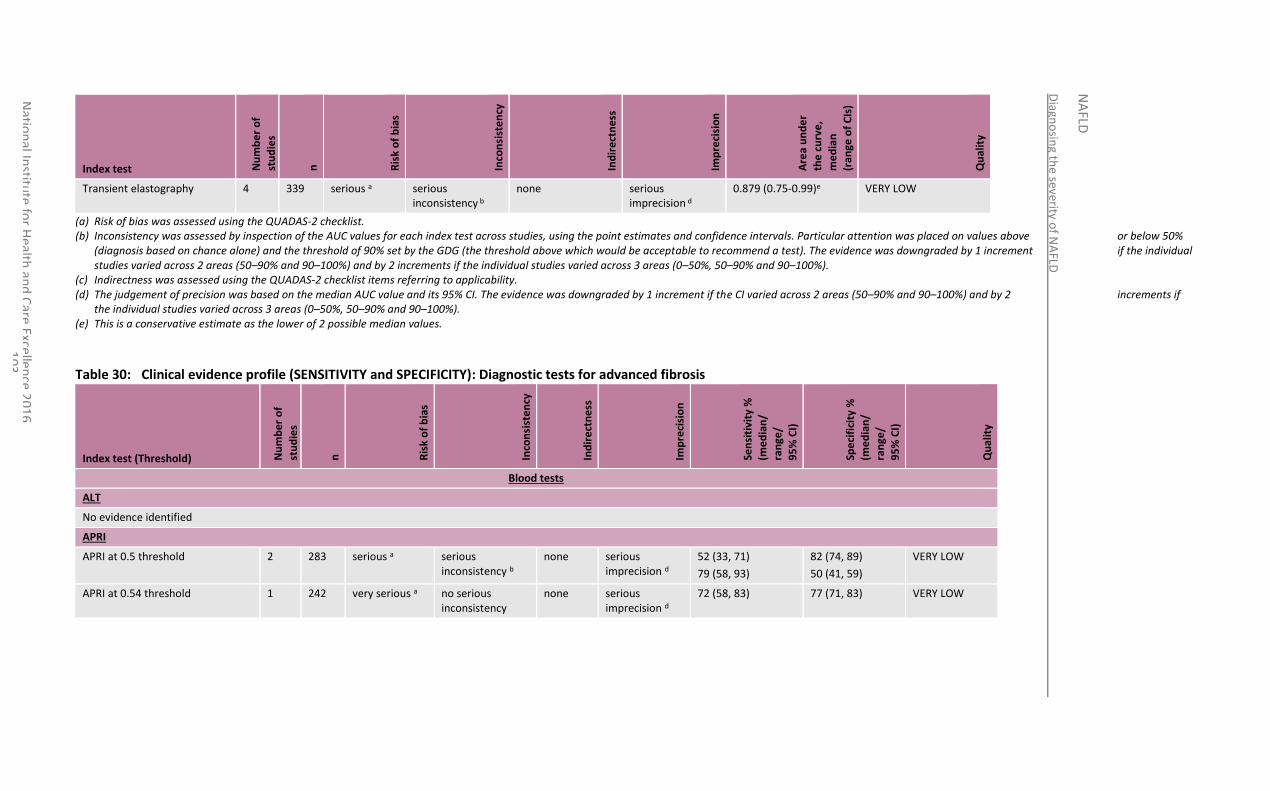
Diagn
osin
g the severity o
f NA
FLD
NA
FLD
Natio
nal In
stitute
for H
ealth an
d C
are Excellen
ce 20
16
1
03
Index test Nu
mb
er
of
stu
die
s
n
Ris
k o
f b
ias
Inco
nsi
ste
ncy
Ind
ire
ctn
ess
Imp
reci
sio
n
Are
a u
nd
er
the
cu
rve
,
me
dia
n
(ran
ge o
f C
Is)
Qu
alit
y
Transient elastography 4 339 serious a serious inconsistency b
none serious imprecision d
0.879 (0.75-0.99)e VERY LOW
(a) Risk of bias was assessed using the QUADAS-2 checklist. (b) Inconsistency was assessed by inspection of the AUC values for each index test across studies, using the point estimates and confidence intervals. Particular attention was placed on values above or below 50%
(diagnosis based on chance alone) and the threshold of 90% set by the GDG (the threshold above which would be acceptable to recommend a test). The evidence was downgraded by 1 increment if the individual studies varied across 2 areas (50–90% and 90–100%) and by 2 increments if the individual studies varied across 3 areas (0–50%, 50–90% and 90–100%).
(c) Indirectness was assessed using the QUADAS-2 checklist items referring to applicability. (d) The judgement of precision was based on the median AUC value and its 95% CI. The evidence was downgraded by 1 increment if the CI varied across 2 areas (50–90% and 90–100%) and by 2 increments if
the individual studies varied across 3 areas (0–50%, 50–90% and 90–100%). (e) This is a conservative estimate as the lower of 2 possible median values.
Table 30: Clinical evidence profile (SENSITIVITY and SPECIFICITY): Diagnostic tests for advanced fibrosis
Index test (Threshold) Nu
mb
er
of
stu
die
s
n
Ris
k o
f b
ias
Inco
nsi
ste
ncy
Ind
ire
ctn
ess
Imp
reci
sio
n
Sen
siti
vity
%
(me
dia
n/
ran
ge/
95
% C
I)
Spe
cifi
city
%
(me
dia
n/
ran
ge/
95
% C
I)
Qu
alit
y
Blood tests
ALT
No evidence identified
APRI
APRI at 0.5 threshold 2 283 serious a serious inconsistency b
none serious imprecision d
52 (33, 71)
79 (58, 93)
82 (74, 89)
50 (41, 59)
VERY LOW
APRI at 0.54 threshold 1 242 very serious a no serious inconsistency
none serious imprecision d
72 (58, 83) 77 (71, 83) VERY LOW
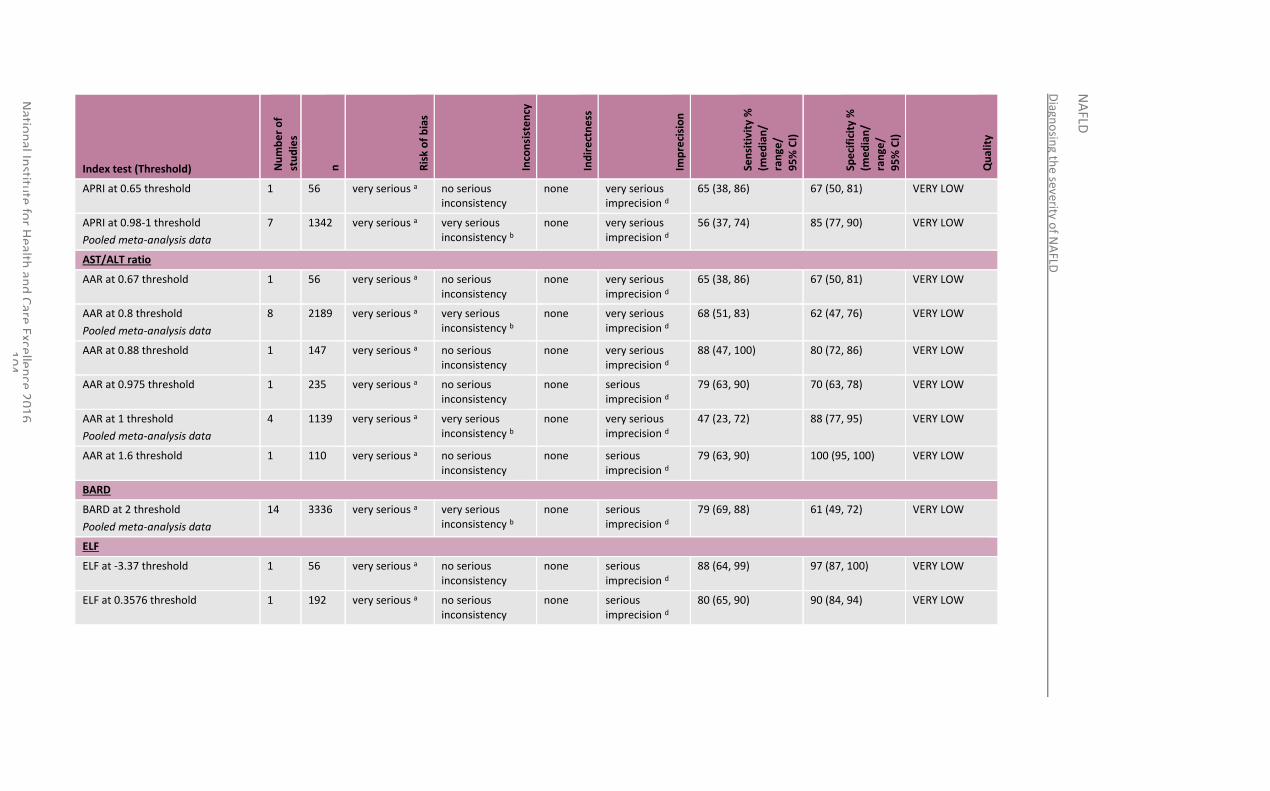
Diagn
osin
g the severity o
f NA
FLD
NA
FLD
Natio
nal In
stitute
for H
ealth an
d C
are Excellen
ce 20
16
1
04
Index test (Threshold) Nu
mb
er
of
stu
die
s
n
Ris
k o
f b
ias
Inco
nsi
ste
ncy
Ind
ire
ctn
ess
Imp
reci
sio
n
Sen
siti
vity
%
(me
dia
n/
ran
ge/
95
% C
I)
Spe
cifi
city
%
(me
dia
n/
ran
ge/
95
% C
I)
Qu
alit
y
APRI at 0.65 threshold 1 56 very serious a no serious inconsistency
none very serious imprecision d
65 (38, 86) 67 (50, 81) VERY LOW
APRI at 0.98-1 threshold
Pooled meta-analysis data
7 1342 very serious a very serious inconsistency b
none very serious imprecision d
56 (37, 74) 85 (77, 90) VERY LOW
AST/ALT ratio
AAR at 0.67 threshold 1 56 very serious a no serious inconsistency
none very serious imprecision d
65 (38, 86) 67 (50, 81) VERY LOW
AAR at 0.8 threshold
Pooled meta-analysis data
8 2189 very serious a very serious inconsistency b
none very serious imprecision d
68 (51, 83) 62 (47, 76) VERY LOW
AAR at 0.88 threshold 1 147 very serious a no serious inconsistency
none very serious imprecision d
88 (47, 100) 80 (72, 86) VERY LOW
AAR at 0.975 threshold 1 235 very serious a no serious inconsistency
none serious imprecision d
79 (63, 90) 70 (63, 78) VERY LOW
AAR at 1 threshold
Pooled meta-analysis data
4 1139 very serious a very serious inconsistency b
none very serious imprecision d
47 (23, 72) 88 (77, 95) VERY LOW
AAR at 1.6 threshold 1 110 very serious a no serious inconsistency
none serious imprecision d
79 (63, 90) 100 (95, 100) VERY LOW
BARD
BARD at 2 threshold
Pooled meta-analysis data
14 3336 very serious a very serious inconsistency b
none serious imprecision d
79 (69, 88) 61 (49, 72) VERY LOW
ELF
ELF at -3.37 threshold 1 56 very serious a no serious inconsistency
none serious imprecision d
88 (64, 99) 97 (87, 100) VERY LOW
ELF at 0.3576 threshold 1 192 very serious a no serious inconsistency
none serious imprecision d
80 (65, 90) 90 (84, 94) VERY LOW
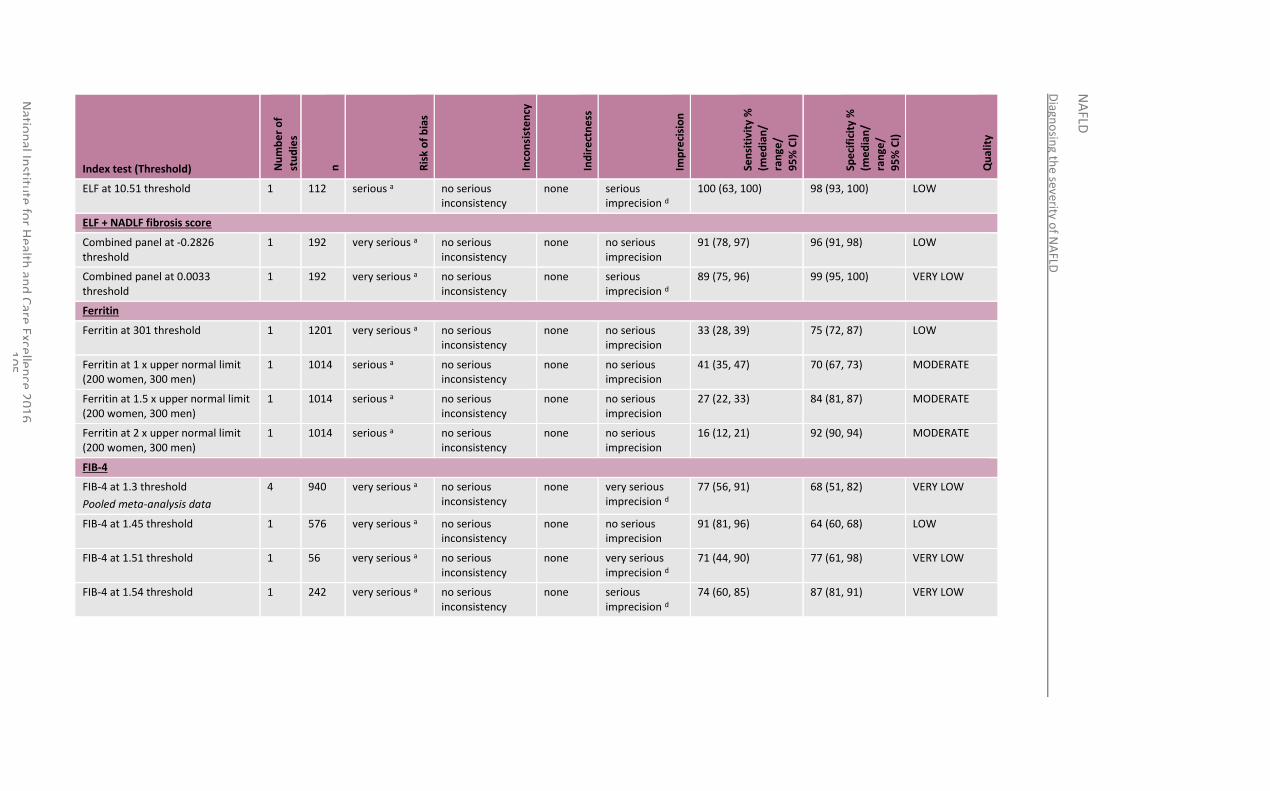
Diagn
osin
g the severity o
f NA
FLD
NA
FLD
Natio
nal In
stitute
for H
ealth an
d C
are Excellen
ce 20
16
1
05
Index test (Threshold) Nu
mb
er
of
stu
die
s
n
Ris
k o
f b
ias
Inco
nsi
ste
ncy
Ind
ire
ctn
ess
Imp
reci
sio
n
Sen
siti
vity
%
(me
dia
n/
ran
ge/
95
% C
I)
Spe
cifi
city
%
(me
dia
n/
ran
ge/
95
% C
I)
Qu
alit
y
ELF at 10.51 threshold 1 112 serious a no serious inconsistency
none serious imprecision d
100 (63, 100) 98 (93, 100) LOW
ELF + NADLF fibrosis score
Combined panel at -0.2826 threshold
1 192 very serious a no serious inconsistency
none no serious imprecision
91 (78, 97) 96 (91, 98) LOW
Combined panel at 0.0033 threshold
1 192 very serious a no serious inconsistency
none serious imprecision d
89 (75, 96) 99 (95, 100) VERY LOW
Ferritin
Ferritin at 301 threshold 1 1201 very serious a no serious inconsistency
none no serious imprecision
33 (28, 39) 75 (72, 87) LOW
Ferritin at 1 x upper normal limit (200 women, 300 men)
1 1014 serious a no serious inconsistency
none no serious imprecision
41 (35, 47) 70 (67, 73) MODERATE
Ferritin at 1.5 x upper normal limit (200 women, 300 men)
1 1014 serious a no serious inconsistency
none no serious imprecision
27 (22, 33) 84 (81, 87) MODERATE
Ferritin at 2 x upper normal limit (200 women, 300 men)
1 1014 serious a no serious inconsistency
none no serious imprecision
16 (12, 21) 92 (90, 94) MODERATE
FIB-4
FIB-4 at 1.3 threshold
Pooled meta-analysis data
4 940 very serious a no serious inconsistency
none very serious imprecision d
77 (56, 91) 68 (51, 82) VERY LOW
FIB-4 at 1.45 threshold 1 576 very serious a no serious inconsistency
none no serious imprecision
91 (81, 96) 64 (60, 68) LOW
FIB-4 at 1.51 threshold 1 56 very serious a no serious inconsistency
none very serious imprecision d
71 (44, 90) 77 (61, 98) VERY LOW
FIB-4 at 1.54 threshold 1 242 very serious a no serious inconsistency
none serious imprecision d
74 (60, 85) 87 (81, 91) VERY LOW
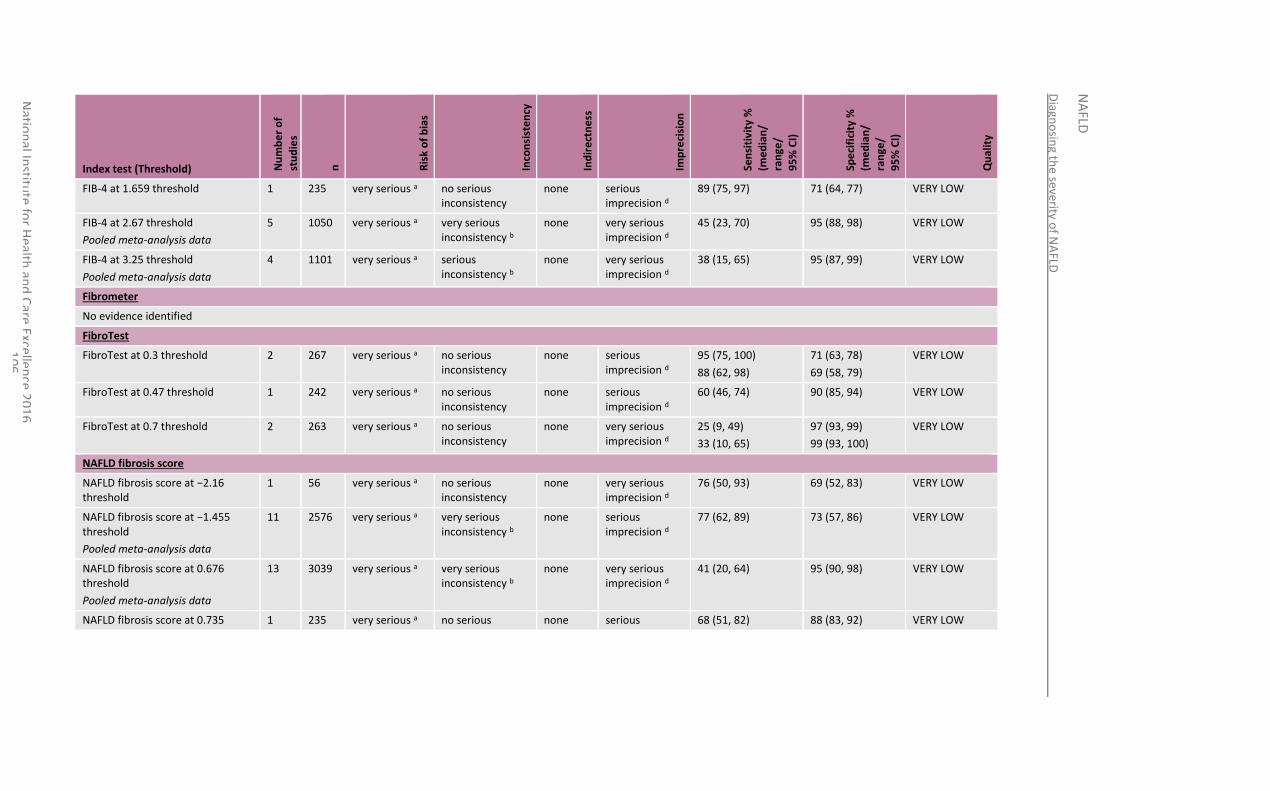
Diagn
osin
g the severity o
f NA
FLD
NA
FLD
Natio
nal In
stitute
for H
ealth an
d C
are Excellen
ce 20
16
1
06
Index test (Threshold) Nu
mb
er
of
stu
die
s
n
Ris
k o
f b
ias
Inco
nsi
ste
ncy
Ind
ire
ctn
ess
Imp
reci
sio
n
Sen
siti
vity
%
(me
dia
n/
ran
ge/
95
% C
I)
Spe
cifi
city
%
(me
dia
n/
ran
ge/
95
% C
I)
Qu
alit
y
FIB-4 at 1.659 threshold 1 235 very serious a no serious inconsistency
none serious imprecision d
89 (75, 97) 71 (64, 77) VERY LOW
FIB-4 at 2.67 threshold
Pooled meta-analysis data
5 1050 very serious a very serious inconsistency b
none very serious imprecision d
45 (23, 70) 95 (88, 98) VERY LOW
FIB-4 at 3.25 threshold
Pooled meta-analysis data
4 1101 very serious a serious inconsistency b
none very serious imprecision d
38 (15, 65) 95 (87, 99) VERY LOW
Fibrometer
No evidence identified
FibroTest
FibroTest at 0.3 threshold 2 267 very serious a no serious inconsistency
none serious imprecision d
95 (75, 100)
88 (62, 98)
71 (63, 78)
69 (58, 79)
VERY LOW
FibroTest at 0.47 threshold 1 242 very serious a no serious inconsistency
none serious imprecision d
60 (46, 74) 90 (85, 94) VERY LOW
FibroTest at 0.7 threshold 2 263 very serious a no serious inconsistency
none very serious imprecision d
25 (9, 49)
33 (10, 65)
97 (93, 99)
99 (93, 100)
VERY LOW
NAFLD fibrosis score
NAFLD fibrosis score at −2.16 threshold
1 56 very serious a no serious inconsistency
none very serious imprecision d
76 (50, 93) 69 (52, 83) VERY LOW
NAFLD fibrosis score at −1.455 threshold
Pooled meta-analysis data
11 2576 very serious a very serious inconsistency b
none serious imprecision d
77 (62, 89) 73 (57, 86) VERY LOW
NAFLD fibrosis score at 0.676 threshold
Pooled meta-analysis data
13 3039 very serious a very serious inconsistency b
none very serious imprecision d
41 (20, 64) 95 (90, 98) VERY LOW
NAFLD fibrosis score at 0.735 1 235 very serious a no serious none serious 68 (51, 82) 88 (83, 92) VERY LOW
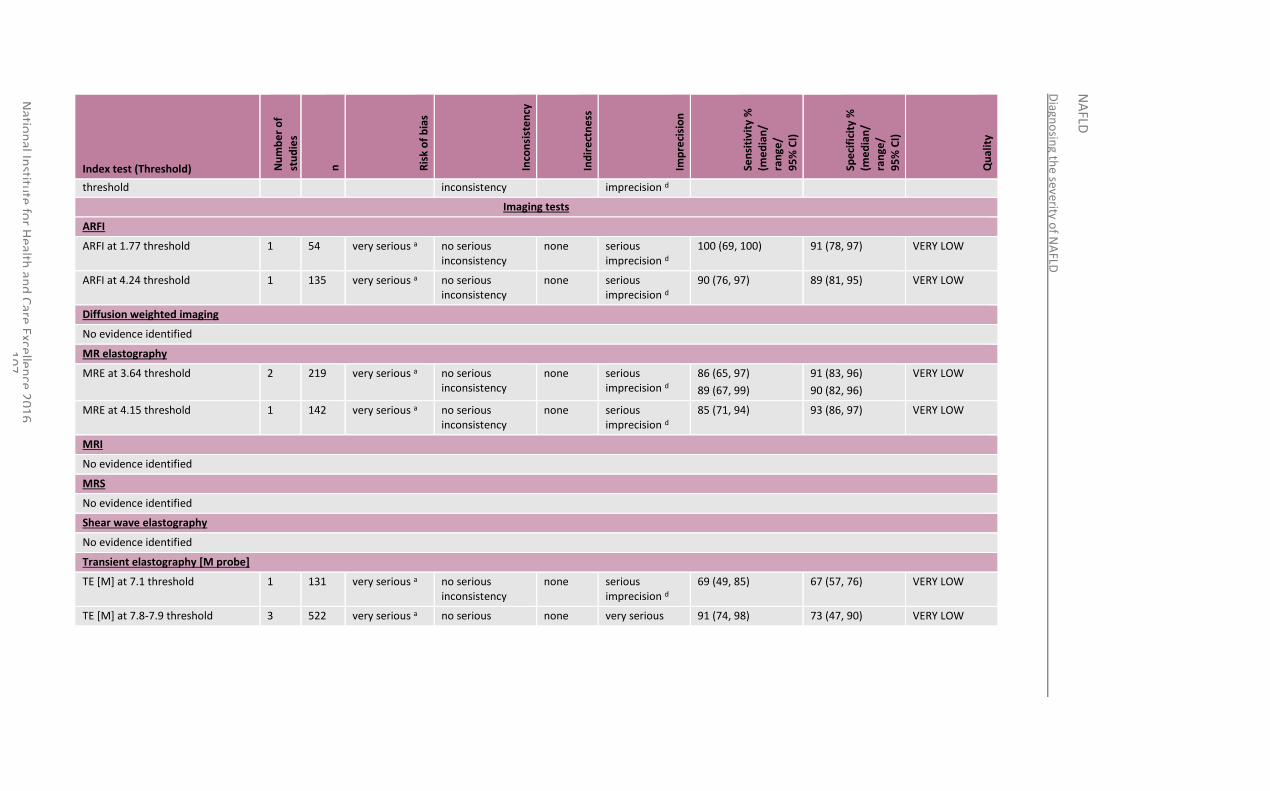
Diagn
osin
g the severity o
f NA
FLD
NA
FLD
Natio
nal In
stitute
for H
ealth an
d C
are Excellen
ce 20
16
1
07
Index test (Threshold) Nu
mb
er
of
stu
die
s
n
Ris
k o
f b
ias
Inco
nsi
ste
ncy
Ind
ire
ctn
ess
Imp
reci
sio
n
Sen
siti
vity
%
(me
dia
n/
ran
ge/
95
% C
I)
Spe
cifi
city
%
(me
dia
n/
ran
ge/
95
% C
I)
Qu
alit
y
threshold inconsistency imprecision d
Imaging tests
ARFI
ARFI at 1.77 threshold 1 54 very serious a no serious inconsistency
none serious imprecision d
100 (69, 100) 91 (78, 97) VERY LOW
ARFI at 4.24 threshold 1 135 very serious a no serious inconsistency
none serious imprecision d
90 (76, 97) 89 (81, 95) VERY LOW
Diffusion weighted imaging
No evidence identified
MR elastography
MRE at 3.64 threshold 2 219 very serious a no serious inconsistency
none serious imprecision d
86 (65, 97)
89 (67, 99)
91 (83, 96)
90 (82, 96)
VERY LOW
MRE at 4.15 threshold 1 142 very serious a no serious inconsistency
none serious imprecision d
85 (71, 94) 93 (86, 97) VERY LOW
MRI
No evidence identified
MRS
No evidence identified
Shear wave elastography
No evidence identified
Transient elastography [M probe]
TE [M] at 7.1 threshold 1 131 very serious a no serious inconsistency
none serious imprecision d
69 (49, 85) 67 (57, 76) VERY LOW
TE [M] at 7.8-7.9 threshold 3 522 very serious a no serious none very serious 91 (74, 98) 73 (47, 90) VERY LOW
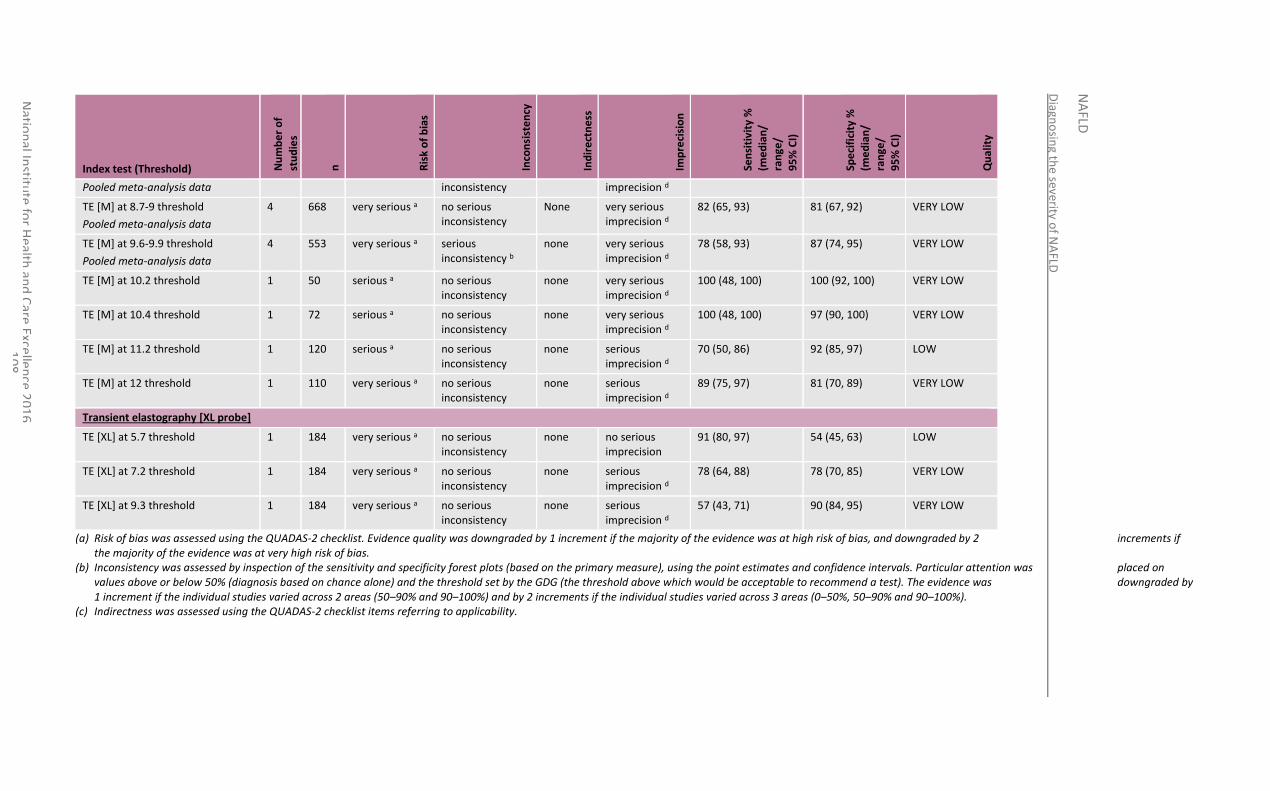
Diagn
osin
g the severity o
f NA
FLD
NA
FLD
Natio
nal In
stitute
for H
ealth an
d C
are Excellen
ce 20
16
1
08
Index test (Threshold) Nu
mb
er
of
stu
die
s
n
Ris
k o
f b
ias
Inco
nsi
ste
ncy
Ind
ire
ctn
ess
Imp
reci
sio
n
Sen
siti
vity
%
(me
dia
n/
ran
ge/
95
% C
I)
Spe
cifi
city
%
(me
dia
n/
ran
ge/
95
% C
I)
Qu
alit
y
Pooled meta-analysis data inconsistency imprecision d
TE [M] at 8.7-9 threshold
Pooled meta-analysis data
4 668 very serious a no serious inconsistency
None very serious imprecision d
82 (65, 93) 81 (67, 92) VERY LOW
TE [M] at 9.6-9.9 threshold
Pooled meta-analysis data
4 553 very serious a serious inconsistency b
none very serious imprecision d
78 (58, 93) 87 (74, 95) VERY LOW
TE [M] at 10.2 threshold 1 50 serious a no serious inconsistency
none very serious imprecision d
100 (48, 100) 100 (92, 100) VERY LOW
TE [M] at 10.4 threshold 1 72 serious a no serious inconsistency
none very serious imprecision d
100 (48, 100) 97 (90, 100) VERY LOW
TE [M] at 11.2 threshold 1 120 serious a no serious inconsistency
none serious imprecision d
70 (50, 86) 92 (85, 97) LOW
TE [M] at 12 threshold 1 110 very serious a no serious inconsistency
none serious imprecision d
89 (75, 97) 81 (70, 89) VERY LOW
Transient elastography [XL probe]
TE [XL] at 5.7 threshold 1 184 very serious a no serious inconsistency
none no serious imprecision
91 (80, 97) 54 (45, 63) LOW
TE [XL] at 7.2 threshold 1 184 very serious a no serious inconsistency
none serious imprecision d
78 (64, 88) 78 (70, 85) VERY LOW
TE [XL] at 9.3 threshold 1 184 very serious a no serious inconsistency
none serious imprecision d
57 (43, 71) 90 (84, 95) VERY LOW
(a) Risk of bias was assessed using the QUADAS-2 checklist. Evidence quality was downgraded by 1 increment if the majority of the evidence was at high risk of bias, and downgraded by 2 increments if the majority of the evidence was at very high risk of bias.
(b) Inconsistency was assessed by inspection of the sensitivity and specificity forest plots (based on the primary measure), using the point estimates and confidence intervals. Particular attention was placed on values above or below 50% (diagnosis based on chance alone) and the threshold set by the GDG (the threshold above which would be acceptable to recommend a test). The evidence was downgraded by 1 increment if the individual studies varied across 2 areas (50–90% and 90–100%) and by 2 increments if the individual studies varied across 3 areas (0–50%, 50–90% and 90–100%).
(c) Indirectness was assessed using the QUADAS-2 checklist items referring to applicability.
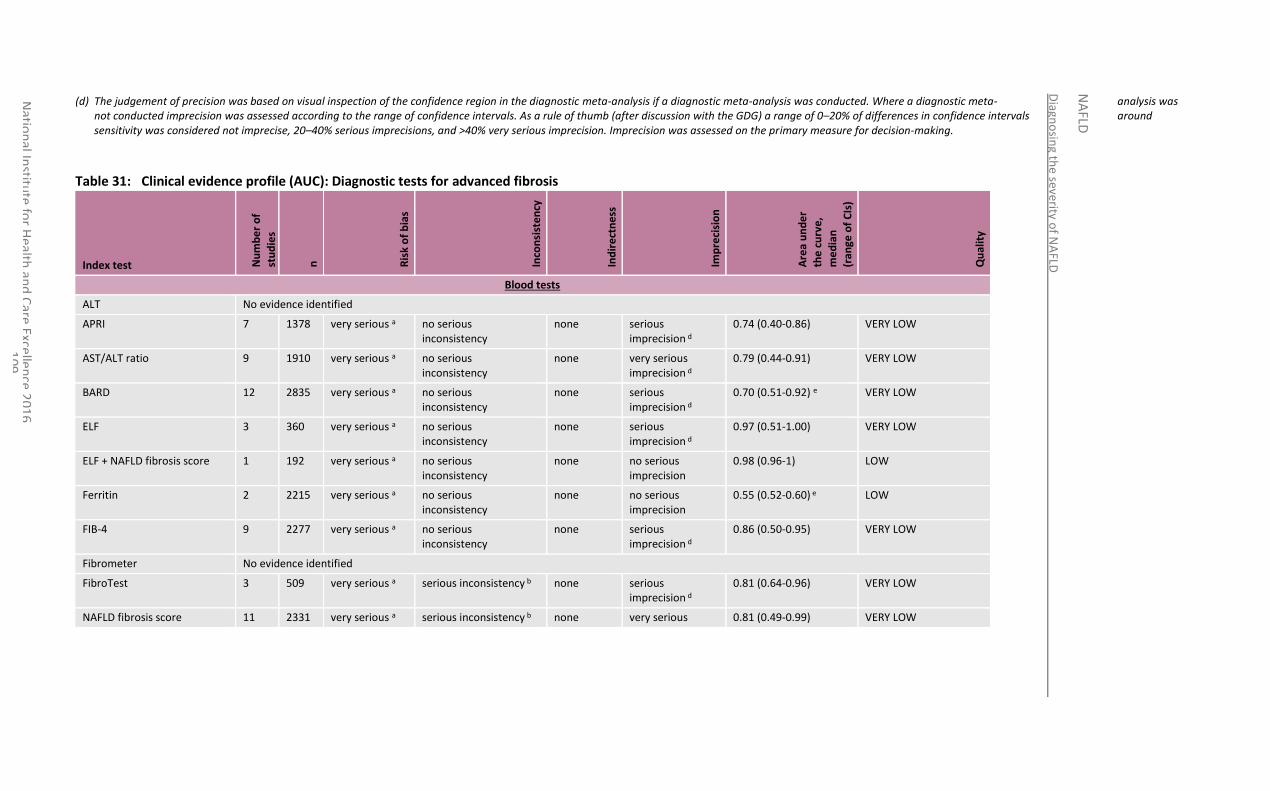
Diagn
osin
g the seve
rity of N
AFLD
NA
FLD
Natio
nal In
stitute
for H
ealth an
d C
are Excellen
ce 20
16
1
09
(d) The judgement of precision was based on visual inspection of the confidence region in the diagnostic meta-analysis if a diagnostic meta-analysis was conducted. Where a diagnostic meta- analysis was not conducted imprecision was assessed according to the range of confidence intervals. As a rule of thumb (after discussion with the GDG) a range of 0–20% of differences in confidence intervals around sensitivity was considered not imprecise, 20–40% serious imprecisions, and >40% very serious imprecision. Imprecision was assessed on the primary measure for decision-making.
Table 31: Clinical evidence profile (AUC): Diagnostic tests for advanced fibrosis
Index test Nu
mb
er
of
stu
die
s
n
Ris
k o
f b
ias
Inco
nsi
ste
ncy
Ind
ire
ctn
ess
Imp
reci
sio
n
Are
a u
nd
er
the
cu
rve
,
me
dia
n
(ran
ge o
f C
Is)
Qu
alit
y
Blood tests
ALT No evidence identified
APRI 7 1378 very serious a no serious inconsistency
none serious imprecision d
0.74 (0.40-0.86) VERY LOW
AST/ALT ratio 9 1910 very serious a no serious inconsistency
none very serious imprecision d
0.79 (0.44-0.91) VERY LOW
BARD 12 2835 very serious a no serious inconsistency
none serious imprecision d
0.70 (0.51-0.92) e VERY LOW
ELF 3 360 very serious a no serious inconsistency
none serious imprecision d
0.97 (0.51-1.00) VERY LOW
ELF + NAFLD fibrosis score 1 192 very serious a no serious inconsistency
none no serious imprecision
0.98 (0.96-1) LOW
Ferritin 2 2215 very serious a no serious inconsistency
none no serious imprecision
0.55 (0.52-0.60) e LOW
FIB-4 9 2277 very serious a no serious inconsistency
none serious imprecision d
0.86 (0.50-0.95) VERY LOW
Fibrometer No evidence identified
FibroTest 3 509 very serious a serious inconsistency b none serious imprecision d
0.81 (0.64-0.96) VERY LOW
NAFLD fibrosis score 11 2331 very serious a serious inconsistency b none very serious 0.81 (0.49-0.99) VERY LOW
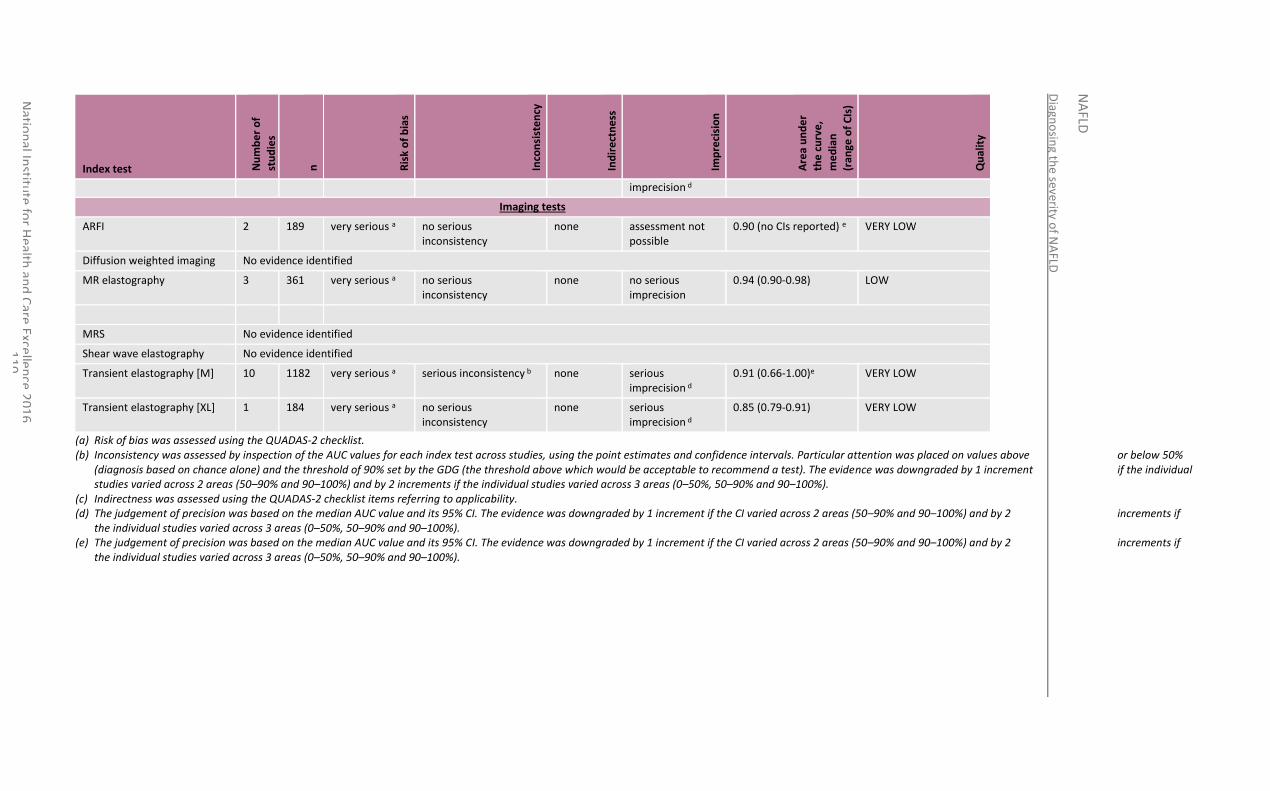
Diagn
osin
g the severity o
f NA
FLD
NA
FLD
Natio
nal In
stitute
for H
ealth an
d C
are Excellen
ce 20
16
1
10
Index test Nu
mb
er
of
stu
die
s
n
Ris
k o
f b
ias
Inco
nsi
ste
ncy
Ind
ire
ctn
ess
Imp
reci
sio
n
Are
a u
nd
er
the
cu
rve
,
me
dia
n
(ran
ge o
f C
Is)
Qu
alit
y
imprecision d
Imaging tests
ARFI 2 189 very serious a no serious inconsistency
none assessment not possible
0.90 (no CIs reported) e VERY LOW
Diffusion weighted imaging No evidence identified
MR elastography 3 361 very serious a no serious inconsistency
none no serious imprecision
0.94 (0.90-0.98) LOW
MRS No evidence identified
Shear wave elastography No evidence identified
Transient elastography [M] 10 1182 very serious a serious inconsistency b none serious imprecision d
0.91 (0.66-1.00)e VERY LOW
Transient elastography [XL] 1 184 very serious a no serious inconsistency
none serious imprecision d
0.85 (0.79-0.91) VERY LOW
(a) Risk of bias was assessed using the QUADAS-2 checklist. (b) Inconsistency was assessed by inspection of the AUC values for each index test across studies, using the point estimates and confidence intervals. Particular attention was placed on values above or below 50%
(diagnosis based on chance alone) and the threshold of 90% set by the GDG (the threshold above which would be acceptable to recommend a test). The evidence was downgraded by 1 increment if the individual studies varied across 2 areas (50–90% and 90–100%) and by 2 increments if the individual studies varied across 3 areas (0–50%, 50–90% and 90–100%).
(c) Indirectness was assessed using the QUADAS-2 checklist items referring to applicability. (d) The judgement of precision was based on the median AUC value and its 95% CI. The evidence was downgraded by 1 increment if the CI varied across 2 areas (50–90% and 90–100%) and by 2 increments if
the individual studies varied across 3 areas (0–50%, 50–90% and 90–100%). (e) The judgement of precision was based on the median AUC value and its 95% CI. The evidence was downgraded by 1 increment if the CI varied across 2 areas (50–90% and 90–100%) and by 2 increments if
the individual studies varied across 3 areas (0–50%, 50–90% and 90–100%).
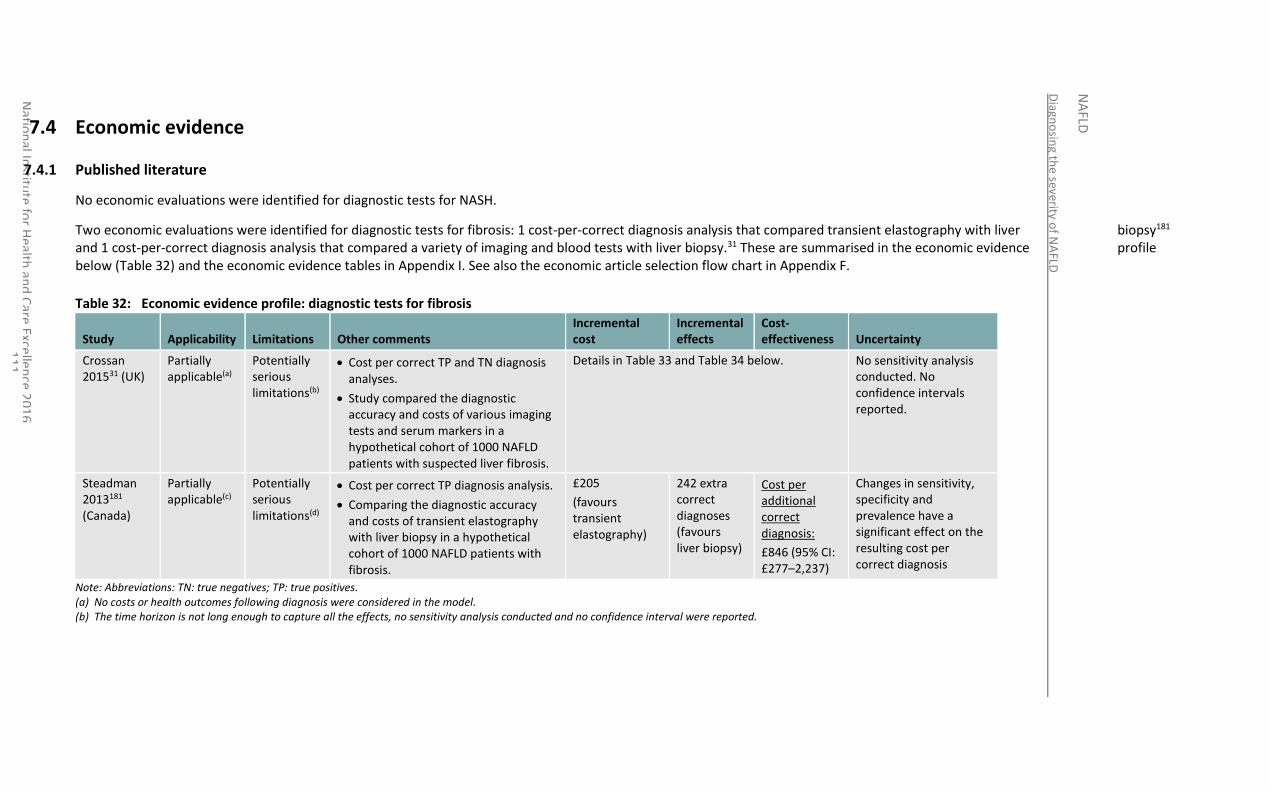
Diagn
osin
g the severity o
f NA
FLD
NA
FLD
Natio
nal In
stitute
for H
ealth an
d C
are Excellen
ce 20
16
1
11
7.4 Economic evidence
7.4.1 Published literature
No economic evaluations were identified for diagnostic tests for NASH.
Two economic evaluations were identified for diagnostic tests for fibrosis: 1 cost-per-correct diagnosis analysis that compared transient elastography with liver biopsy181 and 1 cost-per-correct diagnosis analysis that compared a variety of imaging and blood tests with liver biopsy.31 These are summarised in the economic evidence profile below (Table 32) and the economic evidence tables in Appendix I. See also the economic article selection flow chart in Appendix F.
Table 32: Economic evidence profile: diagnostic tests for fibrosis
Study Applicability Limitations Other comments Incremental cost
Incremental effects
Cost-effectiveness Uncertainty
Crossan 201531 (UK)
Partially applicable(a)
Potentially serious limitations(b)
Cost per correct TP and TN diagnosis analyses.
Study compared the diagnostic accuracy and costs of various imaging tests and serum markers in a hypothetical cohort of 1000 NAFLD patients with suspected liver fibrosis.
Details in Table 33 and Table 34 below. No sensitivity analysis conducted. No confidence intervals reported.
Steadman 2013181 (Canada)
Partially applicable(c)
Potentially serious limitations(d)
Cost per correct TP diagnosis analysis.
Comparing the diagnostic accuracy and costs of transient elastography with liver biopsy in a hypothetical cohort of 1000 NAFLD patients with fibrosis.
£205
(favours transient elastography)
242 extra correct diagnoses (favours liver biopsy)
Cost per additional correct diagnosis:
£846 (95% CI: £277–2,237)
Changes in sensitivity, specificity and prevalence have a significant effect on the resulting cost per correct diagnosis
Note: Abbreviations: TN: true negatives; TP: true positives. (a) No costs or health outcomes following diagnosis were considered in the model. (b) The time horizon is not long enough to capture all the effects, no sensitivity analysis conducted and no confidence interval were reported.
Diagn
osin
g the severity o
f NA
FLD
NA
FLD
Natio
nal In
stitute
for H
ealth an
d C
are Excellen
ce 20
16
1
12
(c) Differences in healthcare system may make results less applicable to UK, no health outcomes following diagnosis were considered in the model. (d) Transient elastography diagnostic accuracy estimates were informed by observational data
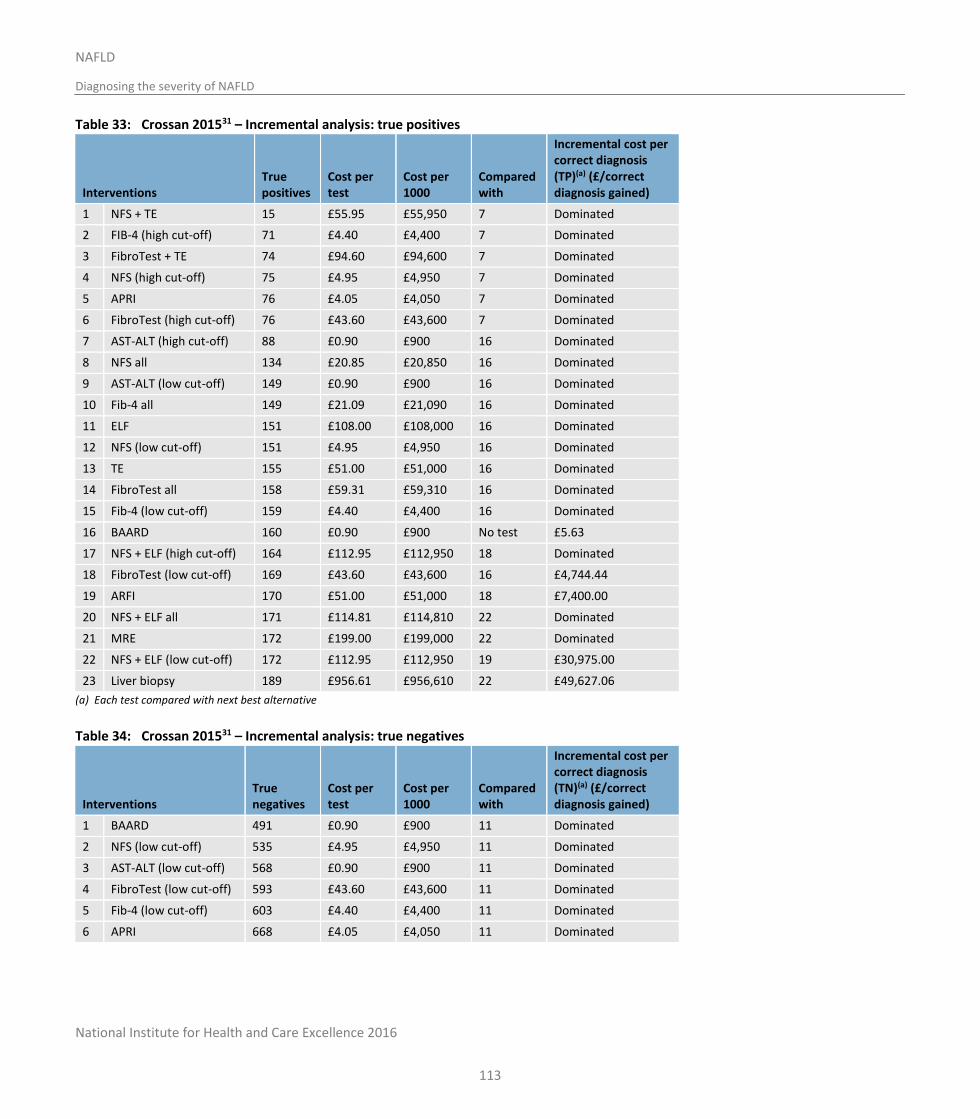
National Institute for Health and Care Excellence 2016
Diagn
osin
g the severity o
f NA
FLD
NA
FLD
NAFLD
Diagnosing the severity of NAFLD
113
Table 33: Crossan 201531 – Incremental analysis: true positives
Interventions True positives
Cost per test
Cost per 1000
Compared with
Incremental cost per correct diagnosis (TP)(a) (£/correct diagnosis gained)
1 NFS + TE 15 £55.95 £55,950 7 Dominated
2 FIB-4 (high cut-off) 71 £4.40 £4,400 7 Dominated
3 FibroTest + TE 74 £94.60 £94,600 7 Dominated
4 NFS (high cut-off) 75 £4.95 £4,950 7 Dominated
5 APRI 76 £4.05 £4,050 7 Dominated
6 FibroTest (high cut-off) 76 £43.60 £43,600 7 Dominated
7 AST-ALT (high cut-off) 88 £0.90 £900 16 Dominated
8 NFS all 134 £20.85 £20,850 16 Dominated
9 AST-ALT (low cut-off) 149 £0.90 £900 16 Dominated
10 Fib-4 all 149 £21.09 £21,090 16 Dominated
11 ELF 151 £108.00 £108,000 16 Dominated
12 NFS (low cut-off) 151 £4.95 £4,950 16 Dominated
13 TE 155 £51.00 £51,000 16 Dominated
14 FibroTest all 158 £59.31 £59,310 16 Dominated
15 Fib-4 (low cut-off) 159 £4.40 £4,400 16 Dominated
16 BAARD 160 £0.90 £900 No test £5.63
17 NFS + ELF (high cut-off) 164 £112.95 £112,950 18 Dominated
18 FibroTest (low cut-off) 169 £43.60 £43,600 16 £4,744.44
19 ARFI 170 £51.00 £51,000 18 £7,400.00
20 NFS + ELF all 171 £114.81 £114,810 22 Dominated
21 MRE 172 £199.00 £199,000 22 Dominated
22 NFS + ELF (low cut-off) 172 £112.95 £112,950 19 £30,975.00
23 Liver biopsy 189 £956.61 £956,610 22 £49,627.06
(a) Each test compared with next best alternative
Table 34: Crossan 201531 – Incremental analysis: true negatives
Interventions True negatives
Cost per test
Cost per 1000
Compared with
Incremental cost per correct diagnosis (TN)(a) (£/correct diagnosis gained)
1 BAARD 491 £0.90 £900 11 Dominated
2 NFS (low cut-off) 535 £4.95 £4,950 11 Dominated
3 AST-ALT (low cut-off) 568 £0.90 £900 11 Dominated
4 FibroTest (low cut-off) 593 £43.60 £43,600 11 Dominated
5 Fib-4 (low cut-off) 603 £4.40 £4,400 11 Dominated
6 APRI 668 £4.05 £4,050 11 Dominated
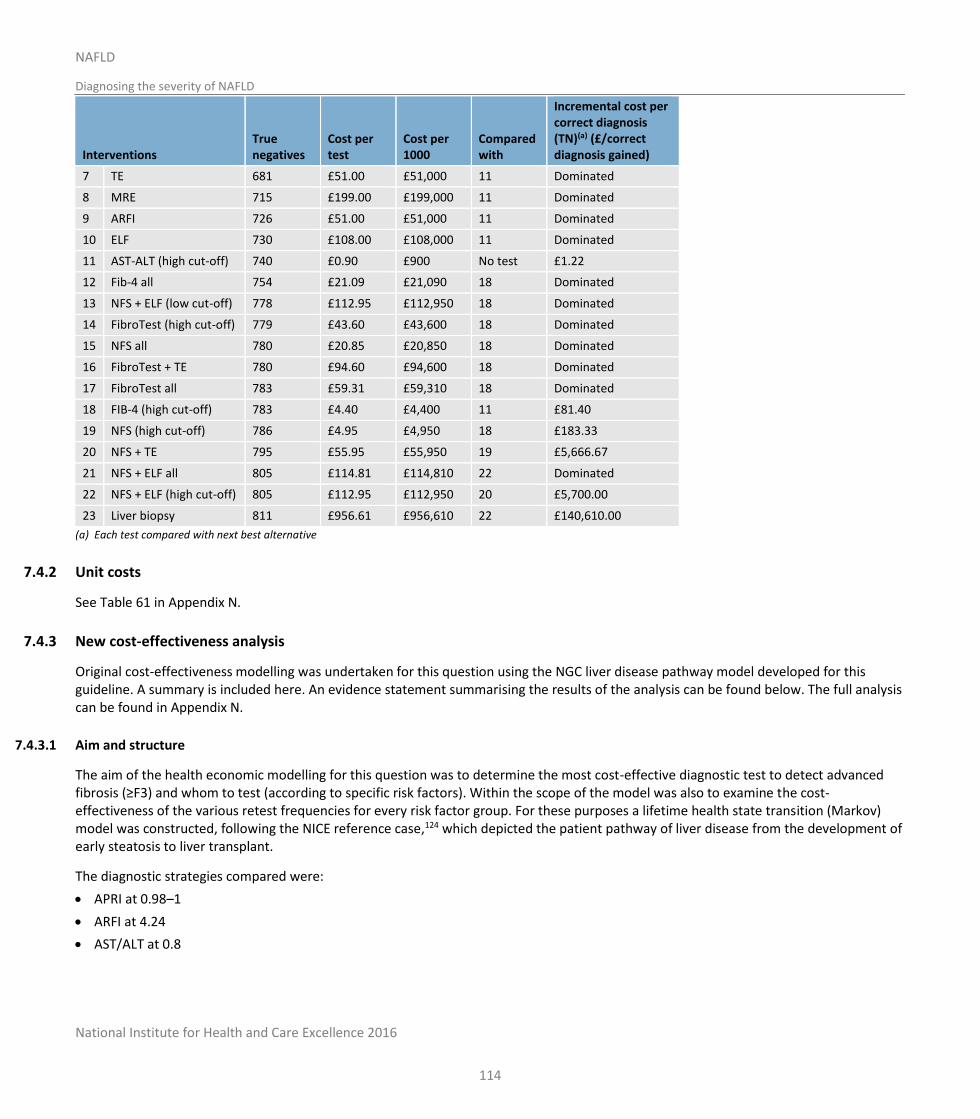
National Institute for Health and Care Excellence 2016
Diagn
osin
g the severity o
f NA
FLD
NA
FLD
NAFLD
Diagnosing the severity of NAFLD
114
Interventions True negatives
Cost per test
Cost per 1000
Compared with
Incremental cost per correct diagnosis (TN)(a) (£/correct diagnosis gained)
7 TE 681 £51.00 £51,000 11 Dominated
8 MRE 715 £199.00 £199,000 11 Dominated
9 ARFI 726 £51.00 £51,000 11 Dominated
10 ELF 730 £108.00 £108,000 11 Dominated
11 AST-ALT (high cut-off) 740 £0.90 £900 No test £1.22
12 Fib-4 all 754 £21.09 £21,090 18 Dominated
13 NFS + ELF (low cut-off) 778 £112.95 £112,950 18 Dominated
14 FibroTest (high cut-off) 779 £43.60 £43,600 18 Dominated
15 NFS all 780 £20.85 £20,850 18 Dominated
16 FibroTest + TE 780 £94.60 £94,600 18 Dominated
17 FibroTest all 783 £59.31 £59,310 18 Dominated
18 FIB-4 (high cut-off) 783 £4.40 £4,400 11 £81.40
19 NFS (high cut-off) 786 £4.95 £4,950 18 £183.33
20 NFS + TE 795 £55.95 £55,950 19 £5,666.67
21 NFS + ELF all 805 £114.81 £114,810 22 Dominated
22 NFS + ELF (high cut-off) 805 £112.95 £112,950 20 £5,700.00
23 Liver biopsy 811 £956.61 £956,610 22 £140,610.00
(a) Each test compared with next best alternative
7.4.2 Unit costs
See Table 61 in Appendix N.
7.4.3 New cost-effectiveness analysis
Original cost-effectiveness modelling was undertaken for this question using the NGC liver disease pathway model developed for this guideline. A summary is included here. An evidence statement summarising the results of the analysis can be found below. The full analysis can be found in Appendix N.
7.4.3.1 Aim and structure
The aim of the health economic modelling for this question was to determine the most cost-effective diagnostic test to detect advanced fibrosis (≥F3) and whom to test (according to specific risk factors). Within the scope of the model was also to examine the cost-effectiveness of the various retest frequencies for every risk factor group. For these purposes a lifetime health state transition (Markov) model was constructed, following the NICE reference case,124 which depicted the patient pathway of liver disease from the development of early steatosis to liver transplant.
The diagnostic strategies compared were:
APRI at 0.98–1
ARFI at 4.24
AST/ALT at 0.8
National Institute for Health and Care Excellence 2016
Diagn
osin
g the severity o
f NA
FLD
NA
FLD
NAFLD
Diagnosing the severity of NAFLD
115
BARD at 2
ELF at 10.51
Ferritin at 2x
FibroTest at 0.47
MRE at 4.15
TE (M probe) at 7.8–7.9
TE (XL probe) at 5.7
FIB-4 at 1.30 and 2.67 followed by ELF at 10.51 for those with indeterminate results
FIB-4 at 1.30 and 2.67 followed by ARFI at 4.24 for those with indeterminate results
NFS at −1.455 and 0.676 followed by ELF at 10.51 for those with indeterminate results
NFS at −1.455 and 0.676 followed by ARFI at 4.24 for those with indeterminate results
No test – treat all
No test – no treatment.
The population was adults with suspected NAFLD, categorised into the following subgroups:
NAFLD, base case prevalence
NAFLD and type 2 diabetes
NAFLD and hypertension
NAFLD and BMI≥30
NAFLD and metabolic syndrome.
The model used diagnostic accuracy data from studies identified in the clinical review in this chapter. Tests that were recognised to follow the dual threshold approach (NFS and FIB-4) were analysed in a secondary comparison where they were combined with the best performing tests from the single threshold test analysis. Test costs were obtained from published literature and GDG sources. Health states costs were constructed under GDG guidance specifically for the purposes of the model. Utilities and transition probabilities were mostly obtained from published literature and through extrapolations from other liver diseases where there was a lack of evidence. The model was built probabilistically to take account of the uncertainty around input parameter point estimates.
Cost-effectiveness was defined by the value of the net monetary benefit (NMB) attributed to every test. The decision rule applied is that the comparator with the highest NMB is the most cost-effective option at the specified cost-effectiveness threshold of £20,000 per QALY gained.
7.4.3.2 Results
Testing for advanced fibrosis was shown to be cost-effective for all risk factor subgroups and retest frequencies at a cost-effectiveness threshold of £20,000 per QALY gained. Across the different retest frequencies the NMB of the first ranked test was greatest at a 2-year retest frequency, though the difference in NMB as the frequency changed was small.
Among the 13 diagnostic strategies included in the first stage comparison, ELF ranked first having the highest diagnostic accuracy across the compared tests. ARFI and MRE followed in terms of ranking having the next best diagnostic accuracies after ELF. FibroTest and TE (M) at 7.8–7.9 followed in fourth and fifth positions due to similarly lower diagnostic accuracies compared to the top 3 ranking tests There was moderate uncertainty in the results with ELF, ARFI and ’no test – no treatment’ having the first place within their 95% confidence intervals.
In the second stage comparison, ELF remained in the first ranking place with the NFS followed by ELF, and FIB-4 followed by ELF strategies following in second and third place. Combinations of tests with ARFI followed in the fourth and fifth place. These results were in line with those in the first stage comparison, with the model favouring the strategies with the highest diagnostic accuracy. Using ELF together with
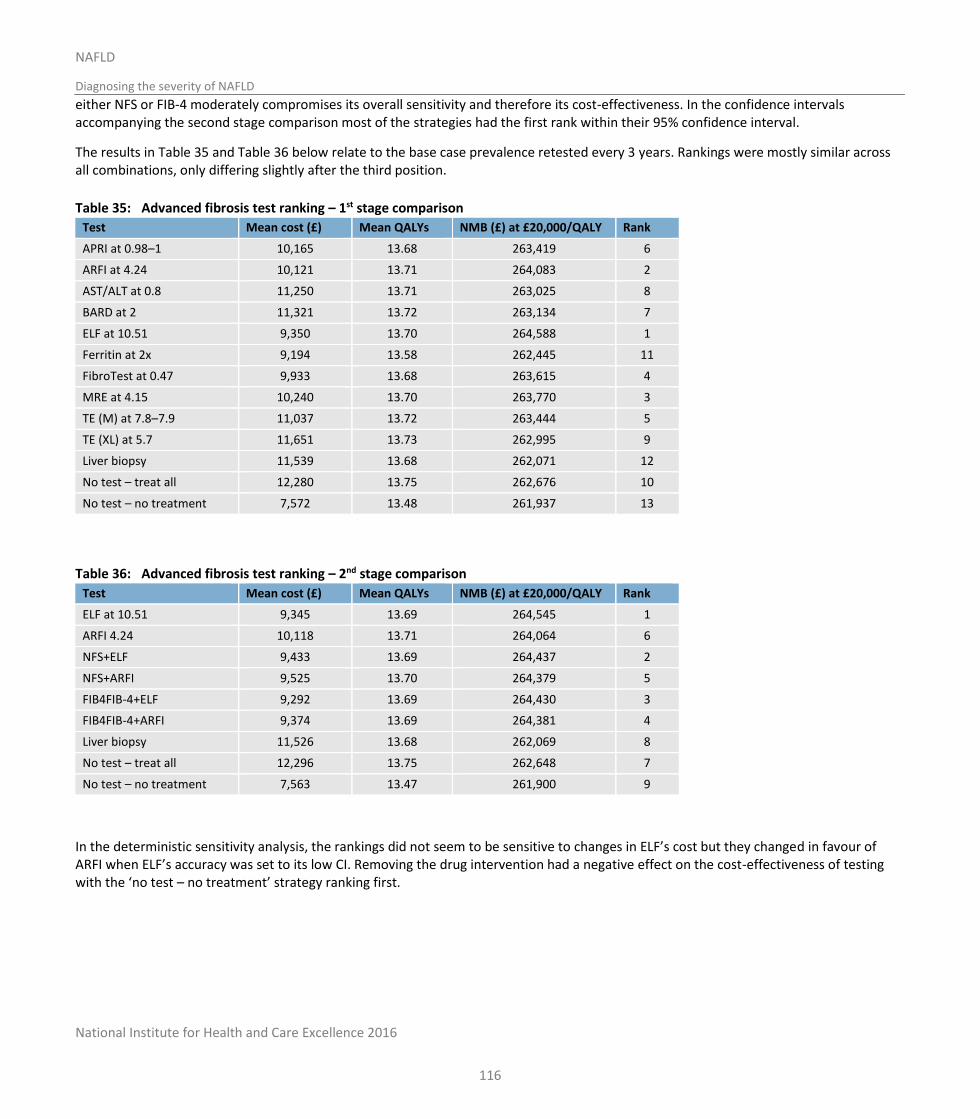
National Institute for Health and Care Excellence 2016
Diagn
osin
g the severity o
f NA
FLD
NA
FLD
NAFLD
Diagnosing the severity of NAFLD
116
either NFS or FIB-4 moderately compromises its overall sensitivity and therefore its cost-effectiveness. In the confidence intervals accompanying the second stage comparison most of the strategies had the first rank within their 95% confidence interval.
The results in Table 35 and Table 36 below relate to the base case prevalence retested every 3 years. Rankings were mostly similar across all combinations, only differing slightly after the third position.
Table 35: Advanced fibrosis test ranking – 1st stage comparison
Test Mean cost (£) Mean QALYs NMB (£) at £20,000/QALY Rank
APRI at 0.98–1 10,165 13.68 263,419 6
ARFI at 4.24 10,121 13.71 264,083 2
AST/ALT at 0.8 11,250 13.71 263,025 8
BARD at 2 11,321 13.72 263,134 7
ELF at 10.51 9,350 13.70 264,588 1
Ferritin at 2x 9,194 13.58 262,445 11
FibroTest at 0.47 9,933 13.68 263,615 4
MRE at 4.15 10,240 13.70 263,770 3
TE (M) at 7.8–7.9 11,037 13.72 263,444 5
TE (XL) at 5.7 11,651 13.73 262,995 9
Liver biopsy 11,539 13.68 262,071 12
No test – treat all 12,280 13.75 262,676 10
No test – no treatment 7,572 13.48 261,937 13
Table 36: Advanced fibrosis test ranking – 2nd stage comparison
Test Mean cost (£) Mean QALYs NMB (£) at £20,000/QALY Rank
ELF at 10.51 9,345 13.69 264,545 1
ARFI 4.24 10,118 13.71 264,064 6
NFS+ELF 9,433 13.69 264,437 2
NFS+ARFI 9,525 13.70 264,379 5
FIB4FIB-4+ELF 9,292 13.69 264,430 3
FIB4FIB-4+ARFI 9,374 13.69 264,381 4
Liver biopsy 11,526 13.68 262,069 8
No test – treat all 12,296 13.75 262,648 7
No test – no treatment 7,563 13.47 261,900 9
In the deterministic sensitivity analysis, the rankings did not seem to be sensitive to changes in ELF’s cost but they changed in favour of ARFI when ELF’s accuracy was set to its low CI. Removing the drug intervention had a negative effect on the cost-effectiveness of testing with the ‘no test – no treatment’ strategy ranking first.
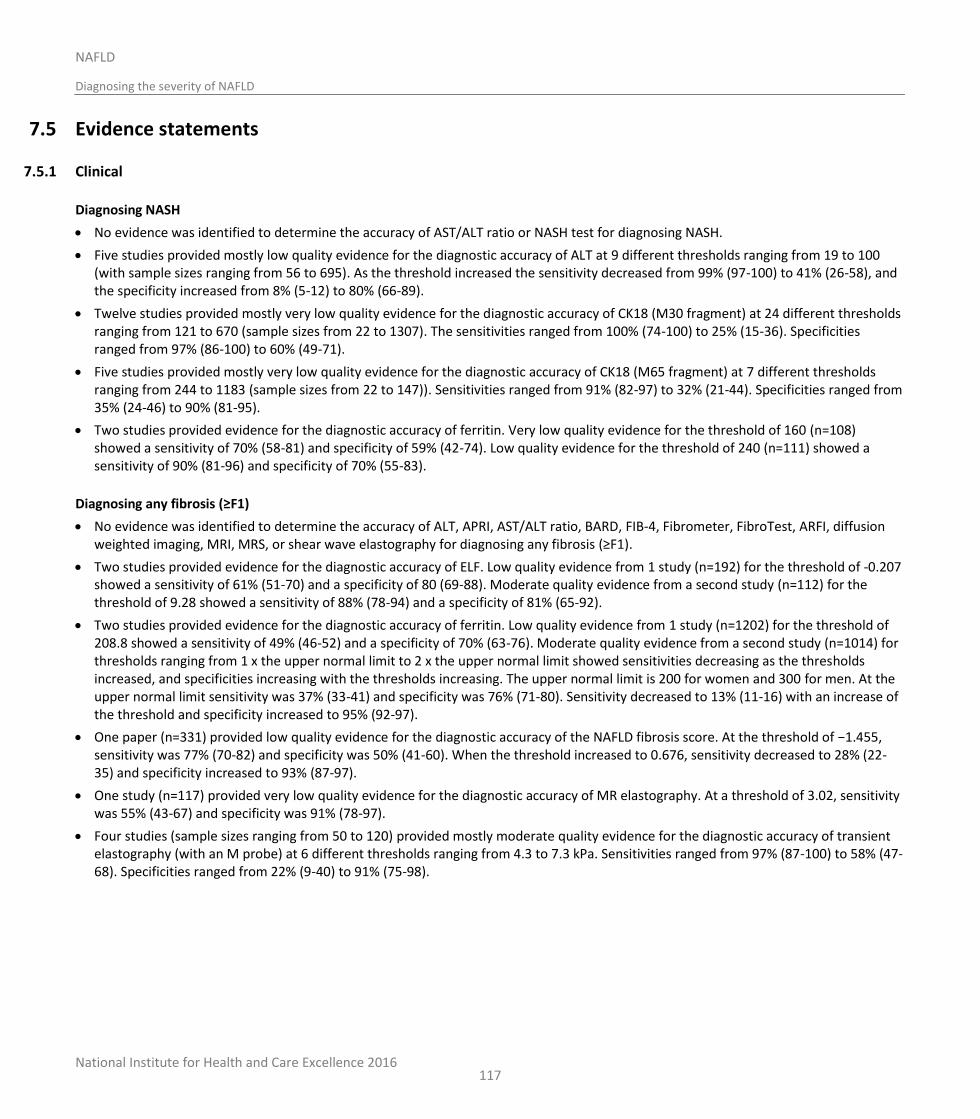
National Institute for Health and Care Excellence 2016
NAFLD
Diagnosing the severity of NAFLD
117
7.5 Evidence statements
7.5.1 Clinical
Diagnosing NASH
No evidence was identified to determine the accuracy of AST/ALT ratio or NASH test for diagnosing NASH.
Five studies provided mostly low quality evidence for the diagnostic accuracy of ALT at 9 different thresholds ranging from 19 to 100 (with sample sizes ranging from 56 to 695). As the threshold increased the sensitivity decreased from 99% (97-100) to 41% (26-58), and the specificity increased from 8% (5-12) to 80% (66-89).
Twelve studies provided mostly very low quality evidence for the diagnostic accuracy of CK18 (M30 fragment) at 24 different thresholds ranging from 121 to 670 (sample sizes from 22 to 1307). The sensitivities ranged from 100% (74-100) to 25% (15-36). Specificities ranged from 97% (86-100) to 60% (49-71).
Five studies provided mostly very low quality evidence for the diagnostic accuracy of CK18 (M65 fragment) at 7 different thresholds ranging from 244 to 1183 (sample sizes from 22 to 147)). Sensitivities ranged from 91% (82-97) to 32% (21-44). Specificities ranged from 35% (24-46) to 90% (81-95).
Two studies provided evidence for the diagnostic accuracy of ferritin. Very low quality evidence for the threshold of 160 (n=108) showed a sensitivity of 70% (58-81) and specificity of 59% (42-74). Low quality evidence for the threshold of 240 (n=111) showed a sensitivity of 90% (81-96) and specificity of 70% (55-83).
Diagnosing any fibrosis (≥F1)
No evidence was identified to determine the accuracy of ALT, APRI, AST/ALT ratio, BARD, FIB-4, Fibrometer, FibroTest, ARFI, diffusion weighted imaging, MRI, MRS, or shear wave elastography for diagnosing any fibrosis (≥F1).
Two studies provided evidence for the diagnostic accuracy of ELF. Low quality evidence from 1 study (n=192) for the threshold of -0.207 showed a sensitivity of 61% (51-70) and a specificity of 80 (69-88). Moderate quality evidence from a second study (n=112) for the threshold of 9.28 showed a sensitivity of 88% (78-94) and a specificity of 81% (65-92).
Two studies provided evidence for the diagnostic accuracy of ferritin. Low quality evidence from 1 study (n=1202) for the threshold of 208.8 showed a sensitivity of 49% (46-52) and a specificity of 70% (63-76). Moderate quality evidence from a second study (n=1014) for thresholds ranging from 1 x the upper normal limit to 2 x the upper normal limit showed sensitivities decreasing as the thresholds increased, and specificities increasing with the thresholds increasing. The upper normal limit is 200 for women and 300 for men. At the upper normal limit sensitivity was 37% (33-41) and specificity was 76% (71-80). Sensitivity decreased to 13% (11-16) with an increase of the threshold and specificity increased to 95% (92-97).
One paper (n=331) provided low quality evidence for the diagnostic accuracy of the NAFLD fibrosis score. At the threshold of −1.455, sensitivity was 77% (70-82) and specificity was 50% (41-60). When the threshold increased to 0.676, sensitivity decreased to 28% (22-35) and specificity increased to 93% (87-97).
One study (n=117) provided very low quality evidence for the diagnostic accuracy of MR elastography. At a threshold of 3.02, sensitivity was 55% (43-67) and specificity was 91% (78-97).
Four studies (sample sizes ranging from 50 to 120) provided mostly moderate quality evidence for the diagnostic accuracy of transient elastography (with an M probe) at 6 different thresholds ranging from 4.3 to 7.3 kPa. Sensitivities ranged from 97% (87-100) to 58% (47-68). Specificities ranged from 22% (9-40) to 91% (75-98).
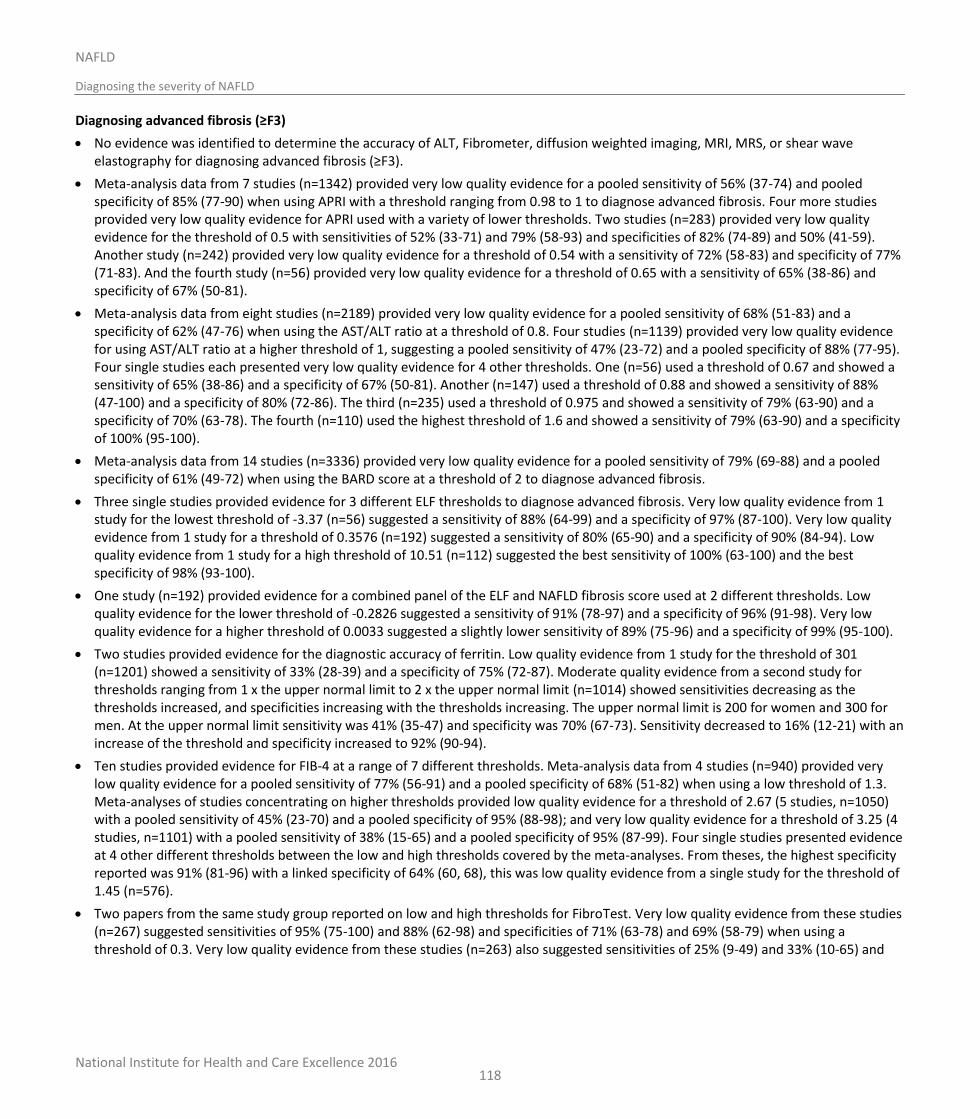
National Institute for Health and Care Excellence 2016
NAFLD
Diagnosing the severity of NAFLD
118
Diagnosing advanced fibrosis (≥F3)
No evidence was identified to determine the accuracy of ALT, Fibrometer, diffusion weighted imaging, MRI, MRS, or shear wave elastography for diagnosing advanced fibrosis (≥F3).
Meta-analysis data from 7 studies (n=1342) provided very low quality evidence for a pooled sensitivity of 56% (37-74) and pooled specificity of 85% (77-90) when using APRI with a threshold ranging from 0.98 to 1 to diagnose advanced fibrosis. Four more studies provided very low quality evidence for APRI used with a variety of lower thresholds. Two studies (n=283) provided very low quality evidence for the threshold of 0.5 with sensitivities of 52% (33-71) and 79% (58-93) and specificities of 82% (74-89) and 50% (41-59). Another study (n=242) provided very low quality evidence for a threshold of 0.54 with a sensitivity of 72% (58-83) and specificity of 77% (71-83). And the fourth study (n=56) provided very low quality evidence for a threshold of 0.65 with a sensitivity of 65% (38-86) and specificity of 67% (50-81).
Meta-analysis data from eight studies (n=2189) provided very low quality evidence for a pooled sensitivity of 68% (51-83) and a specificity of 62% (47-76) when using the AST/ALT ratio at a threshold of 0.8. Four studies (n=1139) provided very low quality evidence for using AST/ALT ratio at a higher threshold of 1, suggesting a pooled sensitivity of 47% (23-72) and a pooled specificity of 88% (77-95). Four single studies each presented very low quality evidence for 4 other thresholds. One (n=56) used a threshold of 0.67 and showed a sensitivity of 65% (38-86) and a specificity of 67% (50-81). Another (n=147) used a threshold of 0.88 and showed a sensitivity of 88% (47-100) and a specificity of 80% (72-86). The third (n=235) used a threshold of 0.975 and showed a sensitivity of 79% (63-90) and a specificity of 70% (63-78). The fourth (n=110) used the highest threshold of 1.6 and showed a sensitivity of 79% (63-90) and a specificity of 100% (95-100).
Meta-analysis data from 14 studies (n=3336) provided very low quality evidence for a pooled sensitivity of 79% (69-88) and a pooled specificity of 61% (49-72) when using the BARD score at a threshold of 2 to diagnose advanced fibrosis.
Three single studies provided evidence for 3 different ELF thresholds to diagnose advanced fibrosis. Very low quality evidence from 1 study for the lowest threshold of -3.37 (n=56) suggested a sensitivity of 88% (64-99) and a specificity of 97% (87-100). Very low quality evidence from 1 study for a threshold of 0.3576 (n=192) suggested a sensitivity of 80% (65-90) and a specificity of 90% (84-94). Low quality evidence from 1 study for a high threshold of 10.51 (n=112) suggested the best sensitivity of 100% (63-100) and the best specificity of 98% (93-100).
One study (n=192) provided evidence for a combined panel of the ELF and NAFLD fibrosis score used at 2 different thresholds. Low quality evidence for the lower threshold of -0.2826 suggested a sensitivity of 91% (78-97) and a specificity of 96% (91-98). Very low quality evidence for a higher threshold of 0.0033 suggested a slightly lower sensitivity of 89% (75-96) and a specificity of 99% (95-100).
Two studies provided evidence for the diagnostic accuracy of ferritin. Low quality evidence from 1 study for the threshold of 301 (n=1201) showed a sensitivity of 33% (28-39) and a specificity of 75% (72-87). Moderate quality evidence from a second study for thresholds ranging from 1 x the upper normal limit to 2 x the upper normal limit (n=1014) showed sensitivities decreasing as the thresholds increased, and specificities increasing with the thresholds increasing. The upper normal limit is 200 for women and 300 for men. At the upper normal limit sensitivity was 41% (35-47) and specificity was 70% (67-73). Sensitivity decreased to 16% (12-21) with an increase of the threshold and specificity increased to 92% (90-94).
Ten studies provided evidence for FIB-4 at a range of 7 different thresholds. Meta-analysis data from 4 studies (n=940) provided very low quality evidence for a pooled sensitivity of 77% (56-91) and a pooled specificity of 68% (51-82) when using a low threshold of 1.3. Meta-analyses of studies concentrating on higher thresholds provided low quality evidence for a threshold of 2.67 (5 studies, n=1050) with a pooled sensitivity of 45% (23-70) and a pooled specificity of 95% (88-98); and very low quality evidence for a threshold of 3.25 (4 studies, n=1101) with a pooled sensitivity of 38% (15-65) and a pooled specificity of 95% (87-99). Four single studies presented evidence at 4 other different thresholds between the low and high thresholds covered by the meta-analyses. From theses, the highest specificity reported was 91% (81-96) with a linked specificity of 64% (60, 68), this was low quality evidence from a single study for the threshold of 1.45 (n=576).
Two papers from the same study group reported on low and high thresholds for FibroTest. Very low quality evidence from these studies (n=267) suggested sensitivities of 95% (75-100) and 88% (62-98) and specificities of 71% (63-78) and 69% (58-79) when using a threshold of 0.3. Very low quality evidence from these studies (n=263) also suggested sensitivities of 25% (9-49) and 33% (10-65) and
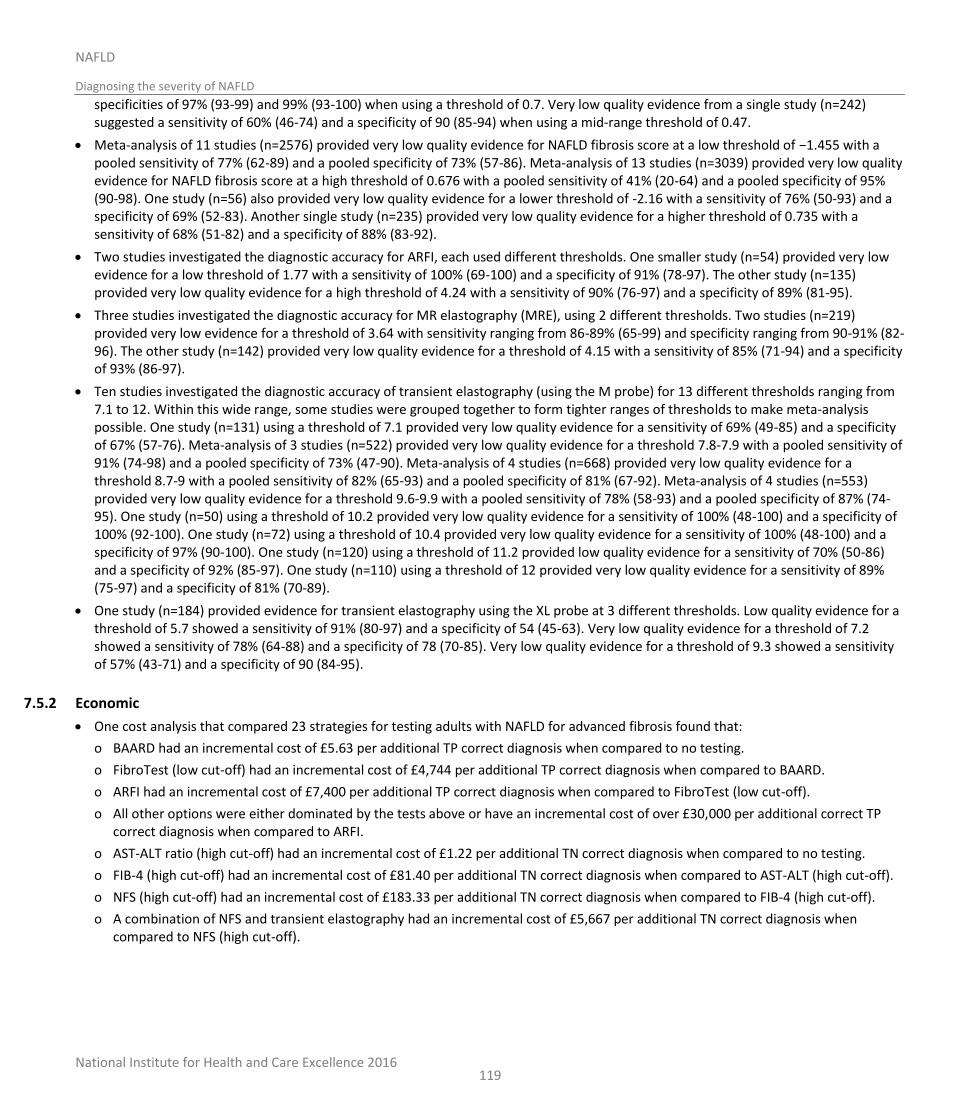
National Institute for Health and Care Excellence 2016
NAFLD
Diagnosing the severity of NAFLD
119
specificities of 97% (93-99) and 99% (93-100) when using a threshold of 0.7. Very low quality evidence from a single study (n=242) suggested a sensitivity of 60% (46-74) and a specificity of 90 (85-94) when using a mid-range threshold of 0.47.
Meta-analysis of 11 studies (n=2576) provided very low quality evidence for NAFLD fibrosis score at a low threshold of −1.455 with a pooled sensitivity of 77% (62-89) and a pooled specificity of 73% (57-86). Meta-analysis of 13 studies (n=3039) provided very low quality evidence for NAFLD fibrosis score at a high threshold of 0.676 with a pooled sensitivity of 41% (20-64) and a pooled specificity of 95% (90-98). One study (n=56) also provided very low quality evidence for a lower threshold of -2.16 with a sensitivity of 76% (50-93) and a specificity of 69% (52-83). Another single study (n=235) provided very low quality evidence for a higher threshold of 0.735 with a sensitivity of 68% (51-82) and a specificity of 88% (83-92).
Two studies investigated the diagnostic accuracy for ARFI, each used different thresholds. One smaller study (n=54) provided very low evidence for a low threshold of 1.77 with a sensitivity of 100% (69-100) and a specificity of 91% (78-97). The other study (n=135) provided very low quality evidence for a high threshold of 4.24 with a sensitivity of 90% (76-97) and a specificity of 89% (81-95).
Three studies investigated the diagnostic accuracy for MR elastography (MRE), using 2 different thresholds. Two studies (n=219) provided very low evidence for a threshold of 3.64 with sensitivity ranging from 86-89% (65-99) and specificity ranging from 90-91% (82-96). The other study (n=142) provided very low quality evidence for a threshold of 4.15 with a sensitivity of 85% (71-94) and a specificity of 93% (86-97).
Ten studies investigated the diagnostic accuracy of transient elastography (using the M probe) for 13 different thresholds ranging from 7.1 to 12. Within this wide range, some studies were grouped together to form tighter ranges of thresholds to make meta-analysis possible. One study (n=131) using a threshold of 7.1 provided very low quality evidence for a sensitivity of 69% (49-85) and a specificity of 67% (57-76). Meta-analysis of 3 studies (n=522) provided very low quality evidence for a threshold 7.8-7.9 with a pooled sensitivity of 91% (74-98) and a pooled specificity of 73% (47-90). Meta-analysis of 4 studies (n=668) provided very low quality evidence for a threshold 8.7-9 with a pooled sensitivity of 82% (65-93) and a pooled specificity of 81% (67-92). Meta-analysis of 4 studies (n=553) provided very low quality evidence for a threshold 9.6-9.9 with a pooled sensitivity of 78% (58-93) and a pooled specificity of 87% (74-95). One study (n=50) using a threshold of 10.2 provided very low quality evidence for a sensitivity of 100% (48-100) and a specificity of 100% (92-100). One study (n=72) using a threshold of 10.4 provided very low quality evidence for a sensitivity of 100% (48-100) and a specificity of 97% (90-100). One study (n=120) using a threshold of 11.2 provided low quality evidence for a sensitivity of 70% (50-86) and a specificity of 92% (85-97). One study (n=110) using a threshold of 12 provided very low quality evidence for a sensitivity of 89% (75-97) and a specificity of 81% (70-89).
One study (n=184) provided evidence for transient elastography using the XL probe at 3 different thresholds. Low quality evidence for a threshold of 5.7 showed a sensitivity of 91% (80-97) and a specificity of 54 (45-63). Very low quality evidence for a threshold of 7.2 showed a sensitivity of 78% (64-88) and a specificity of 78 (70-85). Very low quality evidence for a threshold of 9.3 showed a sensitivity of 57% (43-71) and a specificity of 90 (84-95).
7.5.2 Economic
One cost analysis that compared 23 strategies for testing adults with NAFLD for advanced fibrosis found that:
o BAARD had an incremental cost of £5.63 per additional TP correct diagnosis when compared to no testing.
o FibroTest (low cut-off) had an incremental cost of £4,744 per additional TP correct diagnosis when compared to BAARD.
o ARFI had an incremental cost of £7,400 per additional TP correct diagnosis when compared to FibroTest (low cut-off).
o All other options were either dominated by the tests above or have an incremental cost of over £30,000 per additional correct TP correct diagnosis when compared to ARFI.
o AST-ALT ratio (high cut-off) had an incremental cost of £1.22 per additional TN correct diagnosis when compared to no testing.
o FIB-4 (high cut-off) had an incremental cost of £81.40 per additional TN correct diagnosis when compared to AST-ALT (high cut-off).
o NFS (high cut-off) had an incremental cost of £183.33 per additional TN correct diagnosis when compared to FIB-4 (high cut-off).
o A combination of NFS and transient elastography had an incremental cost of £5,667 per additional TN correct diagnosis when compared to NFS (high cut-off).
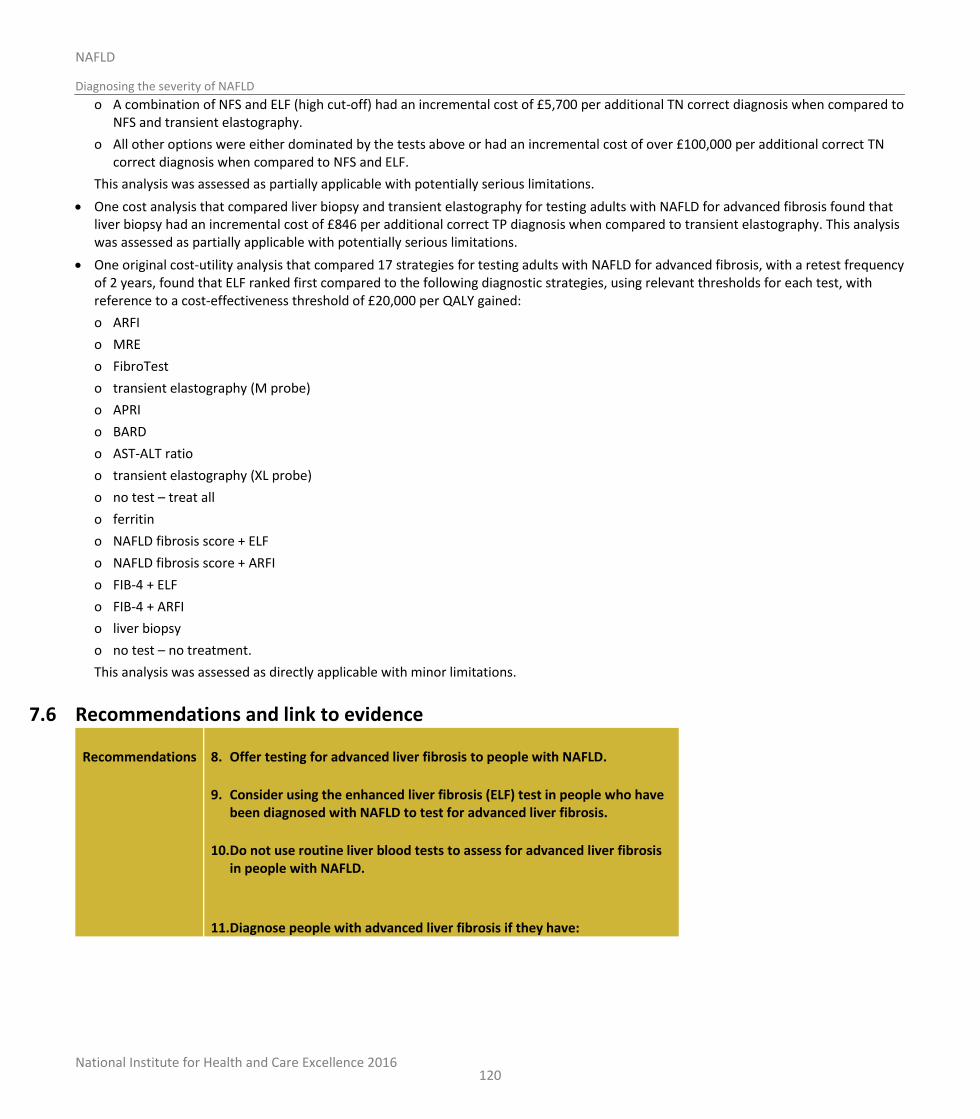
National Institute for Health and Care Excellence 2016
NAFLD
Diagnosing the severity of NAFLD
120
o A combination of NFS and ELF (high cut-off) had an incremental cost of £5,700 per additional TN correct diagnosis when compared to NFS and transient elastography.
o All other options were either dominated by the tests above or had an incremental cost of over £100,000 per additional correct TN correct diagnosis when compared to NFS and ELF.
This analysis was assessed as partially applicable with potentially serious limitations.
One cost analysis that compared liver biopsy and transient elastography for testing adults with NAFLD for advanced fibrosis found that liver biopsy had an incremental cost of £846 per additional correct TP diagnosis when compared to transient elastography. This analysis was assessed as partially applicable with potentially serious limitations.
One original cost-utility analysis that compared 17 strategies for testing adults with NAFLD for advanced fibrosis, with a retest frequency of 2 years, found that ELF ranked first compared to the following diagnostic strategies, using relevant thresholds for each test, with reference to a cost-effectiveness threshold of £20,000 per QALY gained:
o ARFI
o MRE
o FibroTest
o transient elastography (M probe)
o APRI
o BARD
o AST-ALT ratio
o transient elastography (XL probe)
o no test – treat all
o ferritin
o NAFLD fibrosis score + ELF
o NAFLD fibrosis score + ARFI
o FIB-4 + ELF
o FIB-4 + ARFI
o liver biopsy
o no test – no treatment.
This analysis was assessed as directly applicable with minor limitations.
7.6 Recommendations and link to evidence
Recommendations 8. Offer testing for advanced liver fibrosis to people with NAFLD.
9. Consider using the enhanced liver fibrosis (ELF) test in people who have been diagnosed with NAFLD to test for advanced liver fibrosis.
10. Do not use routine liver blood tests to assess for advanced liver fibrosis in people with NAFLD.
11. Diagnose people with advanced liver fibrosis if they have:
National Institute for Health and Care Excellence 2016
NAFLD
Diagnosing the severity of NAFLD
121
an ELF score of 10.51 or above and
NAFLD.
12. Refer adults and young people diagnosed with advanced liver fibrosis to a relevant specialist in hepatology.
13. Explain to people with an ELF score below 10.51 that:
they are unlikely to have advanced liver fibrosis and
reassessment for advanced liver fibrosis every 3 years for adults and every 2 years for children and young people is sufficient for regular monitoring and
no interim tests are needed.
Give the person advice about lifestyle modifications they may be able to make (see chapters 10-14).
Research recommendations
5. Which non-invasive tests most accurately identify NAFLD and non-alcoholic steatohepatitis (NASH)?
6. Which non-invasive tests most accurately diagnose NAFLD and advanced liver fibrosis in children and young people?
Relative values of different diagnostic measures and outcomes
For decision-making, the GDG focused on diagnostic accuracy measures including the sensitivity and specificity of the tests for a diagnosis of NASH, any fibrosis and advanced fibrosis. It was noted that the data would be fed into the health economic model in order to identify the most cost-effective test, or sequence of tests, for the diagnosis of advanced fibrosis. The GDG agreed that, for a condition such as NAFLD with advanced fibrosis (where early identification is essential for effective management), it was crucial to have a highly sensitive test, especially early on in the patient pathway if multiple tests are used. This is because a sensitive test will result in few people with advanced fibrosis being missed (few false negative results). The GDG noted that the cut-off threshold used to define a positive test can vary and assessed the accuracy of the tests at a variety of published thresholds. A threshold set to increase the sensitivity of the test will consequently reduce the specificity. The GDG also discussed the importance of a specific test. A specific test will result in very few NAFLD patients without advanced fibrosis being incorrectly labelled (false positive results). This is particularly important if the results of the test determine people that would then have an invasive, dangerous or costly procedure or treatment.
Trade-off between clinical benefits and harms
The GDG was interested in the performance of blood tests and imaging tests in the diagnosis of NASH, any fibrosis or advanced fibrosis, in people known to have NAFLD. The GDG was not interested in the performance of these tests as screening tools in the general population. Therefore, test performance was assessed from studies matching the intended NAFLD population.
Diagnostic tests for NASH:
No evidence was identified for the performance of AST/ALT ratio or the NASH test in
National Institute for Health and Care Excellence 2016
NAFLD
Diagnosing the severity of NAFLD
122
the diagnosis of NASH. The GDG considered that the evidence reviewed for certain assessment tools – namely ALT and keratin 18 [M30 fragment] – demonstrated limited efficacy for the diagnosis of NASH and would not be recommended as tests. Therefore, the evidence would not be considered within the economic model. Specifically, although both of these tests demonstrated a general trend towards an improvement in sensitivity (to the detriment of specificity) as the threshold values changed between studies (and vice versa), the mean AUC of approximately 0.6 for ALT studies and 0.75 for keratin 18 [M30 fragment] studies led the GDG to conclude that neither were suitable for further consideration. The identified studies evaluating ferritin as an assessment tool for NASH showed only moderate sensitivity and specificity, and a mean AUC of 0.6. Nevertheless, the GDG noted that this is a readily available, relatively cheap assay that has not been fully assessed within this context, and concluded that a research recommendation (for studies assessing the utility of ferritin – as well as other laboratory tests) in making the diagnosis of NASH was justified.
The GDG felt that the identified evidence regarding keratin 18 [M65 fragment] once again demonstrated a marked trade-off between sensitivity and specificity among different studies, and a wide range of threshold values; nevertheless, it also noted the acceptable mean AUC of 0.81. The GDG noted the biological plausibility of why measurement of this protein may be expected to be a useful diagnostic tool for NASH. On balance, the GDG concluded that the evaluated evidence was not strong enough to recommend keratin 18 [M65] outright as a diagnostic test for NASH but, as already described, a research recommendation was justified for studies evaluating novel biomarkers as diagnostic tests for NASH.
Diagnostic tests for any fibrosis (greater than or equal to F1):
The quantity of evidence identified for this part of review was more limited than that relevant to the other sections. Although relevant studies were found for the ELF test, ferritin, NAFLD fibrosis score, MR elastography and transient elastography, none were available for ALT, APRI, AST/ALT ratio, BARD, FIB-4, fibrometer, FibroTest, ARFI, diffusion weighted imaging, MRI, MRS or shear wave elastography.
The GDG noted that the available evidence was, at best, only moderate quality and once again observed that very different threshold values were applied between studies for the same test. In addition, members of the GDG questioned the benefit of attempting to identify all people with any fibrosis, as some evidence suggests that it is only those adults, children and young people with NAFLD and who have advanced fibrosis (greater than or equal to F3) who merit the closest monitoring and who are at greatest risk for the complications of NAFLD.43,44,176 As such, the GDG concluded that no assessment tools from this part of the review could be recommended for use based on this evidence, and hence were not included in the economic modelling.
Diagnostic tests for advanced fibrosis (greater than or equal to F3):
Overall, more evidence was identified for this part of the review; however, no relevant evidence was identified for ALT, ARFI, fibrometer, diffusion-weighted imaging or MRS. Both blood tests and imaging-based tests were reviewed. The majority of the evidence was from populations with biopsy-proven NAFLD, except 1 study which included people with ultrasound-diagnosed NAFLD.
Evidence was found which evaluated the efficacy of a number of laboratory-based tests. Pooled meta-analysis data for APRI (at thresholds of between 0.98 and 1.0) demonstrated sensitivity of 53% but specificity of 85%; the high specificity led the GDG to conclude that APRI potentially could be considered for use. The included studies assessing AST/ALT ratio only showed moderate sensitivity and specificity with
National Institute for Health and Care Excellence 2016
NAFLD
Diagnosing the severity of NAFLD
123
an AUC of 0.79, however, the GDG observed that this test is widely available and modestly priced, so concluded that it could still be considered as an option. The review of those studies evaluating BARD concluded that, although only a modest AUC and specificity was demonstrated on pooled meta-analysis data, higher levels of sensitivity were reported. The 3 studies evaluating ELF (including data from children and young people) all demonstrated high sensitivity and high specificity (with AUC of 0.97), suggesting a promising option. One study looked at a combined panel of the ELF with the NAFLD fibrosis score which similarly demonstrated high sensitivity and specificity (with AUC 0.98) and was also agreed as promising. Despite noting that those included studies that evaluated ferritin all demonstrated low sensitivities, the GDG felt that this still merited further consideration because, although the test is reasonably priced and widely available, the GDG was interested in seeing if the performance of the low sensitivities within the economic model may warrant a ‘do not use’ recommendation. The GDG noted that studies assessing FIB-4, in which a threshold value was used that maximised specificity, tended to be those with the lowest sensitivities but that, on balance, this test could be considered, focusing on those studies which exhibited high sensitivities based on the thresholds assessed. Those studies evaluated for the NAFLD fibrosis score tended to show high sensitivity at the lower threshold and high specificity at the higher threshold (as the test was designed to do), and the GDG agreed that this would also be a possible test to consider for modelling. The GDG expressed concerns about FibroTest, as the exact algorithm to generate the test score is not widely available, and financial support for 2 of the studies included in the review had been obtained from the manufacturer of the test; nevertheless, some promising data independent from the manufacturer were also identified.3
Studies were also identified for ultrasound-based assessment tools. The GDG noted that both studies reviewed for ARFI displayed high sensitivity and specificity, with an AUC of 0.90. With the promising results but limited amount of evidence investigating this imaging technique, the GDG felt this may warrant a research recommendation. The evaluated evidence for transient elastography demonstrated both high sensitivities and specificities (tending to be higher in studies using the M probe than the XL probe – although this may reflect the fact that the M probe is a more established technology), and the AUC was 0.93 for M-probe studies; the GDG agreed that, if considered, the assumption is that the test is performed according to the manufacturer’s instructions using the most appropriate probe in each person.
Finally, evidence was reviewed for magnetic resonance-based assessment tools. The identified studies including MR elastography demonstrated high sensitivity and specificity. The identified study including MRI was not felt suitable for further assessment by the GDG, as the criteria used in this study to identify those with NAFLD and advanced fibrosis were felt to be subjective and non-reproducible.
All of the above tests considered to demonstrate potentially promising results were included within an original economic model to consider the cost-effectiveness. When taking the results of the economic model and clinical evidence into account, the GDG agreed that the ELF test was the most clinically and cost-effectiveness option. However, it was noted that the evidence base informing this recommendation was from a relatively small population and therefore it was agreed that testing for advanced liver fibrosis should be offered and that ELF could be considered as the test that was used in both adults and children and young people. The GDG agreed that a figure of ELF test score greater than 10.51 would be used to presume F3 orF4 fibrosis, as this was the threshold used in the largest study using ELF evaluated within this review.
National Institute for Health and Care Excellence 2016
NAFLD
Diagnosing the severity of NAFLD
124
Trade-off between net clinical effects and costs
Two relevant published economic evaluations were identified for this review.
Crossan 2015 compared 23 different diagnostic tests, or combinations of tests, and sought to evaluate the cost of identifying each true positive with NAFLD, and the cost of identifying each true negative without NAFLD. In the true positive results, BAARD was found to cost £5.63 per diagnosis compared with no test, and to dominate 15 more expensive but less effective tests. The only tests more effective than BAARD did so at excessive cost per additional correct diagnosis. The cost-per-true negative results showed that the AST/ALT ratio cost £1.22 per correct diagnosis compared to no test and dominated 10 less effective tests. FIB-4 (with a high cut-off) gave an additional 43 correct diagnoses per 1,000 people at a cost of £81.40 per additional correct diagnosis. No test or combination did well in diagnosing both true positives and true negatives. This analysis did not take into account the difference in future health or future healthcare costs resulting from using the different tests, and so the GDG was unable to draw any conclusions from it on which test would be most cost-effective from the perspective of the NHS as a whole. The GDG also noted the lack of confidence intervals and absence of sensitivity analysis in this evaluation.
Steadman 2013 was another cost-per-diagnosis study, which compared transient elastography to liver biopsy in a cohort of people with NAFLD. It found that liver biopsy was more accurate at a cost of £846 per additional (true positive) correct diagnosis. However, the GDG could not reach a conclusion on whether £846 is a cost-effective price per correct diagnosis as the study design meant that, again, there was no information on the future health benefits and future additional health costs or savings from using a more or less accurate diagnostic test. Additional limitations of this study included the use of observational data regarding the efficacy of transient elastography in diagnosing advanced NAFLD.
An original cost-utility analysis was conducted for this guideline to address the cost-effectiveness of diagnostic tests for advanced fibrosis in adults, alongside the review questions in Chapters 5, 6 and 8.
This analysis found that, given a retesting frequency of 2 years (see Chapter 8), ELF was the highest ranking of the 17 testing strategies compared at a cost-effectiveness threshold of £20,000 per QALY gained, followed by combinations of either NFS or FIB-4 with ELF or ARFI. Given the uncertainty in the data used, it is not certain that
ELF was cost-effective compared to these combinations, but it was placed first in
59% of probabilistic simulations.
Although ELF, ARFI and combinations of these with dual threshold tests were agreed by the GDG to be clinically and potentially cost-effective options for assessing the severity of disease in people with NAFLD, the GDG also discussed practical reasons for choosing between them. Specifically, given that it is anticipated that most severity testing for people with NAFLD could be undertaken in primary care, it would be more practical if the test used to assess severity is a blood test that can be easily sent from a general practitioner’s surgery rather than an imaging test (ARFI) that is not currently available outside of secondary care. Combinations involving NFS or FIB-4 are currently used quite commonly, and these are a possible option, but given that using ELF alone requires only a single blood test, and therefore does not require people to return to the surgery for an additional appointment and additional blood test (but can produce a quicker – and slightly more accurate – diagnosis), the GDG agreed that using ELF alone is preferable.
The GDG also noted that the accuracy and cost-effectiveness of ELF were underestimated in the model, compared to the clinical evidence in this chapter, as the sensitivity was decreased from 100% to 94% to avoid the technical constraints
National Institute for Health and Care Excellence 2016
NAFLD
Diagnosing the severity of NAFLD
125
that prevent using a perfect 100% in a model (see N.2.3.3.1), and so, if anything, these results were in fact slightly biased against ELF.
The GDG therefore concluded that ELF is both the most cost-effective and the most appropriate test for advanced fibrosis in adults with NAFLD and should be considered for people with NAFLD.
No original economic analysis was conducted on the cost-effectiveness of diagnostic testing for NASH or for any-stage fibrosis in adults, as the GDG judged that none of the tests for those conditions have yet been proven to be sufficiently clinically effective to be considered as options.
No economic analysis was conducted relating to diagnosing NASH, any fibrosis or advanced fibrosis in children and young people under 18 years due to a lack of data on the diagnostic accuracy of these tests in under 18s.
Quality of evidence Many of the included studies were of low or very low quality by GRADE criteria. Much of the evidence was assessed as being at serious or very serious risk of bias due to issues with patient selection, unclear reporting on whether the index test results were interpreted without knowledge of biopsy findings, lack of pre-specified thresholds for the index tests and unclear timing between index test and biopsy. Imprecision around the effects, size and magnitude further added to the downgrading of the evidence.
Studies may report sensitivity and specificity values at a pre-specified published cut-off threshold, or they may determine the optimal threshold from a ROC analysis. This resulted in a range of thresholds being reported for some index tests. If all the sensitivity and specificity values from the range of cut-off thresholds are pooled together, this can result in an overestimation of the diagnostic accuracy in comparison to another index test where sensitivity and specificity values are only reported for 1 cut-off threshold. The GDG noted that a very wide range of threshold values was used between different studies for many of the assessment tools under evaluation within this review, with a number of reasons becoming apparent to justify this. Firstly, in some cases, assessment tools represent newer technologies for which normal and pathological ranges have not yet been fully defined. Secondly, in many cases, the use of a threshold value for a particular assessment tool that provided a high sensitivity was often at the compromise of a reduction in specificity (and vice-versa); as such, the performance of different threshold values had been evaluated even for the same assessment tool to attempt to ascertain the most acceptable balance between sensitivity and specificity. The GDG expressed concerns that so many of the identified studies failed to define normal or abnormal threshold values a priori, and also that threshold values were so hugely variable between different studies evaluating the same assessment tool.
One study initially considered for inclusion investigated MRI using a threshold narratively described by the authors as “diffuse irregularity of the surface of the liver”. The GDG subsequently agreed to exclude this paper on the basis that the criterion described in this study to identify those with NAFLD and advanced fibrosis was felt to be subjective, not adequately quantified and non-reproducible in a way that could easily be explained if required within a recommendation.
The 2 published economic studies included in this review were assessed as partially applicable with potentially serious limitations. As cost analyses only, the GDG were unable to draw conclusions based on their results. The original economic analysis conducted for this question was assessed as directly applicable and with minor limitations.
National Institute for Health and Care Excellence 2016
NAFLD
Diagnosing the severity of NAFLD
126
Other considerations The GDG noted that in the absence of a recommendation for diagnosis of NAFLD, it would be identified incidentally (for example, abdominal imaging requested to investigate abdominal pain incidentally detects fatty liver) rather than through targeted case-finding. The GDG emphasised that regardless of the means by which the diagnosis of NAFLD has been made, all affected people should undergo a severity assessment through the pathway described in these recommendations.
It was agreed by the GDG that all people who have been identified as having an ELF test of at least 10.51 (and therefore presumed to have F3 or F4 fibrosis) should be referred to the care of a specialist in hepatology (or a paediatric hepatologist as appropriate). The GDG agreed that these are the people with NAFLD who need closest monitoring (given their potential development of complications of chronic liver disease), and also the people most likely to be considered for pharmacotherapy for the condition. These aspects of assessment and management of the condition were universally agreed by the GDG to be best suited to secondary care, and specifically a specialist in hepatology (either an adult or paediatric specialist, as appropriate).
The GDG also noted that hepatocellular carcinoma (HCC) has been recognised to occur in people with NAFLD without cirrhosis. However, given that the incidence of HCC in people with NAFLD without cirrhosis appears to be substantially lower than those with NAFLD with associated cirrhosis230 (for whom surveillance for HCC is recommended in the draft NICE Cirrhosis guideline118), the GDG felt that it was outside of its remit to provide further guidance on this issue.
Research recommendations
The GDG made high-priority research recommendations to identify the most accurate non-invasive tests to diagnose NASH in people of all ages, and to diagnose advanced fibrosis in children and young people. See Appendix Q for further details.
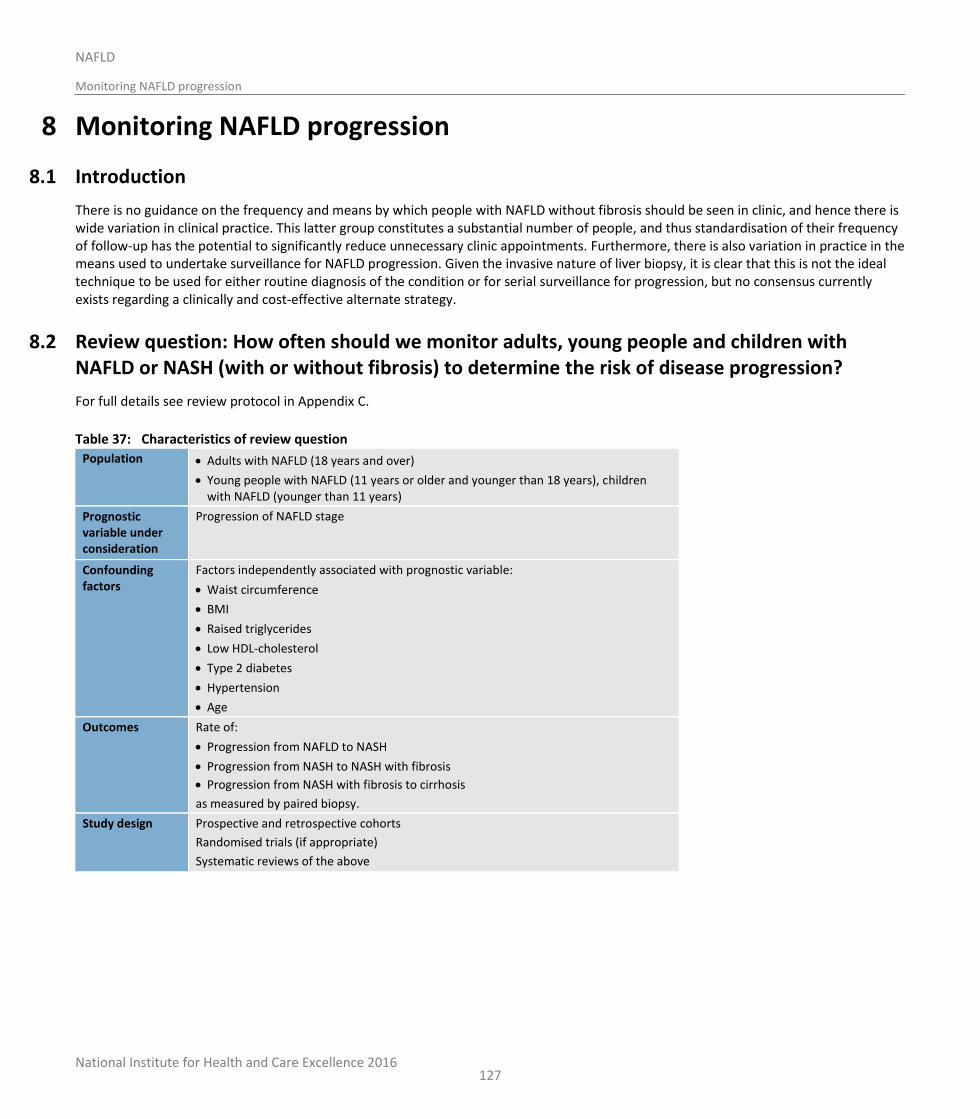
National Institute for Health and Care Excellence 2016
NAFLD
Monitoring NAFLD progression
127
8 Monitoring NAFLD progression
8.1 Introduction
There is no guidance on the frequency and means by which people with NAFLD without fibrosis should be seen in clinic, and hence there is wide variation in clinical practice. This latter group constitutes a substantial number of people, and thus standardisation of their frequency of follow-up has the potential to significantly reduce unnecessary clinic appointments. Furthermore, there is also variation in practice in the means used to undertake surveillance for NAFLD progression. Given the invasive nature of liver biopsy, it is clear that this is not the ideal technique to be used for either routine diagnosis of the condition or for serial surveillance for progression, but no consensus currently exists regarding a clinically and cost-effective alternate strategy.
8.2 Review question: How often should we monitor adults, young people and children with NAFLD or NASH (with or without fibrosis) to determine the risk of disease progression?
For full details see review protocol in Appendix C.
Table 37: Characteristics of review question
Population Adults with NAFLD (18 years and over)
Young people with NAFLD (11 years or older and younger than 18 years), children with NAFLD (younger than 11 years)
Prognostic variable under consideration
Progression of NAFLD stage
Confounding factors
Factors independently associated with prognostic variable:
Waist circumference
BMI
Raised triglycerides
Low HDL-cholesterol
Type 2 diabetes
Hypertension
Age
Outcomes Rate of:
Progression from NAFLD to NASH
Progression from NASH to NASH with fibrosis
Progression from NASH with fibrosis to cirrhosis
as measured by paired biopsy.
Study design Prospective and retrospective cohorts
Randomised trials (if appropriate)
Systematic reviews of the above
National Institute for Health and Care Excellence 2016
NAFLD
Monitoring NAFLD progression
128
8.3 Clinical evidence
Fifteen studies were included in the review that reported serial liver biopsies in populations of people with NAFLD.4,23,43,47,48,51,63,65,70,72,114,134,178,192,211 Evidence from these are summarised in the clinical evidence profile below. See also the study selection flow chart in Appendix E, forest plots in Appendix K, GRADE tables in appendix J, study evidence tables in Appendix H and exclusion list in Appendix M.
No studies were identified that used a multivariate analysis of the progression rate, therefore other study designs were considered for inclusion. Five of the reported studies were retrospective longitudinal in design,4,51,70,114,134 whilst 10 were prospective observational.178,192 23,43,47,48,63,65,72,211 There was a wide range in the time between repeat biopsies, ranging from 1 to 15 years amongst the studies. One included study reported on a population of children and young adults,70 whilst the remaining studies featured adult populations only. Six of the studies were from European populations,43,47,114,134,178,192 5 from the USA,4,48,51,65,70 and 4 from Asian countries: Japan,63 China72,211 and Malaysia.23 As few studies provided enough data to meta-analyse progression rate, a sixteenth study was included in the review.176 This study featured a systematic review and meta-analysis of progression rate for those people who had no fibrosis at baseline using information gathered from contacting some of the authors of some of the papers in this review. Therefore, where possible, the additional data has been added to the current review to provide a suggested fibrosis progression rate across papers. A summary of this information is available in Table 39. Additionally, we investigated whether the included studies also identified factors that may predict fibrosis progression. Seven studies used a multivariate analysis to assess which factors at baseline or follow up predicted a progression of fibrosis.4,23,43,63,114,178,211 The summary from these is found in Table 38.
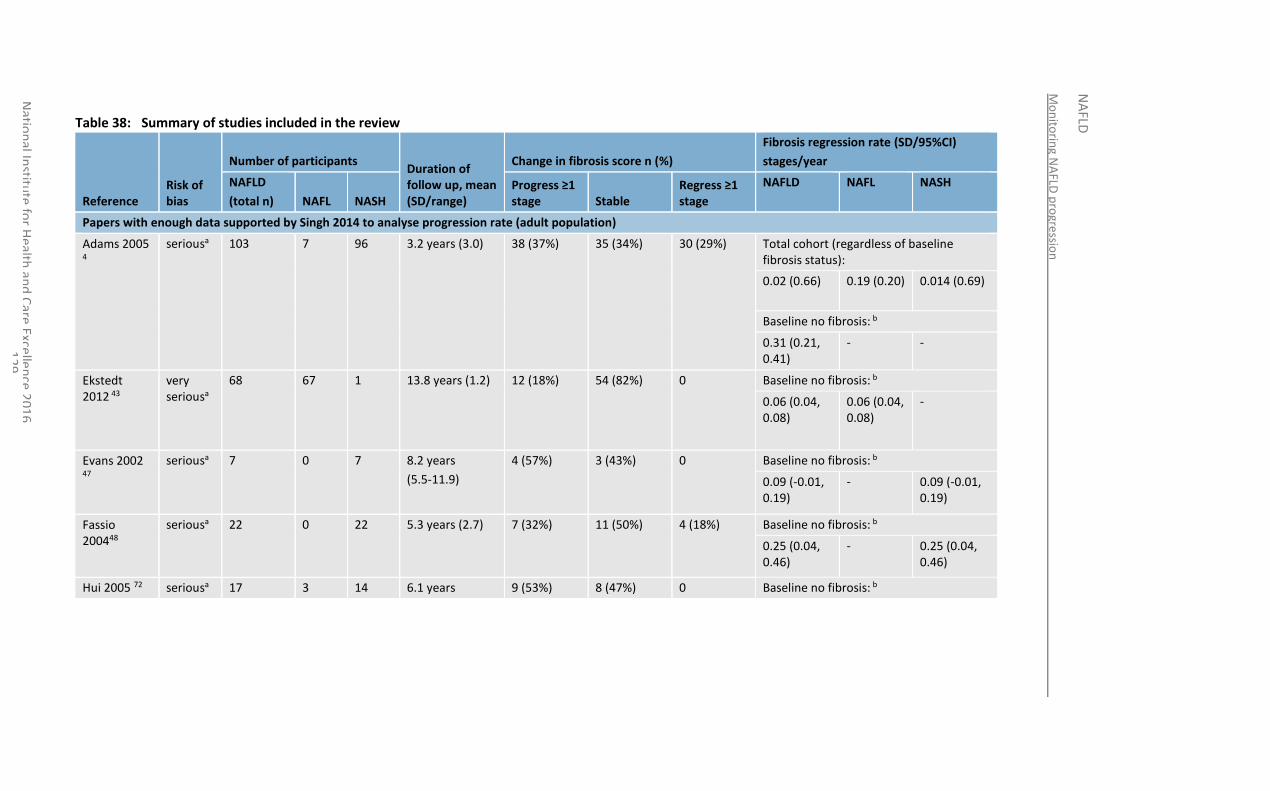
Mo
nito
ring N
AFLD
pro
gressio
n
NA
FLD
Natio
nal In
stitute
for H
ealth an
d C
are Excelle
nce 2
01
6
12
9
Table 38: Summary of studies included in the review
Reference Risk of bias
Number of participants Duration of follow up, mean (SD/range)
Change in fibrosis score n (%)
Fibrosis regression rate (SD/95%CI)
stages/year
NAFLD
(total n) NAFL NASH Progress ≥1 stage Stable
Regress ≥1 stage
NAFLD NAFL NASH
Papers with enough data supported by Singh 2014 to analyse progression rate (adult population)
Adams 2005 4
seriousa 103 7 96 3.2 years (3.0) 38 (37%) 35 (34%) 30 (29%) Total cohort (regardless of baseline fibrosis status):
0.02 (0.66)
0.19 (0.20) 0.014 (0.69)
Baseline no fibrosis: b
0.31 (0.21, 0.41)
- -
Ekstedt 2012 43
very seriousa
68 67 1 13.8 years (1.2) 12 (18%) 54 (82%) 0 Baseline no fibrosis: b
0.06 (0.04, 0.08)
0.06 (0.04, 0.08)
-
Evans 2002 47
seriousa 7 0 7 8.2 years
(5.5-11.9)
4 (57%) 3 (43%) 0 Baseline no fibrosis: b
0.09 (-0.01, 0.19)
- 0.09 (-0.01, 0.19)
Fassio 200448
seriousa 22 0 22 5.3 years (2.7) 7 (32%) 11 (50%) 4 (18%) Baseline no fibrosis: b
0.25 (0.04, 0.46)
- 0.25 (0.04, 0.46)
Hui 2005 72 seriousa 17 3 14 6.1 years 9 (53%) 8 (47%) 0 Baseline no fibrosis: b
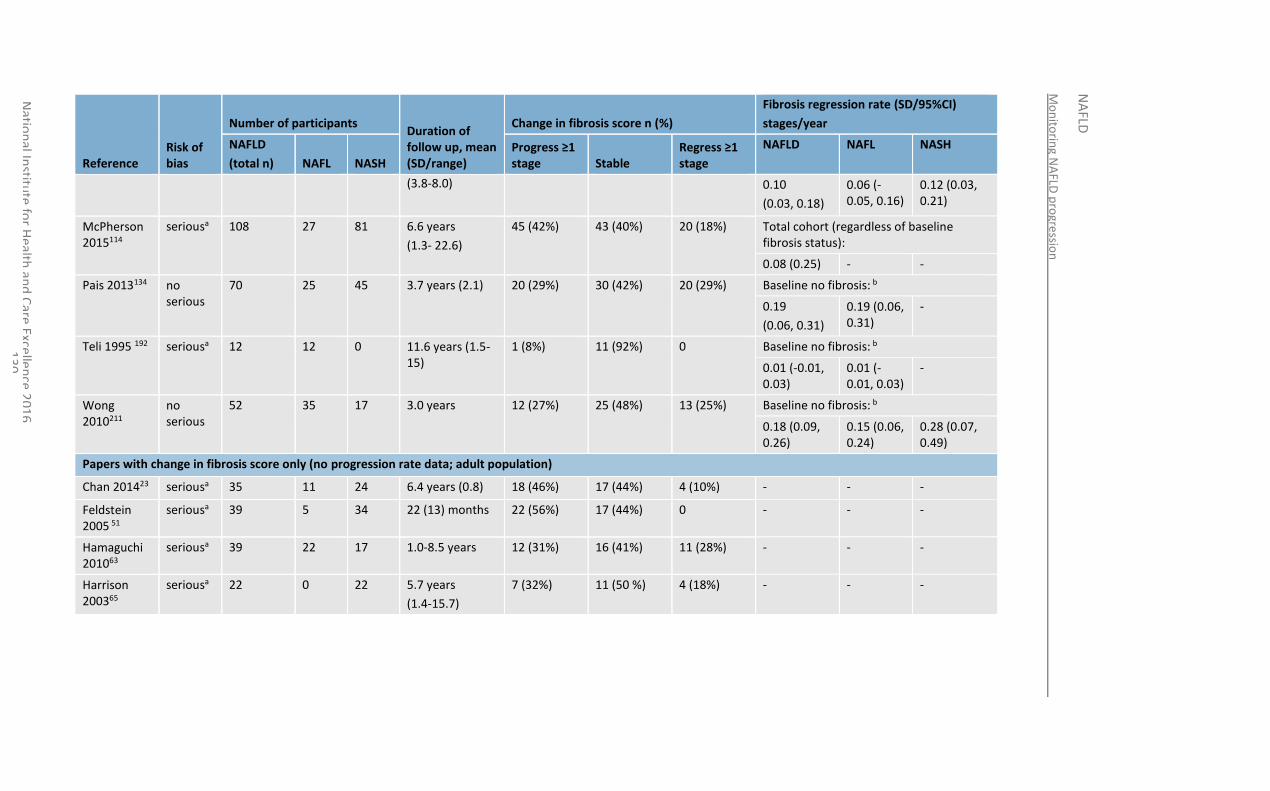
Mo
nito
ring N
AFLD
pro
gressio
n
NA
FLD
Natio
nal In
stitute
for H
ealth an
d C
are Excellen
ce 20
16
1
30
Reference Risk of bias
Number of participants Duration of follow up, mean (SD/range)
Change in fibrosis score n (%)
Fibrosis regression rate (SD/95%CI)
stages/year
NAFLD
(total n) NAFL NASH Progress ≥1 stage Stable
Regress ≥1 stage
NAFLD NAFL NASH
(3.8-8.0) 0.10
(0.03, 0.18)
0.06 (-0.05, 0.16)
0.12 (0.03, 0.21)
McPherson 2015114
seriousa 108
27 81 6.6 years
(1.3- 22.6)
45 (42%) 43 (40%) 20 (18%) Total cohort (regardless of baseline fibrosis status):
0.08 (0.25) - -
Pais 2013134 no serious
70 25 45 3.7 years (2.1) 20 (29%) 30 (42%) 20 (29%) Baseline no fibrosis: b
0.19
(0.06, 0.31)
0.19 (0.06, 0.31)
-
Teli 1995 192 seriousa 12 12 0 11.6 years (1.5-15)
1 (8%) 11 (92%) 0 Baseline no fibrosis: b
0.01 (-0.01, 0.03)
0.01 (-0.01, 0.03)
-
Wong 2010211
no serious
52 35 17 3.0 years 12 (27%) 25 (48%) 13 (25%) Baseline no fibrosis: b
0.18 (0.09, 0.26)
0.15 (0.06, 0.24)
0.28 (0.07, 0.49)
Papers with change in fibrosis score only (no progression rate data; adult population)
Chan 201423 seriousa 35 11 24 6.4 years (0.8) 18 (46%) 17 (44%) 4 (10%) - - -
Feldstein 2005 51
seriousa 39 5 34 22 (13) months 22 (56%) 17 (44%) 0 - - -
Hamaguchi 201063
seriousa 39 22 17 1.0-8.5 years 12 (31%) 16 (41%) 11 (28%) - - -
Harrison 200365
seriousa 22 0 22 5.7 years
(1.4-15.7)
7 (32%) 11 (50 %) 4 (18%) - - -
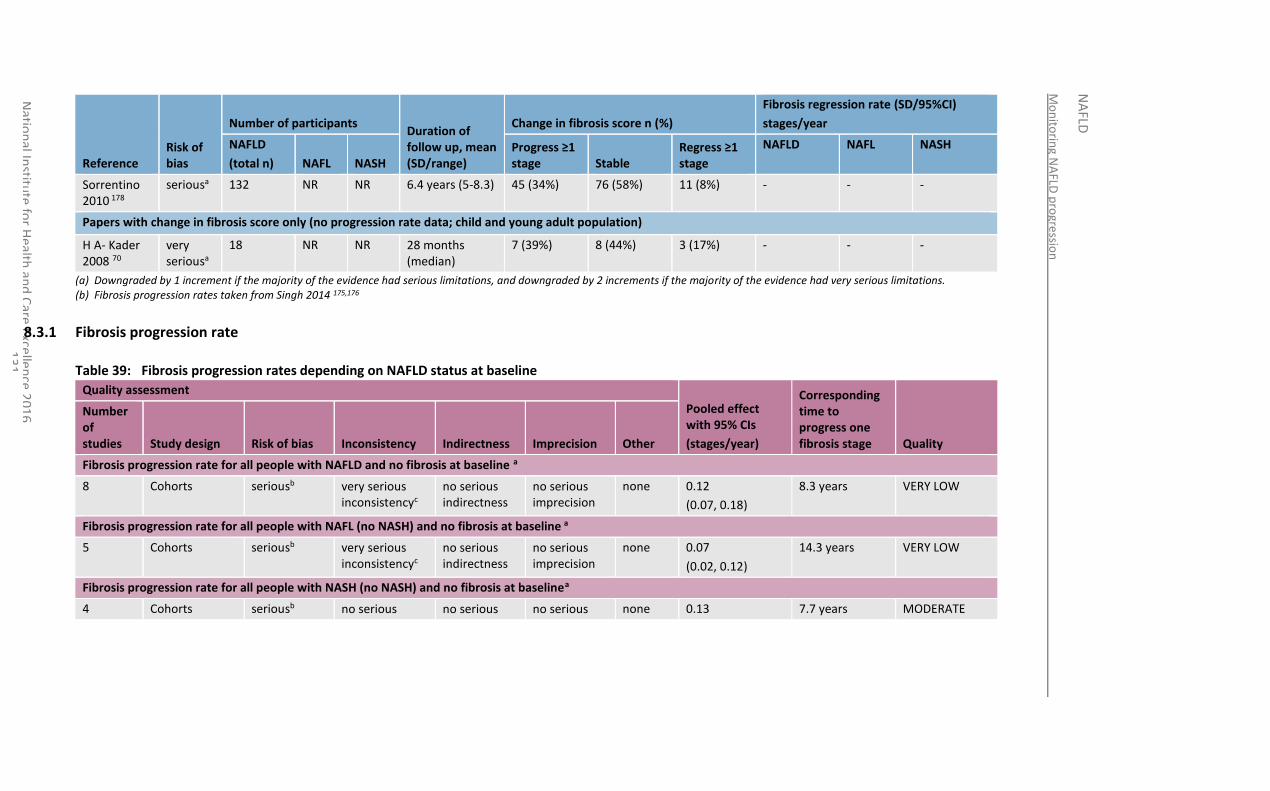
Mo
nito
ring N
AFLD
pro
gressio
n
NA
FLD
Natio
nal In
stitute
for H
ealth an
d C
are Excellen
ce 20
16
1
31
Reference Risk of bias
Number of participants Duration of follow up, mean (SD/range)
Change in fibrosis score n (%)
Fibrosis regression rate (SD/95%CI)
stages/year
NAFLD
(total n) NAFL NASH Progress ≥1 stage Stable
Regress ≥1 stage
NAFLD NAFL NASH
Sorrentino 2010 178
seriousa 132 NR NR 6.4 years (5-8.3) 45 (34%) 76 (58%) 11 (8%) - - -
Papers with change in fibrosis score only (no progression rate data; child and young adult population)
H A- Kader 2008 70
very seriousa
18 NR NR 28 months (median)
7 (39%) 8 (44%) 3 (17%) - - -
(a) Downgraded by 1 increment if the majority of the evidence had serious limitations, and downgraded by 2 increments if the majority of the evidence had very serious limitations. (b) Fibrosis progression rates taken from Singh 2014 175,176
8.3.1 Fibrosis progression rate
Table 39: Fibrosis progression rates depending on NAFLD status at baseline
Quality assessment
Pooled effect with 95% CIs
(stages/year)
Corresponding time to progress one fibrosis stage Quality
Number of studies Study design Risk of bias Inconsistency Indirectness Imprecision Other
Fibrosis progression rate for all people with NAFLD and no fibrosis at baseline a
8 Cohorts seriousb very serious inconsistencyc
no serious indirectness
no serious imprecision
none 0.12
(0.07, 0.18)
8.3 years VERY LOW
Fibrosis progression rate for all people with NAFL (no NASH) and no fibrosis at baseline a
5 Cohorts seriousb very serious inconsistencyc
no serious indirectness
no serious imprecision
none 0.07
(0.02, 0.12)
14.3 years VERY LOW
Fibrosis progression rate for all people with NASH (no NASH) and no fibrosis at baselinea
4 Cohorts seriousb no serious no serious no serious none 0.13 7.7 years MODERATE
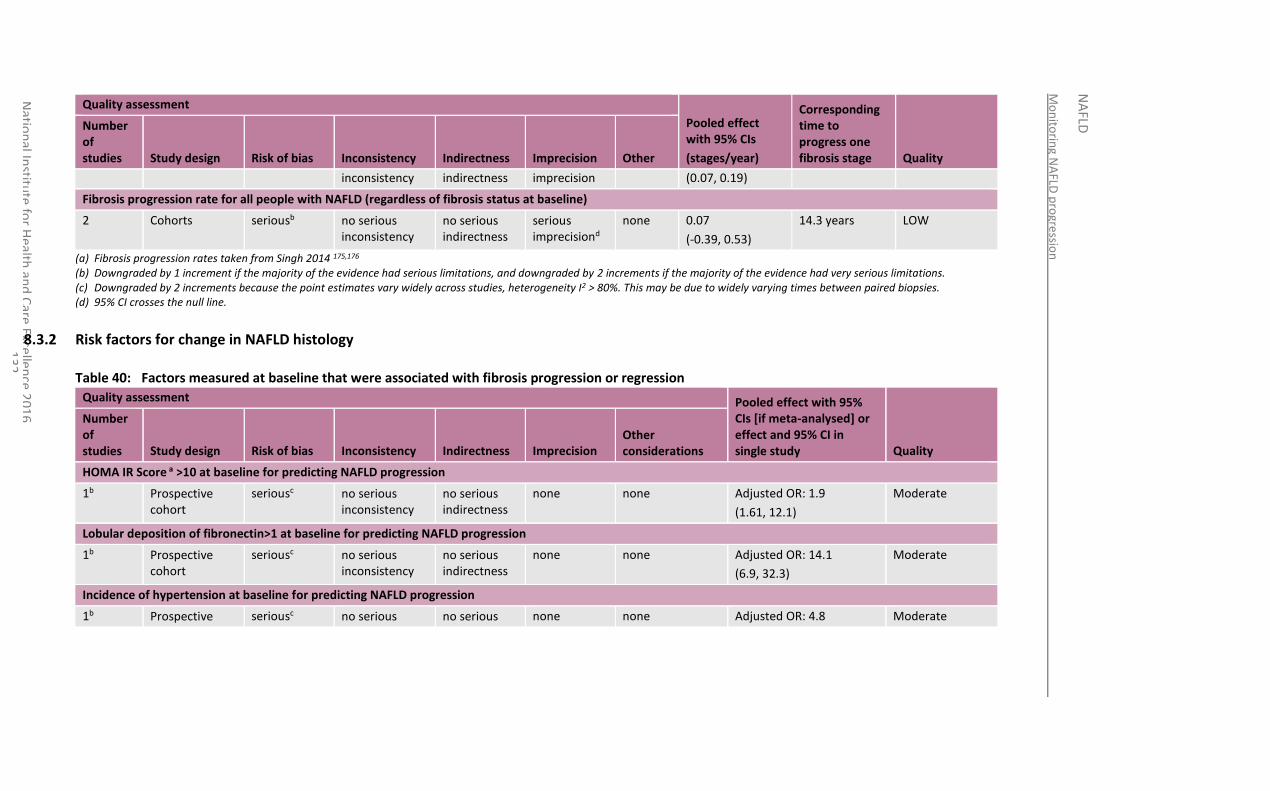
Mo
nito
ring N
AFLD
pro
gressio
n
NA
FLD
Natio
nal In
stitute
for H
ealth an
d C
are Excellen
ce 20
16
1
32
Quality assessment
Pooled effect with 95% CIs
(stages/year)
Corresponding time to progress one fibrosis stage Quality
Number of studies Study design Risk of bias Inconsistency Indirectness Imprecision Other
inconsistency indirectness imprecision (0.07, 0.19)
Fibrosis progression rate for all people with NAFLD (regardless of fibrosis status at baseline)
2 Cohorts seriousb no serious inconsistency
no serious indirectness
serious imprecisiond
none 0.07
(-0.39, 0.53)
14.3 years LOW
(a) Fibrosis progression rates taken from Singh 2014 175,176 (b) Downgraded by 1 increment if the majority of the evidence had serious limitations, and downgraded by 2 increments if the majority of the evidence had very serious limitations. (c) Downgraded by 2 increments because the point estimates vary widely across studies, heterogeneity I2 > 80%. This may be due to widely varying times between paired biopsies. (d) 95% CI crosses the null line.
8.3.2 Risk factors for change in NAFLD histology
Table 40: Factors measured at baseline that were associated with fibrosis progression or regression
Quality assessment Pooled effect with 95% CIs [if meta-analysed] or effect and 95% CI in single study Quality
Number of studies Study design Risk of bias Inconsistency Indirectness Imprecision
Other considerations
HOMA IR Score a >10 at baseline for predicting NAFLD progression
1b Prospective cohort
seriousc no serious inconsistency
no serious indirectness
none none Adjusted OR: 1.9
(1.61, 12.1)
Moderate
Lobular deposition of fibronectin>1 at baseline for predicting NAFLD progression
1b Prospective cohort
seriousc no serious inconsistency
no serious indirectness
none none Adjusted OR: 14.1
(6.9, 32.3)
Moderate
Incidence of hypertension at baseline for predicting NAFLD progression
1b Prospective seriousc no serious no serious none none Adjusted OR: 4.8 Moderate
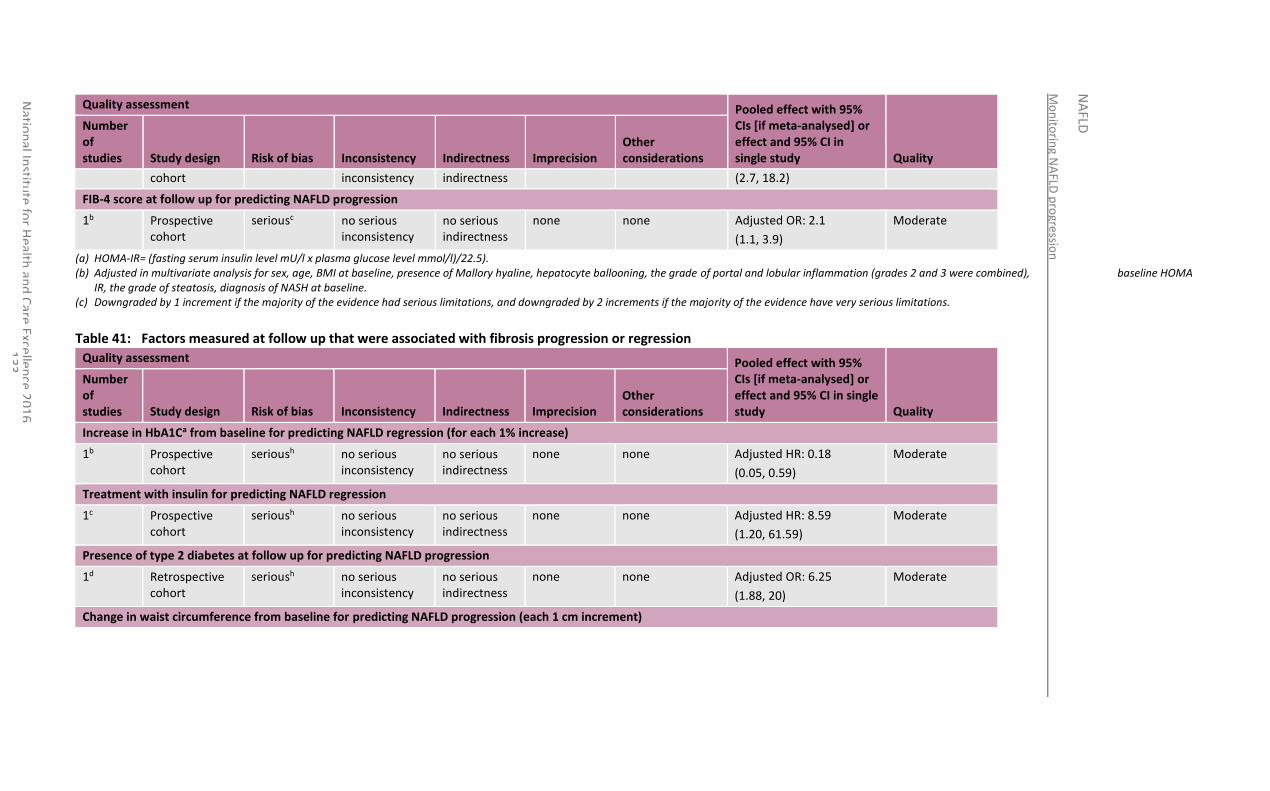
Mo
nito
ring N
AFLD
pro
gressio
n
NA
FLD
Natio
nal In
stitute
for H
ealth an
d C
are Excellen
ce 20
16
1
33
Quality assessment Pooled effect with 95% CIs [if meta-analysed] or effect and 95% CI in single study Quality
Number of studies Study design Risk of bias Inconsistency Indirectness Imprecision
Other considerations
cohort inconsistency indirectness (2.7, 18.2)
FIB-4 score at follow up for predicting NAFLD progression
1b Prospective cohort
seriousc no serious inconsistency
no serious indirectness
none none Adjusted OR: 2.1
(1.1, 3.9)
Moderate
(a) HOMA-IR= (fasting serum insulin level mU/l x plasma glucose level mmol/l)/22.5). (b) Adjusted in multivariate analysis for sex, age, BMI at baseline, presence of Mallory hyaline, hepatocyte ballooning, the grade of portal and lobular inflammation (grades 2 and 3 were combined), baseline HOMA
IR, the grade of steatosis, diagnosis of NASH at baseline. (c) Downgraded by 1 increment if the majority of the evidence had serious limitations, and downgraded by 2 increments if the majority of the evidence have very serious limitations.
Table 41: Factors measured at follow up that were associated with fibrosis progression or regression
Quality assessment Pooled effect with 95% CIs [if meta-analysed] or effect and 95% CI in single study Quality
Number of studies Study design Risk of bias Inconsistency Indirectness Imprecision
Other considerations
Increase in HbA1Ca from baseline for predicting NAFLD regression (for each 1% increase)
1b Prospective cohort
serioush no serious inconsistency
no serious indirectness
none none Adjusted HR: 0.18
(0.05, 0.59)
Moderate
Treatment with insulin for predicting NAFLD regression
1c Prospective cohort
serioush no serious inconsistency
no serious indirectness
none none Adjusted HR: 8.59
(1.20, 61.59)
Moderate
Presence of type 2 diabetes at follow up for predicting NAFLD progression
1d Retrospective cohort
serioush no serious inconsistency
no serious indirectness
none none Adjusted OR: 6.25
(1.88, 20)
Moderate
Change in waist circumference from baseline for predicting NAFLD progression (each 1 cm increment)
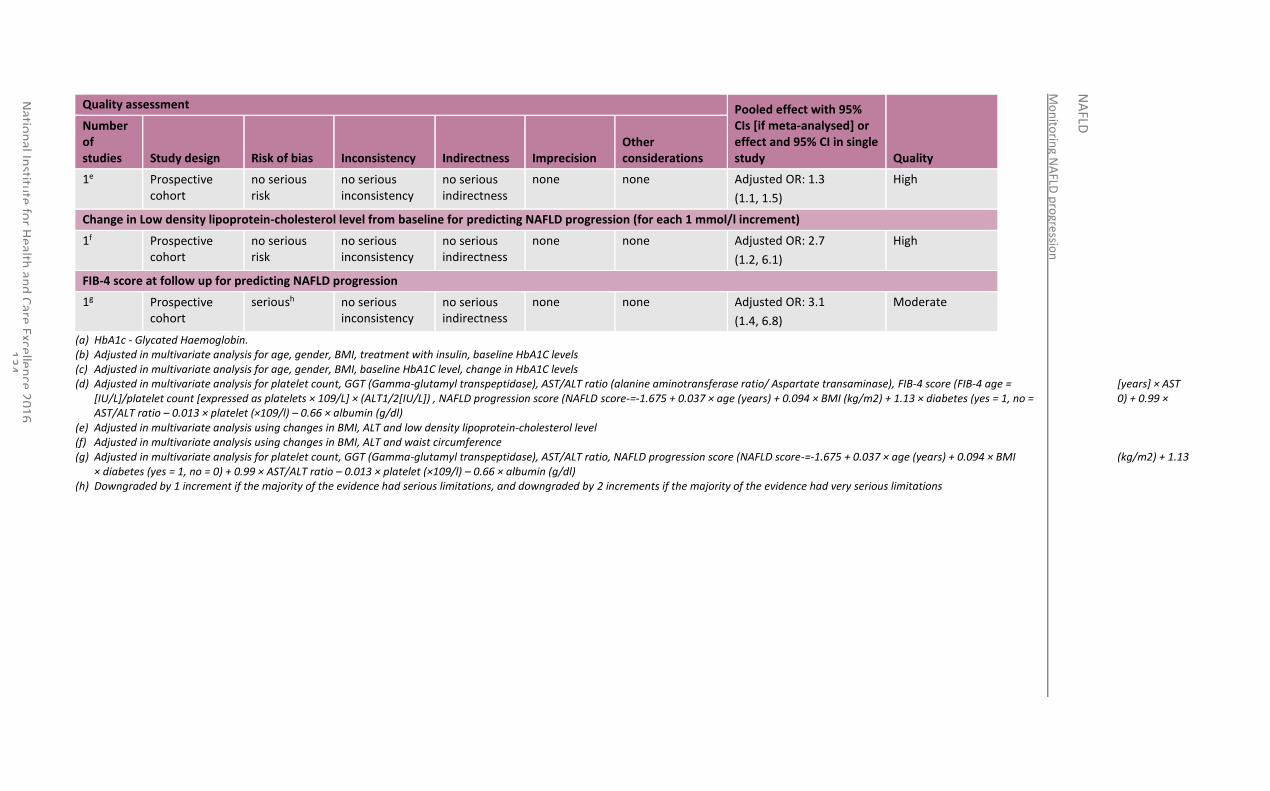
Mo
nito
ring N
AFLD
pro
gressio
n
NA
FLD
Natio
nal In
stitute
for H
ealth an
d C
are Excellen
ce 20
16
1
34
Quality assessment Pooled effect with 95% CIs [if meta-analysed] or effect and 95% CI in single study Quality
Number of studies Study design Risk of bias Inconsistency Indirectness Imprecision
Other considerations
1e Prospective cohort
no serious risk
no serious inconsistency
no serious indirectness
none none Adjusted OR: 1.3
(1.1, 1.5)
High
Change in Low density lipoprotein-cholesterol level from baseline for predicting NAFLD progression (for each 1 mmol/l increment)
1f Prospective cohort
no serious risk
no serious inconsistency
no serious indirectness
none none Adjusted OR: 2.7
(1.2, 6.1)
High
FIB-4 score at follow up for predicting NAFLD progression
1g Prospective cohort
serioush no serious inconsistency
no serious indirectness
none none Adjusted OR: 3.1
(1.4, 6.8)
Moderate
(a) HbA1c - Glycated Haemoglobin. (b) Adjusted in multivariate analysis for age, gender, BMI, treatment with insulin, baseline HbA1C levels (c) Adjusted in multivariate analysis for age, gender, BMI, baseline HbA1C level, change in HbA1C levels (d) Adjusted in multivariate analysis for platelet count, GGT (Gamma-glutamyl transpeptidase), AST/ALT ratio (alanine aminotransferase ratio/ Aspartate transaminase), FIB-4 score (FIB-4 age = [years] × AST
[IU/L]/platelet count [expressed as platelets × 109/L] × (ALT1/2[IU/L]) , NAFLD progression score (NAFLD score-=-1.675 + 0.037 × age (years) + 0.094 × BMI (kg/m2) + 1.13 × diabetes (yes = 1, no = 0) + 0.99 × AST/ALT ratio – 0.013 × platelet (×109/l) – 0.66 × albumin (g/dl)
(e) Adjusted in multivariate analysis using changes in BMI, ALT and low density lipoprotein-cholesterol level (f) Adjusted in multivariate analysis using changes in BMI, ALT and waist circumference (g) Adjusted in multivariate analysis for platelet count, GGT (Gamma-glutamyl transpeptidase), AST/ALT ratio, NAFLD progression score (NAFLD score-=-1.675 + 0.037 × age (years) + 0.094 × BMI (kg/m2) + 1.13
× diabetes (yes = 1, no = 0) + 0.99 × AST/ALT ratio – 0.013 × platelet (×109/l) – 0.66 × albumin (g/dl) (h) Downgraded by 1 increment if the majority of the evidence had serious limitations, and downgraded by 2 increments if the majority of the evidence had very serious limitations
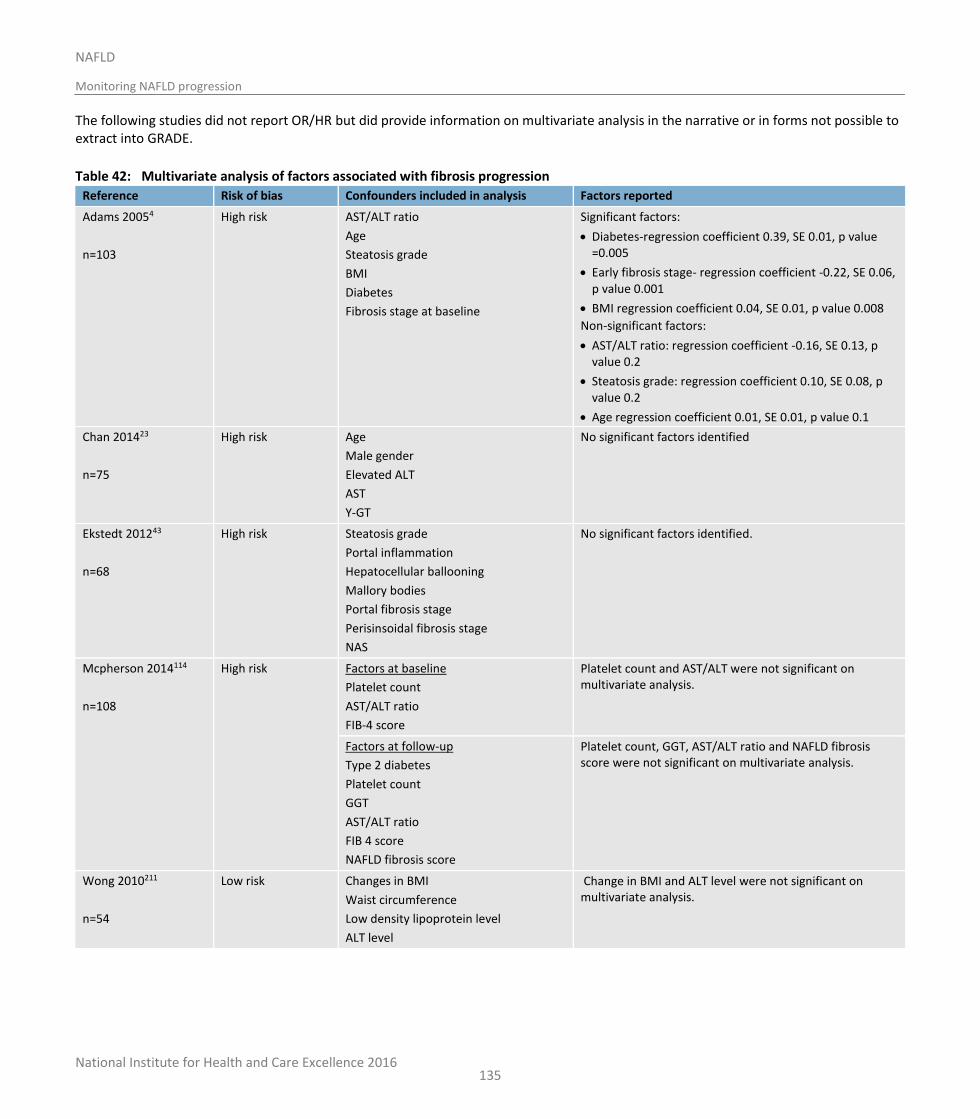
National Institute for Health and Care Excellence 2016
NAFLD
Monitoring NAFLD progression
135
The following studies did not report OR/HR but did provide information on multivariate analysis in the narrative or in forms not possible to extract into GRADE.
Table 42: Multivariate analysis of factors associated with fibrosis progression
Reference Risk of bias Confounders included in analysis Factors reported
Adams 20054
n=103
High risk AST/ALT ratio
Age
Steatosis grade
BMI
Diabetes
Fibrosis stage at baseline
Significant factors:
Diabetes-regression coefficient 0.39, SE 0.01, p value =0.005
Early fibrosis stage- regression coefficient -0.22, SE 0.06, p value 0.001
BMI regression coefficient 0.04, SE 0.01, p value 0.008
Non-significant factors:
AST/ALT ratio: regression coefficient -0.16, SE 0.13, p value 0.2
Steatosis grade: regression coefficient 0.10, SE 0.08, p value 0.2
Age regression coefficient 0.01, SE 0.01, p value 0.1
Chan 201423
n=75
High risk Age
Male gender
Elevated ALT
AST
Y-GT
No significant factors identified
Ekstedt 201243
n=68
High risk Steatosis grade
Portal inflammation
Hepatocellular ballooning
Mallory bodies
Portal fibrosis stage
Perisinsoidal fibrosis stage
NAS
No significant factors identified.
Mcpherson 2014114
n=108
High risk Factors at baseline
Platelet count
AST/ALT ratio
FIB-4 score
Platelet count and AST/ALT were not significant on multivariate analysis.
Factors at follow-up
Type 2 diabetes
Platelet count
GGT
AST/ALT ratio
FIB 4 score
NAFLD fibrosis score
Platelet count, GGT, AST/ALT ratio and NAFLD fibrosis score were not significant on multivariate analysis.
Wong 2010211
n=54
Low risk Changes in BMI
Waist circumference
Low density lipoprotein level
ALT level
Change in BMI and ALT level were not significant on multivariate analysis.
National Institute for Health and Care Excellence 2016
NAFLD
Monitoring NAFLD progression
136
8.4 Economic evidence
8.4.1 Published literature
No relevant economic evaluations were identified.
See also the economic article selection flow chart in Appendix F.
8.4.2 Unit costs
See Table 61 in Appendix N.
8.4.3 New cost-effectiveness analysis
Original cost-effectiveness modelling was undertaken to determine the most cost-effective frequency of testing for advanced fibrosis. A summary of the modelling work and an evidence statement summarising the results of the analysis can be found in Chapter 7. The full analysis can be found in Appendix N.
The model examined multiple surveillance frequency scenarios from 1 to 8 years.
8.5 Evidence statements
8.5.1.1 Clinical
No relevant evidence was identified that specifically addressed the question of how often people with NAFLD or NASH should be monitored to determine risk for disease progression. However when adding further evidence from a supplementary meta-analysis paper that contacted review authors for additional data some information on fibrosis progression rates could be calculated. Very low quality evidence from 8 studies (n=351) suggested that those with any form of NAFLD progress 0.12 (0.07-0.18) fibrosis stages per year. Very low quality evidence from 5 studies (n=142) suggest that those with NALF only and no NASH progress 0.07 (0.02-0.12) fibrosis stages per year and moderate quality evidence from 4 studies (n=60) suggested those with NASH progress at a rate of 0.13 (0.07-0.19) stages per year. Low quality evidence from two studies that did not take into account fibrosis stage at baseline (n=211) suggested that people with any form of NAFLD progress at a rate of 0.07 (-0.39, 0.53) stages per year.
Moderate quality evidence from 1 cohort study (n=132) suggested that the presence at baseline of high HOMA IR score, lobular deposition of fibronectin >1, and hypertension were associated with fibrosis progression in people with NAFLD and a second study (n=108) suggested high FIB-4 score was also associated with fibrosis progression in people with NAFLD.
Moderate quality evidence from 2 cohort studies (n=147) suggested a strong association between insulin treatment and diabetes at follow-up with the progression of fibrosis. However there are large confidence intervals around these effects. Moderate to high quality evidence from 3 cohort studies (n=199) suggested weaker associations between an increase of HbA1c from baseline, increase in waist circumference, change in low LDL-cholesterol and a high FIB-4 score at follow up and the progression of NAFLD.
8.5.2 Economic
One original cost-utility analysis found that testing adults with NAFLD for advanced fibrosis was cost-effective compared to no testing under all fibrosis prevalence’s and retest frequencies investigated at a cost-effectiveness threshold of £20,000 per QALY gained. Retesting at a frequency of 2 years was cost-effective compared to other frequencies. This analysis was assessed as directly applicable with minor limitations.
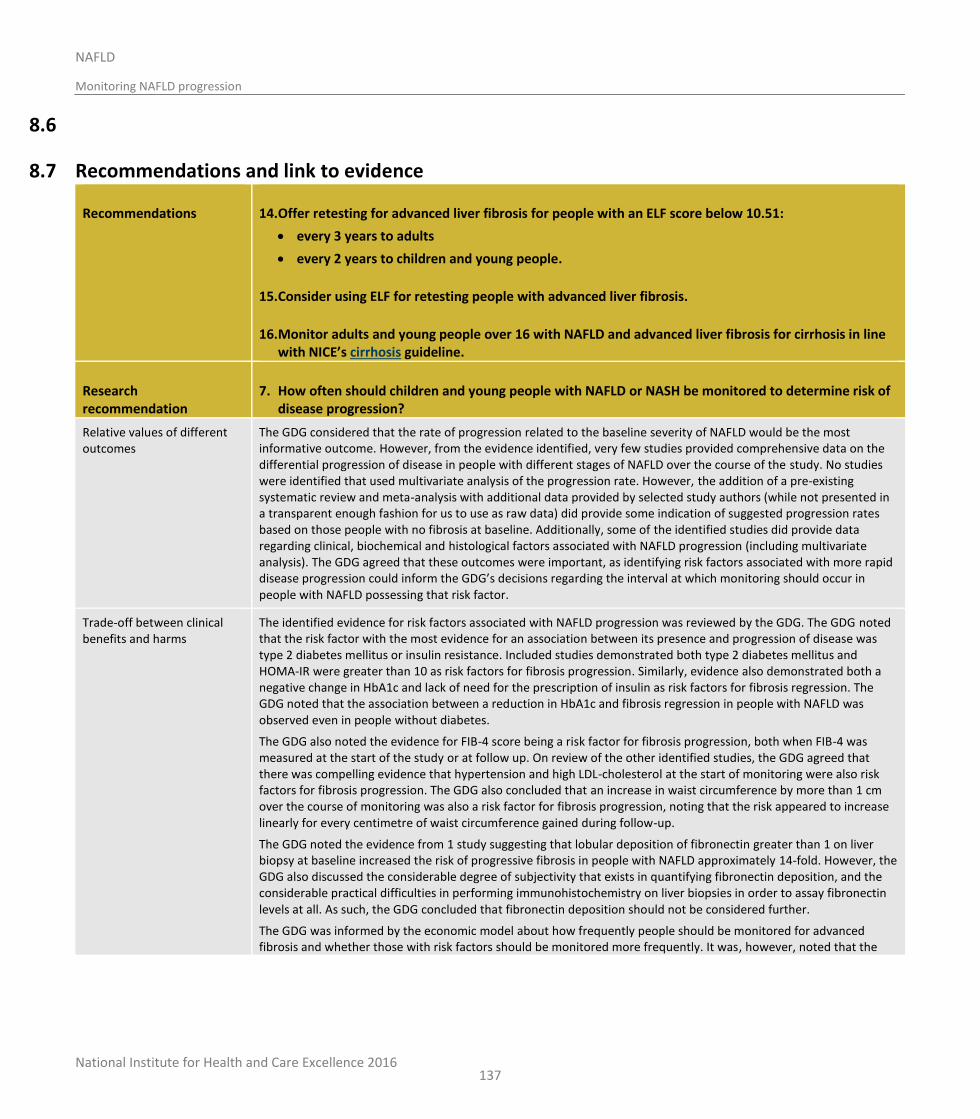
National Institute for Health and Care Excellence 2016
NAFLD
Monitoring NAFLD progression
137
8.6
8.7 Recommendations and link to evidence
Recommendations 14. Offer retesting for advanced liver fibrosis for people with an ELF score below 10.51:
every 3 years to adults
every 2 years to children and young people.
15. Consider using ELF for retesting people with advanced liver fibrosis.
16. Monitor adults and young people over 16 with NAFLD and advanced liver fibrosis for cirrhosis in line with NICE’s cirrhosis guideline.
Research recommendation
7. How often should children and young people with NAFLD or NASH be monitored to determine risk of disease progression?
Relative values of different outcomes
The GDG considered that the rate of progression related to the baseline severity of NAFLD would be the most informative outcome. However, from the evidence identified, very few studies provided comprehensive data on the differential progression of disease in people with different stages of NAFLD over the course of the study. No studies were identified that used multivariate analysis of the progression rate. However, the addition of a pre-existing systematic review and meta-analysis with additional data provided by selected study authors (while not presented in a transparent enough fashion for us to use as raw data) did provide some indication of suggested progression rates based on those people with no fibrosis at baseline. Additionally, some of the identified studies did provide data regarding clinical, biochemical and histological factors associated with NAFLD progression (including multivariate analysis). The GDG agreed that these outcomes were important, as identifying risk factors associated with more rapid disease progression could inform the GDG’s decisions regarding the interval at which monitoring should occur in people with NAFLD possessing that risk factor.
Trade-off between clinical benefits and harms
The identified evidence for risk factors associated with NAFLD progression was reviewed by the GDG. The GDG noted that the risk factor with the most evidence for an association between its presence and progression of disease was type 2 diabetes mellitus or insulin resistance. Included studies demonstrated both type 2 diabetes mellitus and HOMA-IR were greater than 10 as risk factors for fibrosis progression. Similarly, evidence also demonstrated both a negative change in HbA1c and lack of need for the prescription of insulin as risk factors for fibrosis regression. The GDG noted that the association between a reduction in HbA1c and fibrosis regression in people with NAFLD was observed even in people without diabetes.
The GDG also noted the evidence for FIB-4 score being a risk factor for fibrosis progression, both when FIB-4 was measured at the start of the study or at follow up. On review of the other identified studies, the GDG agreed that there was compelling evidence that hypertension and high LDL-cholesterol at the start of monitoring were also risk factors for fibrosis progression. The GDG also concluded that an increase in waist circumference by more than 1 cm over the course of monitoring was also a risk factor for fibrosis progression, noting that the risk appeared to increase linearly for every centimetre of waist circumference gained during follow-up.
The GDG noted the evidence from 1 study suggesting that lobular deposition of fibronectin greater than 1 on liver biopsy at baseline increased the risk of progressive fibrosis in people with NAFLD approximately 14-fold. However, the GDG also discussed the considerable degree of subjectivity that exists in quantifying fibronectin deposition, and the considerable practical difficulties in performing immunohistochemistry on liver biopsies in order to assay fibronectin levels at all. As such, the GDG concluded that fibronectin deposition should not be considered further.
The GDG was informed by the economic model about how frequently people should be monitored for advanced fibrosis and whether those with risk factors should be monitored more frequently. It was, however, noted that the
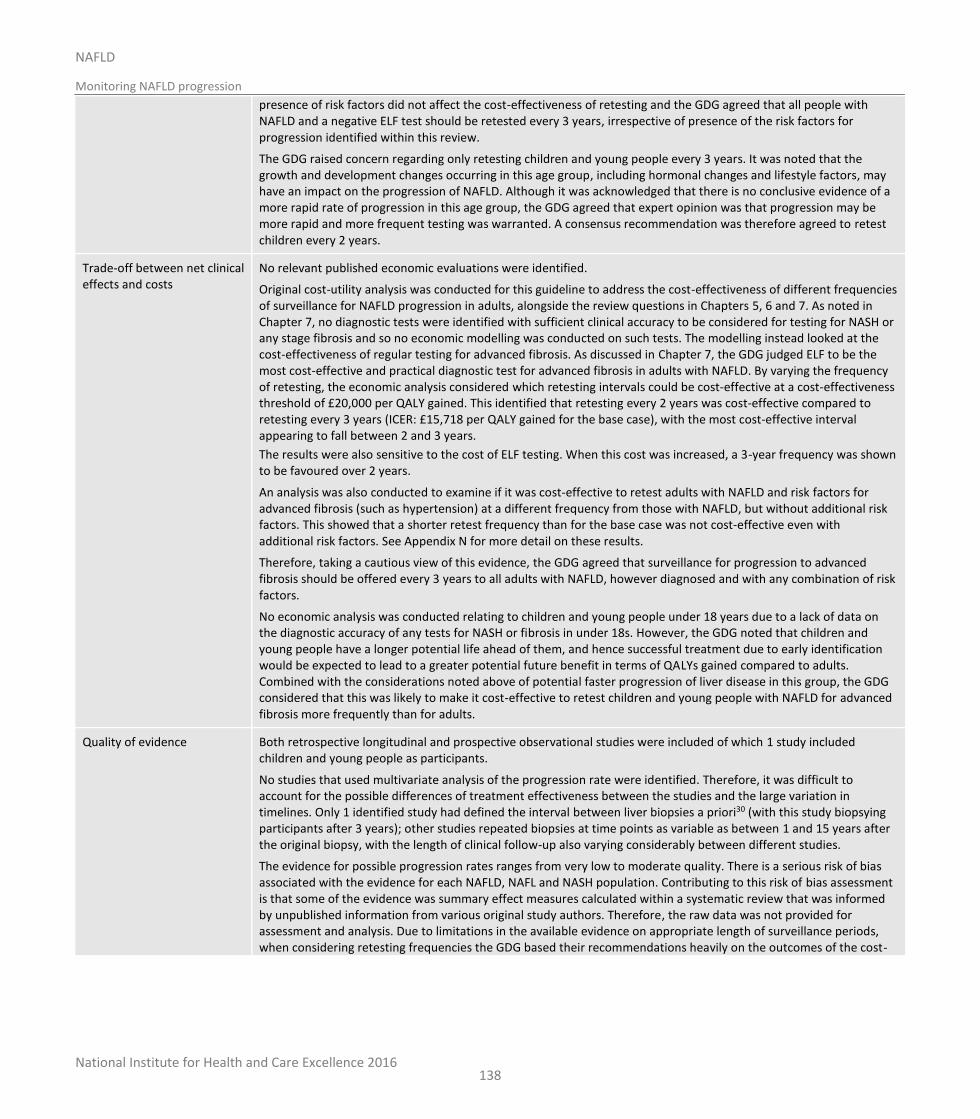
National Institute for Health and Care Excellence 2016
NAFLD
Monitoring NAFLD progression
138
presence of risk factors did not affect the cost-effectiveness of retesting and the GDG agreed that all people with NAFLD and a negative ELF test should be retested every 3 years, irrespective of presence of the risk factors for progression identified within this review.
The GDG raised concern regarding only retesting children and young people every 3 years. It was noted that the growth and development changes occurring in this age group, including hormonal changes and lifestyle factors, may have an impact on the progression of NAFLD. Although it was acknowledged that there is no conclusive evidence of a more rapid rate of progression in this age group, the GDG agreed that expert opinion was that progression may be more rapid and more frequent testing was warranted. A consensus recommendation was therefore agreed to retest children every 2 years.
Trade-off between net clinical effects and costs
No relevant published economic evaluations were identified.
Original cost-utility analysis was conducted for this guideline to address the cost-effectiveness of different frequencies of surveillance for NAFLD progression in adults, alongside the review questions in Chapters 5, 6 and 7. As noted in Chapter 7, no diagnostic tests were identified with sufficient clinical accuracy to be considered for testing for NASH or any stage fibrosis and so no economic modelling was conducted on such tests. The modelling instead looked at the cost-effectiveness of regular testing for advanced fibrosis. As discussed in Chapter 7, the GDG judged ELF to be the most cost-effective and practical diagnostic test for advanced fibrosis in adults with NAFLD. By varying the frequency of retesting, the economic analysis considered which retesting intervals could be cost-effective at a cost-effectiveness threshold of £20,000 per QALY gained. This identified that retesting every 2 years was cost-effective compared to retesting every 3 years (ICER: £15,718 per QALY gained for the base case), with the most cost-effective interval appearing to fall between 2 and 3 years.
The results were also sensitive to the cost of ELF testing. When this cost was increased, a 3-year frequency was shown to be favoured over 2 years.
An analysis was also conducted to examine if it was cost-effective to retest adults with NAFLD and risk factors for advanced fibrosis (such as hypertension) at a different frequency from those with NAFLD, but without additional risk factors. This showed that a shorter retest frequency than for the base case was not cost-effective even with additional risk factors. See Appendix N for more detail on these results.
Therefore, taking a cautious view of this evidence, the GDG agreed that surveillance for progression to advanced fibrosis should be offered every 3 years to all adults with NAFLD, however diagnosed and with any combination of risk factors.
No economic analysis was conducted relating to children and young people under 18 years due to a lack of data on the diagnostic accuracy of any tests for NASH or fibrosis in under 18s. However, the GDG noted that children and young people have a longer potential life ahead of them, and hence successful treatment due to early identification would be expected to lead to a greater potential future benefit in terms of QALYs gained compared to adults. Combined with the considerations noted above of potential faster progression of liver disease in this group, the GDG considered that this was likely to make it cost-effective to retest children and young people with NAFLD for advanced fibrosis more frequently than for adults.
Quality of evidence Both retrospective longitudinal and prospective observational studies were included of which 1 study included children and young people as participants.
No studies that used multivariate analysis of the progression rate were identified. Therefore, it was difficult to account for the possible differences of treatment effectiveness between the studies and the large variation in timelines. Only 1 identified study had defined the interval between liver biopsies a priori30 (with this study biopsying participants after 3 years); other studies repeated biopsies at time points as variable as between 1 and 15 years after the original biopsy, with the length of clinical follow-up also varying considerably between different studies.
The evidence for possible progression rates ranges from very low to moderate quality. There is a serious risk of bias associated with the evidence for each NAFLD, NAFL and NASH population. Contributing to this risk of bias assessment is that some of the evidence was summary effect measures calculated within a systematic review that was informed by unpublished information from various original study authors. Therefore, the raw data was not provided for assessment and analysis. Due to limitations in the available evidence on appropriate length of surveillance periods, when considering retesting frequencies the GDG based their recommendations heavily on the outcomes of the cost-
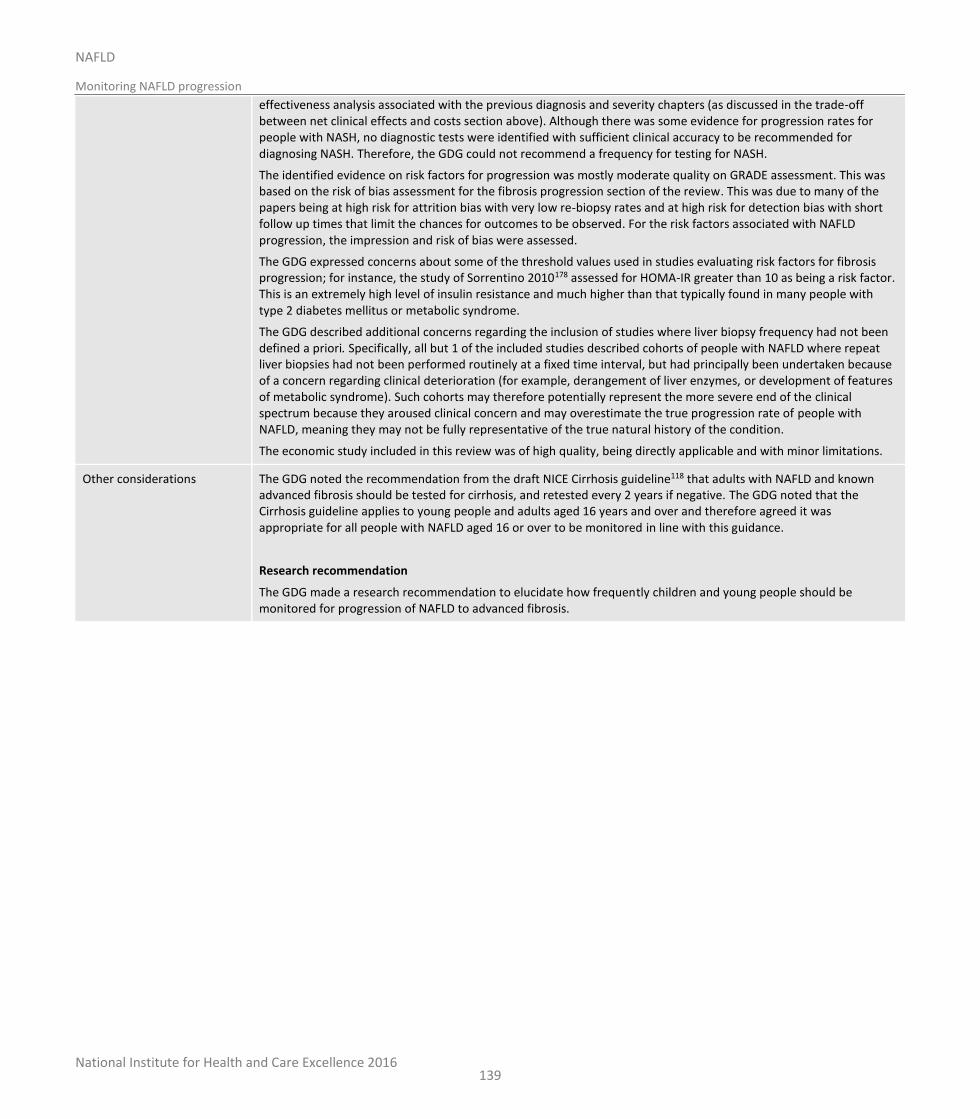
National Institute for Health and Care Excellence 2016
NAFLD
Monitoring NAFLD progression
139
effectiveness analysis associated with the previous diagnosis and severity chapters (as discussed in the trade-off between net clinical effects and costs section above). Although there was some evidence for progression rates for people with NASH, no diagnostic tests were identified with sufficient clinical accuracy to be recommended for diagnosing NASH. Therefore, the GDG could not recommend a frequency for testing for NASH.
The identified evidence on risk factors for progression was mostly moderate quality on GRADE assessment. This was based on the risk of bias assessment for the fibrosis progression section of the review. This was due to many of the papers being at high risk for attrition bias with very low re-biopsy rates and at high risk for detection bias with short follow up times that limit the chances for outcomes to be observed. For the risk factors associated with NAFLD progression, the impression and risk of bias were assessed.
The GDG expressed concerns about some of the threshold values used in studies evaluating risk factors for fibrosis progression; for instance, the study of Sorrentino 2010178 assessed for HOMA-IR greater than 10 as being a risk factor. This is an extremely high level of insulin resistance and much higher than that typically found in many people with type 2 diabetes mellitus or metabolic syndrome.
The GDG described additional concerns regarding the inclusion of studies where liver biopsy frequency had not been defined a priori. Specifically, all but 1 of the included studies described cohorts of people with NAFLD where repeat liver biopsies had not been performed routinely at a fixed time interval, but had principally been undertaken because of a concern regarding clinical deterioration (for example, derangement of liver enzymes, or development of features of metabolic syndrome). Such cohorts may therefore potentially represent the more severe end of the clinical spectrum because they aroused clinical concern and may overestimate the true progression rate of people with NAFLD, meaning they may not be fully representative of the true natural history of the condition.
The economic study included in this review was of high quality, being directly applicable and with minor limitations.
Other considerations The GDG noted the recommendation from the draft NICE Cirrhosis guideline118 that adults with NAFLD and known advanced fibrosis should be tested for cirrhosis, and retested every 2 years if negative. The GDG noted that the Cirrhosis guideline applies to young people and adults aged 16 years and over and therefore agreed it was appropriate for all people with NAFLD aged 16 or over to be monitored in line with this guidance.
Research recommendation
The GDG made a research recommendation to elucidate how frequently children and young people should be monitored for progression of NAFLD to advanced fibrosis.
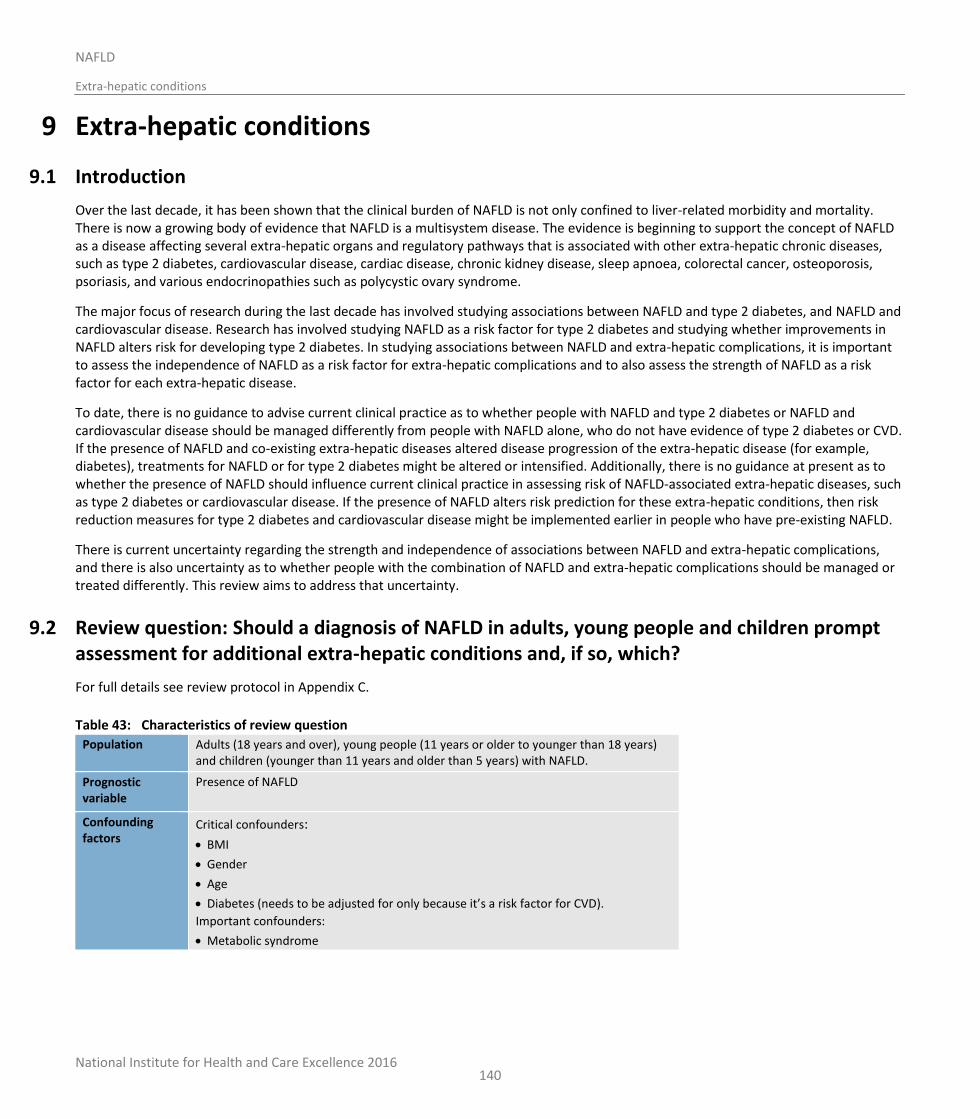
National Institute for Health and Care Excellence 2016
NAFLD
Extra-hepatic conditions
140
9 Extra-hepatic conditions
9.1 Introduction
Over the last decade, it has been shown that the clinical burden of NAFLD is not only confined to liver-related morbidity and mortality. There is now a growing body of evidence that NAFLD is a multisystem disease. The evidence is beginning to support the concept of NAFLD as a disease affecting several extra-hepatic organs and regulatory pathways that is associated with other extra-hepatic chronic diseases, such as type 2 diabetes, cardiovascular disease, cardiac disease, chronic kidney disease, sleep apnoea, colorectal cancer, osteoporosis, psoriasis, and various endocrinopathies such as polycystic ovary syndrome.
The major focus of research during the last decade has involved studying associations between NAFLD and type 2 diabetes, and NAFLD and cardiovascular disease. Research has involved studying NAFLD as a risk factor for type 2 diabetes and studying whether improvements in NAFLD alters risk for developing type 2 diabetes. In studying associations between NAFLD and extra-hepatic complications, it is important to assess the independence of NAFLD as a risk factor for extra-hepatic complications and to also assess the strength of NAFLD as a risk factor for each extra-hepatic disease.
To date, there is no guidance to advise current clinical practice as to whether people with NAFLD and type 2 diabetes or NAFLD and cardiovascular disease should be managed differently from people with NAFLD alone, who do not have evidence of type 2 diabetes or CVD. If the presence of NAFLD and co-existing extra-hepatic diseases altered disease progression of the extra-hepatic disease (for example, diabetes), treatments for NAFLD or for type 2 diabetes might be altered or intensified. Additionally, there is no guidance at present as to whether the presence of NAFLD should influence current clinical practice in assessing risk of NAFLD-associated extra-hepatic diseases, such as type 2 diabetes or cardiovascular disease. If the presence of NAFLD alters risk prediction for these extra-hepatic conditions, then risk reduction measures for type 2 diabetes and cardiovascular disease might be implemented earlier in people who have pre-existing NAFLD.
There is current uncertainty regarding the strength and independence of associations between NAFLD and extra-hepatic complications, and there is also uncertainty as to whether people with the combination of NAFLD and extra-hepatic complications should be managed or treated differently. This review aims to address that uncertainty.
9.2 Review question: Should a diagnosis of NAFLD in adults, young people and children prompt assessment for additional extra-hepatic conditions and, if so, which?
For full details see review protocol in Appendix C.
Table 43: Characteristics of review question
Population Adults (18 years and over), young people (11 years or older to younger than 18 years) and children (younger than 11 years and older than 5 years) with NAFLD.
Prognostic variable
Presence of NAFLD
Confounding factors
Critical confounders:
BMI
Gender
Age
Diabetes (needs to be adjusted for only because it’s a risk factor for CVD).
Important confounders:
Metabolic syndrome
National Institute for Health and Care Excellence 2016
NAFLD
Extra-hepatic conditions
141
Blood pressure.
Outcomes Critical:
Cardiovascular disease (MI, stroke, TIA, angina, PAD, hypertension)
Type 2 diabetes
Colorectal cancer
Dyslipidaemia (hypertriglyceridemia).
Important:
Polycystic ovarian syndrome (PCOS) for adults and young people
Chronic kidney disease (CKD)
Obstructive sleep apnoea syndrome
Vitamin D levels
Obesity
Insulin resistance.
Study design Prospective and retrospective cohorts with multivariate analysis that adjust for ≥3 of
the above confounders in their model.
9.3 Clinical evidence
Twenty-seven studies were included in the review.15,25,26,45,71,73,75,79,82,91,94,99,116,139,141,145,146,157,173,186,188-191,215,222,223 Evidence from these are summarised in the clinical evidence profile below (Table 44). See also the study selection flow chart in Appendix E, forest plots in Appendix K, study evidence tables in Appendix H and exclusion list in Appendix M.
We searched for prospective, retrospective cohort or case-control studies investigating the association of NAFLD with the development of certain extra-hepatic conditions. A wide variety of predominantly prospective studies were identified (see details in Table 44). Some studies included specialised populations such as those who had diabetes, or those who had already undergone certain tests (coronary angiogram), although most studies came from large databases of healthy individuals involved in regular medical health check-ups. While we searched for evidence in covering adults, children and young people, the evidence identified was from adult populations. The GDG felt that since the disease process of primary NAFLD in children and young people is thought to be the same as that in adults, there is no reason to expect that extra-hepatic conditions would be different in children and young people with NAFLD to adults with the condition. Some studies utilised the same large data set but analysed them slightly differently (1 gender only, based on different definitions of NAFLD, or using different measures of adjusted effect [HR, OR, or RR]). All studies conducted a multivariable analysis, but different variables were analysed in each of the studies. Common confounders considered in multivariable analysis were age, BMI or waist circumference, gender, pre-existing conditions such as diabetes and hypertension, blood pressure, triglycerides and cholesterol. The majority of studies identified NAFLD as the prognostic risk factor by using ultrasound to diagnose fatty liver and then confirm NAFLD by excluding other causes (such as alcohol, viral hepatitis). However, sometimes the confirmation of NAFLD specifically as opposed to hepatic steatosis (fatty liver) in general was unclear. In these cases the clinical evidence summary tables in this section and the forest plots in Appendix K have been labelled accordingly. Some studies also used ultrasound plus other measures, such as liver enzyme levels or NAFLD fibrosis score. Where studies used ultrasound to grade fatty liver as mild or moderate to severe and then compare these ‘levels of severity’ to no fatty liver, only the latter comparison is included in this review, as the guideline committee agreed that ultrasound alone is insufficient to adequately grade steatosis.
Twelve studies were identified looking at NAFLD and cardiovascular risk. One on atrial fibrillation in people with diabetes, 5 on cardiovascular events in general (2 of which were in people with diabetes), 2 on cardiovascular mortality, 1 on coronary artery disease (within a highly selected and therefore slightly indirect population of those already clinically indicated for coronary angiogram) and 3 on hypertension. Two studies were identified looking at NAFLD and colorectal cancer. However 1 of these was development of colorectal adenoma (not specifically cancer) so was graded as indirect evidence. Nine studies were identified for NAFLD and diabetes. These were
National Institute for Health and Care Excellence 2016
NAFLD
Extra-hepatic conditions
142
predominantly drawing from large databases of Korean and Japanese employee health checks. Four studies were identified for NAFLD and the development of chronic kidney disease. Three of these were with people with diabetes. No evidence was found on NAFLD and the development of dyslipidaemia, obstructive sleep apnoea syndrome, polycystic ovarian syndrome, obesity, insulin resistance or the effect on vitamin D levels.
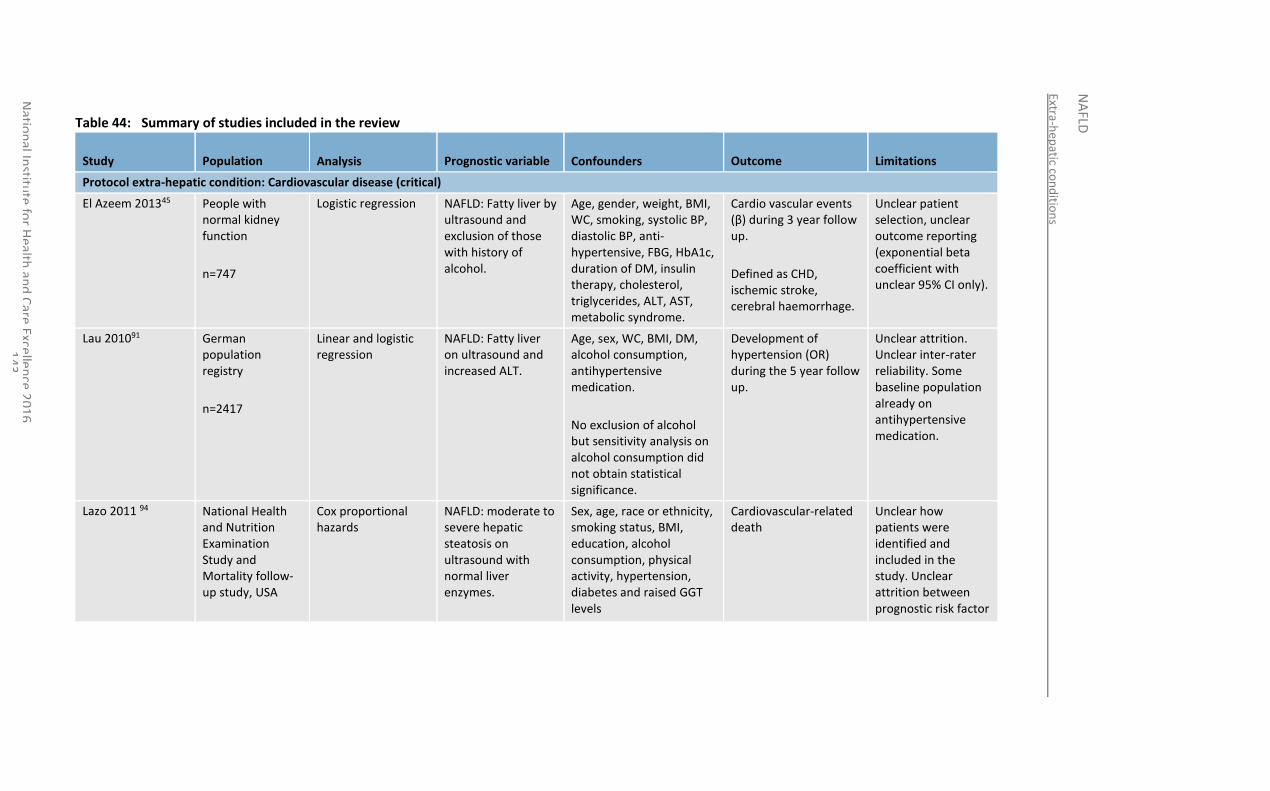
Extra-hep
atic con
ditio
ns
NA
FLD
Natio
nal In
stitute
for H
ealth an
d C
are Excellen
ce 20
16
1
43
Table 44: Summary of studies included in the review
Study Population
Analysis Prognostic variable
Confounders Outcome Limitations
Protocol extra-hepatic condition: Cardiovascular disease (critical)
El Azeem 201345 People with normal kidney function
n=747
Logistic regression NAFLD: Fatty liver by ultrasound and exclusion of those with history of alcohol.
Age, gender, weight, BMI, WC, smoking, systolic BP, diastolic BP, anti-hypertensive, FBG, HbA1c, duration of DM, insulin therapy, cholesterol, triglycerides, ALT, AST, metabolic syndrome.
Cardio vascular events (β) during 3 year follow up.
Defined as CHD, ischemic stroke, cerebral haemorrhage.
Unclear patient selection, unclear outcome reporting (exponential beta coefficient with unclear 95% CI only).
Lau 201091 German population registry
n=2417
Linear and logistic regression
NAFLD: Fatty liver on ultrasound and increased ALT.
Age, sex, WC, BMI, DM, alcohol consumption, antihypertensive medication.
No exclusion of alcohol but sensitivity analysis on alcohol consumption did not obtain statistical significance.
Development of hypertension (OR) during the 5 year follow up.
Unclear attrition. Unclear inter-rater reliability. Some baseline population already on antihypertensive medication.
Lazo 2011 94 National Health and Nutrition Examination Study and Mortality follow-up study, USA
Cox proportional hazards
NAFLD: moderate to severe hepatic steatosis on ultrasound with normal liver enzymes.
Sex, age, race or ethnicity, smoking status, BMI, education, alcohol consumption, physical activity, hypertension, diabetes and raised GGT levels
Cardiovascular-related death
Unclear how patients were identified and included in the study. Unclear attrition between prognostic risk factor
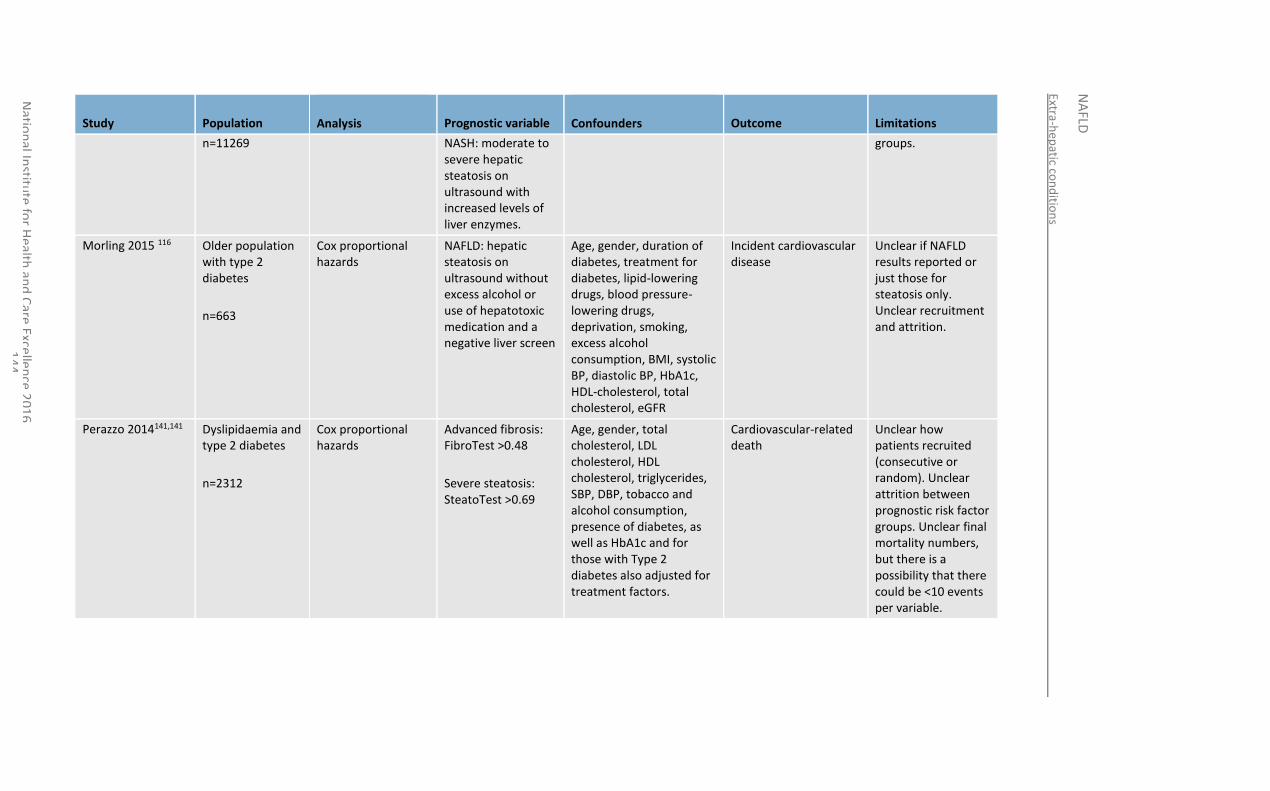
Extra-hep
atic con
ditio
ns
NA
FLD
Natio
nal In
stitute
for H
ealth an
d C
are Excellen
ce 20
16
1
44
Study Population
Analysis Prognostic variable
Confounders Outcome Limitations
n=11269 NASH: moderate to severe hepatic steatosis on ultrasound with increased levels of liver enzymes.
groups.
Morling 2015 116 Older population with type 2 diabetes
n=663
Cox proportional hazards
NAFLD: hepatic steatosis on ultrasound without excess alcohol or use of hepatotoxic medication and a negative liver screen
Age, gender, duration of diabetes, treatment for diabetes, lipid-lowering drugs, blood pressure-lowering drugs, deprivation, smoking, excess alcohol consumption, BMI, systolic BP, diastolic BP, HbA1c, HDL-cholesterol, total cholesterol, eGFR
Incident cardiovascular disease
Unclear if NAFLD results reported or just those for steatosis only. Unclear recruitment and attrition.
Perazzo 2014141,141 Dyslipidaemia and type 2 diabetes
n=2312
Cox proportional hazards
Advanced fibrosis: FibroTest >0.48
Severe steatosis: SteatoTest >0.69
Age, gender, total cholesterol, LDL cholesterol, HDL cholesterol, triglycerides, SBP, DBP, tobacco and alcohol consumption, presence of diabetes, as well as HbA1c and for those with Type 2 diabetes also adjusted for treatment factors.
Cardiovascular-related death
Unclear how patients recruited (consecutive or random). Unclear attrition between prognostic risk factor groups. Unclear final mortality numbers, but there is a possibility that there could be <10 events per variable.
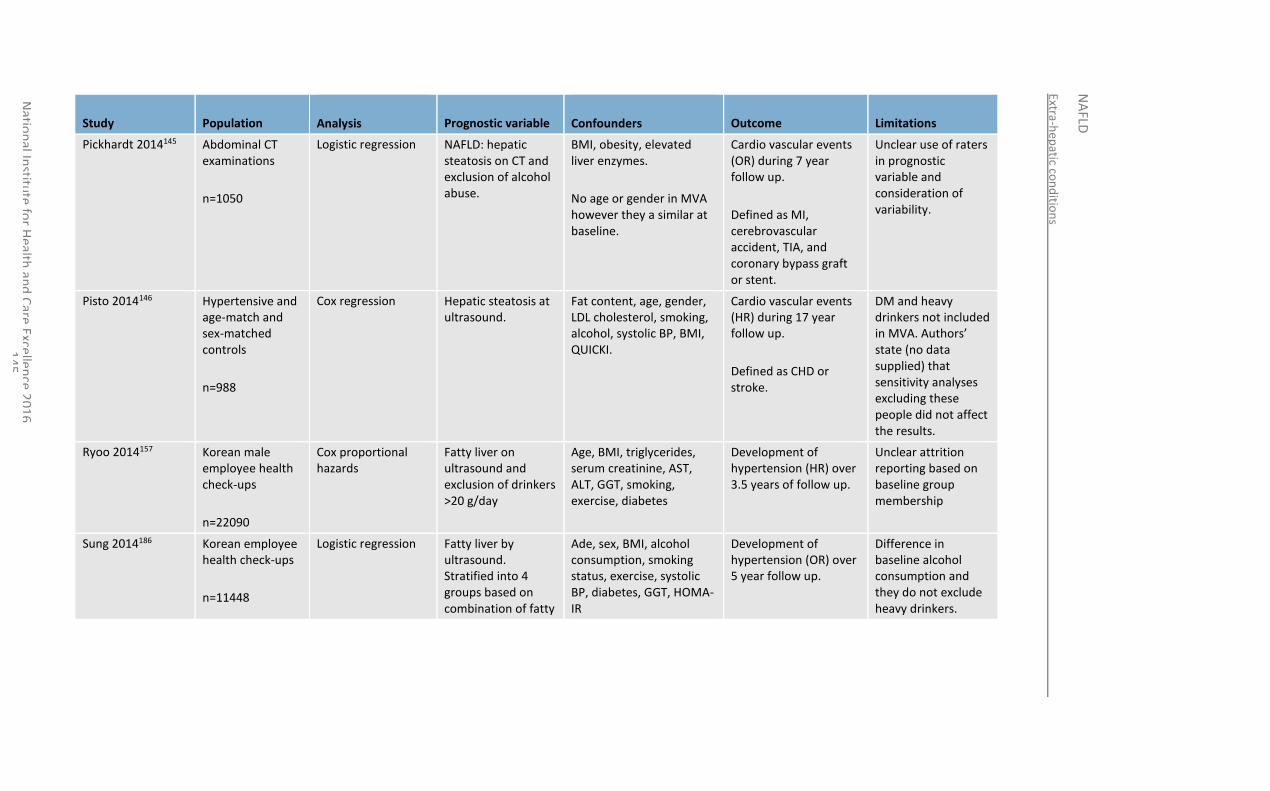
Extra-hep
atic con
ditio
ns
NA
FLD
Natio
nal In
stitute
for H
ealth an
d C
are Excellen
ce 20
16
1
45
Study Population
Analysis Prognostic variable
Confounders Outcome Limitations
Pickhardt 2014145 Abdominal CT examinations
n=1050
Logistic regression NAFLD: hepatic steatosis on CT and exclusion of alcohol abuse.
BMI, obesity, elevated liver enzymes.
No age or gender in MVA however they a similar at baseline.
Cardio vascular events (OR) during 7 year follow up.
Defined as MI, cerebrovascular accident, TIA, and coronary bypass graft or stent.
Unclear use of raters in prognostic variable and consideration of variability.
Pisto 2014146 Hypertensive and age-match and sex-matched controls
n=988
Cox regression Hepatic steatosis at ultrasound.
Fat content, age, gender, LDL cholesterol, smoking, alcohol, systolic BP, BMI, QUICKI.
Cardio vascular events (HR) during 17 year follow up.
Defined as CHD or stroke.
DM and heavy drinkers not included in MVA. Authors’ state (no data supplied) that sensitivity analyses excluding these people did not affect the results.
Ryoo 2014157 Korean male employee health check-ups
n=22090
Cox proportional hazards
Fatty liver on ultrasound and exclusion of drinkers >20 g/day
Age, BMI, triglycerides, serum creatinine, AST, ALT, GGT, smoking, exercise, diabetes
Development of hypertension (HR) over 3.5 years of follow up.
Unclear attrition reporting based on baseline group membership
Sung 2014186 Korean employee health check-ups
n=11448
Logistic regression Fatty liver by ultrasound. Stratified into 4 groups based on combination of fatty
Ade, sex, BMI, alcohol consumption, smoking status, exercise, systolic BP, diabetes, GGT, HOMA-IR
Development of hypertension (OR) over 5 year follow up.
Difference in baseline alcohol consumption and they do not exclude heavy drinkers.
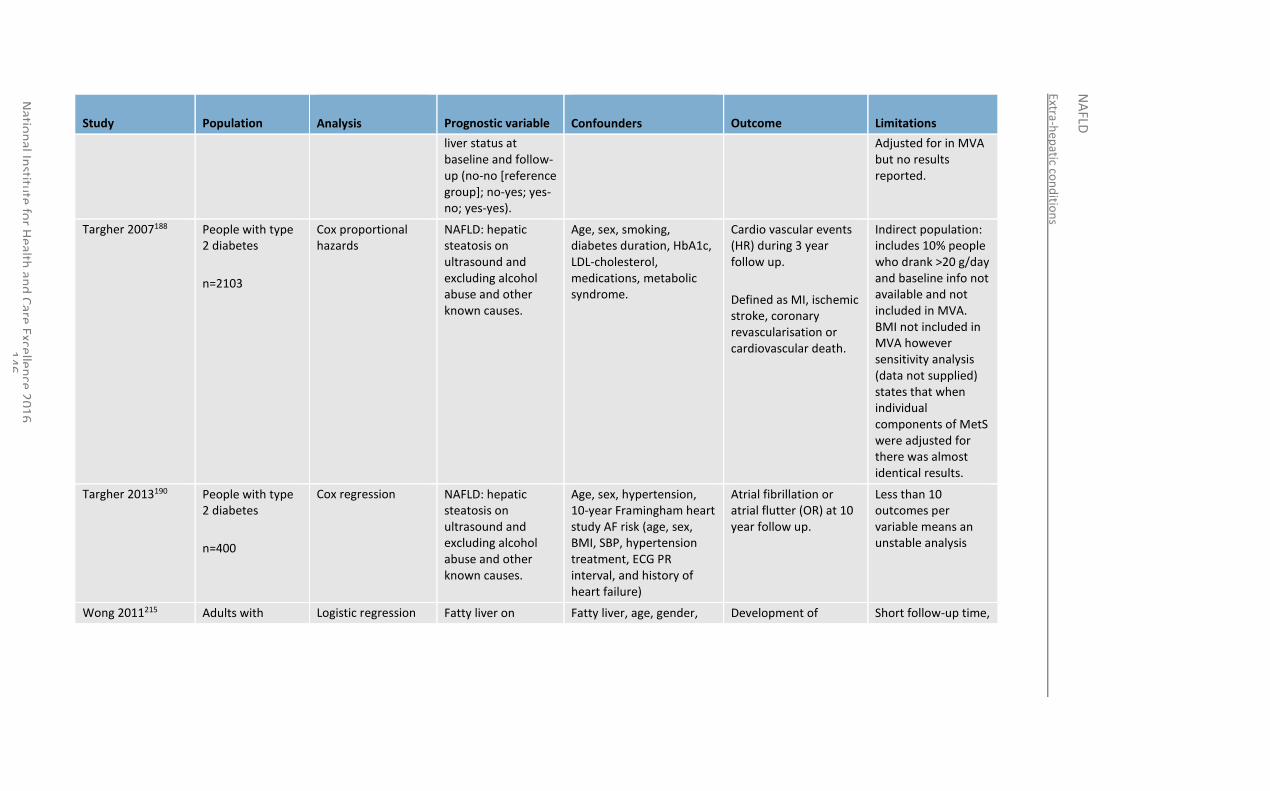
Extra-hep
atic con
ditio
ns
NA
FLD
Natio
nal In
stitute
for H
ealth an
d C
are Excellen
ce 20
16
1
46
Study Population
Analysis Prognostic variable
Confounders Outcome Limitations
liver status at baseline and follow-up (no-no [reference group]; no-yes; yes-no; yes-yes).
Adjusted for in MVA but no results reported.
Targher 2007188 People with type 2 diabetes
n=2103
Cox proportional hazards
NAFLD: hepatic steatosis on ultrasound and excluding alcohol abuse and other known causes.
Age, sex, smoking, diabetes duration, HbA1c, LDL-cholesterol, medications, metabolic syndrome.
Cardio vascular events (HR) during 3 year follow up.
Defined as MI, ischemic stroke, coronary revascularisation or cardiovascular death.
Indirect population: includes 10% people who drank >20 g/day and baseline info not available and not included in MVA. BMI not included in MVA however sensitivity analysis (data not supplied) states that when individual components of MetS were adjusted for there was almost identical results.
Targher 2013190 People with type 2 diabetes
n=400
Cox regression NAFLD: hepatic steatosis on ultrasound and excluding alcohol abuse and other known causes.
Age, sex, hypertension, 10-year Framingham heart study AF risk (age, sex, BMI, SBP, hypertension treatment, ECG PR interval, and history of heart failure)
Atrial fibrillation or atrial flutter (OR) at 10 year follow up.
Less than 10 outcomes per variable means an unstable analysis
Wong 2011215 Adults with Logistic regression Fatty liver on Fatty liver, age, gender, Development of Short follow-up time,
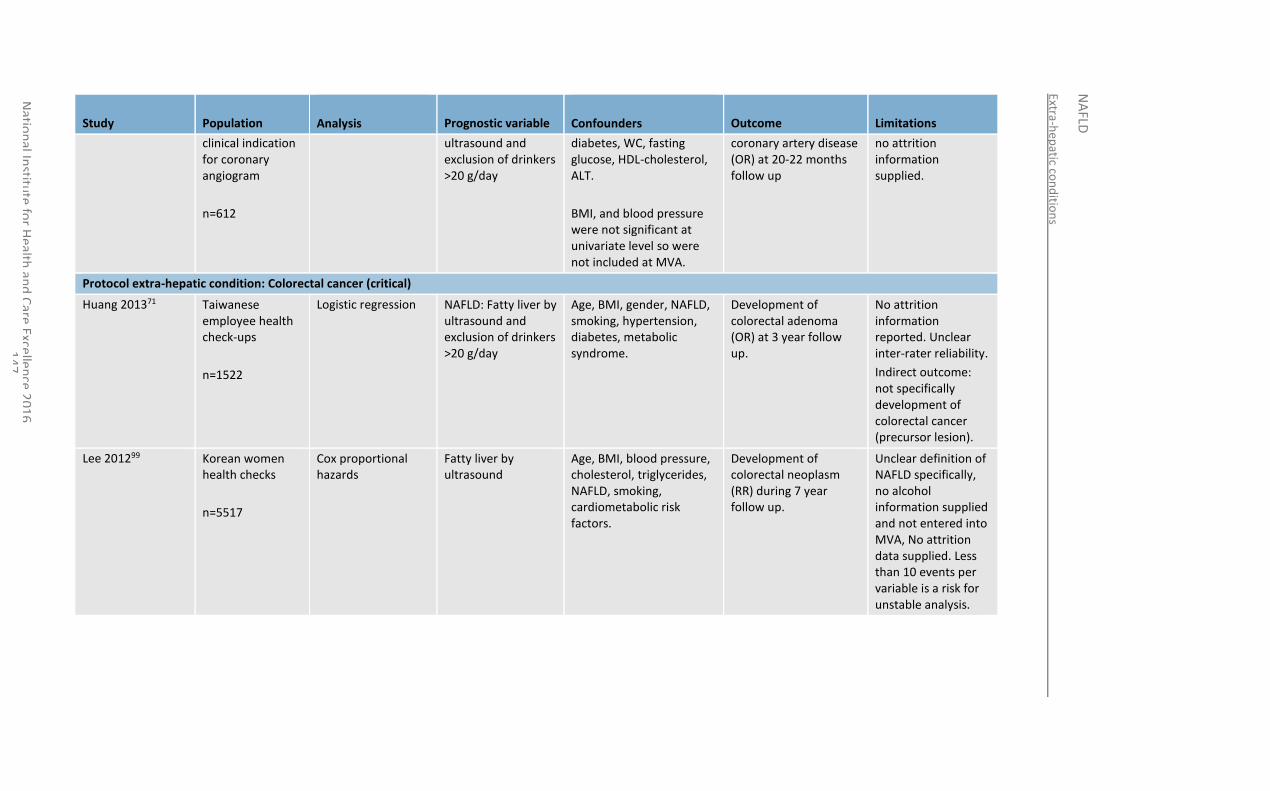
Extra-hep
atic con
ditio
ns
NA
FLD
Natio
nal In
stitute
for H
ealth an
d C
are Excellen
ce 20
16
1
47
Study Population
Analysis Prognostic variable
Confounders Outcome Limitations
clinical indication for coronary angiogram
n=612
ultrasound and exclusion of drinkers >20 g/day
diabetes, WC, fasting glucose, HDL-cholesterol, ALT.
BMI, and blood pressure were not significant at univariate level so were not included at MVA.
coronary artery disease (OR) at 20-22 months follow up
no attrition information supplied.
Protocol extra-hepatic condition: Colorectal cancer (critical)
Huang 201371 Taiwanese employee health check-ups
n=1522
Logistic regression NAFLD: Fatty liver by ultrasound and exclusion of drinkers >20 g/day
Age, BMI, gender, NAFLD, smoking, hypertension, diabetes, metabolic syndrome.
Development of colorectal adenoma (OR) at 3 year follow up.
No attrition information reported. Unclear inter-rater reliability.
Indirect outcome: not specifically development of colorectal cancer (precursor lesion).
Lee 201299 Korean women health checks
n=5517
Cox proportional hazards
Fatty liver by ultrasound
Age, BMI, blood pressure, cholesterol, triglycerides, NAFLD, smoking, cardiometabolic risk factors.
Development of colorectal neoplasm (RR) during 7 year follow up.
Unclear definition of NAFLD specifically, no alcohol information supplied and not entered into MVA, No attrition data supplied. Less than 10 events per variable is a risk for unstable analysis.
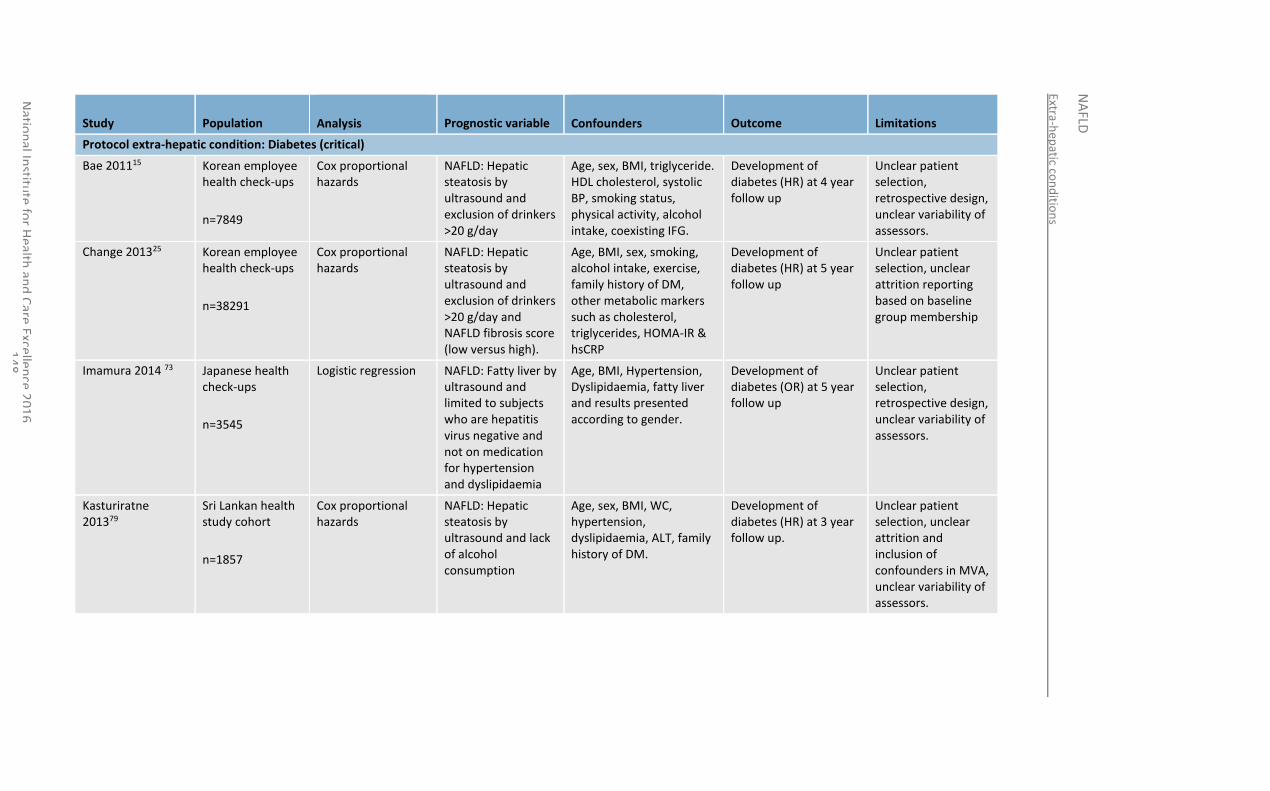
Extra-hep
atic con
ditio
ns
NA
FLD
Natio
nal In
stitute
for H
ealth an
d C
are Excellen
ce 20
16
1
48
Study Population
Analysis Prognostic variable
Confounders Outcome Limitations
Protocol extra-hepatic condition: Diabetes (critical)
Bae 201115 Korean employee health check-ups
n=7849
Cox proportional hazards
NAFLD: Hepatic steatosis by ultrasound and exclusion of drinkers >20 g/day
Age, sex, BMI, triglyceride. HDL cholesterol, systolic BP, smoking status, physical activity, alcohol intake, coexisting IFG.
Development of diabetes (HR) at 4 year follow up
Unclear patient selection, retrospective design, unclear variability of assessors.
Change 201325 Korean employee health check-ups
n=38291
Cox proportional hazards
NAFLD: Hepatic steatosis by ultrasound and exclusion of drinkers >20 g/day and NAFLD fibrosis score (low versus high).
Age, BMI, sex, smoking, alcohol intake, exercise, family history of DM, other metabolic markers such as cholesterol, triglycerides, HOMA-IR & hsCRP
Development of diabetes (HR) at 5 year follow up
Unclear patient selection, unclear attrition reporting based on baseline group membership
Imamura 2014 73 Japanese health check-ups
n=3545
Logistic regression NAFLD: Fatty liver by ultrasound and limited to subjects who are hepatitis virus negative and not on medication for hypertension and dyslipidaemia
Age, BMI, Hypertension, Dyslipidaemia, fatty liver and results presented according to gender.
Development of diabetes (OR) at 5 year follow up
Unclear patient selection, retrospective design, unclear variability of assessors.
Kasturiratne 201379
Sri Lankan health study cohort
n=1857
Cox proportional hazards
NAFLD: Hepatic steatosis by ultrasound and lack of alcohol consumption
Age, sex, BMI, WC, hypertension, dyslipidaemia, ALT, family history of DM.
Development of diabetes (HR) at 3 year follow up.
Unclear patient selection, unclear attrition and inclusion of confounders in MVA, unclear variability of assessors.
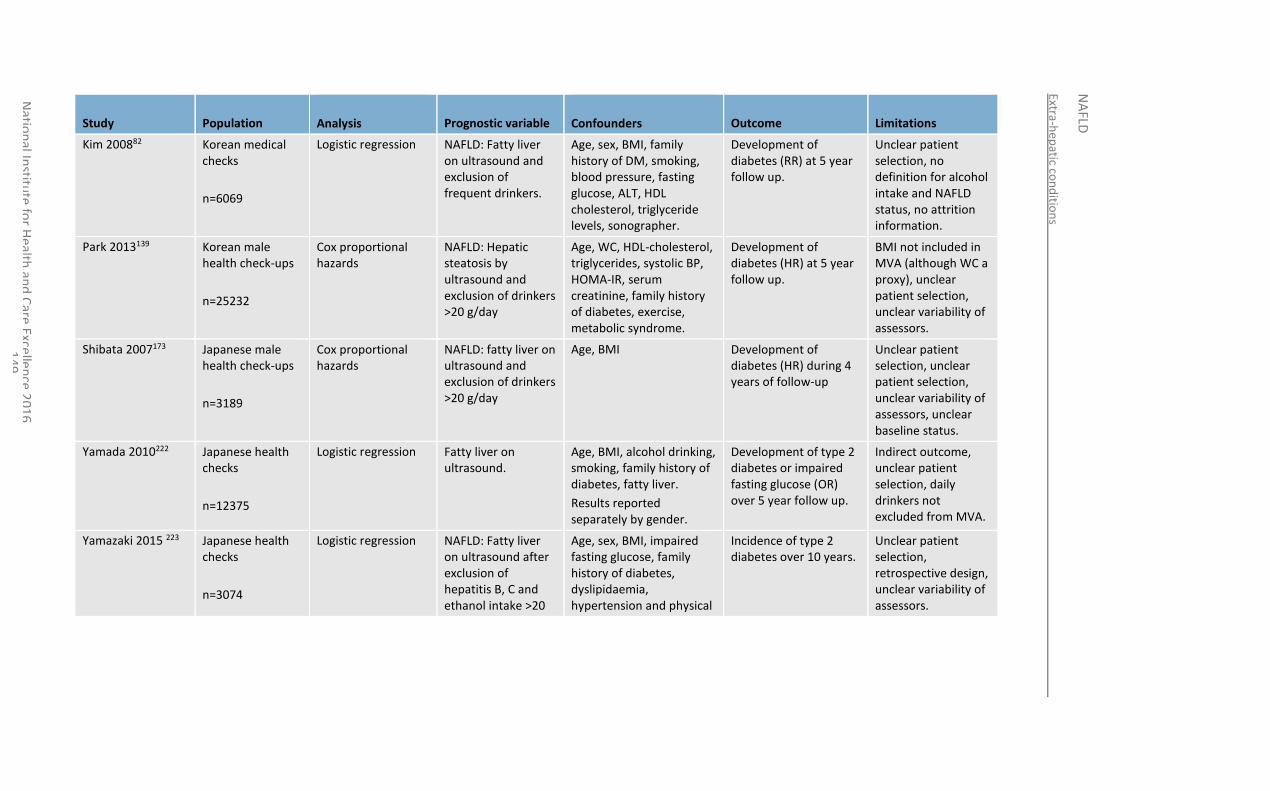
Extra-hep
atic con
ditio
ns
NA
FLD
Natio
nal In
stitute
for H
ealth an
d C
are Excellen
ce 20
16
1
49
Study Population
Analysis Prognostic variable
Confounders Outcome Limitations
Kim 200882 Korean medical checks
n=6069
Logistic regression NAFLD: Fatty liver on ultrasound and exclusion of frequent drinkers.
Age, sex, BMI, family history of DM, smoking, blood pressure, fasting glucose, ALT, HDL cholesterol, triglyceride levels, sonographer.
Development of diabetes (RR) at 5 year follow up.
Unclear patient selection, no definition for alcohol intake and NAFLD status, no attrition information.
Park 2013139 Korean male health check-ups
n=25232
Cox proportional hazards
NAFLD: Hepatic steatosis by ultrasound and exclusion of drinkers >20 g/day
Age, WC, HDL-cholesterol, triglycerides, systolic BP, HOMA-IR, serum creatinine, family history of diabetes, exercise, metabolic syndrome.
Development of diabetes (HR) at 5 year follow up.
BMI not included in MVA (although WC a proxy), unclear patient selection, unclear variability of assessors.
Shibata 2007173 Japanese male health check-ups
n=3189
Cox proportional hazards
NAFLD: fatty liver on ultrasound and exclusion of drinkers >20 g/day
Age, BMI Development of diabetes (HR) during 4 years of follow-up
Unclear patient selection, unclear patient selection, unclear variability of assessors, unclear baseline status.
Yamada 2010222 Japanese health checks
n=12375
Logistic regression Fatty liver on ultrasound.
Age, BMI, alcohol drinking, smoking, family history of diabetes, fatty liver.
Results reported separately by gender.
Development of type 2 diabetes or impaired fasting glucose (OR) over 5 year follow up.
Indirect outcome, unclear patient selection, daily drinkers not excluded from MVA.
Yamazaki 2015 223 Japanese health checks
n=3074
Logistic regression NAFLD: Fatty liver on ultrasound after exclusion of hepatitis B, C and ethanol intake >20
Age, sex, BMI, impaired fasting glucose, family history of diabetes, dyslipidaemia, hypertension and physical
Incidence of type 2 diabetes over 10 years.
Unclear patient selection, retrospective design, unclear variability of assessors.
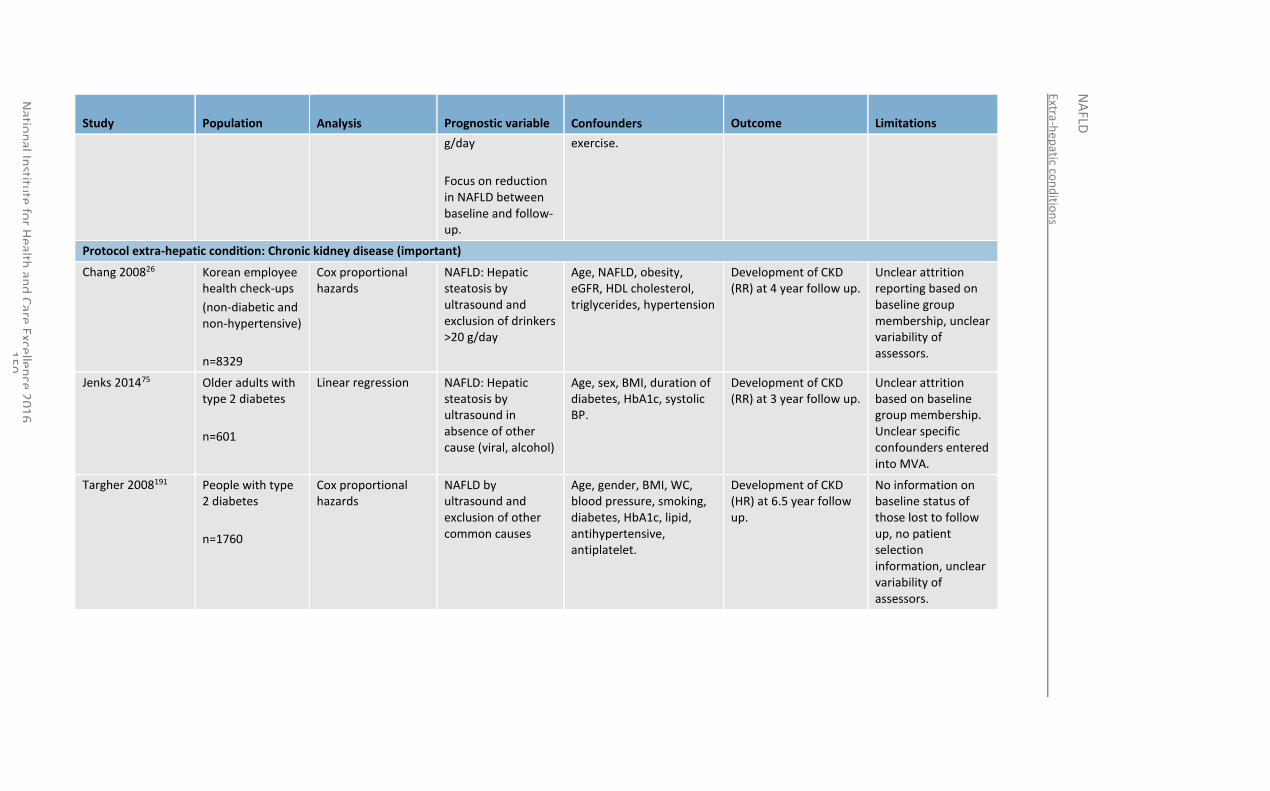
Extra-hep
atic con
ditio
ns
NA
FLD
Natio
nal In
stitute
for H
ealth an
d C
are Excellen
ce 20
16
1
50
Study Population
Analysis Prognostic variable
Confounders Outcome Limitations
g/day
Focus on reduction in NAFLD between baseline and follow-up.
exercise.
Protocol extra-hepatic condition: Chronic kidney disease (important)
Chang 200826 Korean employee health check-ups
(non-diabetic and non-hypertensive)
n=8329
Cox proportional hazards
NAFLD: Hepatic steatosis by ultrasound and exclusion of drinkers >20 g/day
Age, NAFLD, obesity, eGFR, HDL cholesterol, triglycerides, hypertension
Development of CKD (RR) at 4 year follow up.
Unclear attrition reporting based on baseline group membership, unclear variability of assessors.
Jenks 201475 Older adults with type 2 diabetes
n=601
Linear regression NAFLD: Hepatic steatosis by ultrasound in absence of other cause (viral, alcohol)
Age, sex, BMI, duration of diabetes, HbA1c, systolic BP.
Development of CKD (RR) at 3 year follow up.
Unclear attrition based on baseline group membership. Unclear specific confounders entered into MVA.
Targher 2008191 People with type 2 diabetes
n=1760
Cox proportional hazards
NAFLD by ultrasound and exclusion of other common causes
Age, gender, BMI, WC, blood pressure, smoking, diabetes, HbA1c, lipid, antihypertensive, antiplatelet.
Development of CKD (HR) at 6.5 year follow up.
No information on baseline status of those lost to follow up, no patient selection information, unclear variability of assessors.
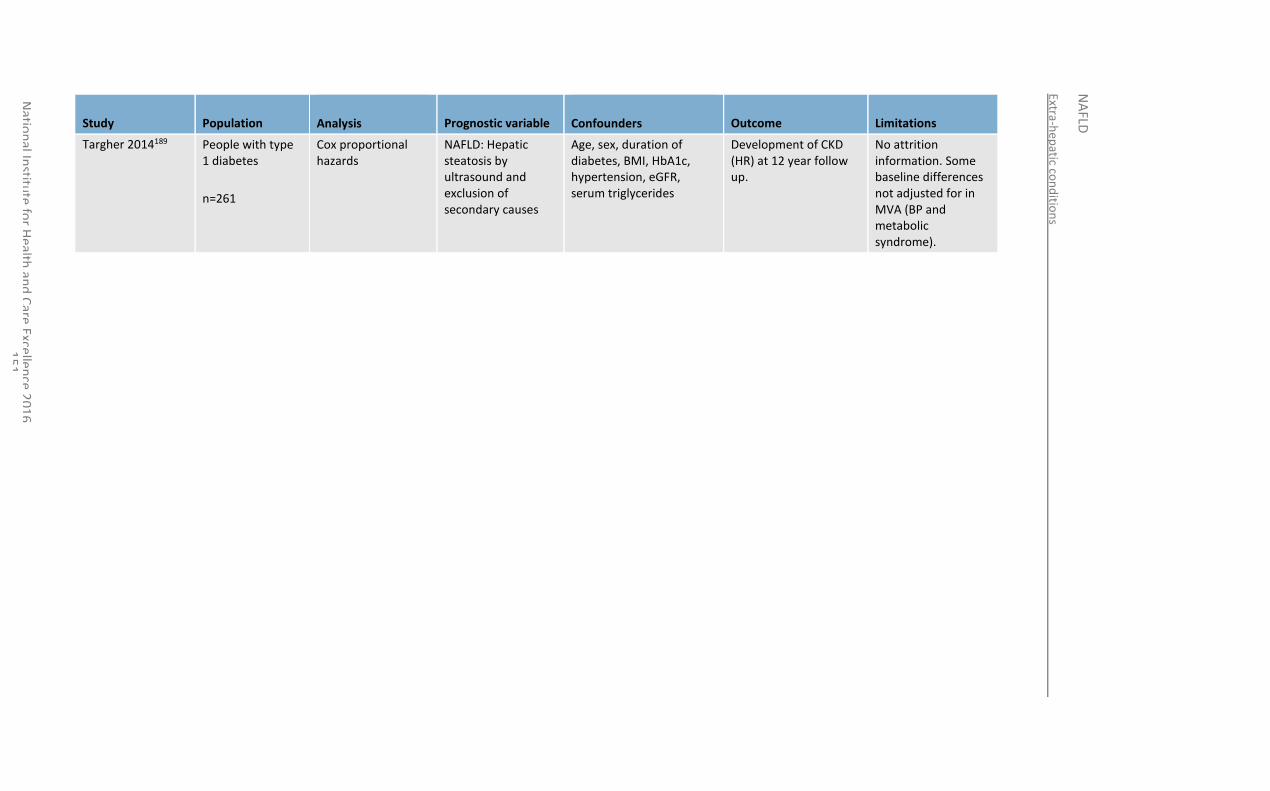
Extra-hep
atic con
ditio
ns
NA
FLD
Natio
nal In
stitute
for H
ealth an
d C
are Excellen
ce 20
16
1
51
Study Population
Analysis Prognostic variable
Confounders Outcome Limitations
Targher 2014189 People with type 1 diabetes
n=261
Cox proportional hazards
NAFLD: Hepatic steatosis by ultrasound and exclusion of secondary causes
Age, sex, duration of diabetes, BMI, HbA1c, hypertension, eGFR, serum triglycerides
Development of CKD (HR) at 12 year follow up.
No attrition information. Some baseline differences not adjusted for in MVA (BP and metabolic syndrome).
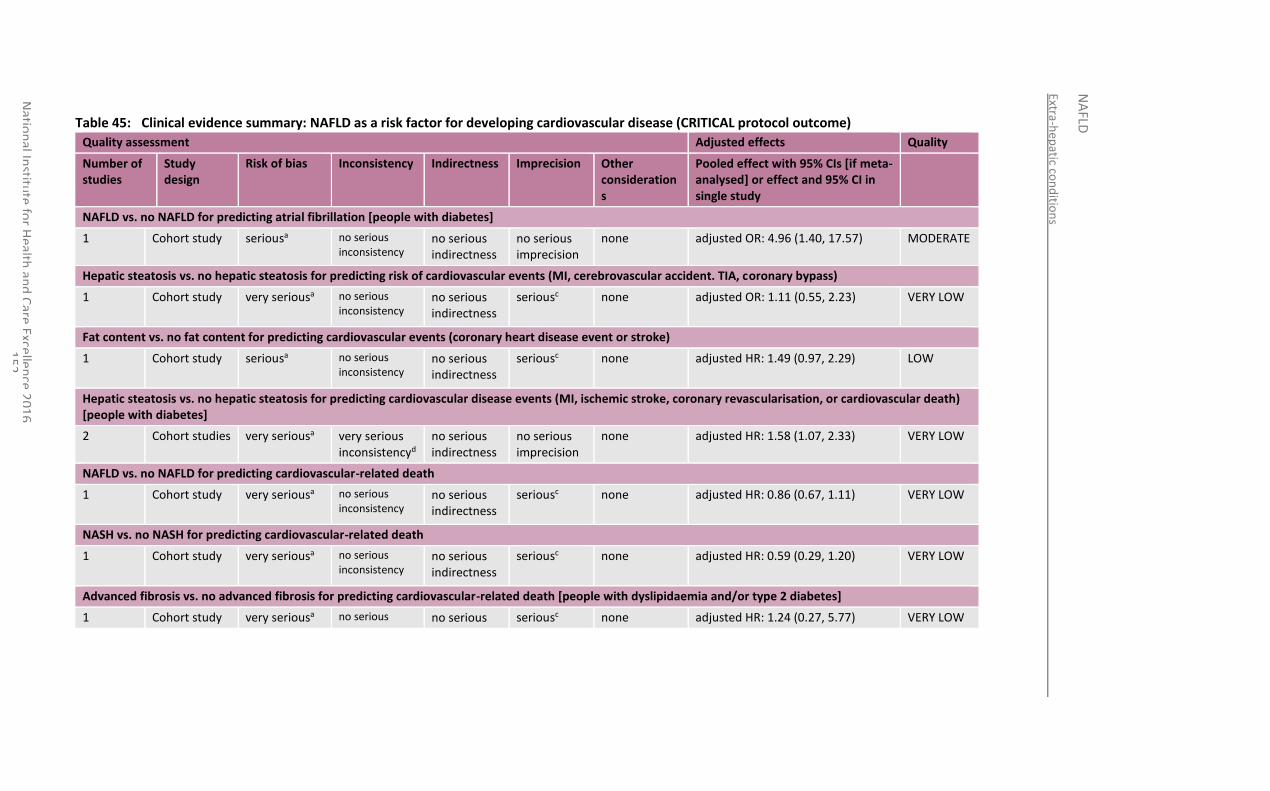
Extra-hep
atic con
ditio
ns
NA
FLD
Natio
nal In
stitute
for H
ealth an
d C
are Excellen
ce 20
16
1
52
Table 45: Clinical evidence summary: NAFLD as a risk factor for developing cardiovascular disease (CRITICAL protocol outcome)
Quality assessment Adjusted effects Quality
Number of studies
Study design
Risk of bias Inconsistency Indirectness Imprecision Other considerations
Pooled effect with 95% CIs [if meta-analysed] or effect and 95% CI in single study
NAFLD vs. no NAFLD for predicting atrial fibrillation [people with diabetes]
1 Cohort study seriousa no serious inconsistency
no serious indirectness
no serious imprecision
none adjusted OR: 4.96 (1.40, 17.57) MODERATE
Hepatic steatosis vs. no hepatic steatosis for predicting risk of cardiovascular events (MI, cerebrovascular accident. TIA, coronary bypass)
1 Cohort study very seriousa no serious inconsistency
no serious indirectness
seriousc
none adjusted OR: 1.11 (0.55, 2.23)
VERY LOW
Fat content vs. no fat content for predicting cardiovascular events (coronary heart disease event or stroke)
1 Cohort study seriousa no serious inconsistency
no serious indirectness
seriousc
none adjusted HR: 1.49 (0.97, 2.29) LOW
Hepatic steatosis vs. no hepatic steatosis for predicting cardiovascular disease events (MI, ischemic stroke, coronary revascularisation, or cardiovascular death) [people with diabetes]
2 Cohort studies very seriousa very serious inconsistencyd
no serious indirectness
no serious imprecision
none adjusted HR: 1.58 (1.07, 2.33) VERY LOW
NAFLD vs. no NAFLD for predicting cardiovascular-related death
1 Cohort study very seriousa no serious inconsistency
no serious indirectness
seriousc
none adjusted HR: 0.86 (0.67, 1.11) VERY LOW
NASH vs. no NASH for predicting cardiovascular-related death
1 Cohort study very seriousa no serious inconsistency
no serious indirectness
seriousc
none adjusted HR: 0.59 (0.29, 1.20) VERY LOW
Advanced fibrosis vs. no advanced fibrosis for predicting cardiovascular-related death [people with dyslipidaemia and/or type 2 diabetes]
1 Cohort study very seriousa no serious no serious seriousc none adjusted HR: 1.24 (0.27, 5.77) VERY LOW
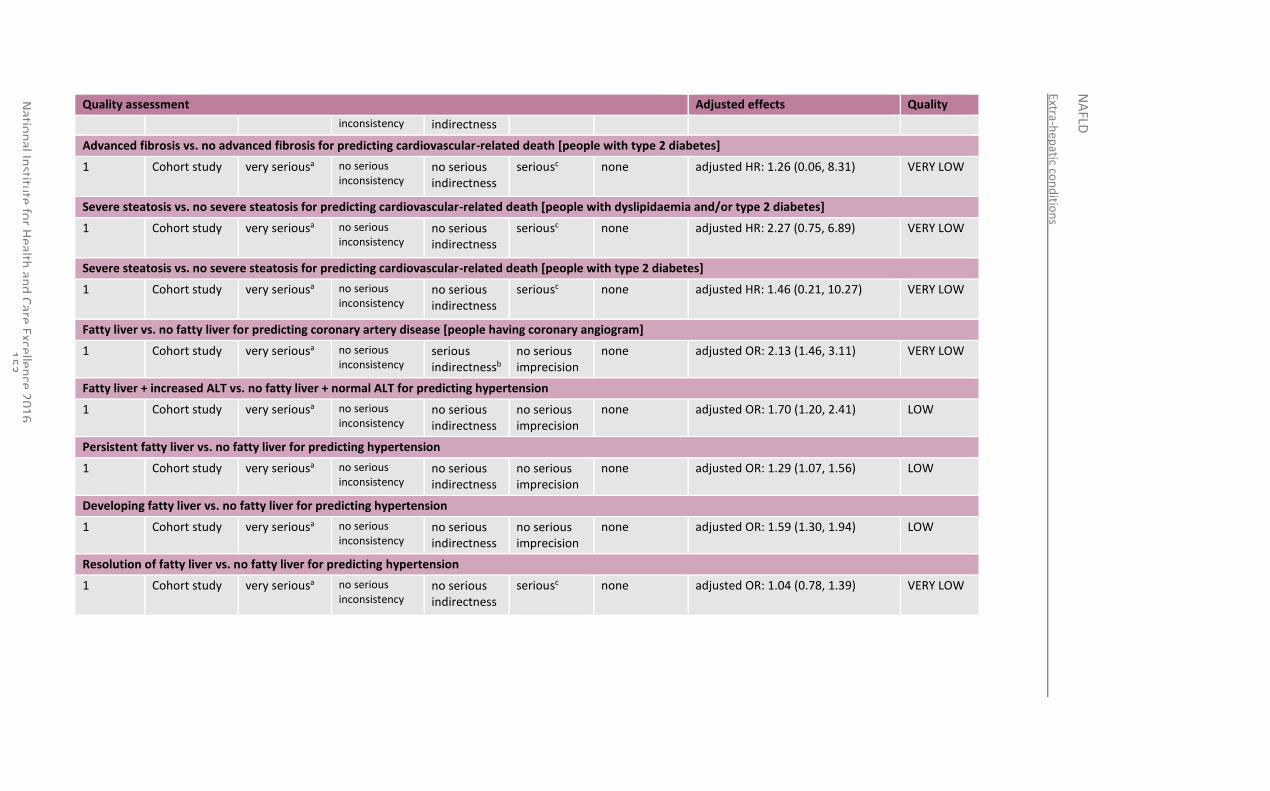
Extra-hep
atic con
ditio
ns
NA
FLD
Natio
nal In
stitute
for H
ealth an
d C
are Excellen
ce 20
16
1
53
Quality assessment Adjusted effects Quality
inconsistency indirectness
Advanced fibrosis vs. no advanced fibrosis for predicting cardiovascular-related death [people with type 2 diabetes]
1 Cohort study very seriousa no serious inconsistency
no serious indirectness
seriousc
none adjusted HR: 1.26 (0.06, 8.31) VERY LOW
Severe steatosis vs. no severe steatosis for predicting cardiovascular-related death [people with dyslipidaemia and/or type 2 diabetes]
1 Cohort study very seriousa no serious inconsistency
no serious indirectness
seriousc
none adjusted HR: 2.27 (0.75, 6.89) VERY LOW
Severe steatosis vs. no severe steatosis for predicting cardiovascular-related death [people with type 2 diabetes]
1 Cohort study very seriousa no serious inconsistency
no serious indirectness
seriousc
none adjusted HR: 1.46 (0.21, 10.27) VERY LOW
Fatty liver vs. no fatty liver for predicting coronary artery disease [people having coronary angiogram]
1 Cohort study very seriousa no serious inconsistency
serious indirectnessb
no serious imprecision
none adjusted OR: 2.13 (1.46, 3.11) VERY LOW
Fatty liver + increased ALT vs. no fatty liver + normal ALT for predicting hypertension
1 Cohort study very seriousa no serious inconsistency
no serious indirectness
no serious imprecision
none adjusted OR: 1.70 (1.20, 2.41) LOW
Persistent fatty liver vs. no fatty liver for predicting hypertension
1 Cohort study very seriousa no serious inconsistency
no serious indirectness
no serious imprecision
none adjusted OR: 1.29 (1.07, 1.56) LOW
Developing fatty liver vs. no fatty liver for predicting hypertension
1 Cohort study very seriousa no serious inconsistency
no serious indirectness
no serious imprecision
none adjusted OR: 1.59 (1.30, 1.94) LOW
Resolution of fatty liver vs. no fatty liver for predicting hypertension
1 Cohort study very seriousa no serious inconsistency
no serious indirectness
seriousc
none adjusted OR: 1.04 (0.78, 1.39) VERY LOW
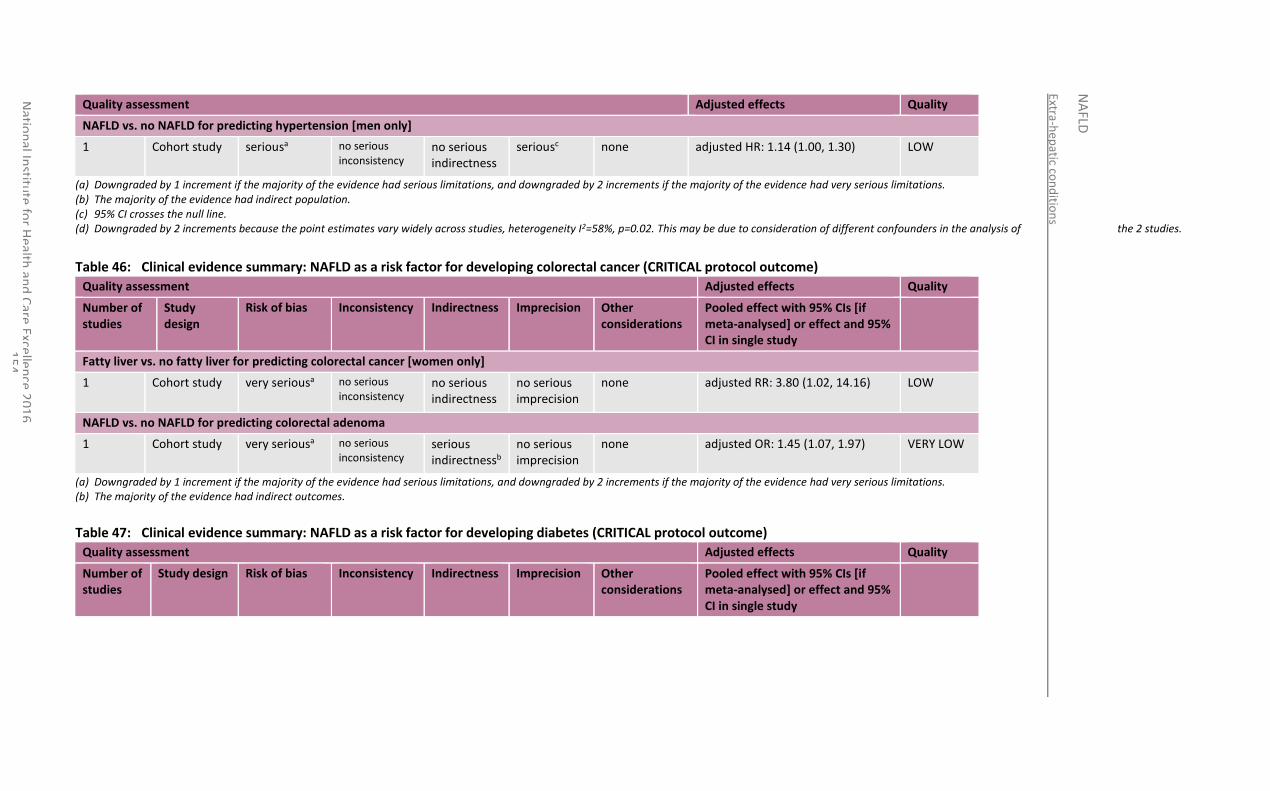
Extra-hep
atic con
ditio
ns
NA
FLD
Natio
nal In
stitute
for H
ealth an
d C
are Excellen
ce 20
16
1
54
Quality assessment Adjusted effects Quality
NAFLD vs. no NAFLD for predicting hypertension [men only]
1 Cohort study seriousa no serious inconsistency
no serious indirectness
seriousc
none adjusted HR: 1.14 (1.00, 1.30) LOW
(a) Downgraded by 1 increment if the majority of the evidence had serious limitations, and downgraded by 2 increments if the majority of the evidence had very serious limitations. (b) The majority of the evidence had indirect population. (c) 95% CI crosses the null line. (d) Downgraded by 2 increments because the point estimates vary widely across studies, heterogeneity I2=58%, p=0.02. This may be due to consideration of different confounders in the analysis of the 2 studies.
Table 46: Clinical evidence summary: NAFLD as a risk factor for developing colorectal cancer (CRITICAL protocol outcome)
Quality assessment Adjusted effects Quality
Number of studies
Study design
Risk of bias Inconsistency Indirectness Imprecision Other considerations
Pooled effect with 95% CIs [if meta-analysed] or effect and 95% CI in single study
Fatty liver vs. no fatty liver for predicting colorectal cancer [women only]
1 Cohort study very seriousa
no serious inconsistency
no serious indirectness
no serious imprecision
none adjusted RR: 3.80 (1.02, 14.16) LOW
NAFLD vs. no NAFLD for predicting colorectal adenoma
1 Cohort study very seriousa
no serious inconsistency
serious indirectnessb
no serious imprecision
none adjusted OR: 1.45 (1.07, 1.97) VERY LOW
(a) Downgraded by 1 increment if the majority of the evidence had serious limitations, and downgraded by 2 increments if the majority of the evidence had very serious limitations. (b) The majority of the evidence had indirect outcomes.
Table 47: Clinical evidence summary: NAFLD as a risk factor for developing diabetes (CRITICAL protocol outcome)
Quality assessment Adjusted effects Quality
Number of studies
Study design Risk of bias Inconsistency Indirectness Imprecision Other considerations
Pooled effect with 95% CIs [if meta-analysed] or effect and 95% CI in single study
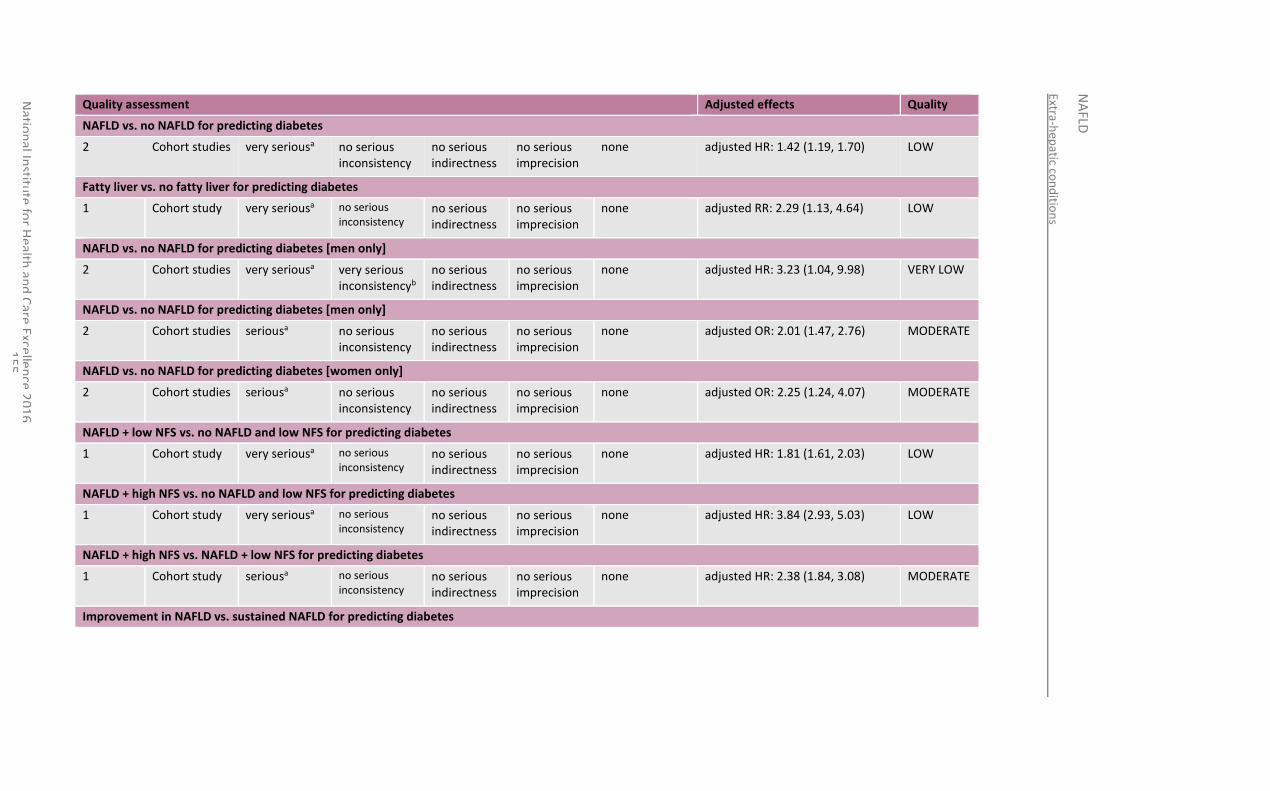
Extra-hep
atic con
ditio
ns
NA
FLD
Natio
nal In
stitute
for H
ealth an
d C
are Excellen
ce 20
16
1
55
Quality assessment Adjusted effects Quality
NAFLD vs. no NAFLD for predicting diabetes
2 Cohort studies very seriousa
no serious inconsistency
no serious indirectness
no serious imprecision
none adjusted HR: 1.42 (1.19, 1.70) LOW
Fatty liver vs. no fatty liver for predicting diabetes
1 Cohort study very seriousa
no serious inconsistency
no serious indirectness
no serious imprecision
none adjusted RR: 2.29 (1.13, 4.64) LOW
NAFLD vs. no NAFLD for predicting diabetes [men only]
2 Cohort studies very seriousa
very serious inconsistencyb
no serious indirectness
no serious imprecision
none adjusted HR: 3.23 (1.04, 9.98) VERY LOW
NAFLD vs. no NAFLD for predicting diabetes [men only]
2 Cohort studies seriousa
no serious inconsistency
no serious indirectness
no serious imprecision
none adjusted OR: 2.01 (1.47, 2.76) MODERATE
NAFLD vs. no NAFLD for predicting diabetes [women only]
2 Cohort studies seriousa
no serious inconsistency
no serious indirectness
no serious imprecision
none adjusted OR: 2.25 (1.24, 4.07) MODERATE
NAFLD + low NFS vs. no NAFLD and low NFS for predicting diabetes
1 Cohort study very seriousa
no serious inconsistency
no serious indirectness
no serious imprecision
none adjusted HR: 1.81 (1.61, 2.03) LOW
NAFLD + high NFS vs. no NAFLD and low NFS for predicting diabetes
1 Cohort study very seriousa
no serious inconsistency
no serious indirectness
no serious imprecision
none adjusted HR: 3.84 (2.93, 5.03) LOW
NAFLD + high NFS vs. NAFLD + low NFS for predicting diabetes
1 Cohort study seriousa
no serious inconsistency
no serious indirectness
no serious imprecision
none adjusted HR: 2.38 (1.84, 3.08) MODERATE
Improvement in NAFLD vs. sustained NAFLD for predicting diabetes
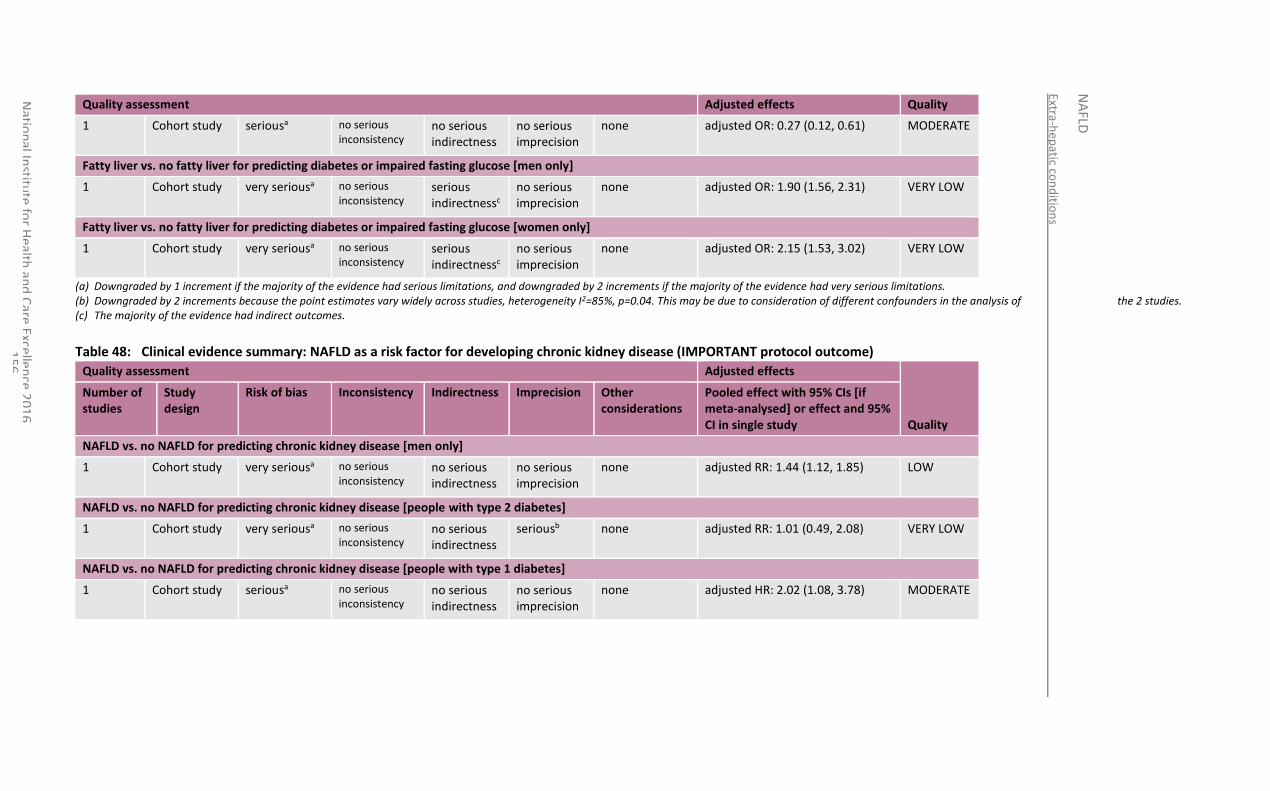
Extra-hep
atic con
ditio
ns
NA
FLD
Natio
nal In
stitute
for H
ealth an
d C
are Excellen
ce 20
16
1
56
Quality assessment Adjusted effects Quality
1 Cohort study seriousa
no serious inconsistency
no serious indirectness
no serious imprecision
none adjusted OR: 0.27 (0.12, 0.61) MODERATE
Fatty liver vs. no fatty liver for predicting diabetes or impaired fasting glucose [men only]
1 Cohort study very seriousa
no serious inconsistency
serious indirectnessc
no serious imprecision
none adjusted OR: 1.90 (1.56, 2.31) VERY LOW
Fatty liver vs. no fatty liver for predicting diabetes or impaired fasting glucose [women only]
1 Cohort study very seriousa
no serious inconsistency
serious indirectnessc
no serious imprecision
none adjusted OR: 2.15 (1.53, 3.02) VERY LOW
(a) Downgraded by 1 increment if the majority of the evidence had serious limitations, and downgraded by 2 increments if the majority of the evidence had very serious limitations. (b) Downgraded by 2 increments because the point estimates vary widely across studies, heterogeneity I2=85%, p=0.04. This may be due to consideration of different confounders in the analysis of the 2 studies. (c) The majority of the evidence had indirect outcomes.
Table 48: Clinical evidence summary: NAFLD as a risk factor for developing chronic kidney disease (IMPORTANT protocol outcome)
Quality assessment Adjusted effects
Quality
Number of studies
Study design
Risk of bias Inconsistency Indirectness Imprecision Other considerations
Pooled effect with 95% CIs [if meta-analysed] or effect and 95% CI in single study
NAFLD vs. no NAFLD for predicting chronic kidney disease [men only]
1 Cohort study very seriousa
no serious inconsistency
no serious indirectness
no serious imprecision
none adjusted RR: 1.44 (1.12, 1.85) LOW
NAFLD vs. no NAFLD for predicting chronic kidney disease [people with type 2 diabetes]
1 Cohort study very seriousa
no serious inconsistency
no serious indirectness
seriousb none adjusted RR: 1.01 (0.49, 2.08) VERY LOW
NAFLD vs. no NAFLD for predicting chronic kidney disease [people with type 1 diabetes]
1 Cohort study seriousa
no serious inconsistency
no serious indirectness
no serious imprecision
none adjusted HR: 2.02 (1.08, 3.78) MODERATE
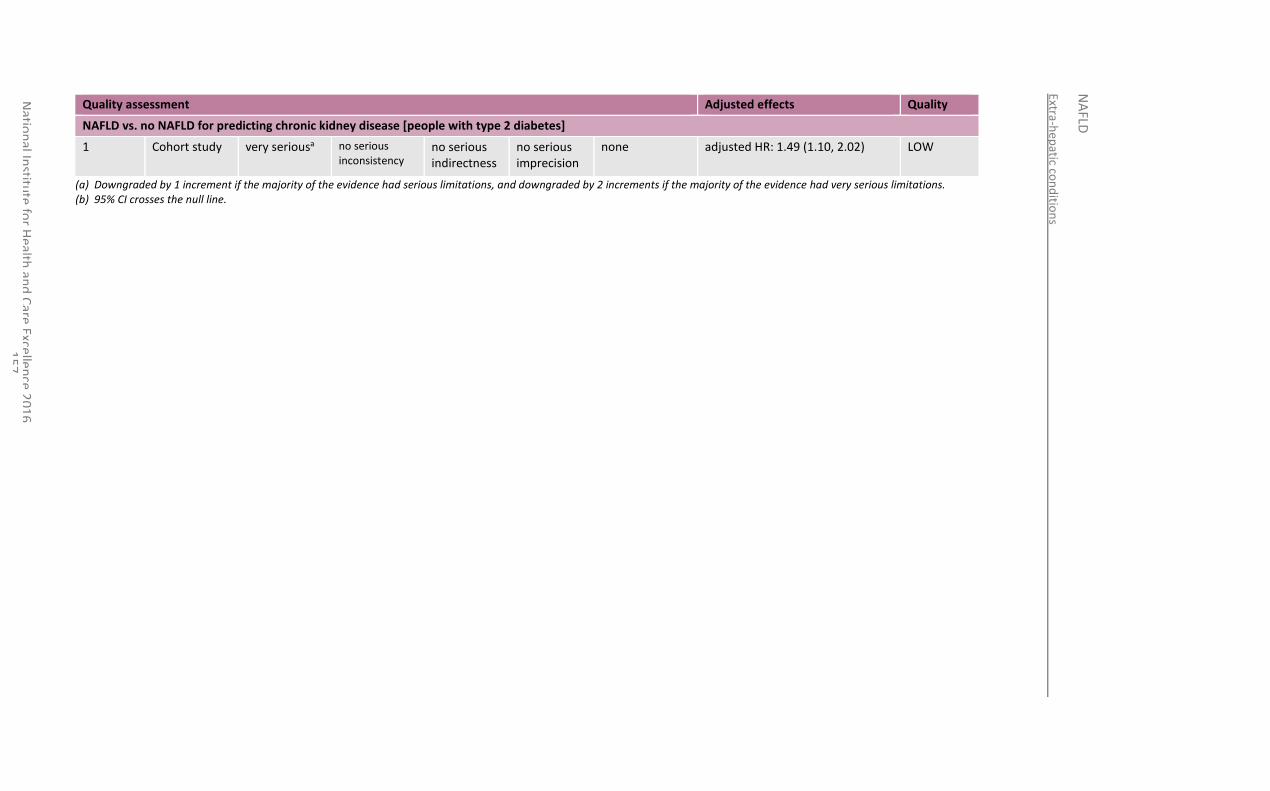
Extra-hep
atic con
ditio
ns
NA
FLD
Natio
nal In
stitute
for H
ealth an
d C
are Excellen
ce 20
16
1
57
Quality assessment Adjusted effects Quality
NAFLD vs. no NAFLD for predicting chronic kidney disease [people with type 2 diabetes]
1 Cohort study very seriousa
no serious inconsistency
no serious indirectness
no serious imprecision
none adjusted HR: 1.49 (1.10, 2.02) LOW
(a) Downgraded by 1 increment if the majority of the evidence had serious limitations, and downgraded by 2 increments if the majority of the evidence had very serious limitations. (b) 95% CI crosses the null line.
National Institute for Health and Care Excellence 2016
NAFLD
Extra-hepatic conditions
158
9.4 Economic evidence
9.4.1 Published literature
No relevant economic evaluations were identified.
See also the economic article selection flow chart in Appendix F.
9.4.2 Unit costs
See Table 89 in Appendix O.
9.5 Evidence statements
9.5.1 Clinical
Cardiovascular risk
Moderate quality evidence from 1 study (n=400) suggests that people with diabetes and NAFLD are at higher risk for developing atrial fibrillation than those without NAFLD (adjusted OR 4.96, 95% CI 1.40-17.57). Three cohort studies investigated NAFLD as a risk factor for cardiovascular events. Very low and low quality evidence suggests that the presence of hepatic steatosis or fat content are not a risk factor for cardiovascular events such as myocardial infarction, cerebrovascular accident, transient ischemic attack, coronary bypass, coronary heart disease or stroke (adjusted OR 1.11, 95% CI 0.55-2.23 (n=1050) and adjusted HR 1.49, 95% CI 0.97-2.29 (n=988)). Very low quality evidence from 2 studies suggests that for those with diabetes, having hepatic steatosis is a risk factor for myocardial infarction, ischemic stroke, coronary revascularisation or cardiovascular death compared to those with diabetes and no hepatic steatosis (adjusted HR 1.58, 95% CI 1.07-2.33, n=2766). Two papers investigated aspects of NAFLD as a risk factor for cardiovascular death. Very low quality evidence from 1 study (n=11269) suggests that neither NAFLD nor NASH put people at increased risk for cardiovascular-related death (adjusted HR 0.86, 95% CI 0.67-1.11 and adjusted HR 0.59, 95% CI 0.29-1.20). Very low quality evidence from another study involving people with dyslipidaemia and/or type 2 diabetes (n=2312) also suggests that advanced fibrosis or severe steatosis are not an increased risk factor for cardiovascular-related death (adjusted HR 1.24, 95% CI 0.27-5.77, adjusted HR 1.26, 95% CI 0.06-8.31, adjusted HR 2.27, 95% CI 0.75-6.89, and adjusted HR 1.46, 95% CI 0.21-10.27). Very low quality evidence from 1 study in a highly selected indirect population of people having coronary angiogram (n=612) suggests that those with fatty liver are at an increased risk for developing coronary artery disease compared to those without fatty liver (adjusted OR 2.13, 95% CI 1.46-3.11). Low quality evidence from 1 study (n=2417) suggests that fatty liver and increase ALT levels are a risk factor for developing hypertension compared to those with no fatty liver and normal ALT levels (adjusted OR 1.70, 95% CI 1.20-2.41). Low quality evidence from 1 study (n=11448) suggests that those with persistent fatty liver (at both baseline and follow-up) and those who developed fatty liver between baseline and follow-up are at increased risk for developing hypertension compared to those without fatty liver at baseline or follow-up (adjusted OR 1.29, 95% CI 1.07-1.56 and adjusted OR 1.59, 95% CI 1.30-1.94), however those who had fatty liver at baseline and experienced resolution of fatty liver by follow-up are not at increased risk for developing hypertension (adjusted OR 1.04, 95% CI 0.78-1.39). Low quality evidence from a third study in men only (n=22090)
National Institute for Health and Care Excellence 2016
NAFLD
Extra-hepatic conditions
159
also suggests that those with NAFLD are not at increased risk for developing hypertension compared to men without NAFLD (adjusted HR 1.14, 95% CI 1.00-1.03).
Colorectal cancer
Low quality evidence from 1 retrospective cohort study (n=5517) shows that women with fatty liver have an increased risk of developing colorectal cancer, although the small event numbers lead to a large confidence interval around the effect (adjusted RR 3.80, 95%CI 1.02-14.16). Very low quality evidence from 1 cohort study (n=1522) shows that people with NAFLD have an increased risk for developing the indirect outcome of colorectal adenoma (adjusted OR 1.45, 95% CI 1.07-1.97).
Diabetes
Low quality evidence from 2 studies (n=9706) suggests that people with NAFLD are at increased risk for developing diabetes (adjusted HR 1.42, 95% CI 1.19-1.70). Similar low quality evidence from 1 study suggests (n=6069) that people with fatty liver are at increased risk for developing diabetes (adjusted RR 2.29, 95% CI 1.13-4.64). Very low quality evidence from 2 studies (n=28421) suggests that NAFLD is a risk factor for developing diabetes in a male only population (adjusted HR 3.23, 95% CI 1.04-9.98). Moderate quality evidence from 2 more cohort studies (n-6734) also suggests that NAFLD is a risk factor for developing diabetes for men (adjusted OR 2.01, 95% CI 1.47-2.76) and for women (adjusted OR 2.25, 95% CI 1.24-4.07). Low quality evidence from 1 study (n=38291) looking at the presence of NAFLD in combination with fibrosis score suggests that both those with NAFLD and a low NAFLD fibrosis score and NAFLD with an intermediate-high fibrosis score are at increased risk for developing diabetes compared to those with no NAFLD (adjusted HR 1.81 , 95% CI 1.61-2.03 and adjusted HR 3.84, 95% CI 2.93-5.03), and that those with NAFLD and an intermediate-high NFS are at an increased risk for developing diabetes compared to those with NAFLD and a low NFS score (adjusted HR 2.38, 95% CI 1.84-3.08). Moderate quality evidence from 1 study (n=3074) suggests that reduction of NAFLD is associated with a reduced risk of type 2 diabetes compared to those with sustained NAFLD (adjusted OR 0.27, 95% CI 0.12-0.61). Very low quality evidence from 1 study (n=12375) suggests that men and women with fatty liver are at an increased risk for developing the indirect outcome of diabetes or impaired fasting glucose compared to men and women without fatty liver (adjusted OR 1.90, 95% CI 1.56-2.31, and adjusted OR 2.15, 95% CI 1.53-3.02).
Chronic kidney disease
Low quality evidence from 1 study (n=8329) shows that men with NAFLD have an increased risk for developing chronic kidney disease (adjusted OR 1.44, 95%CI 1.12-1.85). Two studies were identified looking at NAFLD in people with type 2 diabetes. Very low quality evidence from 1 of these studies (n=601) suggests there is no difference in risk between those with NAFLD and those without (adjusted RR 1.01, 95% CI 0.49-2.08). However, low quality evidence from the other study (n=1760) suggests that those with NAFLD and diabetes are at an increased risk for developing CKD compared to those with diabetes and no NAFLD (adjusted HR 1.49, 95%CI 1.10-2.02). Moderate quality evidence from 1 cohort study in people with type 1 diabetes (n=261) suggests that in this population, having NAFLD does increase your risk for CKD (adjusted HR 2.02 =, 95%CI 1.08-3.78).
There was no evidence identified on whether people with NAFLD are at an increased risk for developing dyslipidaemia, obstructive sleep apnoea, PCOS, obesity, or insulin resistance, or having an independent effect on vitamin D levels.
9.5.2 Economic
No relevant economic evaluations were identified.
National Institute for Health and Care Excellence 2016
NAFLD
Extra-hepatic conditions
160
9.6 Recommendations and link to evidence
Recommendations 17. Be aware that NAFLD is a risk factor for type 2 diabetes, hypertension and chronic kidney disease.
18. Be aware that in people with type 2 diabetes, NAFLD is a risk factor for atrial fibrillation, myocardial infarction, ischaemic stroke and death from cardiovascular causes.
Research recommendation
8. Is NAFLD a risk factor for the development of colorectal cancer?
Relative values of different outcomes
The GDG agreed that the outcomes that were critical to decision-making were the risks of cardiovascular disease (including myocardial infarction, stroke, transient ischaemic attack, angina, peripheral arterial disease and hypertension), type 2 diabetes, colorectal cancer and dyslipidaemia (focusing particularly on hypertriglyceridaemia). Studies that reported cardiovascular events and those that reported mortality attributable to cardiovascular disease were agreed to be suitable for inclusion. The GDG agreed to include data concerning occurrence of colorectal adenomas as well as data reporting colorectal malignancies.
Trade-off between clinical benefits and harms
Cardiovascular disease:
A single prospective cohort study reported that people with NAFLD and diabetes had a significantly increased risk of atrial fibrillation. Although only a single study, the GDG considered the apparent strength of association – coupled with the large number of participants within the study (400 people) – was sufficient for them to conclude that NAFLD with diabetes is an independent risk factor for atrial fibrillation, after adjusting for age, sex, hypertension, electrocardiographic LVH and PR interval, and 10-year Framingham Heart Study-derived AF risk score.
Although the evidence shows that NAFLD is independently associated with an approximate doubling of risk of cardiovascular disease, the GDG noted that none of the identified evidence evaluating whether cardiovascular-related mortality alone is a complication of NAFLD identified a positive association. This finding was maintained whether NASH or severe fibrosis were present or not and regardless of the presence or absence of dyslipidaemia or diabetes. The GDG also noted that the evidence reviewed was of very low quality by GRADE criteria. However, the GDG noted a large prospective cohort study - which included more than 2,000 people - reported data consistent with NAFLD with diabetes as being an independent risk factor for cardiovascular events (which were measured in different ways including incidence of specific events, such as myocardial infarction or stroke; need for certain interventions such as coronary revascularisation or carotid endarterectomy; or as cardiovascular-related mortality). The conclusion of the GDG was that the identified evidence was strong enough to conclude that co-morbid NAFLD and diabetes (and possibly not NAFLD by itself) is an independent risk factor for cardiovascular disease when adjusting for combinations of fat content, age, gender, LDL cholesterol, smoking, alcohol consumption, systolic blood pressure, BMI, QUICKI (quantitative insulin sensitivity check index), diabetes, elevated liver enzymes, smoking, diabetes duration, HbA1c, medications, and metabolic syndrome. However, to date more evidence is needed in people without diabetes as a co-morbid condition, since cohort studies in people without diabetes have lower cardiovascular event rates
National Institute for Health and Care Excellence 2016
NAFLD
Extra-hepatic conditions
161
than studies in which diabetes is a co-morbid condition. Thus, existing studies may be underpowered to study the association between NAFLD and cardiovascular disease in people who do not have diabetes.
The GDG also reviewed the data for whether NAFLD is a risk factor for hypertension. Evidence was identified, consistent with NAFLD in combination with a raised ALT, as being an independent risk factor for hypertension when adjusted for age, sex, waist circumference, BMI, diabetes mellitus, average daily alcohol consumption and the use of anti-hypertensive medication. Similarly, data from a retrospective cohort of more than 11,000 people showed that the development of NAFLD (or the continued presence of NAFLD) over 5 years of follow-up was associated with the development of hypertension, but that this association no longer held for people whose fatty liver resolved over the course of follow-up. The GDG agreed that the reviewed evidence was sufficient to conclude that NAFLD is a significant risk factor for the development of hypertension.
Colorectal cancer:
The GDG noted the data from a retrospective cohort of more than 5,000 people with fatty liver disease demonstrated that fatty liver disease may increase the risk of colorectal cancer in women (this was an all-female cohort, rather than evidence that the risk only exists for women). Similarly, the GDG noted evidence for NAFLD appearing to cause a small increase in colonic adenomas. The GDG concluded that the available evidence was suggestive of an association between NAFLD and colorectal cancer, but insufficient for them to conclude that NAFLD was an independent risk factor for colorectal cancer when adjusted for age, BMI, gender, smoking, hypertension, diabetes mellitus, blood pressure, fasting glucose, total cholesterol, triglycerides, HDL-cholesterol and metabolic syndrome. Nevertheless, given that this evidence was from large populations and reported the same direction of effect, the GDG felt there were sufficient grounds to make a research recommendation for further studies to investigate whether NAFLD is a risk factor for colorectal cancer.
Diabetes:
The GDG noted that all of the identified evidence for this part of the review question was consistent with NAFLD being an independent risk factor for diabetes when controlling for other possible confounders. This risk was similar for both men and women. People with NAFLD with a high NAFLD fibrosis score were at a higher risk of diabetes than those who did not have a high fibrosis score. The GDG agreed with the conclusion that NAFLD is an independent risk factor for diabetes when adjusting for combinations of age, sex, BMI, triglyceride, HDL cholesterol, systolic BP, smoking status, physical activity, alcohol intake, coexisting IFG, hypertension, dyslipidaemia, ALT, HOMA-IR, serum creatinine and family history of diabetes mellitus.
Chronic kidney disease (CKD):
The GDG noted the contradictory results from studies assessing the relationship between NAFLD and CKD, with the evidence from certain data sets consistent with NAFLD being a risk factor for CKD, whilst other data did not support this. However, the GDG also noted the higher quality of evidence of the data supporting this relationship, including lower imprecision, compared to the data suggestive of no relationship. On balance, the GDG concluded that there was sufficient evidence to conclude that NAFLD is an independent risk factor for CKD when adjusting for age,
National Institute for Health and Care Excellence 2016
NAFLD
Extra-hepatic conditions
162
sex, duration of diabetes, BMI, HbA1c, hypertension, smoking, eGFR, serum triglycerides, obesity, and HDL cholesterol.
Other extra-hepatic conditions:
No evidence was identified to support or refute whether people with NAFLD have a different risk of developing dyslipidaemia, obstructive sleep apnoea, polycystic ovarian syndrome, obesity, insulin resistance or different vitamin D levels, compared to people without NAFLD.
Trade-off between net clinical effects and costs
No relevant economic evaluations were identified.
The GDG considered the economic implications of this review. Any recommendations leading to a greater number of people being referred for additional assessment (and hence possible subsequent care) would have the potential to give rise to additional costs, but also resultant benefits to health. The GDG did not think it appropriate to recommend that any specific people should receive additional assessment or care as a result of these considerations, but instead recommended that clinicians be aware of the additional risk posed by NAFLD for the named conditions. This will then be taken into account when clinicians assess people for these conditions in line with the existing NICE recommendations for those conditions. As the existing NICE recommendations are based on cost-effectiveness evidence, the GDG are confident that any additional treatment arising as a result of such assessments would be cost-effective.
Quality of evidence For this review question, evidence was identified from cohort and case-control studies using multivariate analysis. The quality of evidence was variable, with the majority of the evidence rated as low or very low quality by GRADE criteria. Much of the downgrading was due to the serious or very serious risk of bias in the evidence due to issues around patient selection, and unclear attrition reporting. Some evidence was also at higher risk of bias due to lack of transparency for multivariable analysis strategies. However, the number of participants in included studies was often very large, and participant follow-up had often been over a long period of time. Heterogeneity was noted between studies both in the means of diagnosing NAFLD and in defining some of the outcomes measures; for example, variability in the definition of ‘cardiovascular events’ which contributed to the difficulty in evaluating studies that use different thresholds for what constitutes the occurrence of such events (with respect of analysis of dichotomous outcomes) . However, the definition of these terms in all of the included studies was felt to be sufficient to still be of clinical relevance towards decision-making.
Other considerations The GDG noted that NICE guidelines already exist for the assessment and management of extra-hepatic conditions reviewed within this question (for example, NICE guideline CG180 on atrial fibrillation, NICE guideline CG182 on chronic kidney disease and NICE guideline CG131 on colorectal cancer). As such, the GDG agreed that it was outside of its remit to recommend an assessment pathway for those in whom these extra-hepatic conditions are suspected, but that this review question should serve as a reminder to clinicians who have made a diagnosis of NAFLD to consider whether assessment for such extra-hepatic conditions may be appropriate.
The GDG noted that all of the included evidence related to adults only. However, the GDG felt that since the disease process of primary NAFLD in children and young people is thought to be the same as that in adults, there is no reason to expect that extra-hepatic conditions would be different in children and young people with NAFLD to adults with the condition and therefore the recommendation should apply

National Institute for Health and Care Excellence 2016
NAFLD
Extra-hepatic conditions
163
to all.
Research recommendation
The GDG made a research recommendation to investigate if NAFLD is a risk factor for developing colorectal cancer.
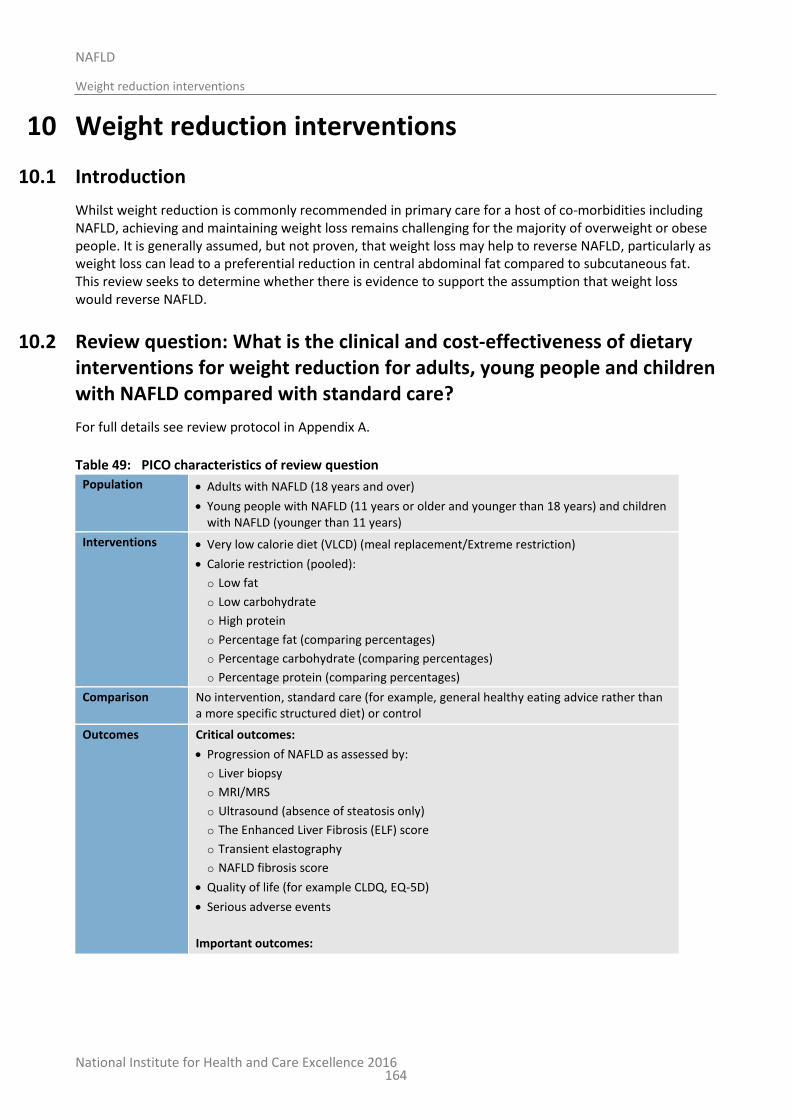
National Institute for Health and Care Excellence 2016
NAFLD
Weight reduction interventions
164
10 Weight reduction interventions
10.1 Introduction
Whilst weight reduction is commonly recommended in primary care for a host of co-morbidities including NAFLD, achieving and maintaining weight loss remains challenging for the majority of overweight or obese people. It is generally assumed, but not proven, that weight loss may help to reverse NAFLD, particularly as weight loss can lead to a preferential reduction in central abdominal fat compared to subcutaneous fat. This review seeks to determine whether there is evidence to support the assumption that weight loss would reverse NAFLD.
10.2 Review question: What is the clinical and cost-effectiveness of dietary interventions for weight reduction for adults, young people and children with NAFLD compared with standard care?
For full details see review protocol in Appendix A.
Table 49: PICO characteristics of review question
Population Adults with NAFLD (18 years and over)
Young people with NAFLD (11 years or older and younger than 18 years) and children with NAFLD (younger than 11 years)
Interventions Very low calorie diet (VLCD) (meal replacement/Extreme restriction)
Calorie restriction (pooled):
o Low fat
o Low carbohydrate
o High protein
o Percentage fat (comparing percentages)
o Percentage carbohydrate (comparing percentages)
o Percentage protein (comparing percentages)
Comparison No intervention, standard care (for example, general healthy eating advice rather than a more specific structured diet) or control
Outcomes Critical outcomes:
Progression of NAFLD as assessed by:
o Liver biopsy
o MRI/MRS
o Ultrasound (absence of steatosis only)
o The Enhanced Liver Fibrosis (ELF) score
o Transient elastography
o NAFLD fibrosis score
Quality of life (for example CLDQ, EQ-5D)
Serious adverse events
Important outcomes:
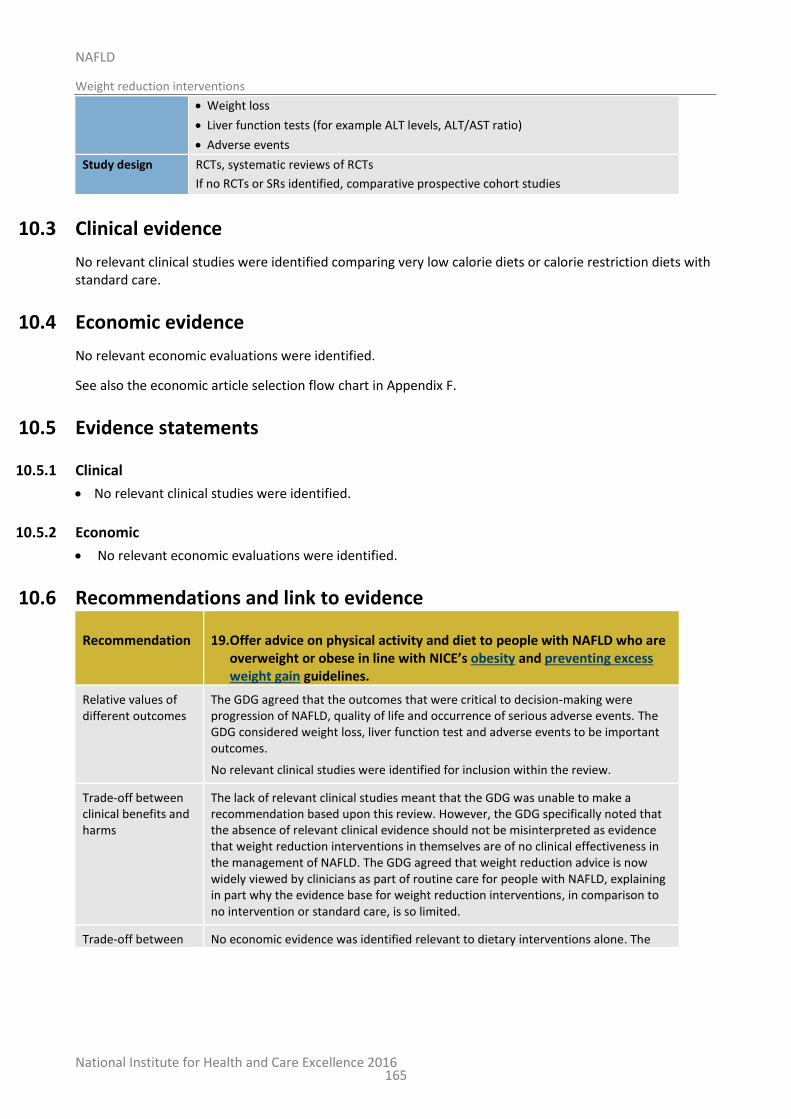
National Institute for Health and Care Excellence 2016
NAFLD
Weight reduction interventions
165
Weight loss
Liver function tests (for example ALT levels, ALT/AST ratio)
Adverse events
Study design RCTs, systematic reviews of RCTs
If no RCTs or SRs identified, comparative prospective cohort studies
10.3 Clinical evidence
No relevant clinical studies were identified comparing very low calorie diets or calorie restriction diets with standard care.
10.4 Economic evidence
No relevant economic evaluations were identified.
See also the economic article selection flow chart in Appendix F.
10.5 Evidence statements
10.5.1 Clinical
No relevant clinical studies were identified.
10.5.2 Economic
No relevant economic evaluations were identified.
10.6 Recommendations and link to evidence
Recommendation 19. Offer advice on physical activity and diet to people with NAFLD who are overweight or obese in line with NICE’s obesity and preventing excess weight gain guidelines.
Relative values of different outcomes
The GDG agreed that the outcomes that were critical to decision-making were progression of NAFLD, quality of life and occurrence of serious adverse events. The GDG considered weight loss, liver function test and adverse events to be important outcomes.
No relevant clinical studies were identified for inclusion within the review.
Trade-off between clinical benefits and harms
The lack of relevant clinical studies meant that the GDG was unable to make a recommendation based upon this review. However, the GDG specifically noted that the absence of relevant clinical evidence should not be misinterpreted as evidence that weight reduction interventions in themselves are of no clinical effectiveness in the management of NAFLD. The GDG agreed that weight reduction advice is now widely viewed by clinicians as part of routine care for people with NAFLD, explaining in part why the evidence base for weight reduction interventions, in comparison to no intervention or standard care, is so limited.
Trade-off between No economic evidence was identified relevant to dietary interventions alone. The
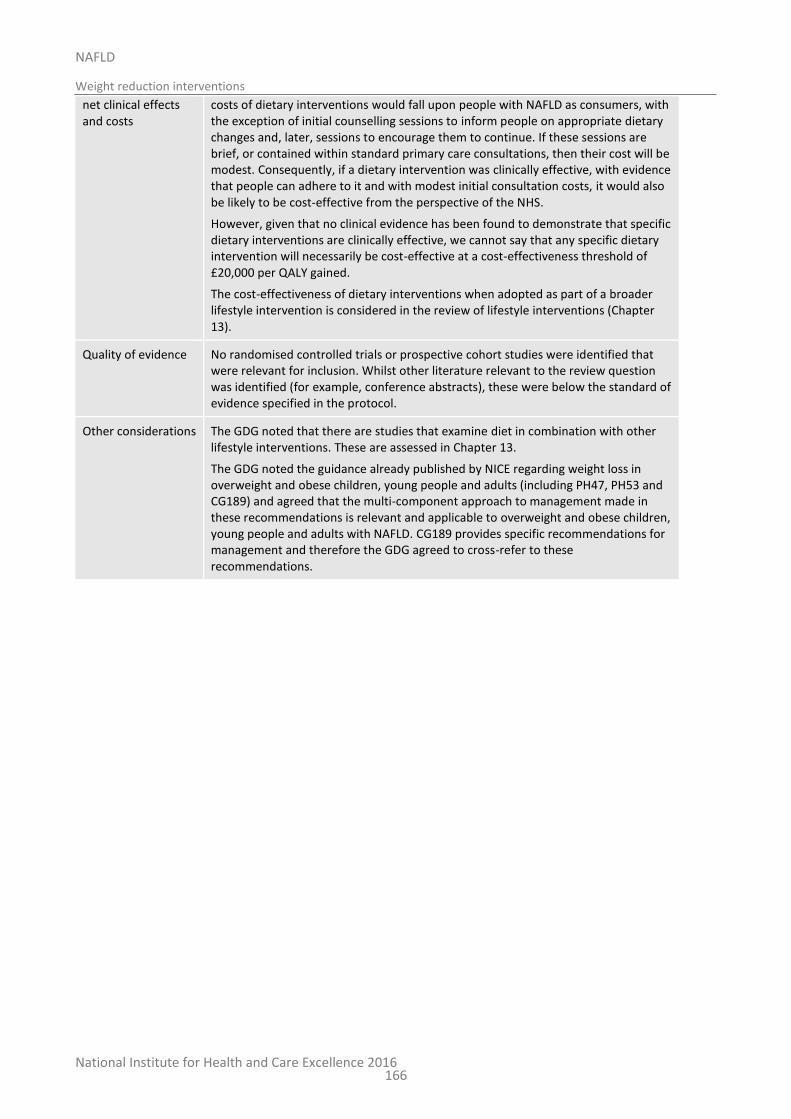
National Institute for Health and Care Excellence 2016
NAFLD
Weight reduction interventions
166
net clinical effects and costs
costs of dietary interventions would fall upon people with NAFLD as consumers, with the exception of initial counselling sessions to inform people on appropriate dietary changes and, later, sessions to encourage them to continue. If these sessions are brief, or contained within standard primary care consultations, then their cost will be modest. Consequently, if a dietary intervention was clinically effective, with evidence that people can adhere to it and with modest initial consultation costs, it would also be likely to be cost-effective from the perspective of the NHS.
However, given that no clinical evidence has been found to demonstrate that specific dietary interventions are clinically effective, we cannot say that any specific dietary intervention will necessarily be cost-effective at a cost-effectiveness threshold of £20,000 per QALY gained.
The cost-effectiveness of dietary interventions when adopted as part of a broader lifestyle intervention is considered in the review of lifestyle interventions (Chapter 13).
Quality of evidence No randomised controlled trials or prospective cohort studies were identified that were relevant for inclusion. Whilst other literature relevant to the review question was identified (for example, conference abstracts), these were below the standard of evidence specified in the protocol.
Other considerations The GDG noted that there are studies that examine diet in combination with other lifestyle interventions. These are assessed in Chapter 13.
The GDG noted the guidance already published by NICE regarding weight loss in overweight and obese children, young people and adults (including PH47, PH53 and CG189) and agreed that the multi-component approach to management made in these recommendations is relevant and applicable to overweight and obese children, young people and adults with NAFLD. CG189 provides specific recommendations for management and therefore the GDG agreed to cross-refer to these recommendations.
National Institute for Health and Care Excellence 2016
NAFLD
Dietary modification and supplements
167
11 Dietary modification and supplements
11.1 Introduction
Given both the absence of any pharmacological interventions specifically licensed at present for the treatment of NAFLD – as well as concerns about the difficulties in complying with lifestyle interventions – there is great interest in alternative therapeutic strategies for the condition. One such strategy focuses on dietary modifications or supplements, with a number of different interventions that have a robust scientific rationale for being of potential clinical benefit having now been evaluated in clinical trials. This review question sought to review the clinical and cost-effectiveness of these dietary interventions.
These interventions take a number of different forms:
Omega-3 fatty acids: Typical Western diets are associated with a significant increase in the ratio of omega-6 fatty acid consumption compared to omega-3 fatty acids. The potential consequences of this include impaired regulation of hepatic and adipose function (predisposing to hepatic fat deposition) as well as increased production of pro-inflammatory arachidonic acid-derived eicosanoids (which may predispose to steatohepatitis). Given that omega-3 fatty acid supplementation is well-recognised to improve both hypertriglyceridaemia and insulin sensitivity (as well as conveying systemic anti-inflammatory effects), it has been proposed that omega-3 fatty acid supplementation may slow down or even reverse hepatic steatosis and steatohepatitis.
Probiotics and prebiotics: People with NAFLD appear to have an alteration in the composition of their gut microbiota and increased intestinal permeability in comparison to healthy people without the condition. Whether this acts as a cause of NAFLD, consequence or is purely incidental remains unclear; however, there is increasing evidence for interaction between the gut microbiota and the host metabolism, as well as recognition that a consequence of intestinal permeability may be increased exposure of the liver to potentially pro-inflammatory gut-derived microbial products. Together, this suggests that the gut-liver axis may directly influence the onset and progression of NAFLD. By extension, it has been proposed that modulation of the gut microbiota (by means including probiotics (defined as live micro-organisms that are proposed to convey a health benefit to the host when ingested) or prebiotics (non-digestible food components that promote the growth or activity of micro-organisms within the gut that may convey a health benefit to the host) may slow down or reverse hepatic fat deposition and steatohepatitis.
Other dietary modifications that may also influence the onset and progression of NAFLD (including caffeine, alcohol and fructose) are evaluated in separate review questions within this guideline.
11.2 Review question: What is the clinical and cost-effectiveness of dietary modifications or supplements for adults, young people and children with NAFLD compared with standard care?
For full details see review protocol in Appendix A.
Table 50: PICO characteristics of review question
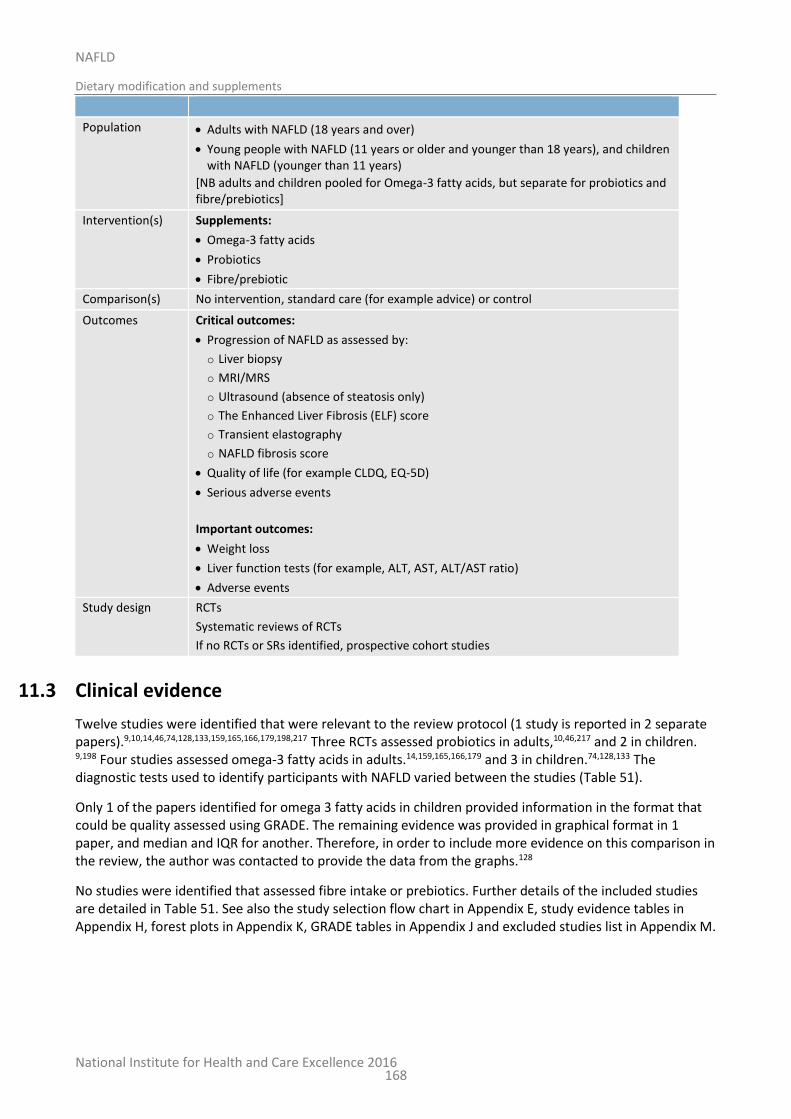
National Institute for Health and Care Excellence 2016
NAFLD
Dietary modification and supplements
168
Population Adults with NAFLD (18 years and over)
Young people with NAFLD (11 years or older and younger than 18 years), and children with NAFLD (younger than 11 years)
[NB adults and children pooled for Omega-3 fatty acids, but separate for probiotics and fibre/prebiotics]
Intervention(s) Supplements:
Omega-3 fatty acids
Probiotics
Fibre/prebiotic
Comparison(s) No intervention, standard care (for example advice) or control
Outcomes Critical outcomes:
Progression of NAFLD as assessed by:
o Liver biopsy
o MRI/MRS
o Ultrasound (absence of steatosis only)
o The Enhanced Liver Fibrosis (ELF) score
o Transient elastography
o NAFLD fibrosis score
Quality of life (for example CLDQ, EQ-5D)
Serious adverse events
Important outcomes:
Weight loss
Liver function tests (for example, ALT, AST, ALT/AST ratio)
Adverse events
Study design RCTs
Systematic reviews of RCTs
If no RCTs or SRs identified, prospective cohort studies
11.3 Clinical evidence
Twelve studies were identified that were relevant to the review protocol (1 study is reported in 2 separate papers).9,10,14,46,74,128,133,159,165,166,179,198,217 Three RCTs assessed probiotics in adults,10,46,217 and 2 in children. 9,198 Four studies assessed omega-3 fatty acids in adults.14,159,165,166,179 and 3 in children.74,128,133 The diagnostic tests used to identify participants with NAFLD varied between the studies (Table 51).
Only 1 of the papers identified for omega 3 fatty acids in children provided information in the format that could be quality assessed using GRADE. The remaining evidence was provided in graphical format in 1 paper, and median and IQR for another. Therefore, in order to include more evidence on this comparison in the review, the author was contacted to provide the data from the graphs.128
No studies were identified that assessed fibre intake or prebiotics. Further details of the included studies are detailed in Table 51. See also the study selection flow chart in Appendix E, study evidence tables in Appendix H, forest plots in Appendix K, GRADE tables in Appendix J and excluded studies list in Appendix M.
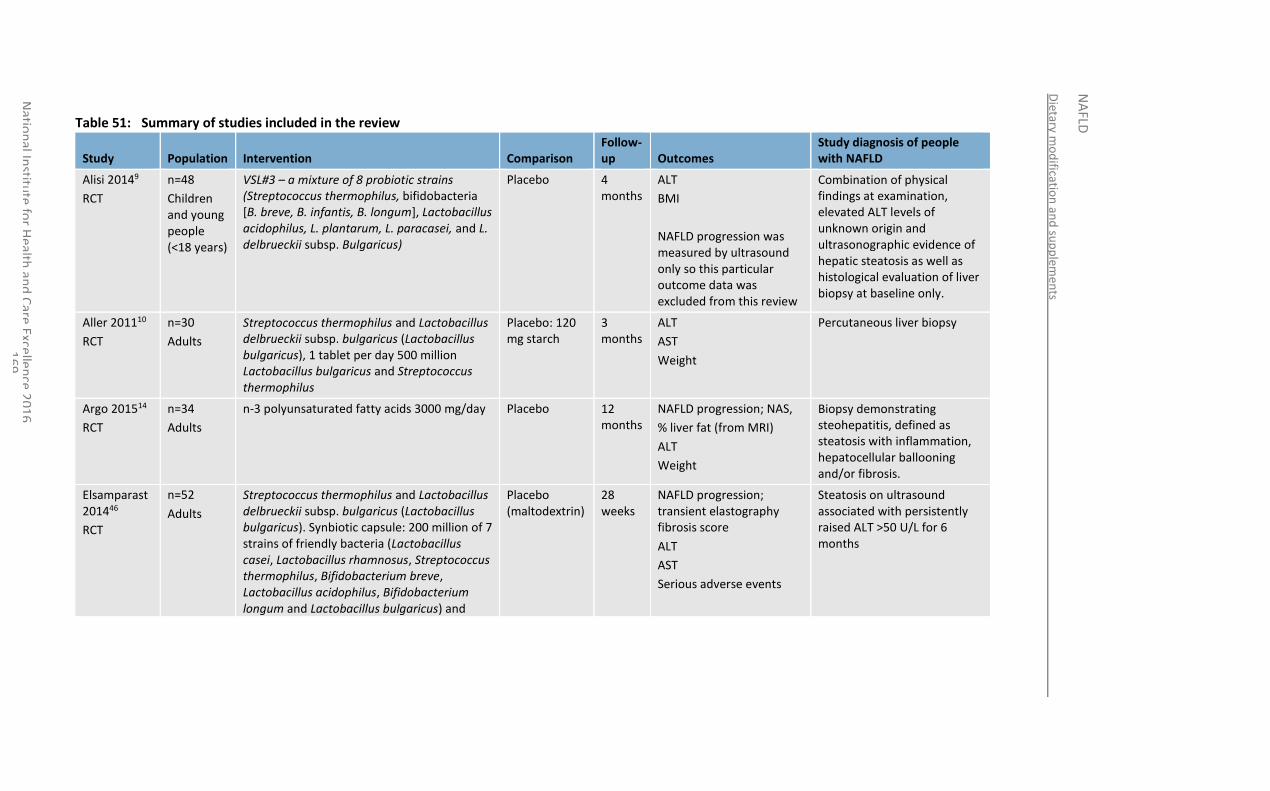
Dietary m
od
ification
and
sup
plem
ents
NA
FLD
Natio
nal In
stitute
for H
ealth an
d C
are Excellen
ce 20
16
1
69
Table 51: Summary of studies included in the review
Study Population Intervention Comparison Follow-up Outcomes
Study diagnosis of people with NAFLD
Alisi 20149
RCT
n=48
Children and young people (<18 years)
VSL#3 – a mixture of 8 probiotic strains (Streptococcus thermophilus, bifidobacteria [B. breve, B. infantis, B. longum], Lactobacillus acidophilus, L. plantarum, L. paracasei, and L. delbrueckii subsp. Bulgaricus)
Placebo 4 months
ALT
BMI
NAFLD progression was measured by ultrasound only so this particular outcome data was excluded from this review
Combination of physical findings at examination, elevated ALT levels of unknown origin and ultrasonographic evidence of hepatic steatosis as well as histological evaluation of liver biopsy at baseline only.
Aller 201110
RCT
n=30
Adults
Streptococcus thermophilus and Lactobacillus delbrueckii subsp. bulgaricus (Lactobacillus bulgaricus), 1 tablet per day 500 million Lactobacillus bulgaricus and Streptococcus thermophilus
Placebo: 120 mg starch
3 months
ALT
AST
Weight
Percutaneous liver biopsy
Argo 201514
RCT
n=34
Adults
n-3 polyunsaturated fatty acids 3000 mg/day Placebo 12 months
NAFLD progression; NAS,
% liver fat (from MRI)
ALT
Weight
Biopsy demonstrating steohepatitis, defined as steatosis with inflammation, hepatocellular ballooning and/or fibrosis.
Elsamparast 201446
RCT
n=52
Adults
Streptococcus thermophilus and Lactobacillus delbrueckii subsp. bulgaricus (Lactobacillus bulgaricus). Synbiotic capsule: 200 million of 7 strains of friendly bacteria (Lactobacillus casei, Lactobacillus rhamnosus, Streptococcus thermophilus, Bifidobacterium breve, Lactobacillus acidophilus, Bifidobacterium longum and Lactobacillus bulgaricus) and
Placebo (maltodextrin)
28 weeks
NAFLD progression; transient elastography fibrosis score
ALT
AST
Serious adverse events
Steatosis on ultrasound associated with persistently raised ALT >50 U/L for 6 months
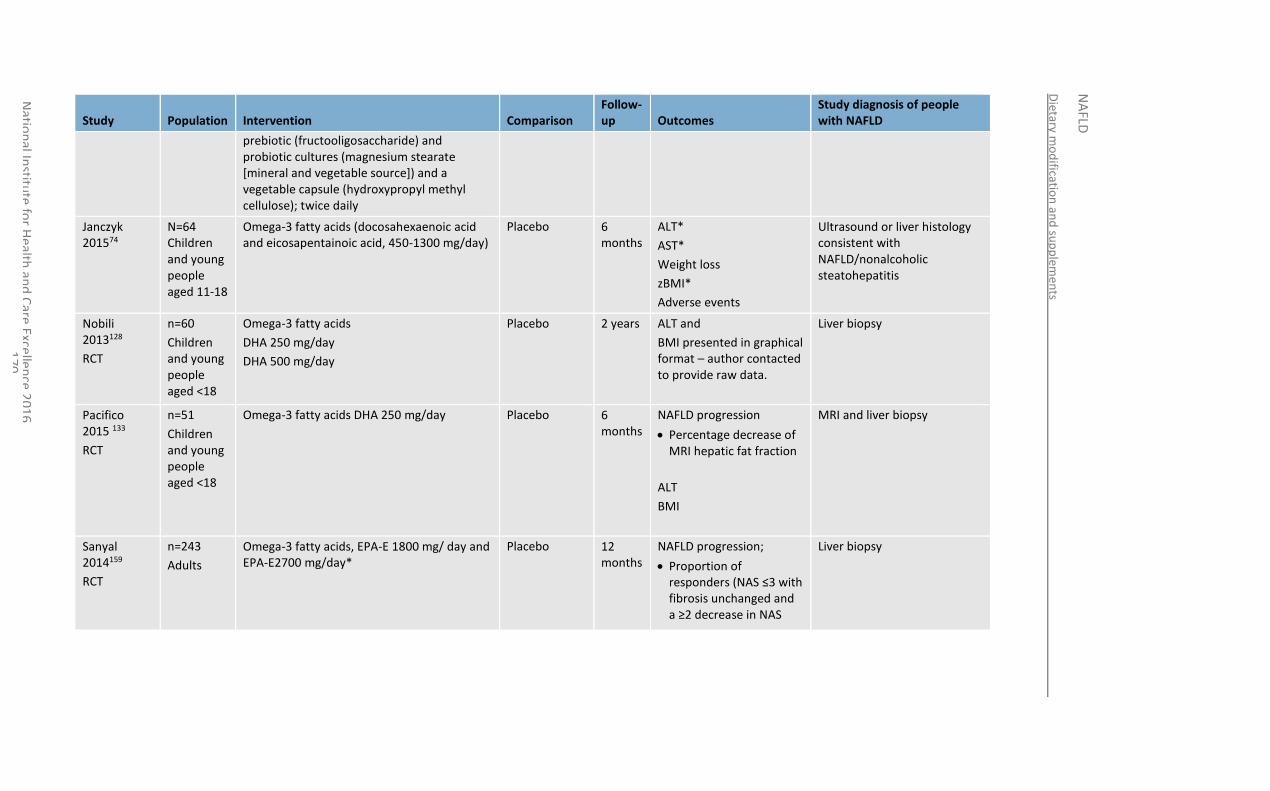
Dietary m
od
ification
and
sup
plem
ents
NA
FLD
Natio
nal In
stitute
for H
ealth an
d C
are Excellen
ce 20
16
1
70
Study Population Intervention Comparison Follow-up Outcomes
Study diagnosis of people with NAFLD
prebiotic (fructooligosaccharide) and probiotic cultures (magnesium stearate [mineral and vegetable source]) and a vegetable capsule (hydroxypropyl methyl cellulose); twice daily
Janczyk 201574
N=64 Children and young people aged 11-18
Omega-3 fatty acids (docosahexaenoic acid and eicosapentainoic acid, 450-1300 mg/day)
Placebo 6 months
ALT*
AST*
Weight loss
zBMI*
Adverse events
Ultrasound or liver histology consistent with NAFLD/nonalcoholic steatohepatitis
Nobili 2013128
RCT
n=60
Children and young people aged <18
Omega-3 fatty acids
DHA 250 mg/day
DHA 500 mg/day
Placebo 2 years ALT and
BMI presented in graphical format – author contacted to provide raw data.
Liver biopsy
Pacifico 2015 133
RCT
n=51
Children and young people aged <18
Omega-3 fatty acids DHA 250 mg/day
Placebo 6 months
NAFLD progression
Percentage decrease of MRI hepatic fat fraction
ALT
BMI
MRI and liver biopsy
Sanyal 2014159
RCT
n=243
Adults
Omega-3 fatty acids, EPA-E 1800 mg/ day and EPA-E2700 mg/day*
Placebo 12 months
NAFLD progression;
Proportion of responders (NAS ≤3 with fibrosis unchanged and a ≥2 decrease in NAS
Liver biopsy
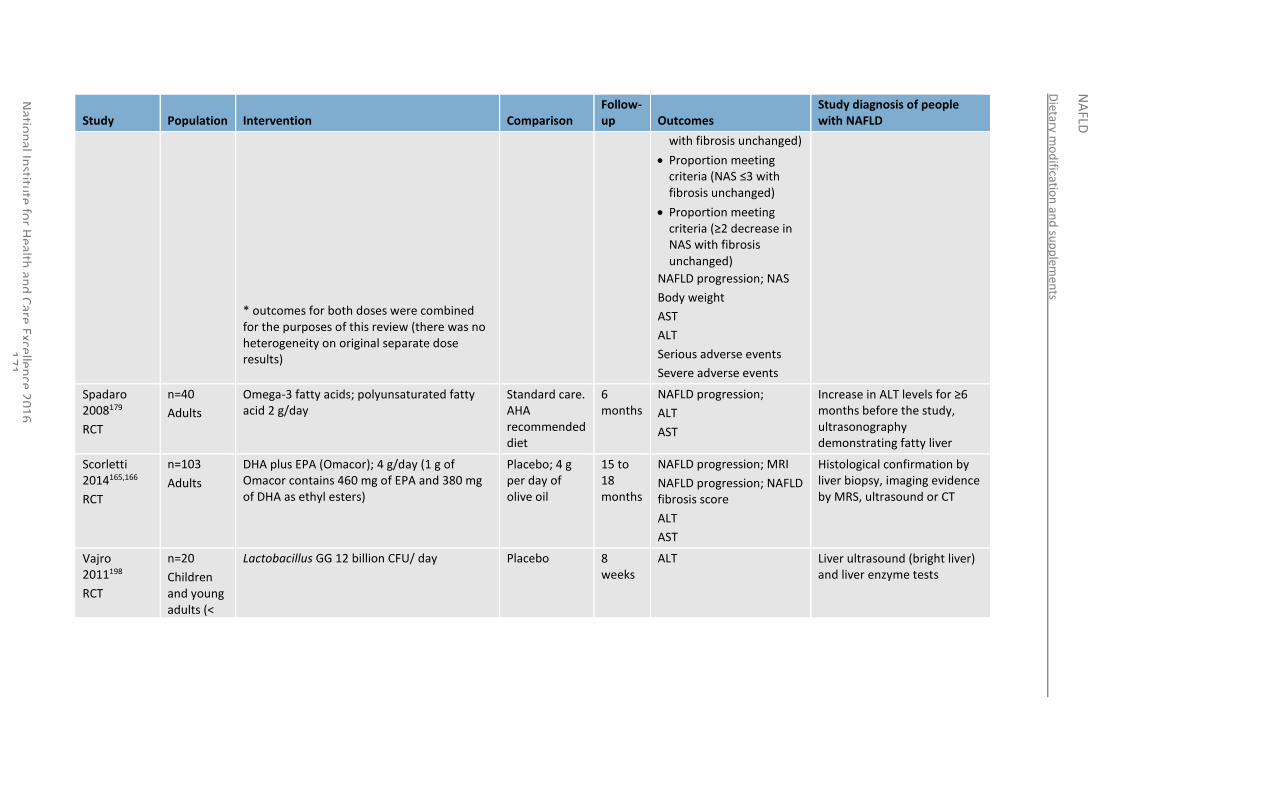
Dietary m
od
ification
and
sup
plem
ents
NA
FLD
Natio
nal In
stitute
for H
ealth an
d C
are Excellen
ce 20
16
1
71
Study Population Intervention Comparison Follow-up Outcomes
Study diagnosis of people with NAFLD
* outcomes for both doses were combined for the purposes of this review (there was no heterogeneity on original separate dose results)
with fibrosis unchanged)
Proportion meeting criteria (NAS ≤3 with fibrosis unchanged)
Proportion meeting criteria (≥2 decrease in NAS with fibrosis unchanged)
NAFLD progression; NAS
Body weight
AST
ALT
Serious adverse events
Severe adverse events
Spadaro 2008179
RCT
n=40
Adults
Omega-3 fatty acids; polyunsaturated fatty acid 2 g/day
Standard care. AHA recommended diet
6 months
NAFLD progression;
ALT
AST
Increase in ALT levels for ≥6 months before the study, ultrasonography demonstrating fatty liver
Scorletti 2014165,166
RCT
n=103
Adults
DHA plus EPA (Omacor); 4 g/day (1 g of Omacor contains 460 mg of EPA and 380 mg of DHA as ethyl esters)
Placebo; 4 g per day of olive oil
15 to 18 months
NAFLD progression; MRI
NAFLD progression; NAFLD fibrosis score
ALT
AST
Histological confirmation by liver biopsy, imaging evidence by MRS, ultrasound or CT
Vajro 2011198
RCT
n=20
Children and young adults (<
Lactobacillus GG 12 billion CFU/ day Placebo 8 weeks
ALT Liver ultrasound (bright liver) and liver enzyme tests
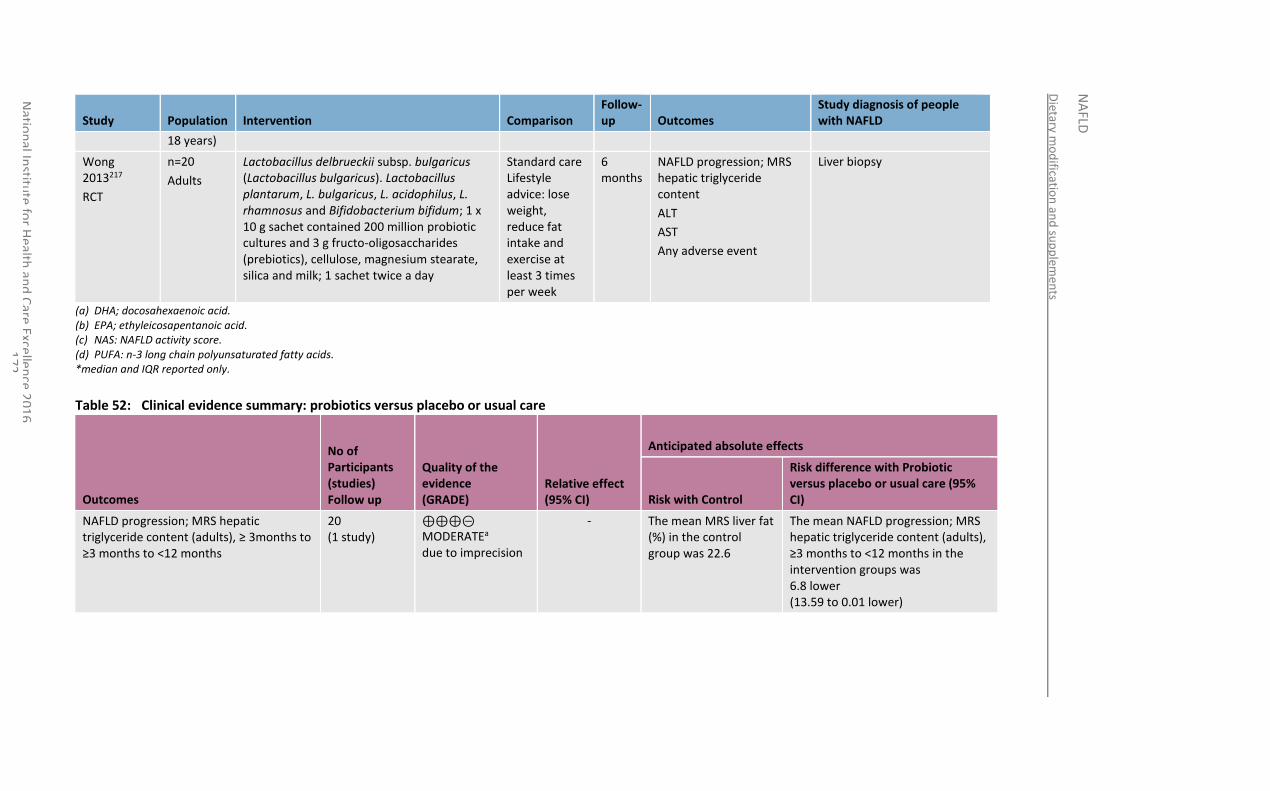
Dietary m
od
ification
and
sup
plem
ents
NA
FLD
Natio
nal In
stitute
for H
ealth an
d C
are Excellen
ce 20
16
1
72
Study Population Intervention Comparison Follow-up Outcomes
Study diagnosis of people with NAFLD
18 years)
Wong 2013217
RCT
n=20
Adults
Lactobacillus delbrueckii subsp. bulgaricus (Lactobacillus bulgaricus). Lactobacillus plantarum, L. bulgaricus, L. acidophilus, L. rhamnosus and Bifidobacterium bifidum; 1 x 10 g sachet contained 200 million probiotic cultures and 3 g fructo-oligosaccharides (prebiotics), cellulose, magnesium stearate, silica and milk; 1 sachet twice a day
Standard care Lifestyle advice: lose weight, reduce fat intake and exercise at least 3 times per week
6 months
NAFLD progression; MRS hepatic triglyceride content
ALT
AST
Any adverse event
Liver biopsy
(a) DHA; docosahexaenoic acid. (b) EPA; ethyleicosapentanoic acid. (c) NAS: NAFLD activity score. (d) PUFA: n-3 long chain polyunsaturated fatty acids. *median and IQR reported only.
Table 52: Clinical evidence summary: probiotics versus placebo or usual care
Outcomes
No of Participants (studies) Follow up
Quality of the evidence (GRADE)
Relative effect (95% CI)
Anticipated absolute effects
Risk with Control
Risk difference with Probiotic versus placebo or usual care (95% CI)
NAFLD progression; MRS hepatic triglyceride content (adults), ≥ 3months to ≥3 months to <12 months
20 (1 study)
⊕⊕⊕⊝ MODERATEa due to imprecision
- The mean MRS liver fat (%) in the control group was 22.6
The mean NAFLD progression; MRS hepatic triglyceride content (adults), ≥3 months to <12 months in the intervention groups was 6.8 lower (13.59 to 0.01 lower)
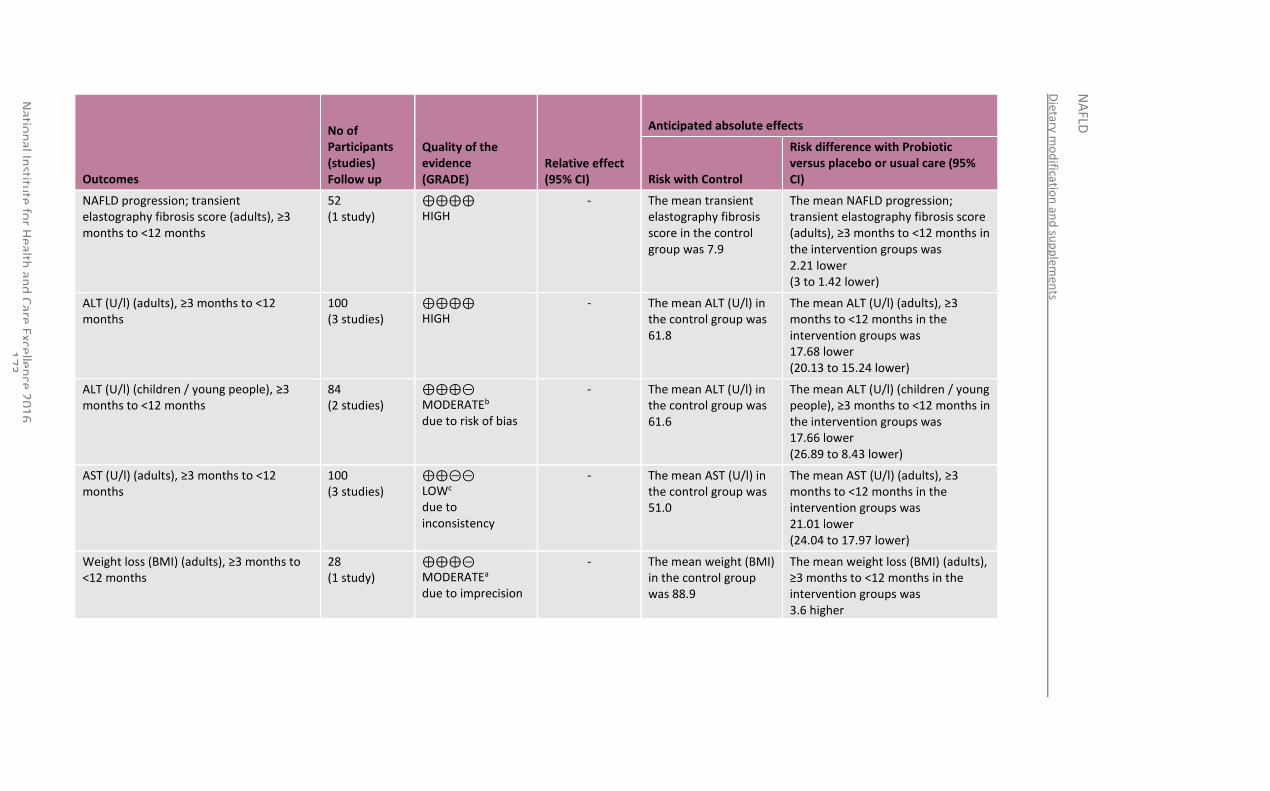
Dietary m
od
ification
and
sup
plem
ents
NA
FLD
Natio
nal In
stitute
for H
ealth an
d C
are Excellen
ce 20
16
1
73
Outcomes
No of Participants (studies) Follow up
Quality of the evidence (GRADE)
Relative effect (95% CI)
Anticipated absolute effects
Risk with Control
Risk difference with Probiotic versus placebo or usual care (95% CI)
NAFLD progression; transient elastography fibrosis score (adults), ≥3 months to <12 months
52 (1 study)
⊕⊕⊕⊕ HIGH
- The mean transient elastography fibrosis score in the control group was 7.9
The mean NAFLD progression; transient elastography fibrosis score (adults), ≥3 months to <12 months in the intervention groups was 2.21 lower (3 to 1.42 lower)
ALT (U/l) (adults), ≥3 months to <12 months
100 (3 studies)
⊕⊕⊕⊕ HIGH
- The mean ALT (U/l) in the control group was 61.8
The mean ALT (U/l) (adults), ≥3 months to <12 months in the intervention groups was 17.68 lower (20.13 to 15.24 lower)
ALT (U/l) (children / young people), ≥3 months to <12 months
84 (2 studies)
⊕⊕⊕⊝ MODERATEb due to risk of bias
- The mean ALT (U/l) in the control group was 61.6
The mean ALT (U/l) (children / young people), ≥3 months to <12 months in the intervention groups was 17.66 lower (26.89 to 8.43 lower)
AST (U/l) (adults), ≥3 months to <12 months
100 (3 studies)
⊕⊕⊝⊝ LOWc due to inconsistency
- The mean AST (U/l) in the control group was 51.0
The mean AST (U/l) (adults), ≥3 months to <12 months in the intervention groups was 21.01 lower (24.04 to 17.97 lower)
Weight loss (BMI) (adults), ≥3 months to <12 months
28 (1 study)
⊕⊕⊕⊝ MODERATEa due to imprecision
- The mean weight (BMI) in the control group was 88.9
The mean weight loss (BMI) (adults), ≥3 months to <12 months in the intervention groups was 3.6 higher
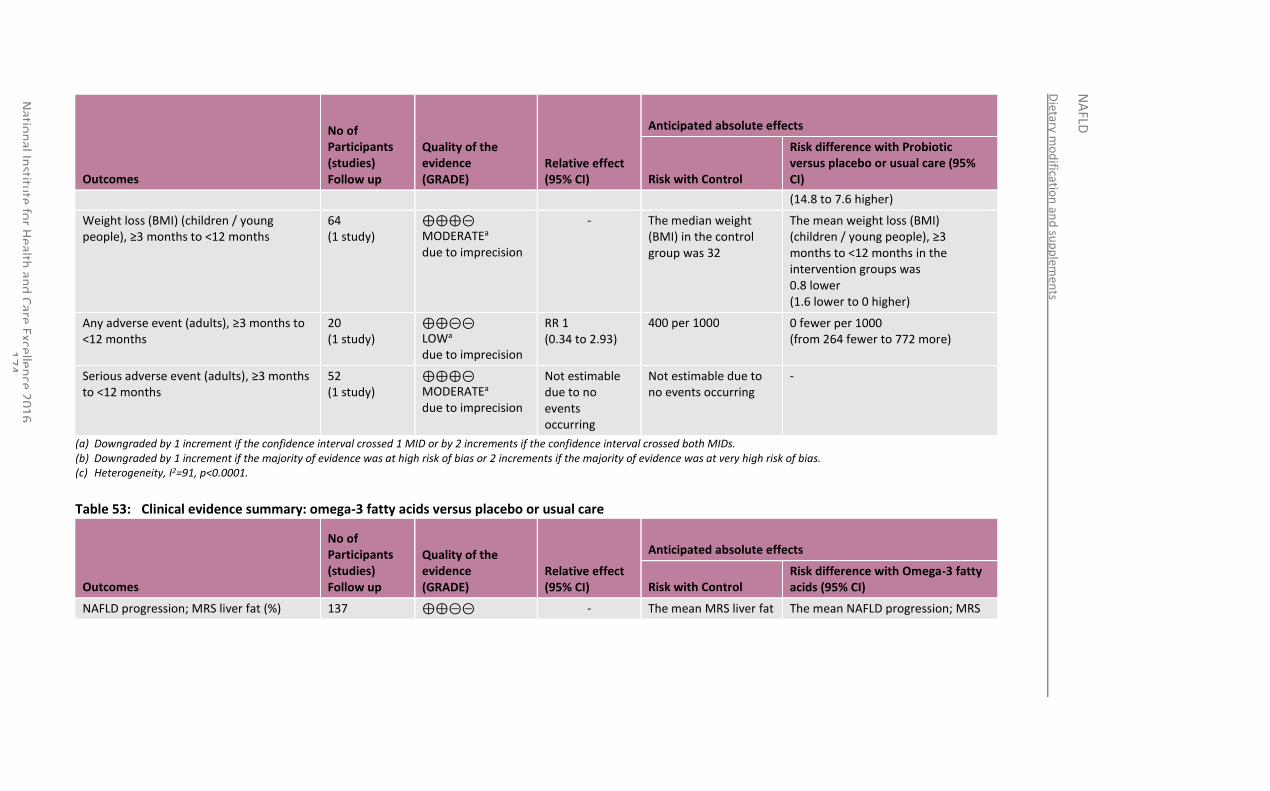
Dietary m
od
ification
and
sup
plem
ents
NA
FLD
Natio
nal In
stitute
for H
ealth an
d C
are Excellen
ce 20
16
1
74
Outcomes
No of Participants (studies) Follow up
Quality of the evidence (GRADE)
Relative effect (95% CI)
Anticipated absolute effects
Risk with Control
Risk difference with Probiotic versus placebo or usual care (95% CI)
(14.8 to 7.6 higher)
Weight loss (BMI) (children / young people), ≥3 months to <12 months
64 (1 study)
⊕⊕⊕⊝ MODERATEa due to imprecision
- The median weight (BMI) in the control group was 32
The mean weight loss (BMI) (children / young people), ≥3 months to <12 months in the intervention groups was 0.8 lower (1.6 lower to 0 higher)
Any adverse event (adults), ≥3 months to <12 months
20 (1 study)
⊕⊕⊝⊝ LOWa due to imprecision
RR 1 (0.34 to 2.93)
400 per 1000 0 fewer per 1000 (from 264 fewer to 772 more)
Serious adverse event (adults), ≥3 months to <12 months
52 (1 study)
⊕⊕⊕⊝ MODERATEa due to imprecision
Not estimable due to no events occurring
Not estimable due to no events occurring
-
(a) Downgraded by 1 increment if the confidence interval crossed 1 MID or by 2 increments if the confidence interval crossed both MIDs. (b) Downgraded by 1 increment if the majority of evidence was at high risk of bias or 2 increments if the majority of evidence was at very high risk of bias. (c) Heterogeneity, I2=91, p<0.0001.
Table 53: Clinical evidence summary: omega-3 fatty acids versus placebo or usual care
Outcomes
No of Participants (studies) Follow up
Quality of the evidence (GRADE)
Relative effect (95% CI)
Anticipated absolute effects
Risk with Control Risk difference with Omega-3 fatty acids (95% CI)
NAFLD progression; MRS liver fat (%) 137 ⊕⊕⊝⊝ - The mean MRS liver fat The mean NAFLD progression; MRS
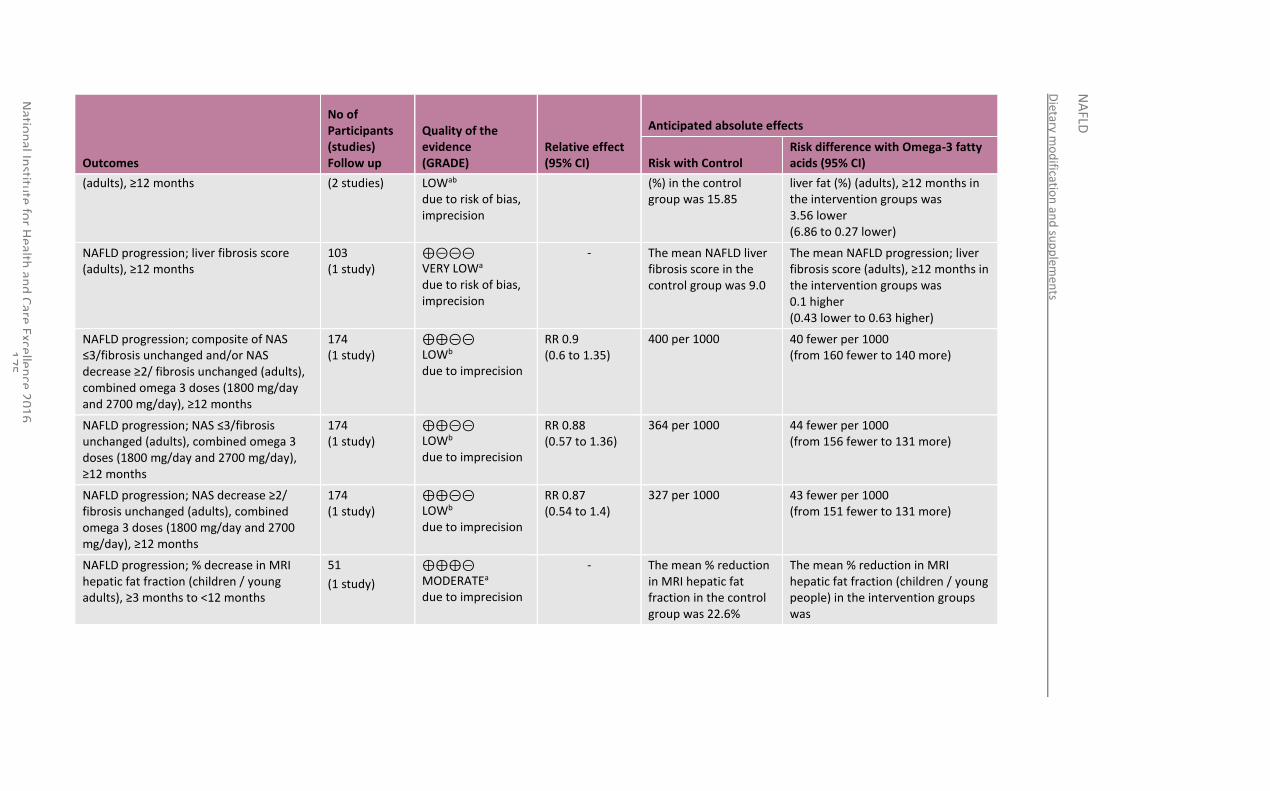
Dietary m
od
ification
and
sup
plem
ents
NA
FLD
Natio
nal In
stitute
for H
ealth an
d C
are Excellen
ce 20
16
1
75
Outcomes
No of Participants (studies) Follow up
Quality of the evidence (GRADE)
Relative effect (95% CI)
Anticipated absolute effects
Risk with Control Risk difference with Omega-3 fatty acids (95% CI)
(adults), ≥12 months
(2 studies) LOWab due to risk of bias, imprecision
(%) in the control group was 15.85
liver fat (%) (adults), ≥12 months in the intervention groups was 3.56 lower (6.86 to 0.27 lower)
NAFLD progression; liver fibrosis score (adults), ≥12 months
103 (1 study)
⊕⊝⊝⊝ VERY LOWa due to risk of bias, imprecision
- The mean NAFLD liver fibrosis score in the control group was 9.0
The mean NAFLD progression; liver fibrosis score (adults), ≥12 months in the intervention groups was 0.1 higher (0.43 lower to 0.63 higher)
NAFLD progression; composite of NAS ≤3/fibrosis unchanged and/or NAS decrease ≥2/ fibrosis unchanged (adults), combined omega 3 doses (1800 mg/day and 2700 mg/day), ≥12 months
174 (1 study)
⊕⊕⊝⊝ LOWb due to imprecision
RR 0.9 (0.6 to 1.35)
400 per 1000 40 fewer per 1000 (from 160 fewer to 140 more)
NAFLD progression; NAS ≤3/fibrosis unchanged (adults), combined omega 3 doses (1800 mg/day and 2700 mg/day), ≥12 months
174 (1 study)
⊕⊕⊝⊝ LOWb due to imprecision
RR 0.88 (0.57 to 1.36)
364 per 1000 44 fewer per 1000 (from 156 fewer to 131 more)
NAFLD progression; NAS decrease ≥2/ fibrosis unchanged (adults), combined omega 3 doses (1800 mg/day and 2700 mg/day), ≥12 months
174 (1 study)
⊕⊕⊝⊝ LOWb due to imprecision
RR 0.87 (0.54 to 1.4)
327 per 1000 43 fewer per 1000 (from 151 fewer to 131 more)
NAFLD progression; % decrease in MRI hepatic fat fraction (children / young adults), ≥3 months to <12 months
51
(1 study)
⊕⊕⊕⊝ MODERATEa due to imprecision
- The mean % reduction in MRI hepatic fat fraction in the control group was 22.6%
The mean % reduction in MRI hepatic fat fraction (children / young people) in the intervention groups was
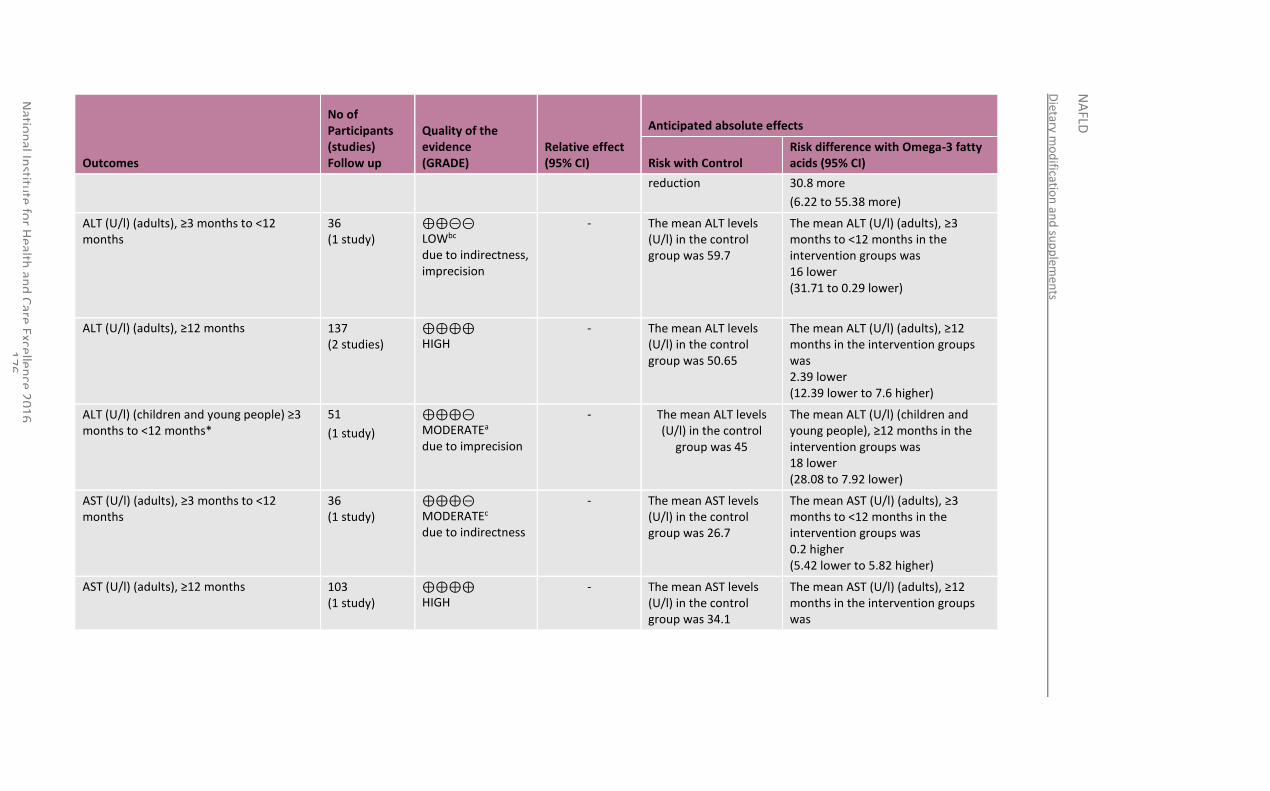
Dietary m
od
ification
and
sup
plem
ents
NA
FLD
Natio
nal In
stitute
for H
ealth an
d C
are Excellen
ce 20
16
1
76
Outcomes
No of Participants (studies) Follow up
Quality of the evidence (GRADE)
Relative effect (95% CI)
Anticipated absolute effects
Risk with Control Risk difference with Omega-3 fatty acids (95% CI)
reduction 30.8 more
(6.22 to 55.38 more)
ALT (U/l) (adults), ≥3 months to <12 months
36 (1 study)
⊕⊕⊝⊝ LOWbc due to indirectness, imprecision
- The mean ALT levels (U/l) in the control group was 59.7
The mean ALT (U/l) (adults), ≥3 months to <12 months in the intervention groups was 16 lower (31.71 to 0.29 lower)
ALT (U/l) (adults), ≥12 months 137 (2 studies)
⊕⊕⊕⊕ HIGH
- The mean ALT levels (U/l) in the control group was 50.65
The mean ALT (U/l) (adults), ≥12 months in the intervention groups was 2.39 lower (12.39 lower to 7.6 higher)
ALT (U/l) (children and young people) ≥3 months to <12 months*
51
(1 study)
⊕⊕⊕⊝ MODERATEa due to imprecision
- The mean ALT levels (U/l) in the control
group was 45
The mean ALT (U/l) (children and young people), ≥12 months in the intervention groups was 18 lower (28.08 to 7.92 lower)
AST (U/l) (adults), ≥3 months to <12 months
36 (1 study)
⊕⊕⊕⊝ MODERATEc due to indirectness
- The mean AST levels (U/l) in the control group was 26.7
The mean AST (U/l) (adults), ≥3 months to <12 months in the intervention groups was 0.2 higher (5.42 lower to 5.82 higher)
AST (U/l) (adults), ≥12 months 103 (1 study)
⊕⊕⊕⊕ HIGH
- The mean AST levels (U/l) in the control group was 34.1
The mean AST (U/l) (adults), ≥12 months in the intervention groups was
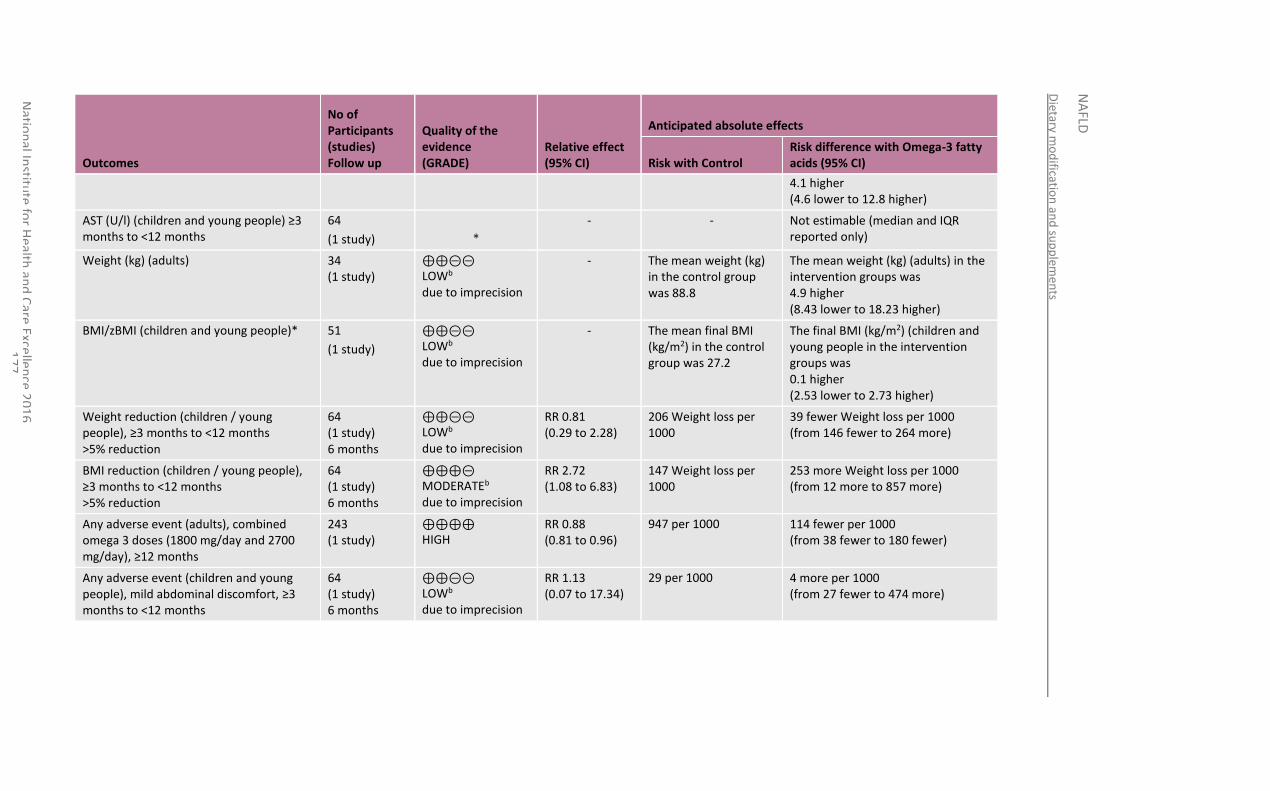
Dietary m
od
ification
and
sup
plem
ents
NA
FLD
Natio
nal In
stitute
for H
ealth an
d C
are Excellen
ce 20
16
1
77
Outcomes
No of Participants (studies) Follow up
Quality of the evidence (GRADE)
Relative effect (95% CI)
Anticipated absolute effects
Risk with Control Risk difference with Omega-3 fatty acids (95% CI)
4.1 higher (4.6 lower to 12.8 higher)
AST (U/l) (children and young people) ≥3 months to <12 months
64
(1 study)
*
- - Not estimable (median and IQR reported only)
Weight (kg) (adults) 34 (1 study)
⊕⊕⊝⊝ LOWb due to imprecision
- The mean weight (kg) in the control group was 88.8
The mean weight (kg) (adults) in the intervention groups was 4.9 higher (8.43 lower to 18.23 higher)
BMI/zBMI (children and young people)* 51
(1 study)
⊕⊕⊝⊝ LOWb due to imprecision
- The mean final BMI (kg/m2) in the control group was 27.2
The final BMI (kg/m2) (children and young people in the intervention groups was 0.1 higher (2.53 lower to 2.73 higher)
Weight reduction (children / young people), ≥3 months to <12 months >5% reduction
64 (1 study) 6 months
⊕⊕⊝⊝ LOWb due to imprecision
RR 0.81 (0.29 to 2.28)
206 Weight loss per 1000
39 fewer Weight loss per 1000 (from 146 fewer to 264 more)
BMI reduction (children / young people), ≥3 months to <12 months >5% reduction
64 (1 study) 6 months
⊕⊕⊕⊝ MODERATEb due to imprecision
RR 2.72 (1.08 to 6.83)
147 Weight loss per 1000
253 more Weight loss per 1000 (from 12 more to 857 more)
Any adverse event (adults), combined omega 3 doses (1800 mg/day and 2700 mg/day), ≥12 months
243 (1 study)
⊕⊕⊕⊕ HIGH
RR 0.88 (0.81 to 0.96)
947 per 1000 114 fewer per 1000 (from 38 fewer to 180 fewer)
Any adverse event (children and young people), mild abdominal discomfort, ≥3 months to <12 months
64 (1 study) 6 months
⊕⊕⊝⊝ LOWb due to imprecision
RR 1.13 (0.07 to 17.34)
29 per 1000 4 more per 1000 (from 27 fewer to 474 more)
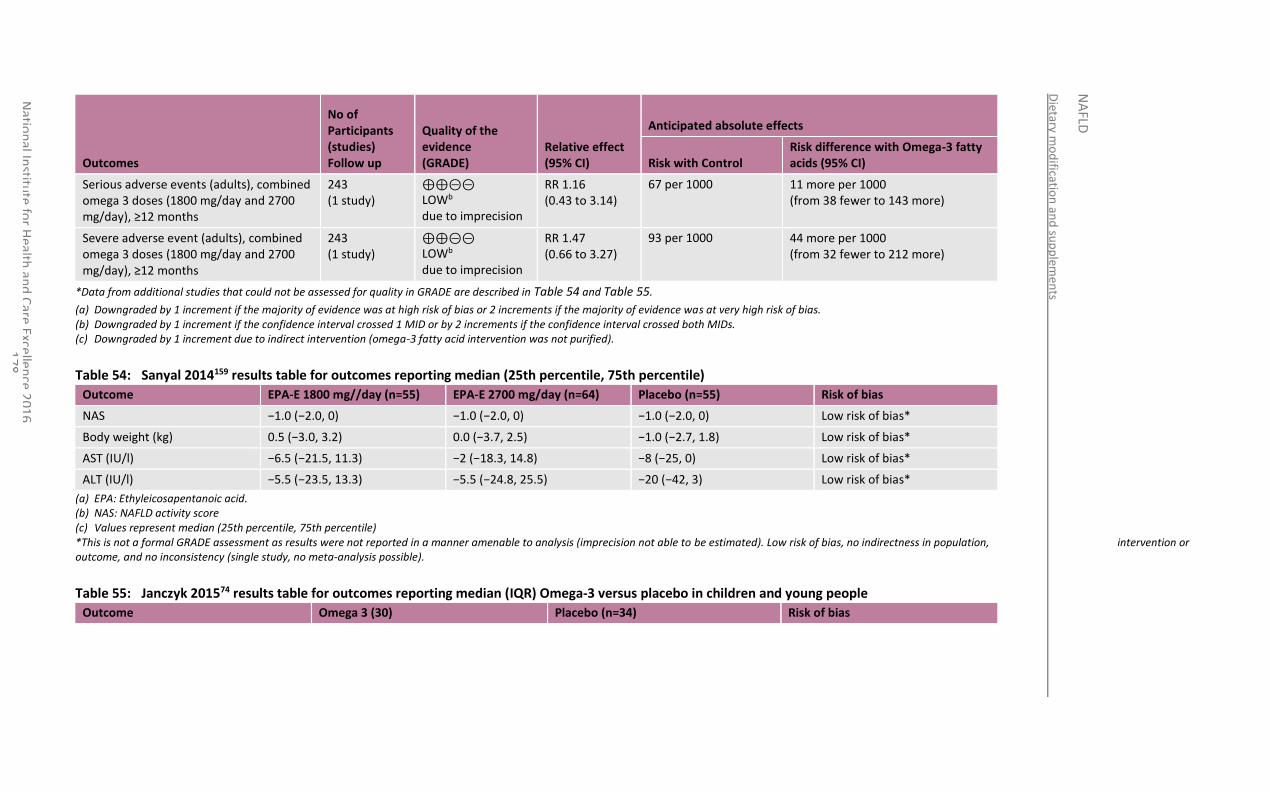
Dietary m
od
ification
and
sup
plem
ents
NA
FLD
Natio
nal In
stitute
for H
ealth an
d C
are Excellen
ce 20
16
1
78
Outcomes
No of Participants (studies) Follow up
Quality of the evidence (GRADE)
Relative effect (95% CI)
Anticipated absolute effects
Risk with Control Risk difference with Omega-3 fatty acids (95% CI)
Serious adverse events (adults), combined omega 3 doses (1800 mg/day and 2700 mg/day), ≥12 months
243 (1 study)
⊕⊕⊝⊝ LOWb due to imprecision
RR 1.16 (0.43 to 3.14)
67 per 1000 11 more per 1000 (from 38 fewer to 143 more)
Severe adverse event (adults), combined omega 3 doses (1800 mg/day and 2700 mg/day), ≥12 months
243 (1 study)
⊕⊕⊝⊝ LOWb due to imprecision
RR 1.47 (0.66 to 3.27)
93 per 1000 44 more per 1000 (from 32 fewer to 212 more)
*Data from additional studies that could not be assessed for quality in GRADE are described in Table 54 and Table 55.
(a) Downgraded by 1 increment if the majority of evidence was at high risk of bias or 2 increments if the majority of evidence was at very high risk of bias. (b) Downgraded by 1 increment if the confidence interval crossed 1 MID or by 2 increments if the confidence interval crossed both MIDs. (c) Downgraded by 1 increment due to indirect intervention (omega-3 fatty acid intervention was not purified).
Table 54: Sanyal 2014159 results table for outcomes reporting median (25th percentile, 75th percentile)
Outcome EPA-E 1800 mg//day (n=55) EPA-E 2700 mg/day (n=64) Placebo (n=55) Risk of bias
NAS −1.0 (−2.0, 0) −1.0 (−2.0, 0) −1.0 (−2.0, 0) Low risk of bias*
Body weight (kg) 0.5 (−3.0, 3.2) 0.0 (−3.7, 2.5) −1.0 (−2.7, 1.8) Low risk of bias*
AST (IU/l) −6.5 (−21.5, 11.3) −2 (−18.3, 14.8) −8 (−25, 0) Low risk of bias*
ALT (IU/l) −5.5 (−23.5, 13.3) −5.5 (−24.8, 25.5) −20 (−42, 3) Low risk of bias*
(a) EPA: Ethyleicosapentanoic acid. (b) NAS: NAFLD activity score (c) Values represent median (25th percentile, 75th percentile) *This is not a formal GRADE assessment as results were not reported in a manner amenable to analysis (imprecision not able to be estimated). Low risk of bias, no indirectness in population, intervention or outcome, and no inconsistency (single study, no meta-analysis possible).
Table 55: Janczyk 201574 results table for outcomes reporting median (IQR) Omega-3 versus placebo in children and young people
Outcome Omega 3 (30) Placebo (n=34) Risk of bias
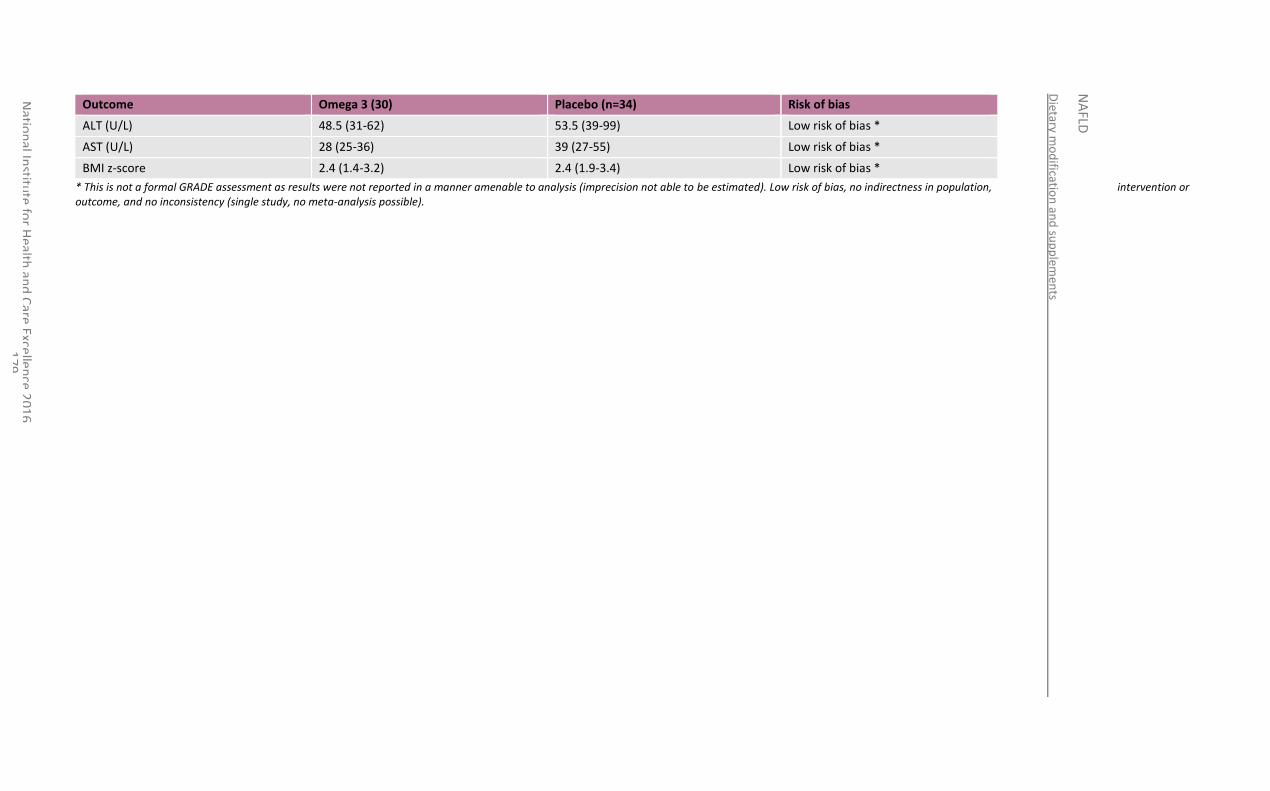
Dietary m
od
ification
and
sup
plem
ents
NA
FLD
Natio
nal In
stitute
for H
ealth an
d C
are Excellen
ce 20
16
1
79
Outcome Omega 3 (30) Placebo (n=34) Risk of bias
ALT (U/L) 48.5 (31-62) 53.5 (39-99) Low risk of bias *
AST (U/L) 28 (25-36) 39 (27-55) Low risk of bias *
BMI z-score 2.4 (1.4-3.2) 2.4 (1.9-3.4) Low risk of bias *
* This is not a formal GRADE assessment as results were not reported in a manner amenable to analysis (imprecision not able to be estimated). Low risk of bias, no indirectness in population, intervention or outcome, and no inconsistency (single study, no meta-analysis possible).
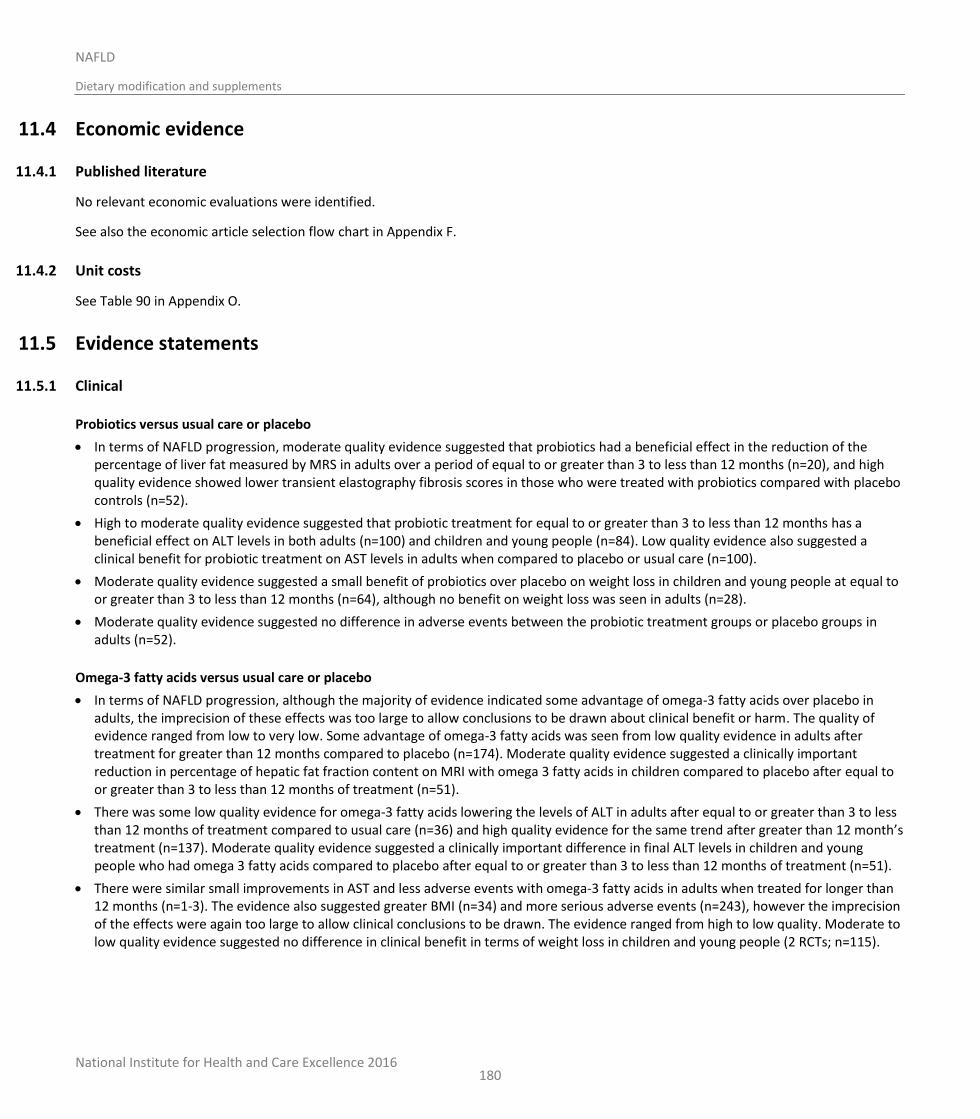
National Institute for Health and Care Excellence 2016
NAFLD
Dietary modification and supplements
180
11.4 Economic evidence
11.4.1 Published literature
No relevant economic evaluations were identified.
See also the economic article selection flow chart in Appendix F.
11.4.2 Unit costs
See Table 90 in Appendix O.
11.5 Evidence statements
11.5.1 Clinical
Probiotics versus usual care or placebo
In terms of NAFLD progression, moderate quality evidence suggested that probiotics had a beneficial effect in the reduction of the percentage of liver fat measured by MRS in adults over a period of equal to or greater than 3 to less than 12 months (n=20), and high quality evidence showed lower transient elastography fibrosis scores in those who were treated with probiotics compared with placebo controls (n=52).
High to moderate quality evidence suggested that probiotic treatment for equal to or greater than 3 to less than 12 months has a beneficial effect on ALT levels in both adults (n=100) and children and young people (n=84). Low quality evidence also suggested a clinical benefit for probiotic treatment on AST levels in adults when compared to placebo or usual care (n=100).
Moderate quality evidence suggested a small benefit of probiotics over placebo on weight loss in children and young people at equal to or greater than 3 to less than 12 months (n=64), although no benefit on weight loss was seen in adults (n=28).
Moderate quality evidence suggested no difference in adverse events between the probiotic treatment groups or placebo groups in adults (n=52).
Omega-3 fatty acids versus usual care or placebo
In terms of NAFLD progression, although the majority of evidence indicated some advantage of omega-3 fatty acids over placebo in adults, the imprecision of these effects was too large to allow conclusions to be drawn about clinical benefit or harm. The quality of evidence ranged from low to very low. Some advantage of omega-3 fatty acids was seen from low quality evidence in adults after treatment for greater than 12 months compared to placebo (n=174). Moderate quality evidence suggested a clinically important reduction in percentage of hepatic fat fraction content on MRI with omega 3 fatty acids in children compared to placebo after equal to or greater than 3 to less than 12 months of treatment (n=51).
There was some low quality evidence for omega-3 fatty acids lowering the levels of ALT in adults after equal to or greater than 3 to less than 12 months of treatment compared to usual care (n=36) and high quality evidence for the same trend after greater than 12 month’s treatment (n=137). Moderate quality evidence suggested a clinically important difference in final ALT levels in children and young people who had omega 3 fatty acids compared to placebo after equal to or greater than 3 to less than 12 months of treatment (n=51).
There were similar small improvements in AST and less adverse events with omega-3 fatty acids in adults when treated for longer than 12 months (n=1-3). The evidence also suggested greater BMI (n=34) and more serious adverse events (n=243), however the imprecision of the effects were again too large to allow clinical conclusions to be drawn. The evidence ranged from high to low quality. Moderate to low quality evidence suggested no difference in clinical benefit in terms of weight loss in children and young people (2 RCTs; n=115).
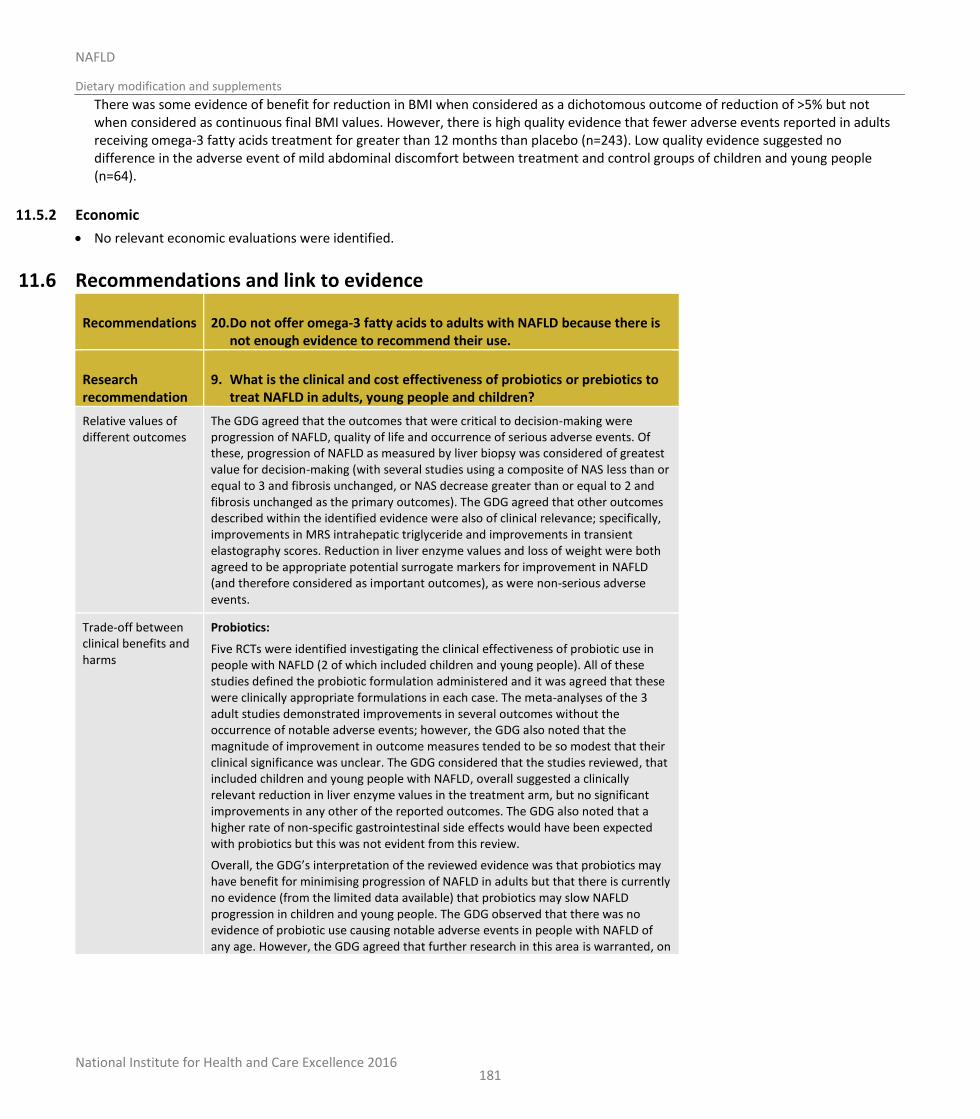
National Institute for Health and Care Excellence 2016
NAFLD
Dietary modification and supplements
181
There was some evidence of benefit for reduction in BMI when considered as a dichotomous outcome of reduction of >5% but not when considered as continuous final BMI values. However, there is high quality evidence that fewer adverse events reported in adults receiving omega-3 fatty acids treatment for greater than 12 months than placebo (n=243). Low quality evidence suggested no difference in the adverse event of mild abdominal discomfort between treatment and control groups of children and young people (n=64).
11.5.2 Economic
No relevant economic evaluations were identified.
11.6 Recommendations and link to evidence
Recommendations 20. Do not offer omega-3 fatty acids to adults with NAFLD because there is not enough evidence to recommend their use.
Research recommendation
9. What is the clinical and cost effectiveness of probiotics or prebiotics to treat NAFLD in adults, young people and children?
Relative values of different outcomes
The GDG agreed that the outcomes that were critical to decision-making were progression of NAFLD, quality of life and occurrence of serious adverse events. Of these, progression of NAFLD as measured by liver biopsy was considered of greatest value for decision-making (with several studies using a composite of NAS less than or equal to 3 and fibrosis unchanged, or NAS decrease greater than or equal to 2 and fibrosis unchanged as the primary outcomes). The GDG agreed that other outcomes described within the identified evidence were also of clinical relevance; specifically, improvements in MRS intrahepatic triglyceride and improvements in transient elastography scores. Reduction in liver enzyme values and loss of weight were both agreed to be appropriate potential surrogate markers for improvement in NAFLD (and therefore considered as important outcomes), as were non-serious adverse events.
Trade-off between clinical benefits and harms
Probiotics:
Five RCTs were identified investigating the clinical effectiveness of probiotic use in people with NAFLD (2 of which included children and young people). All of these studies defined the probiotic formulation administered and it was agreed that these were clinically appropriate formulations in each case. The meta-analyses of the 3 adult studies demonstrated improvements in several outcomes without the occurrence of notable adverse events; however, the GDG also noted that the magnitude of improvement in outcome measures tended to be so modest that their clinical significance was unclear. The GDG considered that the studies reviewed, that included children and young people with NAFLD, overall suggested a clinically relevant reduction in liver enzyme values in the treatment arm, but no significant improvements in any other of the reported outcomes. The GDG also noted that a higher rate of non-specific gastrointestinal side effects would have been expected with probiotics but this was not evident from this review.
Overall, the GDG’s interpretation of the reviewed evidence was that probiotics may have benefit for minimising progression of NAFLD in adults but that there is currently no evidence (from the limited data available) that probiotics may slow NAFLD progression in children and young people. The GDG observed that there was no evidence of probiotic use causing notable adverse events in people with NAFLD of any age. However, the GDG agreed that further research in this area is warranted, on
National Institute for Health and Care Excellence 2016
NAFLD
Dietary modification and supplements
182
a number of grounds. Firstly, there is a clear scientific rationale for why probiotics and manipulation of the gut microbiota may be effective in the treatment of NAFLD in children, young people and adults. Secondly, the identified studies were small and of variable quality yet still provided some promising data suggesting that NAFLD progression may be slowed through the use of probiotics, which merited consideration of larger and more robust studies within this area.
Omega-3 fatty acids:
All studies had defined the form of omega-3 fatty acid administered apart from 1; the GDG viewed the results of that study with caution, as the exact nature of the intervention was unclear. It was also noted that some people in the control arm in this study had been identified as using omega-3 fatty acids and that there was variable adherence within the intervention arm; this may have minimised observation of the full potential benefits of the omega-3 fatty acid intervention. It was noted that investigators in some studies had sought to define adherence by study participants to the intervention (for example, by measurement of erythrocyte percentage DHA and EPA enrichment by gas chromatography). The GDG agreed that the 4 studies considered assessing the effect of omega-3 fatty acids on NAFLD progression in adults with NAFLD14,159,165,166,179 did not overall demonstrate any significant improvements in clinically relevant outcomes. A slight decrease in adverse events and an even smaller increase in serious or severe adverse events was reported in adults with NAFLD randomised to receiving omega-3 supplements compared to the control group, but these differences were not large enough to be clinically important. The GDG also observed that regression analysis in the Scorletti 2014 study demonstrated that DHA (but not EPA) was independently associated with a decrease in liver fat percentage (as measured by MRS), but that the primary endpoint of progression of NAFLD as measured by liver biopsy was no different whether people with NAFLD were given omega-3 fatty acid supplements either containing DHA or without.
The GDG also considered 3 studies assessing NAFLD progression in children with the condition treated with omega-3 fatty acids. There was some evidence of clinically relevant reductions in hepatic fat fraction (as assessed by MRI) and ALT in children and young people with NAFLD who were treated with DHA for 6 months.
Collectively, the GDG concluded that there was insufficient evidence from the reviewed evidence for omega-3 fatty acids to be recommended at present to adults with NAFLD as a treatment to slow NAFLD progression. Whilst there was some supportive evidence for omega-3 fatty acids (specifically, DHA) slowing progression of NAFLD in children and young people with the condition, the GDG felt that as this was from a single study – with a relatively small cohort size – it was insufficient to allow the GDG to fully recommend DHA as therapy for children and young people with NAFLD. Therefore, the GDG agreed on a conclusion that DHA appears to have some effectiveness in this role.
Other dietary interventions:
No studies were identified relevant for inclusion regarding the other dietary interventions of fibre or prebiotics. As such, the GDG were unable to make any specific recommendations regarding such interventions.
Trade-off between net clinical effects and costs
No economic evidence was identified relating to any of the dietary supplements considered in this review.
The GDG noted that the probiotic VSL#3 (containing sachets of lysophilised lactic acid bacteria) is listed within the BNF, but only ‘for use under the supervision of a physician for the maintenance of remission of ileoanal pouchitis only in adults as
National Institute for Health and Care Excellence 2016
NAFLD
Dietary modification and supplements
183
induced by antibiotics’ and so could not be prescribed by clinicians for people with NAFLD. No other probiotics are listed in the BNF.
The GDG is not recommending that omega-3 fatty acid preparations should either be prescribed by clinicians or bought over-the-counter by people with NAFLD and so there are currently no economic considerations relating to these products.
Quality of evidence Probiotics:
The GDG noted that the number of identified studies was small and included only small numbers of participants with variable lengths of follow-up. The information given within the identified studies regarding the means taken to assess compliance with the intervention was often limited. For these reasons, and the imprecision associated with the effects, the majority of evidence was rated as low to moderate quality. A high quality GRADE rating was observed for 2 outcomes; NAFLD progression assessed by transient elastography fibrosis score and ALT levels in adults at greater than or equal to 3 to 12 months.
Omega-3 fatty acids:
The majority of the evidence was rated as low risk of bias as the identified RCTs were overall well-designed, adequately powered studies with appropriate outcomes that together gave sufficient data to allow meaningful conclusions to be reached regarding the clinical efficacy of this intervention. However, the imprecision associated with the effects for many outcomes lead to the majority of evidence being rated as moderate quality. A high-quality GRADE rating was observed for 3 outcomes; ALT levels, AST levels and adverse events for adults at greater than or equal to 12 months.
Other considerations Research recommendation
The GDG made a high-priority research recommendation to investigate the clinical and cost-effectiveness of probiotics and prebiotics to treat NAFLD. See Appendix Q for further details.
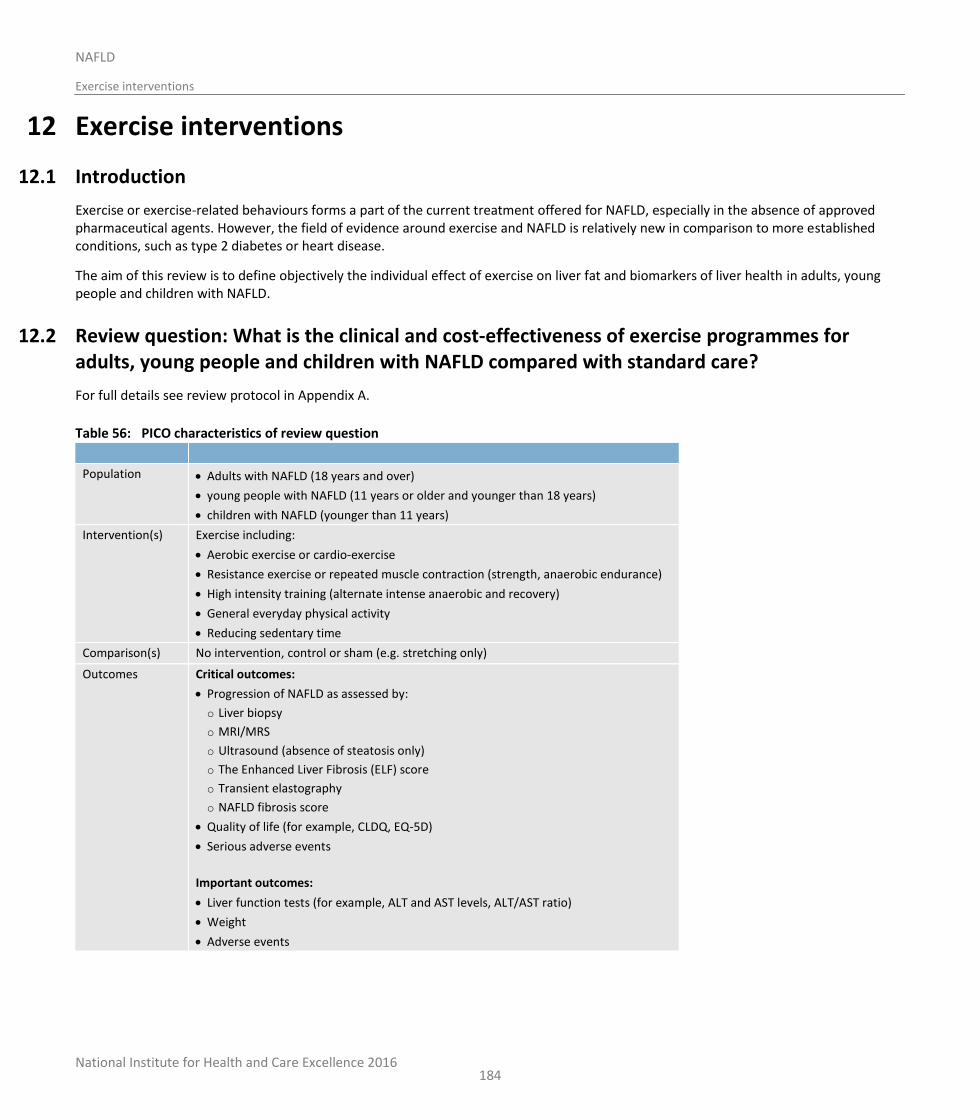
National Institute for Health and Care Excellence 2016
NAFLD
Exercise interventions
184
12 Exercise interventions
12.1 Introduction
Exercise or exercise-related behaviours forms a part of the current treatment offered for NAFLD, especially in the absence of approved pharmaceutical agents. However, the field of evidence around exercise and NAFLD is relatively new in comparison to more established conditions, such as type 2 diabetes or heart disease.
The aim of this review is to define objectively the individual effect of exercise on liver fat and biomarkers of liver health in adults, young people and children with NAFLD.
12.2 Review question: What is the clinical and cost-effectiveness of exercise programmes for adults, young people and children with NAFLD compared with standard care?
For full details see review protocol in Appendix A.
Table 56: PICO characteristics of review question
Population Adults with NAFLD (18 years and over)
young people with NAFLD (11 years or older and younger than 18 years)
children with NAFLD (younger than 11 years)
Intervention(s) Exercise including:
Aerobic exercise or cardio-exercise
Resistance exercise or repeated muscle contraction (strength, anaerobic endurance)
High intensity training (alternate intense anaerobic and recovery)
General everyday physical activity
Reducing sedentary time
Comparison(s) No intervention, control or sham (e.g. stretching only)
Outcomes Critical outcomes:
Progression of NAFLD as assessed by:
o Liver biopsy
o MRI/MRS
o Ultrasound (absence of steatosis only)
o The Enhanced Liver Fibrosis (ELF) score
o Transient elastography
o NAFLD fibrosis score
Quality of life (for example, CLDQ, EQ-5D)
Serious adverse events
Important outcomes:
Liver function tests (for example, ALT and AST levels, ALT/AST ratio)
Weight
Adverse events
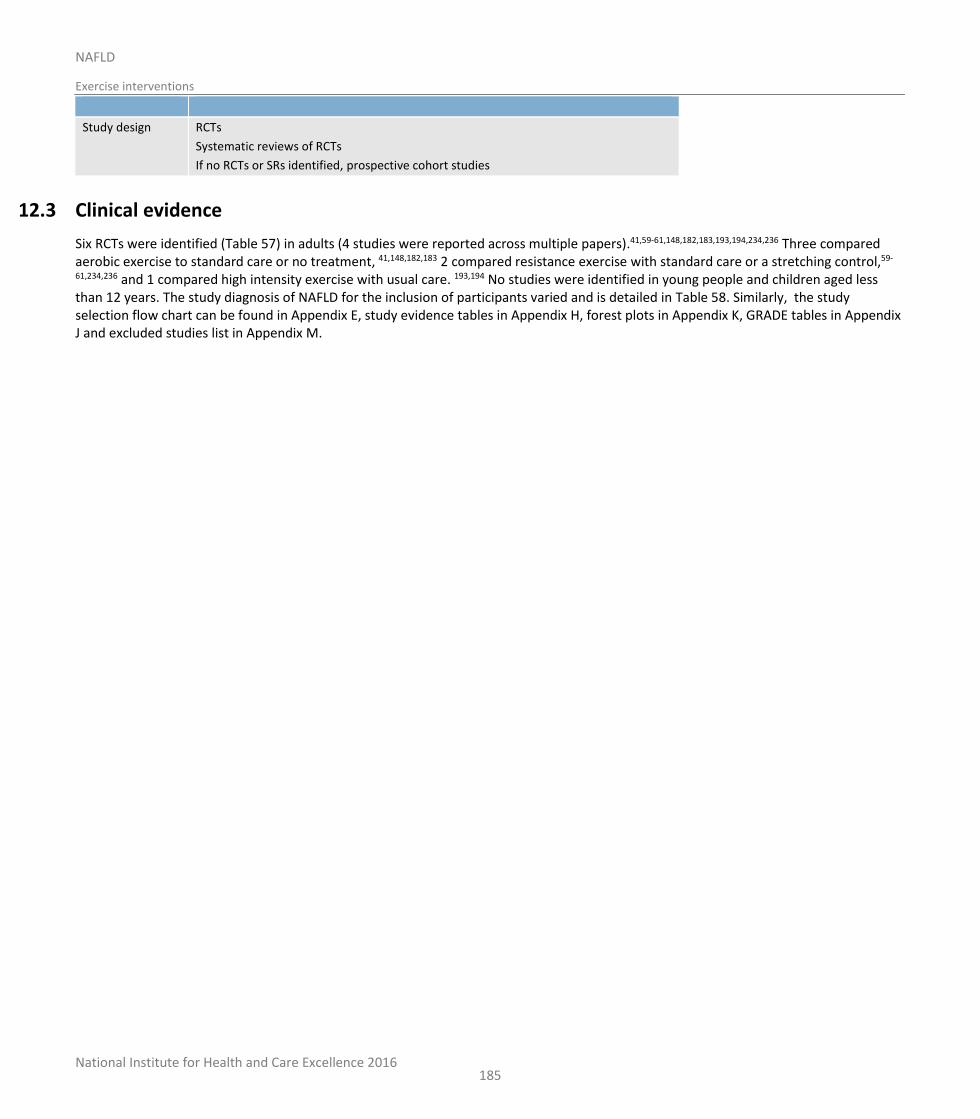
National Institute for Health and Care Excellence 2016
NAFLD
Exercise interventions
185
Study design RCTs
Systematic reviews of RCTs
If no RCTs or SRs identified, prospective cohort studies
12.3 Clinical evidence
Six RCTs were identified (Table 57) in adults (4 studies were reported across multiple papers).41,59-61,148,182,183,193,194,234,236 Three compared aerobic exercise to standard care or no treatment, 41,148,182,183 2 compared resistance exercise with standard care or a stretching control,59-
61,234,236 and 1 compared high intensity exercise with usual care. 193,194 No studies were identified in young people and children aged less than 12 years. The study diagnosis of NAFLD for the inclusion of participants varied and is detailed in Table 58. Similarly, the study selection flow chart can be found in Appendix E, study evidence tables in Appendix H, forest plots in Appendix K, GRADE tables in Appendix J and excluded studies list in Appendix M.
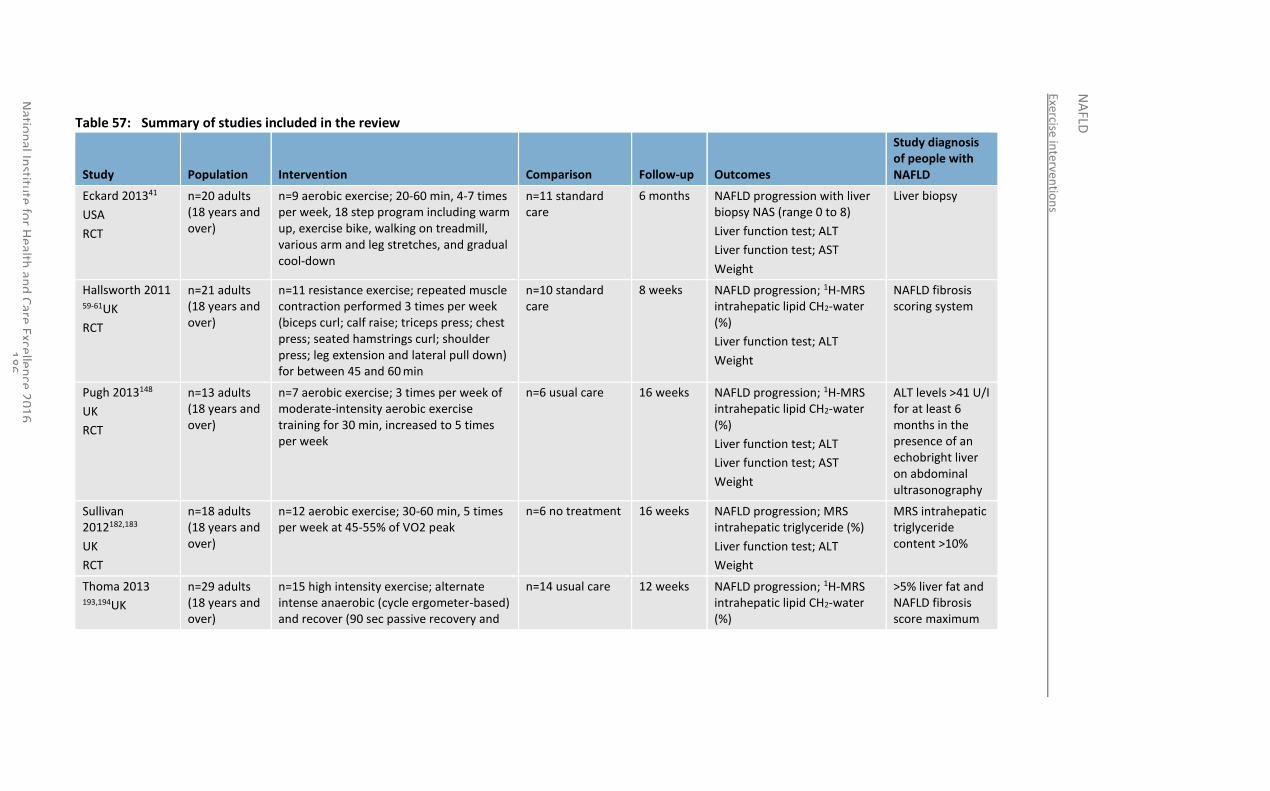
Exercise interven
tion
s
NA
FLD
Natio
nal In
stitute
for H
ealth an
d C
are Excellen
ce 20
16
1
86
Table 57: Summary of studies included in the review
Study Population Intervention Comparison Follow-up Outcomes
Study diagnosis of people with NAFLD
Eckard 201341
USA
RCT
n=20 adults (18 years and over)
n=9 aerobic exercise; 20-60 min, 4-7 times per week, 18 step program including warm up, exercise bike, walking on treadmill, various arm and leg stretches, and gradual cool-down
n=11 standard care
6 months NAFLD progression with liver biopsy NAS (range 0 to 8)
Liver function test; ALT
Liver function test; AST
Weight
Liver biopsy
Hallsworth 2011 59-61UK
RCT
n=21 adults (18 years and over)
n=11 resistance exercise; repeated muscle contraction performed 3 times per week (biceps curl; calf raise; triceps press; chest press; seated hamstrings curl; shoulder press; leg extension and lateral pull down) for between 45 and 60 min
n=10 standard care
8 weeks NAFLD progression; 1H-MRS intrahepatic lipid CH2-water (%)
Liver function test; ALT
Weight
NAFLD fibrosis scoring system
Pugh 2013148
UK
RCT
n=13 adults (18 years and over)
n=7 aerobic exercise; 3 times per week of moderate-intensity aerobic exercise training for 30 min, increased to 5 times per week
n=6 usual care 16 weeks NAFLD progression; 1H-MRS intrahepatic lipid CH2-water (%)
Liver function test; ALT
Liver function test; AST
Weight
ALT levels >41 U/I for at least 6 months in the presence of an echobright liver on abdominal ultrasonography
Sullivan 2012182,183
UK
RCT
n=18 adults (18 years and over)
n=12 aerobic exercise; 30-60 min, 5 times per week at 45-55% of VO2 peak
n=6 no treatment 16 weeks NAFLD progression; MRS intrahepatic triglyceride (%)
Liver function test; ALT
Weight
MRS intrahepatic triglyceride content >10%
Thoma 2013 193,194UK
n=29 adults (18 years and over)
n=15 high intensity exercise; alternate intense anaerobic (cycle ergometer-based) and recover (90 sec passive recovery and
n=14 usual care 12 weeks NAFLD progression; 1H-MRS intrahepatic lipid CH2-water (%)
>5% liver fat and NAFLD fibrosis score maximum
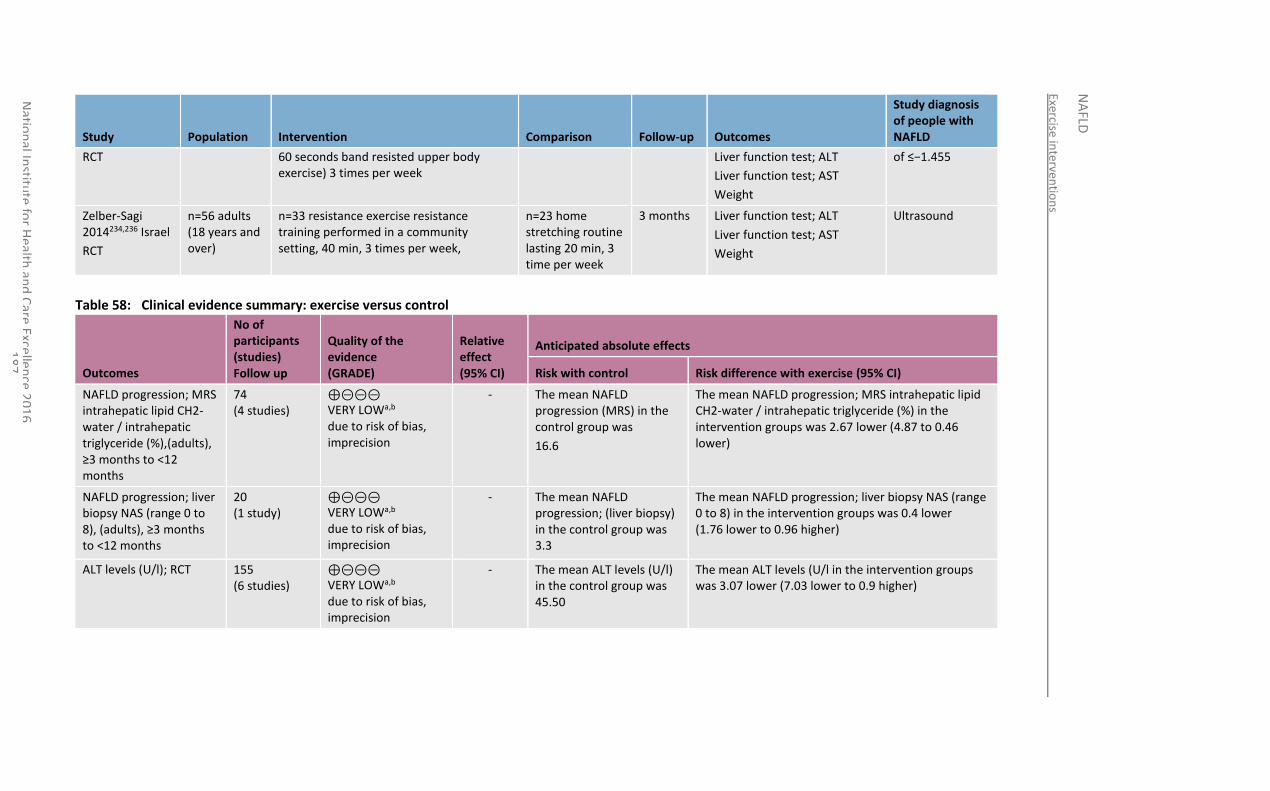
Exercise interven
tion
s
NA
FLD
Natio
nal In
stitute
for H
ealth an
d C
are Excellen
ce 20
16
1
87
Study Population Intervention Comparison Follow-up Outcomes
Study diagnosis of people with NAFLD
RCT 60 seconds band resisted upper body exercise) 3 times per week
Liver function test; ALT
Liver function test; AST
Weight
of ≤−1.455
Zelber-Sagi 2014234,236 Israel
RCT
n=56 adults (18 years and over)
n=33 resistance exercise resistance training performed in a community setting, 40 min, 3 times per week,
n=23 home stretching routine lasting 20 min, 3 time per week
3 months Liver function test; ALT
Liver function test; AST
Weight
Ultrasound
Table 58: Clinical evidence summary: exercise versus control
Outcomes
No of participants (studies) Follow up
Quality of the evidence (GRADE)
Relative effect (95% CI)
Anticipated absolute effects
Risk with control Risk difference with exercise (95% CI)
NAFLD progression; MRS intrahepatic lipid CH2-water / intrahepatic triglyceride (%),(adults), ≥3 months to <12 months
74 (4 studies)
⊕⊝⊝⊝ VERY LOWa,b due to risk of bias, imprecision
- The mean NAFLD progression (MRS) in the control group was
16.6
The mean NAFLD progression; MRS intrahepatic lipid CH2-water / intrahepatic triglyceride (%) in the intervention groups was 2.67 lower (4.87 to 0.46 lower)
NAFLD progression; liver biopsy NAS (range 0 to 8), (adults), ≥3 months to <12 months
20 (1 study)
⊕⊝⊝⊝ VERY LOWa,b due to risk of bias, imprecision
- The mean NAFLD progression; (liver biopsy) in the control group was 3.3
The mean NAFLD progression; liver biopsy NAS (range 0 to 8) in the intervention groups was 0.4 lower (1.76 lower to 0.96 higher)
ALT levels (U/l); RCT 155 (6 studies)
⊕⊝⊝⊝ VERY LOWa,b due to risk of bias, imprecision
- The mean ALT levels (U/l) in the control group was 45.50
The mean ALT levels (U/l in the intervention groups was 3.07 lower (7.03 lower to 0.9 higher)
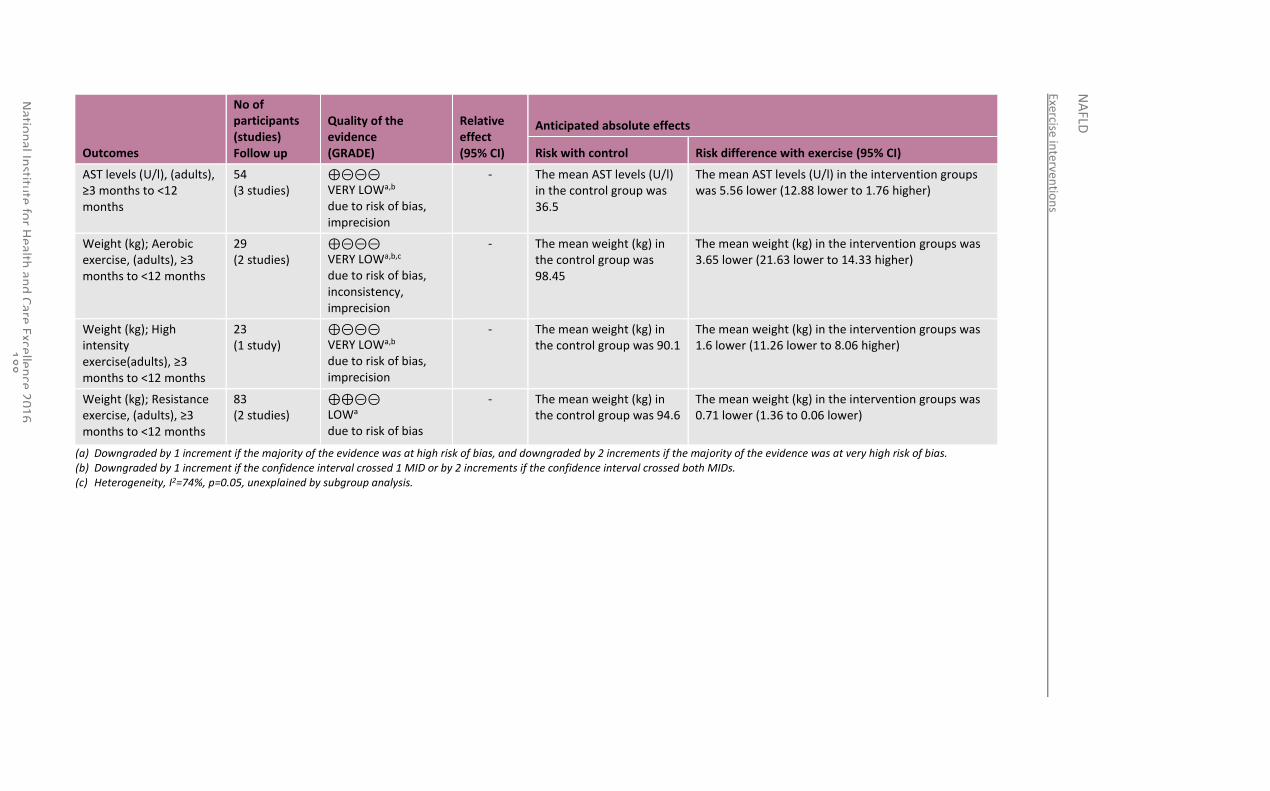
Exercise interven
tion
s
NA
FLD
Natio
nal In
stitute
for H
ealth an
d C
are Excellen
ce 20
16
1
88
Outcomes
No of participants (studies) Follow up
Quality of the evidence (GRADE)
Relative effect (95% CI)
Anticipated absolute effects
Risk with control Risk difference with exercise (95% CI)
AST levels (U/l), (adults), ≥3 months to <12 months
54 (3 studies)
⊕⊝⊝⊝ VERY LOWa,b due to risk of bias, imprecision
- The mean AST levels (U/l) in the control group was 36.5
The mean AST levels (U/l) in the intervention groups was 5.56 lower (12.88 lower to 1.76 higher)
Weight (kg); Aerobic exercise, (adults), ≥3 months to <12 months
29 (2 studies)
⊕⊝⊝⊝ VERY LOWa,b,c due to risk of bias, inconsistency, imprecision
- The mean weight (kg) in the control group was 98.45
The mean weight (kg) in the intervention groups was 3.65 lower (21.63 lower to 14.33 higher)
Weight (kg); High intensity exercise(adults), ≥3 months to <12 months
23 (1 study)
⊕⊝⊝⊝ VERY LOWa,b due to risk of bias, imprecision
- The mean weight (kg) in the control group was 90.1
The mean weight (kg) in the intervention groups was 1.6 lower (11.26 lower to 8.06 higher)
Weight (kg); Resistance exercise, (adults), ≥3 months to <12 months
83 (2 studies)
⊕⊕⊝⊝ LOWa due to risk of bias
- The mean weight (kg) in the control group was 94.6
The mean weight (kg) in the intervention groups was 0.71 lower (1.36 to 0.06 lower)
(a) Downgraded by 1 increment if the majority of the evidence was at high risk of bias, and downgraded by 2 increments if the majority of the evidence was at very high risk of bias. (b) Downgraded by 1 increment if the confidence interval crossed 1 MID or by 2 increments if the confidence interval crossed both MIDs. (c) Heterogeneity, I2=74%, p=0.05, unexplained by subgroup analysis.
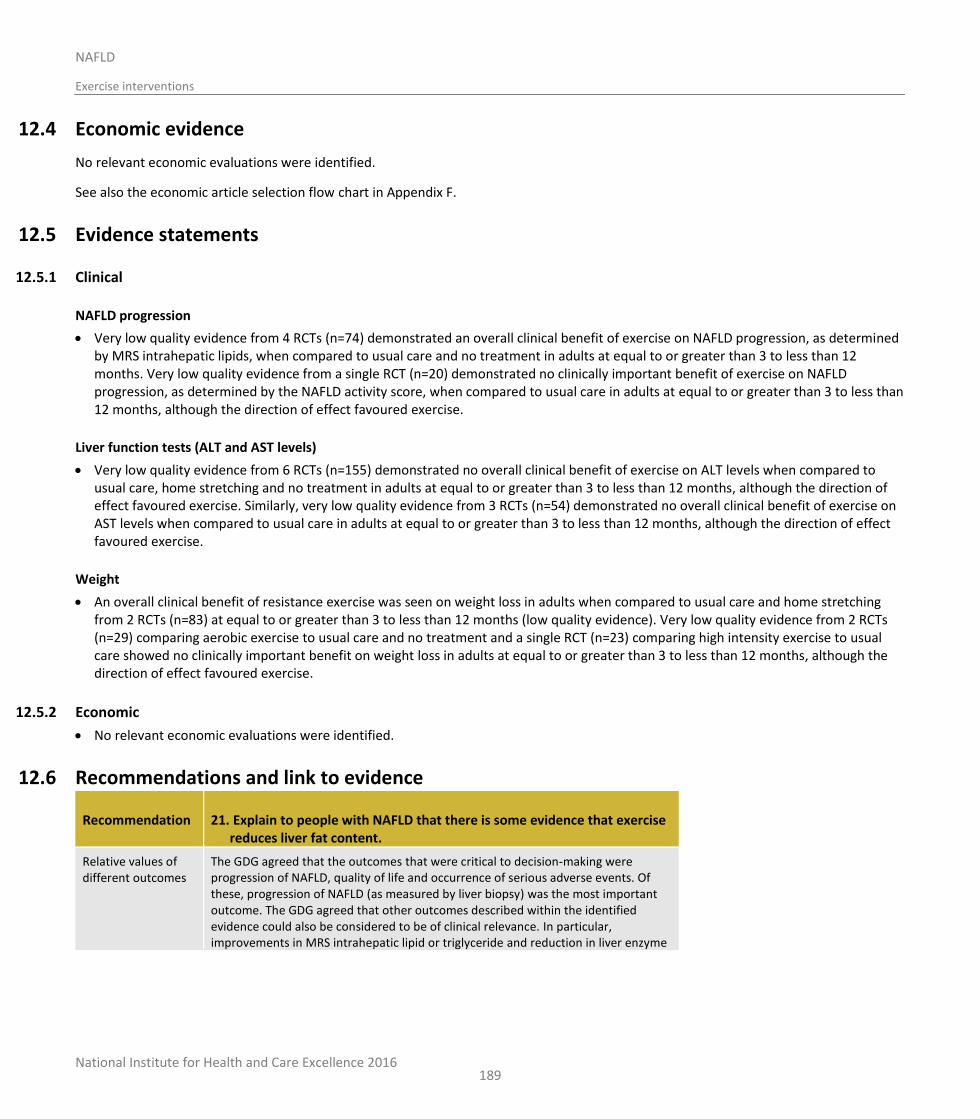
National Institute for Health and Care Excellence 2016
NAFLD
Exercise interventions
189
12.4 Economic evidence
No relevant economic evaluations were identified.
See also the economic article selection flow chart in Appendix F.
12.5 Evidence statements
12.5.1 Clinical
NAFLD progression
Very low quality evidence from 4 RCTs (n=74) demonstrated an overall clinical benefit of exercise on NAFLD progression, as determined by MRS intrahepatic lipids, when compared to usual care and no treatment in adults at equal to or greater than 3 to less than 12 months. Very low quality evidence from a single RCT (n=20) demonstrated no clinically important benefit of exercise on NAFLD progression, as determined by the NAFLD activity score, when compared to usual care in adults at equal to or greater than 3 to less than 12 months, although the direction of effect favoured exercise.
Liver function tests (ALT and AST levels)
Very low quality evidence from 6 RCTs (n=155) demonstrated no overall clinical benefit of exercise on ALT levels when compared to usual care, home stretching and no treatment in adults at equal to or greater than 3 to less than 12 months, although the direction of effect favoured exercise. Similarly, very low quality evidence from 3 RCTs (n=54) demonstrated no overall clinical benefit of exercise on AST levels when compared to usual care in adults at equal to or greater than 3 to less than 12 months, although the direction of effect favoured exercise.
Weight
An overall clinical benefit of resistance exercise was seen on weight loss in adults when compared to usual care and home stretching from 2 RCTs (n=83) at equal to or greater than 3 to less than 12 months (low quality evidence). Very low quality evidence from 2 RCTs (n=29) comparing aerobic exercise to usual care and no treatment and a single RCT (n=23) comparing high intensity exercise to usual care showed no clinically important benefit on weight loss in adults at equal to or greater than 3 to less than 12 months, although the direction of effect favoured exercise.
12.5.2 Economic
No relevant economic evaluations were identified.
12.6 Recommendations and link to evidence
Recommendation 21. Explain to people with NAFLD that there is some evidence that exercise reduces liver fat content.
Relative values of different outcomes
The GDG agreed that the outcomes that were critical to decision-making were progression of NAFLD, quality of life and occurrence of serious adverse events. Of these, progression of NAFLD (as measured by liver biopsy) was the most important outcome. The GDG agreed that other outcomes described within the identified evidence could also be considered to be of clinical relevance. In particular, improvements in MRS intrahepatic lipid or triglyceride and reduction in liver enzyme
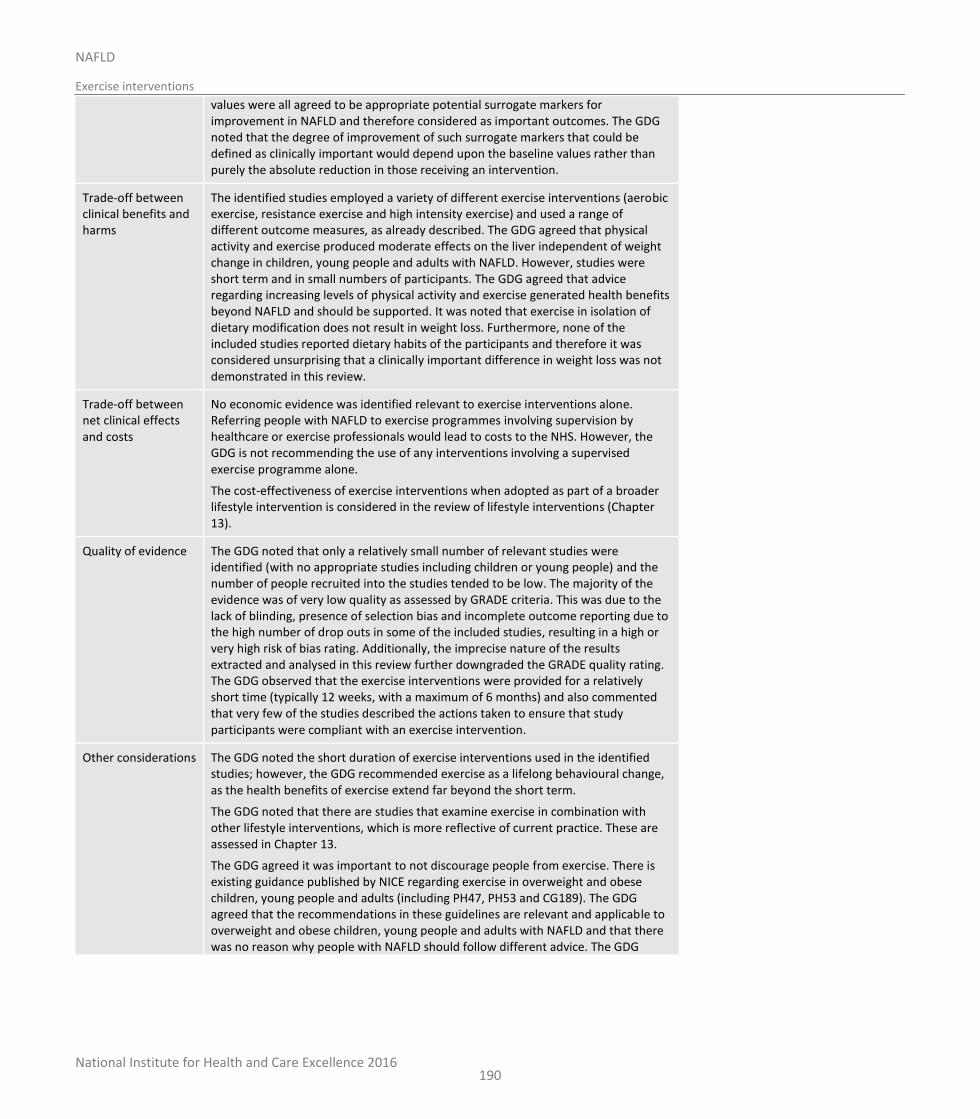
National Institute for Health and Care Excellence 2016
NAFLD
Exercise interventions
190
values were all agreed to be appropriate potential surrogate markers for improvement in NAFLD and therefore considered as important outcomes. The GDG noted that the degree of improvement of such surrogate markers that could be defined as clinically important would depend upon the baseline values rather than purely the absolute reduction in those receiving an intervention.
Trade-off between clinical benefits and harms
The identified studies employed a variety of different exercise interventions (aerobic exercise, resistance exercise and high intensity exercise) and used a range of different outcome measures, as already described. The GDG agreed that physical activity and exercise produced moderate effects on the liver independent of weight change in children, young people and adults with NAFLD. However, studies were short term and in small numbers of participants. The GDG agreed that advice regarding increasing levels of physical activity and exercise generated health benefits beyond NAFLD and should be supported. It was noted that exercise in isolation of dietary modification does not result in weight loss. Furthermore, none of the included studies reported dietary habits of the participants and therefore it was considered unsurprising that a clinically important difference in weight loss was not demonstrated in this review.
Trade-off between net clinical effects and costs
No economic evidence was identified relevant to exercise interventions alone. Referring people with NAFLD to exercise programmes involving supervision by healthcare or exercise professionals would lead to costs to the NHS. However, the GDG is not recommending the use of any interventions involving a supervised exercise programme alone.
The cost-effectiveness of exercise interventions when adopted as part of a broader lifestyle intervention is considered in the review of lifestyle interventions (Chapter 13).
Quality of evidence The GDG noted that only a relatively small number of relevant studies were identified (with no appropriate studies including children or young people) and the number of people recruited into the studies tended to be low. The majority of the evidence was of very low quality as assessed by GRADE criteria. This was due to the lack of blinding, presence of selection bias and incomplete outcome reporting due to the high number of drop outs in some of the included studies, resulting in a high or very high risk of bias rating. Additionally, the imprecise nature of the results extracted and analysed in this review further downgraded the GRADE quality rating. The GDG observed that the exercise interventions were provided for a relatively short time (typically 12 weeks, with a maximum of 6 months) and also commented that very few of the studies described the actions taken to ensure that study participants were compliant with an exercise intervention.
Other considerations The GDG noted the short duration of exercise interventions used in the identified studies; however, the GDG recommended exercise as a lifelong behavioural change, as the health benefits of exercise extend far beyond the short term.
The GDG noted that there are studies that examine exercise in combination with other lifestyle interventions, which is more reflective of current practice. These are assessed in Chapter 13.
The GDG agreed it was important to not discourage people from exercise. There is existing guidance published by NICE regarding exercise in overweight and obese children, young people and adults (including PH47, PH53 and CG189). The GDG agreed that the recommendations in these guidelines are relevant and applicable to overweight and obese children, young people and adults with NAFLD and that there was no reason why people with NAFLD should follow different advice. The GDG

National Institute for Health and Care Excellence 2016
NAFLD
Exercise interventions
191
particularly emphasised the point described in CG189 (recommendation 1.6.1) that exercise provides health benefits even without weight loss, including reduced risks of type 2 diabetes mellitus and of cardiovascular disease.
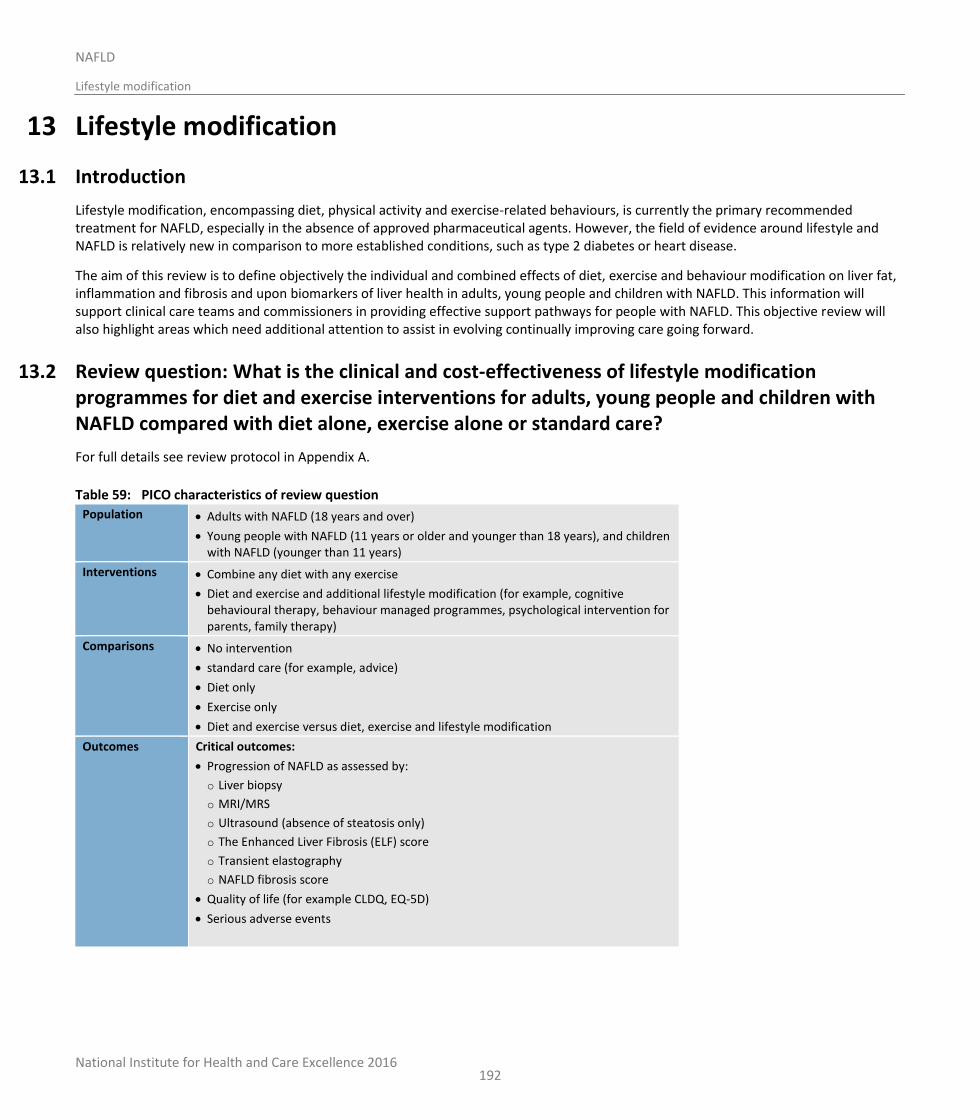
National Institute for Health and Care Excellence 2016
NAFLD
Lifestyle modification
192
13 Lifestyle modification
13.1 Introduction
Lifestyle modification, encompassing diet, physical activity and exercise-related behaviours, is currently the primary recommended treatment for NAFLD, especially in the absence of approved pharmaceutical agents. However, the field of evidence around lifestyle and NAFLD is relatively new in comparison to more established conditions, such as type 2 diabetes or heart disease.
The aim of this review is to define objectively the individual and combined effects of diet, exercise and behaviour modification on liver fat, inflammation and fibrosis and upon biomarkers of liver health in adults, young people and children with NAFLD. This information will support clinical care teams and commissioners in providing effective support pathways for people with NAFLD. This objective review will also highlight areas which need additional attention to assist in evolving continually improving care going forward.
13.2 Review question: What is the clinical and cost-effectiveness of lifestyle modification programmes for diet and exercise interventions for adults, young people and children with NAFLD compared with diet alone, exercise alone or standard care?
For full details see review protocol in Appendix A.
Table 59: PICO characteristics of review question
Population Adults with NAFLD (18 years and over)
Young people with NAFLD (11 years or older and younger than 18 years), and children with NAFLD (younger than 11 years)
Interventions Combine any diet with any exercise
Diet and exercise and additional lifestyle modification (for example, cognitive behavioural therapy, behaviour managed programmes, psychological intervention for parents, family therapy)
Comparisons No intervention
standard care (for example, advice)
Diet only
Exercise only
Diet and exercise versus diet, exercise and lifestyle modification
Outcomes Critical outcomes:
Progression of NAFLD as assessed by:
o Liver biopsy
o MRI/MRS
o Ultrasound (absence of steatosis only)
o The Enhanced Liver Fibrosis (ELF) score
o Transient elastography
o NAFLD fibrosis score
Quality of life (for example CLDQ, EQ-5D)
Serious adverse events
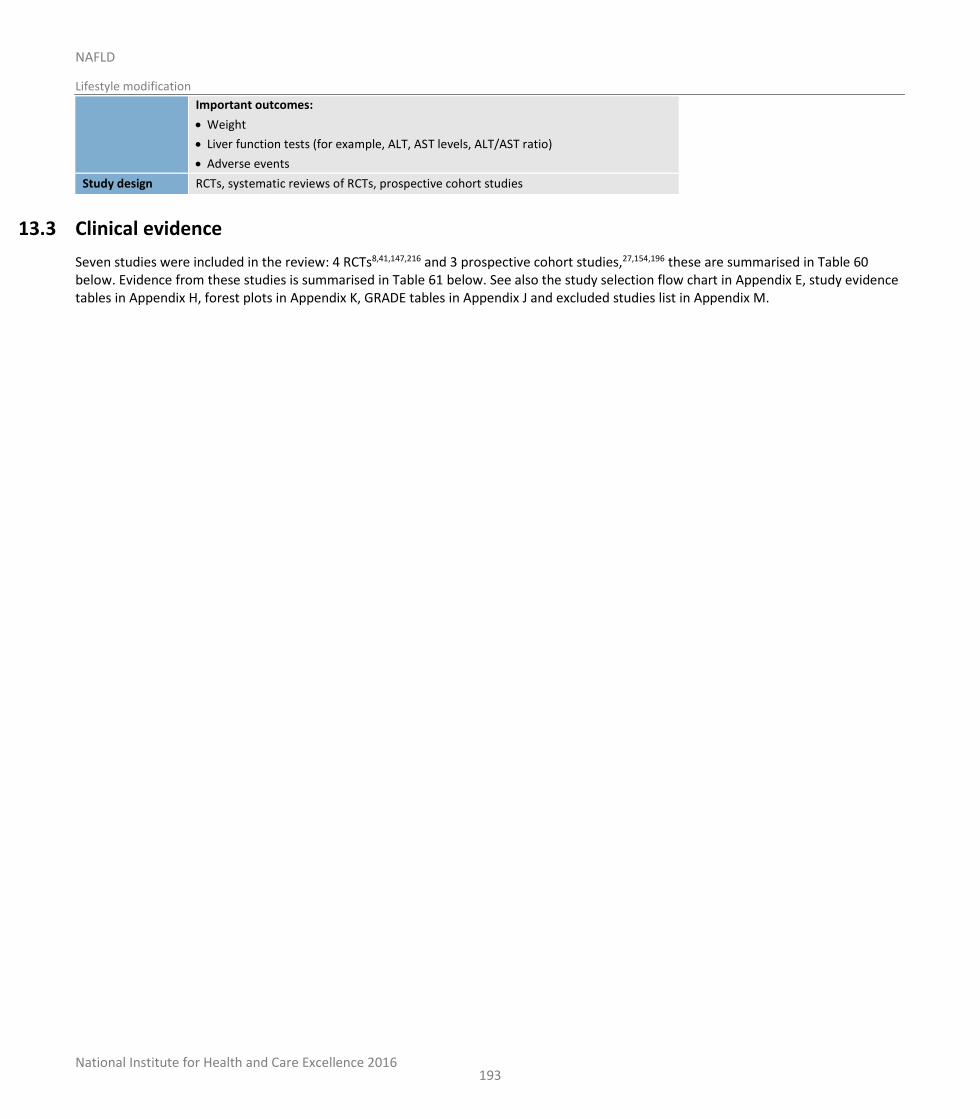
National Institute for Health and Care Excellence 2016
NAFLD
Lifestyle modification
193
Important outcomes:
Weight
Liver function tests (for example, ALT, AST levels, ALT/AST ratio)
Adverse events
Study design RCTs, systematic reviews of RCTs, prospective cohort studies
13.3 Clinical evidence
Seven studies were included in the review: 4 RCTs8,41,147,216 and 3 prospective cohort studies,27,154,196 these are summarised in Table 60 below. Evidence from these studies is summarised in Table 61 below. See also the study selection flow chart in Appendix E, study evidence tables in Appendix H, forest plots in Appendix K, GRADE tables in Appendix J and excluded studies list in Appendix M.
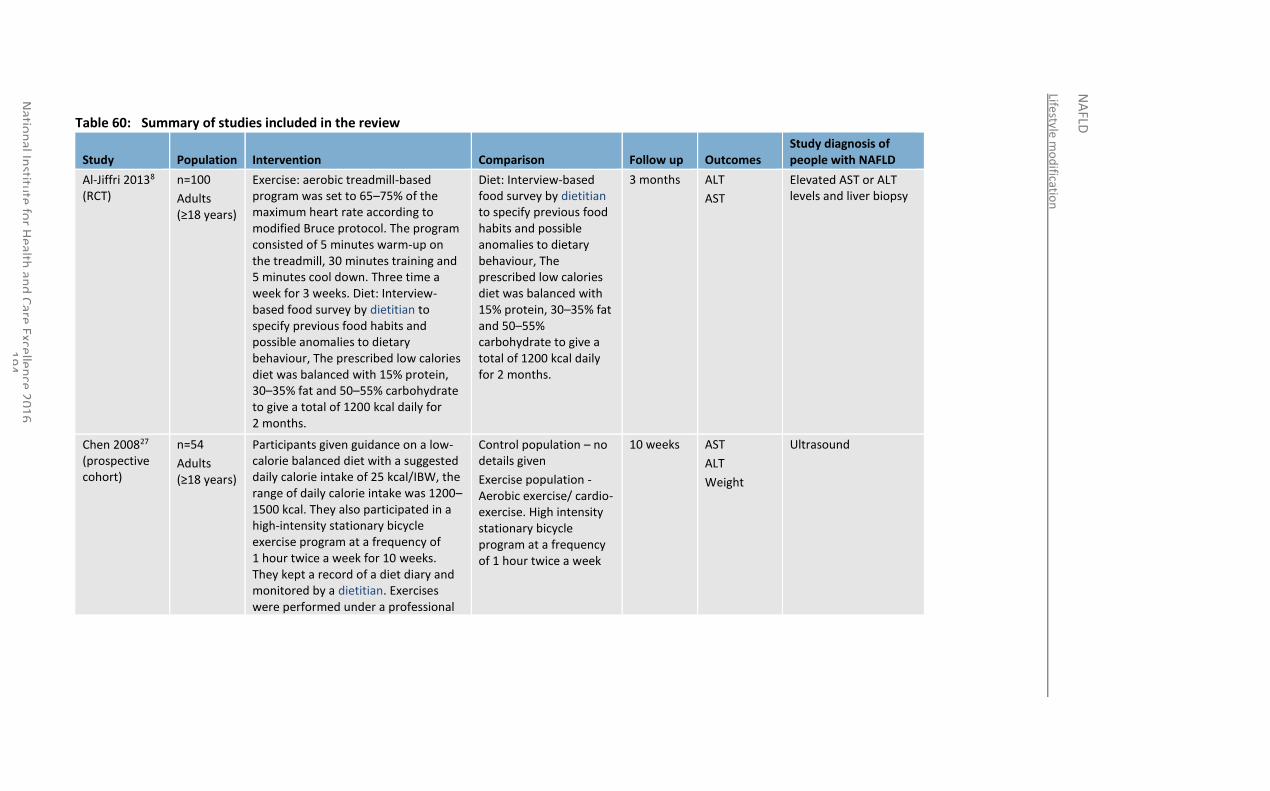
Lifestyle m
od
ification
NA
FLD
Natio
nal In
stitute
for H
ealth an
d C
are Excellen
ce 20
16
1
94
Table 60: Summary of studies included in the review
Study Population Intervention Comparison Follow up Outcomes Study diagnosis of people with NAFLD
Al-Jiffri 20138 (RCT)
n=100
Adults (≥18 years)
Exercise: aerobic treadmill-based program was set to 65–75% of the maximum heart rate according to modified Bruce protocol. The program consisted of 5 minutes warm-up on the treadmill, 30 minutes training and 5 minutes cool down. Three time a week for 3 weeks. Diet: Interview-based food survey by dietitian to specify previous food habits and possible anomalies to dietary behaviour, The prescribed low calories diet was balanced with 15% protein, 30–35% fat and 50–55% carbohydrate to give a total of 1200 kcal daily for 2 months.
Diet: Interview-based food survey by dietitian to specify previous food habits and possible anomalies to dietary behaviour, The prescribed low calories diet was balanced with 15% protein, 30–35% fat and 50–55% carbohydrate to give a total of 1200 kcal daily for 2 months.
3 months ALT
AST
Elevated AST or ALT levels and liver biopsy
Chen 200827 (prospective cohort)
n=54
Adults (≥18 years)
Participants given guidance on a low-calorie balanced diet with a suggested daily calorie intake of 25 kcal/IBW, the range of daily calorie intake was 1200–1500 kcal. They also participated in a high-intensity stationary bicycle exercise program at a frequency of 1 hour twice a week for 10 weeks. They kept a record of a diet diary and monitored by a dietitian. Exercises were performed under a professional
Control population – no details given
Exercise population - Aerobic exercise/ cardio-exercise. High intensity stationary bicycle program at a frequency of 1 hour twice a week
10 weeks AST
ALT
Weight
Ultrasound
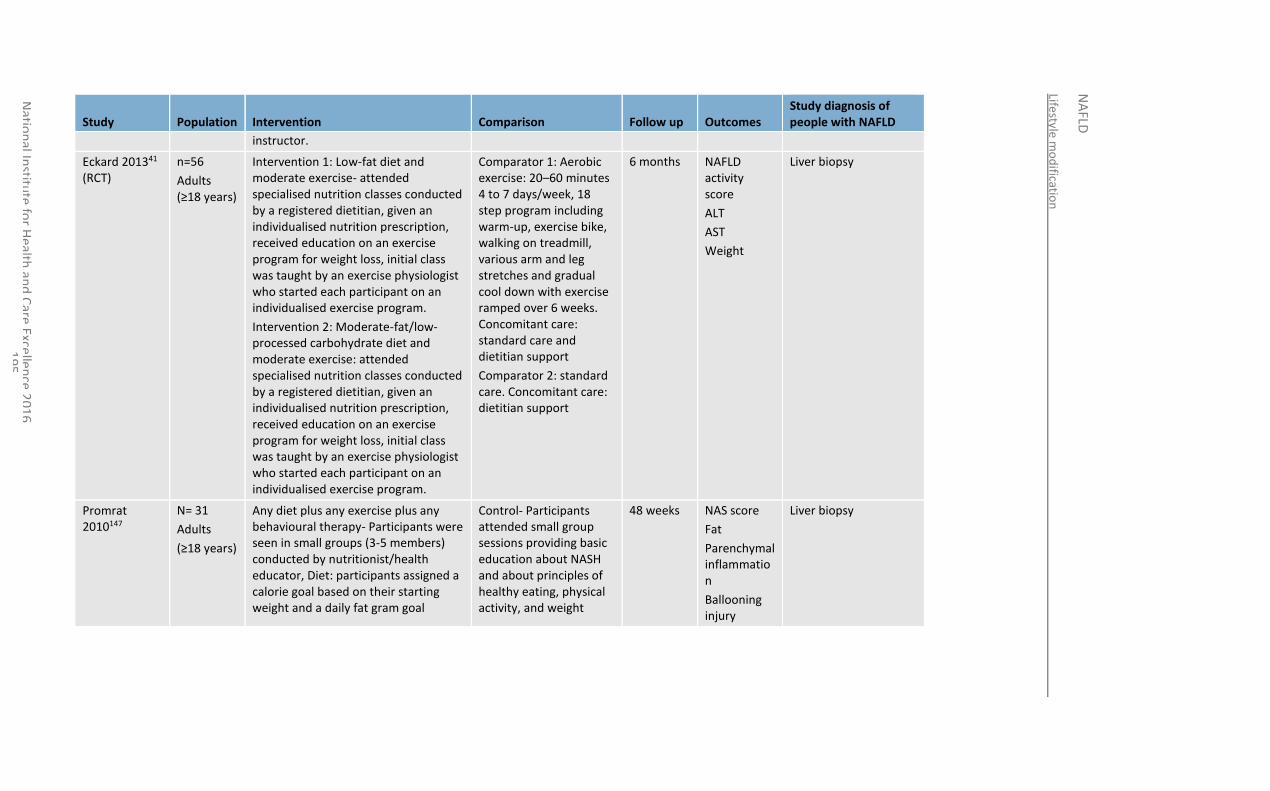
Lifestyle m
od
ification
NA
FLD
Natio
nal In
stitute
for H
ealth an
d C
are Excellen
ce 20
16
1
95
Study Population Intervention Comparison Follow up Outcomes Study diagnosis of people with NAFLD
instructor.
Eckard 201341 (RCT)
n=56
Adults (≥18 years)
Intervention 1: Low-fat diet and moderate exercise- attended specialised nutrition classes conducted by a registered dietitian, given an individualised nutrition prescription, received education on an exercise program for weight loss, initial class was taught by an exercise physiologist who started each participant on an individualised exercise program.
Intervention 2: Moderate-fat/low-processed carbohydrate diet and moderate exercise: attended specialised nutrition classes conducted by a registered dietitian, given an individualised nutrition prescription, received education on an exercise program for weight loss, initial class was taught by an exercise physiologist who started each participant on an individualised exercise program.
Comparator 1: Aerobic exercise: 20–60 minutes 4 to 7 days/week, 18 step program including warm-up, exercise bike, walking on treadmill, various arm and leg stretches and gradual cool down with exercise ramped over 6 weeks. Concomitant care: standard care and dietitian support
Comparator 2: standard care. Concomitant care: dietitian support
6 months NAFLD activity score
ALT
AST
Weight
Liver biopsy
Promrat 2010147
N= 31
Adults
(≥18 years)
Any diet plus any exercise plus any behavioural therapy- Participants were seen in small groups (3-5 members) conducted by nutritionist/health educator, Diet: participants assigned a calorie goal based on their starting weight and a daily fat gram goal
Control- Participants attended small group sessions providing basic education about NASH and about principles of healthy eating, physical activity, and weight
48 weeks NAS score
Fat
Parenchymal inflammation
Ballooning injury
Liver biopsy
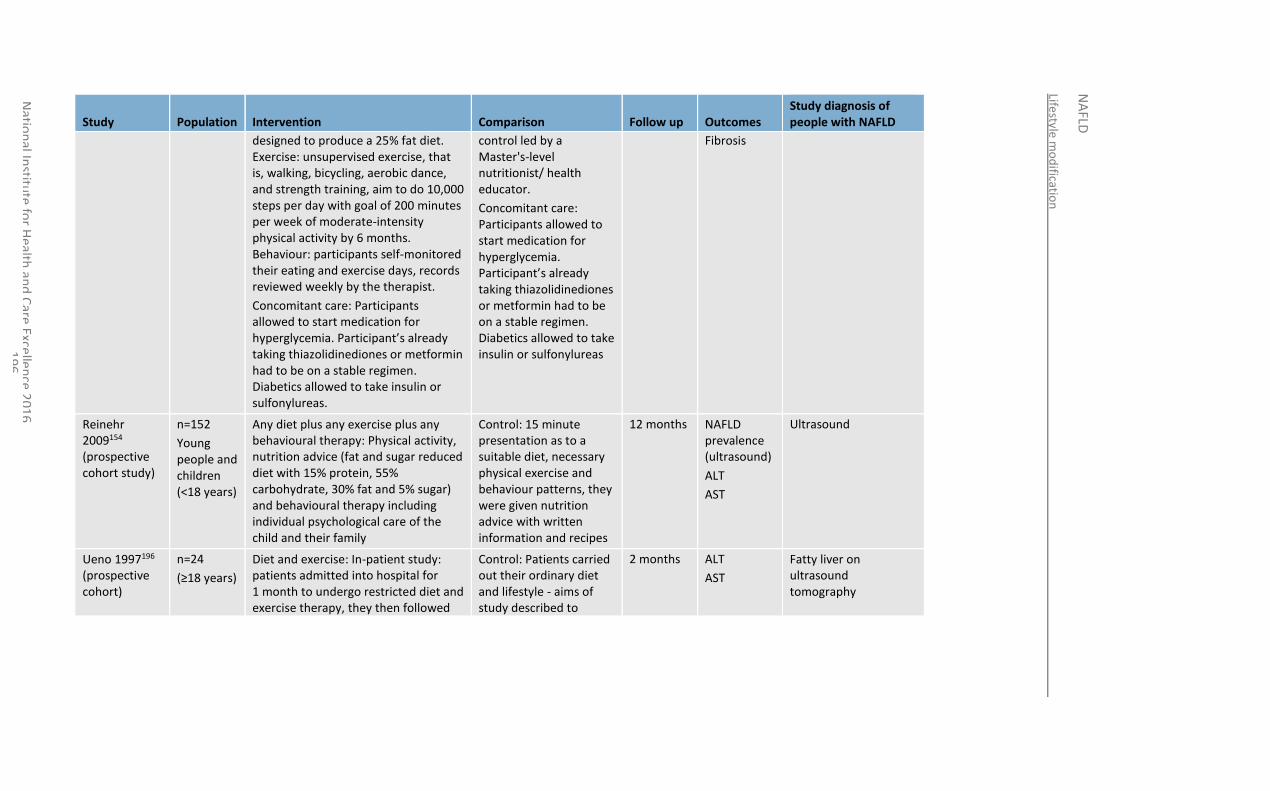
Lifestyle m
od
ification
NA
FLD
Natio
nal In
stitute
for H
ealth an
d C
are Excellen
ce 20
16
1
96
Study Population Intervention Comparison Follow up Outcomes Study diagnosis of people with NAFLD
designed to produce a 25% fat diet. Exercise: unsupervised exercise, that is, walking, bicycling, aerobic dance, and strength training, aim to do 10,000 steps per day with goal of 200 minutes per week of moderate-intensity physical activity by 6 months. Behaviour: participants self-monitored their eating and exercise days, records reviewed weekly by the therapist.
Concomitant care: Participants allowed to start medication for hyperglycemia. Participant’s already taking thiazolidinediones or metformin had to be on a stable regimen. Diabetics allowed to take insulin or sulfonylureas.
control led by a Master's-level nutritionist/ health educator.
Concomitant care: Participants allowed to start medication for hyperglycemia. Participant’s already taking thiazolidinediones or metformin had to be on a stable regimen. Diabetics allowed to take insulin or sulfonylureas
Fibrosis
Reinehr 2009154 (prospective cohort study)
n=152
Young people and children (<18 years)
Any diet plus any exercise plus any behavioural therapy: Physical activity, nutrition advice (fat and sugar reduced diet with 15% protein, 55% carbohydrate, 30% fat and 5% sugar) and behavioural therapy including individual psychological care of the child and their family
Control: 15 minute presentation as to a suitable diet, necessary physical exercise and behaviour patterns, they were given nutrition advice with written information and recipes
12 months NAFLD prevalence (ultrasound)
ALT
AST
Ultrasound
Ueno 1997196 (prospective cohort)
n=24
(≥18 years)
Diet and exercise: In-patient study: patients admitted into hospital for 1 month to undergo restricted diet and exercise therapy, they then followed
Control: Patients carried out their ordinary diet and lifestyle - aims of study described to
2 months ALT
AST
Fatty liver on ultrasound tomography
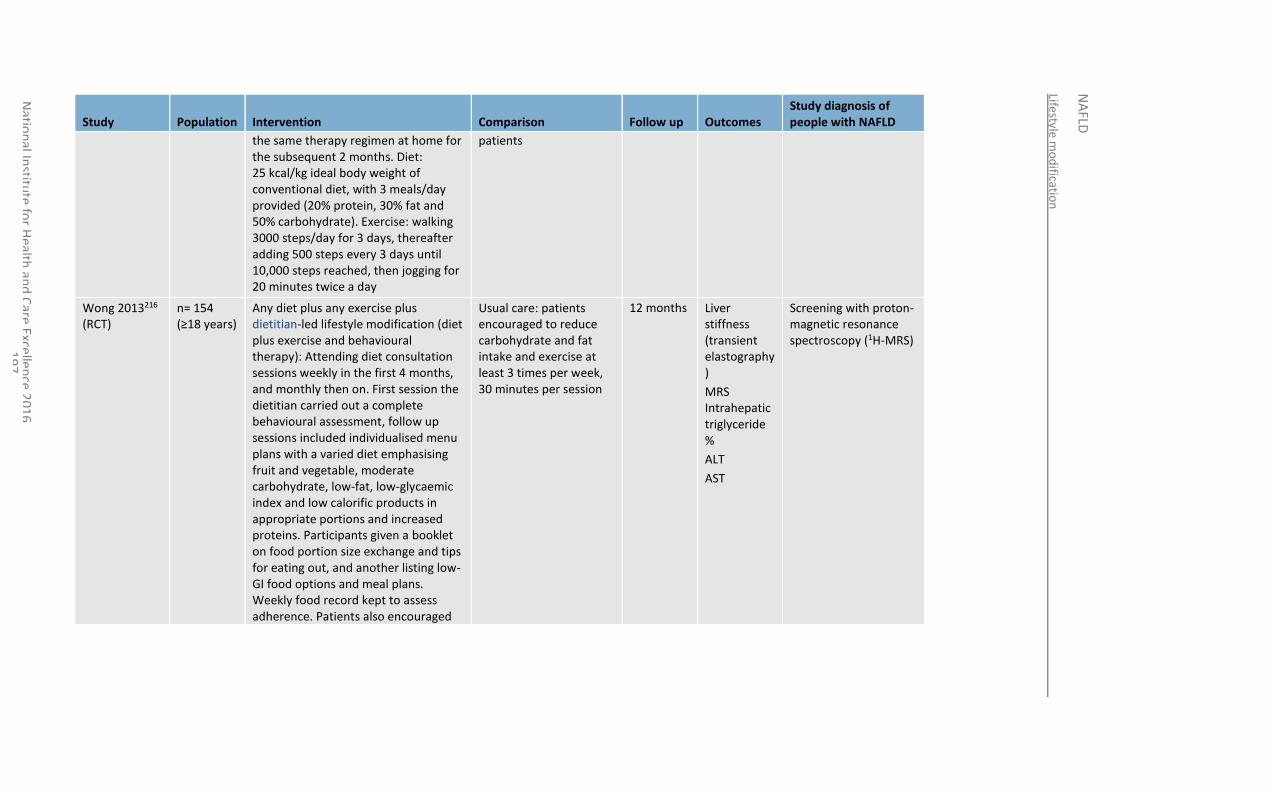
Lifestyle m
od
ification
NA
FLD
Natio
nal In
stitute
for H
ealth an
d C
are Excellen
ce 20
16
1
97
Study Population Intervention Comparison Follow up Outcomes Study diagnosis of people with NAFLD
the same therapy regimen at home for the subsequent 2 months. Diet: 25 kcal/kg ideal body weight of conventional diet, with 3 meals/day provided (20% protein, 30% fat and 50% carbohydrate). Exercise: walking 3000 steps/day for 3 days, thereafter adding 500 steps every 3 days until 10,000 steps reached, then jogging for 20 minutes twice a day
patients
Wong 2013216 (RCT)
n= 154 (≥18 years)
Any diet plus any exercise plus dietitian-led lifestyle modification (diet plus exercise and behavioural therapy): Attending diet consultation sessions weekly in the first 4 months, and monthly then on. First session the dietitian carried out a complete behavioural assessment, follow up sessions included individualised menu plans with a varied diet emphasising fruit and vegetable, moderate carbohydrate, low-fat, low-glycaemic index and low calorific products in appropriate portions and increased proteins. Participants given a booklet on food portion size exchange and tips for eating out, and another listing low-GI food options and meal plans. Weekly food record kept to assess adherence. Patients also encouraged
Usual care: patients encouraged to reduce carbohydrate and fat intake and exercise at least 3 times per week, 30 minutes per session
12 months Liver stiffness (transient elastography)
MRS Intrahepatic triglyceride %
ALT
AST
Screening with proton-magnetic resonance spectroscopy (1H-MRS)
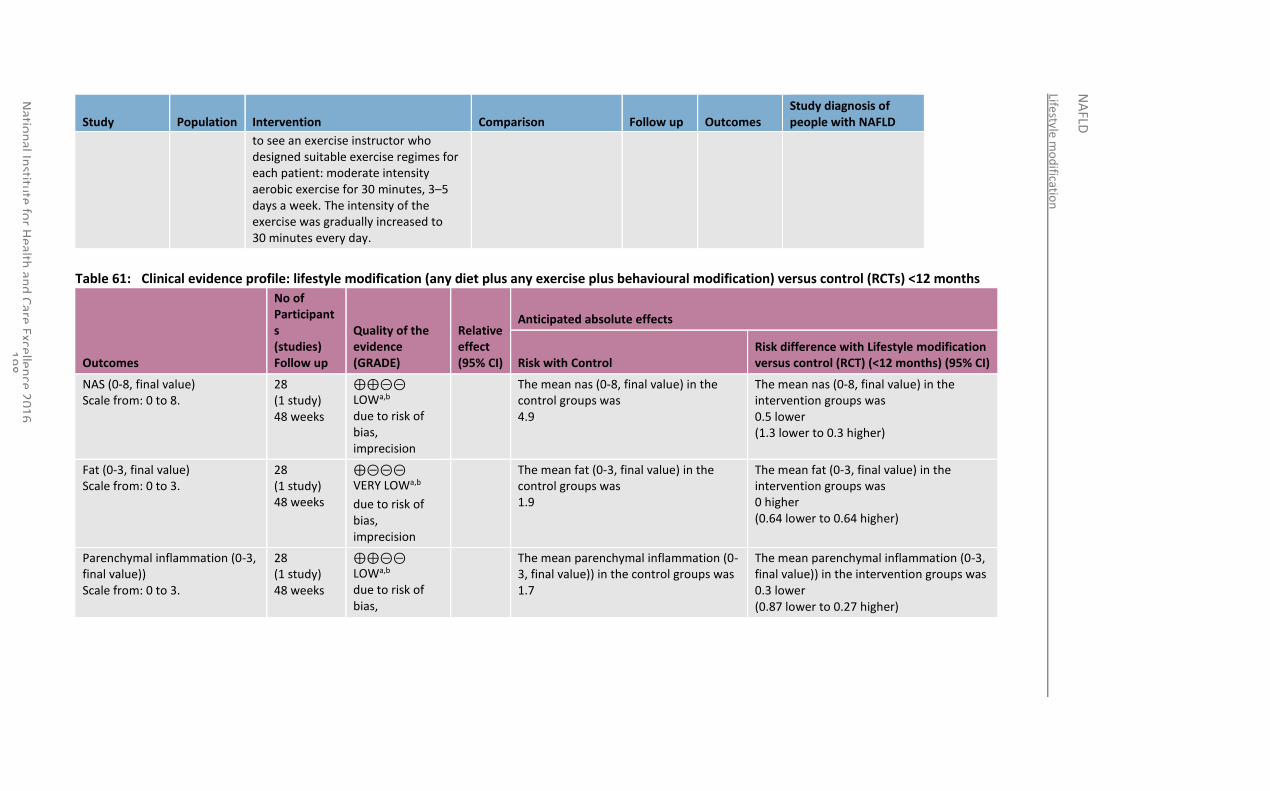
Lifestyle m
od
ification
NA
FLD
Natio
nal In
stitute
for H
ealth an
d C
are Excellen
ce 20
16
1
98
Study Population Intervention Comparison Follow up Outcomes Study diagnosis of people with NAFLD
to see an exercise instructor who designed suitable exercise regimes for each patient: moderate intensity aerobic exercise for 30 minutes, 3–5 days a week. The intensity of the exercise was gradually increased to 30 minutes every day.
Table 61: Clinical evidence profile: lifestyle modification (any diet plus any exercise plus behavioural modification) versus control (RCTs) <12 months
Outcomes
No of Participants (studies) Follow up
Quality of the evidence (GRADE)
Relative effect (95% CI)
Anticipated absolute effects
Risk with Control Risk difference with Lifestyle modification versus control (RCT) (<12 months) (95% CI)
NAS (0-8, final value) Scale from: 0 to 8.
28 (1 study) 48 weeks
⊕⊕⊝⊝ LOWa,b due to risk of bias, imprecision
The mean nas (0-8, final value) in the control groups was 4.9
The mean nas (0-8, final value) in the intervention groups was 0.5 lower (1.3 lower to 0.3 higher)
Fat (0-3, final value) Scale from: 0 to 3.
28 (1 study) 48 weeks
⊕⊝⊝⊝ VERY LOWa,b
due to risk of bias, imprecision
The mean fat (0-3, final value) in the control groups was 1.9
The mean fat (0-3, final value) in the intervention groups was 0 higher (0.64 lower to 0.64 higher)
Parenchymal inflammation (0-3, final value)) Scale from: 0 to 3.
28 (1 study) 48 weeks
⊕⊕⊝⊝ LOWa,b due to risk of bias,
The mean parenchymal inflammation (0-3, final value)) in the control groups was 1.7
The mean parenchymal inflammation (0-3, final value)) in the intervention groups was 0.3 lower (0.87 lower to 0.27 higher)
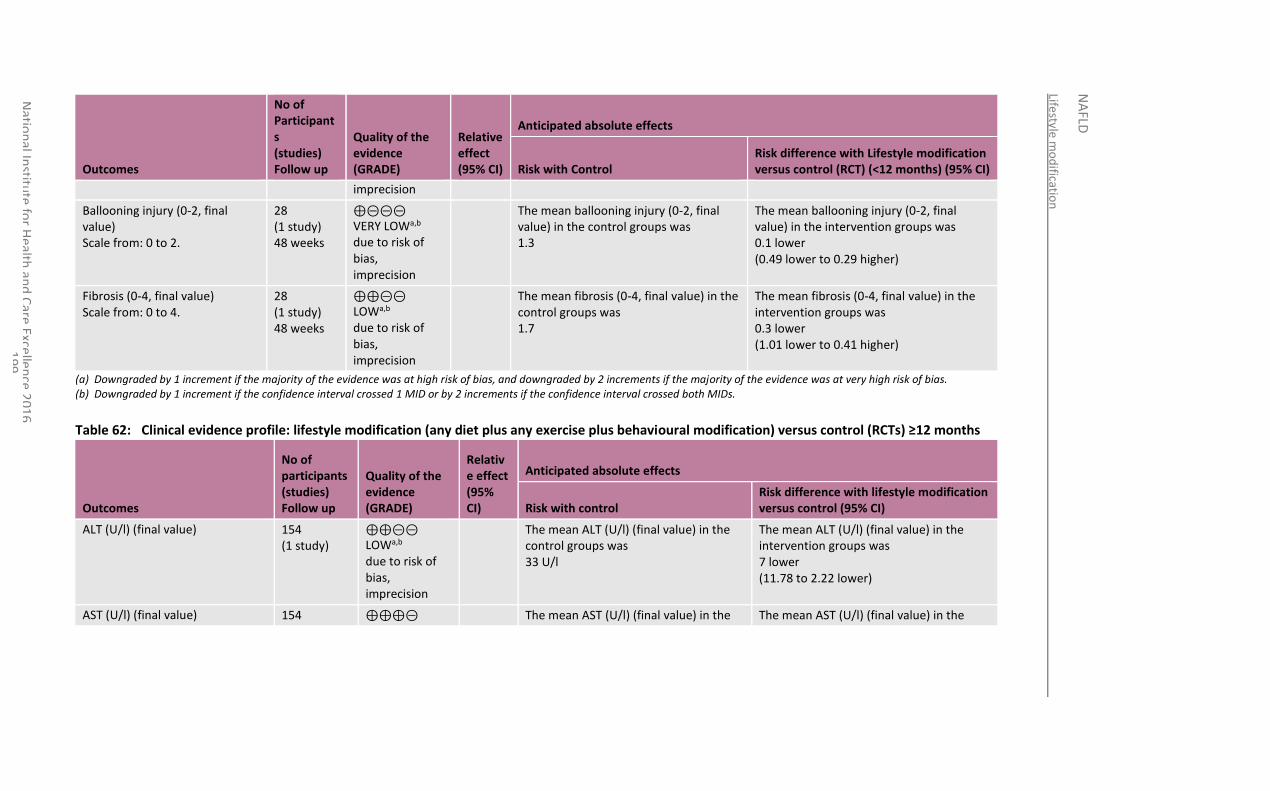
Lifestyle m
od
ification
NA
FLD
Natio
nal In
stitute
for H
ealth an
d C
are Excellen
ce 20
16
1
99
Outcomes
No of Participants (studies) Follow up
Quality of the evidence (GRADE)
Relative effect (95% CI)
Anticipated absolute effects
Risk with Control Risk difference with Lifestyle modification versus control (RCT) (<12 months) (95% CI)
imprecision
Ballooning injury (0-2, final value) Scale from: 0 to 2.
28 (1 study) 48 weeks
⊕⊝⊝⊝ VERY LOWa,b due to risk of bias, imprecision
The mean ballooning injury (0-2, final value) in the control groups was 1.3
The mean ballooning injury (0-2, final value) in the intervention groups was 0.1 lower (0.49 lower to 0.29 higher)
Fibrosis (0-4, final value) Scale from: 0 to 4.
28 (1 study) 48 weeks
⊕⊕⊝⊝ LOWa,b due to risk of bias, imprecision
The mean fibrosis (0-4, final value) in the control groups was 1.7
The mean fibrosis (0-4, final value) in the intervention groups was 0.3 lower (1.01 lower to 0.41 higher)
(a) Downgraded by 1 increment if the majority of the evidence was at high risk of bias, and downgraded by 2 increments if the majority of the evidence was at very high risk of bias. (b) Downgraded by 1 increment if the confidence interval crossed 1 MID or by 2 increments if the confidence interval crossed both MIDs.
Table 62: Clinical evidence profile: lifestyle modification (any diet plus any exercise plus behavioural modification) versus control (RCTs) ≥12 months
Outcomes
No of participants (studies) Follow up
Quality of the evidence (GRADE)
Relative effect (95% CI)
Anticipated absolute effects
Risk with control Risk difference with lifestyle modification versus control (95% CI)
ALT (U/l) (final value) 154 (1 study)
⊕⊕⊝⊝ LOWa,b due to risk of bias, imprecision
The mean ALT (U/l) (final value) in the control groups was 33 U/l
The mean ALT (U/l) (final value) in the intervention groups was 7 lower (11.78 to 2.22 lower)
AST (U/l) (final value) 154 ⊕⊕⊕⊝ The mean AST (U/l) (final value) in the The mean AST (U/l) (final value) in the
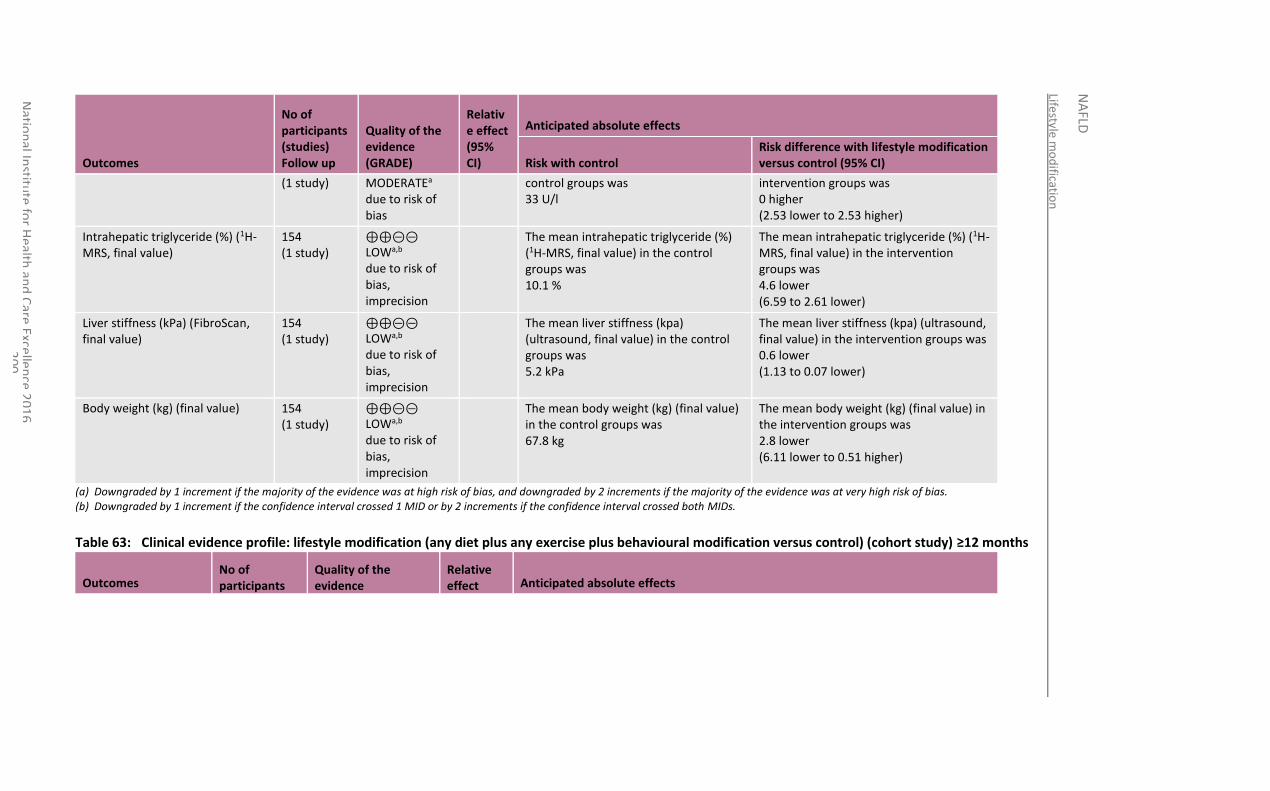
Lifestyle m
od
ification
NA
FLD
Natio
nal In
stitute
for H
ealth an
d C
are Excellen
ce 20
16
2
00
Outcomes
No of participants (studies) Follow up
Quality of the evidence (GRADE)
Relative effect (95% CI)
Anticipated absolute effects
Risk with control Risk difference with lifestyle modification versus control (95% CI)
(1 study) MODERATEa due to risk of bias
control groups was 33 U/l
intervention groups was 0 higher (2.53 lower to 2.53 higher)
Intrahepatic triglyceride (%) (1H-MRS, final value)
154 (1 study)
⊕⊕⊝⊝ LOWa,b due to risk of bias, imprecision
The mean intrahepatic triglyceride (%) (1H-MRS, final value) in the control groups was 10.1 %
The mean intrahepatic triglyceride (%) (1H-MRS, final value) in the intervention groups was 4.6 lower (6.59 to 2.61 lower)
Liver stiffness (kPa) (FibroScan, final value)
154 (1 study)
⊕⊕⊝⊝ LOWa,b due to risk of bias, imprecision
The mean liver stiffness (kpa) (ultrasound, final value) in the control groups was 5.2 kPa
The mean liver stiffness (kpa) (ultrasound, final value) in the intervention groups was 0.6 lower (1.13 to 0.07 lower)
Body weight (kg) (final value) 154 (1 study)
⊕⊕⊝⊝ LOWa,b due to risk of bias, imprecision
The mean body weight (kg) (final value) in the control groups was 67.8 kg
The mean body weight (kg) (final value) in the intervention groups was 2.8 lower (6.11 lower to 0.51 higher)
(a) Downgraded by 1 increment if the majority of the evidence was at high risk of bias, and downgraded by 2 increments if the majority of the evidence was at very high risk of bias. (b) Downgraded by 1 increment if the confidence interval crossed 1 MID or by 2 increments if the confidence interval crossed both MIDs.
Table 63: Clinical evidence profile: lifestyle modification (any diet plus any exercise plus behavioural modification versus control) (cohort study) ≥12 months
Outcomes No of participants
Quality of the evidence
Relative effect Anticipated absolute effects
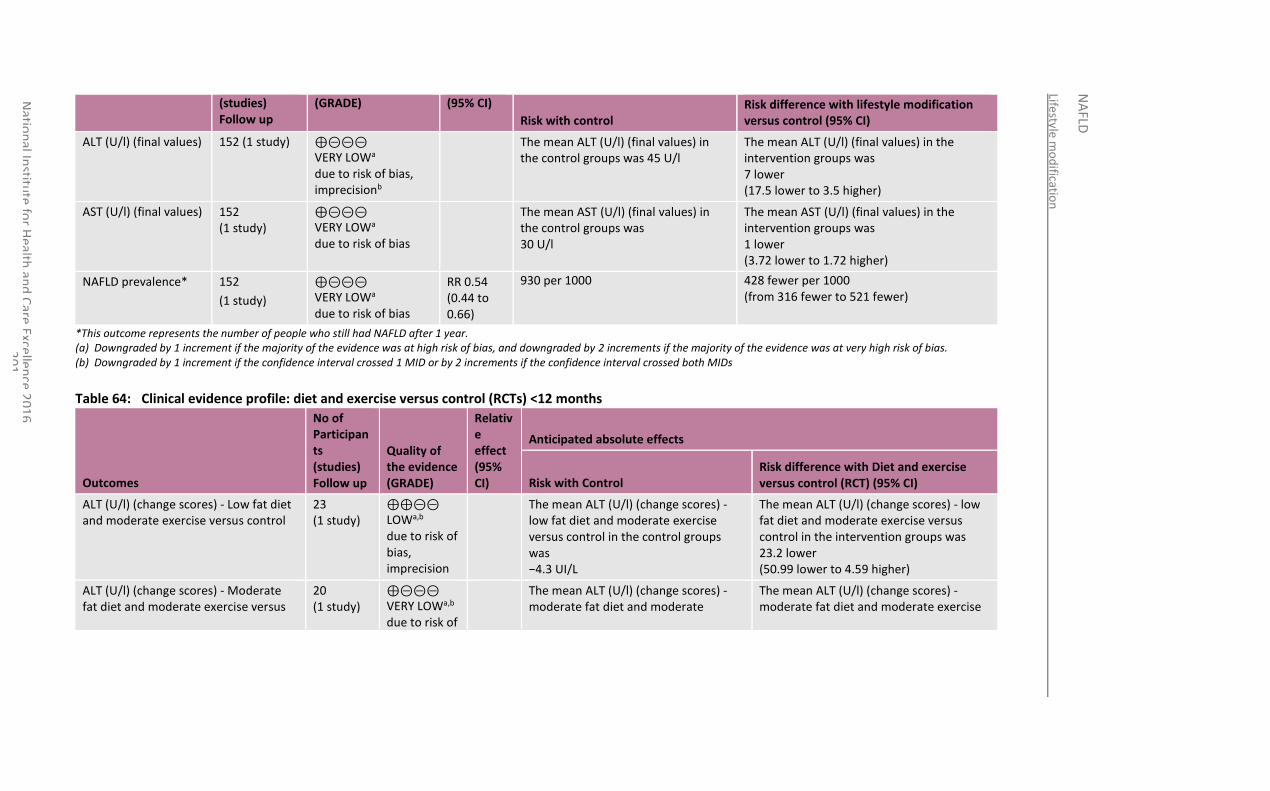
Lifestyle m
od
ification
NA
FLD
Natio
nal In
stitute
for H
ealth an
d C
are Excellen
ce 20
16
2
01
(studies) Follow up
(GRADE) (95% CI)
Risk with control Risk difference with lifestyle modification versus control (95% CI)
ALT (U/l) (final values) 152 (1 study) ⊕⊝⊝⊝ VERY LOWa due to risk of bias, imprecisionb
The mean ALT (U/l) (final values) in the control groups was 45 U/l
The mean ALT (U/l) (final values) in the intervention groups was 7 lower (17.5 lower to 3.5 higher)
AST (U/l) (final values) 152 (1 study)
⊕⊝⊝⊝ VERY LOWa due to risk of bias
The mean AST (U/l) (final values) in the control groups was 30 U/l
The mean AST (U/l) (final values) in the intervention groups was 1 lower (3.72 lower to 1.72 higher)
NAFLD prevalence* 152
(1 study)
⊕⊝⊝⊝ VERY LOWa due to risk of bias
RR 0.54 (0.44 to 0.66)
930 per 1000 428 fewer per 1000 (from 316 fewer to 521 fewer)
*This outcome represents the number of people who still had NAFLD after 1 year. (a) Downgraded by 1 increment if the majority of the evidence was at high risk of bias, and downgraded by 2 increments if the majority of the evidence was at very high risk of bias. (b) Downgraded by 1 increment if the confidence interval crossed 1 MID or by 2 increments if the confidence interval crossed both MIDs
Table 64: Clinical evidence profile: diet and exercise versus control (RCTs) <12 months
Outcomes
No of Participants (studies) Follow up
Quality of the evidence (GRADE)
Relative effect (95% CI)
Anticipated absolute effects
Risk with Control Risk difference with Diet and exercise versus control (RCT) (95% CI)
ALT (U/l) (change scores) - Low fat diet and moderate exercise versus control
23 (1 study)
⊕⊕⊝⊝ LOWa,b due to risk of bias, imprecision
The mean ALT (U/l) (change scores) - low fat diet and moderate exercise versus control in the control groups was −4.3 UI/L
The mean ALT (U/l) (change scores) - low fat diet and moderate exercise versus control in the intervention groups was 23.2 lower (50.99 lower to 4.59 higher)
ALT (U/l) (change scores) - Moderate fat diet and moderate exercise versus
20 (1 study)
⊕⊝⊝⊝ VERY LOWa,b due to risk of
The mean ALT (U/l) (change scores) - moderate fat diet and moderate
The mean ALT (U/l) (change scores) - moderate fat diet and moderate exercise
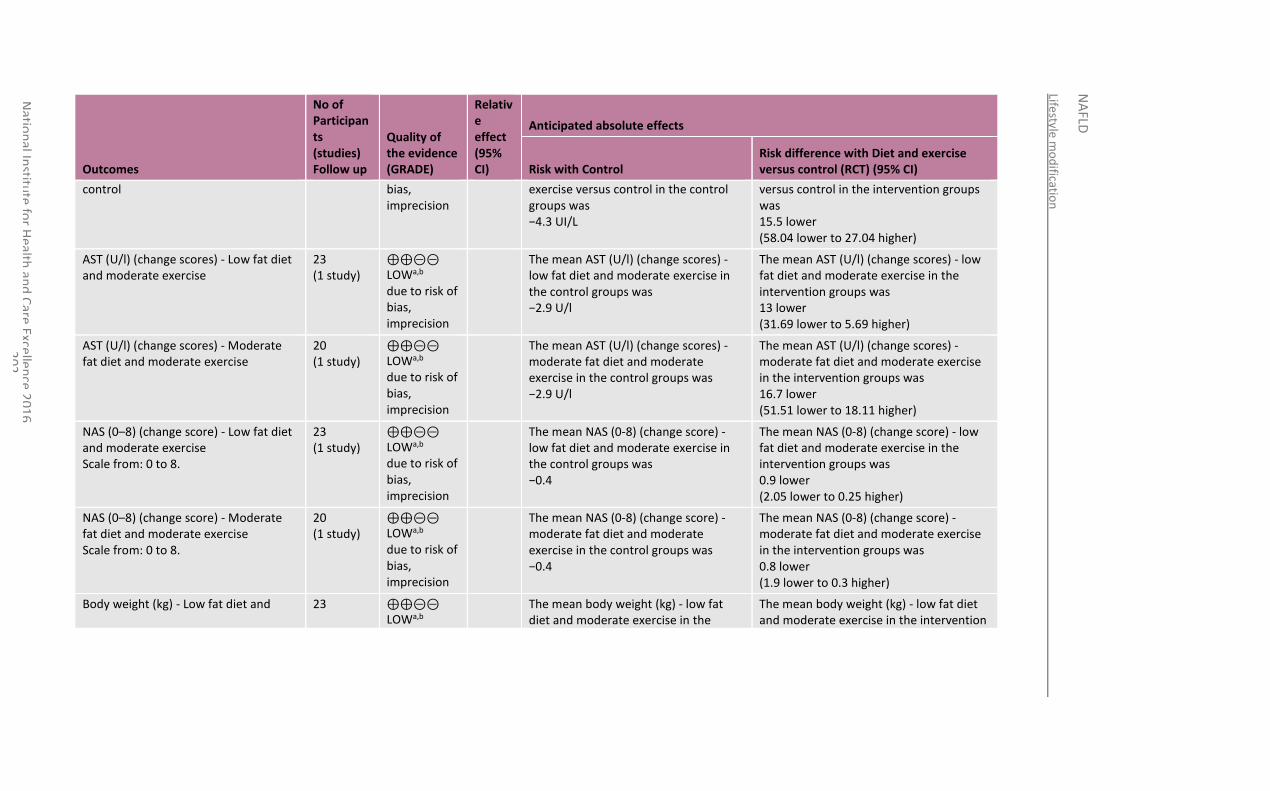
Lifestyle m
od
ification
NA
FLD
Natio
nal In
stitute
for H
ealth an
d C
are Excellen
ce 20
16
2
02
Outcomes
No of Participants (studies) Follow up
Quality of the evidence (GRADE)
Relative effect (95% CI)
Anticipated absolute effects
Risk with Control Risk difference with Diet and exercise versus control (RCT) (95% CI)
control bias, imprecision
exercise versus control in the control groups was −4.3 UI/L
versus control in the intervention groups was 15.5 lower (58.04 lower to 27.04 higher)
AST (U/l) (change scores) - Low fat diet and moderate exercise
23 (1 study)
⊕⊕⊝⊝ LOWa,b due to risk of bias, imprecision
The mean AST (U/l) (change scores) - low fat diet and moderate exercise in the control groups was −2.9 U/l
The mean AST (U/l) (change scores) - low fat diet and moderate exercise in the intervention groups was 13 lower (31.69 lower to 5.69 higher)
AST (U/l) (change scores) - Moderate fat diet and moderate exercise
20 (1 study)
⊕⊕⊝⊝ LOWa,b due to risk of bias, imprecision
The mean AST (U/l) (change scores) - moderate fat diet and moderate exercise in the control groups was −2.9 U/l
The mean AST (U/l) (change scores) - moderate fat diet and moderate exercise in the intervention groups was 16.7 lower (51.51 lower to 18.11 higher)
NAS (0–8) (change score) - Low fat diet and moderate exercise Scale from: 0 to 8.
23 (1 study)
⊕⊕⊝⊝ LOWa,b due to risk of bias, imprecision
The mean NAS (0-8) (change score) - low fat diet and moderate exercise in the control groups was −0.4
The mean NAS (0-8) (change score) - low fat diet and moderate exercise in the intervention groups was 0.9 lower (2.05 lower to 0.25 higher)
NAS (0–8) (change score) - Moderate fat diet and moderate exercise Scale from: 0 to 8.
20 (1 study)
⊕⊕⊝⊝ LOWa,b due to risk of bias, imprecision
The mean NAS (0-8) (change score) - moderate fat diet and moderate exercise in the control groups was −0.4
The mean NAS (0-8) (change score) - moderate fat diet and moderate exercise in the intervention groups was 0.8 lower (1.9 lower to 0.3 higher)
Body weight (kg) - Low fat diet and 23 ⊕⊕⊝⊝ LOWa,b
The mean body weight (kg) - low fat diet and moderate exercise in the
The mean body weight (kg) - low fat diet and moderate exercise in the intervention
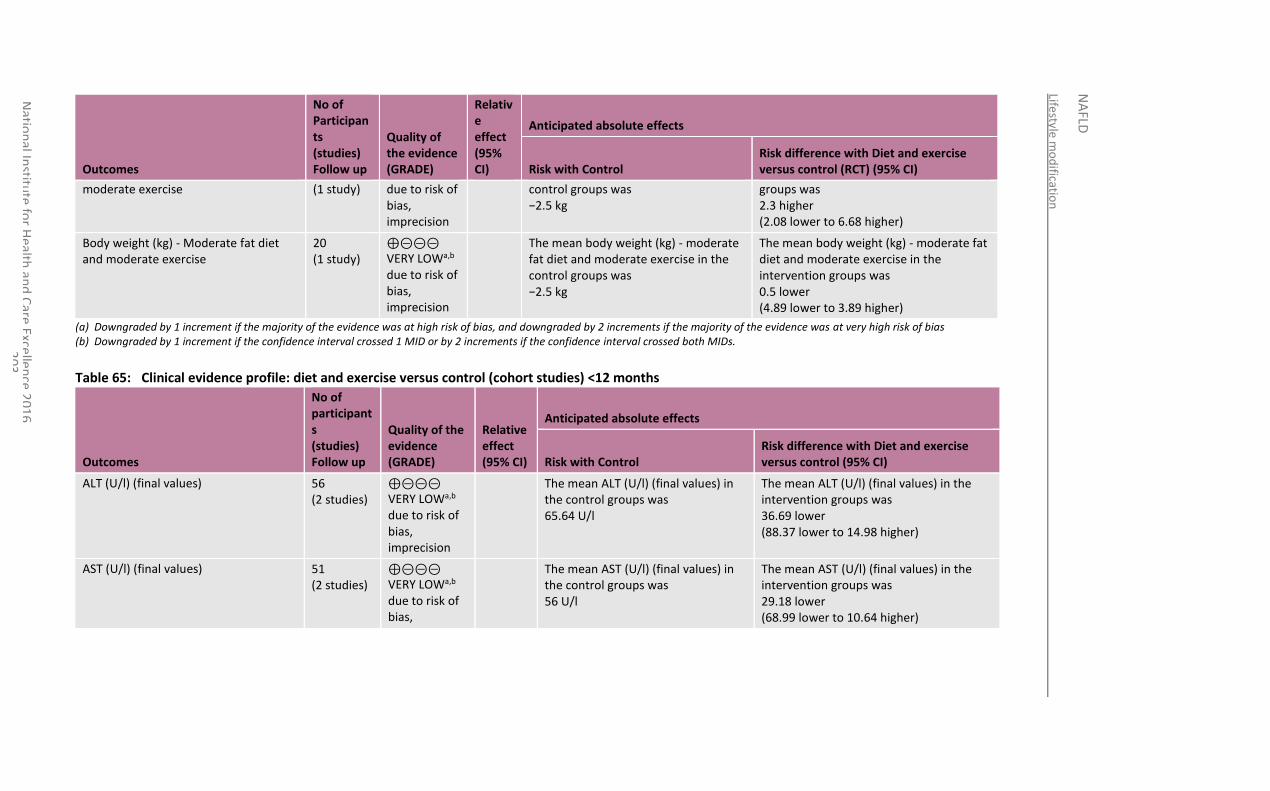
Lifestyle m
od
ification
NA
FLD
Natio
nal In
stitute
for H
ealth an
d C
are Excellen
ce 20
16
2
03
Outcomes
No of Participants (studies) Follow up
Quality of the evidence (GRADE)
Relative effect (95% CI)
Anticipated absolute effects
Risk with Control Risk difference with Diet and exercise versus control (RCT) (95% CI)
moderate exercise (1 study) due to risk of bias, imprecision
control groups was −2.5 kg
groups was 2.3 higher (2.08 lower to 6.68 higher)
Body weight (kg) - Moderate fat diet and moderate exercise
20 (1 study)
⊕⊝⊝⊝ VERY LOWa,b due to risk of bias, imprecision
The mean body weight (kg) - moderate fat diet and moderate exercise in the control groups was −2.5 kg
The mean body weight (kg) - moderate fat diet and moderate exercise in the intervention groups was 0.5 lower (4.89 lower to 3.89 higher)
(a) Downgraded by 1 increment if the majority of the evidence was at high risk of bias, and downgraded by 2 increments if the majority of the evidence was at very high risk of bias (b) Downgraded by 1 increment if the confidence interval crossed 1 MID or by 2 increments if the confidence interval crossed both MIDs.
Table 65: Clinical evidence profile: diet and exercise versus control (cohort studies) <12 months
Outcomes
No of participants (studies) Follow up
Quality of the evidence (GRADE)
Relative effect (95% CI)
Anticipated absolute effects
Risk with Control Risk difference with Diet and exercise versus control (95% CI)
ALT (U/l) (final values) 56 (2 studies)
⊕⊝⊝⊝ VERY LOWa,b due to risk of bias, imprecision
The mean ALT (U/l) (final values) in the control groups was 65.64 U/l
The mean ALT (U/l) (final values) in the intervention groups was 36.69 lower (88.37 lower to 14.98 higher)
AST (U/l) (final values) 51 (2 studies)
⊕⊝⊝⊝ VERY LOWa,b due to risk of bias,
The mean AST (U/l) (final values) in the control groups was 56 U/l
The mean AST (U/l) (final values) in the intervention groups was 29.18 lower (68.99 lower to 10.64 higher)
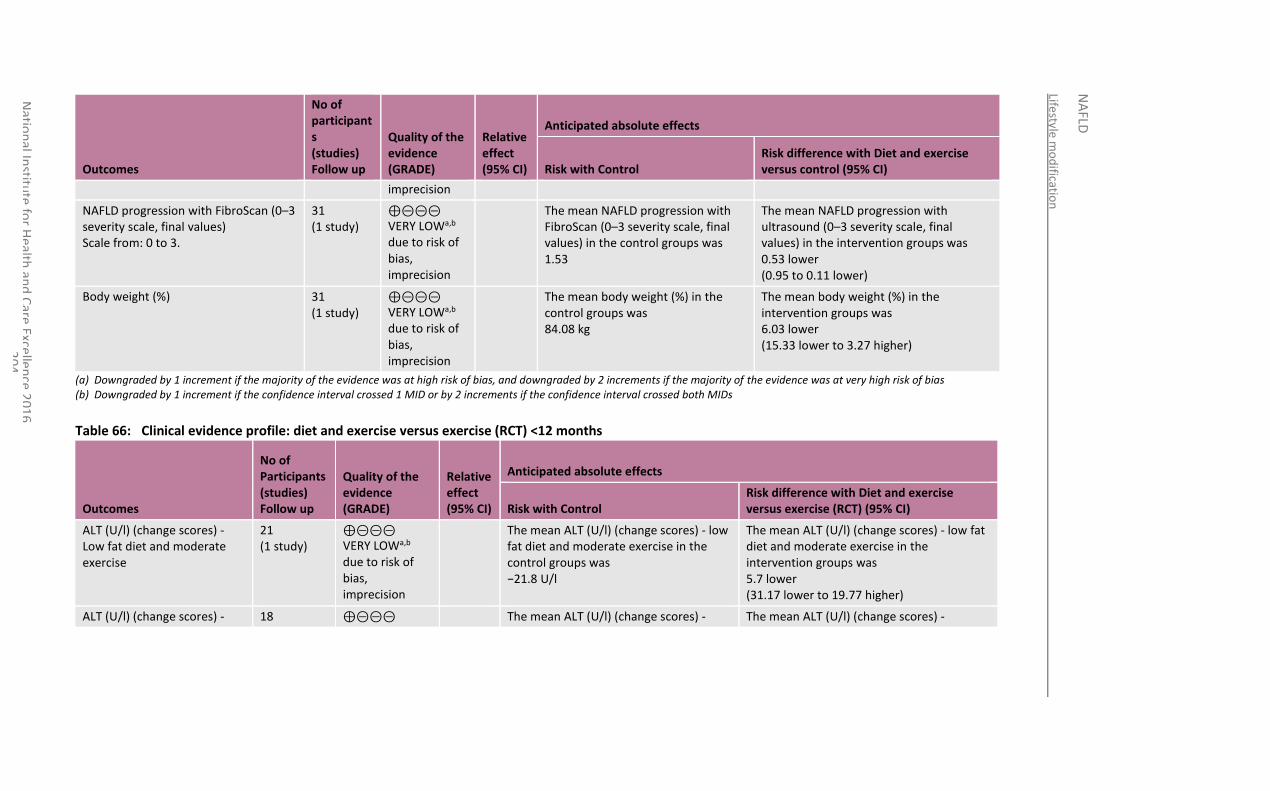
Lifestyle m
od
ification
NA
FLD
Natio
nal In
stitute
for H
ealth an
d C
are Excellen
ce 20
16
2
04
Outcomes
No of participants (studies) Follow up
Quality of the evidence (GRADE)
Relative effect (95% CI)
Anticipated absolute effects
Risk with Control Risk difference with Diet and exercise versus control (95% CI)
imprecision
NAFLD progression with FibroScan (0–3 severity scale, final values) Scale from: 0 to 3.
31 (1 study)
⊕⊝⊝⊝ VERY LOWa,b due to risk of bias, imprecision
The mean NAFLD progression with FibroScan (0–3 severity scale, final values) in the control groups was 1.53
The mean NAFLD progression with ultrasound (0–3 severity scale, final values) in the intervention groups was 0.53 lower (0.95 to 0.11 lower)
Body weight (%) 31 (1 study)
⊕⊝⊝⊝ VERY LOWa,b due to risk of bias, imprecision
The mean body weight (%) in the control groups was 84.08 kg
The mean body weight (%) in the intervention groups was 6.03 lower (15.33 lower to 3.27 higher)
(a) Downgraded by 1 increment if the majority of the evidence was at high risk of bias, and downgraded by 2 increments if the majority of the evidence was at very high risk of bias (b) Downgraded by 1 increment if the confidence interval crossed 1 MID or by 2 increments if the confidence interval crossed both MIDs
Table 66: Clinical evidence profile: diet and exercise versus exercise (RCT) <12 months
Outcomes
No of Participants (studies) Follow up
Quality of the evidence (GRADE)
Relative effect (95% CI)
Anticipated absolute effects
Risk with Control Risk difference with Diet and exercise versus exercise (RCT) (95% CI)
ALT (U/l) (change scores) - Low fat diet and moderate exercise
21 (1 study)
⊕⊝⊝⊝ VERY LOWa,b due to risk of bias, imprecision
The mean ALT (U/l) (change scores) - low fat diet and moderate exercise in the control groups was −21.8 U/l
The mean ALT (U/l) (change scores) - low fat diet and moderate exercise in the intervention groups was 5.7 lower (31.17 lower to 19.77 higher)
ALT (U/l) (change scores) - 18 ⊕⊝⊝⊝ The mean ALT (U/l) (change scores) - The mean ALT (U/l) (change scores) -
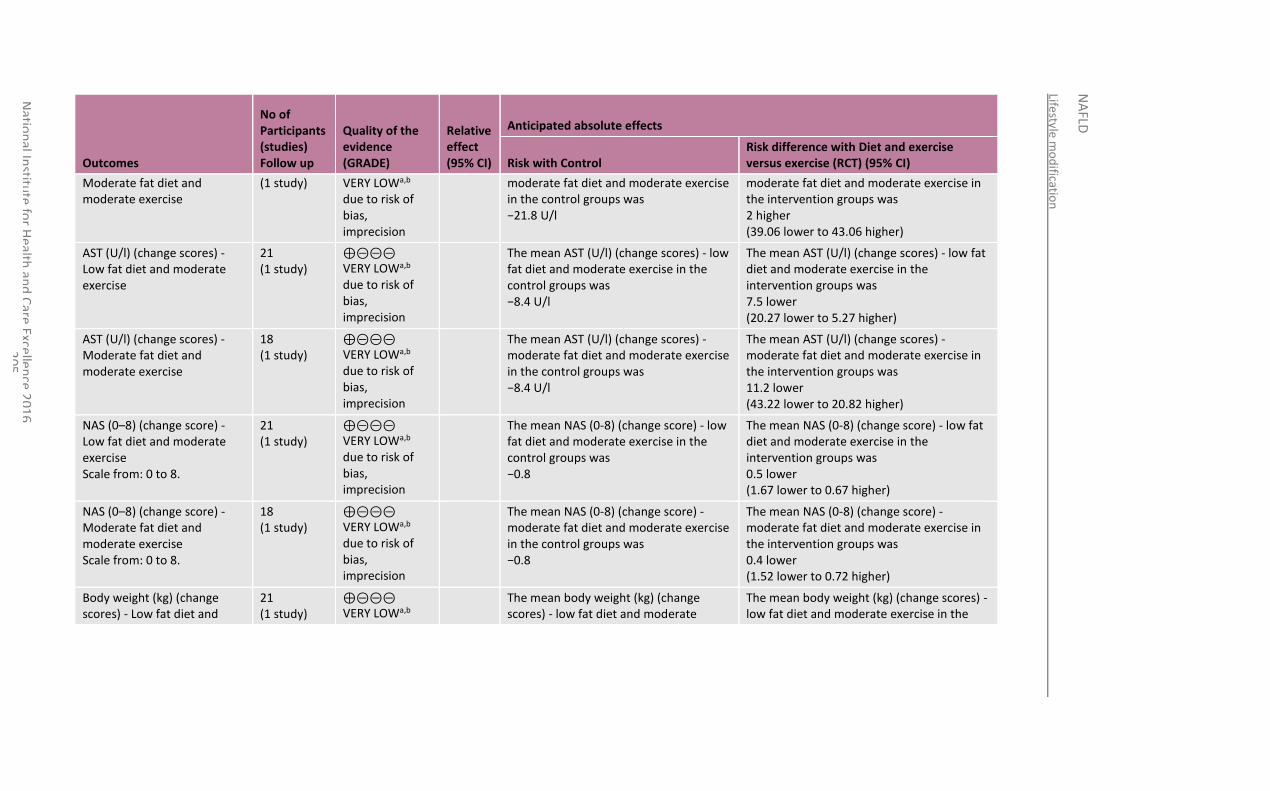
Lifestyle m
od
ification
NA
FLD
Natio
nal In
stitute
for H
ealth an
d C
are Excellen
ce 20
16
2
05
Outcomes
No of Participants (studies) Follow up
Quality of the evidence (GRADE)
Relative effect (95% CI)
Anticipated absolute effects
Risk with Control Risk difference with Diet and exercise versus exercise (RCT) (95% CI)
Moderate fat diet and moderate exercise
(1 study) VERY LOWa,b due to risk of bias, imprecision
moderate fat diet and moderate exercise in the control groups was −21.8 U/l
moderate fat diet and moderate exercise in the intervention groups was 2 higher (39.06 lower to 43.06 higher)
AST (U/l) (change scores) - Low fat diet and moderate exercise
21 (1 study)
⊕⊝⊝⊝ VERY LOWa,b due to risk of bias, imprecision
The mean AST (U/l) (change scores) - low fat diet and moderate exercise in the control groups was −8.4 U/l
The mean AST (U/l) (change scores) - low fat diet and moderate exercise in the intervention groups was 7.5 lower (20.27 lower to 5.27 higher)
AST (U/l) (change scores) - Moderate fat diet and moderate exercise
18 (1 study)
⊕⊝⊝⊝ VERY LOWa,b due to risk of bias, imprecision
The mean AST (U/l) (change scores) - moderate fat diet and moderate exercise in the control groups was −8.4 U/l
The mean AST (U/l) (change scores) - moderate fat diet and moderate exercise in the intervention groups was 11.2 lower (43.22 lower to 20.82 higher)
NAS (0–8) (change score) - Low fat diet and moderate exercise Scale from: 0 to 8.
21 (1 study)
⊕⊝⊝⊝ VERY LOWa,b due to risk of bias, imprecision
The mean NAS (0-8) (change score) - low fat diet and moderate exercise in the control groups was −0.8
The mean NAS (0-8) (change score) - low fat diet and moderate exercise in the intervention groups was 0.5 lower (1.67 lower to 0.67 higher)
NAS (0–8) (change score) - Moderate fat diet and moderate exercise Scale from: 0 to 8.
18 (1 study)
⊕⊝⊝⊝ VERY LOWa,b due to risk of bias, imprecision
The mean NAS (0-8) (change score) - moderate fat diet and moderate exercise in the control groups was −0.8
The mean NAS (0-8) (change score) - moderate fat diet and moderate exercise in the intervention groups was 0.4 lower (1.52 lower to 0.72 higher)
Body weight (kg) (change scores) - Low fat diet and
21 (1 study)
⊕⊝⊝⊝ VERY LOWa,b
The mean body weight (kg) (change scores) - low fat diet and moderate
The mean body weight (kg) (change scores) - low fat diet and moderate exercise in the
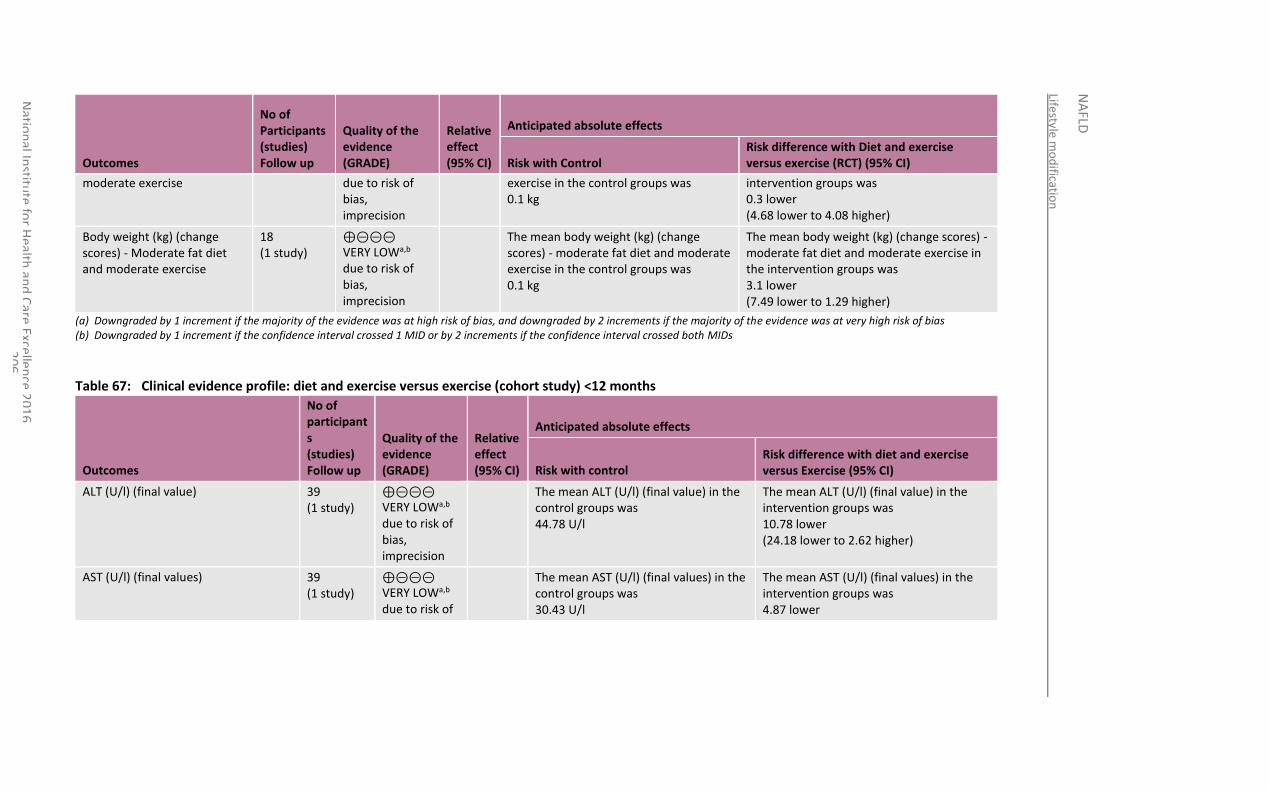
Lifestyle m
od
ification
NA
FLD
Natio
nal In
stitute
for H
ealth an
d C
are Excellen
ce 20
16
2
06
Outcomes
No of Participants (studies) Follow up
Quality of the evidence (GRADE)
Relative effect (95% CI)
Anticipated absolute effects
Risk with Control Risk difference with Diet and exercise versus exercise (RCT) (95% CI)
moderate exercise due to risk of bias, imprecision
exercise in the control groups was 0.1 kg
intervention groups was 0.3 lower (4.68 lower to 4.08 higher)
Body weight (kg) (change scores) - Moderate fat diet and moderate exercise
18 (1 study)
⊕⊝⊝⊝ VERY LOWa,b due to risk of bias, imprecision
The mean body weight (kg) (change scores) - moderate fat diet and moderate exercise in the control groups was 0.1 kg
The mean body weight (kg) (change scores) - moderate fat diet and moderate exercise in the intervention groups was 3.1 lower (7.49 lower to 1.29 higher)
(a) Downgraded by 1 increment if the majority of the evidence was at high risk of bias, and downgraded by 2 increments if the majority of the evidence was at very high risk of bias (b) Downgraded by 1 increment if the confidence interval crossed 1 MID or by 2 increments if the confidence interval crossed both MIDs
Table 67: Clinical evidence profile: diet and exercise versus exercise (cohort study) <12 months
Outcomes
No of participants (studies) Follow up
Quality of the evidence (GRADE)
Relative effect (95% CI)
Anticipated absolute effects
Risk with control Risk difference with diet and exercise versus Exercise (95% CI)
ALT (U/l) (final value) 39 (1 study)
⊕⊝⊝⊝ VERY LOWa,b due to risk of bias, imprecision
The mean ALT (U/l) (final value) in the control groups was 44.78 U/l
The mean ALT (U/l) (final value) in the intervention groups was 10.78 lower (24.18 lower to 2.62 higher)
AST (U/l) (final values) 39 (1 study)
⊕⊝⊝⊝ VERY LOWa,b due to risk of
The mean AST (U/l) (final values) in the control groups was 30.43 U/l
The mean AST (U/l) (final values) in the intervention groups was 4.87 lower
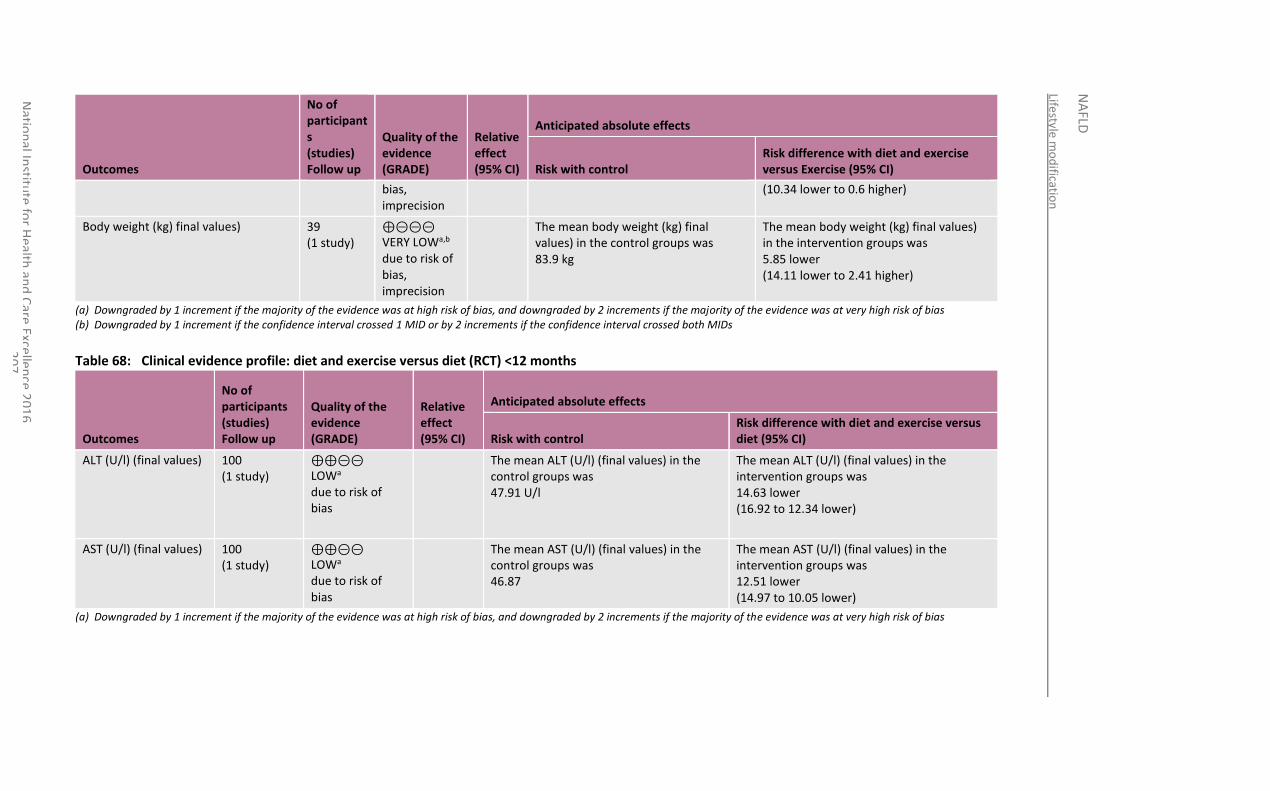
Lifestyle m
od
ification
NA
FLD
Natio
nal In
stitute
for H
ealth an
d C
are Excellen
ce 20
16
2
07
Outcomes
No of participants (studies) Follow up
Quality of the evidence (GRADE)
Relative effect (95% CI)
Anticipated absolute effects
Risk with control Risk difference with diet and exercise versus Exercise (95% CI)
bias, imprecision
(10.34 lower to 0.6 higher)
Body weight (kg) final values) 39 (1 study)
⊕⊝⊝⊝ VERY LOWa,b due to risk of bias, imprecision
The mean body weight (kg) final values) in the control groups was 83.9 kg
The mean body weight (kg) final values) in the intervention groups was 5.85 lower (14.11 lower to 2.41 higher)
(a) Downgraded by 1 increment if the majority of the evidence was at high risk of bias, and downgraded by 2 increments if the majority of the evidence was at very high risk of bias (b) Downgraded by 1 increment if the confidence interval crossed 1 MID or by 2 increments if the confidence interval crossed both MIDs
Table 68: Clinical evidence profile: diet and exercise versus diet (RCT) <12 months
Outcomes
No of participants (studies) Follow up
Quality of the evidence (GRADE)
Relative effect (95% CI)
Anticipated absolute effects
Risk with control Risk difference with diet and exercise versus diet (95% CI)
ALT (U/l) (final values) 100 (1 study)
⊕⊕⊝⊝ LOWa due to risk of bias
The mean ALT (U/l) (final values) in the control groups was 47.91 U/l
The mean ALT (U/l) (final values) in the intervention groups was 14.63 lower (16.92 to 12.34 lower)
AST (U/l) (final values) 100 (1 study)
⊕⊕⊝⊝ LOWa due to risk of bias
The mean AST (U/l) (final values) in the control groups was 46.87
The mean AST (U/l) (final values) in the intervention groups was 12.51 lower (14.97 to 10.05 lower)
(a) Downgraded by 1 increment if the majority of the evidence was at high risk of bias, and downgraded by 2 increments if the majority of the evidence was at very high risk of bias

Lifestyle m
od
ification
NA
FLD
Natio
nal In
stitute
for H
ealth an
d C
are Excellen
ce 20
16
2
08
National Institute for Health and Care Excellence 2016
NAFLD
Lifestyle modification
209
13.4 Economic evidence
13.4.1 Published literature
No relevant economic evaluations were identified.
See also the economic article selection flow chart in Appendix F.
13.4.2 Review of economic evidence from NICE public health guidance
Relevant economic evidence was identified in recent NICE public health guidance that looked at overweight and obese people (with no reference to whether they also had NAFLD): PH53 (2014) ‘Managing overweight and obesity in adults’121 and PH47 (2013) ‘Managing overweight and obesity among children and young people’.119 PH53 included a clinical review of behavioural weight management programme (BWMP) versus control, a clinical review of multicomponent BWMP, and an original economic evaluation in the form of a decision model. PH47 included a systematic literature review considering both clinical and economic evidence and an original economic model.
A summary of the relevant evidence from PH47 and PH53 can be found in Appendix P.
13.5 Evidence statements
13.5.1 Clinical
Lifestyle modification (diet, exercise and behavioural modification) versus control
The clinical benefit of lifestyle modification on the progression of NAFLD was observed in a RCT at less than 12 months (n=154) and another RCT at more than or equal to 12 months (n=28). Clinical benefits of lifestyle modification at less than 12 months were seen on the improvement of NAFLD activity score (low quality), parenchymal inflammation (low quality), ballooning injury (very low quality) and fibrosis (low quality) when compared to education. There was no clinically important difference seen in the level of liver fat (very low quality) between the lifestyle modification and education groups. Clinical benefits of lifestyle modification at more than or equal to 12 months were seen on the percentage of intrahepatic triglycerides (low quality) and liver stiffness (low quality) when compared to usual care. The clinical benefit of lifestyle modification on the progression of NAFLD was also seen in a cohort study (n=152) through an increased reduction of NAFLD prevalence at more than or equal to 12 months when compared to a control group receiving advice (very low quality).
Evidence from a single RCT (n=28) and a cohort study (n=152) demonstrated clinical benefit of lifestyle modification on ALT levels at more than or equal to 12 months when compared to usual care (low quality) and advice (very low quality) respectively. However, no clinically important difference was seen on AST levels from either the RCT (moderate quality) or cohort study (very low quality).
Possible clinical benefit of lifestyle modification was observed at more than or equal to 12 months from a single RCT (n=28) on body weight (low quality) when compared to usual care.
Diet and exercise versus control
A single RCT demonstrated clinical benefit of a low fat diet with moderate exercise (n= 23) and a moderate fat diet with moderate exercise (n=20) on NAFLD progression through the NAFLD activity score at less than 12 months when compared to standard care (low quality). A cohort study (n=31) also demonstrated the clinical benefit of diet and exercise on NAFLD progression measured using transient elastography (FibroScan) at less than 12 months when compared to the control group (very low quality).
RCT evidence demonstrated clinical benefit of the low fat diet with moderate exercise on ALT and AST levels at less than 12 months when compared to standard care (low quality). However, no clinically important difference was seen on ALT (very low quality) and AST
National Institute for Health and Care Excellence 2016
NAFLD
Lifestyle modification
210
levels (low quality) for the moderate fat diet with moderate exercise when compared to standard care. Evidence from 2 cohort studies demonstrated clinical benefit of diet and exercise on ALT (n=56) and AST levels (n=51) at less than 12 months (very low quality) when compared to control. RCT evidence also showed clinical benefit of the low fat diet with moderate exercise at less than 12 months on body weight at when compared to standard care (low quality), with no clinically important difference seen for the moderate fat diet with moderate exercise when compared to standard care (very low quality) at less than 12 months. Evidence from a cohort study (n=31) also showed clinical benefit of diet and exercise on body weight at less than 12 months when compared to control (very low quality).
Diet and exercise versus exercise
A single RCT demonstrated no clinically important difference of a low fat diet with moderate exercise (n=21) or a moderate fat diet with moderate exercise (n=18) on NAFLD progression when compared to exercise alone at less than 12 months, with the direction of effect favouring diet and exercise (very low quality).
Evidence form the RCT demonstrated no clinically important difference of either the low fat diet with moderate exercise or moderate fat diet with moderate exercise on ALT or AST levels when compared to exercise alone at less than 12 months (very low quality), with the direction of effect for AST levels favouring diet and exercise.
The RCT also demonstrated clinically important benefit of the moderate fat diet with moderate exercise (very low quality) on body weight when compared to exercise alone at less than 12 months, however no clinically important difference of the low fat diet with moderate exercises and exercise alone was seen (very low quality).
Evidence from a cohort study (n=39) demonstrated clinical benefit of diet and exercise on body weight when compared to exercise alone at less than 12 months (very low quality).
Diet and exercise versus diet
A single RCT (n=39) demonstrated the clinical benefit of diet and exercise on ALT and AST levels when compared to diet alone at less than 12 months (low quality).
13.5.2 Economic
No relevant economic evaluations were identified.
13.6 Recommendations and link to evidence
Recommendation 22. Consider the lifestyle interventions in NICE’s obesity guideline for people with NAFLD regardless of their BMI.
Relative values of different outcomes
The GDG agreed that the outcomes that were critical to decision-making were progression of NAFLD, quality of life and serious adverse events. Progression of NAFLD as measured by liver biopsy was considered of greatest value for decision-making (although only 1 study used change in NAS score on liver biopsy as a primary outcome measure). The GDG agreed that other outcomes described within the identified evidence were also of clinical relevance; specifically, improvements in MRS intrahepatic triglyceride and improvements in transient elastography scores. Reduction in liver enzyme values, loss of weight and non-serious adverse events were all agreed to be appropriate potential surrogate markers for improvement in NAFLD and therefore considered as important outcomes. Absence of steatosis (as shown in 1 study) was also considered to be of clinical relevance.
Trade-off between clinical benefits and harms
The GDG agreed that, in general, the dietary, exercise and behavioural interventions described in the included studies were interventions that were practical to offer to adults, children and young people with NAFLD. Researchers had taken measures to ensure compliance with the interventions being delivered (for example, food diary
National Institute for Health and Care Excellence 2016
NAFLD
Lifestyle modification
211
monitoring of study participants by dietitians).
The GDG noted that 1 study examining changes in liver biopsy scores in people with NAFLD after a lifestyle modification intervention (which used a dietary and exercise intervention) demonstrated no significant change in biopsy scores between participants receiving the lifestyle intervention and those receiving standard care, although there was a trend to improvement with the intervention. In addition, the GDG observed that the included studies consistently demonstrated a pattern of improvement in other relevant outcomes (including MRS intrahepatic triglyceride, transient elastography scores and liver enzymes) to a clinically significant degree. The trend for improvement with lifestyle modification interventions appeared to occur independently of weight loss, and was also seen in children and young people. The greatest reduction in NAFLD prevalence was seen in those who lost the most weight, as shown by absence of steatosis assessed by ultrasound. It was agreed this is consistent with evidence from the review of exercise interventions and it was noted that weight loss is not the primary factor, as calorie-burning does not directly translate into health gain and the health benefits are independent of weight loss.
The GDG noted that the benefits of lifestyle modification in people with NAFLD appeared to be most pronounced in those who were obese, however, this could not be evaluated in more detail as BMI was not a pre-specified sub-group in the review protocol. Comparison of the evidence in which participants received very intensive, personalised dietary and exercise interventions with that in which participants received standard dietary and exercise interventions, without behavioural modification, led the GDG to conclude that lifestyle modification interventions with a behavioural component may be more clinically effective than those without. However, the evidence was not strong enough to specify this as a required component of the intervention in the recommendation.
The GDG felt that lifestyle modification had some clinical benefit with improvements in NAFLD activity score, parenchymal inflammation, ballooning injury, fibrosis and body weight. The GDG also felt that lifestyle modification had some clinical benefit on NAFLD prevalence and ALT levels over usual care.
Overall, the GDG concluded that the evidence assessed was compelling for demonstrating an improvement in clinically relevant outcomes in adults, children and young people with NAFLD, of all BMIs, receiving lifestyle modification interventions. Lifestyle modification strategies are already recommended by NICE for people who are obese or overweight as part of public health guidance (see PH53 Recommendation 6 and PH47 Recommendation 8) and the NICE guideline on obesity CG189. The GDG noted that, in addition to the benefits that these interventions provide in terms of weight loss and reduced risk of cardiovascular disease (assessed in the public health guidance), there is also evidence that they provide the additional benefit of reducing the rate of NAFLD progression, and so those recommendations should extend to people with NAFLD. While most interventions are aimed at people with BMI over 25, evidence included in this review suggested that lifestyle modification programmes can be beneficial in populations that include people with NAFLD and a BMI lower than 25.The cost implication of considering lifestyle modification programmes for people with NAFLD regardless of BMI is discussed further below.
Trade-off between net clinical effects and costs
No relevant economic evaluations were identified within the published literature of lifestyle interventions in people with NAFLD.
In the absence of such direct evidence, the GDG considered recent NICE public
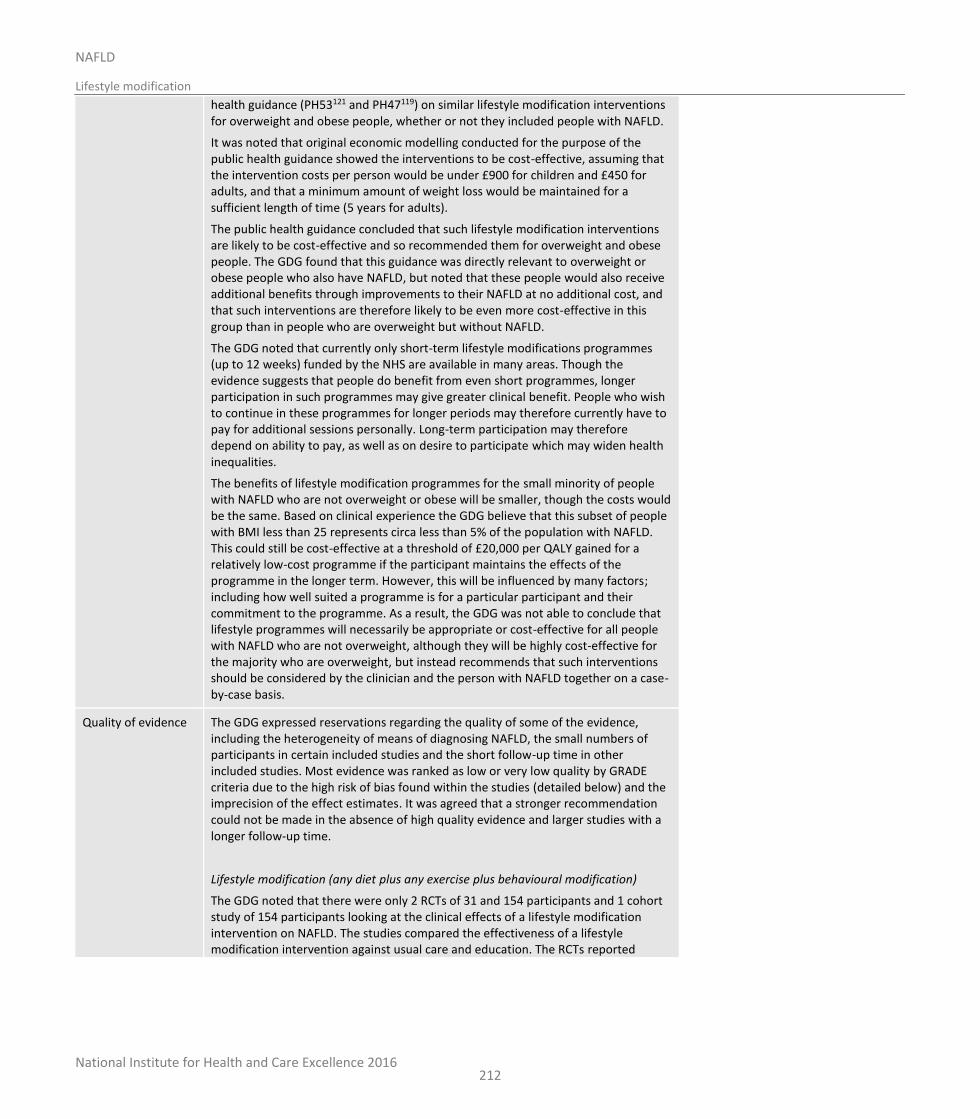
National Institute for Health and Care Excellence 2016
NAFLD
Lifestyle modification
212
health guidance (PH53121 and PH47119) on similar lifestyle modification interventions for overweight and obese people, whether or not they included people with NAFLD.
It was noted that original economic modelling conducted for the purpose of the public health guidance showed the interventions to be cost-effective, assuming that the intervention costs per person would be under £900 for children and £450 for adults, and that a minimum amount of weight loss would be maintained for a sufficient length of time (5 years for adults).
The public health guidance concluded that such lifestyle modification interventions are likely to be cost-effective and so recommended them for overweight and obese people. The GDG found that this guidance was directly relevant to overweight or obese people who also have NAFLD, but noted that these people would also receive additional benefits through improvements to their NAFLD at no additional cost, and that such interventions are therefore likely to be even more cost-effective in this group than in people who are overweight but without NAFLD.
The GDG noted that currently only short-term lifestyle modifications programmes (up to 12 weeks) funded by the NHS are available in many areas. Though the evidence suggests that people do benefit from even short programmes, longer participation in such programmes may give greater clinical benefit. People who wish to continue in these programmes for longer periods may therefore currently have to pay for additional sessions personally. Long-term participation may therefore depend on ability to pay, as well as on desire to participate which may widen health inequalities.
The benefits of lifestyle modification programmes for the small minority of people with NAFLD who are not overweight or obese will be smaller, though the costs would be the same. Based on clinical experience the GDG believe that this subset of people with BMI less than 25 represents circa less than 5% of the population with NAFLD. This could still be cost-effective at a threshold of £20,000 per QALY gained for a relatively low-cost programme if the participant maintains the effects of the programme in the longer term. However, this will be influenced by many factors; including how well suited a programme is for a particular participant and their commitment to the programme. As a result, the GDG was not able to conclude that lifestyle programmes will necessarily be appropriate or cost-effective for all people with NAFLD who are not overweight, although they will be highly cost-effective for the majority who are overweight, but instead recommends that such interventions should be considered by the clinician and the person with NAFLD together on a case-by-case basis.
Quality of evidence The GDG expressed reservations regarding the quality of some of the evidence, including the heterogeneity of means of diagnosing NAFLD, the small numbers of participants in certain included studies and the short follow-up time in other included studies. Most evidence was ranked as low or very low quality by GRADE criteria due to the high risk of bias found within the studies (detailed below) and the imprecision of the effect estimates. It was agreed that a stronger recommendation could not be made in the absence of high quality evidence and larger studies with a longer follow-up time.
Lifestyle modification (any diet plus any exercise plus behavioural modification)
The GDG noted that there were only 2 RCTs of 31 and 154 participants and 1 cohort study of 154 participants looking at the clinical effects of a lifestyle modification intervention on NAFLD. The studies compared the effectiveness of a lifestyle modification intervention against usual care and education. The RCTs reported
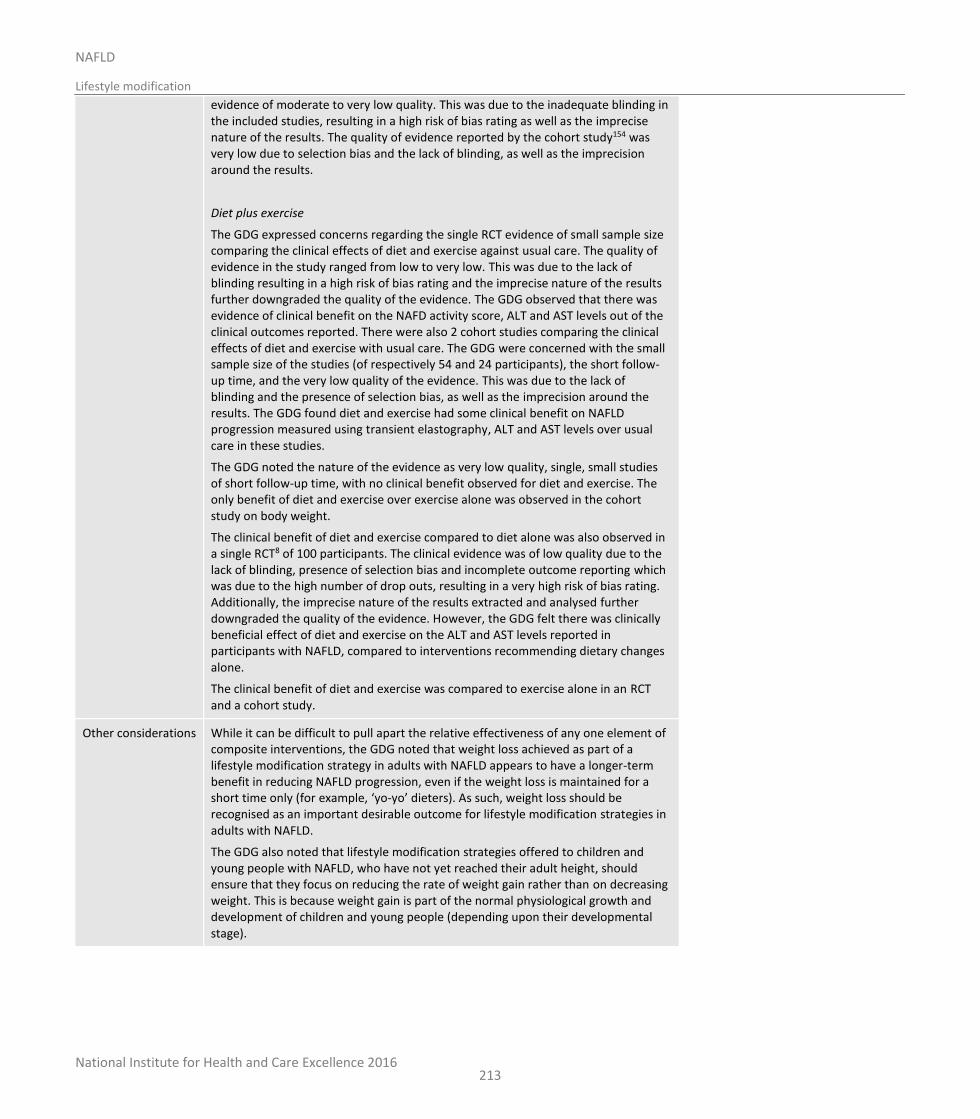
National Institute for Health and Care Excellence 2016
NAFLD
Lifestyle modification
213
evidence of moderate to very low quality. This was due to the inadequate blinding in the included studies, resulting in a high risk of bias rating as well as the imprecise nature of the results. The quality of evidence reported by the cohort study154 was very low due to selection bias and the lack of blinding, as well as the imprecision around the results.
Diet plus exercise
The GDG expressed concerns regarding the single RCT evidence of small sample size comparing the clinical effects of diet and exercise against usual care. The quality of evidence in the study ranged from low to very low. This was due to the lack of blinding resulting in a high risk of bias rating and the imprecise nature of the results further downgraded the quality of the evidence. The GDG observed that there was evidence of clinical benefit on the NAFD activity score, ALT and AST levels out of the clinical outcomes reported. There were also 2 cohort studies comparing the clinical effects of diet and exercise with usual care. The GDG were concerned with the small sample size of the studies (of respectively 54 and 24 participants), the short follow-up time, and the very low quality of the evidence. This was due to the lack of blinding and the presence of selection bias, as well as the imprecision around the results. The GDG found diet and exercise had some clinical benefit on NAFLD progression measured using transient elastography, ALT and AST levels over usual care in these studies.
The GDG noted the nature of the evidence as very low quality, single, small studies of short follow-up time, with no clinical benefit observed for diet and exercise. The only benefit of diet and exercise over exercise alone was observed in the cohort study on body weight.
The clinical benefit of diet and exercise compared to diet alone was also observed in a single RCT8 of 100 participants. The clinical evidence was of low quality due to the lack of blinding, presence of selection bias and incomplete outcome reporting which was due to the high number of drop outs, resulting in a very high risk of bias rating. Additionally, the imprecise nature of the results extracted and analysed further downgraded the quality of the evidence. However, the GDG felt there was clinically beneficial effect of diet and exercise on the ALT and AST levels reported in participants with NAFLD, compared to interventions recommending dietary changes alone.
The clinical benefit of diet and exercise was compared to exercise alone in an RCT and a cohort study.
Other considerations While it can be difficult to pull apart the relative effectiveness of any one element of composite interventions, the GDG noted that weight loss achieved as part of a lifestyle modification strategy in adults with NAFLD appears to have a longer-term benefit in reducing NAFLD progression, even if the weight loss is maintained for a short time only (for example, ‘yo-yo’ dieters). As such, weight loss should be recognised as an important desirable outcome for lifestyle modification strategies in adults with NAFLD.
The GDG also noted that lifestyle modification strategies offered to children and young people with NAFLD, who have not yet reached their adult height, should ensure that they focus on reducing the rate of weight gain rather than on decreasing weight. This is because weight gain is part of the normal physiological growth and development of children and young people (depending upon their developmental stage).

National Institute for Health and Care Excellence 2016
NAFLD
Lifestyle modification
214
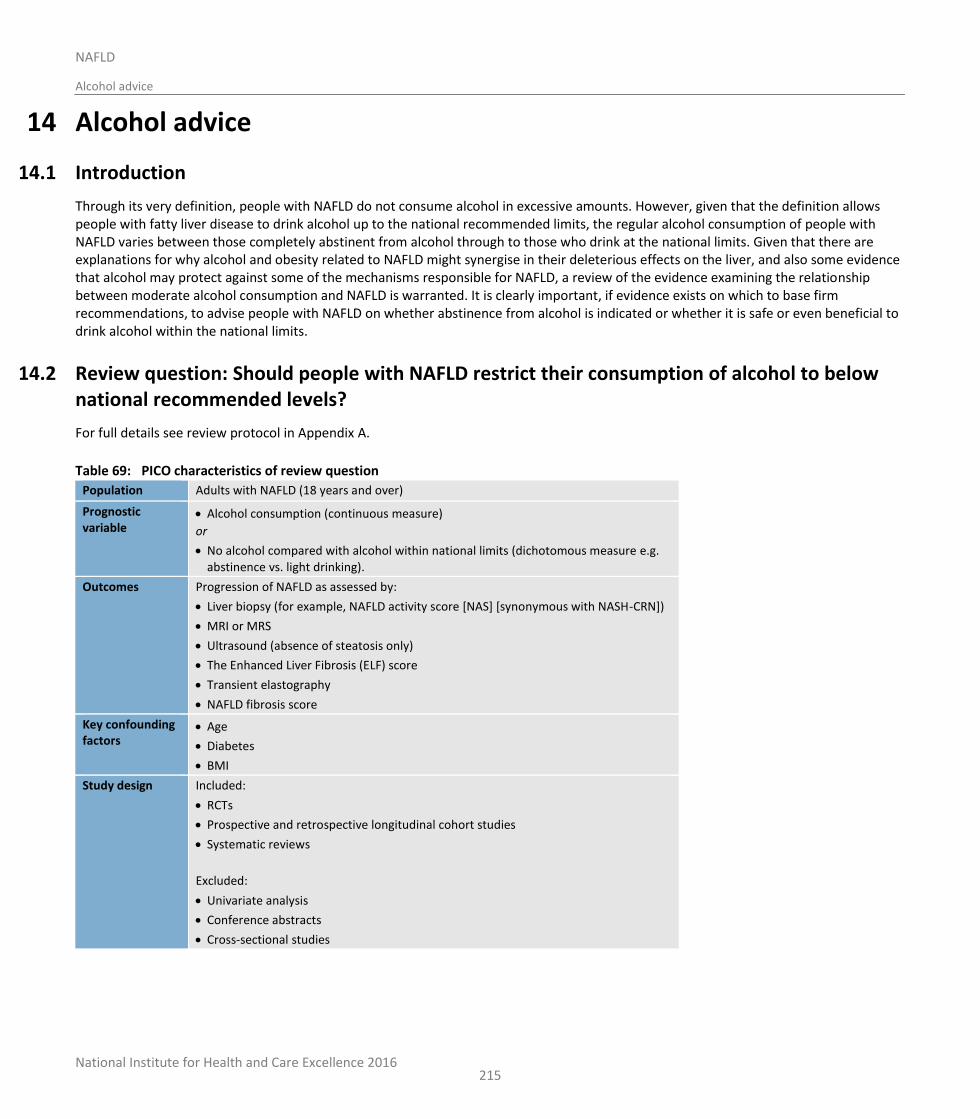
National Institute for Health and Care Excellence 2016
NAFLD
Alcohol advice
215
14 Alcohol advice
14.1 Introduction
Through its very definition, people with NAFLD do not consume alcohol in excessive amounts. However, given that the definition allows people with fatty liver disease to drink alcohol up to the national recommended limits, the regular alcohol consumption of people with NAFLD varies between those completely abstinent from alcohol through to those who drink at the national limits. Given that there are explanations for why alcohol and obesity related to NAFLD might synergise in their deleterious effects on the liver, and also some evidence that alcohol may protect against some of the mechanisms responsible for NAFLD, a review of the evidence examining the relationship between moderate alcohol consumption and NAFLD is warranted. It is clearly important, if evidence exists on which to base firm recommendations, to advise people with NAFLD on whether abstinence from alcohol is indicated or whether it is safe or even beneficial to drink alcohol within the national limits.
14.2 Review question: Should people with NAFLD restrict their consumption of alcohol to below national recommended levels?
For full details see review protocol in Appendix A.
Table 69: PICO characteristics of review question
Population Adults with NAFLD (18 years and over)
Prognostic variable
Alcohol consumption (continuous measure)
or
No alcohol compared with alcohol within national limits (dichotomous measure e.g. abstinence vs. light drinking).
Outcomes Progression of NAFLD as assessed by:
Liver biopsy (for example, NAFLD activity score [NAS] [synonymous with NASH-CRN])
MRI or MRS
Ultrasound (absence of steatosis only)
The Enhanced Liver Fibrosis (ELF) score
Transient elastography
NAFLD fibrosis score
Key confounding factors
Age
Diabetes
BMI
Study design Included:
RCTs
Prospective and retrospective longitudinal cohort studies
Systematic reviews
Excluded:
Univariate analysis
Conference abstracts
Cross-sectional studies
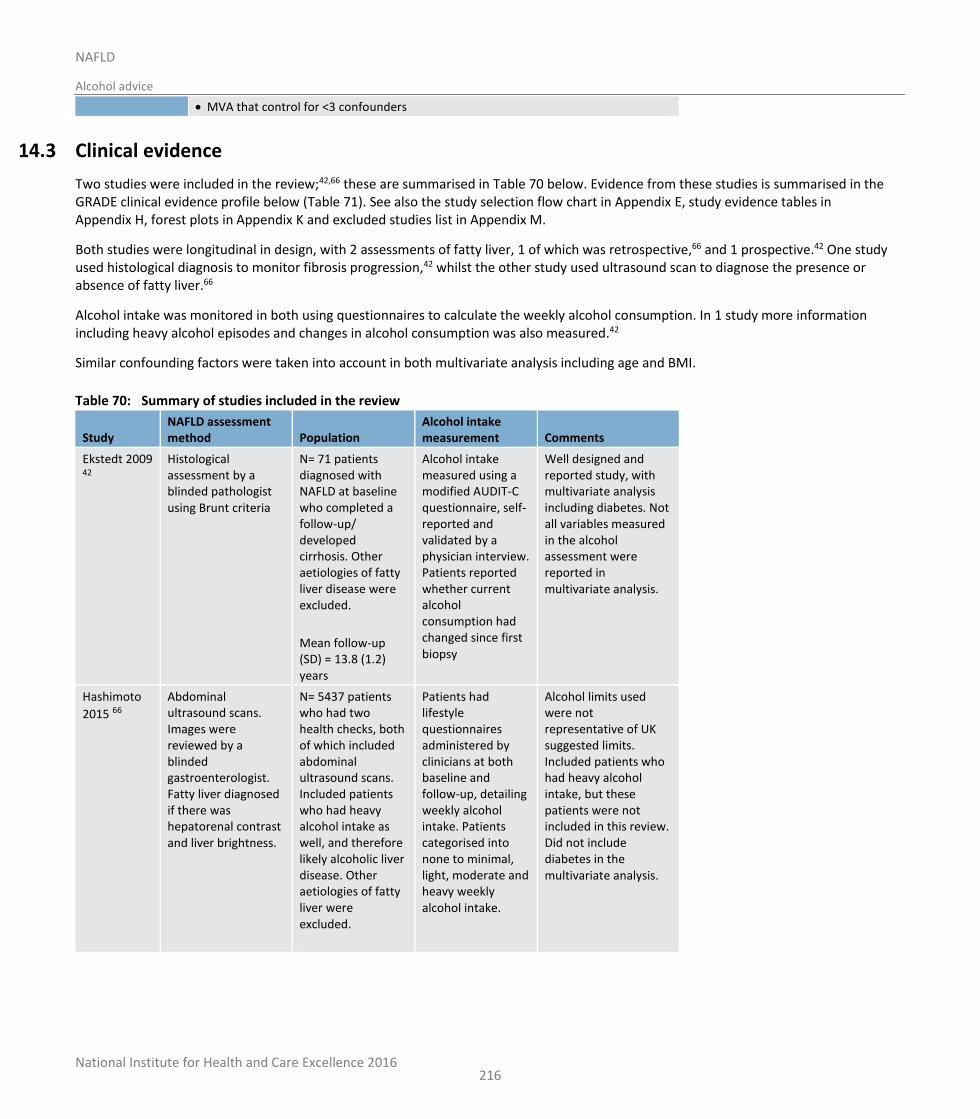
National Institute for Health and Care Excellence 2016
NAFLD
Alcohol advice
216
MVA that control for <3 confounders
14.3 Clinical evidence
Two studies were included in the review;42,66 these are summarised in Table 70 below. Evidence from these studies is summarised in the GRADE clinical evidence profile below (Table 71). See also the study selection flow chart in Appendix E, study evidence tables in Appendix H, forest plots in Appendix K and excluded studies list in Appendix M.
Both studies were longitudinal in design, with 2 assessments of fatty liver, 1 of which was retrospective,66 and 1 prospective.42 One study used histological diagnosis to monitor fibrosis progression,42 whilst the other study used ultrasound scan to diagnose the presence or absence of fatty liver.66
Alcohol intake was monitored in both using questionnaires to calculate the weekly alcohol consumption. In 1 study more information including heavy alcohol episodes and changes in alcohol consumption was also measured.42
Similar confounding factors were taken into account in both multivariate analysis including age and BMI.
Table 70: Summary of studies included in the review
Study NAFLD assessment method Population
Alcohol intake measurement Comments
Ekstedt 2009 42
Histological assessment by a blinded pathologist using Brunt criteria
N= 71 patients diagnosed with NAFLD at baseline who completed a follow-up/ developed cirrhosis. Other aetiologies of fatty liver disease were excluded.
Mean follow-up (SD) = 13.8 (1.2) years
Alcohol intake measured using a modified AUDIT-C questionnaire, self-reported and validated by a physician interview. Patients reported whether current alcohol consumption had changed since first biopsy
Well designed and reported study, with multivariate analysis including diabetes. Not all variables measured in the alcohol assessment were reported in multivariate analysis.
Hashimoto
2015 66
Abdominal ultrasound scans. Images were reviewed by a blinded gastroenterologist. Fatty liver diagnosed if there was hepatorenal contrast and liver brightness.
N= 5437 patients who had two health checks, both of which included abdominal ultrasound scans. Included patients who had heavy alcohol intake as well, and therefore likely alcoholic liver disease. Other aetiologies of fatty liver were excluded.
Patients had lifestyle questionnaires administered by clinicians at both baseline and follow-up, detailing weekly alcohol intake. Patients categorised into none to minimal, light, moderate and heavy weekly alcohol intake.
Alcohol limits used were not representative of UK suggested limits. Included patients who had heavy alcohol intake, but these patients were not included in this review. Did not include diabetes in the multivariate analysis.
National Institute for Health and Care Excellence 2016
NAFLD
Alcohol advice
217
Study NAFLD assessment method Population
Alcohol intake measurement Comments
Follow-up time = 10 years
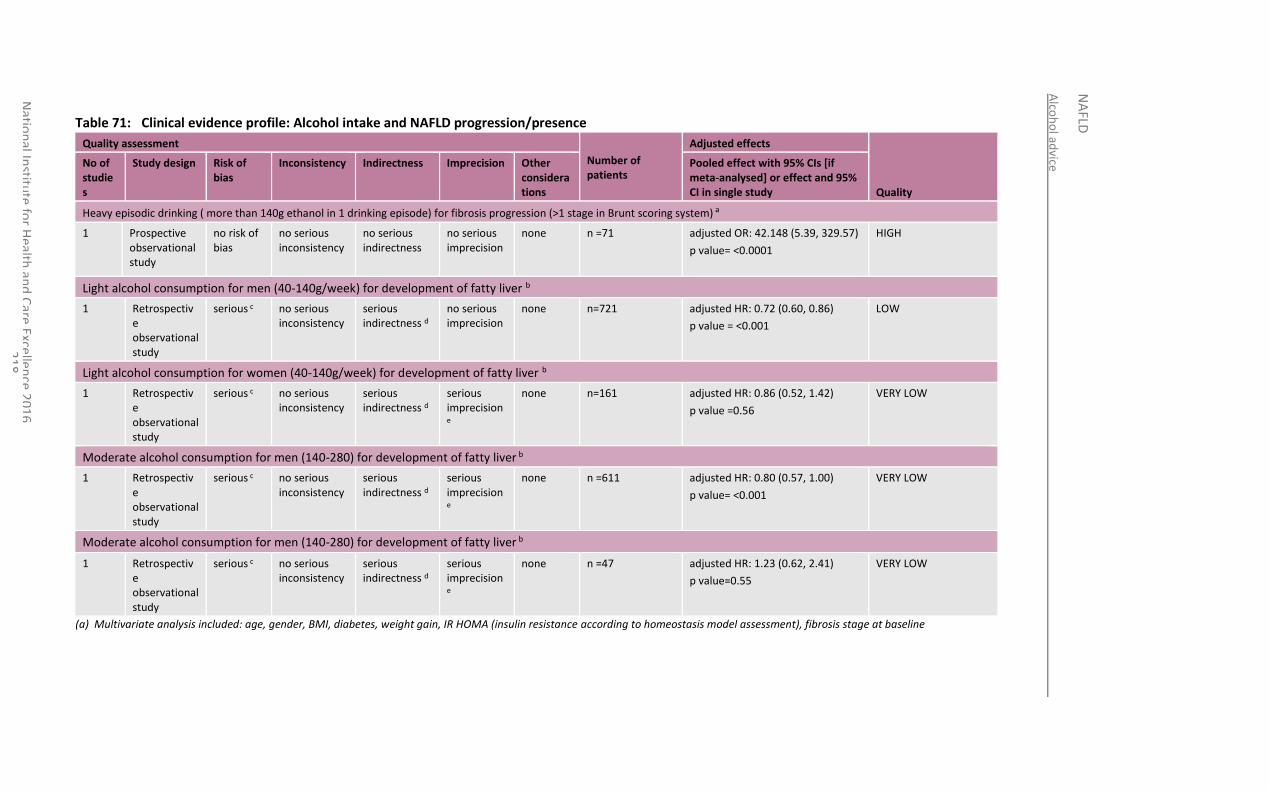
Alco
ho
l advice
NA
FLD
Natio
nal In
stitute
for H
ealth an
d C
are Excellen
ce 20
16
2
18
Table 71: Clinical evidence profile: Alcohol intake and NAFLD progression/presence
Quality assessment
Number of patients
Adjusted effects
Quality
No of studies
Study design Risk of bias
Inconsistency Indirectness Imprecision Other considerations
Pooled effect with 95% CIs [if meta-analysed] or effect and 95% CI in single study
Heavy episodic drinking ( more than 140g ethanol in 1 drinking episode) for fibrosis progression (>1 stage in Brunt scoring system) a
1 Prospective observational study
no risk of bias
no serious inconsistency
no serious indirectness
no serious imprecision
none n =71 adjusted OR: 42.148 (5.39, 329.57)
p value= <0.0001
HIGH
Light alcohol consumption for men (40-140g/week) for development of fatty liver b
1 Retrospective observational study
serious c no serious inconsistency
serious indirectness d
no serious imprecision
none n=721 adjusted HR: 0.72 (0.60, 0.86)
p value = <0.001
LOW
Light alcohol consumption for women (40-140g/week) for development of fatty liver b
1 Retrospective observational study
serious c no serious inconsistency
serious indirectness d
serious imprecision e
none n=161 adjusted HR: 0.86 (0.52, 1.42)
p value =0.56
VERY LOW
Moderate alcohol consumption for men (140-280) for development of fatty liver b
1 Retrospective observational study
serious c no serious inconsistency
serious indirectness d
serious imprecision e
none n =611
adjusted HR: 0.80 (0.57, 1.00)
p value= <0.001
VERY LOW
Moderate alcohol consumption for men (140-280) for development of fatty liver b
1 Retrospective observational study
serious c no serious inconsistency
serious indirectness d
serious imprecision e
none n =47
adjusted HR: 1.23 (0.62, 2.41)
p value=0.55
VERY LOW
(a) Multivariate analysis included: age, gender, BMI, diabetes, weight gain, IR HOMA (insulin resistance according to homeostasis model assessment), fibrosis stage at baseline
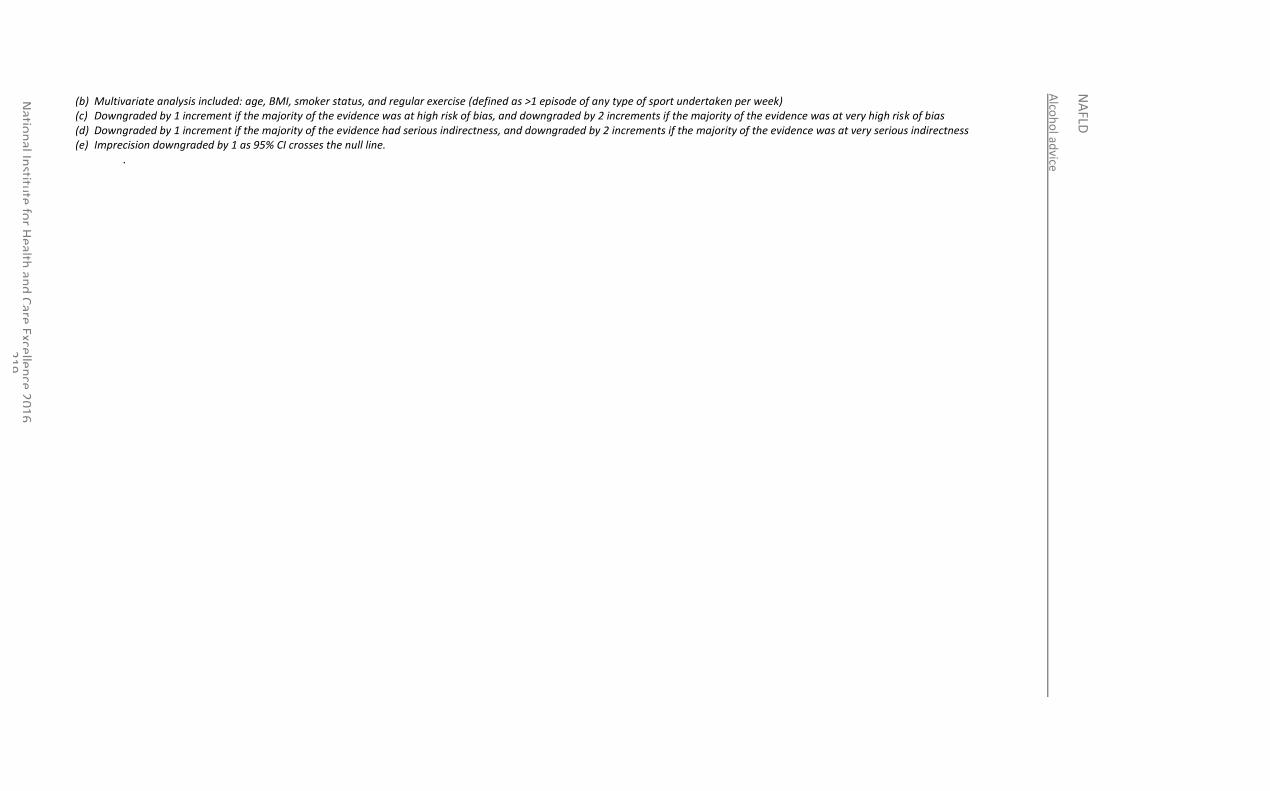
Alco
ho
l advice
NA
FLD
Natio
nal In
stitute
for H
ealth an
d C
are Excellen
ce 20
16
2
19
(b) Multivariate analysis included: age, BMI, smoker status, and regular exercise (defined as >1 episode of any type of sport undertaken per week) (c) Downgraded by 1 increment if the majority of the evidence was at high risk of bias, and downgraded by 2 increments if the majority of the evidence was at very high risk of bias (d) Downgraded by 1 increment if the majority of the evidence had serious indirectness, and downgraded by 2 increments if the majority of the evidence was at very serious indirectness (e) Imprecision downgraded by 1 as 95% CI crosses the null line.
.
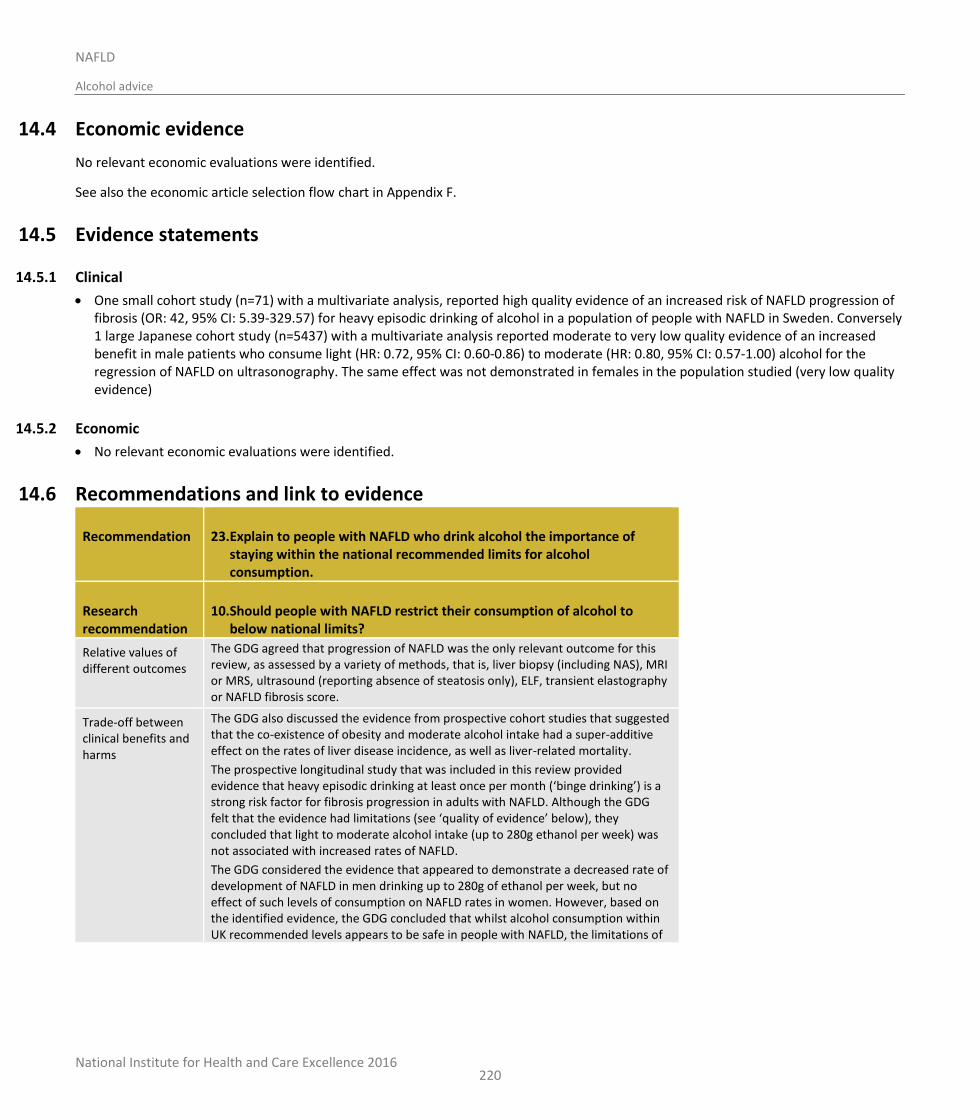
National Institute for Health and Care Excellence 2016
NAFLD
Alcohol advice
220
14.4 Economic evidence
No relevant economic evaluations were identified.
See also the economic article selection flow chart in Appendix F.
14.5 Evidence statements
14.5.1 Clinical
One small cohort study (n=71) with a multivariate analysis, reported high quality evidence of an increased risk of NAFLD progression of fibrosis (OR: 42, 95% CI: 5.39-329.57) for heavy episodic drinking of alcohol in a population of people with NAFLD in Sweden. Conversely 1 large Japanese cohort study (n=5437) with a multivariate analysis reported moderate to very low quality evidence of an increased benefit in male patients who consume light (HR: 0.72, 95% CI: 0.60-0.86) to moderate (HR: 0.80, 95% CI: 0.57-1.00) alcohol for the regression of NAFLD on ultrasonography. The same effect was not demonstrated in females in the population studied (very low quality evidence)
14.5.2 Economic
No relevant economic evaluations were identified.
14.6 Recommendations and link to evidence
Recommendation 23. Explain to people with NAFLD who drink alcohol the importance of staying within the national recommended limits for alcohol consumption.
Research recommendation
10. Should people with NAFLD restrict their consumption of alcohol to below national limits?
Relative values of different outcomes
The GDG agreed that progression of NAFLD was the only relevant outcome for this review, as assessed by a variety of methods, that is, liver biopsy (including NAS), MRI or MRS, ultrasound (reporting absence of steatosis only), ELF, transient elastography or NAFLD fibrosis score.
Trade-off between clinical benefits and harms
The GDG also discussed the evidence from prospective cohort studies that suggested that the co-existence of obesity and moderate alcohol intake had a super-additive effect on the rates of liver disease incidence, as well as liver-related mortality.
The prospective longitudinal study that was included in this review provided evidence that heavy episodic drinking at least once per month (‘binge drinking’) is a strong risk factor for fibrosis progression in adults with NAFLD. Although the GDG felt that the evidence had limitations (see ‘quality of evidence’ below), they concluded that light to moderate alcohol intake (up to 280g ethanol per week) was not associated with increased rates of NAFLD.
The GDG considered the evidence that appeared to demonstrate a decreased rate of development of NAFLD in men drinking up to 280g of ethanol per week, but no effect of such levels of consumption on NAFLD rates in women. However, based on the identified evidence, the GDG concluded that whilst alcohol consumption within UK recommended levels appears to be safe in people with NAFLD, the limitations of
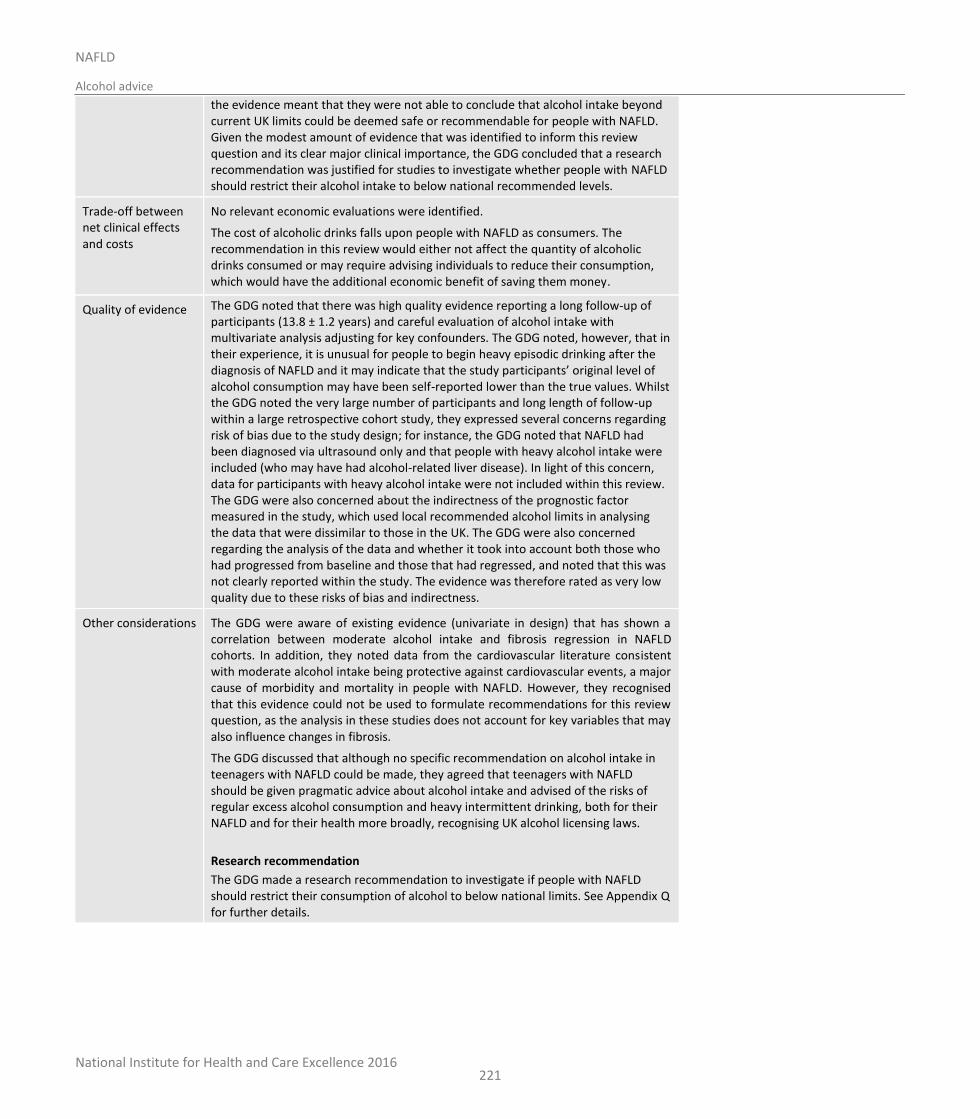
National Institute for Health and Care Excellence 2016
NAFLD
Alcohol advice
221
the evidence meant that they were not able to conclude that alcohol intake beyond current UK limits could be deemed safe or recommendable for people with NAFLD. Given the modest amount of evidence that was identified to inform this review question and its clear major clinical importance, the GDG concluded that a research recommendation was justified for studies to investigate whether people with NAFLD should restrict their alcohol intake to below national recommended levels.
Trade-off between net clinical effects and costs
No relevant economic evaluations were identified.
The cost of alcoholic drinks falls upon people with NAFLD as consumers. The recommendation in this review would either not affect the quantity of alcoholic drinks consumed or may require advising individuals to reduce their consumption, which would have the additional economic benefit of saving them money.
Quality of evidence The GDG noted that there was high quality evidence reporting a long follow-up of participants (13.8 ± 1.2 years) and careful evaluation of alcohol intake with multivariate analysis adjusting for key confounders. The GDG noted, however, that in their experience, it is unusual for people to begin heavy episodic drinking after the diagnosis of NAFLD and it may indicate that the study participants’ original level of alcohol consumption may have been self-reported lower than the true values. Whilst the GDG noted the very large number of participants and long length of follow-up within a large retrospective cohort study, they expressed several concerns regarding risk of bias due to the study design; for instance, the GDG noted that NAFLD had been diagnosed via ultrasound only and that people with heavy alcohol intake were included (who may have had alcohol-related liver disease). In light of this concern, data for participants with heavy alcohol intake were not included within this review. The GDG were also concerned about the indirectness of the prognostic factor measured in the study, which used local recommended alcohol limits in analysing the data that were dissimilar to those in the UK. The GDG were also concerned regarding the analysis of the data and whether it took into account both those who had progressed from baseline and those that had regressed, and noted that this was not clearly reported within the study. The evidence was therefore rated as very low quality due to these risks of bias and indirectness.
Other considerations The GDG were aware of existing evidence (univariate in design) that has shown a correlation between moderate alcohol intake and fibrosis regression in NAFLD cohorts. In addition, they noted data from the cardiovascular literature consistent with moderate alcohol intake being protective against cardiovascular events, a major cause of morbidity and mortality in people with NAFLD. However, they recognised that this evidence could not be used to formulate recommendations for this review question, as the analysis in these studies does not account for key variables that may also influence changes in fibrosis.
The GDG discussed that although no specific recommendation on alcohol intake in teenagers with NAFLD could be made, they agreed that teenagers with NAFLD should be given pragmatic advice about alcohol intake and advised of the risks of regular excess alcohol consumption and heavy intermittent drinking, both for their NAFLD and for their health more broadly, recognising UK alcohol licensing laws.
Research recommendation
The GDG made a research recommendation to investigate if people with NAFLD should restrict their consumption of alcohol to below national limits. See Appendix Q for further details.

National Institute for Health and Care Excellence 2016
NAFLD
Alcohol advice
222
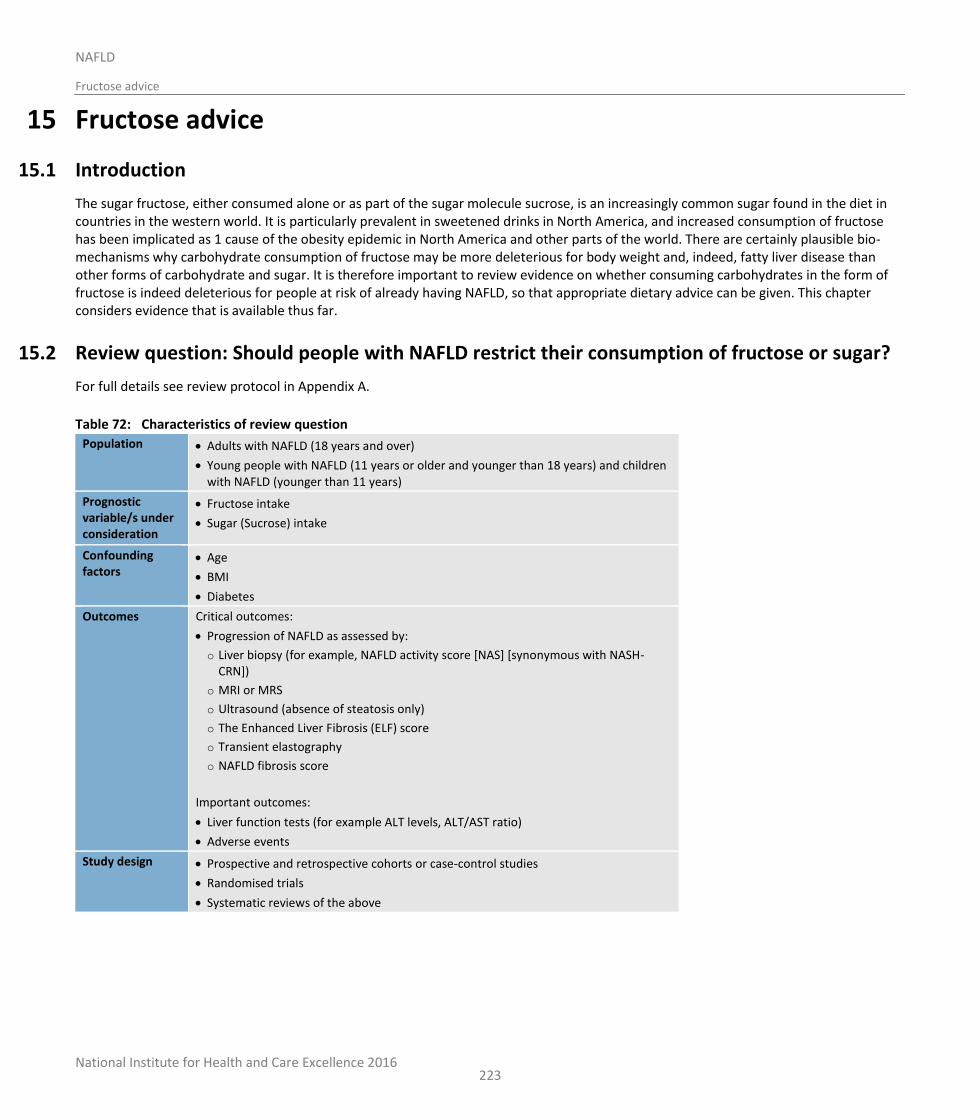
National Institute for Health and Care Excellence 2016
NAFLD
Fructose advice
223
15 Fructose advice
15.1 Introduction
The sugar fructose, either consumed alone or as part of the sugar molecule sucrose, is an increasingly common sugar found in the diet in countries in the western world. It is particularly prevalent in sweetened drinks in North America, and increased consumption of fructose has been implicated as 1 cause of the obesity epidemic in North America and other parts of the world. There are certainly plausible bio-mechanisms why carbohydrate consumption of fructose may be more deleterious for body weight and, indeed, fatty liver disease than other forms of carbohydrate and sugar. It is therefore important to review evidence on whether consuming carbohydrates in the form of fructose is indeed deleterious for people at risk of already having NAFLD, so that appropriate dietary advice can be given. This chapter considers evidence that is available thus far.
15.2 Review question: Should people with NAFLD restrict their consumption of fructose or sugar?
For full details see review protocol in Appendix A.
Table 72: Characteristics of review question
Population Adults with NAFLD (18 years and over)
Young people with NAFLD (11 years or older and younger than 18 years) and children with NAFLD (younger than 11 years)
Prognostic variable/s under consideration
Fructose intake
Sugar (Sucrose) intake
Confounding factors
Age
BMI
Diabetes
Outcomes Critical outcomes:
Progression of NAFLD as assessed by:
o Liver biopsy (for example, NAFLD activity score [NAS] [synonymous with NASH-CRN])
o MRI or MRS
o Ultrasound (absence of steatosis only)
o The Enhanced Liver Fibrosis (ELF) score
o Transient elastography
o NAFLD fibrosis score
Important outcomes:
Liver function tests (for example ALT levels, ALT/AST ratio)
Adverse events
Study design Prospective and retrospective cohorts or case-control studies
Randomised trials
Systematic reviews of the above
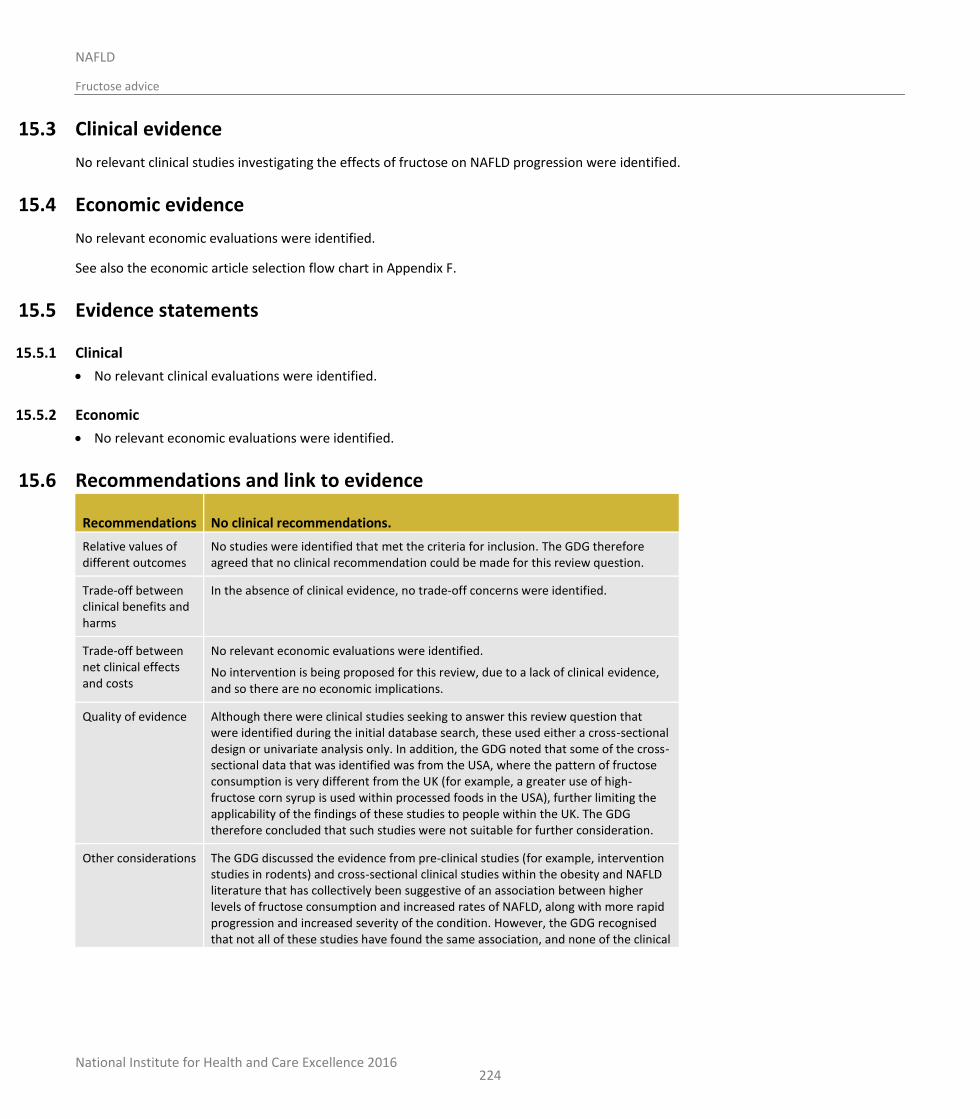
National Institute for Health and Care Excellence 2016
NAFLD
Fructose advice
224
15.3 Clinical evidence
No relevant clinical studies investigating the effects of fructose on NAFLD progression were identified.
15.4 Economic evidence
No relevant economic evaluations were identified.
See also the economic article selection flow chart in Appendix F.
15.5 Evidence statements
15.5.1 Clinical
No relevant clinical evaluations were identified.
15.5.2 Economic
No relevant economic evaluations were identified.
15.6 Recommendations and link to evidence
Recommendations No clinical recommendations.
Relative values of different outcomes
No studies were identified that met the criteria for inclusion. The GDG therefore agreed that no clinical recommendation could be made for this review question.
Trade-off between clinical benefits and harms
In the absence of clinical evidence, no trade-off concerns were identified.
Trade-off between net clinical effects and costs
No relevant economic evaluations were identified.
No intervention is being proposed for this review, due to a lack of clinical evidence, and so there are no economic implications.
Quality of evidence Although there were clinical studies seeking to answer this review question that were identified during the initial database search, these used either a cross-sectional design or univariate analysis only. In addition, the GDG noted that some of the cross-sectional data that was identified was from the USA, where the pattern of fructose consumption is very different from the UK (for example, a greater use of high-fructose corn syrup is used within processed foods in the USA), further limiting the applicability of the findings of these studies to people within the UK. The GDG therefore concluded that such studies were not suitable for further consideration.
Other considerations The GDG discussed the evidence from pre-clinical studies (for example, intervention studies in rodents) and cross-sectional clinical studies within the obesity and NAFLD literature that has collectively been suggestive of an association between higher levels of fructose consumption and increased rates of NAFLD, along with more rapid progression and increased severity of the condition. However, the GDG recognised that not all of these studies have found the same association, and none of the clinical
National Institute for Health and Care Excellence 2016
NAFLD
Fructose advice
225
studies have used multivariate analysis. As such, the GDG considered that there was not enough evidence available at present for them to make a recommendation for this review question.
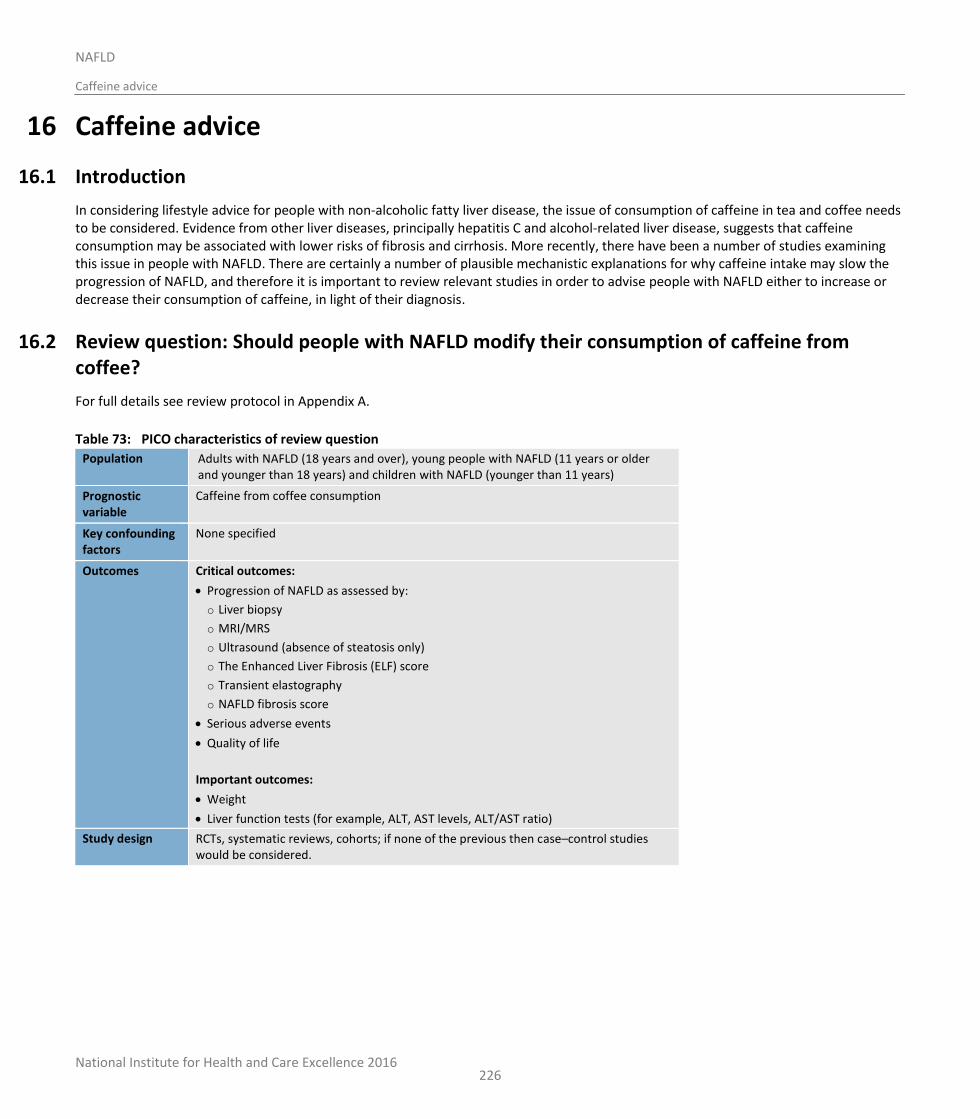
National Institute for Health and Care Excellence 2016
NAFLD
Caffeine advice
226
16 Caffeine advice
16.1 Introduction
In considering lifestyle advice for people with non-alcoholic fatty liver disease, the issue of consumption of caffeine in tea and coffee needs to be considered. Evidence from other liver diseases, principally hepatitis C and alcohol-related liver disease, suggests that caffeine consumption may be associated with lower risks of fibrosis and cirrhosis. More recently, there have been a number of studies examining this issue in people with NAFLD. There are certainly a number of plausible mechanistic explanations for why caffeine intake may slow the progression of NAFLD, and therefore it is important to review relevant studies in order to advise people with NAFLD either to increase or decrease their consumption of caffeine, in light of their diagnosis.
16.2 Review question: Should people with NAFLD modify their consumption of caffeine from coffee?
For full details see review protocol in Appendix A.
Table 73: PICO characteristics of review question
Population Adults with NAFLD (18 years and over), young people with NAFLD (11 years or older and younger than 18 years) and children with NAFLD (younger than 11 years)
Prognostic variable
Caffeine from coffee consumption
Key confounding factors
None specified
Outcomes Critical outcomes:
Progression of NAFLD as assessed by:
o Liver biopsy
o MRI/MRS
o Ultrasound (absence of steatosis only)
o The Enhanced Liver Fibrosis (ELF) score
o Transient elastography
o NAFLD fibrosis score
Serious adverse events
Quality of life
Important outcomes:
Weight
Liver function tests (for example, ALT, AST levels, ALT/AST ratio)
Study design RCTs, systematic reviews, cohorts; if none of the previous then case–control studies would be considered.
National Institute for Health and Care Excellence 2016
NAFLD
Caffeine advice
227
16.3 Clinical evidence
No studies were identified specifically addressing the effect of caffeine consumption on the progression of NAFLD. Two case-control studies were identified looking at the effect caffeine consumption on both those with and without NAFLD.22,54 The diagnostic tests used to identify participants with NAFLD differed between the studies (Table 75). Both studies determined coffee intake by self-reported responses to a questionnaire. The validity of the results from the studies relied on the respondent’s ability to provide accurate information. A reliable self-report measure will produce a consistent result every time it is executed; however, none of the studies evaluated the consistency of replies (for example by test–retest methods). Furthermore neither of these studies used validated questionnaires.
Further details of the included studies are detailed in Table 75. See also the study selection flow chart in Appendix E, study evidence tables in Appendix H, forest plots in Appendix K, and excluded studies list in Appendix M.
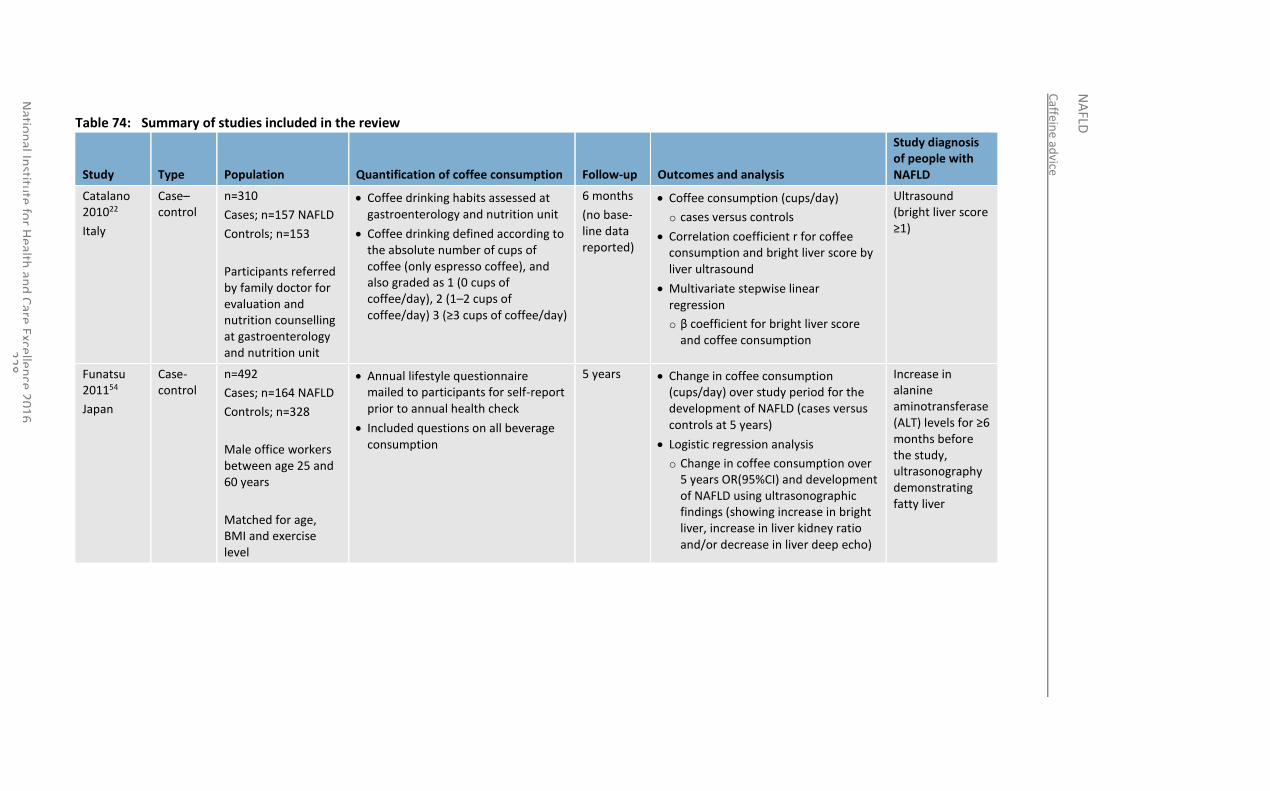
Caffein
e advice
NA
FLD
Natio
nal In
stitute
for H
ealth an
d C
are Exce
llence 2
01
6
22
8
Table 74: Summary of studies included in the review
Study Type Population Quantification of coffee consumption Follow-up Outcomes and analysis
Study diagnosis of people with NAFLD
Catalano 201022
Italy
Case–control
n=310
Cases; n=157 NAFLD
Controls; n=153
Participants referred by family doctor for evaluation and nutrition counselling at gastroenterology and nutrition unit
Coffee drinking habits assessed at gastroenterology and nutrition unit
Coffee drinking defined according to the absolute number of cups of coffee (only espresso coffee), and also graded as 1 (0 cups of coffee/day), 2 (1–2 cups of coffee/day) 3 (≥3 cups of coffee/day)
6 months
(no base-line data reported)
Coffee consumption (cups/day)
o cases versus controls
Correlation coefficient r for coffee consumption and bright liver score by liver ultrasound
Multivariate stepwise linear regression
o β coefficient for bright liver score and coffee consumption
Ultrasound (bright liver score ≥1)
Funatsu 201154
Japan
Case-control
n=492
Cases; n=164 NAFLD
Controls; n=328
Male office workers between age 25 and 60 years
Matched for age, BMI and exercise level
Annual lifestyle questionnaire mailed to participants for self-report prior to annual health check
Included questions on all beverage consumption
5 years Change in coffee consumption (cups/day) over study period for the development of NAFLD (cases versus controls at 5 years)
Logistic regression analysis
o Change in coffee consumption over 5 years OR(95%CI) and development of NAFLD using ultrasonographic findings (showing increase in bright liver, increase in liver kidney ratio and/or decrease in liver deep echo)
Increase in alanine aminotransferase (ALT) levels for ≥6 months before the study, ultrasonography demonstrating fatty liver
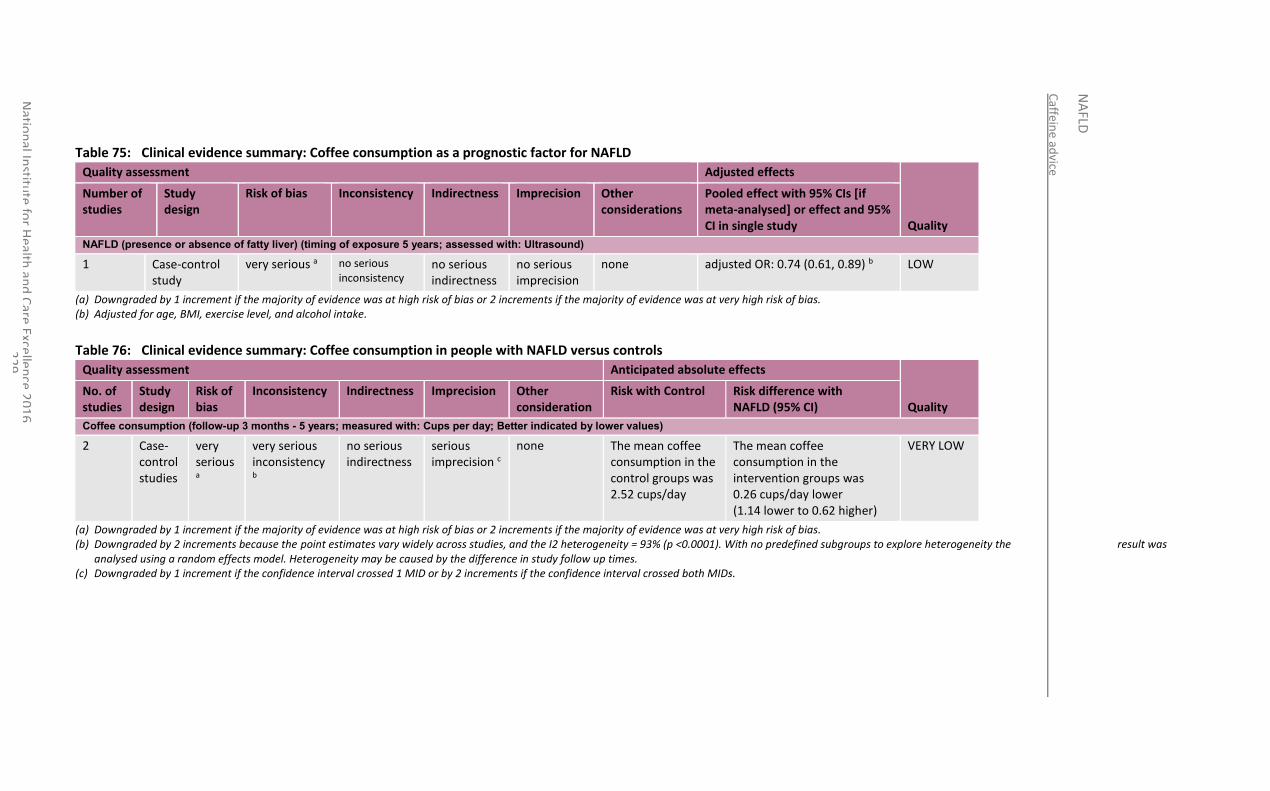
Caffein
e advice
NA
FLD
Natio
nal In
stitute
for H
ealth an
d C
are Excellen
ce 20
16
2
29
Table 75: Clinical evidence summary: Coffee consumption as a prognostic factor for NAFLD
Quality assessment Adjusted effects
Quality
Number of studies
Study design
Risk of bias Inconsistency Indirectness Imprecision Other considerations
Pooled effect with 95% CIs [if meta-analysed] or effect and 95% CI in single study
NAFLD (presence or absence of fatty liver) (timing of exposure 5 years; assessed with: Ultrasound)
1 Case-control study
very serious a no serious inconsistency
no serious indirectness
no serious imprecision
none adjusted OR: 0.74 (0.61, 0.89) b LOW
(a) Downgraded by 1 increment if the majority of evidence was at high risk of bias or 2 increments if the majority of evidence was at very high risk of bias. (b) Adjusted for age, BMI, exercise level, and alcohol intake.
Table 76: Clinical evidence summary: Coffee consumption in people with NAFLD versus controls
Quality assessment Anticipated absolute effects
Quality No. of studies
Study design
Risk of bias
Inconsistency Indirectness Imprecision Other consideration
Risk with Control Risk difference with NAFLD (95% CI)
Coffee consumption (follow-up 3 months - 5 years; measured with: Cups per day; Better indicated by lower values)
2 Case-control studies
very serious a
very serious inconsistency b
no serious indirectness
serious imprecision c
none The mean coffee consumption in the control groups was 2.52 cups/day
The mean coffee consumption in the intervention groups was 0.26 cups/day lower (1.14 lower to 0.62 higher)
VERY LOW
(a) Downgraded by 1 increment if the majority of evidence was at high risk of bias or 2 increments if the majority of evidence was at very high risk of bias. (b) Downgraded by 2 increments because the point estimates vary widely across studies, and the I2 heterogeneity = 93% (p <0.0001). With no predefined subgroups to explore heterogeneity the result was
analysed using a random effects model. Heterogeneity may be caused by the difference in study follow up times. (c) Downgraded by 1 increment if the confidence interval crossed 1 MID or by 2 increments if the confidence interval crossed both MIDs.
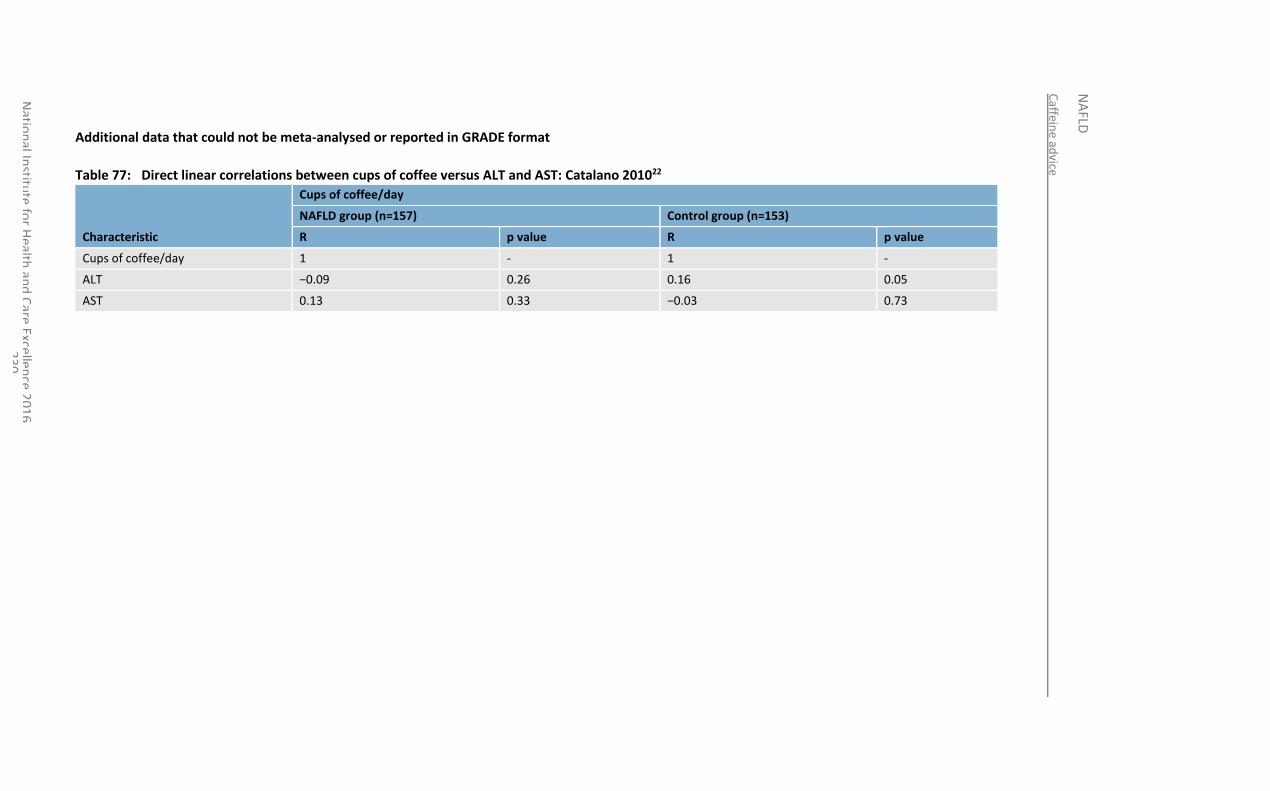
Caffein
e advice
NA
FLD
Natio
nal In
stitute
for H
ealth an
d C
are Excellen
ce 20
16
2
30
Additional data that could not be meta-analysed or reported in GRADE format
Table 77: Direct linear correlations between cups of coffee versus ALT and AST: Catalano 201022
Characteristic
Cups of coffee/day
NAFLD group (n=157) Control group (n=153)
R p value R p value
Cups of coffee/day 1 - 1 -
ALT −0.09 0.26 0.16 0.05
AST 0.13 0.33 −0.03 0.73
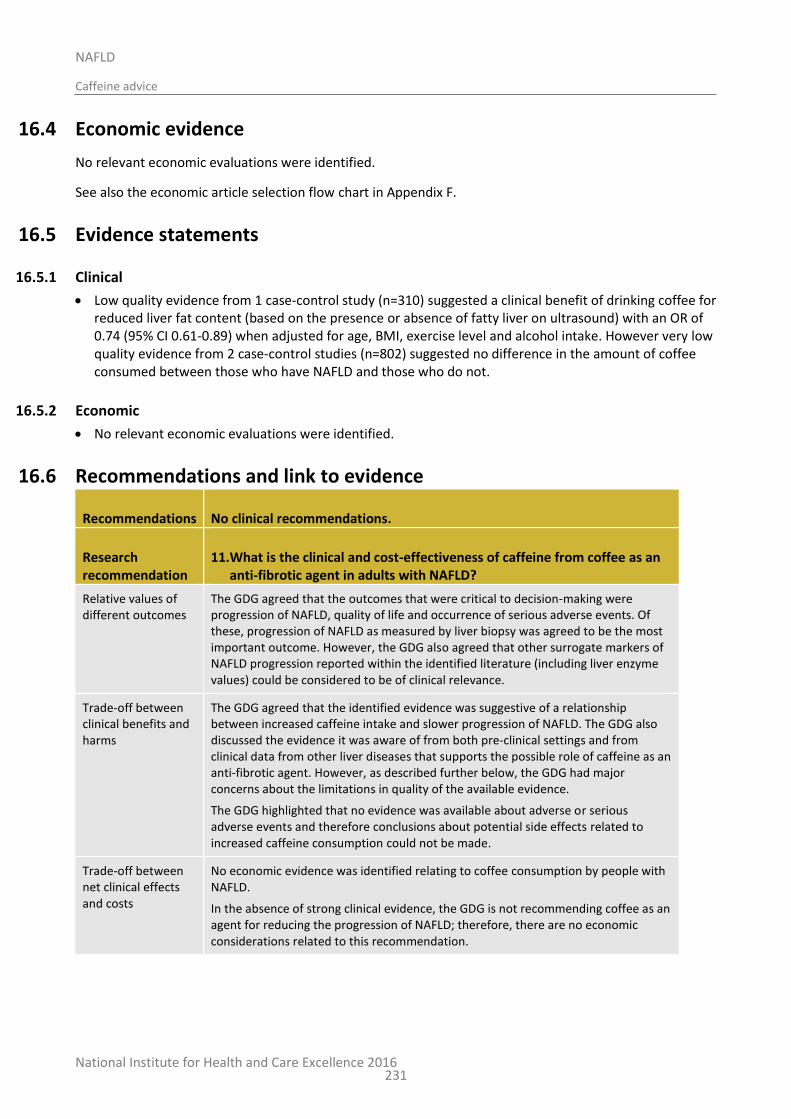
National Institute for Health and Care Excellence 2016
NAFLD
Caffeine advice
231
16.4 Economic evidence
No relevant economic evaluations were identified.
See also the economic article selection flow chart in Appendix F.
16.5 Evidence statements
16.5.1 Clinical
Low quality evidence from 1 case-control study (n=310) suggested a clinical benefit of drinking coffee for reduced liver fat content (based on the presence or absence of fatty liver on ultrasound) with an OR of 0.74 (95% CI 0.61-0.89) when adjusted for age, BMI, exercise level and alcohol intake. However very low quality evidence from 2 case-control studies (n=802) suggested no difference in the amount of coffee consumed between those who have NAFLD and those who do not.
16.5.2 Economic
No relevant economic evaluations were identified.
16.6 Recommendations and link to evidence
Recommendations No clinical recommendations.
Research recommendation
11. What is the clinical and cost-effectiveness of caffeine from coffee as an anti-fibrotic agent in adults with NAFLD?
Relative values of different outcomes
The GDG agreed that the outcomes that were critical to decision-making were progression of NAFLD, quality of life and occurrence of serious adverse events. Of these, progression of NAFLD as measured by liver biopsy was agreed to be the most important outcome. However, the GDG also agreed that other surrogate markers of NAFLD progression reported within the identified literature (including liver enzyme values) could be considered to be of clinical relevance.
Trade-off between clinical benefits and harms
The GDG agreed that the identified evidence was suggestive of a relationship between increased caffeine intake and slower progression of NAFLD. The GDG also discussed the evidence it was aware of from both pre-clinical settings and from clinical data from other liver diseases that supports the possible role of caffeine as an anti-fibrotic agent. However, as described further below, the GDG had major concerns about the limitations in quality of the available evidence.
The GDG highlighted that no evidence was available about adverse or serious adverse events and therefore conclusions about potential side effects related to increased caffeine consumption could not be made.
Trade-off between net clinical effects and costs
No economic evidence was identified relating to coffee consumption by people with NAFLD.
In the absence of strong clinical evidence, the GDG is not recommending coffee as an agent for reducing the progression of NAFLD; therefore, there are no economic considerations related to this recommendation.
National Institute for Health and Care Excellence 2016
NAFLD
Caffeine advice
232
However, it was noted that if future research provides more solid clinical- effectiveness evidence for the use of coffee by people with NAFLD, backing up positive recommendations, then the costs for its use would mainly fall upon people with NAFLD as consumers.
Quality of evidence The GDG had significant concerns about the quality of evidence available for this review. In particular, it noted that there were no relevant randomised controlled trials specifically addressing the review question. Those studies that had been identified for inclusion were case control studies involving populations both with and without NAFLD and the evidence from these studies were of low to very low quality by GRADE criteria. The GDG expressed concern that studies tended to measure the caffeine intake of study participants by relying upon self-reporting (using non-validated food questionnaires), where there is a clear risk of recall bias. The GDG also discussed how the size of a standard ‘cup of coffee’ – as well as the amount of caffeine equating to a cup of coffee – was described variably between different studies, as there are no accepted standard definitions for these terms.
The GDG reiterated that any evidence for an apparent association between caffeine intake and change in NAFLD status arising from association studies could potentially be explained by confounding factors (for example, an alternative aspect of the metabolic syndrome, or another factor of study participants’ lifestyle or diet not recorded by the researchers). However, the GDG noted that 1 of the studies had included multivariate logistic regression analysis to attempt correction of this aspect.
Other considerations Whilst this review question sought to identify the relationship between caffeine from coffee and clinical outcomes for people with NAFLD, the GDG also observed that none of the identified studies examined for a relationship between NAFLD progression and the intake of decaffeinated coffee.
The overall conclusion from the GDG was that the evidence reviewed was not strong enough to make a clinical recommendation for caffeine as an agent for reducing progression of NAFLD. However, the GDG agreed that since the evidence reviewed was suggestive of a possible therapeutic benefit from caffeine, a research recommendation was justified. Specifically, the GDG noted that a randomised controlled trial to assess the effect of caffeine upon NAFLD progression would be of particular interest.
Research recommendation
The GDG made a research recommendation to investigate the clinical and cost-effectiveness of caffeine from coffee as an anti-fibrotic agent to treat adults with NAFLD.
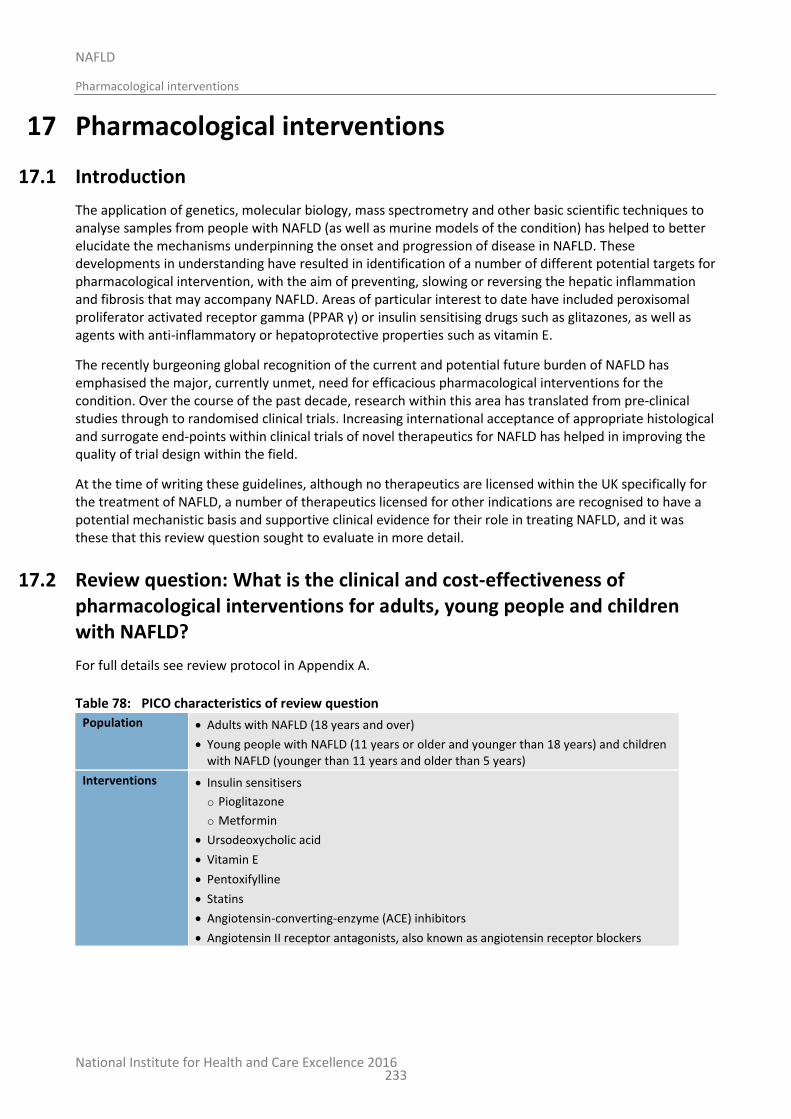
National Institute for Health and Care Excellence 2016
NAFLD
Pharmacological interventions
233
17 Pharmacological interventions
17.1 Introduction
The application of genetics, molecular biology, mass spectrometry and other basic scientific techniques to analyse samples from people with NAFLD (as well as murine models of the condition) has helped to better elucidate the mechanisms underpinning the onset and progression of disease in NAFLD. These developments in understanding have resulted in identification of a number of different potential targets for pharmacological intervention, with the aim of preventing, slowing or reversing the hepatic inflammation and fibrosis that may accompany NAFLD. Areas of particular interest to date have included peroxisomal proliferator activated receptor gamma (PPAR γ) or insulin sensitising drugs such as glitazones, as well as agents with anti-inflammatory or hepatoprotective properties such as vitamin E.
The recently burgeoning global recognition of the current and potential future burden of NAFLD has emphasised the major, currently unmet, need for efficacious pharmacological interventions for the condition. Over the course of the past decade, research within this area has translated from pre-clinical studies through to randomised clinical trials. Increasing international acceptance of appropriate histological and surrogate end-points within clinical trials of novel therapeutics for NAFLD has helped in improving the quality of trial design within the field.
At the time of writing these guidelines, although no therapeutics are licensed within the UK specifically for the treatment of NAFLD, a number of therapeutics licensed for other indications are recognised to have a potential mechanistic basis and supportive clinical evidence for their role in treating NAFLD, and it was these that this review question sought to evaluate in more detail.
17.2 Review question: What is the clinical and cost-effectiveness of pharmacological interventions for adults, young people and children with NAFLD?
For full details see review protocol in Appendix A.
Table 78: PICO characteristics of review question
Population Adults with NAFLD (18 years and over)
Young people with NAFLD (11 years or older and younger than 18 years) and children with NAFLD (younger than 11 years and older than 5 years)
Interventions Insulin sensitisers
o Pioglitazone
o Metformin
Ursodeoxycholic acid
Vitamin E
Pentoxifylline
Statins
Angiotensin-converting-enzyme (ACE) inhibitors
Angiotensin II receptor antagonists, also known as angiotensin receptor blockers
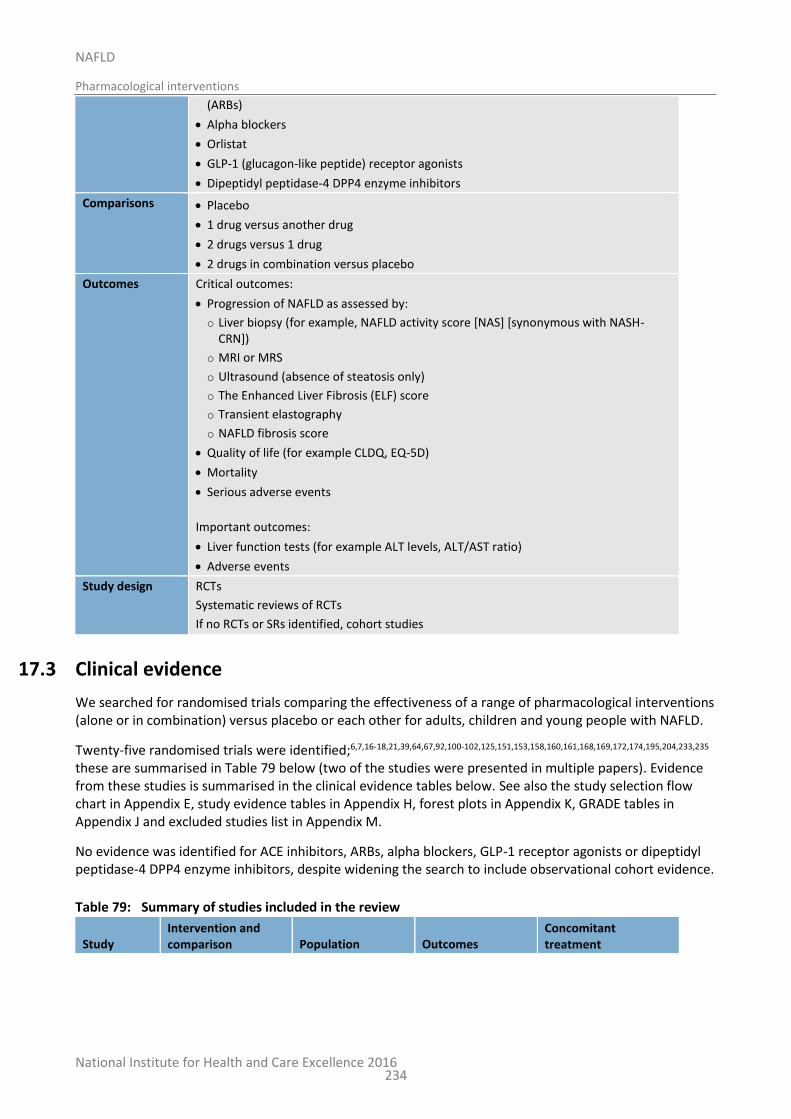
National Institute for Health and Care Excellence 2016
NAFLD
Pharmacological interventions
234
(ARBs)
Alpha blockers
Orlistat
GLP-1 (glucagon-like peptide) receptor agonists
Dipeptidyl peptidase-4 DPP4 enzyme inhibitors
Comparisons Placebo
1 drug versus another drug
2 drugs versus 1 drug
2 drugs in combination versus placebo
Outcomes Critical outcomes:
Progression of NAFLD as assessed by:
o Liver biopsy (for example, NAFLD activity score [NAS] [synonymous with NASH-CRN])
o MRI or MRS
o Ultrasound (absence of steatosis only)
o The Enhanced Liver Fibrosis (ELF) score
o Transient elastography
o NAFLD fibrosis score
Quality of life (for example CLDQ, EQ-5D)
Mortality
Serious adverse events
Important outcomes:
Liver function tests (for example ALT levels, ALT/AST ratio)
Adverse events
Study design RCTs
Systematic reviews of RCTs
If no RCTs or SRs identified, cohort studies
17.3 Clinical evidence
We searched for randomised trials comparing the effectiveness of a range of pharmacological interventions (alone or in combination) versus placebo or each other for adults, children and young people with NAFLD.
Twenty-five randomised trials were identified;6,7,16-18,21,39,64,67,92,100-102,125,151,153,158,160,161,168,169,172,174,195,204,233,235 these are summarised in Table 79 below (two of the studies were presented in multiple papers). Evidence from these studies is summarised in the clinical evidence tables below. See also the study selection flow chart in Appendix E, study evidence tables in Appendix H, forest plots in Appendix K, GRADE tables in Appendix J and excluded studies list in Appendix M.
No evidence was identified for ACE inhibitors, ARBs, alpha blockers, GLP-1 receptor agonists or dipeptidyl peptidase-4 DPP4 enzyme inhibitors, despite widening the search to include observational cohort evidence.
Table 79: Summary of studies included in the review
Study Intervention and comparison Population Outcomes
Concomitant treatment
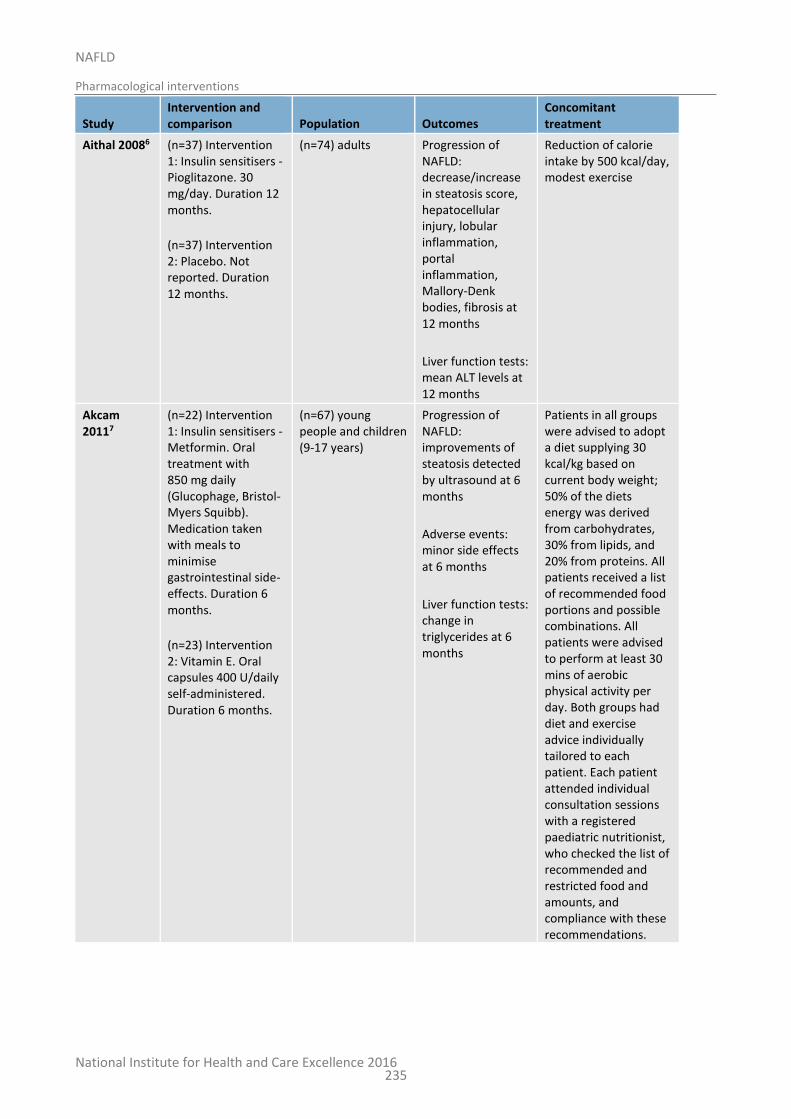
National Institute for Health and Care Excellence 2016
NAFLD
Pharmacological interventions
235
Study Intervention and comparison Population Outcomes
Concomitant treatment
Aithal 20086 (n=37) Intervention 1: Insulin sensitisers - Pioglitazone. 30 mg/day. Duration 12 months.
(n=37) Intervention 2: Placebo. Not reported. Duration 12 months.
(n=74) adults Progression of NAFLD: decrease/increase in steatosis score, hepatocellular injury, lobular inflammation, portal inflammation, Mallory-Denk bodies, fibrosis at 12 months
Liver function tests: mean ALT levels at 12 months
Reduction of calorie intake by 500 kcal/day, modest exercise
Akcam 20117
(n=22) Intervention 1: Insulin sensitisers - Metformin. Oral treatment with 850 mg daily (Glucophage, Bristol-Myers Squibb). Medication taken with meals to minimise gastrointestinal side-effects. Duration 6 months.
(n=23) Intervention 2: Vitamin E. Oral capsules 400 U/daily self-administered. Duration 6 months.
(n=67) young people and children (9-17 years)
Progression of NAFLD: improvements of steatosis detected by ultrasound at 6 months
Adverse events: minor side effects at 6 months
Liver function tests: change in triglycerides at 6 months
Patients in all groups were advised to adopt a diet supplying 30 kcal/kg based on current body weight; 50% of the diets energy was derived from carbohydrates, 30% from lipids, and 20% from proteins. All patients received a list of recommended food portions and possible combinations. All patients were advised to perform at least 30 mins of aerobic physical activity per day. Both groups had diet and exercise advice individually tailored to each patient. Each patient attended individual consultation sessions with a registered paediatric nutritionist, who checked the list of recommended and restricted food and amounts, and compliance with these recommendations.
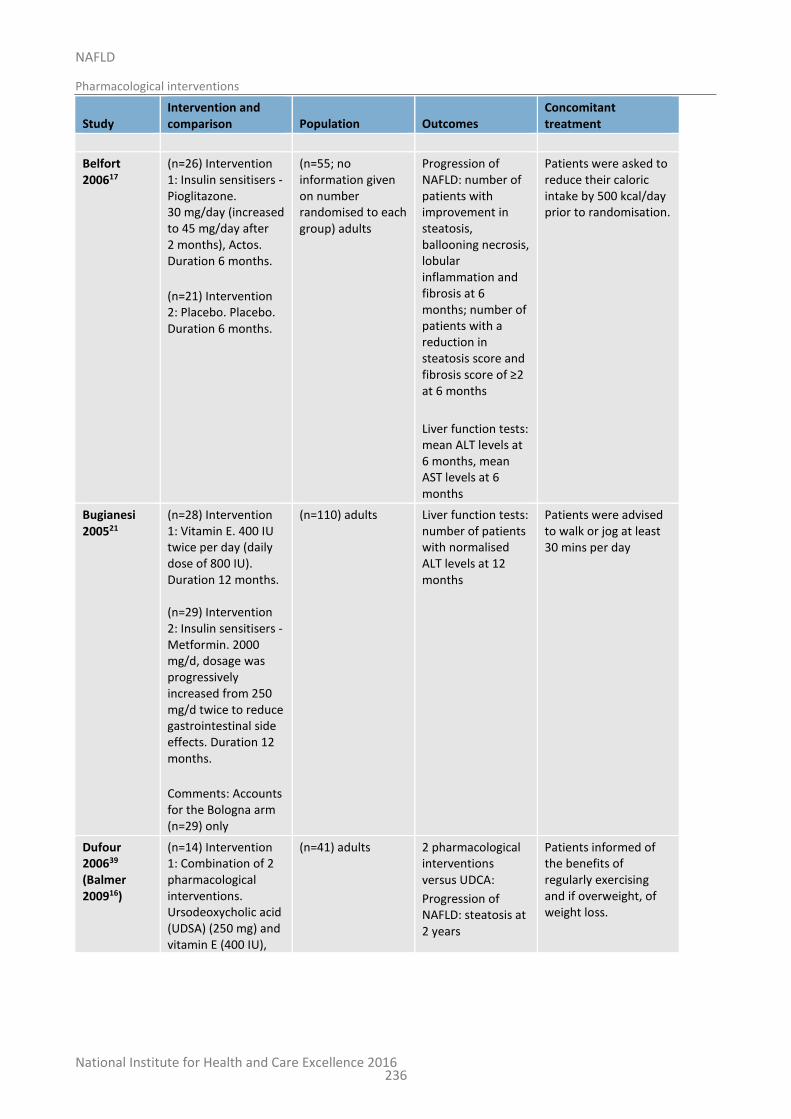
National Institute for Health and Care Excellence 2016
NAFLD
Pharmacological interventions
236
Study Intervention and comparison Population Outcomes
Concomitant treatment
Belfort 200617
(n=26) Intervention 1: Insulin sensitisers - Pioglitazone. 30 mg/day (increased to 45 mg/day after 2 months), Actos. Duration 6 months.
(n=21) Intervention 2: Placebo. Placebo. Duration 6 months.
(n=55; no information given on number randomised to each group) adults
Progression of NAFLD: number of patients with improvement in steatosis, ballooning necrosis, lobular inflammation and fibrosis at 6 months; number of patients with a reduction in steatosis score and fibrosis score of ≥2 at 6 months
Liver function tests: mean ALT levels at 6 months, mean AST levels at 6 months
Patients were asked to reduce their caloric intake by 500 kcal/day prior to randomisation.
Bugianesi 200521
(n=28) Intervention 1: Vitamin E. 400 IU twice per day (daily dose of 800 IU). Duration 12 months. (n=29) Intervention 2: Insulin sensitisers - Metformin. 2000 mg/d, dosage was progressively increased from 250 mg/d twice to reduce gastrointestinal side effects. Duration 12 months.
Comments: Accounts for the Bologna arm (n=29) only
(n=110) adults Liver function tests: number of patients with normalised ALT levels at 12 months
Patients were advised to walk or jog at least 30 mins per day
Dufour 200639 (Balmer 200916)
(n=14) Intervention 1: Combination of 2 pharmacological interventions. Ursodeoxycholic acid (UDSA) (250 mg) and vitamin E (400 IU),
(n=41) adults 2 pharmacological interventions versus UDCA:
Progression of NAFLD: steatosis at 2 years
Patients informed of the benefits of regularly exercising and if overweight, of weight loss.
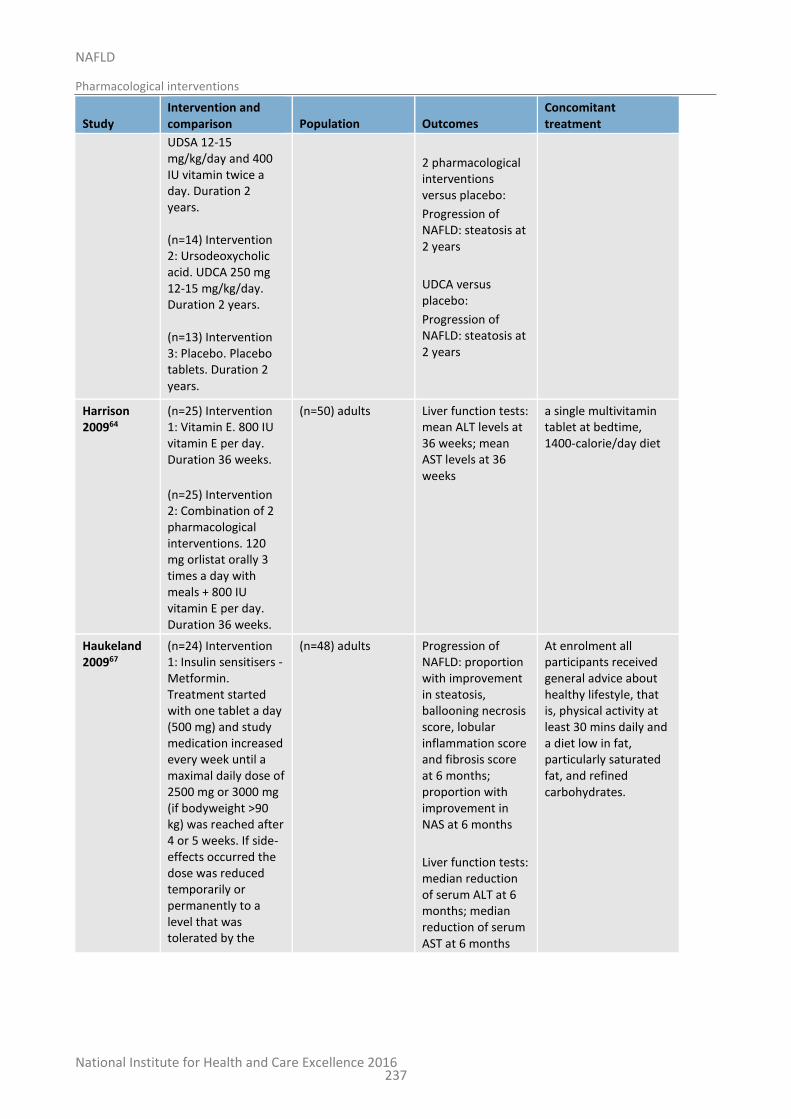
National Institute for Health and Care Excellence 2016
NAFLD
Pharmacological interventions
237
Study Intervention and comparison Population Outcomes
Concomitant treatment
UDSA 12-15 mg/kg/day and 400 IU vitamin twice a day. Duration 2 years. (n=14) Intervention 2: Ursodeoxycholic acid. UDCA 250 mg 12-15 mg/kg/day. Duration 2 years. (n=13) Intervention 3: Placebo. Placebo tablets. Duration 2 years.
2 pharmacological interventions versus placebo:
Progression of NAFLD: steatosis at 2 years
UDCA versus placebo:
Progression of NAFLD: steatosis at 2 years
Harrison 200964
(n=25) Intervention 1: Vitamin E. 800 IU vitamin E per day. Duration 36 weeks.
(n=25) Intervention 2: Combination of 2 pharmacological interventions. 120 mg orlistat orally 3 times a day with meals + 800 IU vitamin E per day. Duration 36 weeks.
(n=50) adults Liver function tests: mean ALT levels at 36 weeks; mean AST levels at 36 weeks
a single multivitamin tablet at bedtime, 1400-calorie/day diet
Haukeland 200967
(n=24) Intervention 1: Insulin sensitisers - Metformin. Treatment started with one tablet a day (500 mg) and study medication increased every week until a maximal daily dose of 2500 mg or 3000 mg (if bodyweight >90 kg) was reached after 4 or 5 weeks. If side-effects occurred the dose was reduced temporarily or permanently to a level that was tolerated by the
(n=48) adults Progression of NAFLD: proportion with improvement in steatosis, ballooning necrosis score, lobular inflammation score and fibrosis score at 6 months; proportion with improvement in NAS at 6 months
Liver function tests: median reduction of serum ALT at 6 months; median reduction of serum AST at 6 months
At enrolment all participants received general advice about healthy lifestyle, that is, physical activity at least 30 mins daily and a diet low in fat, particularly saturated fat, and refined carbohydrates.
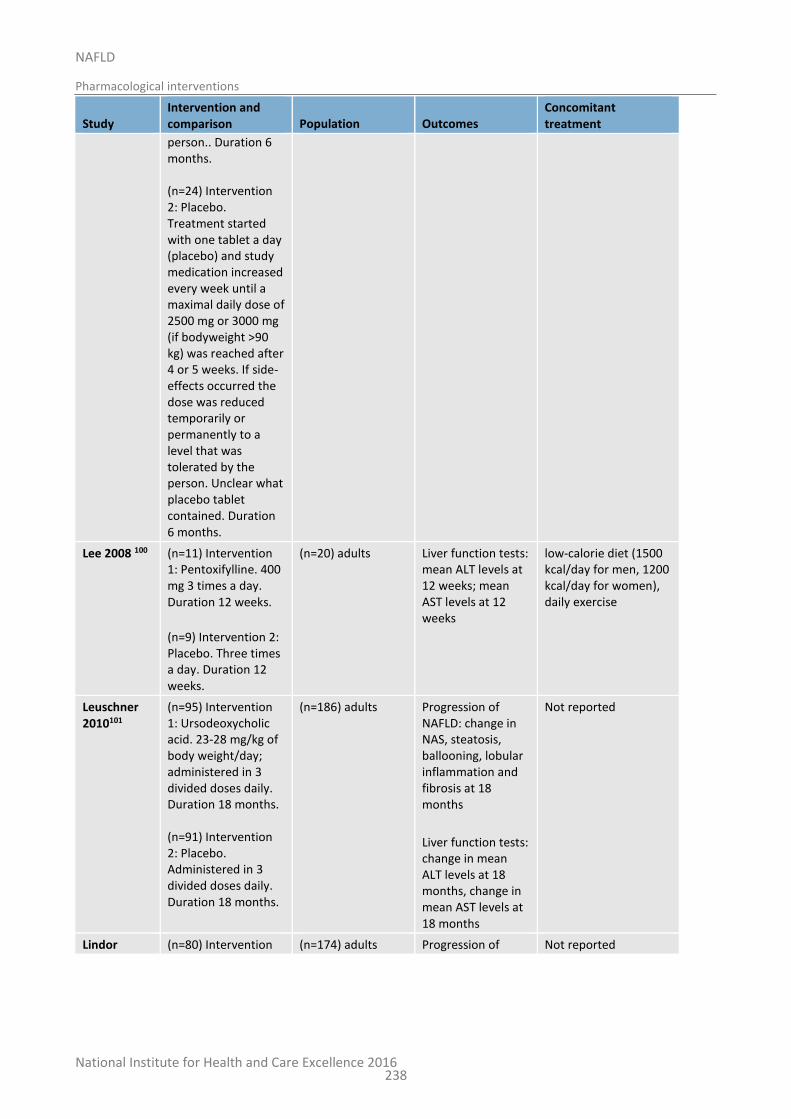
National Institute for Health and Care Excellence 2016
NAFLD
Pharmacological interventions
238
Study Intervention and comparison Population Outcomes
Concomitant treatment
person.. Duration 6 months. (n=24) Intervention 2: Placebo. Treatment started with one tablet a day (placebo) and study medication increased every week until a maximal daily dose of 2500 mg or 3000 mg (if bodyweight >90 kg) was reached after 4 or 5 weeks. If side-effects occurred the dose was reduced temporarily or permanently to a level that was tolerated by the person. Unclear what placebo tablet contained. Duration 6 months.
Lee 2008 100 (n=11) Intervention 1: Pentoxifylline. 400 mg 3 times a day. Duration 12 weeks.
(n=9) Intervention 2: Placebo. Three times a day. Duration 12 weeks.
(n=20) adults Liver function tests: mean ALT levels at 12 weeks; mean AST levels at 12 weeks
low-calorie diet (1500 kcal/day for men, 1200 kcal/day for women), daily exercise
Leuschner 2010101
(n=95) Intervention 1: Ursodeoxycholic acid. 23-28 mg/kg of body weight/day; administered in 3 divided doses daily. Duration 18 months. (n=91) Intervention 2: Placebo. Administered in 3 divided doses daily. Duration 18 months.
(n=186) adults Progression of NAFLD: change in NAS, steatosis, ballooning, lobular inflammation and fibrosis at 18 months
Liver function tests: change in mean ALT levels at 18 months, change in mean AST levels at 18 months
Not reported
Lindor (n=80) Intervention (n=174) adults Progression of Not reported
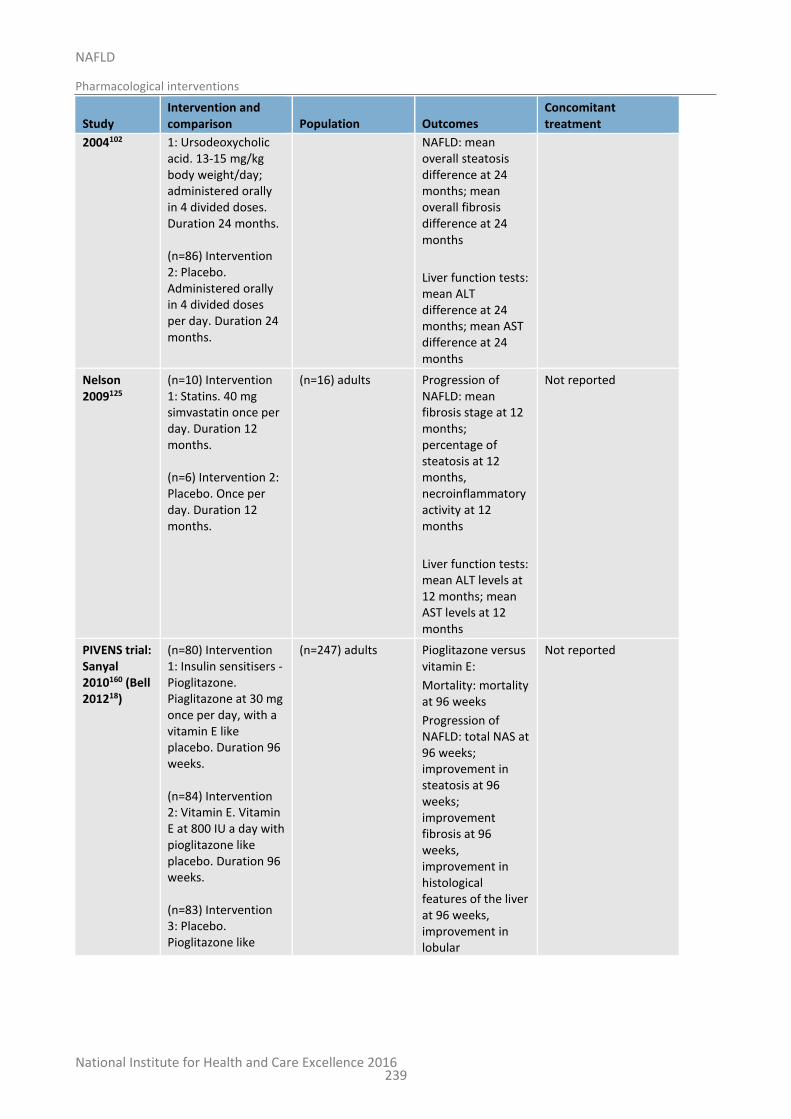
National Institute for Health and Care Excellence 2016
NAFLD
Pharmacological interventions
239
Study Intervention and comparison Population Outcomes
Concomitant treatment
2004102 1: Ursodeoxycholic acid. 13-15 mg/kg body weight/day; administered orally in 4 divided doses. Duration 24 months. (n=86) Intervention 2: Placebo. Administered orally in 4 divided doses per day. Duration 24 months.
NAFLD: mean overall steatosis difference at 24 months; mean overall fibrosis difference at 24 months
Liver function tests: mean ALT difference at 24 months; mean AST difference at 24 months
Nelson 2009125
(n=10) Intervention 1: Statins. 40 mg simvastatin once per day. Duration 12 months. (n=6) Intervention 2: Placebo. Once per day. Duration 12 months.
(n=16) adults Progression of NAFLD: mean fibrosis stage at 12 months; percentage of steatosis at 12 months, necroinflammatory activity at 12 months
Liver function tests: mean ALT levels at 12 months; mean AST levels at 12 months
Not reported
PIVENS trial: Sanyal 2010160 (Bell 201218)
(n=80) Intervention 1: Insulin sensitisers - Pioglitazone. Piaglitazone at 30 mg once per day, with a vitamin E like placebo. Duration 96 weeks. (n=84) Intervention 2: Vitamin E. Vitamin E at 800 IU a day with pioglitazone like placebo. Duration 96 weeks. (n=83) Intervention 3: Placebo. Pioglitazone like
(n=247) adults Pioglitazone versus vitamin E:
Mortality: mortality at 96 weeks
Progression of NAFLD: total NAS at 96 weeks; improvement in steatosis at 96 weeks; improvement fibrosis at 96 weeks, improvement in histological features of the liver at 96 weeks, improvement in lobular
Not reported
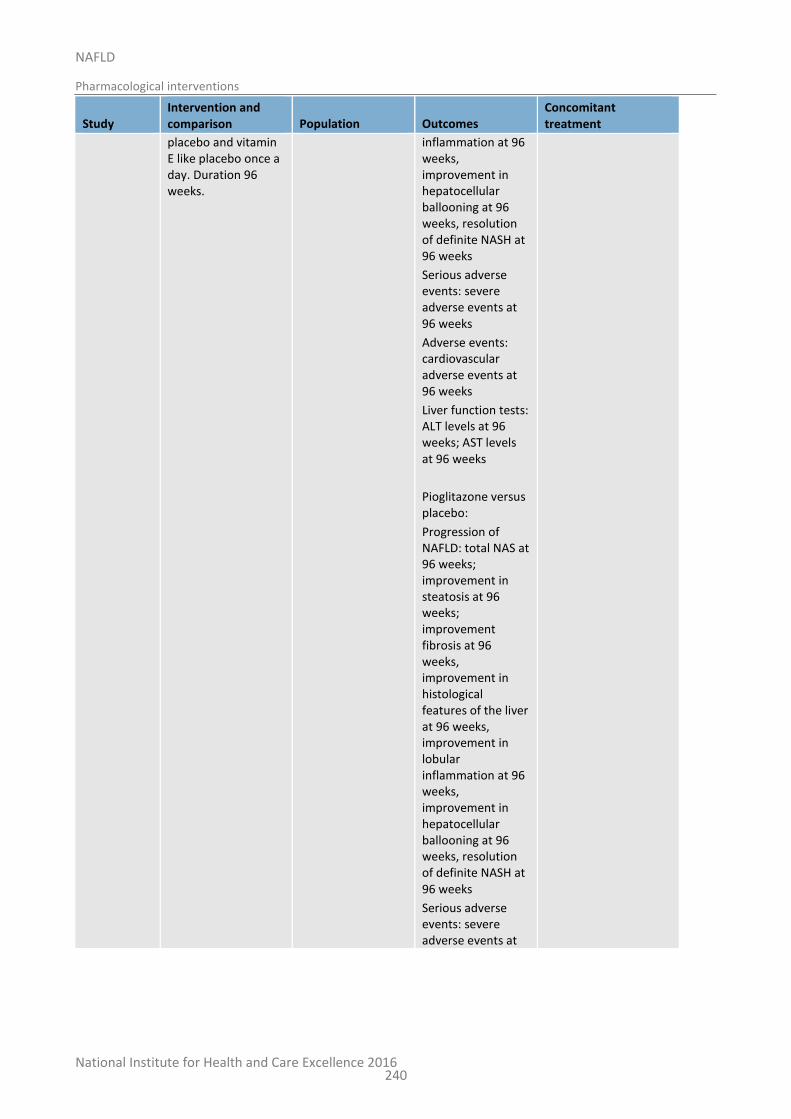
National Institute for Health and Care Excellence 2016
NAFLD
Pharmacological interventions
240
Study Intervention and comparison Population Outcomes
Concomitant treatment
placebo and vitamin E like placebo once a day. Duration 96 weeks.
inflammation at 96 weeks, improvement in hepatocellular ballooning at 96 weeks, resolution of definite NASH at 96 weeks
Serious adverse events: severe adverse events at 96 weeks
Adverse events: cardiovascular adverse events at 96 weeks
Liver function tests: ALT levels at 96 weeks; AST levels at 96 weeks
Pioglitazone versus placebo:
Progression of NAFLD: total NAS at 96 weeks; improvement in steatosis at 96 weeks; improvement fibrosis at 96 weeks, improvement in histological features of the liver at 96 weeks, improvement in lobular inflammation at 96 weeks, improvement in hepatocellular ballooning at 96 weeks, resolution of definite NASH at 96 weeks
Serious adverse events: severe adverse events at
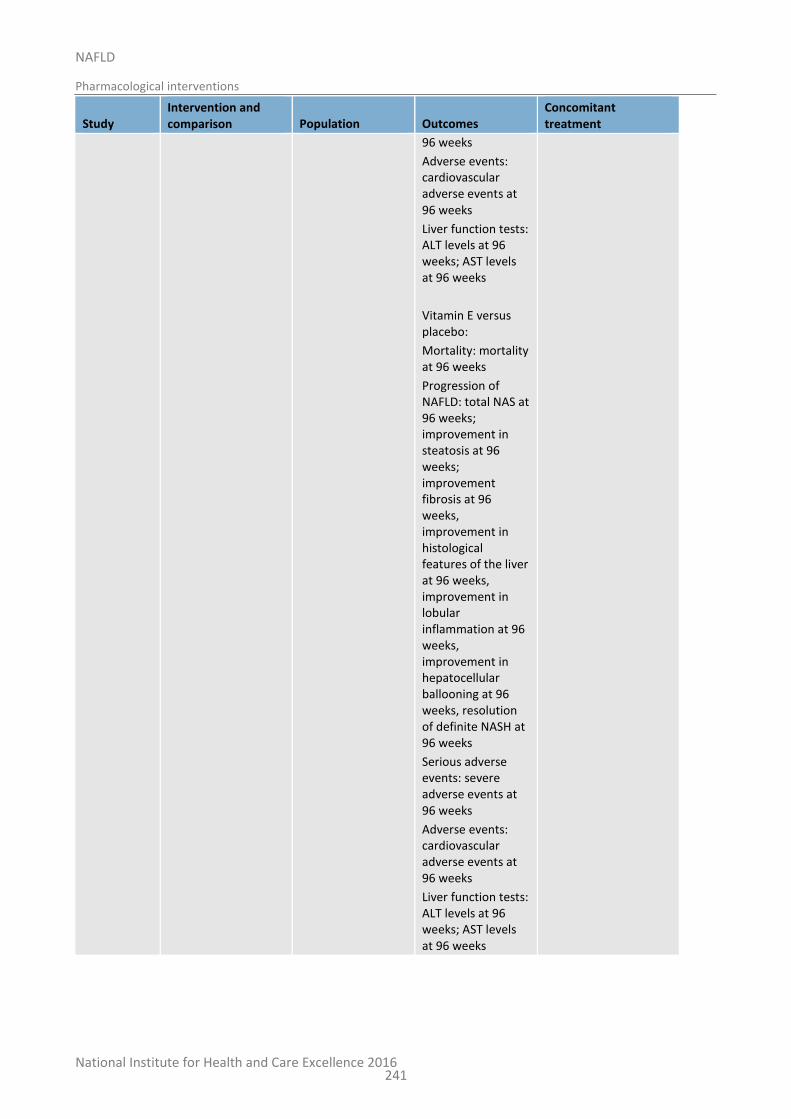
National Institute for Health and Care Excellence 2016
NAFLD
Pharmacological interventions
241
Study Intervention and comparison Population Outcomes
Concomitant treatment
96 weeks
Adverse events: cardiovascular adverse events at 96 weeks
Liver function tests: ALT levels at 96 weeks; AST levels at 96 weeks
Vitamin E versus placebo:
Mortality: mortality at 96 weeks
Progression of NAFLD: total NAS at 96 weeks; improvement in steatosis at 96 weeks; improvement fibrosis at 96 weeks, improvement in histological features of the liver at 96 weeks, improvement in lobular inflammation at 96 weeks, improvement in hepatocellular ballooning at 96 weeks, resolution of definite NASH at 96 weeks
Serious adverse events: severe adverse events at 96 weeks
Adverse events: cardiovascular adverse events at 96 weeks
Liver function tests: ALT levels at 96 weeks; AST levels at 96 weeks
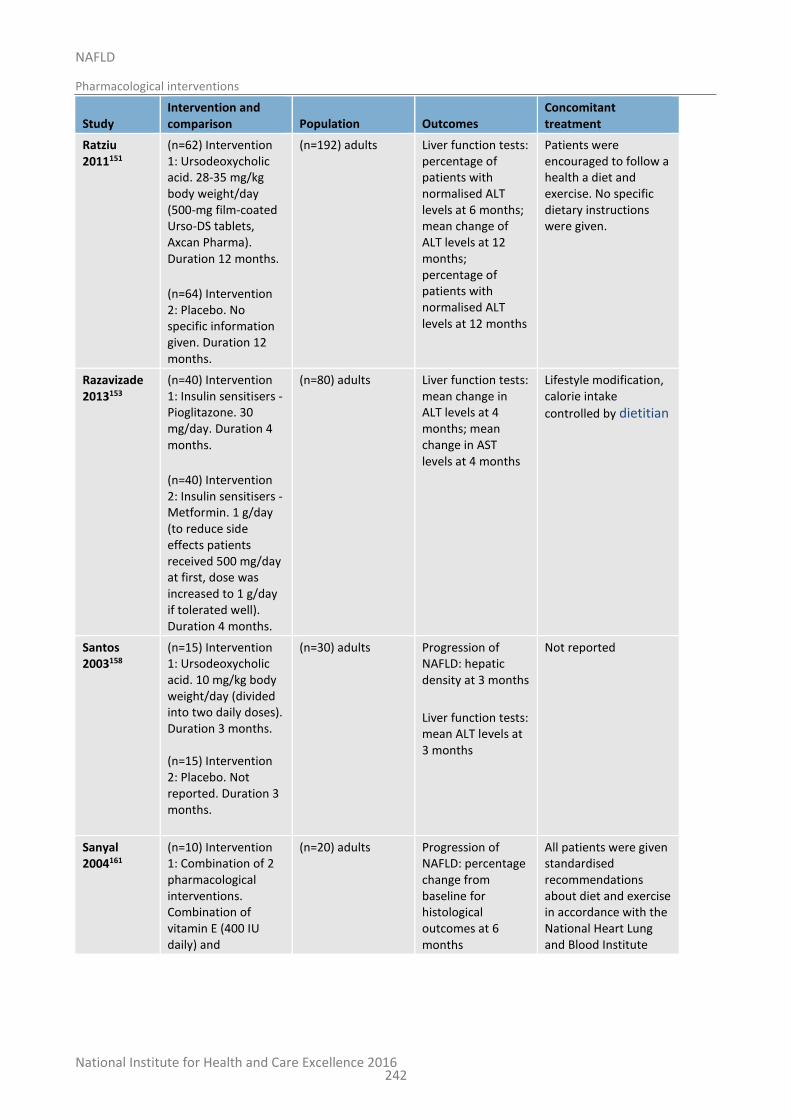
National Institute for Health and Care Excellence 2016
NAFLD
Pharmacological interventions
242
Study Intervention and comparison Population Outcomes
Concomitant treatment
Ratziu 2011151
(n=62) Intervention 1: Ursodeoxycholic acid. 28-35 mg/kg body weight/day (500-mg film-coated Urso-DS tablets, Axcan Pharma). Duration 12 months.
(n=64) Intervention 2: Placebo. No specific information given. Duration 12 months.
(n=192) adults Liver function tests: percentage of patients with normalised ALT levels at 6 months; mean change of ALT levels at 12 months; percentage of patients with normalised ALT levels at 12 months
Patients were encouraged to follow a health a diet and exercise. No specific dietary instructions were given.
Razavizade 2013153
(n=40) Intervention 1: Insulin sensitisers - Pioglitazone. 30 mg/day. Duration 4 months.
(n=40) Intervention 2: Insulin sensitisers - Metformin. 1 g/day (to reduce side effects patients received 500 mg/day at first, dose was increased to 1 g/day if tolerated well). Duration 4 months.
(n=80) adults Liver function tests: mean change in ALT levels at 4 months; mean change in AST levels at 4 months
Lifestyle modification, calorie intake
controlled by dietitian
Santos 2003158
(n=15) Intervention 1: Ursodeoxycholic acid. 10 mg/kg body weight/day (divided into two daily doses). Duration 3 months. (n=15) Intervention 2: Placebo. Not reported. Duration 3 months.
(n=30) adults Progression of NAFLD: hepatic density at 3 months
Liver function tests: mean ALT levels at 3 months
Not reported
Sanyal 2004161
(n=10) Intervention 1: Combination of 2 pharmacological interventions. Combination of vitamin E (400 IU daily) and
(n=20) adults Progression of NAFLD: percentage change from baseline for histological outcomes at 6 months
All patients were given standardised recommendations about diet and exercise in accordance with the National Heart Lung and Blood Institute
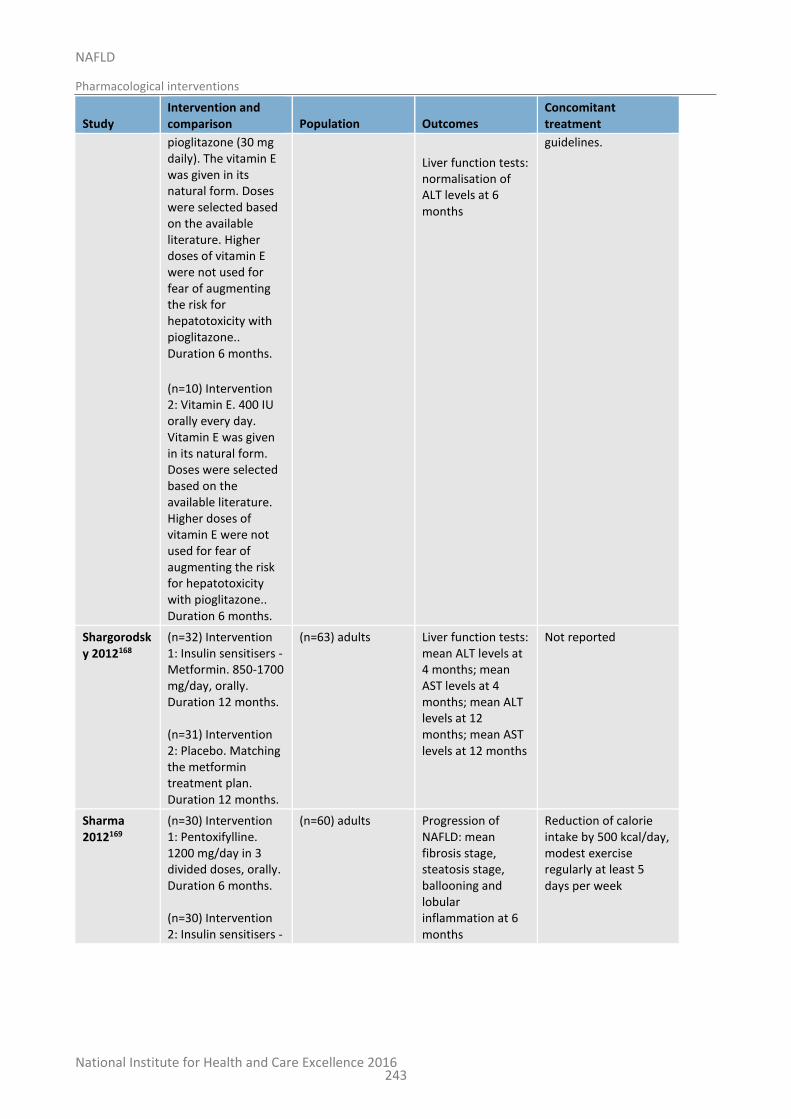
National Institute for Health and Care Excellence 2016
NAFLD
Pharmacological interventions
243
Study Intervention and comparison Population Outcomes
Concomitant treatment
pioglitazone (30 mg daily). The vitamin E was given in its natural form. Doses were selected based on the available literature. Higher doses of vitamin E were not used for fear of augmenting the risk for hepatotoxicity with pioglitazone.. Duration 6 months.
(n=10) Intervention 2: Vitamin E. 400 IU orally every day. Vitamin E was given in its natural form. Doses were selected based on the available literature. Higher doses of vitamin E were not used for fear of augmenting the risk for hepatotoxicity with pioglitazone.. Duration 6 months.
Liver function tests: normalisation of ALT levels at 6 months
guidelines.
Shargorodsky 2012168
(n=32) Intervention 1: Insulin sensitisers - Metformin. 850-1700 mg/day, orally. Duration 12 months. (n=31) Intervention 2: Placebo. Matching the metformin treatment plan. Duration 12 months.
(n=63) adults Liver function tests: mean ALT levels at 4 months; mean AST levels at 4 months; mean ALT levels at 12 months; mean AST levels at 12 months
Not reported
Sharma 2012169
(n=30) Intervention 1: Pentoxifylline. 1200 mg/day in 3 divided doses, orally. Duration 6 months. (n=30) Intervention 2: Insulin sensitisers -
(n=60) adults Progression of NAFLD: mean fibrosis stage, steatosis stage, ballooning and lobular inflammation at 6 months
Reduction of calorie intake by 500 kcal/day, modest exercise regularly at least 5 days per week
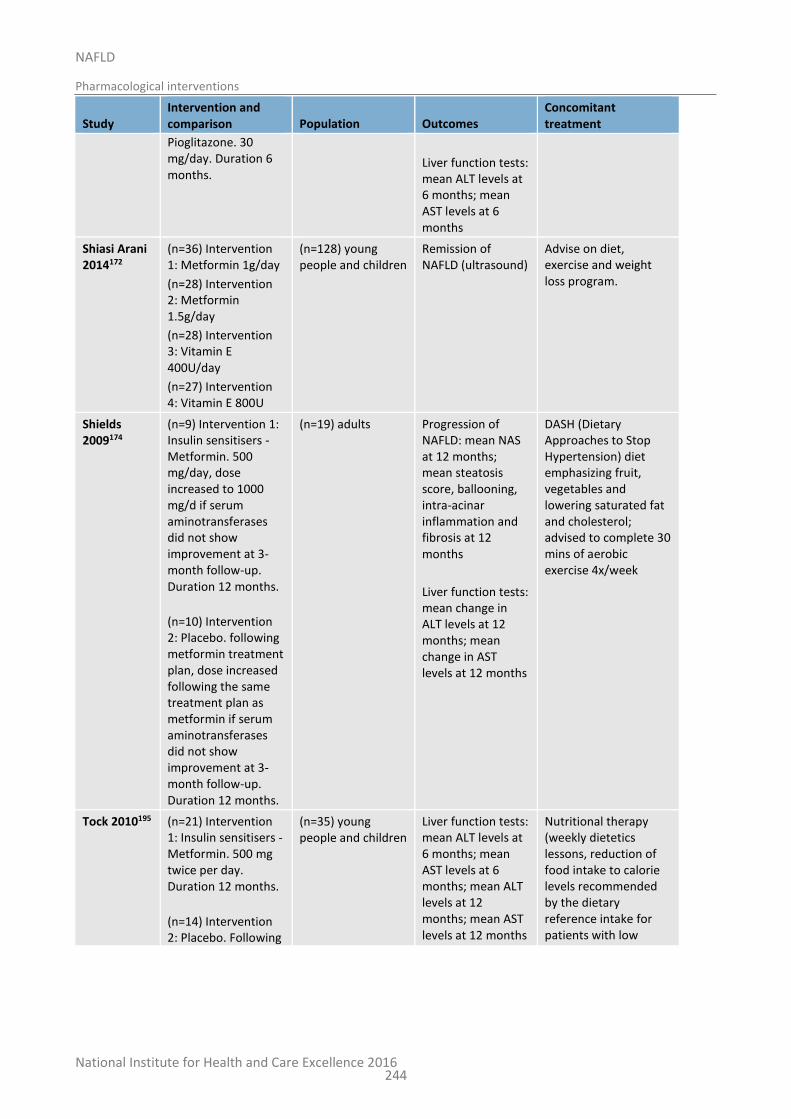
National Institute for Health and Care Excellence 2016
NAFLD
Pharmacological interventions
244
Study Intervention and comparison Population Outcomes
Concomitant treatment
Pioglitazone. 30 mg/day. Duration 6 months.
Liver function tests: mean ALT levels at 6 months; mean AST levels at 6 months
Shiasi Arani 2014172
(n=36) Intervention 1: Metformin 1g/day
(n=28) Intervention 2: Metformin 1.5g/day
(n=28) Intervention 3: Vitamin E 400U/day
(n=27) Intervention 4: Vitamin E 800U
(n=128) young people and children
Remission of NAFLD (ultrasound)
Advise on diet, exercise and weight loss program.
Shields 2009174
(n=9) Intervention 1: Insulin sensitisers - Metformin. 500 mg/day, dose increased to 1000 mg/d if serum aminotransferases did not show improvement at 3-month follow-up. Duration 12 months.
(n=10) Intervention 2: Placebo. following metformin treatment plan, dose increased following the same treatment plan as metformin if serum aminotransferases did not show improvement at 3-month follow-up. Duration 12 months.
(n=19) adults Progression of NAFLD: mean NAS at 12 months; mean steatosis score, ballooning, intra-acinar inflammation and fibrosis at 12 months
Liver function tests: mean change in ALT levels at 12 months; mean change in AST levels at 12 months
DASH (Dietary Approaches to Stop Hypertension) diet emphasizing fruit, vegetables and lowering saturated fat and cholesterol; advised to complete 30 mins of aerobic exercise 4x/week
Tock 2010195 (n=21) Intervention 1: Insulin sensitisers - Metformin. 500 mg twice per day. Duration 12 months.
(n=14) Intervention 2: Placebo. Following
(n=35) young people and children
Liver function tests: mean ALT levels at 6 months; mean AST levels at 6 months; mean ALT levels at 12 months; mean AST levels at 12 months
Nutritional therapy (weekly dietetics lessons, reduction of food intake to calorie levels recommended by the dietary reference intake for patients with low
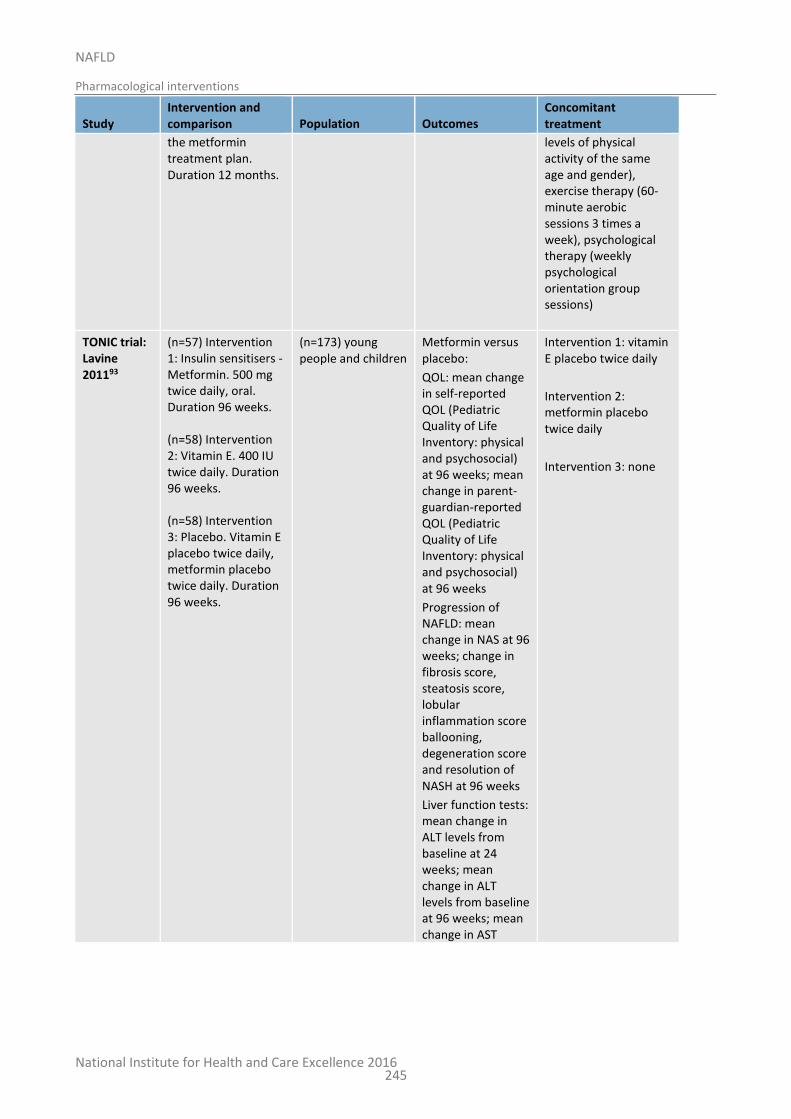
National Institute for Health and Care Excellence 2016
NAFLD
Pharmacological interventions
245
Study Intervention and comparison Population Outcomes
Concomitant treatment
the metformin treatment plan. Duration 12 months.
levels of physical activity of the same age and gender), exercise therapy (60-minute aerobic sessions 3 times a week), psychological therapy (weekly psychological orientation group sessions)
TONIC trial: Lavine 201193
(n=57) Intervention 1: Insulin sensitisers - Metformin. 500 mg twice daily, oral. Duration 96 weeks. (n=58) Intervention 2: Vitamin E. 400 IU twice daily. Duration 96 weeks. (n=58) Intervention 3: Placebo. Vitamin E placebo twice daily, metformin placebo twice daily. Duration 96 weeks.
(n=173) young people and children
Metformin versus placebo:
QOL: mean change in self-reported QOL (Pediatric Quality of Life Inventory: physical and psychosocial) at 96 weeks; mean change in parent-guardian-reported QOL (Pediatric Quality of Life Inventory: physical and psychosocial) at 96 weeks
Progression of NAFLD: mean change in NAS at 96 weeks; change in fibrosis score, steatosis score, lobular inflammation score ballooning, degeneration score and resolution of NASH at 96 weeks
Liver function tests: mean change in ALT levels from baseline at 24 weeks; mean change in ALT levels from baseline at 96 weeks; mean change in AST
Intervention 1: vitamin E placebo twice daily
Intervention 2: metformin placebo twice daily
Intervention 3: none
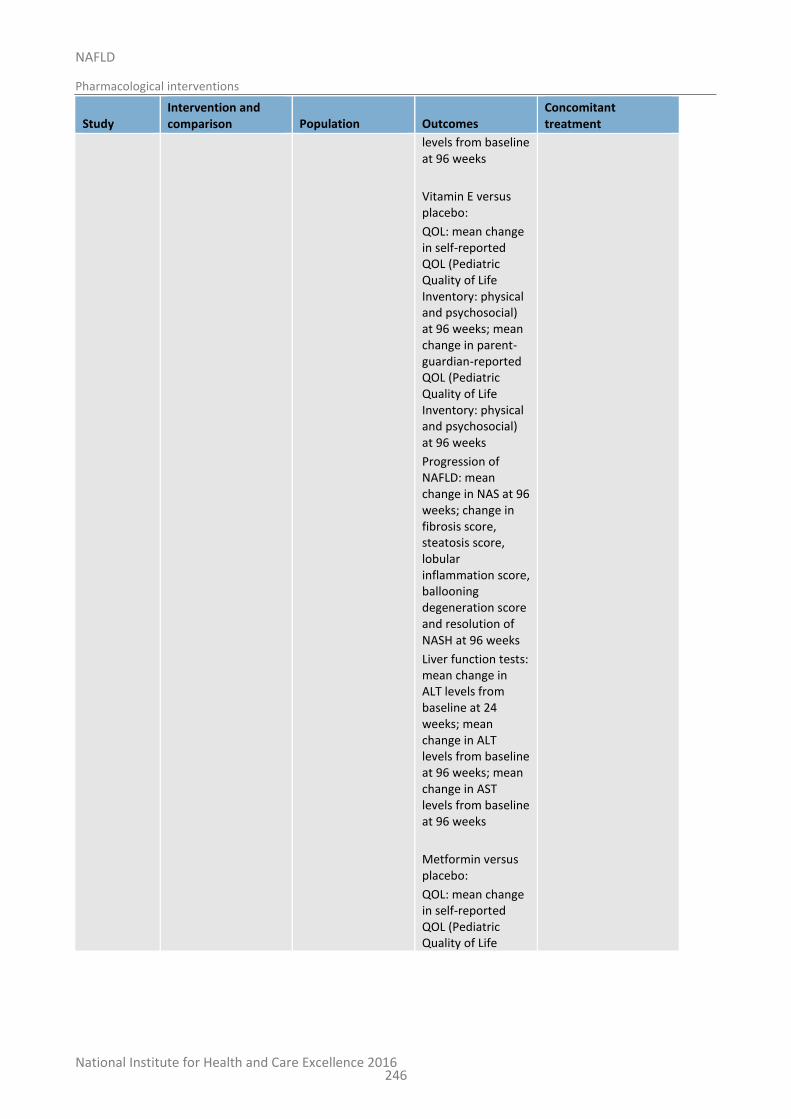
National Institute for Health and Care Excellence 2016
NAFLD
Pharmacological interventions
246
Study Intervention and comparison Population Outcomes
Concomitant treatment
levels from baseline at 96 weeks
Vitamin E versus placebo:
QOL: mean change in self-reported QOL (Pediatric Quality of Life Inventory: physical and psychosocial) at 96 weeks; mean change in parent-guardian-reported QOL (Pediatric Quality of Life Inventory: physical and psychosocial) at 96 weeks
Progression of NAFLD: mean change in NAS at 96 weeks; change in fibrosis score, steatosis score, lobular inflammation score, ballooning degeneration score and resolution of NASH at 96 weeks
Liver function tests: mean change in ALT levels from baseline at 24 weeks; mean change in ALT levels from baseline at 96 weeks; mean change in AST levels from baseline at 96 weeks
Metformin versus placebo:
QOL: mean change in self-reported QOL (Pediatric Quality of Life
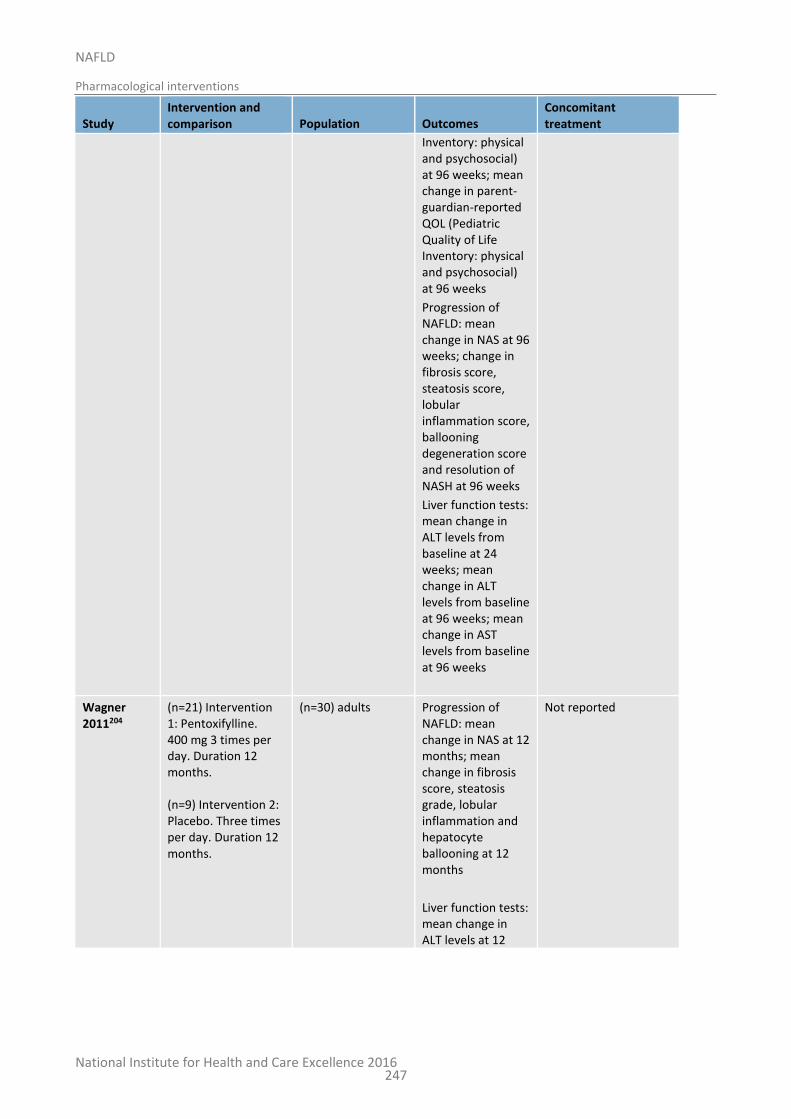
National Institute for Health and Care Excellence 2016
NAFLD
Pharmacological interventions
247
Study Intervention and comparison Population Outcomes
Concomitant treatment
Inventory: physical and psychosocial) at 96 weeks; mean change in parent-guardian-reported QOL (Pediatric Quality of Life Inventory: physical and psychosocial) at 96 weeks
Progression of NAFLD: mean change in NAS at 96 weeks; change in fibrosis score, steatosis score, lobular inflammation score, ballooning degeneration score and resolution of NASH at 96 weeks
Liver function tests: mean change in ALT levels from baseline at 24 weeks; mean change in ALT levels from baseline at 96 weeks; mean change in AST levels from baseline at 96 weeks
Wagner 2011204
(n=21) Intervention 1: Pentoxifylline. 400 mg 3 times per day. Duration 12 months. (n=9) Intervention 2: Placebo. Three times per day. Duration 12 months.
(n=30) adults Progression of NAFLD: mean change in NAS at 12 months; mean change in fibrosis score, steatosis grade, lobular inflammation and hepatocyte ballooning at 12 months
Liver function tests: mean change in ALT levels at 12
Not reported
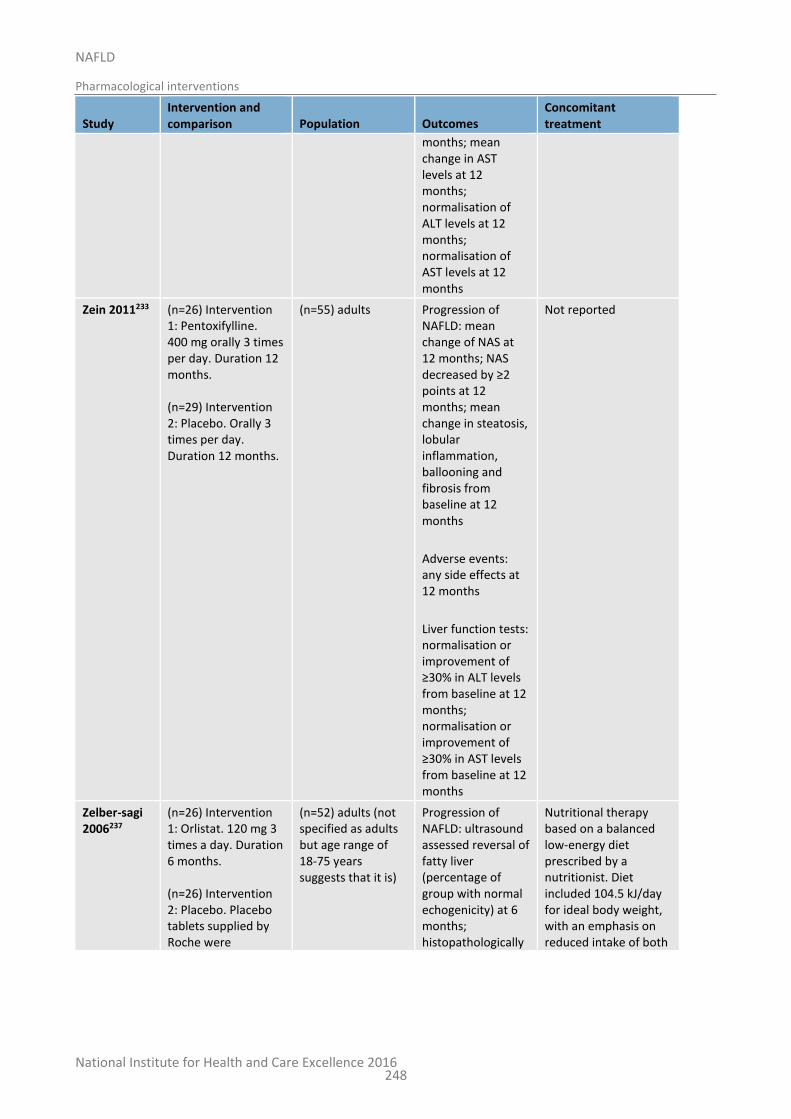
National Institute for Health and Care Excellence 2016
NAFLD
Pharmacological interventions
248
Study Intervention and comparison Population Outcomes
Concomitant treatment
months; mean change in AST levels at 12 months; normalisation of ALT levels at 12 months; normalisation of AST levels at 12 months
Zein 2011233 (n=26) Intervention 1: Pentoxifylline. 400 mg orally 3 times per day. Duration 12 months. (n=29) Intervention 2: Placebo. Orally 3 times per day. Duration 12 months.
(n=55) adults Progression of NAFLD: mean change of NAS at 12 months; NAS decreased by ≥2 points at 12 months; mean change in steatosis, lobular inflammation, ballooning and fibrosis from baseline at 12 months
Adverse events: any side effects at 12 months
Liver function tests: normalisation or improvement of ≥30% in ALT levels from baseline at 12 months; normalisation or improvement of ≥30% in AST levels from baseline at 12 months
Not reported
Zelber-sagi 2006237
(n=26) Intervention 1: Orlistat. 120 mg 3 times a day. Duration 6 months. (n=26) Intervention 2: Placebo. Placebo tablets supplied by Roche were
(n=52) adults (not specified as adults but age range of 18-75 years suggests that it is)
Progression of NAFLD: ultrasound assessed reversal of fatty liver (percentage of group with normal echogenicity) at 6 months; histopathologically
Nutritional therapy based on a balanced low-energy diet prescribed by a nutritionist. Diet included 104.5 kJ/day for ideal body weight, with an emphasis on reduced intake of both
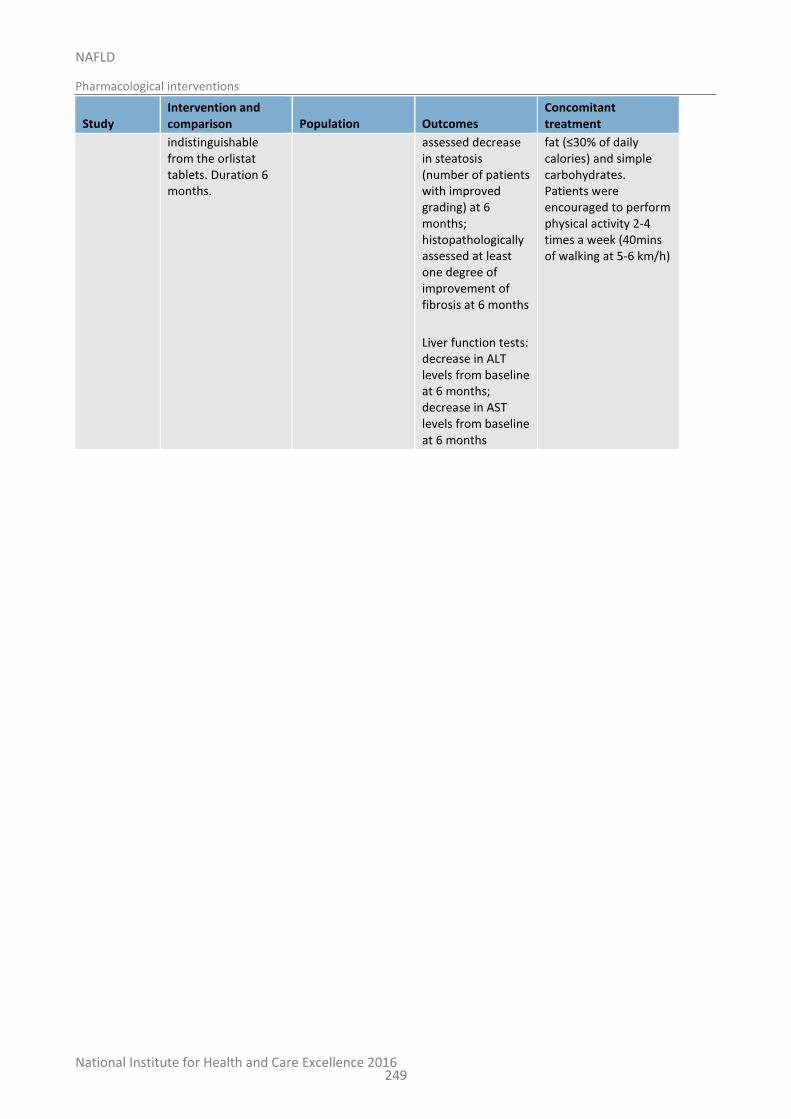
National Institute for Health and Care Excellence 2016
NAFLD
Pharmacological interventions
249
Study Intervention and comparison Population Outcomes
Concomitant treatment
indistinguishable from the orlistat tablets. Duration 6 months.
assessed decrease in steatosis (number of patients with improved grading) at 6 months; histopathologically assessed at least one degree of improvement of fibrosis at 6 months
Liver function tests: decrease in ALT levels from baseline at 6 months; decrease in AST levels from baseline at 6 months
fat (≤30% of daily calories) and simple carbohydrates. Patients were encouraged to perform physical activity 2-4 times a week (40mins of walking at 5-6 km/h)
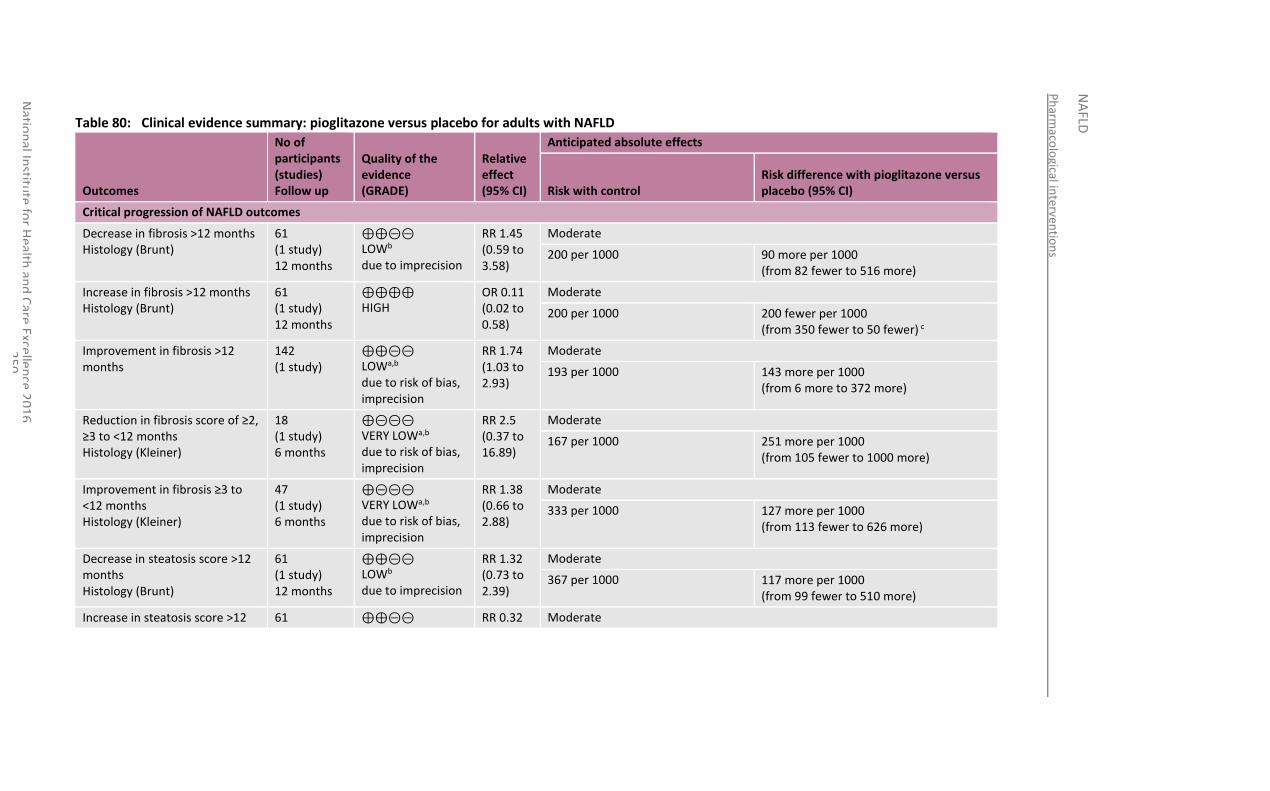
Ph
armaco
logical in
terven
tion
s
NA
FLD
Natio
nal In
stitute
for H
ealth an
d C
are Excellen
ce 20
16
2
50
Table 80: Clinical evidence summary: pioglitazone versus placebo for adults with NAFLD
Outcomes
No of participants (studies) Follow up
Quality of the evidence (GRADE)
Relative effect (95% CI)
Anticipated absolute effects
Risk with control Risk difference with pioglitazone versus placebo (95% CI)
Critical progression of NAFLD outcomes
Decrease in fibrosis >12 months Histology (Brunt)
61 (1 study) 12 months
⊕⊕⊝⊝ LOWb due to imprecision
RR 1.45 (0.59 to 3.58)
Moderate
200 per 1000 90 more per 1000 (from 82 fewer to 516 more)
Increase in fibrosis >12 months Histology (Brunt)
61 (1 study) 12 months
⊕⊕⊕⊕ HIGH
OR 0.11 (0.02 to 0.58)
Moderate
200 per 1000 200 fewer per 1000 (from 350 fewer to 50 fewer) c
Improvement in fibrosis >12 months
142 (1 study)
⊕⊕⊝⊝ LOWa,b due to risk of bias, imprecision
RR 1.74 (1.03 to 2.93)
Moderate
193 per 1000 143 more per 1000 (from 6 more to 372 more)
Reduction in fibrosis score of ≥2, ≥3 to <12 months Histology (Kleiner)
18 (1 study) 6 months
⊕⊝⊝⊝ VERY LOWa,b due to risk of bias, imprecision
RR 2.5 (0.37 to 16.89)
Moderate
167 per 1000 251 more per 1000 (from 105 fewer to 1000 more)
Improvement in fibrosis ≥3 to <12 months Histology (Kleiner)
47 (1 study) 6 months
⊕⊝⊝⊝ VERY LOWa,b due to risk of bias, imprecision
RR 1.38 (0.66 to 2.88)
Moderate
333 per 1000 127 more per 1000 (from 113 fewer to 626 more)
Decrease in steatosis score >12 months Histology (Brunt)
61 (1 study) 12 months
⊕⊕⊝⊝ LOWb due to imprecision
RR 1.32 (0.73 to 2.39)
Moderate
367 per 1000 117 more per 1000 (from 99 fewer to 510 more)
Increase in steatosis score >12 61 ⊕⊕⊝⊝ RR 0.32 Moderate
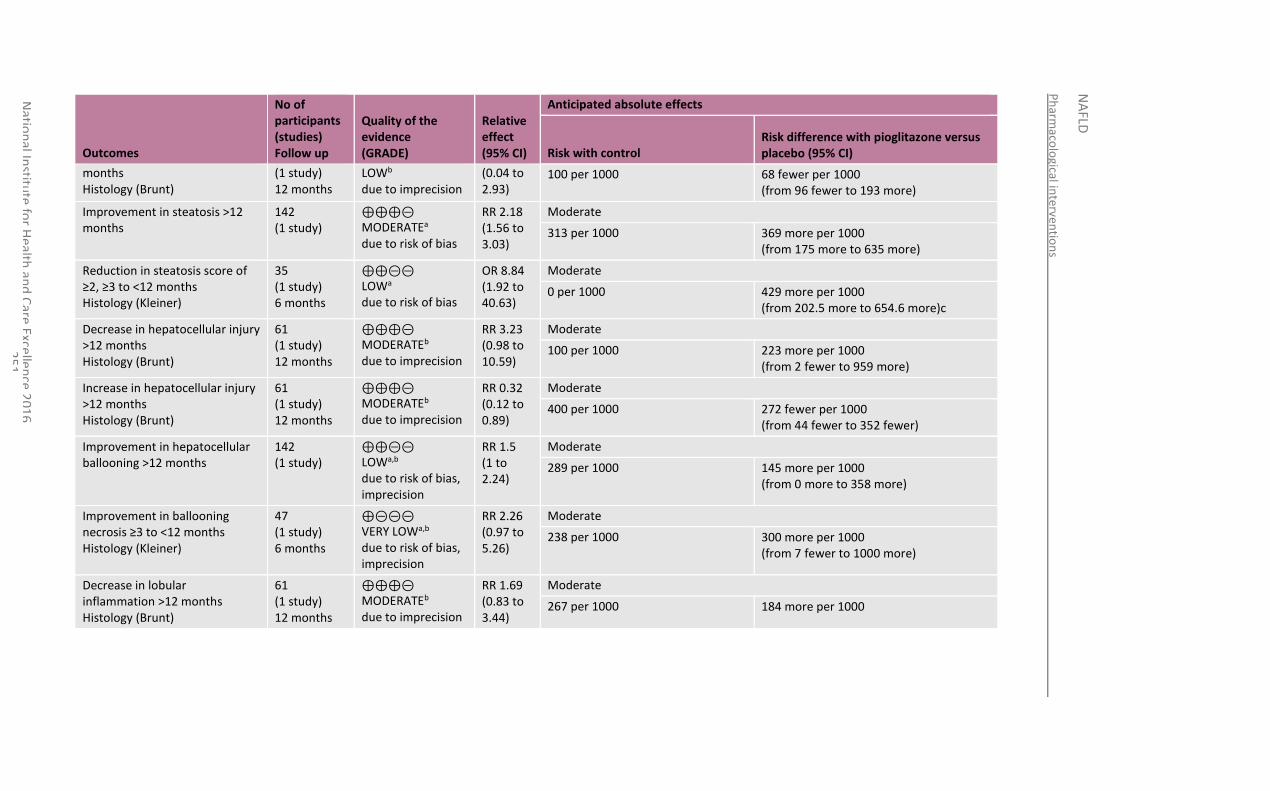
Ph
armaco
logical in
terventio
ns
NA
FLD
Natio
nal In
stitute
for H
ealth an
d C
are Excellen
ce 20
16
2
51
Outcomes
No of participants (studies) Follow up
Quality of the evidence (GRADE)
Relative effect (95% CI)
Anticipated absolute effects
Risk with control Risk difference with pioglitazone versus placebo (95% CI)
months Histology (Brunt)
(1 study) 12 months
LOWb due to imprecision
(0.04 to 2.93)
100 per 1000 68 fewer per 1000 (from 96 fewer to 193 more)
Improvement in steatosis >12 months
142 (1 study)
⊕⊕⊕⊝ MODERATEa due to risk of bias
RR 2.18 (1.56 to 3.03)
Moderate
313 per 1000 369 more per 1000 (from 175 more to 635 more)
Reduction in steatosis score of ≥2, ≥3 to <12 months Histology (Kleiner)
35 (1 study) 6 months
⊕⊕⊝⊝ LOWa due to risk of bias
OR 8.84 (1.92 to 40.63)
Moderate
0 per 1000 429 more per 1000 (from 202.5 more to 654.6 more)c
Decrease in hepatocellular injury >12 months Histology (Brunt)
61 (1 study) 12 months
⊕⊕⊕⊝ MODERATEb due to imprecision
RR 3.23 (0.98 to 10.59)
Moderate
100 per 1000 223 more per 1000 (from 2 fewer to 959 more)
Increase in hepatocellular injury >12 months Histology (Brunt)
61 (1 study) 12 months
⊕⊕⊕⊝ MODERATEb due to imprecision
RR 0.32 (0.12 to 0.89)
Moderate
400 per 1000 272 fewer per 1000 (from 44 fewer to 352 fewer)
Improvement in hepatocellular ballooning >12 months
142 (1 study)
⊕⊕⊝⊝ LOWa,b due to risk of bias, imprecision
RR 1.5 (1 to 2.24)
Moderate
289 per 1000 145 more per 1000 (from 0 more to 358 more)
Improvement in ballooning necrosis ≥3 to <12 months Histology (Kleiner)
47 (1 study) 6 months
⊕⊝⊝⊝ VERY LOWa,b due to risk of bias, imprecision
RR 2.26 (0.97 to 5.26)
Moderate
238 per 1000 300 more per 1000 (from 7 fewer to 1000 more)
Decrease in lobular inflammation >12 months Histology (Brunt)
61 (1 study) 12 months
⊕⊕⊕⊝ MODERATEb due to imprecision
RR 1.69 (0.83 to 3.44)
Moderate
267 per 1000 184 more per 1000
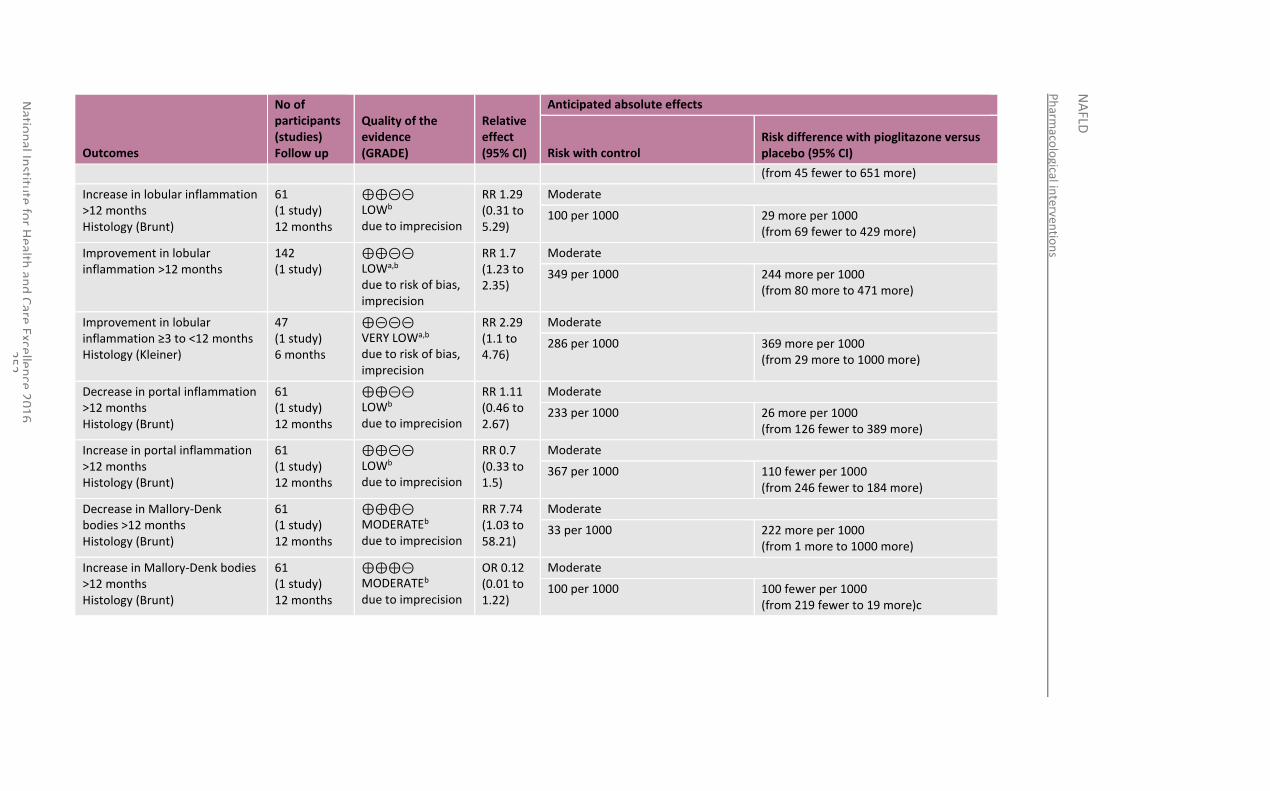
Ph
armaco
logical in
terventio
ns
NA
FLD
Natio
nal In
stitute
for H
ealth an
d C
are Excellen
ce 20
16
2
52
Outcomes
No of participants (studies) Follow up
Quality of the evidence (GRADE)
Relative effect (95% CI)
Anticipated absolute effects
Risk with control Risk difference with pioglitazone versus placebo (95% CI)
(from 45 fewer to 651 more)
Increase in lobular inflammation >12 months Histology (Brunt)
61 (1 study) 12 months
⊕⊕⊝⊝ LOWb due to imprecision
RR 1.29 (0.31 to 5.29)
Moderate
100 per 1000 29 more per 1000 (from 69 fewer to 429 more)
Improvement in lobular inflammation >12 months
142 (1 study)
⊕⊕⊝⊝ LOWa,b due to risk of bias, imprecision
RR 1.7 (1.23 to 2.35)
Moderate
349 per 1000 244 more per 1000 (from 80 more to 471 more)
Improvement in lobular inflammation ≥3 to <12 months Histology (Kleiner)
47 (1 study) 6 months
⊕⊝⊝⊝ VERY LOWa,b due to risk of bias, imprecision
RR 2.29 (1.1 to 4.76)
Moderate
286 per 1000 369 more per 1000 (from 29 more to 1000 more)
Decrease in portal inflammation >12 months Histology (Brunt)
61 (1 study) 12 months
⊕⊕⊝⊝ LOWb due to imprecision
RR 1.11 (0.46 to 2.67)
Moderate
233 per 1000 26 more per 1000 (from 126 fewer to 389 more)
Increase in portal inflammation >12 months Histology (Brunt)
61 (1 study) 12 months
⊕⊕⊝⊝ LOWb due to imprecision
RR 0.7 (0.33 to 1.5)
Moderate
367 per 1000 110 fewer per 1000 (from 246 fewer to 184 more)
Decrease in Mallory-Denk bodies >12 months Histology (Brunt)
61 (1 study) 12 months
⊕⊕⊕⊝ MODERATEb due to imprecision
RR 7.74 (1.03 to 58.21)
Moderate
33 per 1000 222 more per 1000 (from 1 more to 1000 more)
Increase in Mallory-Denk bodies >12 months Histology (Brunt)
61 (1 study) 12 months
⊕⊕⊕⊝ MODERATEb due to imprecision
OR 0.12 (0.01 to 1.22)
Moderate
100 per 1000 100 fewer per 1000 (from 219 fewer to 19 more)c
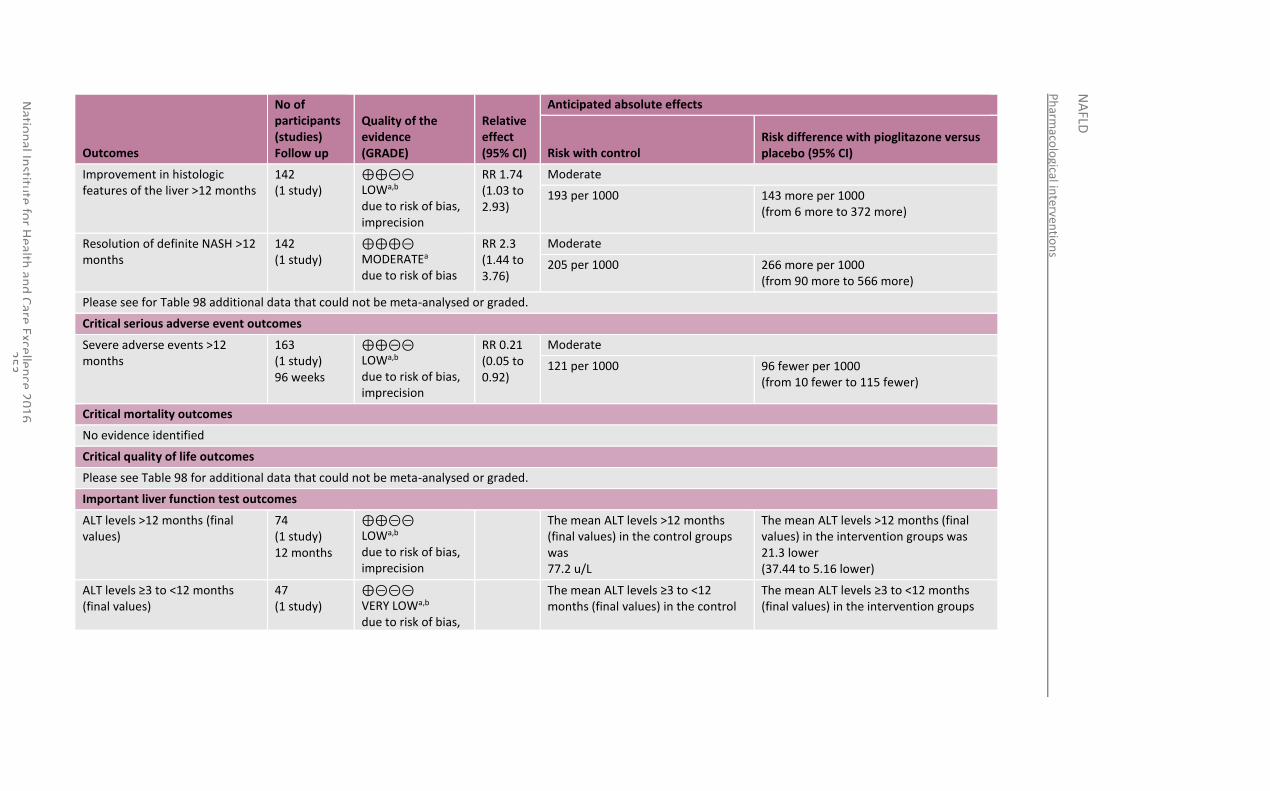
Ph
armaco
logical in
terventio
ns
NA
FLD
Natio
nal In
stitute
for H
ealth an
d C
are Excellen
ce 20
16
2
53
Outcomes
No of participants (studies) Follow up
Quality of the evidence (GRADE)
Relative effect (95% CI)
Anticipated absolute effects
Risk with control Risk difference with pioglitazone versus placebo (95% CI)
Improvement in histologic features of the liver >12 months
142 (1 study)
⊕⊕⊝⊝ LOWa,b due to risk of bias, imprecision
RR 1.74 (1.03 to 2.93)
Moderate
193 per 1000 143 more per 1000 (from 6 more to 372 more)
Resolution of definite NASH >12 months
142 (1 study)
⊕⊕⊕⊝ MODERATEa due to risk of bias
RR 2.3 (1.44 to 3.76)
Moderate
205 per 1000 266 more per 1000 (from 90 more to 566 more)
Please see for Table 98 additional data that could not be meta-analysed or graded.
Critical serious adverse event outcomes
Severe adverse events >12 months
163 (1 study) 96 weeks
⊕⊕⊝⊝ LOWa,b due to risk of bias, imprecision
RR 0.21 (0.05 to 0.92)
Moderate
121 per 1000 96 fewer per 1000 (from 10 fewer to 115 fewer)
Critical mortality outcomes
No evidence identified
Critical quality of life outcomes
Please see Table 98 for additional data that could not be meta-analysed or graded.
Important liver function test outcomes
ALT levels >12 months (final values)
74 (1 study) 12 months
⊕⊕⊝⊝ LOWa,b due to risk of bias, imprecision
The mean ALT levels >12 months (final values) in the control groups was 77.2 u/L
The mean ALT levels >12 months (final values) in the intervention groups was 21.3 lower (37.44 to 5.16 lower)
ALT levels ≥3 to <12 months (final values)
47 (1 study)
⊕⊝⊝⊝ VERY LOWa,b due to risk of bias,
The mean ALT levels ≥3 to <12 months (final values) in the control
The mean ALT levels ≥3 to <12 months (final values) in the intervention groups
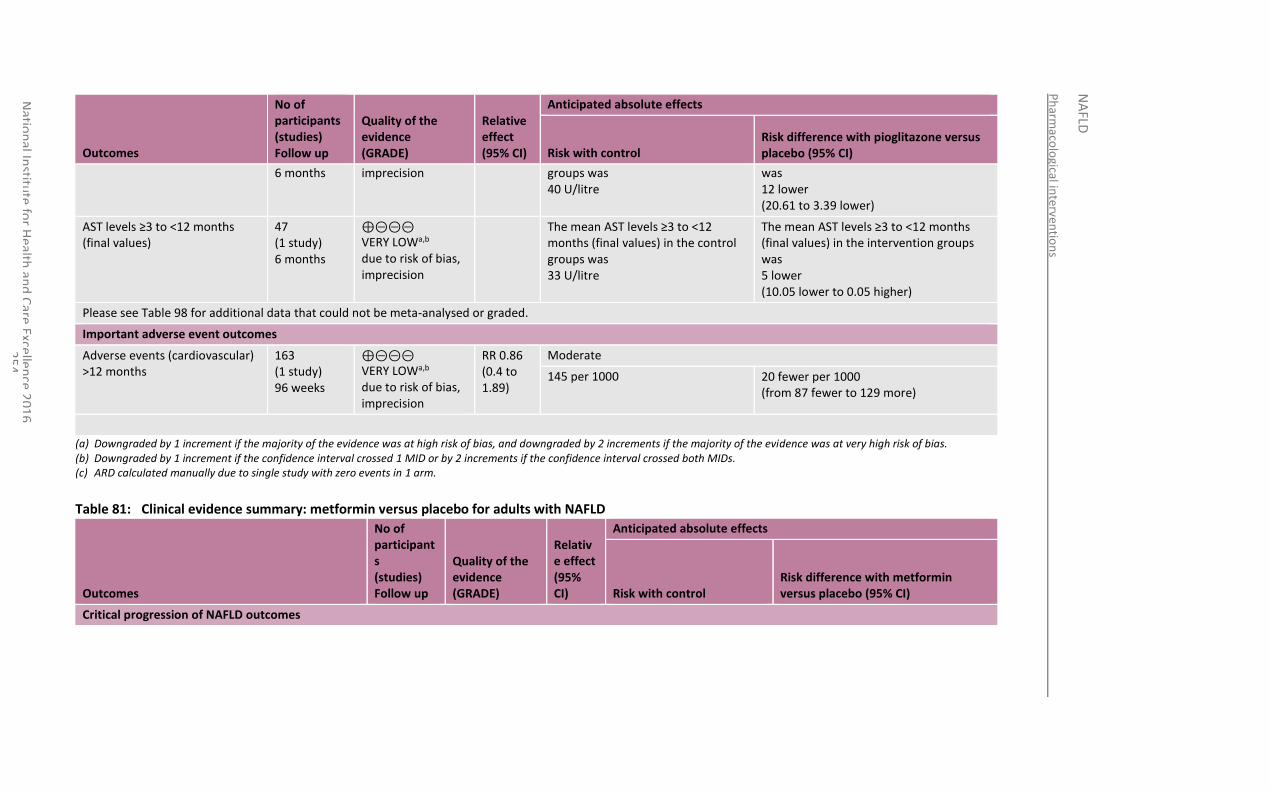
Ph
armaco
logical in
terventio
ns
NA
FLD
Natio
nal In
stitute
for H
ealth an
d C
are Excellen
ce 20
16
2
54
Outcomes
No of participants (studies) Follow up
Quality of the evidence (GRADE)
Relative effect (95% CI)
Anticipated absolute effects
Risk with control Risk difference with pioglitazone versus placebo (95% CI)
6 months imprecision groups was 40 U/litre
was 12 lower (20.61 to 3.39 lower)
AST levels ≥3 to <12 months (final values)
47 (1 study) 6 months
⊕⊝⊝⊝ VERY LOWa,b due to risk of bias, imprecision
The mean AST levels ≥3 to <12 months (final values) in the control groups was 33 U/litre
The mean AST levels ≥3 to <12 months (final values) in the intervention groups was 5 lower (10.05 lower to 0.05 higher)
Please see Table 98 for additional data that could not be meta-analysed or graded.
Important adverse event outcomes
Adverse events (cardiovascular) >12 months
163 (1 study) 96 weeks
⊕⊝⊝⊝ VERY LOWa,b due to risk of bias, imprecision
RR 0.86 (0.4 to 1.89)
Moderate
145 per 1000 20 fewer per 1000 (from 87 fewer to 129 more)
(a) Downgraded by 1 increment if the majority of the evidence was at high risk of bias, and downgraded by 2 increments if the majority of the evidence was at very high risk of bias. (b) Downgraded by 1 increment if the confidence interval crossed 1 MID or by 2 increments if the confidence interval crossed both MIDs. (c) ARD calculated manually due to single study with zero events in 1 arm.
Table 81: Clinical evidence summary: metformin versus placebo for adults with NAFLD
Outcomes
No of participants (studies) Follow up
Quality of the evidence (GRADE)
Relative effect (95% CI)
Anticipated absolute effects
Risk with control Risk difference with metformin versus placebo (95% CI)
Critical progression of NAFLD outcomes
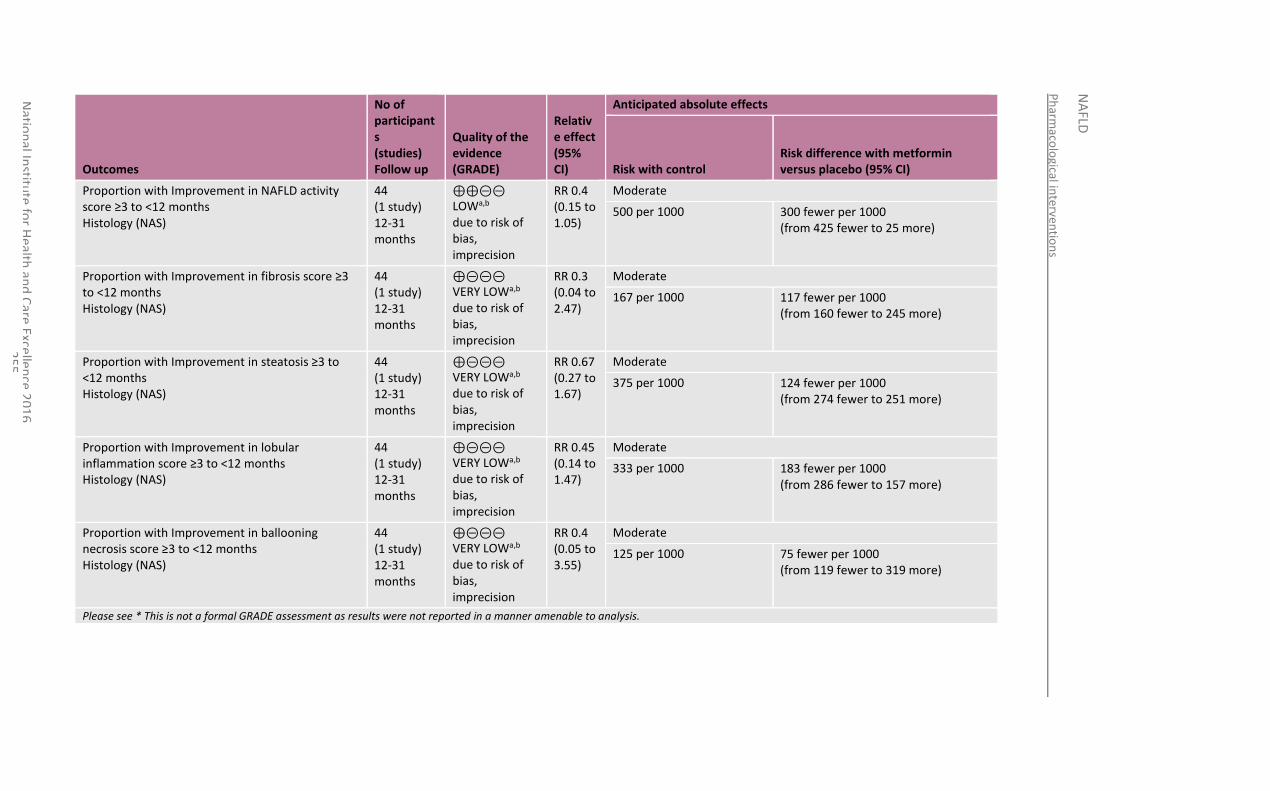
Ph
armaco
logical in
terventio
ns
NA
FLD
Natio
nal In
stitute
for H
ealth an
d C
are Excellen
ce 20
16
2
55
Outcomes
No of participants (studies) Follow up
Quality of the evidence (GRADE)
Relative effect (95% CI)
Anticipated absolute effects
Risk with control Risk difference with metformin versus placebo (95% CI)
Proportion with Improvement in NAFLD activity score ≥3 to <12 months Histology (NAS)
44 (1 study) 12-31 months
⊕⊕⊝⊝ LOWa,b due to risk of bias, imprecision
RR 0.4 (0.15 to 1.05)
Moderate
500 per 1000 300 fewer per 1000 (from 425 fewer to 25 more)
Proportion with Improvement in fibrosis score ≥3 to <12 months Histology (NAS)
44 (1 study) 12-31 months
⊕⊝⊝⊝ VERY LOWa,b due to risk of bias, imprecision
RR 0.3 (0.04 to 2.47)
Moderate
167 per 1000 117 fewer per 1000 (from 160 fewer to 245 more)
Proportion with Improvement in steatosis ≥3 to <12 months Histology (NAS)
44 (1 study) 12-31 months
⊕⊝⊝⊝ VERY LOWa,b due to risk of bias, imprecision
RR 0.67 (0.27 to 1.67)
Moderate
375 per 1000 124 fewer per 1000 (from 274 fewer to 251 more)
Proportion with Improvement in lobular inflammation score ≥3 to <12 months Histology (NAS)
44 (1 study) 12-31 months
⊕⊝⊝⊝ VERY LOWa,b due to risk of bias, imprecision
RR 0.45 (0.14 to 1.47)
Moderate
333 per 1000 183 fewer per 1000 (from 286 fewer to 157 more)
Proportion with Improvement in ballooning necrosis score ≥3 to <12 months Histology (NAS)
44 (1 study) 12-31 months
⊕⊝⊝⊝ VERY LOWa,b due to risk of bias, imprecision
RR 0.4 (0.05 to 3.55)
Moderate
125 per 1000 75 fewer per 1000 (from 119 fewer to 319 more)
Please see * This is not a formal GRADE assessment as results were not reported in a manner amenable to analysis.
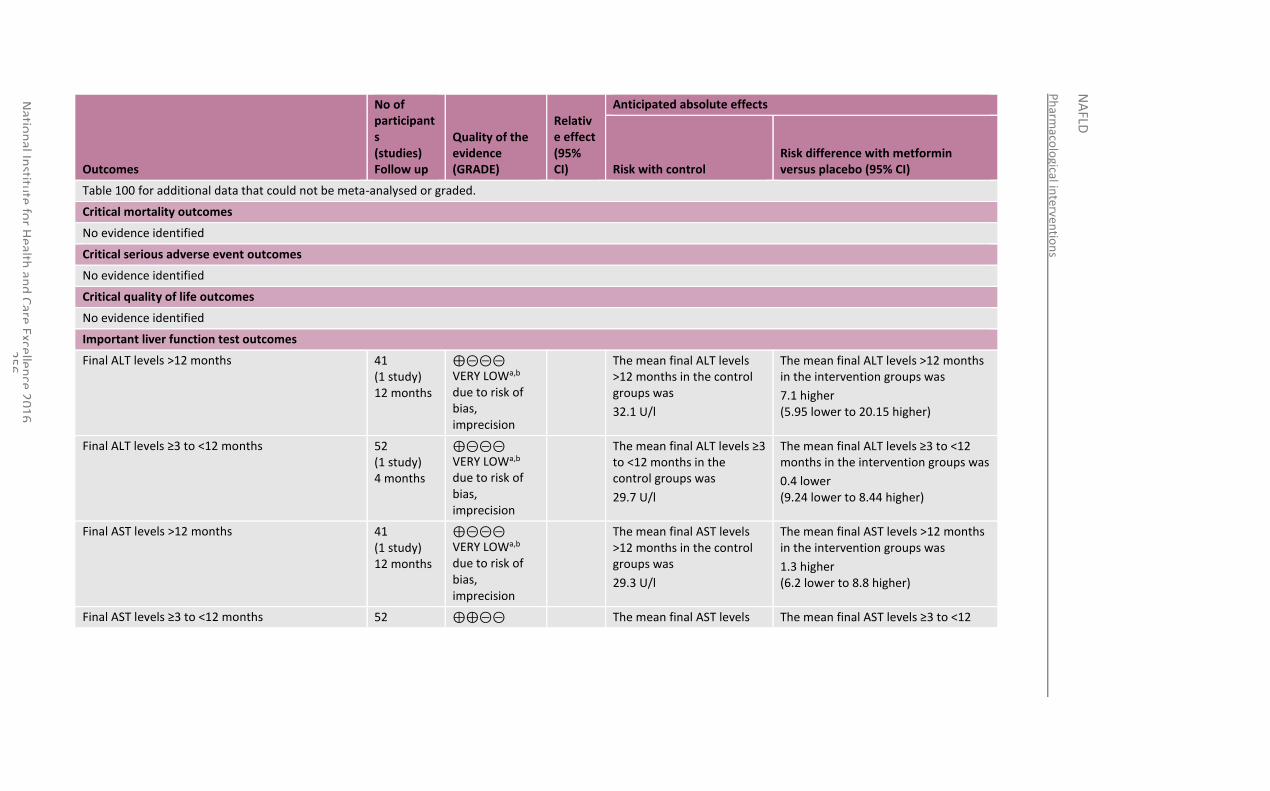
Ph
armaco
logical in
terventio
ns
NA
FLD
Natio
nal In
stitute
for H
ealth an
d C
are Excellen
ce 20
16
2
56
Outcomes
No of participants (studies) Follow up
Quality of the evidence (GRADE)
Relative effect (95% CI)
Anticipated absolute effects
Risk with control Risk difference with metformin versus placebo (95% CI)
Table 100 for additional data that could not be meta-analysed or graded.
Critical mortality outcomes
No evidence identified
Critical serious adverse event outcomes
No evidence identified
Critical quality of life outcomes
No evidence identified
Important liver function test outcomes
Final ALT levels >12 months 41 (1 study) 12 months
⊕⊝⊝⊝ VERY LOWa,b due to risk of bias, imprecision
The mean final ALT levels >12 months in the control groups was
32.1 U/l
The mean final ALT levels >12 months in the intervention groups was
7.1 higher (5.95 lower to 20.15 higher)
Final ALT levels ≥3 to <12 months 52 (1 study) 4 months
⊕⊝⊝⊝ VERY LOWa,b due to risk of bias, imprecision
The mean final ALT levels ≥3 to <12 months in the control groups was
29.7 U/l
The mean final ALT levels ≥3 to <12 months in the intervention groups was
0.4 lower (9.24 lower to 8.44 higher)
Final AST levels >12 months 41 (1 study) 12 months
⊕⊝⊝⊝ VERY LOWa,b due to risk of bias, imprecision
The mean final AST levels >12 months in the control groups was
29.3 U/l
The mean final AST levels >12 months in the intervention groups was
1.3 higher (6.2 lower to 8.8 higher)
Final AST levels ≥3 to <12 months 52 ⊕⊕⊝⊝ The mean final AST levels The mean final AST levels ≥3 to <12
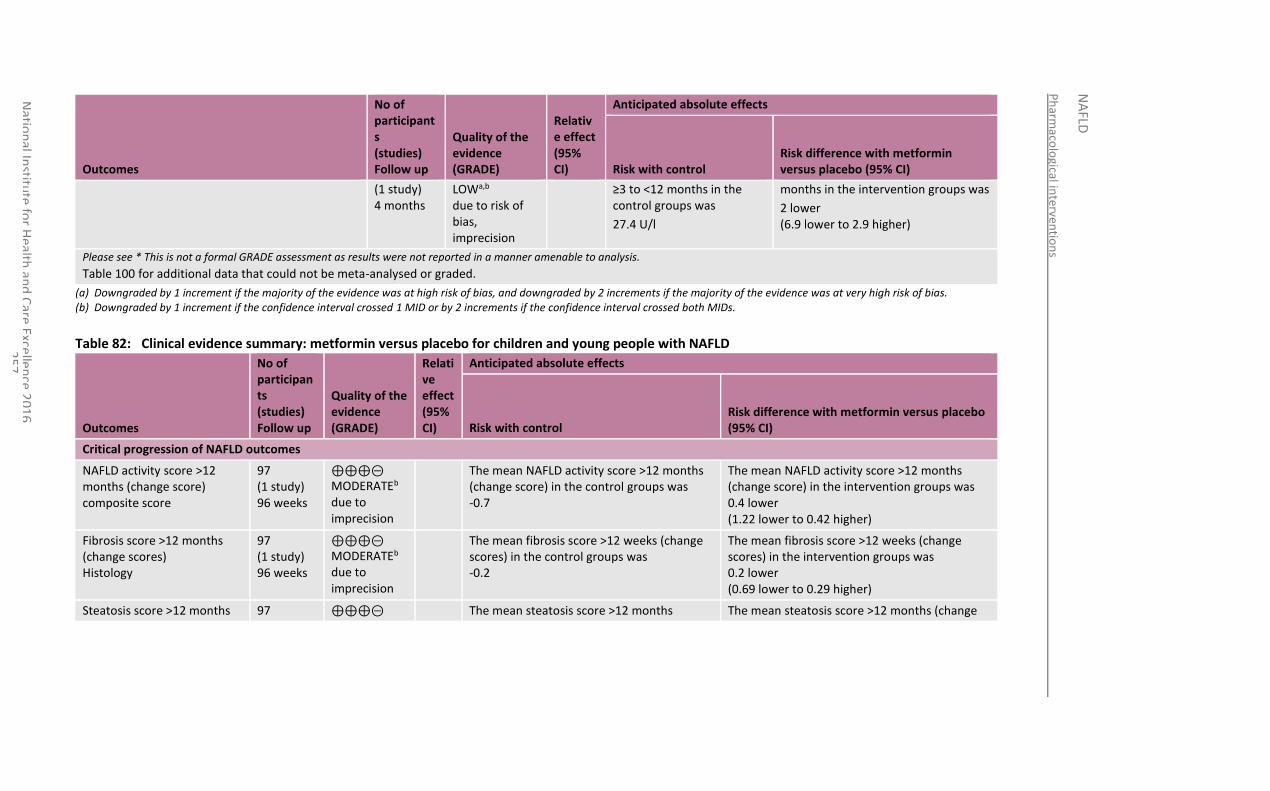
Ph
armaco
logical in
terventio
ns
NA
FLD
Natio
nal In
stitute
for H
ealth an
d C
are Excellen
ce 20
16
2
57
Outcomes
No of participants (studies) Follow up
Quality of the evidence (GRADE)
Relative effect (95% CI)
Anticipated absolute effects
Risk with control Risk difference with metformin versus placebo (95% CI)
(1 study) 4 months
LOWa,b due to risk of bias, imprecision
≥3 to <12 months in the control groups was
27.4 U/l
months in the intervention groups was
2 lower (6.9 lower to 2.9 higher)
Please see * This is not a formal GRADE assessment as results were not reported in a manner amenable to analysis.
Table 100 for additional data that could not be meta-analysed or graded.
(a) Downgraded by 1 increment if the majority of the evidence was at high risk of bias, and downgraded by 2 increments if the majority of the evidence was at very high risk of bias. (b) Downgraded by 1 increment if the confidence interval crossed 1 MID or by 2 increments if the confidence interval crossed both MIDs.
Table 82: Clinical evidence summary: metformin versus placebo for children and young people with NAFLD
Outcomes
No of participants (studies) Follow up
Quality of the evidence (GRADE)
Relative effect (95% CI)
Anticipated absolute effects
Risk with control Risk difference with metformin versus placebo (95% CI)
Critical progression of NAFLD outcomes
NAFLD activity score >12 months (change score) composite score
97 (1 study) 96 weeks
⊕⊕⊕⊝ MODERATEb due to imprecision
The mean NAFLD activity score >12 months (change score) in the control groups was -0.7
The mean NAFLD activity score >12 months (change score) in the intervention groups was 0.4 lower (1.22 lower to 0.42 higher)
Fibrosis score >12 months (change scores) Histology
97 (1 study) 96 weeks
⊕⊕⊕⊝ MODERATEb due to imprecision
The mean fibrosis score >12 weeks (change scores) in the control groups was -0.2
The mean fibrosis score >12 weeks (change scores) in the intervention groups was 0.2 lower (0.69 lower to 0.29 higher)
Steatosis score >12 months 97 ⊕⊕⊕⊝ The mean steatosis score >12 months The mean steatosis score >12 months (change
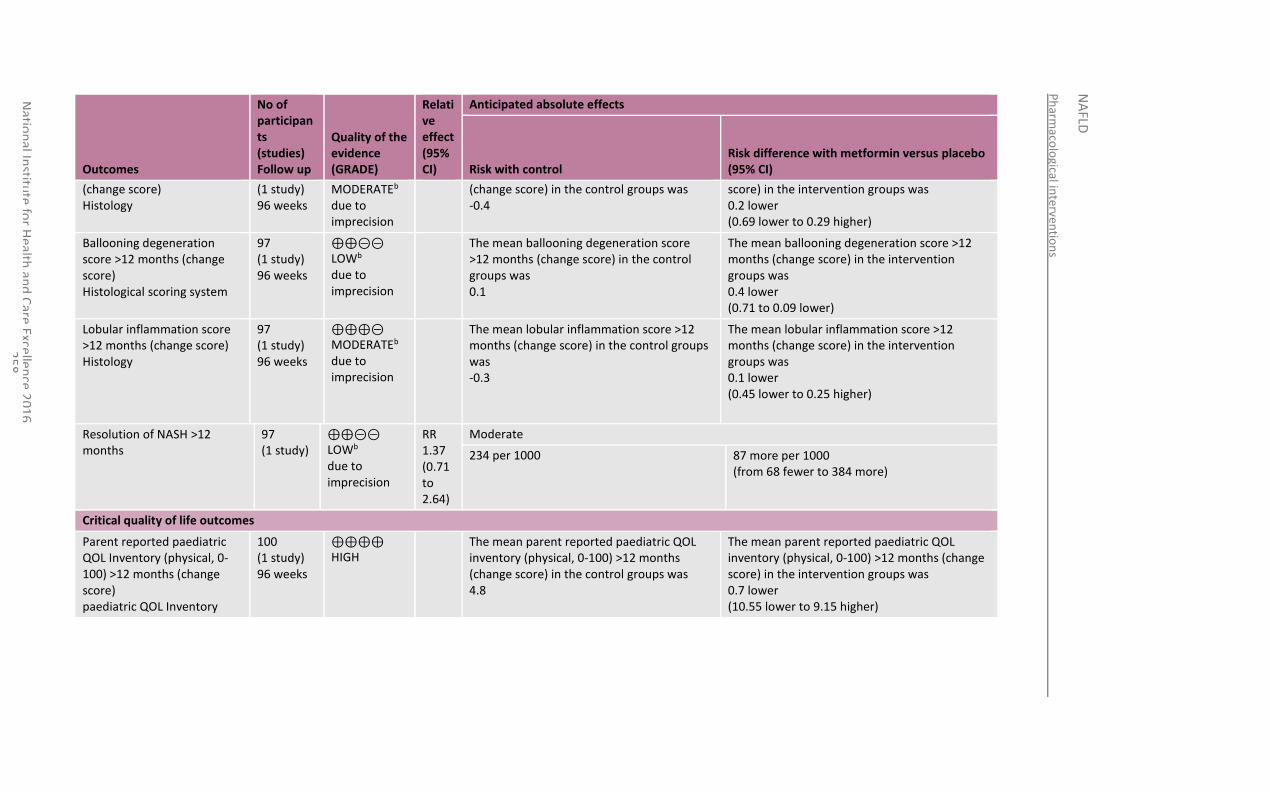
Ph
armaco
logical in
terventio
ns
NA
FLD
Natio
nal In
stitute
for H
ealth an
d C
are Excellen
ce 20
16
2
58
Outcomes
No of participants (studies) Follow up
Quality of the evidence (GRADE)
Relative effect (95% CI)
Anticipated absolute effects
Risk with control Risk difference with metformin versus placebo (95% CI)
(change score) Histology
(1 study) 96 weeks
MODERATEb due to imprecision
(change score) in the control groups was -0.4
score) in the intervention groups was 0.2 lower (0.69 lower to 0.29 higher)
Ballooning degeneration score >12 months (change score) Histological scoring system
97 (1 study) 96 weeks
⊕⊕⊝⊝ LOWb due to imprecision
The mean ballooning degeneration score >12 months (change score) in the control groups was 0.1
The mean ballooning degeneration score >12 months (change score) in the intervention groups was 0.4 lower (0.71 to 0.09 lower)
Lobular inflammation score >12 months (change score) Histology
97 (1 study) 96 weeks
⊕⊕⊕⊝ MODERATEb due to imprecision
The mean lobular inflammation score >12 months (change score) in the control groups was -0.3
The mean lobular inflammation score >12 months (change score) in the intervention groups was 0.1 lower (0.45 lower to 0.25 higher)
Resolution of NASH >12 months
97 (1 study)
⊕⊕⊝⊝ LOWb due to imprecision
RR 1.37 (0.71 to 2.64)
Moderate
234 per 1000 87 more per 1000 (from 68 fewer to 384 more)
Critical quality of life outcomes
Parent reported paediatric QOL Inventory (physical, 0-100) >12 months (change score) paediatric QOL Inventory
100 (1 study) 96 weeks
⊕⊕⊕⊕ HIGH
The mean parent reported paediatric QOL inventory (physical, 0-100) >12 months (change score) in the control groups was 4.8
The mean parent reported paediatric QOL inventory (physical, 0-100) >12 months (change score) in the intervention groups was 0.7 lower (10.55 lower to 9.15 higher)
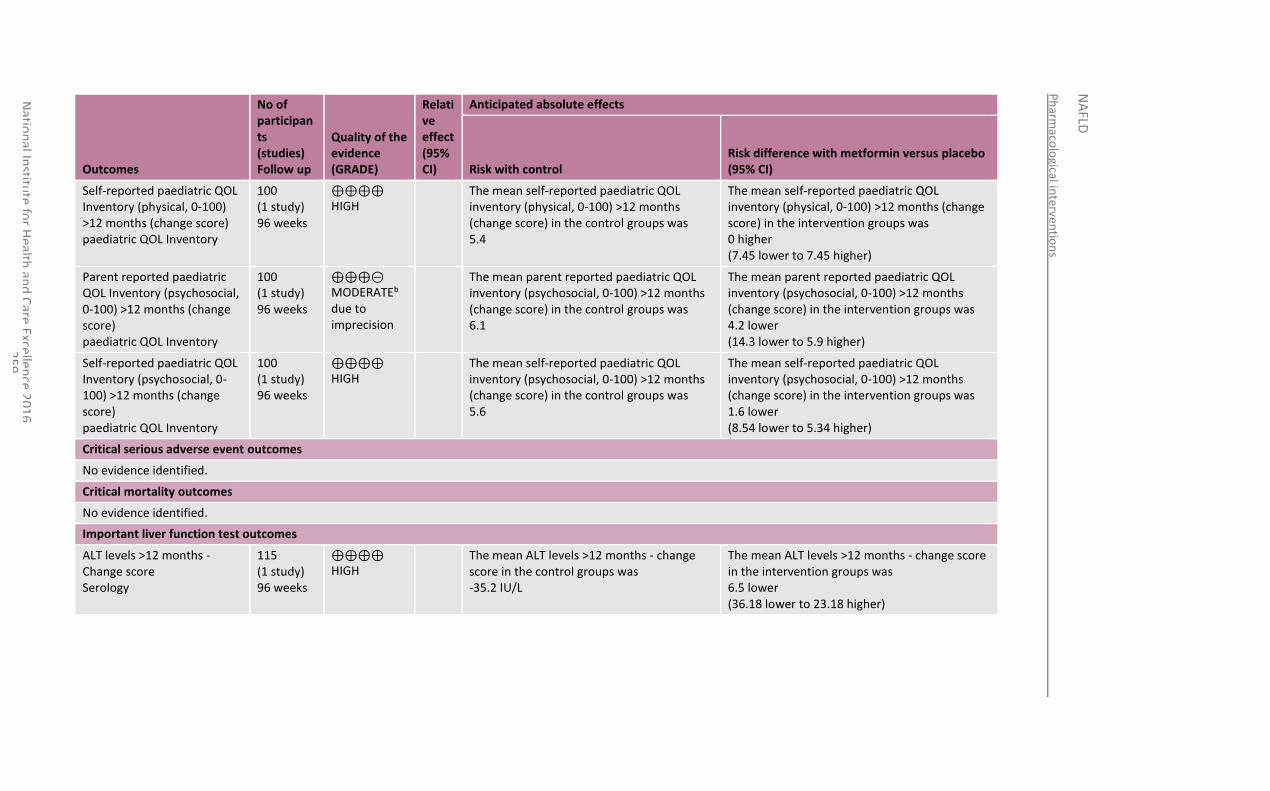
Ph
armaco
logical in
terventio
ns
NA
FLD
Natio
nal In
stitute
for H
ealth an
d C
are Excellen
ce 20
16
2
59
Outcomes
No of participants (studies) Follow up
Quality of the evidence (GRADE)
Relative effect (95% CI)
Anticipated absolute effects
Risk with control Risk difference with metformin versus placebo (95% CI)
Self-reported paediatric QOL Inventory (physical, 0-100) >12 months (change score) paediatric QOL Inventory
100 (1 study) 96 weeks
⊕⊕⊕⊕ HIGH
The mean self-reported paediatric QOL inventory (physical, 0-100) >12 months (change score) in the control groups was 5.4
The mean self-reported paediatric QOL inventory (physical, 0-100) >12 months (change score) in the intervention groups was 0 higher (7.45 lower to 7.45 higher)
Parent reported paediatric QOL Inventory (psychosocial, 0-100) >12 months (change score) paediatric QOL Inventory
100 (1 study) 96 weeks
⊕⊕⊕⊝ MODERATEb due to imprecision
The mean parent reported paediatric QOL inventory (psychosocial, 0-100) >12 months (change score) in the control groups was 6.1
The mean parent reported paediatric QOL inventory (psychosocial, 0-100) >12 months (change score) in the intervention groups was 4.2 lower (14.3 lower to 5.9 higher)
Self-reported paediatric QOL Inventory (psychosocial, 0-100) >12 months (change score) paediatric QOL Inventory
100 (1 study) 96 weeks
⊕⊕⊕⊕ HIGH
The mean self-reported paediatric QOL inventory (psychosocial, 0-100) >12 months (change score) in the control groups was 5.6
The mean self-reported paediatric QOL inventory (psychosocial, 0-100) >12 months (change score) in the intervention groups was 1.6 lower (8.54 lower to 5.34 higher)
Critical serious adverse event outcomes
No evidence identified.
Critical mortality outcomes
No evidence identified.
Important liver function test outcomes
ALT levels >12 months - Change score Serology
115 (1 study) 96 weeks
⊕⊕⊕⊕ HIGH
The mean ALT levels >12 months - change score in the control groups was -35.2 IU/L
The mean ALT levels >12 months - change score in the intervention groups was 6.5 lower (36.18 lower to 23.18 higher)
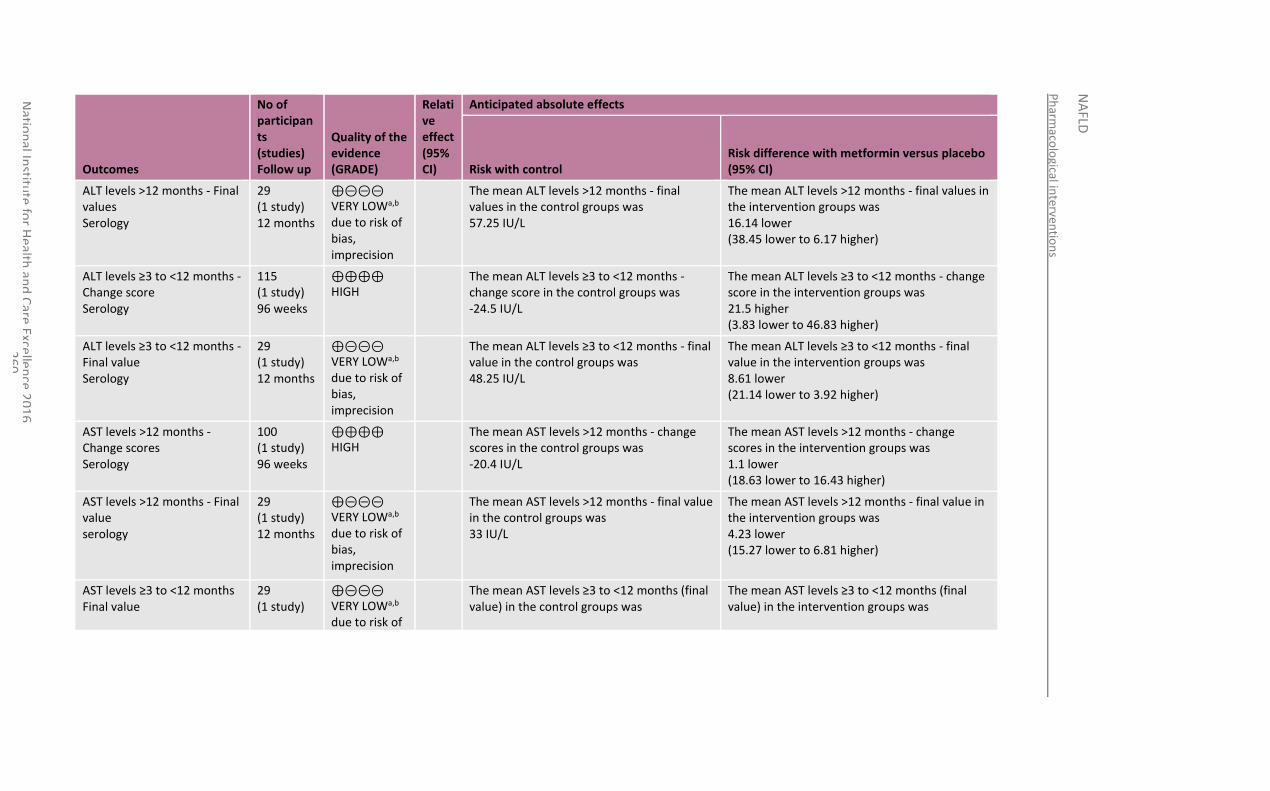
Ph
armaco
logical in
terventio
ns
NA
FLD
Natio
nal In
stitute
for H
ealth an
d C
are Excellen
ce 20
16
2
60
Outcomes
No of participants (studies) Follow up
Quality of the evidence (GRADE)
Relative effect (95% CI)
Anticipated absolute effects
Risk with control Risk difference with metformin versus placebo (95% CI)
ALT levels >12 months - Final values Serology
29 (1 study) 12 months
⊕⊝⊝⊝ VERY LOWa,b due to risk of bias, imprecision
The mean ALT levels >12 months - final values in the control groups was 57.25 IU/L
The mean ALT levels >12 months - final values in the intervention groups was 16.14 lower (38.45 lower to 6.17 higher)
ALT levels ≥3 to <12 months - Change score Serology
115 (1 study) 96 weeks
⊕⊕⊕⊕ HIGH
The mean ALT levels ≥3 to <12 months - change score in the control groups was -24.5 IU/L
The mean ALT levels ≥3 to <12 months - change score in the intervention groups was 21.5 higher (3.83 lower to 46.83 higher)
ALT levels ≥3 to <12 months - Final value Serology
29 (1 study) 12 months
⊕⊝⊝⊝ VERY LOWa,b due to risk of bias, imprecision
The mean ALT levels ≥3 to <12 months - final value in the control groups was 48.25 IU/L
The mean ALT levels ≥3 to <12 months - final value in the intervention groups was 8.61 lower (21.14 lower to 3.92 higher)
AST levels >12 months - Change scores Serology
100 (1 study) 96 weeks
⊕⊕⊕⊕ HIGH
The mean AST levels >12 months - change scores in the control groups was -20.4 IU/L
The mean AST levels >12 months - change scores in the intervention groups was 1.1 lower (18.63 lower to 16.43 higher)
AST levels >12 months - Final value serology
29 (1 study) 12 months
⊕⊝⊝⊝ VERY LOWa,b due to risk of bias, imprecision
The mean AST levels >12 months - final value in the control groups was 33 IU/L
The mean AST levels >12 months - final value in the intervention groups was 4.23 lower (15.27 lower to 6.81 higher)
AST levels ≥3 to <12 months Final value
29 (1 study)
⊕⊝⊝⊝ VERY LOWa,b due to risk of
The mean AST levels ≥3 to <12 months (final value) in the control groups was
The mean AST levels ≥3 to <12 months (final value) in the intervention groups was
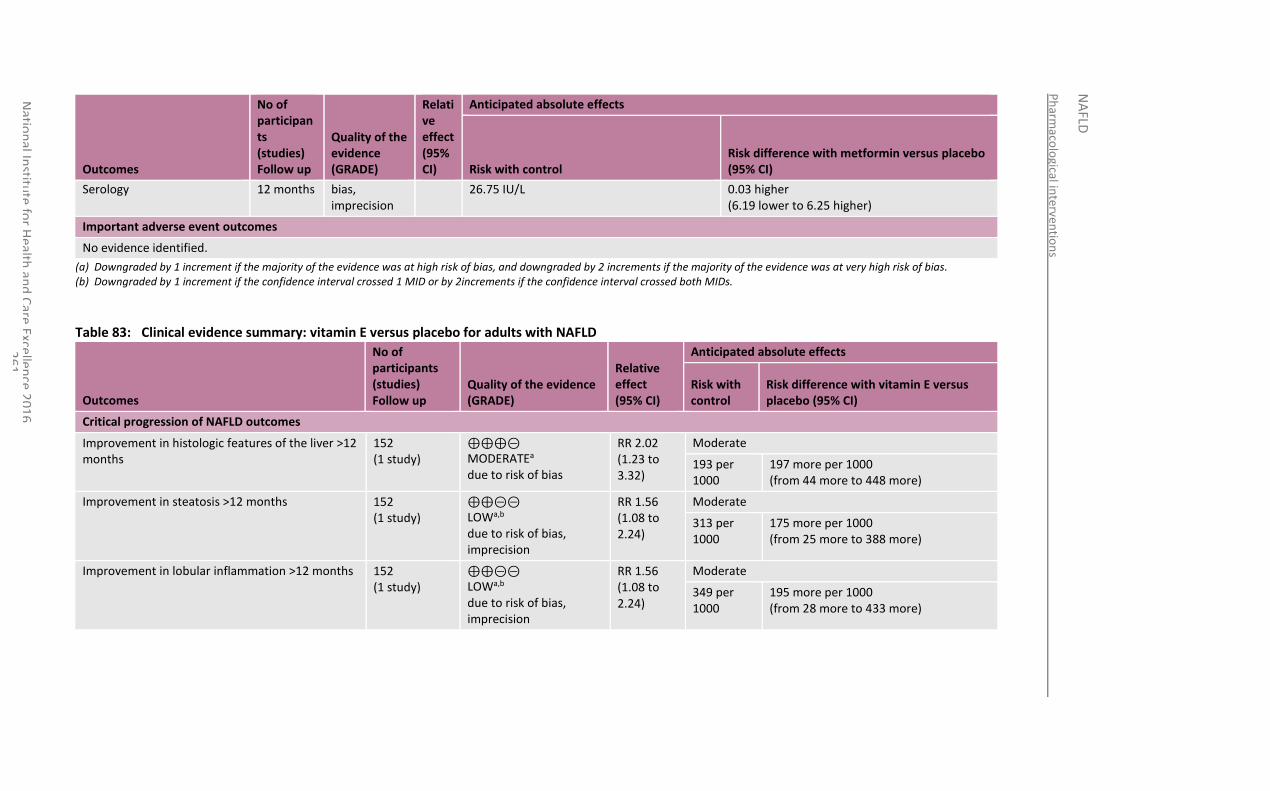
Ph
armaco
logical in
terventio
ns
NA
FLD
Natio
nal In
stitute
for H
ealth an
d C
are Excellen
ce 20
16
2
61
Outcomes
No of participants (studies) Follow up
Quality of the evidence (GRADE)
Relative effect (95% CI)
Anticipated absolute effects
Risk with control Risk difference with metformin versus placebo (95% CI)
Serology 12 months bias, imprecision
26.75 IU/L 0.03 higher (6.19 lower to 6.25 higher)
Important adverse event outcomes
No evidence identified.
(a) Downgraded by 1 increment if the majority of the evidence was at high risk of bias, and downgraded by 2 increments if the majority of the evidence was at very high risk of bias. (b) Downgraded by 1 increment if the confidence interval crossed 1 MID or by 2increments if the confidence interval crossed both MIDs.
Table 83: Clinical evidence summary: vitamin E versus placebo for adults with NAFLD
Outcomes
No of participants (studies) Follow up
Quality of the evidence (GRADE)
Relative effect (95% CI)
Anticipated absolute effects
Risk with control
Risk difference with vitamin E versus placebo (95% CI)
Critical progression of NAFLD outcomes
Improvement in histologic features of the liver >12 months
152 (1 study)
⊕⊕⊕⊝ MODERATEa due to risk of bias
RR 2.02 (1.23 to 3.32)
Moderate
193 per 1000
197 more per 1000 (from 44 more to 448 more)
Improvement in steatosis >12 months 152 (1 study)
⊕⊕⊝⊝ LOWa,b due to risk of bias, imprecision
RR 1.56 (1.08 to 2.24)
Moderate
313 per 1000
175 more per 1000 (from 25 more to 388 more)
Improvement in lobular inflammation >12 months 152 (1 study)
⊕⊕⊝⊝ LOWa,b due to risk of bias, imprecision
RR 1.56 (1.08 to 2.24)
Moderate
349 per 1000
195 more per 1000 (from 28 more to 433 more)
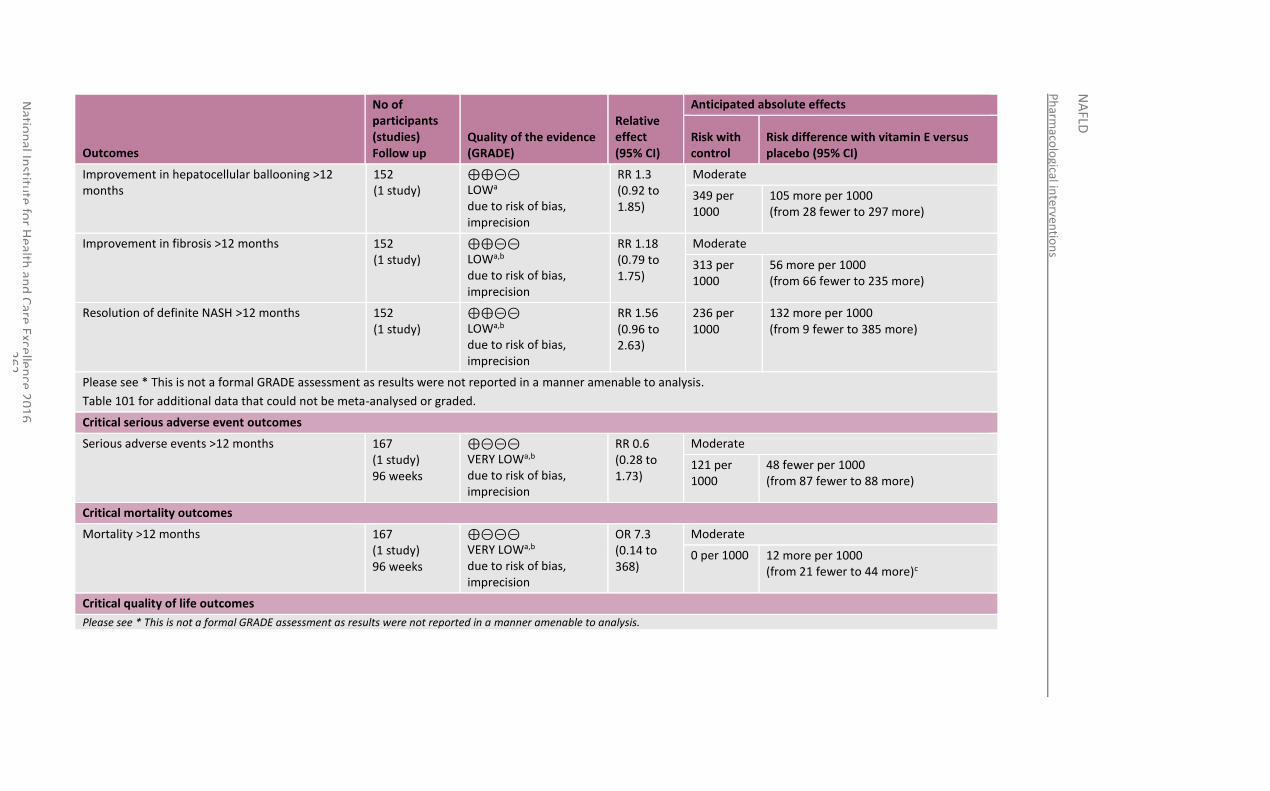
Ph
armaco
logical in
terventio
ns
NA
FLD
Natio
nal In
stitute
for H
ealth an
d C
are Excellen
ce 20
16
2
62
Outcomes
No of participants (studies) Follow up
Quality of the evidence (GRADE)
Relative effect (95% CI)
Anticipated absolute effects
Risk with control
Risk difference with vitamin E versus placebo (95% CI)
Improvement in hepatocellular ballooning >12 months
152 (1 study)
⊕⊕⊝⊝ LOWa due to risk of bias, imprecision
RR 1.3 (0.92 to 1.85)
Moderate
349 per 1000
105 more per 1000 (from 28 fewer to 297 more)
Improvement in fibrosis >12 months 152 (1 study)
⊕⊕⊝⊝ LOWa,b due to risk of bias, imprecision
RR 1.18 (0.79 to 1.75)
Moderate
313 per 1000
56 more per 1000 (from 66 fewer to 235 more)
Resolution of definite NASH >12 months 152 (1 study)
⊕⊕⊝⊝ LOWa,b due to risk of bias, imprecision
RR 1.56 (0.96 to 2.63)
236 per 1000
132 more per 1000 (from 9 fewer to 385 more)
Please see * This is not a formal GRADE assessment as results were not reported in a manner amenable to analysis.
Table 101 for additional data that could not be meta-analysed or graded.
Critical serious adverse event outcomes
Serious adverse events >12 months 167 (1 study) 96 weeks
⊕⊝⊝⊝ VERY LOWa,b due to risk of bias, imprecision
RR 0.6 (0.28 to 1.73)
Moderate
121 per 1000
48 fewer per 1000 (from 87 fewer to 88 more)
Critical mortality outcomes
Mortality >12 months 167 (1 study) 96 weeks
⊕⊝⊝⊝ VERY LOWa,b due to risk of bias, imprecision
OR 7.3 (0.14 to 368)
Moderate
0 per 1000 12 more per 1000 (from 21 fewer to 44 more)c
Critical quality of life outcomes
Please see * This is not a formal GRADE assessment as results were not reported in a manner amenable to analysis.
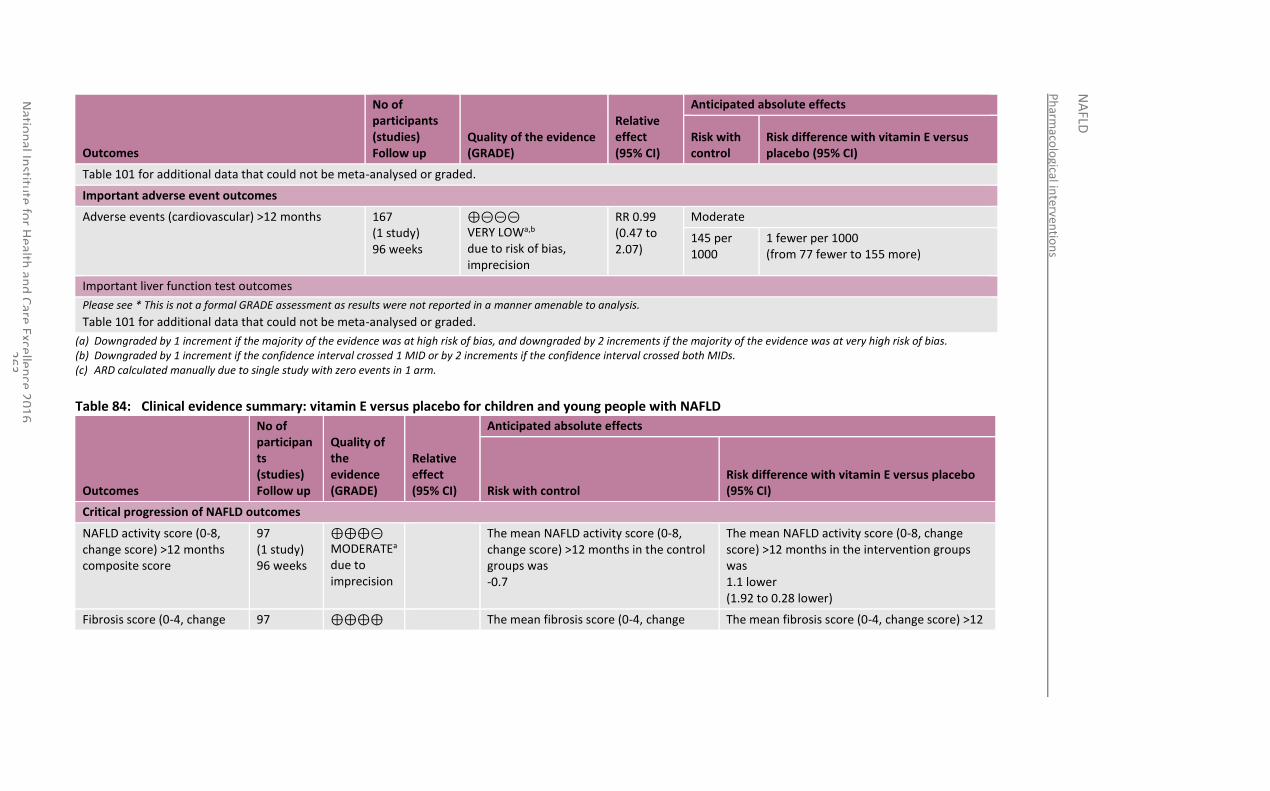
Ph
armaco
logical in
terventio
ns
NA
FLD
Natio
nal In
stitute
for H
ealth an
d C
are Excellen
ce 20
16
2
63
Outcomes
No of participants (studies) Follow up
Quality of the evidence (GRADE)
Relative effect (95% CI)
Anticipated absolute effects
Risk with control
Risk difference with vitamin E versus placebo (95% CI)
Table 101 for additional data that could not be meta-analysed or graded.
Important adverse event outcomes
Adverse events (cardiovascular) >12 months 167 (1 study) 96 weeks
⊕⊝⊝⊝ VERY LOWa,b due to risk of bias, imprecision
RR 0.99 (0.47 to 2.07)
Moderate
145 per 1000
1 fewer per 1000 (from 77 fewer to 155 more)
Important liver function test outcomes
Please see * This is not a formal GRADE assessment as results were not reported in a manner amenable to analysis.
Table 101 for additional data that could not be meta-analysed or graded.
(a) Downgraded by 1 increment if the majority of the evidence was at high risk of bias, and downgraded by 2 increments if the majority of the evidence was at very high risk of bias. (b) Downgraded by 1 increment if the confidence interval crossed 1 MID or by 2 increments if the confidence interval crossed both MIDs. (c) ARD calculated manually due to single study with zero events in 1 arm.
Table 84: Clinical evidence summary: vitamin E versus placebo for children and young people with NAFLD
Outcomes
No of participants (studies) Follow up
Quality of the evidence (GRADE)
Relative effect (95% CI)
Anticipated absolute effects
Risk with control Risk difference with vitamin E versus placebo (95% CI)
Critical progression of NAFLD outcomes
NAFLD activity score (0-8, change score) >12 months composite score
97 (1 study) 96 weeks
⊕⊕⊕⊝ MODERATEa due to imprecision
The mean NAFLD activity score (0-8, change score) >12 months in the control groups was -0.7
The mean NAFLD activity score (0-8, change score) >12 months in the intervention groups was 1.1 lower (1.92 to 0.28 lower)
Fibrosis score (0-4, change 97 ⊕⊕⊕⊕ The mean fibrosis score (0-4, change The mean fibrosis score (0-4, change score) >12
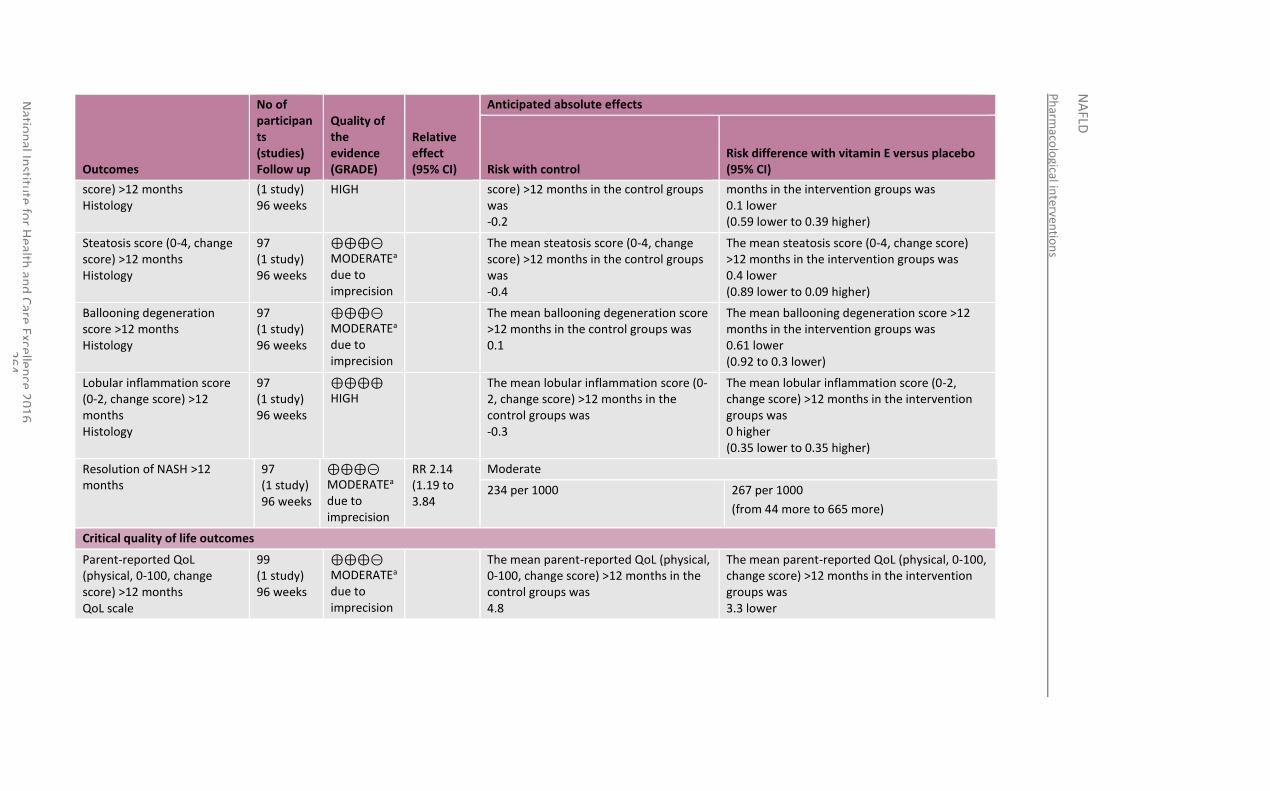
Ph
armaco
logical in
terventio
ns
NA
FLD
Natio
nal In
stitute
for H
ealth an
d C
are Excellen
ce 20
16
2
64
Outcomes
No of participants (studies) Follow up
Quality of the evidence (GRADE)
Relative effect (95% CI)
Anticipated absolute effects
Risk with control Risk difference with vitamin E versus placebo (95% CI)
score) >12 months Histology
(1 study) 96 weeks
HIGH score) >12 months in the control groups was -0.2
months in the intervention groups was 0.1 lower (0.59 lower to 0.39 higher)
Steatosis score (0-4, change score) >12 months Histology
97 (1 study) 96 weeks
⊕⊕⊕⊝ MODERATEa due to imprecision
The mean steatosis score (0-4, change score) >12 months in the control groups was -0.4
The mean steatosis score (0-4, change score) >12 months in the intervention groups was 0.4 lower (0.89 lower to 0.09 higher)
Ballooning degeneration score >12 months Histology
97 (1 study) 96 weeks
⊕⊕⊕⊝ MODERATEa due to imprecision
The mean ballooning degeneration score >12 months in the control groups was 0.1
The mean ballooning degeneration score >12 months in the intervention groups was 0.61 lower (0.92 to 0.3 lower)
Lobular inflammation score (0-2, change score) >12 months Histology
97 (1 study) 96 weeks
⊕⊕⊕⊕ HIGH
The mean lobular inflammation score (0-2, change score) >12 months in the control groups was -0.3
The mean lobular inflammation score (0-2, change score) >12 months in the intervention groups was 0 higher (0.35 lower to 0.35 higher)
Resolution of NASH >12 months
97 (1 study) 96 weeks
⊕⊕⊕⊝ MODERATEa due to imprecision
RR 2.14 (1.19 to 3.84
Moderate
234 per 1000 267 per 1000
(from 44 more to 665 more)
Critical quality of life outcomes
Parent-reported QoL (physical, 0-100, change score) >12 months QoL scale
99 (1 study) 96 weeks
⊕⊕⊕⊝ MODERATEa due to imprecision
The mean parent-reported QoL (physical, 0-100, change score) >12 months in the control groups was 4.8
The mean parent-reported QoL (physical, 0-100, change score) >12 months in the intervention groups was 3.3 lower
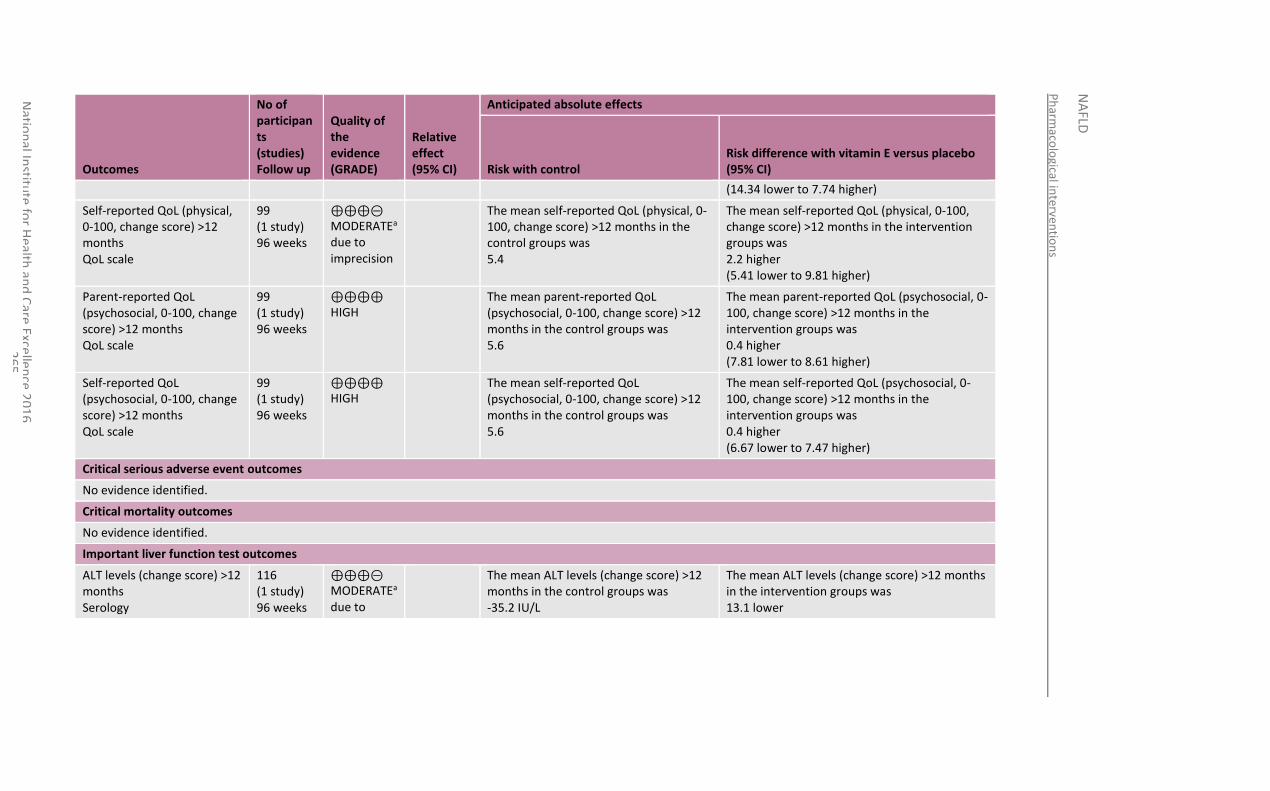
Ph
armaco
logical in
terventio
ns
NA
FLD
Natio
nal In
stitute
for H
ealth an
d C
are Excellen
ce 20
16
2
65
Outcomes
No of participants (studies) Follow up
Quality of the evidence (GRADE)
Relative effect (95% CI)
Anticipated absolute effects
Risk with control Risk difference with vitamin E versus placebo (95% CI)
(14.34 lower to 7.74 higher)
Self-reported QoL (physical, 0-100, change score) >12 months QoL scale
99 (1 study) 96 weeks
⊕⊕⊕⊝ MODERATEa due to imprecision
The mean self-reported QoL (physical, 0-100, change score) >12 months in the control groups was 5.4
The mean self-reported QoL (physical, 0-100, change score) >12 months in the intervention groups was 2.2 higher (5.41 lower to 9.81 higher)
Parent-reported QoL (psychosocial, 0-100, change score) >12 months QoL scale
99 (1 study) 96 weeks
⊕⊕⊕⊕ HIGH
The mean parent-reported QoL (psychosocial, 0-100, change score) >12 months in the control groups was 5.6
The mean parent-reported QoL (psychosocial, 0-100, change score) >12 months in the intervention groups was 0.4 higher (7.81 lower to 8.61 higher)
Self-reported QoL (psychosocial, 0-100, change score) >12 months QoL scale
99 (1 study) 96 weeks
⊕⊕⊕⊕ HIGH
The mean self-reported QoL (psychosocial, 0-100, change score) >12 months in the control groups was 5.6
The mean self-reported QoL (psychosocial, 0-100, change score) >12 months in the intervention groups was 0.4 higher (6.67 lower to 7.47 higher)
Critical serious adverse event outcomes
No evidence identified.
Critical mortality outcomes
No evidence identified.
Important liver function test outcomes
ALT levels (change score) >12 months Serology
116 (1 study) 96 weeks
⊕⊕⊕⊝ MODERATEa due to
The mean ALT levels (change score) >12 months in the control groups was -35.2 IU/L
The mean ALT levels (change score) >12 months in the intervention groups was 13.1 lower
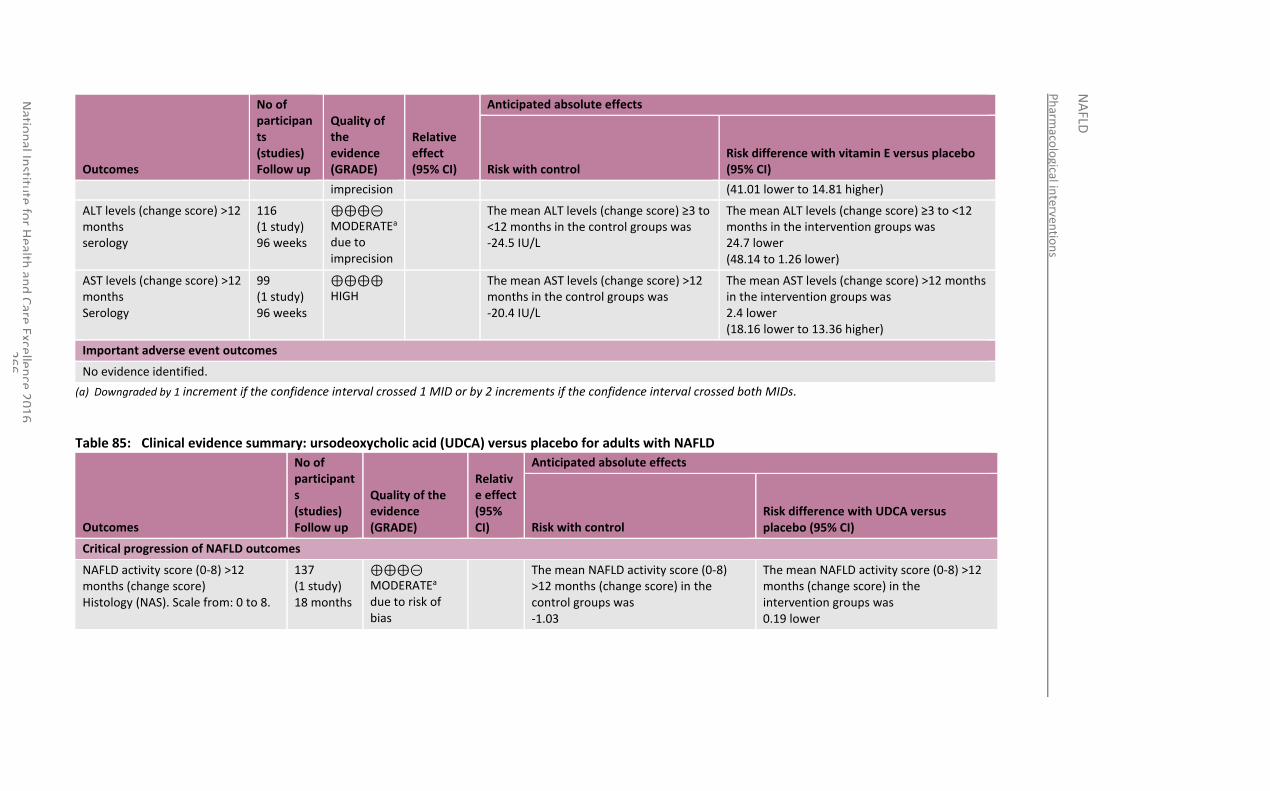
Ph
armaco
logical in
terventio
ns
NA
FLD
Natio
nal In
stitute
for H
ealth an
d C
are Excellen
ce 20
16
2
66
Outcomes
No of participants (studies) Follow up
Quality of the evidence (GRADE)
Relative effect (95% CI)
Anticipated absolute effects
Risk with control Risk difference with vitamin E versus placebo (95% CI)
imprecision (41.01 lower to 14.81 higher)
ALT levels (change score) >12 months serology
116 (1 study) 96 weeks
⊕⊕⊕⊝ MODERATEa due to imprecision
The mean ALT levels (change score) ≥3 to <12 months in the control groups was -24.5 IU/L
The mean ALT levels (change score) ≥3 to <12 months in the intervention groups was 24.7 lower (48.14 to 1.26 lower)
AST levels (change score) >12 months Serology
99 (1 study) 96 weeks
⊕⊕⊕⊕ HIGH
The mean AST levels (change score) >12 months in the control groups was -20.4 IU/L
The mean AST levels (change score) >12 months in the intervention groups was 2.4 lower (18.16 lower to 13.36 higher)
Important adverse event outcomes
No evidence identified.
(a) Downgraded by 1 increment if the confidence interval crossed 1 MID or by 2 increments if the confidence interval crossed both MIDs.
Table 85: Clinical evidence summary: ursodeoxycholic acid (UDCA) versus placebo for adults with NAFLD
Outcomes
No of participants (studies) Follow up
Quality of the evidence (GRADE)
Relative effect (95% CI)
Anticipated absolute effects
Risk with control Risk difference with UDCA versus placebo (95% CI)
Critical progression of NAFLD outcomes
NAFLD activity score (0-8) >12 months (change score) Histology (NAS). Scale from: 0 to 8.
137 (1 study) 18 months
⊕⊕⊕⊝ MODERATEa due to risk of bias
The mean NAFLD activity score (0-8) >12 months (change score) in the control groups was -1.03
The mean NAFLD activity score (0-8) >12 months (change score) in the intervention groups was 0.19 lower
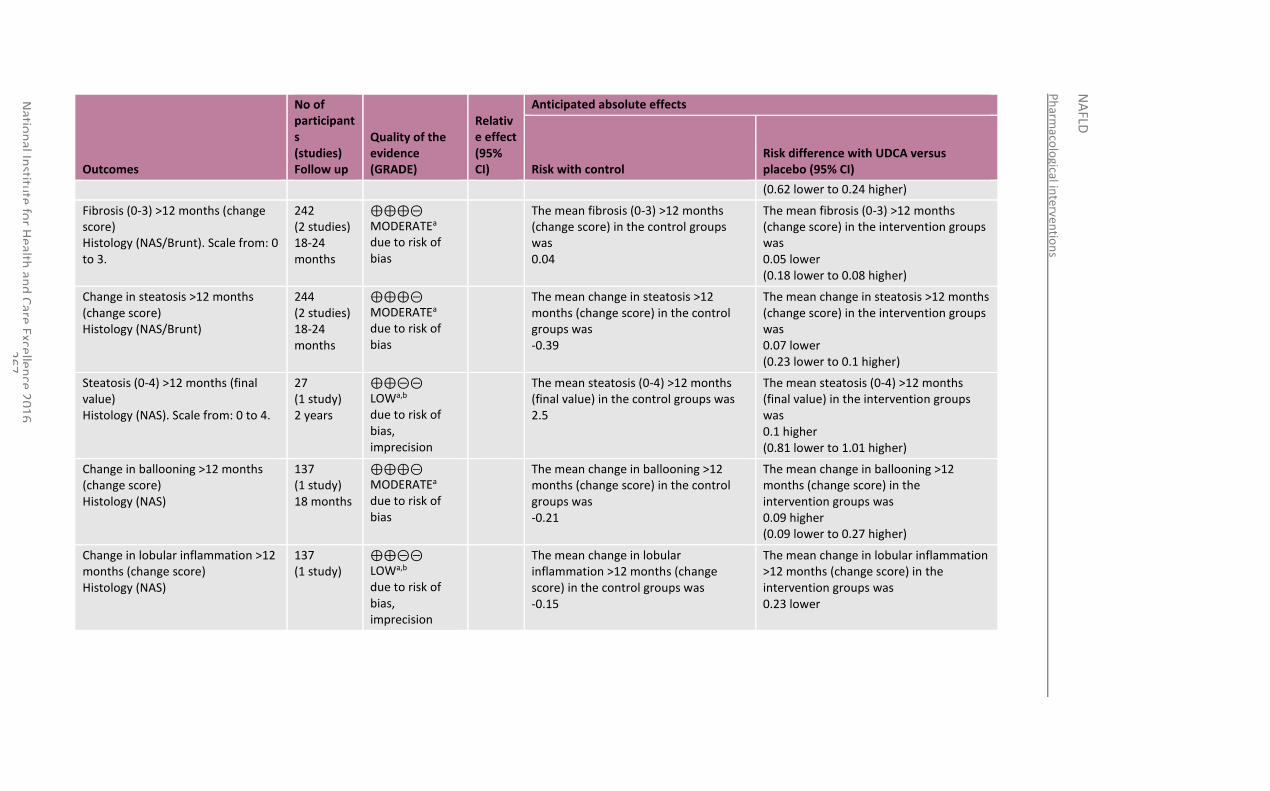
Ph
armaco
logical in
terventio
ns
NA
FLD
Natio
nal In
stitute
for H
ealth an
d C
are Excellen
ce 20
16
2
67
Outcomes
No of participants (studies) Follow up
Quality of the evidence (GRADE)
Relative effect (95% CI)
Anticipated absolute effects
Risk with control Risk difference with UDCA versus placebo (95% CI)
(0.62 lower to 0.24 higher)
Fibrosis (0-3) >12 months (change score) Histology (NAS/Brunt). Scale from: 0 to 3.
242 (2 studies) 18-24 months
⊕⊕⊕⊝ MODERATEa due to risk of bias
The mean fibrosis (0-3) >12 months (change score) in the control groups was 0.04
The mean fibrosis (0-3) >12 months (change score) in the intervention groups was 0.05 lower (0.18 lower to 0.08 higher)
Change in steatosis >12 months (change score) Histology (NAS/Brunt)
244 (2 studies) 18-24 months
⊕⊕⊕⊝ MODERATEa due to risk of bias
The mean change in steatosis >12 months (change score) in the control groups was -0.39
The mean change in steatosis >12 months (change score) in the intervention groups was 0.07 lower (0.23 lower to 0.1 higher)
Steatosis (0-4) >12 months (final value) Histology (NAS). Scale from: 0 to 4.
27 (1 study) 2 years
⊕⊕⊝⊝ LOWa,b due to risk of bias, imprecision
The mean steatosis (0-4) >12 months (final value) in the control groups was 2.5
The mean steatosis (0-4) >12 months (final value) in the intervention groups was 0.1 higher (0.81 lower to 1.01 higher)
Change in ballooning >12 months (change score) Histology (NAS)
137 (1 study) 18 months
⊕⊕⊕⊝ MODERATEa due to risk of bias
The mean change in ballooning >12 months (change score) in the control groups was -0.21
The mean change in ballooning >12 months (change score) in the intervention groups was 0.09 higher (0.09 lower to 0.27 higher)
Change in lobular inflammation >12 months (change score) Histology (NAS)
137 (1 study)
⊕⊕⊝⊝ LOWa,b due to risk of bias, imprecision
The mean change in lobular inflammation >12 months (change score) in the control groups was -0.15
The mean change in lobular inflammation >12 months (change score) in the intervention groups was 0.23 lower
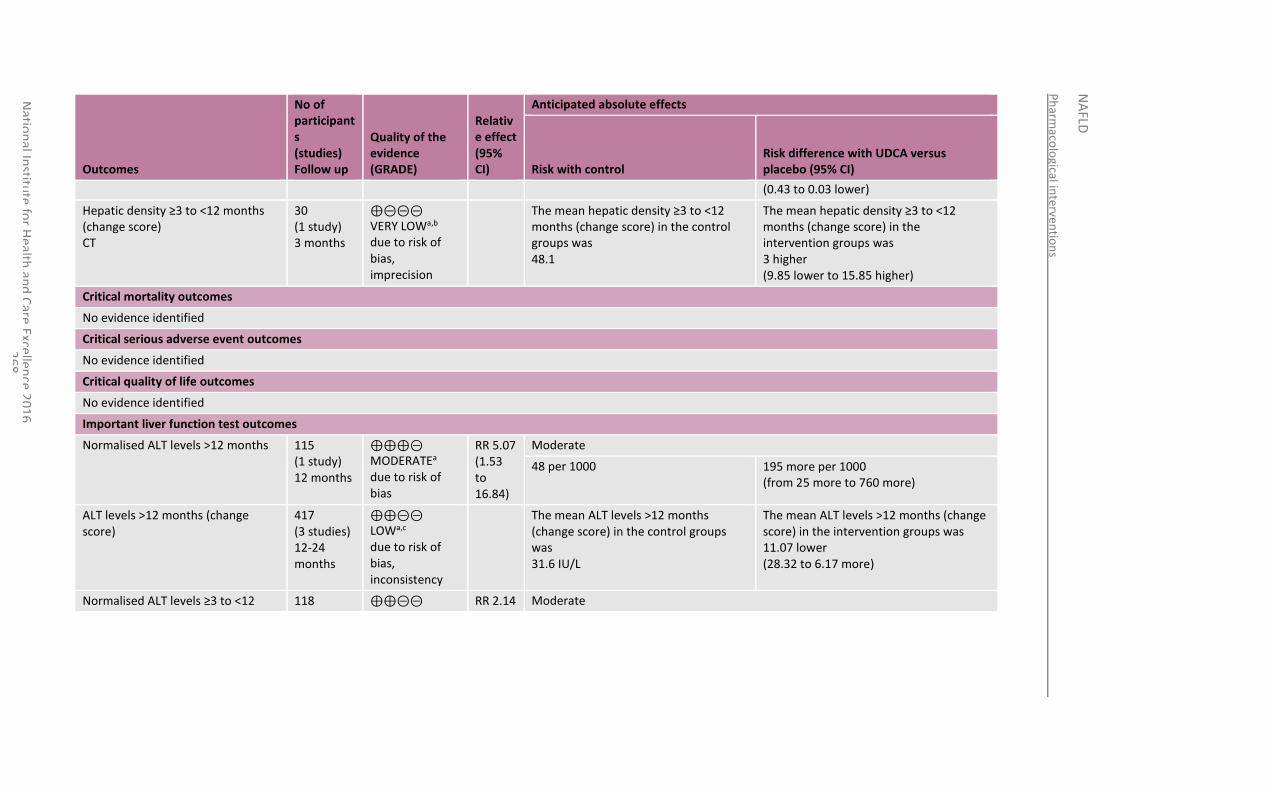
Ph
armaco
logical in
terventio
ns
NA
FLD
Natio
nal In
stitute
for H
ealth an
d C
are Exce
llence 2
01
6
26
8
Outcomes
No of participants (studies) Follow up
Quality of the evidence (GRADE)
Relative effect (95% CI)
Anticipated absolute effects
Risk with control Risk difference with UDCA versus placebo (95% CI)
(0.43 to 0.03 lower)
Hepatic density ≥3 to <12 months (change score) CT
30 (1 study) 3 months
⊕⊝⊝⊝ VERY LOWa,b due to risk of bias, imprecision
The mean hepatic density ≥3 to <12 months (change score) in the control groups was 48.1
The mean hepatic density ≥3 to <12 months (change score) in the intervention groups was 3 higher (9.85 lower to 15.85 higher)
Critical mortality outcomes
No evidence identified
Critical serious adverse event outcomes
No evidence identified
Critical quality of life outcomes
No evidence identified
Important liver function test outcomes
Normalised ALT levels >12 months 115 (1 study) 12 months
⊕⊕⊕⊝ MODERATEa due to risk of bias
RR 5.07 (1.53 to 16.84)
Moderate
48 per 1000 195 more per 1000 (from 25 more to 760 more)
ALT levels >12 months (change score)
417 (3 studies) 12-24 months
⊕⊕⊝⊝ LOWa,c due to risk of bias, inconsistency
The mean ALT levels >12 months (change score) in the control groups was 31.6 IU/L
The mean ALT levels >12 months (change score) in the intervention groups was 11.07 lower (28.32 to 6.17 more)
Normalised ALT levels ≥3 to <12 118 ⊕⊕⊝⊝ RR 2.14 Moderate
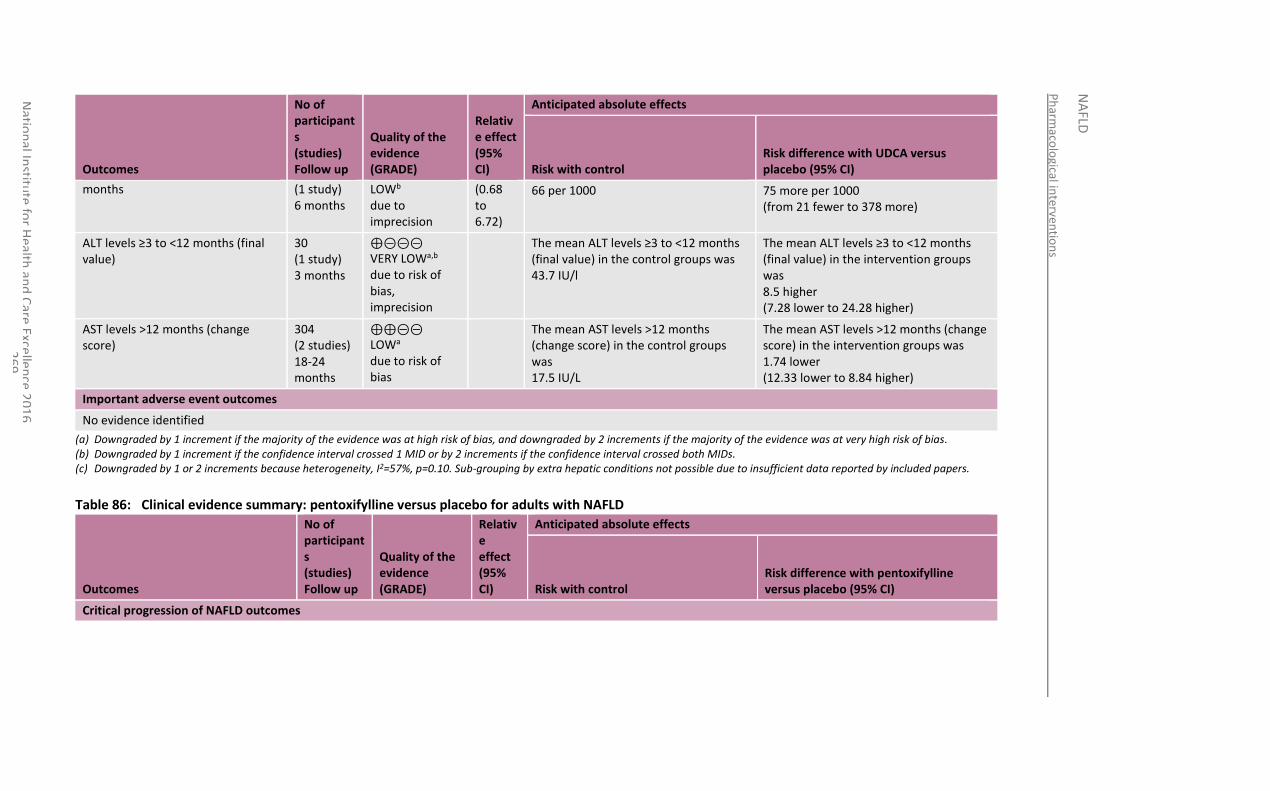
Ph
armaco
logical in
terventio
ns
NA
FLD
Natio
nal In
stitute
for H
ealth an
d C
are Excellen
ce 20
16
2
69
Outcomes
No of participants (studies) Follow up
Quality of the evidence (GRADE)
Relative effect (95% CI)
Anticipated absolute effects
Risk with control Risk difference with UDCA versus placebo (95% CI)
months (1 study) 6 months
LOWb due to imprecision
(0.68 to 6.72)
66 per 1000 75 more per 1000 (from 21 fewer to 378 more)
ALT levels ≥3 to <12 months (final value)
30 (1 study) 3 months
⊕⊝⊝⊝ VERY LOWa,b due to risk of bias, imprecision
The mean ALT levels ≥3 to <12 months (final value) in the control groups was 43.7 IU/l
The mean ALT levels ≥3 to <12 months (final value) in the intervention groups was 8.5 higher (7.28 lower to 24.28 higher)
AST levels >12 months (change score)
304 (2 studies) 18-24 months
⊕⊕⊝⊝ LOWa due to risk of bias
The mean AST levels >12 months (change score) in the control groups was 17.5 IU/L
The mean AST levels >12 months (change score) in the intervention groups was 1.74 lower (12.33 lower to 8.84 higher)
Important adverse event outcomes
No evidence identified
(a) Downgraded by 1 increment if the majority of the evidence was at high risk of bias, and downgraded by 2 increments if the majority of the evidence was at very high risk of bias. (b) Downgraded by 1 increment if the confidence interval crossed 1 MID or by 2 increments if the confidence interval crossed both MIDs. (c) Downgraded by 1 or 2 increments because heterogeneity, I2=57%, p=0.10. Sub-grouping by extra hepatic conditions not possible due to insufficient data reported by included papers.
Table 86: Clinical evidence summary: pentoxifylline versus placebo for adults with NAFLD
Outcomes
No of participants (studies) Follow up
Quality of the evidence (GRADE)
Relative effect (95% CI)
Anticipated absolute effects
Risk with control Risk difference with pentoxifylline versus placebo (95% CI)
Critical progression of NAFLD outcomes
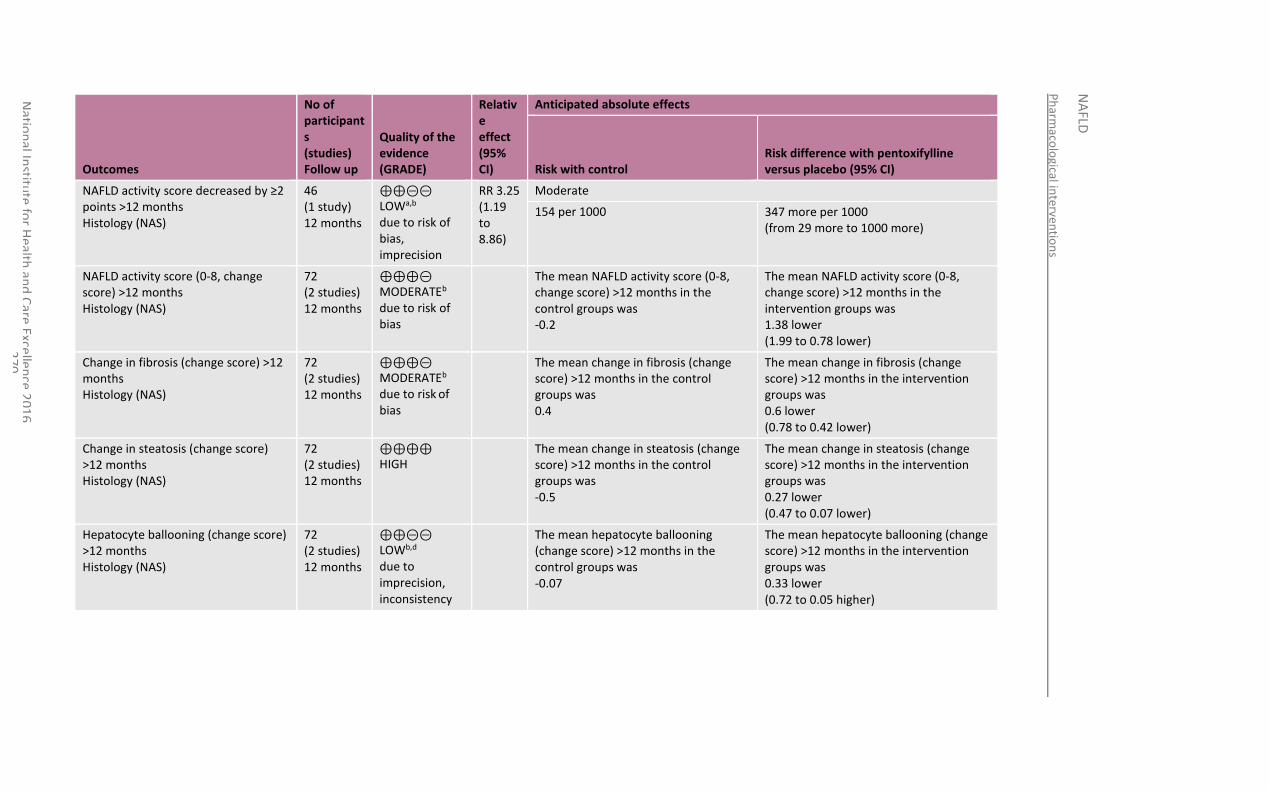
Ph
armaco
logical in
terventio
ns
NA
FLD
Natio
nal In
stitute
for H
ealth an
d C
are Excellen
ce 20
16
2
70
Outcomes
No of participants (studies) Follow up
Quality of the evidence (GRADE)
Relative effect (95% CI)
Anticipated absolute effects
Risk with control Risk difference with pentoxifylline versus placebo (95% CI)
NAFLD activity score decreased by ≥2 points >12 months Histology (NAS)
46 (1 study) 12 months
⊕⊕⊝⊝ LOWa,b due to risk of bias, imprecision
RR 3.25 (1.19 to 8.86)
Moderate
154 per 1000 347 more per 1000 (from 29 more to 1000 more)
NAFLD activity score (0-8, change score) >12 months Histology (NAS)
72 (2 studies) 12 months
⊕⊕⊕⊝ MODERATEb due to risk of bias
The mean NAFLD activity score (0-8, change score) >12 months in the control groups was -0.2
The mean NAFLD activity score (0-8, change score) >12 months in the intervention groups was 1.38 lower (1.99 to 0.78 lower)
Change in fibrosis (change score) >12 months Histology (NAS)
72 (2 studies) 12 months
⊕⊕⊕⊝ MODERATEb due to risk of bias
The mean change in fibrosis (change score) >12 months in the control groups was 0.4
The mean change in fibrosis (change score) >12 months in the intervention groups was 0.6 lower (0.78 to 0.42 lower)
Change in steatosis (change score) >12 months Histology (NAS)
72 (2 studies) 12 months
⊕⊕⊕⊕ HIGH
The mean change in steatosis (change score) >12 months in the control groups was -0.5
The mean change in steatosis (change score) >12 months in the intervention groups was 0.27 lower (0.47 to 0.07 lower)
Hepatocyte ballooning (change score) >12 months Histology (NAS)
72 (2 studies) 12 months
⊕⊕⊝⊝ LOWb,d due to imprecision, inconsistency
The mean hepatocyte ballooning (change score) >12 months in the control groups was -0.07
The mean hepatocyte ballooning (change score) >12 months in the intervention groups was 0.33 lower (0.72 to 0.05 higher)
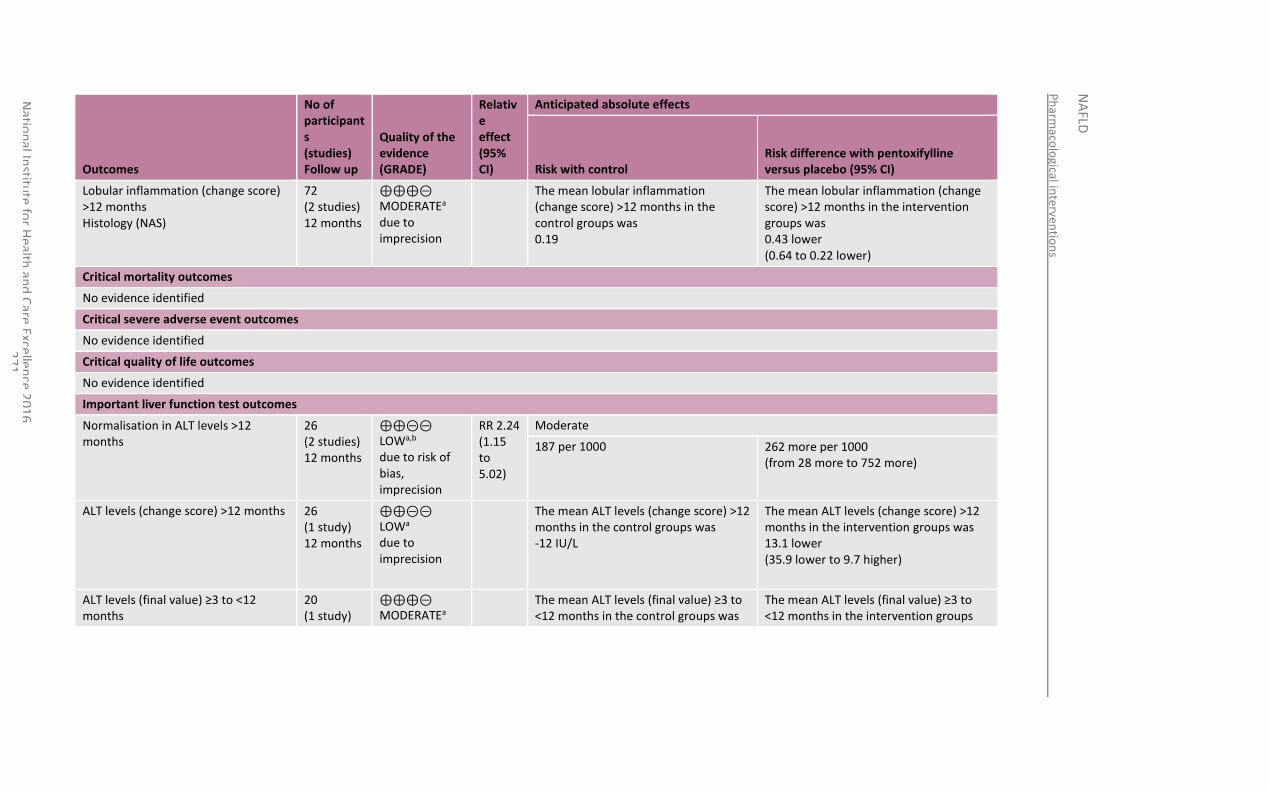
Ph
armaco
logical in
terventio
ns
NA
FLD
Natio
nal In
stitute
for H
ealth an
d C
are Excellen
ce 20
16
2
71
Outcomes
No of participants (studies) Follow up
Quality of the evidence (GRADE)
Relative effect (95% CI)
Anticipated absolute effects
Risk with control Risk difference with pentoxifylline versus placebo (95% CI)
Lobular inflammation (change score) >12 months Histology (NAS)
72 (2 studies) 12 months
⊕⊕⊕⊝ MODERATEa due to imprecision
The mean lobular inflammation (change score) >12 months in the control groups was 0.19
The mean lobular inflammation (change score) >12 months in the intervention groups was 0.43 lower (0.64 to 0.22 lower)
Critical mortality outcomes
No evidence identified
Critical severe adverse event outcomes
No evidence identified
Critical quality of life outcomes
No evidence identified
Important liver function test outcomes
Normalisation in ALT levels >12 months
26 (2 studies) 12 months
⊕⊕⊝⊝ LOWa,b due to risk of bias, imprecision
RR 2.24 (1.15 to 5.02)
Moderate
187 per 1000 262 more per 1000 (from 28 more to 752 more)
ALT levels (change score) >12 months 26 (1 study) 12 months
⊕⊕⊝⊝ LOWa due to imprecision
The mean ALT levels (change score) >12 months in the control groups was -12 IU/L
The mean ALT levels (change score) >12 months in the intervention groups was 13.1 lower (35.9 lower to 9.7 higher)
ALT levels (final value) ≥3 to <12 months
20 (1 study)
⊕⊕⊕⊝ MODERATEa
The mean ALT levels (final value) ≥3 to <12 months in the control groups was
The mean ALT levels (final value) ≥3 to <12 months in the intervention groups
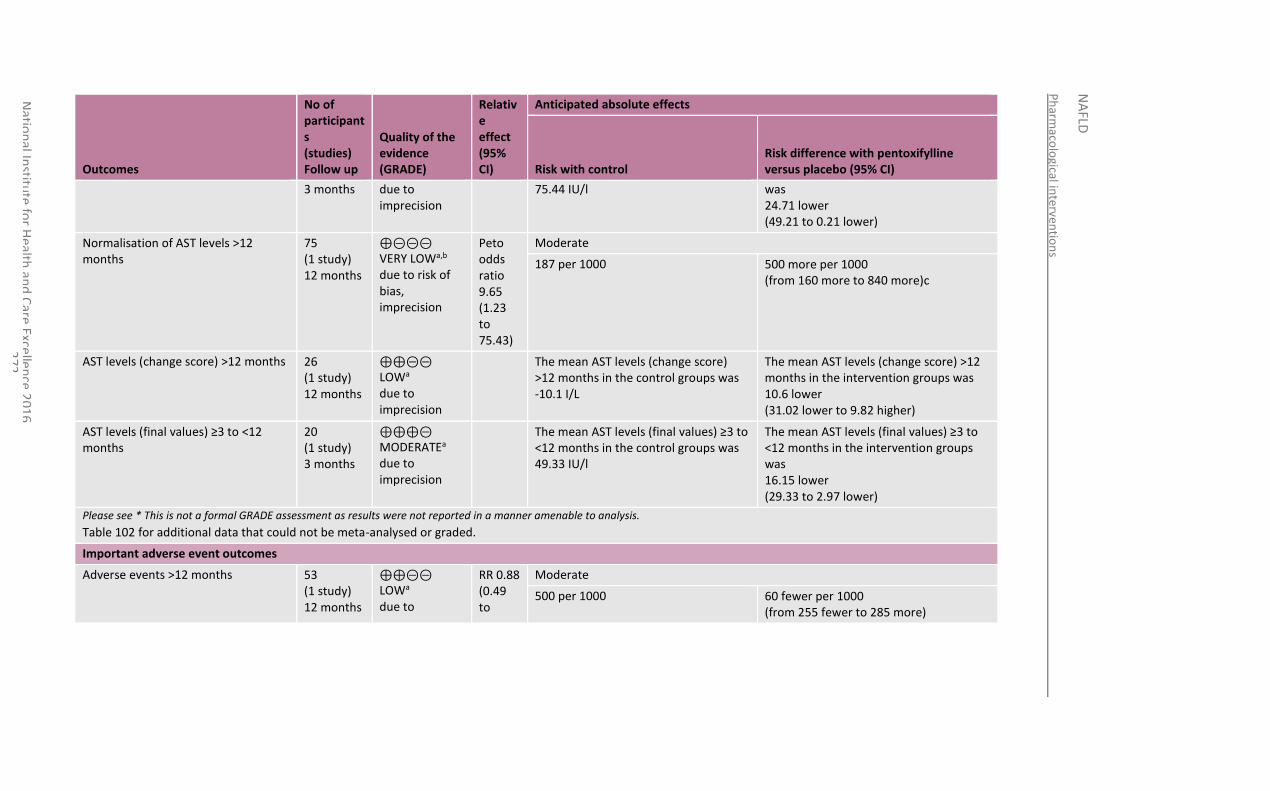
Ph
armaco
logical in
terventio
ns
NA
FLD
Natio
nal In
stitute
for H
ealth an
d C
are Excellen
ce 20
16
2
72
Outcomes
No of participants (studies) Follow up
Quality of the evidence (GRADE)
Relative effect (95% CI)
Anticipated absolute effects
Risk with control Risk difference with pentoxifylline versus placebo (95% CI)
3 months due to imprecision
75.44 IU/l was 24.71 lower (49.21 to 0.21 lower)
Normalisation of AST levels >12 months
75 (1 study) 12 months
⊕⊝⊝⊝ VERY LOWa,b due to risk of bias, imprecision
Peto odds ratio 9.65 (1.23 to 75.43)
Moderate
187 per 1000 500 more per 1000 (from 160 more to 840 more)c
AST levels (change score) >12 months 26 (1 study) 12 months
⊕⊕⊝⊝ LOWa due to imprecision
The mean AST levels (change score) >12 months in the control groups was -10.1 I/L
The mean AST levels (change score) >12 months in the intervention groups was 10.6 lower (31.02 lower to 9.82 higher)
AST levels (final values) ≥3 to <12 months
20 (1 study) 3 months
⊕⊕⊕⊝ MODERATEa due to imprecision
The mean AST levels (final values) ≥3 to <12 months in the control groups was 49.33 IU/l
The mean AST levels (final values) ≥3 to <12 months in the intervention groups was 16.15 lower (29.33 to 2.97 lower)
Please see * This is not a formal GRADE assessment as results were not reported in a manner amenable to analysis.
Table 102 for additional data that could not be meta-analysed or graded.
Important adverse event outcomes
Adverse events >12 months 53 (1 study) 12 months
⊕⊕⊝⊝ LOWa due to
RR 0.88 (0.49 to
Moderate
500 per 1000 60 fewer per 1000 (from 255 fewer to 285 more)
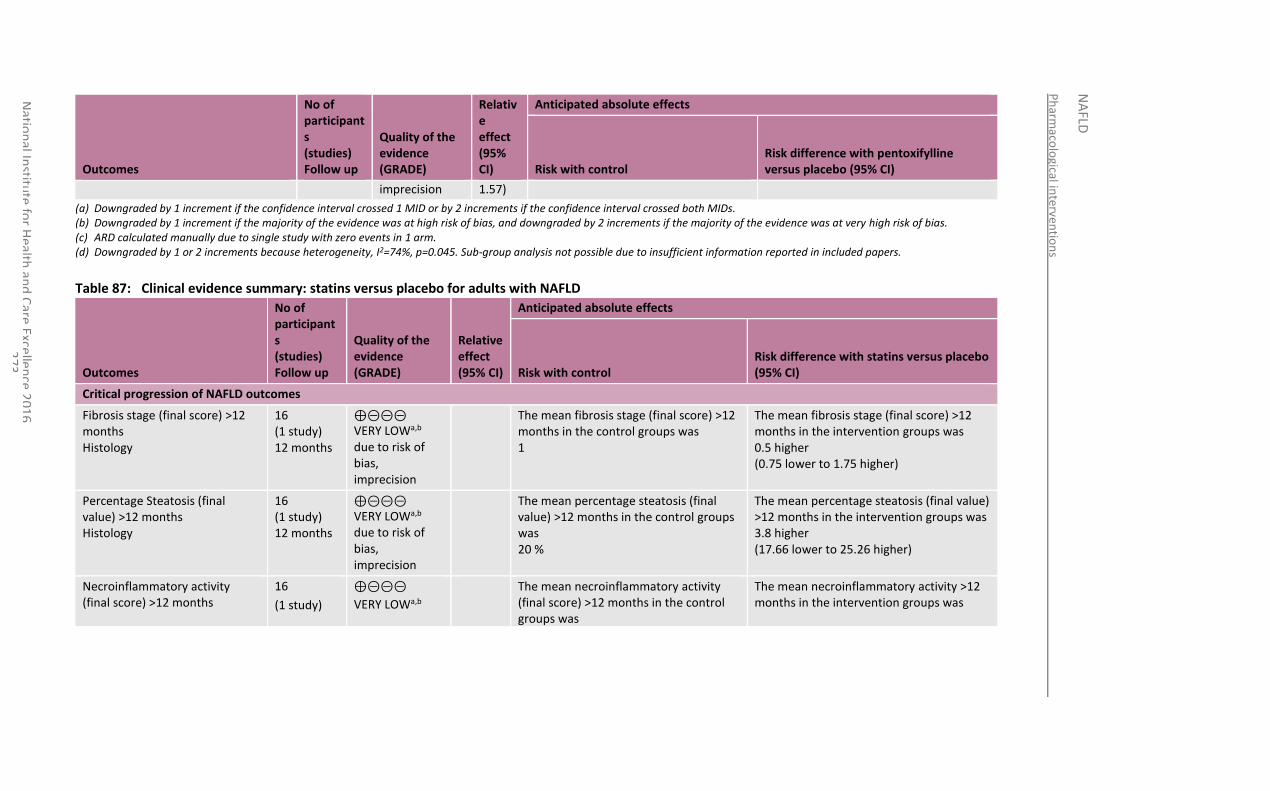
Ph
armaco
logical in
terventio
ns
NA
FLD
Natio
nal In
stitute
for H
ealth an
d C
are Excellen
ce 20
16
2
73
Outcomes
No of participants (studies) Follow up
Quality of the evidence (GRADE)
Relative effect (95% CI)
Anticipated absolute effects
Risk with control Risk difference with pentoxifylline versus placebo (95% CI)
imprecision 1.57)
(a) Downgraded by 1 increment if the confidence interval crossed 1 MID or by 2 increments if the confidence interval crossed both MIDs. (b) Downgraded by 1 increment if the majority of the evidence was at high risk of bias, and downgraded by 2 increments if the majority of the evidence was at very high risk of bias. (c) ARD calculated manually due to single study with zero events in 1 arm. (d) Downgraded by 1 or 2 increments because heterogeneity, I2=74%, p=0.045. Sub-group analysis not possible due to insufficient information reported in included papers.
Table 87: Clinical evidence summary: statins versus placebo for adults with NAFLD
Outcomes
No of participants (studies) Follow up
Quality of the evidence (GRADE)
Relative effect (95% CI)
Anticipated absolute effects
Risk with control Risk difference with statins versus placebo (95% CI)
Critical progression of NAFLD outcomes
Fibrosis stage (final score) >12 months Histology
16 (1 study) 12 months
⊕⊝⊝⊝ VERY LOWa,b due to risk of bias, imprecision
The mean fibrosis stage (final score) >12 months in the control groups was 1
The mean fibrosis stage (final score) >12 months in the intervention groups was 0.5 higher (0.75 lower to 1.75 higher)
Percentage Steatosis (final value) >12 months Histology
16 (1 study) 12 months
⊕⊝⊝⊝ VERY LOWa,b due to risk of bias, imprecision
The mean percentage steatosis (final value) >12 months in the control groups was 20 %
The mean percentage steatosis (final value) >12 months in the intervention groups was 3.8 higher (17.66 lower to 25.26 higher)
Necroinflammatory activity (final score) >12 months
16
(1 study)
⊕⊝⊝⊝
VERY LOWa,b
The mean necroinflammatory activity (final score) >12 months in the control groups was
The mean necroinflammatory activity >12 months in the intervention groups was
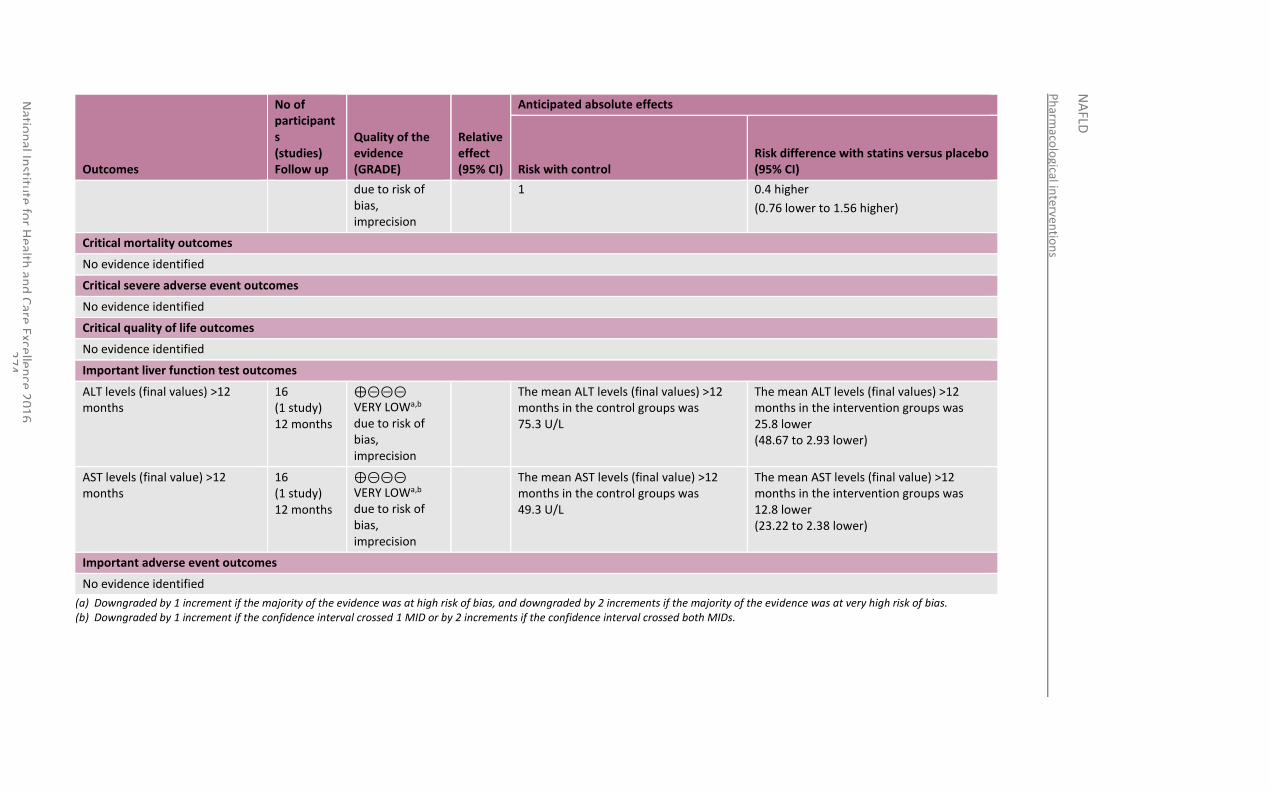
Ph
armaco
logical in
terventio
ns
NA
FLD
Natio
nal In
stitute
for H
ealth an
d C
are Excellen
ce 20
16
2
74
Outcomes
No of participants (studies) Follow up
Quality of the evidence (GRADE)
Relative effect (95% CI)
Anticipated absolute effects
Risk with control Risk difference with statins versus placebo (95% CI)
due to risk of bias, imprecision
1 0.4 higher
(0.76 lower to 1.56 higher)
Critical mortality outcomes
No evidence identified
Critical severe adverse event outcomes
No evidence identified
Critical quality of life outcomes
No evidence identified
Important liver function test outcomes
ALT levels (final values) >12 months
16 (1 study) 12 months
⊕⊝⊝⊝ VERY LOWa,b due to risk of bias, imprecision
The mean ALT levels (final values) >12 months in the control groups was 75.3 U/L
The mean ALT levels (final values) >12 months in the intervention groups was 25.8 lower (48.67 to 2.93 lower)
AST levels (final value) >12 months
16 (1 study) 12 months
⊕⊝⊝⊝ VERY LOWa,b due to risk of bias, imprecision
The mean AST levels (final value) >12 months in the control groups was 49.3 U/L
The mean AST levels (final value) >12 months in the intervention groups was 12.8 lower (23.22 to 2.38 lower)
Important adverse event outcomes
No evidence identified
(a) Downgraded by 1 increment if the majority of the evidence was at high risk of bias, and downgraded by 2 increments if the majority of the evidence was at very high risk of bias. (b) Downgraded by 1 increment if the confidence interval crossed 1 MID or by 2 increments if the confidence interval crossed both MIDs.
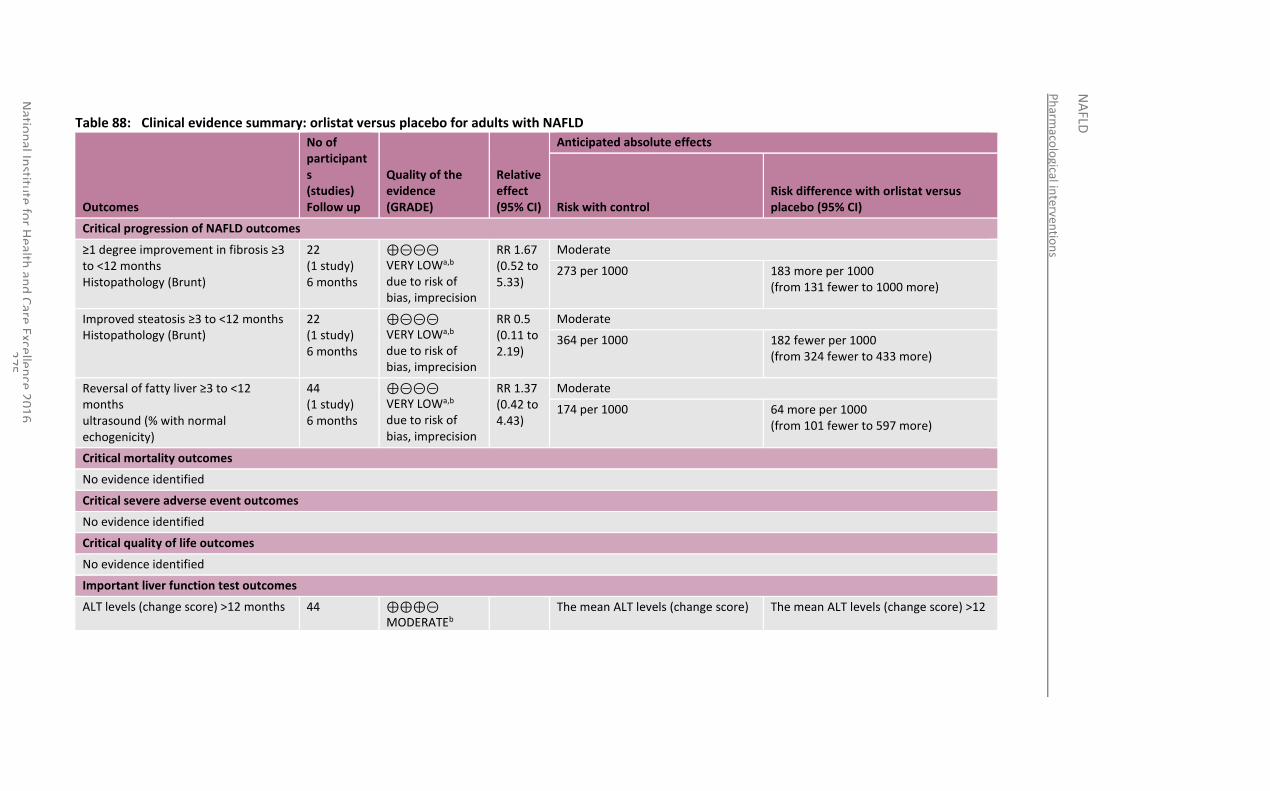
Ph
armaco
logical in
terventio
ns
NA
FLD
Natio
nal In
stitute
for H
ealth an
d C
are Excellen
ce 20
16
2
75
Table 88: Clinical evidence summary: orlistat versus placebo for adults with NAFLD
Outcomes
No of participants (studies) Follow up
Quality of the evidence (GRADE)
Relative effect (95% CI)
Anticipated absolute effects
Risk with control Risk difference with orlistat versus placebo (95% CI)
Critical progression of NAFLD outcomes
≥1 degree improvement in fibrosis ≥3 to <12 months Histopathology (Brunt)
22 (1 study) 6 months
⊕⊝⊝⊝ VERY LOWa,b due to risk of bias, imprecision
RR 1.67 (0.52 to 5.33)
Moderate
273 per 1000 183 more per 1000 (from 131 fewer to 1000 more)
Improved steatosis ≥3 to <12 months Histopathology (Brunt)
22 (1 study) 6 months
⊕⊝⊝⊝ VERY LOWa,b due to risk of bias, imprecision
RR 0.5 (0.11 to 2.19)
Moderate
364 per 1000 182 fewer per 1000 (from 324 fewer to 433 more)
Reversal of fatty liver ≥3 to <12 months ultrasound (% with normal echogenicity)
44 (1 study) 6 months
⊕⊝⊝⊝ VERY LOWa,b due to risk of bias, imprecision
RR 1.37 (0.42 to 4.43)
Moderate
174 per 1000 64 more per 1000 (from 101 fewer to 597 more)
Critical mortality outcomes
No evidence identified
Critical severe adverse event outcomes
No evidence identified
Critical quality of life outcomes
No evidence identified
Important liver function test outcomes
ALT levels (change score) >12 months 44 ⊕⊕⊕⊝ MODERATEb
The mean ALT levels (change score) The mean ALT levels (change score) >12
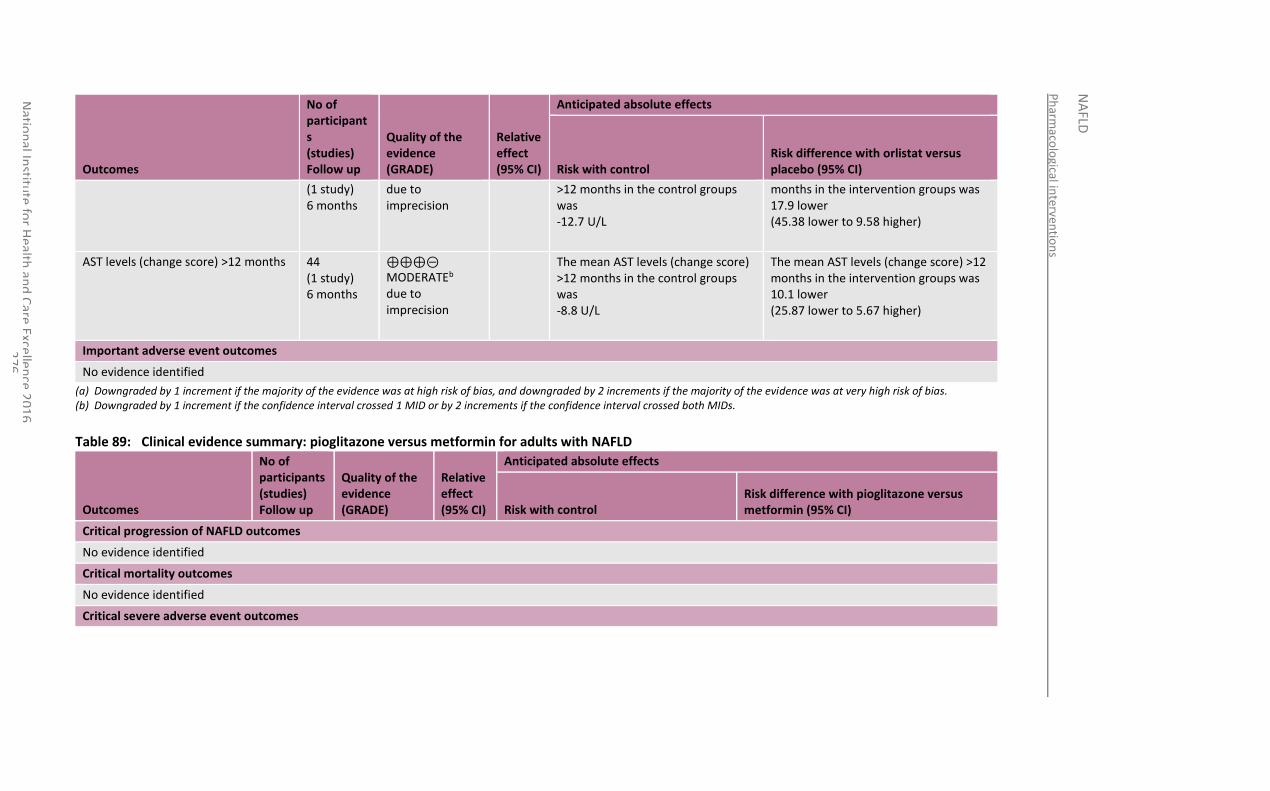
Ph
armaco
logical in
terventio
ns
NA
FLD
Natio
nal In
stitute
for H
ealth an
d C
are Excellen
ce 20
16
2
76
Outcomes
No of participants (studies) Follow up
Quality of the evidence (GRADE)
Relative effect (95% CI)
Anticipated absolute effects
Risk with control Risk difference with orlistat versus placebo (95% CI)
(1 study) 6 months
due to imprecision
>12 months in the control groups was -12.7 U/L
months in the intervention groups was 17.9 lower (45.38 lower to 9.58 higher)
AST levels (change score) >12 months 44 (1 study) 6 months
⊕⊕⊕⊝ MODERATEb due to imprecision
The mean AST levels (change score) >12 months in the control groups was -8.8 U/L
The mean AST levels (change score) >12 months in the intervention groups was 10.1 lower (25.87 lower to 5.67 higher)
Important adverse event outcomes
No evidence identified
(a) Downgraded by 1 increment if the majority of the evidence was at high risk of bias, and downgraded by 2 increments if the majority of the evidence was at very high risk of bias. (b) Downgraded by 1 increment if the confidence interval crossed 1 MID or by 2 increments if the confidence interval crossed both MIDs.
Table 89: Clinical evidence summary: pioglitazone versus metformin for adults with NAFLD
Outcomes
No of participants (studies) Follow up
Quality of the evidence (GRADE)
Relative effect (95% CI)
Anticipated absolute effects
Risk with control Risk difference with pioglitazone versus metformin (95% CI)
Critical progression of NAFLD outcomes
No evidence identified
Critical mortality outcomes
No evidence identified
Critical severe adverse event outcomes
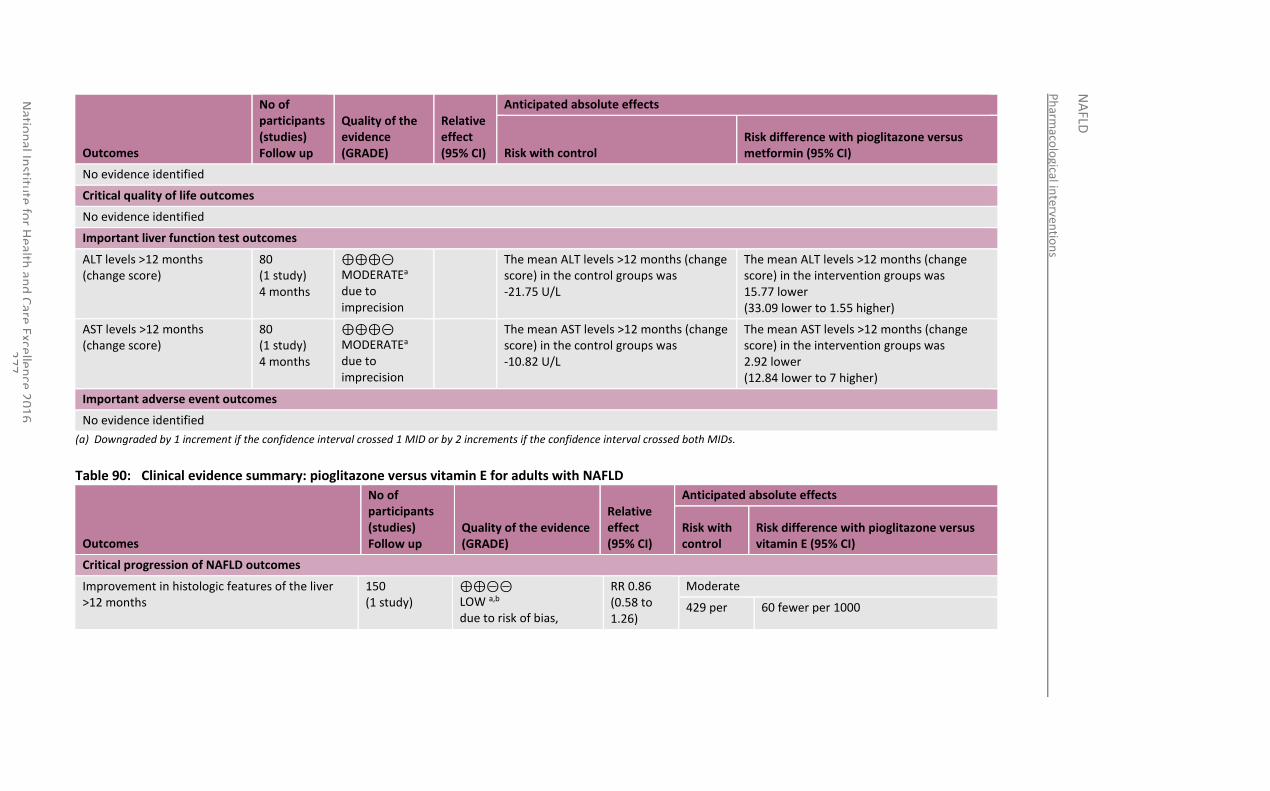
Ph
armaco
logical in
terventio
ns
NA
FLD
Natio
nal In
stitute
for H
ealth an
d C
are Excellen
ce 20
16
2
77
Outcomes
No of participants (studies) Follow up
Quality of the evidence (GRADE)
Relative effect (95% CI)
Anticipated absolute effects
Risk with control Risk difference with pioglitazone versus metformin (95% CI)
No evidence identified
Critical quality of life outcomes
No evidence identified
Important liver function test outcomes
ALT levels >12 months (change score)
80 (1 study) 4 months
⊕⊕⊕⊝ MODERATEa due to imprecision
The mean ALT levels >12 months (change score) in the control groups was -21.75 U/L
The mean ALT levels >12 months (change score) in the intervention groups was 15.77 lower (33.09 lower to 1.55 higher)
AST levels >12 months (change score)
80 (1 study) 4 months
⊕⊕⊕⊝ MODERATEa due to imprecision
The mean AST levels >12 months (change score) in the control groups was -10.82 U/L
The mean AST levels >12 months (change score) in the intervention groups was 2.92 lower (12.84 lower to 7 higher)
Important adverse event outcomes
No evidence identified
(a) Downgraded by 1 increment if the confidence interval crossed 1 MID or by 2 increments if the confidence interval crossed both MIDs.
Table 90: Clinical evidence summary: pioglitazone versus vitamin E for adults with NAFLD
Outcomes
No of participants (studies) Follow up
Quality of the evidence (GRADE)
Relative effect (95% CI)
Anticipated absolute effects
Risk with control
Risk difference with pioglitazone versus vitamin E (95% CI)
Critical progression of NAFLD outcomes
Improvement in histologic features of the liver >12 months
150 (1 study)
⊕⊕⊝⊝ LOW a,b due to risk of bias,
RR 0.86 (0.58 to 1.26)
Moderate
429 per 60 fewer per 1000
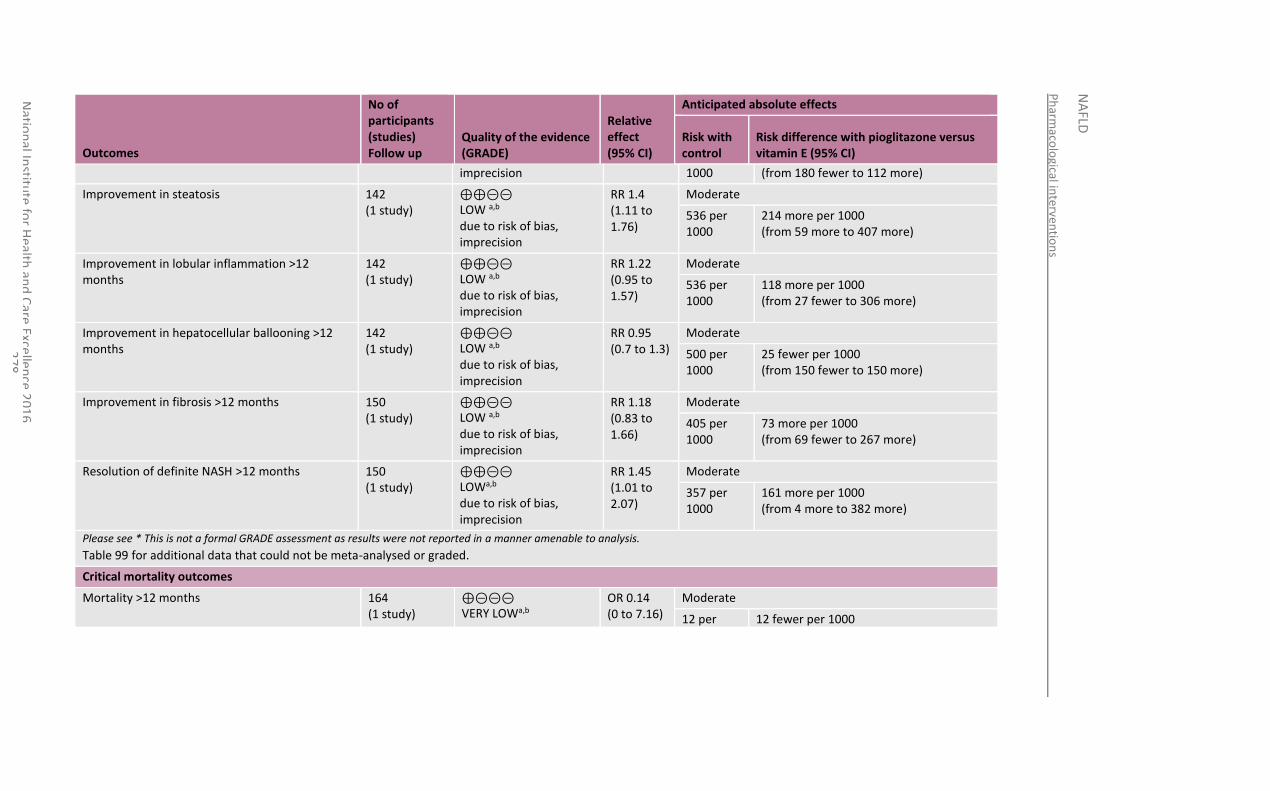
Ph
armaco
logical in
terventio
ns
NA
FLD
Natio
nal In
stitute
for H
ealth an
d C
are Excellen
ce 20
16
2
78
Outcomes
No of participants (studies) Follow up
Quality of the evidence (GRADE)
Relative effect (95% CI)
Anticipated absolute effects
Risk with control
Risk difference with pioglitazone versus vitamin E (95% CI)
imprecision 1000 (from 180 fewer to 112 more)
Improvement in steatosis 142 (1 study)
⊕⊕⊝⊝ LOW a,b due to risk of bias, imprecision
RR 1.4 (1.11 to 1.76)
Moderate
536 per 1000
214 more per 1000 (from 59 more to 407 more)
Improvement in lobular inflammation >12 months
142 (1 study)
⊕⊕⊝⊝ LOW a,b due to risk of bias, imprecision
RR 1.22 (0.95 to 1.57)
Moderate
536 per 1000
118 more per 1000 (from 27 fewer to 306 more)
Improvement in hepatocellular ballooning >12 months
142 (1 study)
⊕⊕⊝⊝ LOW a,b due to risk of bias, imprecision
RR 0.95 (0.7 to 1.3)
Moderate
500 per 1000
25 fewer per 1000 (from 150 fewer to 150 more)
Improvement in fibrosis >12 months 150 (1 study)
⊕⊕⊝⊝ LOW a,b due to risk of bias, imprecision
RR 1.18 (0.83 to 1.66)
Moderate
405 per 1000
73 more per 1000 (from 69 fewer to 267 more)
Resolution of definite NASH >12 months 150 (1 study)
⊕⊕⊝⊝ LOWa,b due to risk of bias, imprecision
RR 1.45 (1.01 to 2.07)
Moderate
357 per 1000
161 more per 1000 (from 4 more to 382 more)
Please see * This is not a formal GRADE assessment as results were not reported in a manner amenable to analysis.
Table 99 for additional data that could not be meta-analysed or graded.
Critical mortality outcomes
Mortality >12 months 164 (1 study)
⊕⊝⊝⊝ VERY LOWa,b
OR 0.14 (0 to 7.16)
Moderate
12 per 12 fewer per 1000
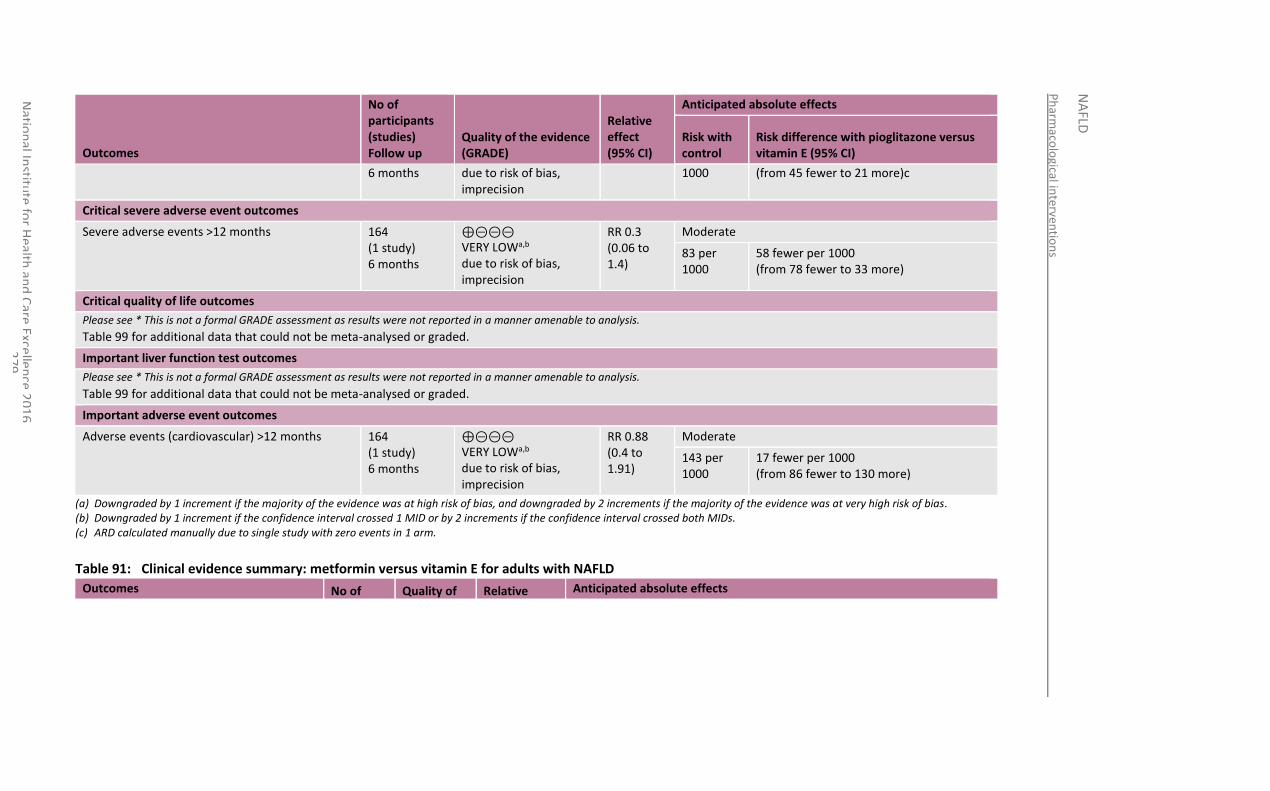
Ph
armaco
logical in
terventio
ns
NA
FLD
Natio
nal In
stitute
for H
ealth an
d C
are Excellen
ce 20
16
2
79
Outcomes
No of participants (studies) Follow up
Quality of the evidence (GRADE)
Relative effect (95% CI)
Anticipated absolute effects
Risk with control
Risk difference with pioglitazone versus vitamin E (95% CI)
6 months due to risk of bias, imprecision
1000 (from 45 fewer to 21 more)c
Critical severe adverse event outcomes
Severe adverse events >12 months 164 (1 study) 6 months
⊕⊝⊝⊝ VERY LOWa,b due to risk of bias, imprecision
RR 0.3 (0.06 to 1.4)
Moderate
83 per 1000
58 fewer per 1000 (from 78 fewer to 33 more)
Critical quality of life outcomes
Please see * This is not a formal GRADE assessment as results were not reported in a manner amenable to analysis.
Table 99 for additional data that could not be meta-analysed or graded.
Important liver function test outcomes
Please see * This is not a formal GRADE assessment as results were not reported in a manner amenable to analysis.
Table 99 for additional data that could not be meta-analysed or graded.
Important adverse event outcomes
Adverse events (cardiovascular) >12 months 164 (1 study) 6 months
⊕⊝⊝⊝ VERY LOWa,b due to risk of bias, imprecision
RR 0.88 (0.4 to 1.91)
Moderate
143 per 1000
17 fewer per 1000 (from 86 fewer to 130 more)
(a) Downgraded by 1 increment if the majority of the evidence was at high risk of bias, and downgraded by 2 increments if the majority of the evidence was at very high risk of bias. (b) Downgraded by 1 increment if the confidence interval crossed 1 MID or by 2 increments if the confidence interval crossed both MIDs. (c) ARD calculated manually due to single study with zero events in 1 arm.
Table 91: Clinical evidence summary: metformin versus vitamin E for adults with NAFLD
Outcomes No of Quality of Relative Anticipated absolute effects
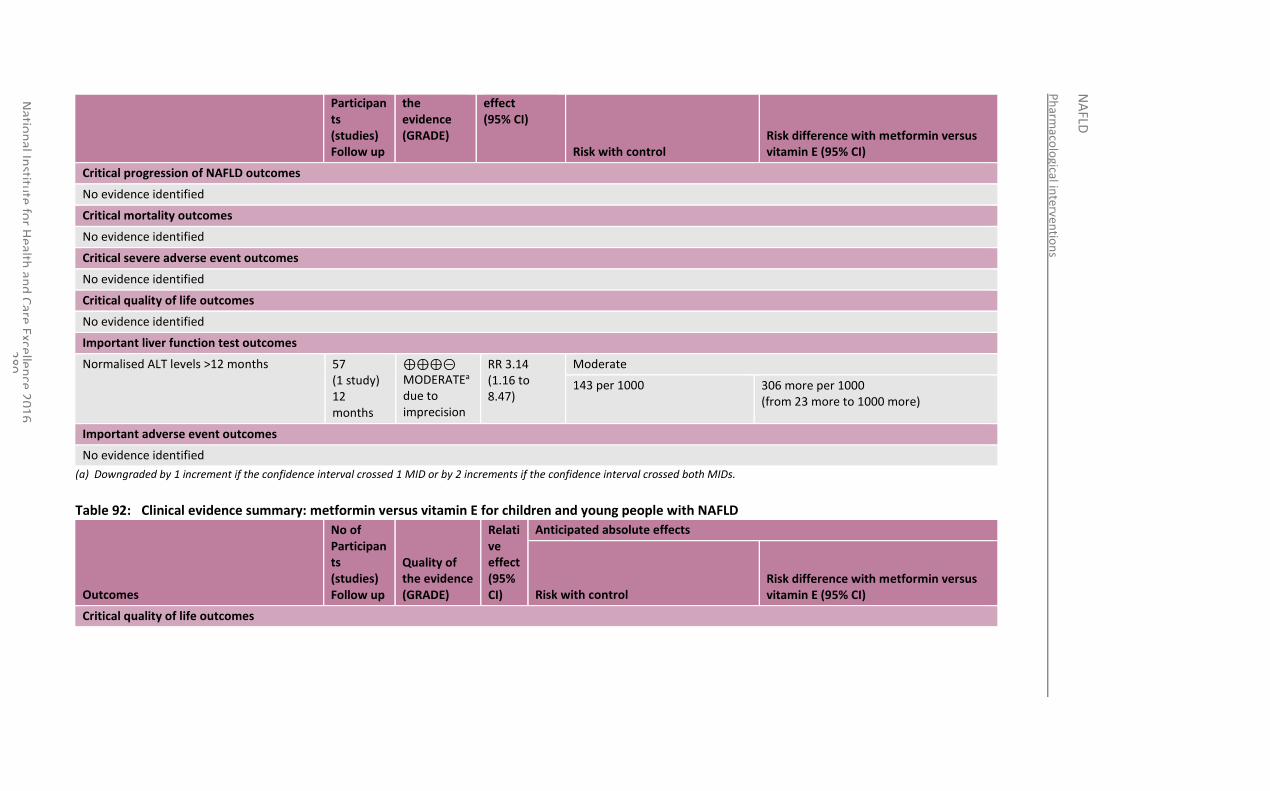
Ph
armaco
logical in
terventio
ns
NA
FLD
Natio
nal In
stitute
for H
ealth an
d C
are Excellen
ce 20
16
2
80
Participants (studies) Follow up
the evidence (GRADE)
effect (95% CI)
Risk with control Risk difference with metformin versus vitamin E (95% CI)
Critical progression of NAFLD outcomes
No evidence identified
Critical mortality outcomes
No evidence identified
Critical severe adverse event outcomes
No evidence identified
Critical quality of life outcomes
No evidence identified
Important liver function test outcomes
Normalised ALT levels >12 months 57 (1 study) 12 months
⊕⊕⊕⊝ MODERATEa due to imprecision
RR 3.14 (1.16 to 8.47)
Moderate
143 per 1000 306 more per 1000 (from 23 more to 1000 more)
Important adverse event outcomes
No evidence identified
(a) Downgraded by 1 increment if the confidence interval crossed 1 MID or by 2 increments if the confidence interval crossed both MIDs.
Table 92: Clinical evidence summary: metformin versus vitamin E for children and young people with NAFLD
Outcomes
No of Participants (studies) Follow up
Quality of the evidence (GRADE)
Relative effect (95% CI)
Anticipated absolute effects
Risk with control Risk difference with metformin versus vitamin E (95% CI)
Critical quality of life outcomes
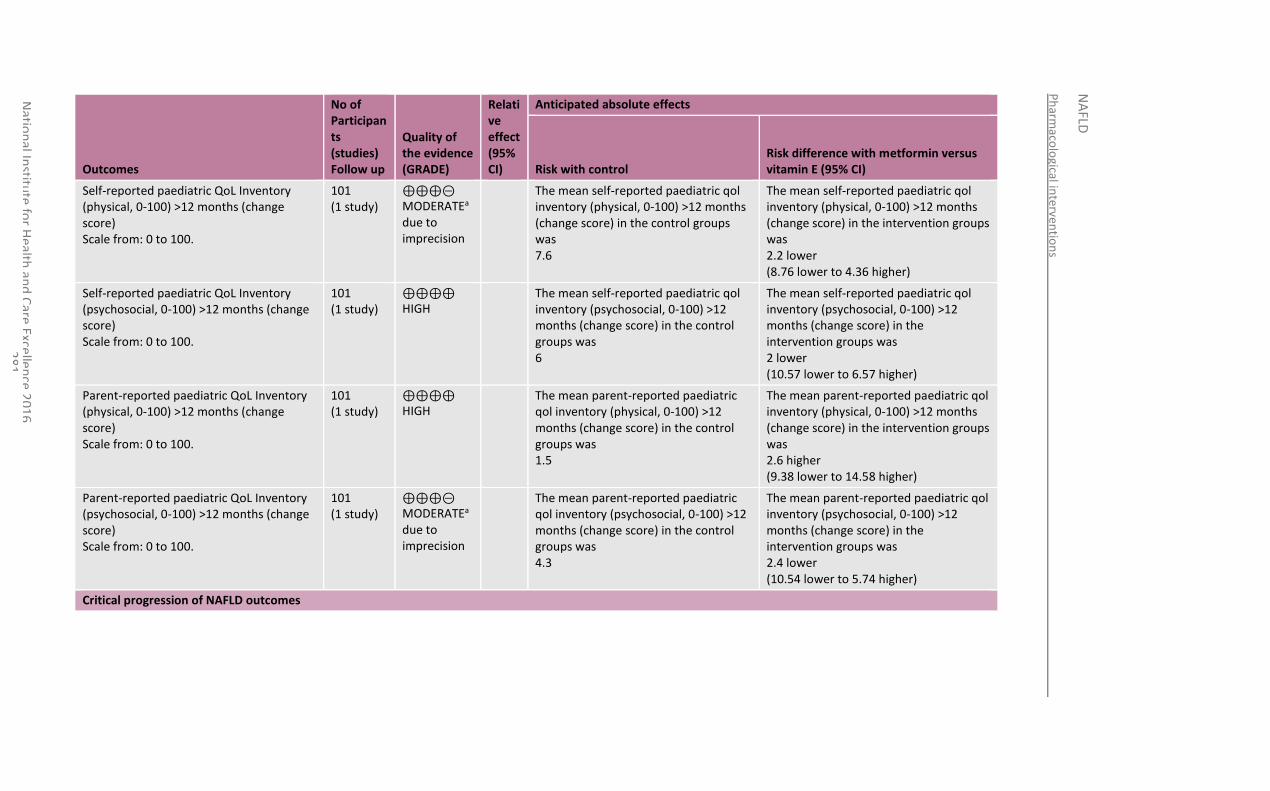
Ph
armaco
logical in
terventio
ns
NA
FLD
Natio
nal In
stitute
for H
ealth an
d C
are Excellen
ce 20
16
2
81
Outcomes
No of Participants (studies) Follow up
Quality of the evidence (GRADE)
Relative effect (95% CI)
Anticipated absolute effects
Risk with control Risk difference with metformin versus vitamin E (95% CI)
Self-reported paediatric QoL Inventory (physical, 0-100) >12 months (change score) Scale from: 0 to 100.
101 (1 study)
⊕⊕⊕⊝ MODERATEa due to imprecision
The mean self-reported paediatric qol inventory (physical, 0-100) >12 months (change score) in the control groups was 7.6
The mean self-reported paediatric qol inventory (physical, 0-100) >12 months (change score) in the intervention groups was 2.2 lower (8.76 lower to 4.36 higher)
Self-reported paediatric QoL Inventory (psychosocial, 0-100) >12 months (change score) Scale from: 0 to 100.
101 (1 study)
⊕⊕⊕⊕ HIGH
The mean self-reported paediatric qol inventory (psychosocial, 0-100) >12 months (change score) in the control groups was 6
The mean self-reported paediatric qol inventory (psychosocial, 0-100) >12 months (change score) in the intervention groups was 2 lower (10.57 lower to 6.57 higher)
Parent-reported paediatric QoL Inventory (physical, 0-100) >12 months (change score) Scale from: 0 to 100.
101 (1 study)
⊕⊕⊕⊕ HIGH
The mean parent-reported paediatric qol inventory (physical, 0-100) >12 months (change score) in the control groups was 1.5
The mean parent-reported paediatric qol inventory (physical, 0-100) >12 months (change score) in the intervention groups was 2.6 higher (9.38 lower to 14.58 higher)
Parent-reported paediatric QoL Inventory (psychosocial, 0-100) >12 months (change score) Scale from: 0 to 100.
101 (1 study)
⊕⊕⊕⊝ MODERATEa due to imprecision
The mean parent-reported paediatric qol inventory (psychosocial, 0-100) >12 months (change score) in the control groups was 4.3
The mean parent-reported paediatric qol inventory (psychosocial, 0-100) >12 months (change score) in the intervention groups was 2.4 lower (10.54 lower to 5.74 higher)
Critical progression of NAFLD outcomes
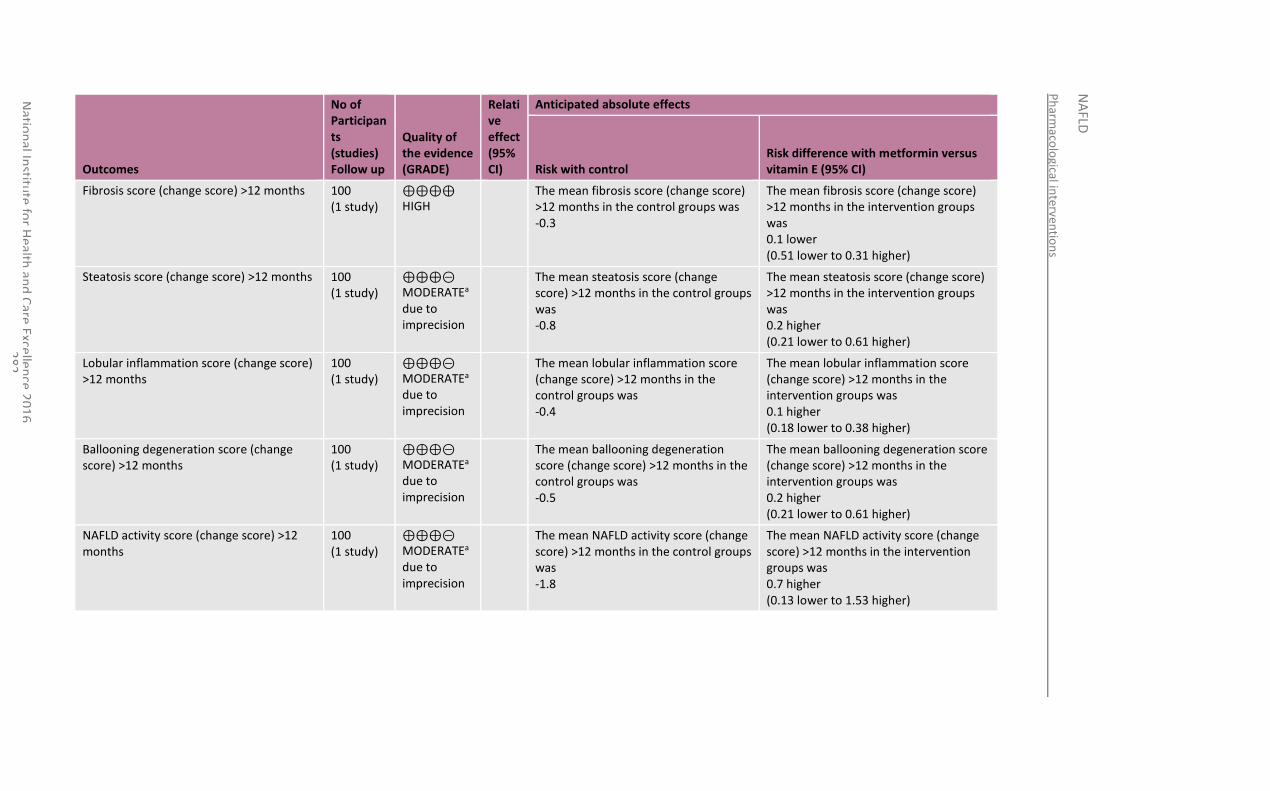
Ph
armaco
logical in
terventio
ns
NA
FLD
Natio
nal In
stitute
for H
ealth an
d C
are Excellen
ce 20
16
2
82
Outcomes
No of Participants (studies) Follow up
Quality of the evidence (GRADE)
Relative effect (95% CI)
Anticipated absolute effects
Risk with control Risk difference with metformin versus vitamin E (95% CI)
Fibrosis score (change score) >12 months 100 (1 study)
⊕⊕⊕⊕ HIGH
The mean fibrosis score (change score) >12 months in the control groups was -0.3
The mean fibrosis score (change score) >12 months in the intervention groups was 0.1 lower (0.51 lower to 0.31 higher)
Steatosis score (change score) >12 months 100 (1 study)
⊕⊕⊕⊝ MODERATEa due to imprecision
The mean steatosis score (change score) >12 months in the control groups was -0.8
The mean steatosis score (change score) >12 months in the intervention groups was 0.2 higher (0.21 lower to 0.61 higher)
Lobular inflammation score (change score) >12 months
100 (1 study)
⊕⊕⊕⊝ MODERATEa due to imprecision
The mean lobular inflammation score (change score) >12 months in the control groups was -0.4
The mean lobular inflammation score (change score) >12 months in the intervention groups was 0.1 higher (0.18 lower to 0.38 higher)
Ballooning degeneration score (change score) >12 months
100 (1 study)
⊕⊕⊕⊝ MODERATEa due to imprecision
The mean ballooning degeneration score (change score) >12 months in the control groups was -0.5
The mean ballooning degeneration score (change score) >12 months in the intervention groups was 0.2 higher (0.21 lower to 0.61 higher)
NAFLD activity score (change score) >12 months
100 (1 study)
⊕⊕⊕⊝ MODERATEa due to imprecision
The mean NAFLD activity score (change score) >12 months in the control groups was -1.8
The mean NAFLD activity score (change score) >12 months in the intervention groups was 0.7 higher (0.13 lower to 1.53 higher)
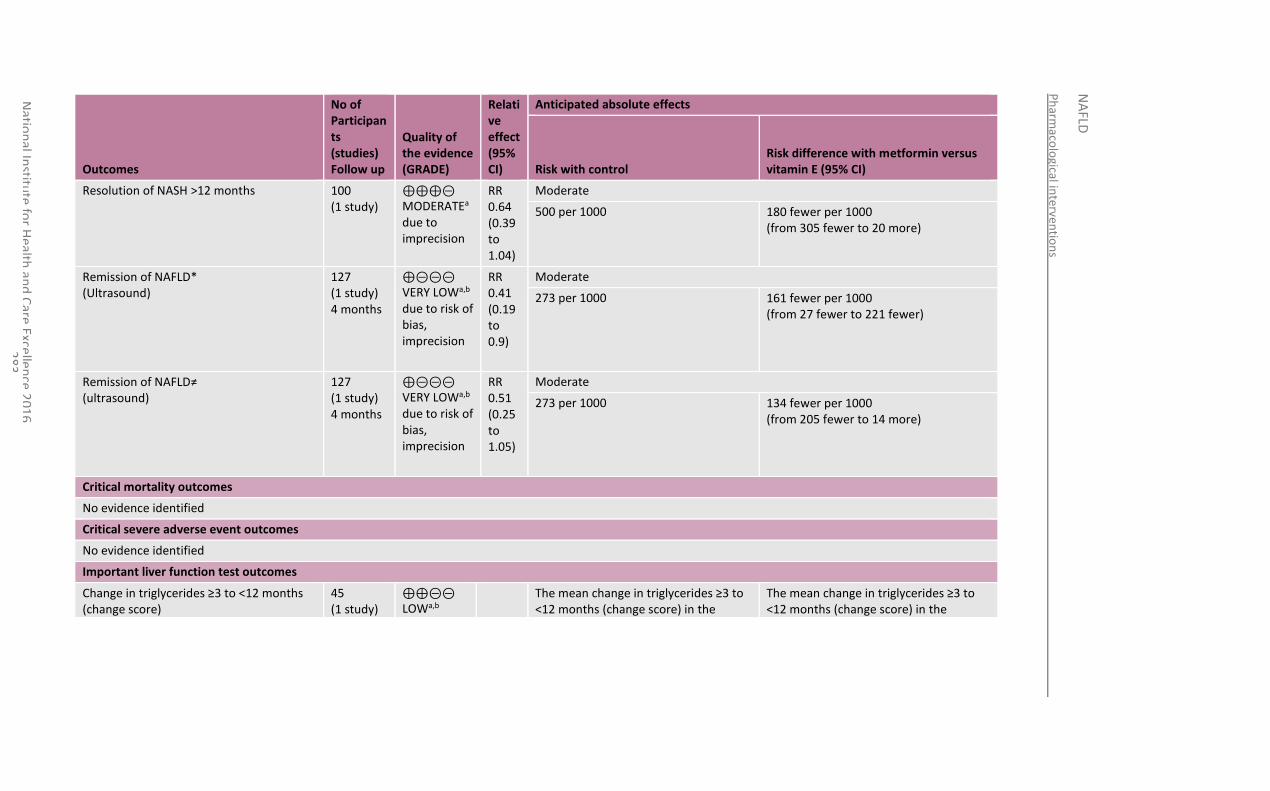
Ph
armaco
logical in
terventio
ns
NA
FLD
Natio
nal In
stitute
for H
ealth an
d C
are Excellen
ce 20
16
2
83
Outcomes
No of Participants (studies) Follow up
Quality of the evidence (GRADE)
Relative effect (95% CI)
Anticipated absolute effects
Risk with control Risk difference with metformin versus vitamin E (95% CI)
Resolution of NASH >12 months 100 (1 study)
⊕⊕⊕⊝ MODERATEa due to imprecision
RR 0.64 (0.39 to 1.04)
Moderate
500 per 1000 180 fewer per 1000 (from 305 fewer to 20 more)
Remission of NAFLD* (Ultrasound)
127 (1 study) 4 months
⊕⊝⊝⊝ VERY LOWa,b due to risk of bias, imprecision
RR 0.41 (0.19 to 0.9)
Moderate
273 per 1000 161 fewer per 1000 (from 27 fewer to 221 fewer)
Remission of NAFLD≠ (ultrasound)
127 (1 study) 4 months
⊕⊝⊝⊝ VERY LOWa,b due to risk of bias, imprecision
RR 0.51 (0.25 to 1.05)
Moderate
273 per 1000 134 fewer per 1000 (from 205 fewer to 14 more)
Critical mortality outcomes
No evidence identified
Critical severe adverse event outcomes
No evidence identified
Important liver function test outcomes
Change in triglycerides ≥3 to <12 months (change score)
45 (1 study)
⊕⊕⊝⊝ LOWa,b
The mean change in triglycerides ≥3 to <12 months (change score) in the
The mean change in triglycerides ≥3 to <12 months (change score) in the
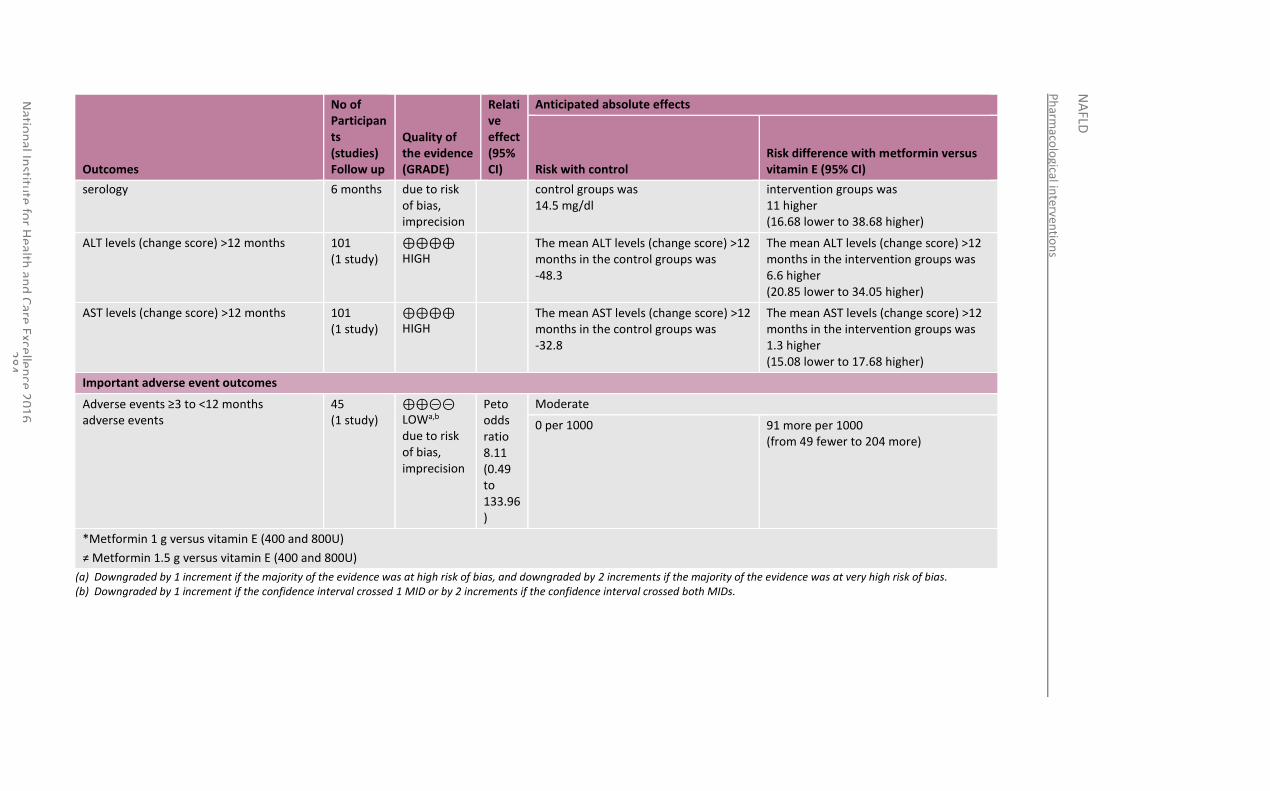
Ph
armaco
logical in
terventio
ns
NA
FLD
Natio
nal In
stitute
for H
ealth an
d C
are Excellen
ce 20
16
2
84
Outcomes
No of Participants (studies) Follow up
Quality of the evidence (GRADE)
Relative effect (95% CI)
Anticipated absolute effects
Risk with control Risk difference with metformin versus vitamin E (95% CI)
serology 6 months due to risk of bias, imprecision
control groups was 14.5 mg/dl
intervention groups was 11 higher (16.68 lower to 38.68 higher)
ALT levels (change score) >12 months 101 (1 study)
⊕⊕⊕⊕ HIGH
The mean ALT levels (change score) >12 months in the control groups was -48.3
The mean ALT levels (change score) >12 months in the intervention groups was 6.6 higher (20.85 lower to 34.05 higher)
AST levels (change score) >12 months 101 (1 study)
⊕⊕⊕⊕ HIGH
The mean AST levels (change score) >12 months in the control groups was -32.8
The mean AST levels (change score) >12 months in the intervention groups was 1.3 higher (15.08 lower to 17.68 higher)
Important adverse event outcomes
Adverse events ≥3 to <12 months adverse events
45 (1 study)
⊕⊕⊝⊝ LOWa,b due to risk of bias, imprecision
Peto odds ratio 8.11 (0.49 to 133.96)
Moderate
0 per 1000 91 more per 1000 (from 49 fewer to 204 more)
*Metformin 1 g versus vitamin E (400 and 800U)
≠ Metformin 1.5 g versus vitamin E (400 and 800U)
(a) Downgraded by 1 increment if the majority of the evidence was at high risk of bias, and downgraded by 2 increments if the majority of the evidence was at very high risk of bias. (b) Downgraded by 1 increment if the confidence interval crossed 1 MID or by 2 increments if the confidence interval crossed both MIDs.
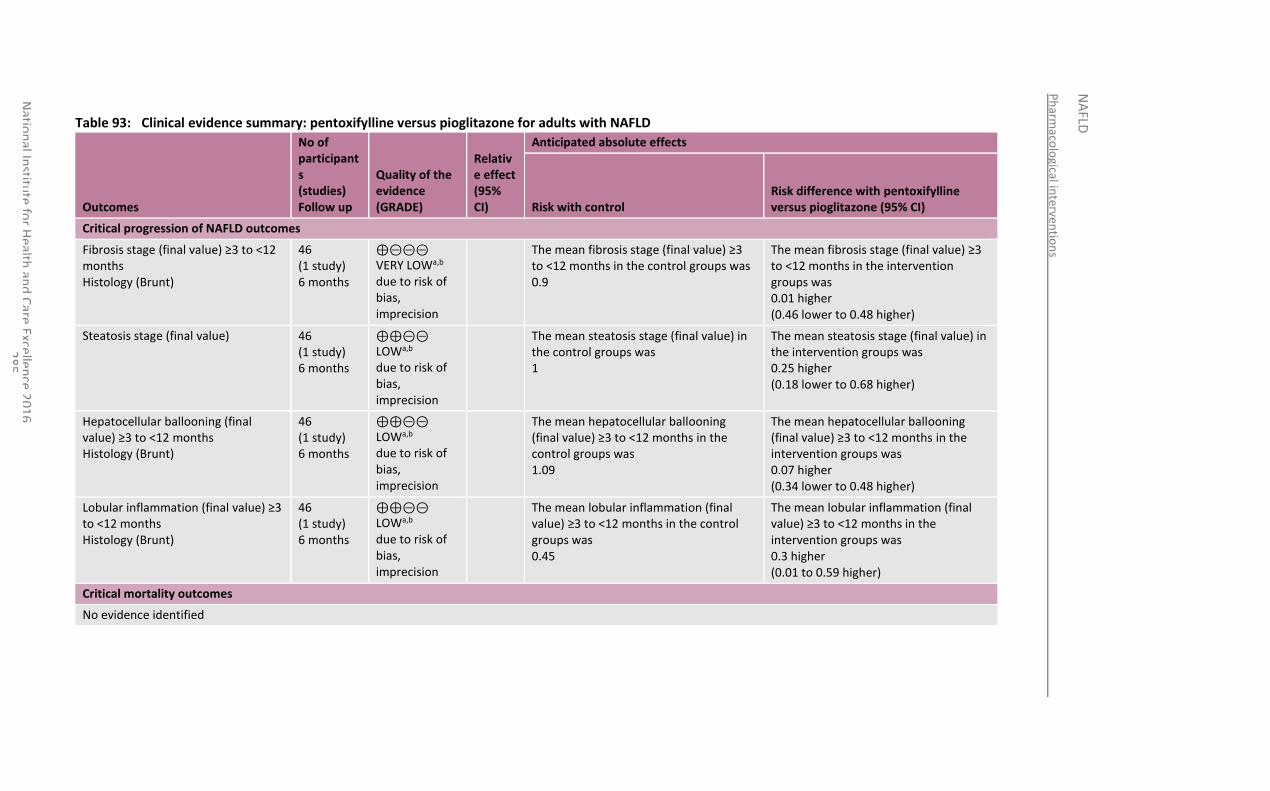
Ph
armaco
logical in
terventio
ns
NA
FLD
Natio
nal In
stitute
for H
ealth an
d C
are Excellen
ce 20
16
2
85
Table 93: Clinical evidence summary: pentoxifylline versus pioglitazone for adults with NAFLD
Outcomes
No of participants (studies) Follow up
Quality of the evidence (GRADE)
Relative effect (95% CI)
Anticipated absolute effects
Risk with control Risk difference with pentoxifylline versus pioglitazone (95% CI)
Critical progression of NAFLD outcomes
Fibrosis stage (final value) ≥3 to <12 months Histology (Brunt)
46 (1 study) 6 months
⊕⊝⊝⊝ VERY LOWa,b due to risk of bias, imprecision
The mean fibrosis stage (final value) ≥3 to <12 months in the control groups was 0.9
The mean fibrosis stage (final value) ≥3 to <12 months in the intervention groups was 0.01 higher (0.46 lower to 0.48 higher)
Steatosis stage (final value) 46 (1 study) 6 months
⊕⊕⊝⊝ LOWa,b due to risk of bias, imprecision
The mean steatosis stage (final value) in the control groups was 1
The mean steatosis stage (final value) in the intervention groups was 0.25 higher (0.18 lower to 0.68 higher)
Hepatocellular ballooning (final value) ≥3 to <12 months Histology (Brunt)
46 (1 study) 6 months
⊕⊕⊝⊝ LOWa,b due to risk of bias, imprecision
The mean hepatocellular ballooning (final value) ≥3 to <12 months in the control groups was 1.09
The mean hepatocellular ballooning (final value) ≥3 to <12 months in the intervention groups was 0.07 higher (0.34 lower to 0.48 higher)
Lobular inflammation (final value) ≥3 to <12 months Histology (Brunt)
46 (1 study) 6 months
⊕⊕⊝⊝ LOWa,b due to risk of bias, imprecision
The mean lobular inflammation (final value) ≥3 to <12 months in the control groups was 0.45
The mean lobular inflammation (final value) ≥3 to <12 months in the intervention groups was 0.3 higher (0.01 to 0.59 higher)
Critical mortality outcomes
No evidence identified
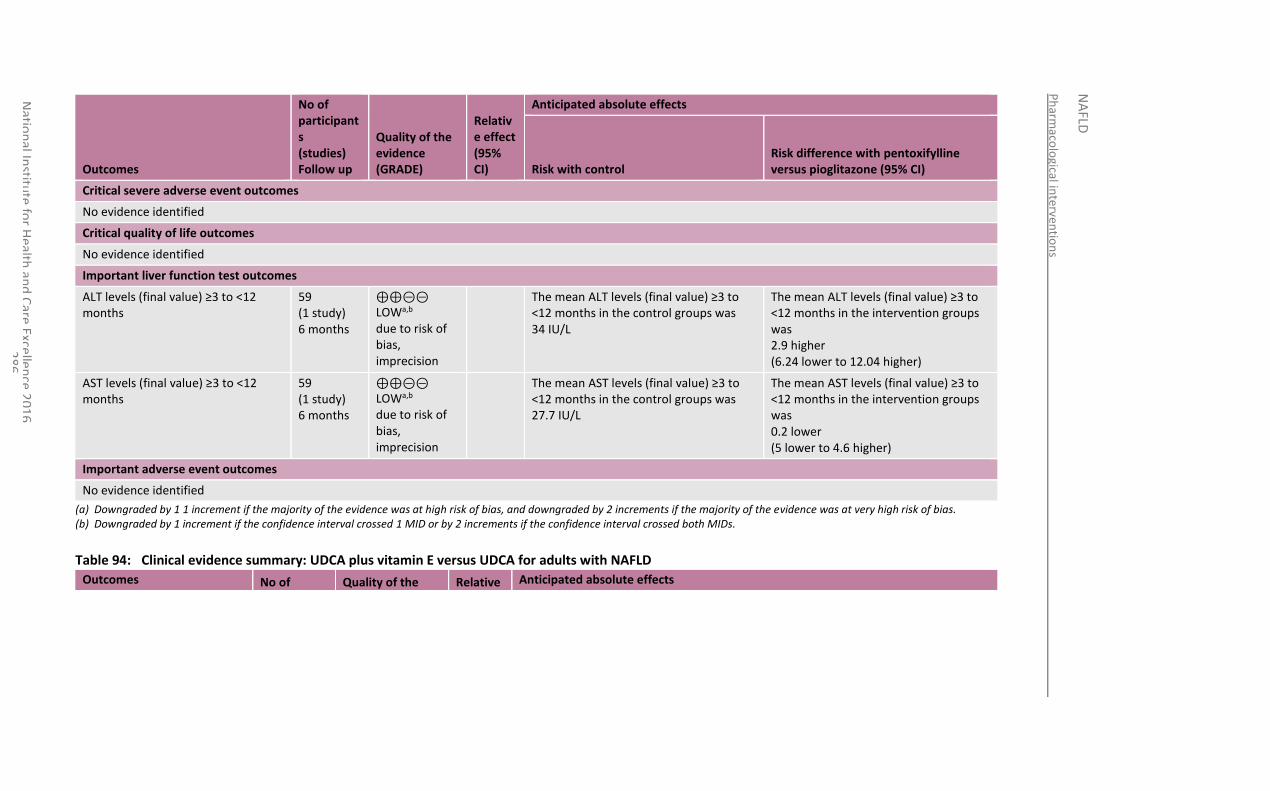
Ph
armaco
logical in
terventio
ns
NA
FLD
Natio
nal In
stitute
for H
ealth an
d C
are Excellen
ce 20
16
2
86
Outcomes
No of participants (studies) Follow up
Quality of the evidence (GRADE)
Relative effect (95% CI)
Anticipated absolute effects
Risk with control Risk difference with pentoxifylline versus pioglitazone (95% CI)
Critical severe adverse event outcomes
No evidence identified
Critical quality of life outcomes
No evidence identified
Important liver function test outcomes
ALT levels (final value) ≥3 to <12 months
59 (1 study) 6 months
⊕⊕⊝⊝ LOWa,b due to risk of bias, imprecision
The mean ALT levels (final value) ≥3 to <12 months in the control groups was 34 IU/L
The mean ALT levels (final value) ≥3 to <12 months in the intervention groups was 2.9 higher (6.24 lower to 12.04 higher)
AST levels (final value) ≥3 to <12 months
59 (1 study) 6 months
⊕⊕⊝⊝ LOWa,b due to risk of bias, imprecision
The mean AST levels (final value) ≥3 to <12 months in the control groups was 27.7 IU/L
The mean AST levels (final value) ≥3 to <12 months in the intervention groups was 0.2 lower (5 lower to 4.6 higher)
Important adverse event outcomes
No evidence identified
(a) Downgraded by 1 1 increment if the majority of the evidence was at high risk of bias, and downgraded by 2 increments if the majority of the evidence was at very high risk of bias. (b) Downgraded by 1 increment if the confidence interval crossed 1 MID or by 2 increments if the confidence interval crossed both MIDs.
Table 94: Clinical evidence summary: UDCA plus vitamin E versus UDCA for adults with NAFLD
Outcomes No of Quality of the Relative Anticipated absolute effects
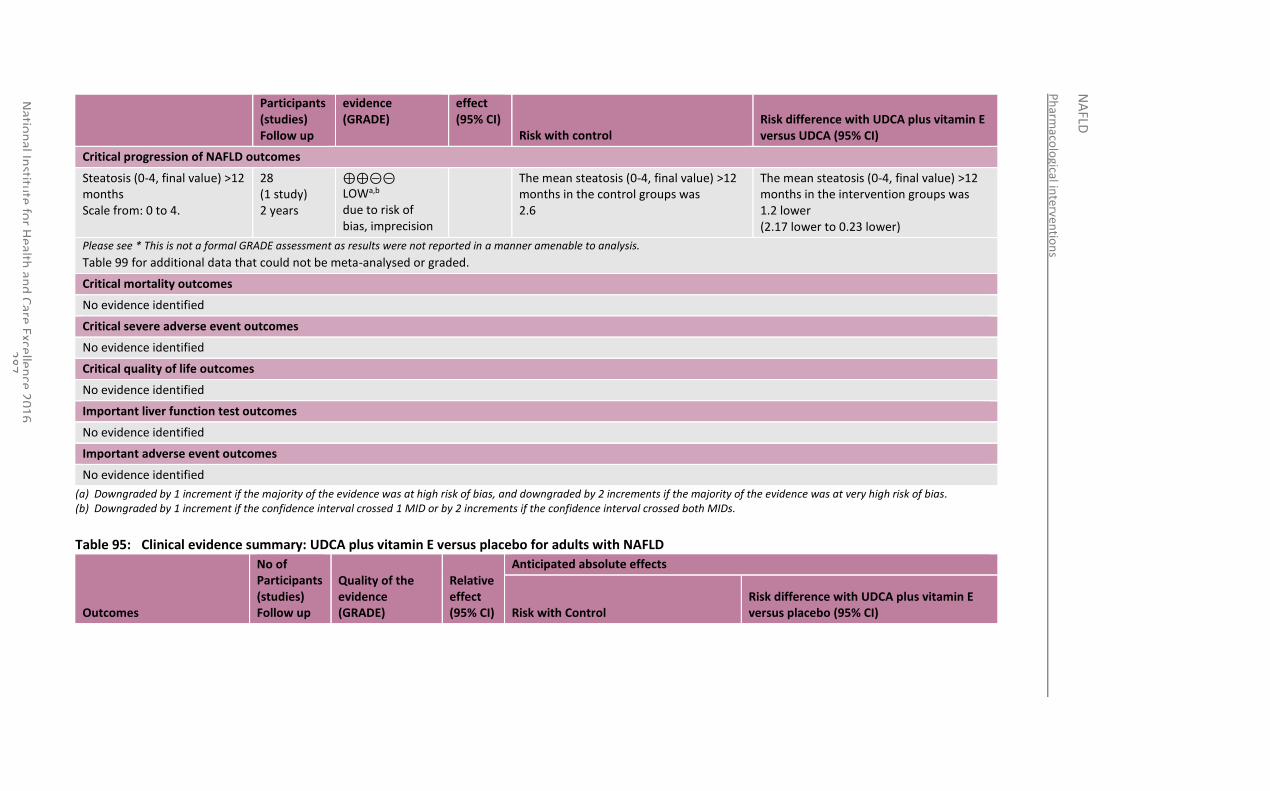
Ph
armaco
logical in
terventio
ns
NA
FLD
Natio
nal In
stitute
for H
ealth an
d C
are Excellen
ce 20
16
2
87
Participants (studies) Follow up
evidence (GRADE)
effect (95% CI)
Risk with control Risk difference with UDCA plus vitamin E versus UDCA (95% CI)
Critical progression of NAFLD outcomes
Steatosis (0-4, final value) >12 months Scale from: 0 to 4.
28 (1 study) 2 years
⊕⊕⊝⊝ LOWa,b due to risk of bias, imprecision
The mean steatosis (0-4, final value) >12 months in the control groups was 2.6
The mean steatosis (0-4, final value) >12 months in the intervention groups was 1.2 lower (2.17 lower to 0.23 lower)
Please see * This is not a formal GRADE assessment as results were not reported in a manner amenable to analysis.
Table 99 for additional data that could not be meta-analysed or graded.
Critical mortality outcomes
No evidence identified
Critical severe adverse event outcomes
No evidence identified
Critical quality of life outcomes
No evidence identified
Important liver function test outcomes
No evidence identified
Important adverse event outcomes
No evidence identified
(a) Downgraded by 1 increment if the majority of the evidence was at high risk of bias, and downgraded by 2 increments if the majority of the evidence was at very high risk of bias. (b) Downgraded by 1 increment if the confidence interval crossed 1 MID or by 2 increments if the confidence interval crossed both MIDs.
Table 95: Clinical evidence summary: UDCA plus vitamin E versus placebo for adults with NAFLD
Outcomes
No of Participants (studies) Follow up
Quality of the evidence (GRADE)
Relative effect (95% CI)
Anticipated absolute effects
Risk with Control Risk difference with UDCA plus vitamin E versus placebo (95% CI)
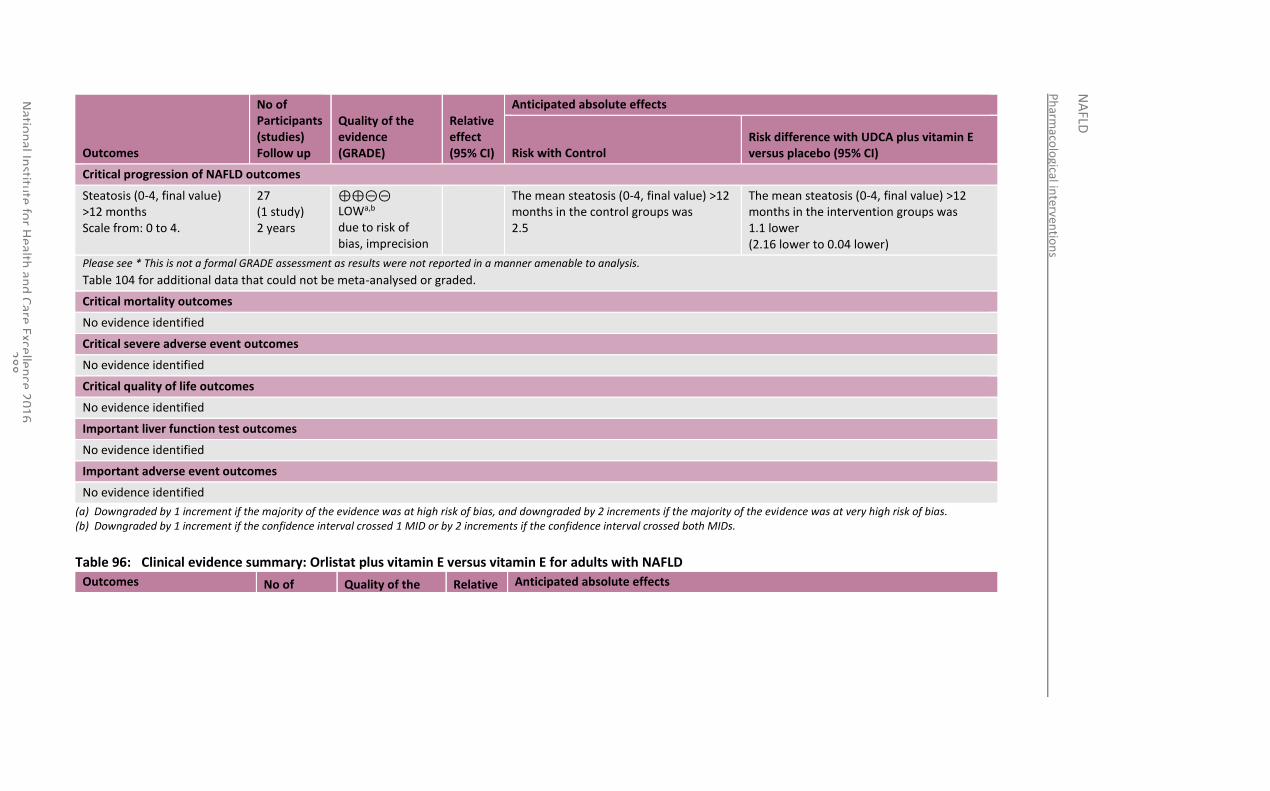
Ph
armaco
logical in
terventio
ns
NA
FLD
Natio
nal In
stitute
for H
ealth an
d C
are Excellen
ce 20
16
2
88
Outcomes
No of Participants (studies) Follow up
Quality of the evidence (GRADE)
Relative effect (95% CI)
Anticipated absolute effects
Risk with Control Risk difference with UDCA plus vitamin E versus placebo (95% CI)
Critical progression of NAFLD outcomes
Steatosis (0-4, final value) >12 months Scale from: 0 to 4.
27 (1 study) 2 years
⊕⊕⊝⊝ LOWa,b due to risk of bias, imprecision
The mean steatosis (0-4, final value) >12 months in the control groups was 2.5
The mean steatosis (0-4, final value) >12 months in the intervention groups was 1.1 lower (2.16 lower to 0.04 lower)
Please see * This is not a formal GRADE assessment as results were not reported in a manner amenable to analysis.
Table 104 for additional data that could not be meta-analysed or graded.
Critical mortality outcomes
No evidence identified
Critical severe adverse event outcomes
No evidence identified
Critical quality of life outcomes
No evidence identified
Important liver function test outcomes
No evidence identified
Important adverse event outcomes
No evidence identified
(a) Downgraded by 1 increment if the majority of the evidence was at high risk of bias, and downgraded by 2 increments if the majority of the evidence was at very high risk of bias. (b) Downgraded by 1 increment if the confidence interval crossed 1 MID or by 2 increments if the confidence interval crossed both MIDs.
Table 96: Clinical evidence summary: Orlistat plus vitamin E versus vitamin E for adults with NAFLD
Outcomes No of Quality of the Relative Anticipated absolute effects
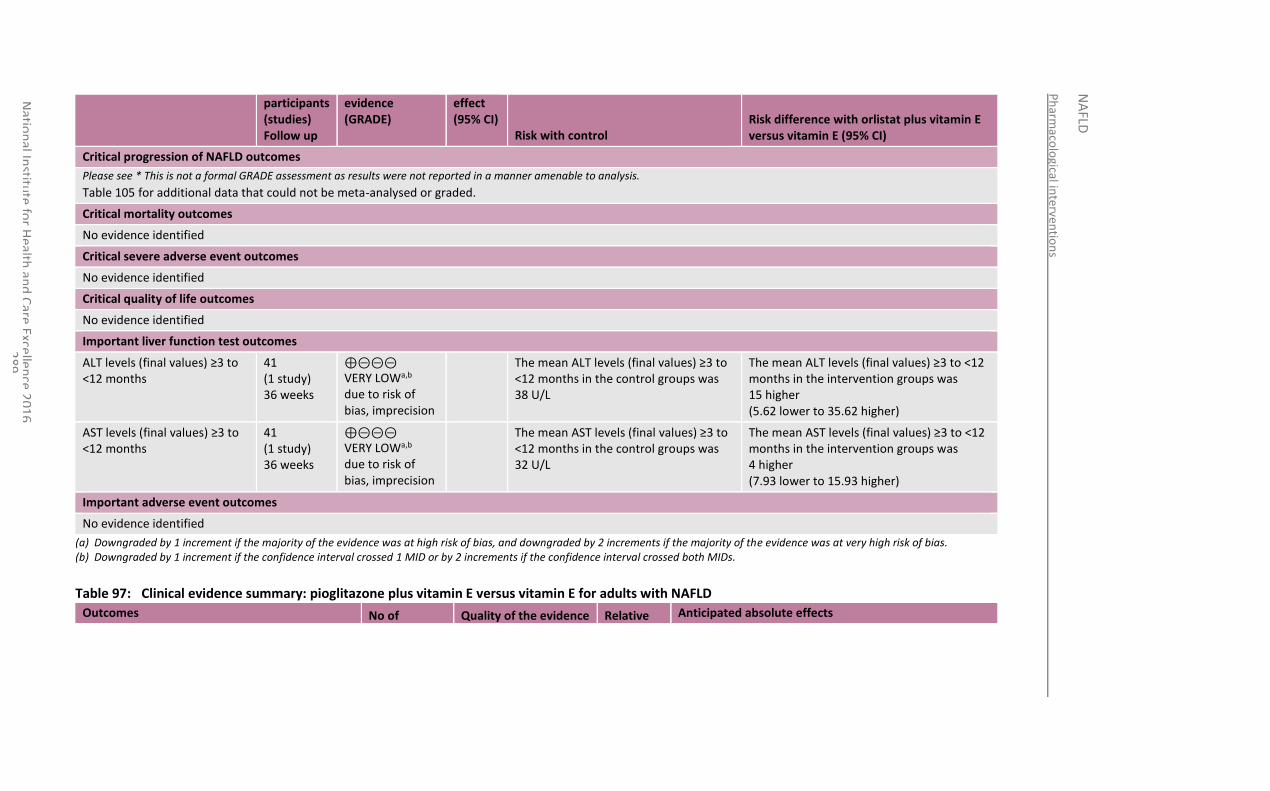
Ph
armaco
logical in
terventio
ns
NA
FLD
Natio
nal In
stitute
for H
ealth an
d C
are Excellen
ce 20
16
2
89
participants (studies) Follow up
evidence (GRADE)
effect (95% CI)
Risk with control Risk difference with orlistat plus vitamin E versus vitamin E (95% CI)
Critical progression of NAFLD outcomes
Please see * This is not a formal GRADE assessment as results were not reported in a manner amenable to analysis.
Table 105 for additional data that could not be meta-analysed or graded.
Critical mortality outcomes
No evidence identified
Critical severe adverse event outcomes
No evidence identified
Critical quality of life outcomes
No evidence identified
Important liver function test outcomes
ALT levels (final values) ≥3 to <12 months
41 (1 study) 36 weeks
⊕⊝⊝⊝ VERY LOWa,b due to risk of bias, imprecision
The mean ALT levels (final values) ≥3 to <12 months in the control groups was 38 U/L
The mean ALT levels (final values) ≥3 to <12 months in the intervention groups was 15 higher (5.62 lower to 35.62 higher)
AST levels (final values) ≥3 to <12 months
41 (1 study) 36 weeks
⊕⊝⊝⊝ VERY LOWa,b due to risk of bias, imprecision
The mean AST levels (final values) ≥3 to <12 months in the control groups was 32 U/L
The mean AST levels (final values) ≥3 to <12 months in the intervention groups was 4 higher (7.93 lower to 15.93 higher)
Important adverse event outcomes
No evidence identified
(a) Downgraded by 1 increment if the majority of the evidence was at high risk of bias, and downgraded by 2 increments if the majority of the evidence was at very high risk of bias. (b) Downgraded by 1 increment if the confidence interval crossed 1 MID or by 2 increments if the confidence interval crossed both MIDs.
Table 97: Clinical evidence summary: pioglitazone plus vitamin E versus vitamin E for adults with NAFLD
Outcomes No of Quality of the evidence Relative Anticipated absolute effects
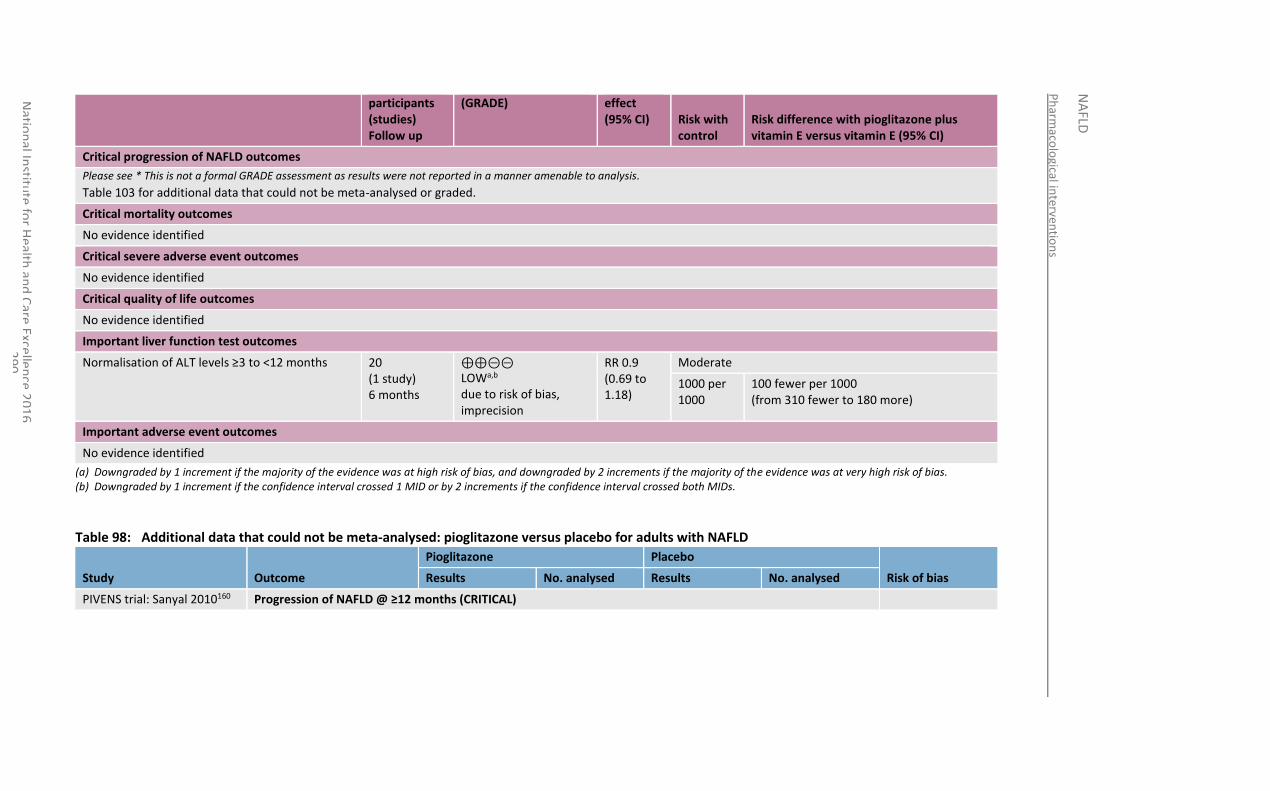
Ph
armaco
logical in
terventio
ns
NA
FLD
Natio
nal In
stitute
for H
ealth an
d C
are Excellen
ce 20
16
2
90
participants (studies) Follow up
(GRADE) effect (95% CI) Risk with
control Risk difference with pioglitazone plus vitamin E versus vitamin E (95% CI)
Critical progression of NAFLD outcomes
Please see * This is not a formal GRADE assessment as results were not reported in a manner amenable to analysis.
Table 103 for additional data that could not be meta-analysed or graded.
Critical mortality outcomes
No evidence identified
Critical severe adverse event outcomes
No evidence identified
Critical quality of life outcomes
No evidence identified
Important liver function test outcomes
Normalisation of ALT levels ≥3 to <12 months 20 (1 study) 6 months
⊕⊕⊝⊝ LOWa,b due to risk of bias, imprecision
RR 0.9 (0.69 to 1.18)
Moderate
1000 per 1000
100 fewer per 1000 (from 310 fewer to 180 more)
Important adverse event outcomes
No evidence identified
(a) Downgraded by 1 increment if the majority of the evidence was at high risk of bias, and downgraded by 2 increments if the majority of the evidence was at very high risk of bias. (b) Downgraded by 1 increment if the confidence interval crossed 1 MID or by 2 increments if the confidence interval crossed both MIDs.
Table 98: Additional data that could not be meta-analysed: pioglitazone versus placebo for adults with NAFLD
Study Outcome
Pioglitazone Placebo
Risk of bias Results No. analysed Results No. analysed
PIVENS trial: Sanyal 2010160 Progression of NAFLD @ ≥12 months (CRITICAL)
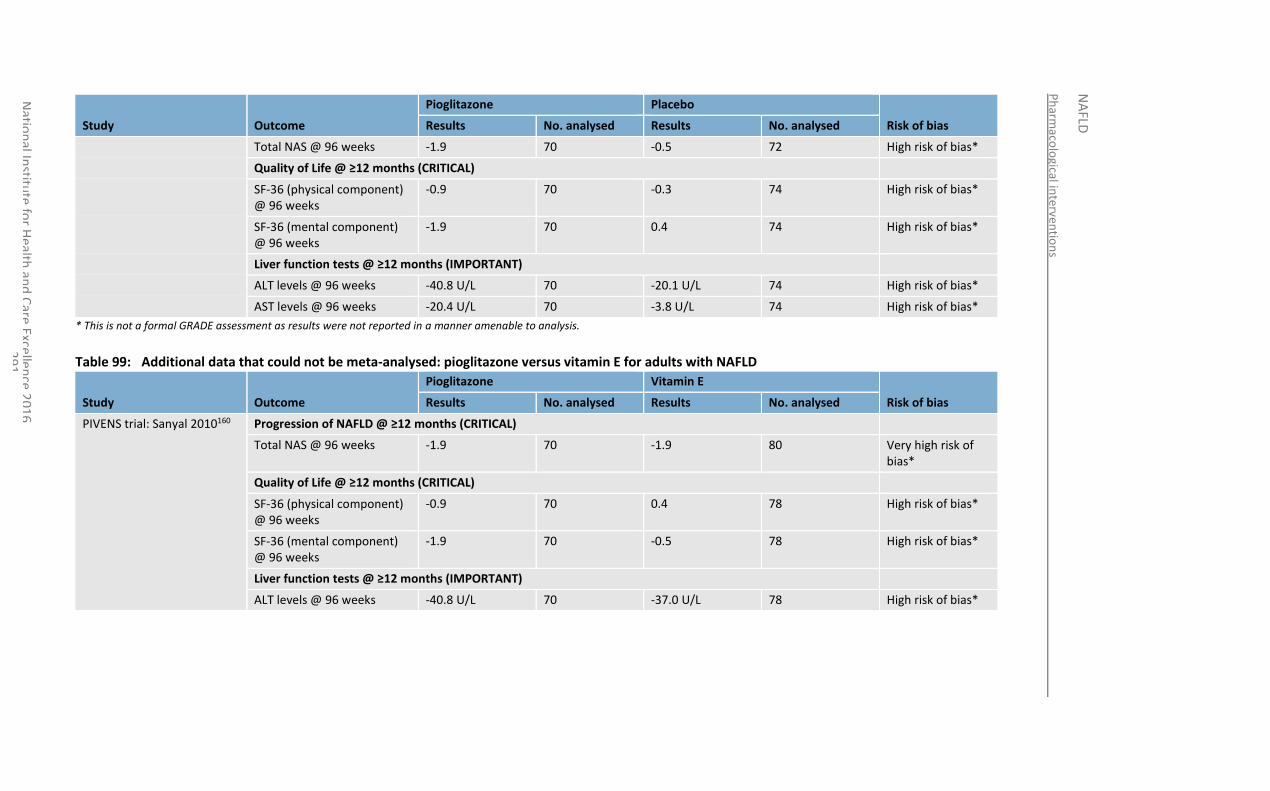
Ph
armaco
logical in
terventio
ns
NA
FLD
Natio
nal In
stitute
for H
ealth an
d C
are Excellen
ce 20
16
2
91
Study Outcome
Pioglitazone Placebo
Risk of bias Results No. analysed Results No. analysed
Total NAS @ 96 weeks -1.9 70 -0.5 72 High risk of bias*
Quality of Life @ ≥12 months (CRITICAL)
SF-36 (physical component) @ 96 weeks
-0.9 70 -0.3 74 High risk of bias*
SF-36 (mental component) @ 96 weeks
-1.9 70 0.4 74 High risk of bias*
Liver function tests @ ≥12 months (IMPORTANT)
ALT levels @ 96 weeks -40.8 U/L 70 -20.1 U/L 74 High risk of bias*
AST levels @ 96 weeks -20.4 U/L 70 -3.8 U/L 74 High risk of bias*
* This is not a formal GRADE assessment as results were not reported in a manner amenable to analysis.
Table 99: Additional data that could not be meta-analysed: pioglitazone versus vitamin E for adults with NAFLD
Study Outcome
Pioglitazone Vitamin E
Risk of bias Results No. analysed Results No. analysed
PIVENS trial: Sanyal 2010160 Progression of NAFLD @ ≥12 months (CRITICAL)
Total NAS @ 96 weeks -1.9 70 -1.9 80 Very high risk of bias*
Quality of Life @ ≥12 months (CRITICAL)
SF-36 (physical component) @ 96 weeks
-0.9 70 0.4 78 High risk of bias*
SF-36 (mental component) @ 96 weeks
-1.9 70 -0.5 78 High risk of bias*
Liver function tests @ ≥12 months (IMPORTANT)
ALT levels @ 96 weeks -40.8 U/L 70 -37.0 U/L 78 High risk of bias*
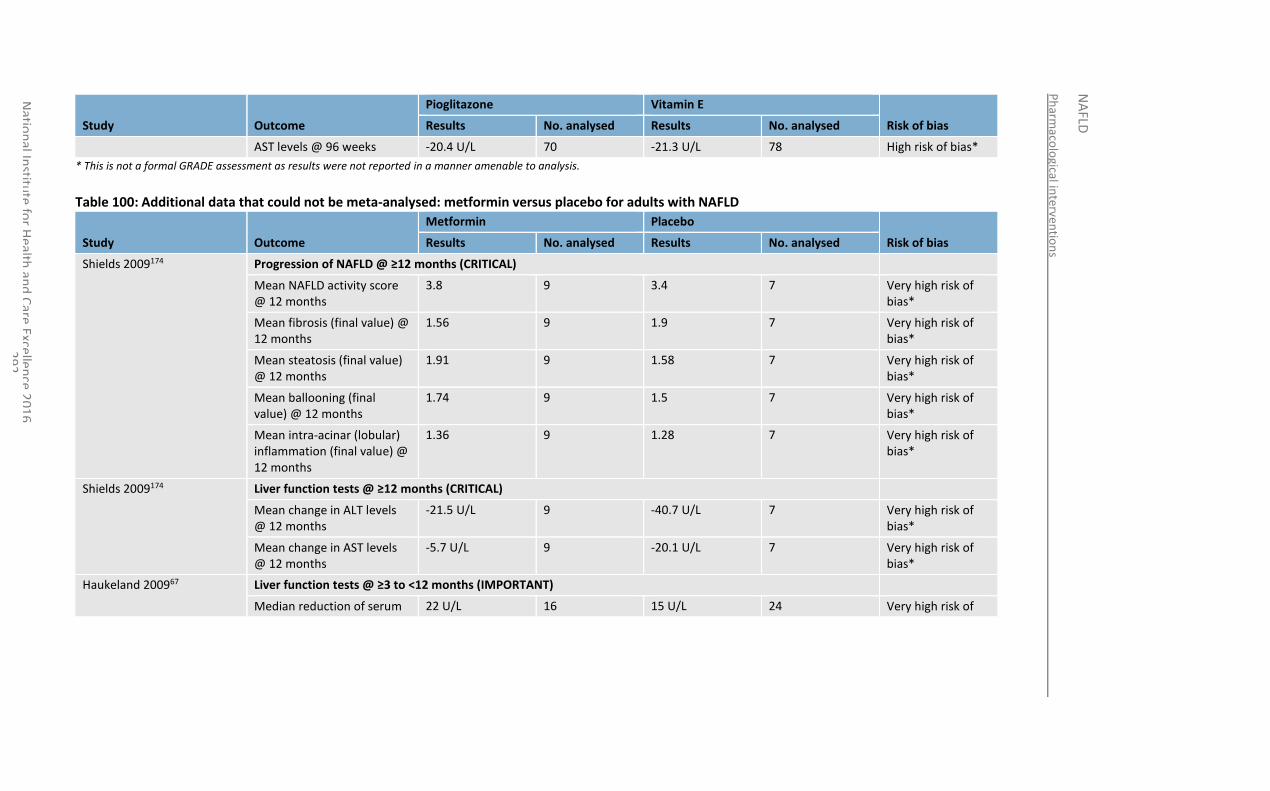
Ph
armaco
logical in
terventio
ns
NA
FLD
Natio
nal In
stitute
for H
ealth an
d C
are Excellen
ce 20
16
2
92
Study Outcome
Pioglitazone Vitamin E
Risk of bias Results No. analysed Results No. analysed
AST levels @ 96 weeks -20.4 U/L 70 -21.3 U/L 78 High risk of bias*
* This is not a formal GRADE assessment as results were not reported in a manner amenable to analysis.
Table 100: Additional data that could not be meta-analysed: metformin versus placebo for adults with NAFLD
Study Outcome
Metformin Placebo
Risk of bias Results No. analysed Results No. analysed
Shields 2009174 Progression of NAFLD @ ≥12 months (CRITICAL)
Mean NAFLD activity score @ 12 months
3.8 9 3.4 7 Very high risk of bias*
Mean fibrosis (final value) @ 12 months
1.56 9 1.9 7 Very high risk of bias*
Mean steatosis (final value) @ 12 months
1.91 9 1.58 7 Very high risk of bias*
Mean ballooning (final value) @ 12 months
1.74 9 1.5 7 Very high risk of bias*
Mean intra-acinar (lobular) inflammation (final value) @ 12 months
1.36 9 1.28 7 Very high risk of bias*
Shields 2009174 Liver function tests @ ≥12 months (CRITICAL)
Mean change in ALT levels @ 12 months
-21.5 U/L 9 -40.7 U/L 7 Very high risk of bias*
Mean change in AST levels @ 12 months
-5.7 U/L 9 -20.1 U/L 7 Very high risk of bias*
Haukeland 200967 Liver function tests @ ≥3 to <12 months (IMPORTANT)
Median reduction of serum 22 U/L 16 15 U/L 24 Very high risk of
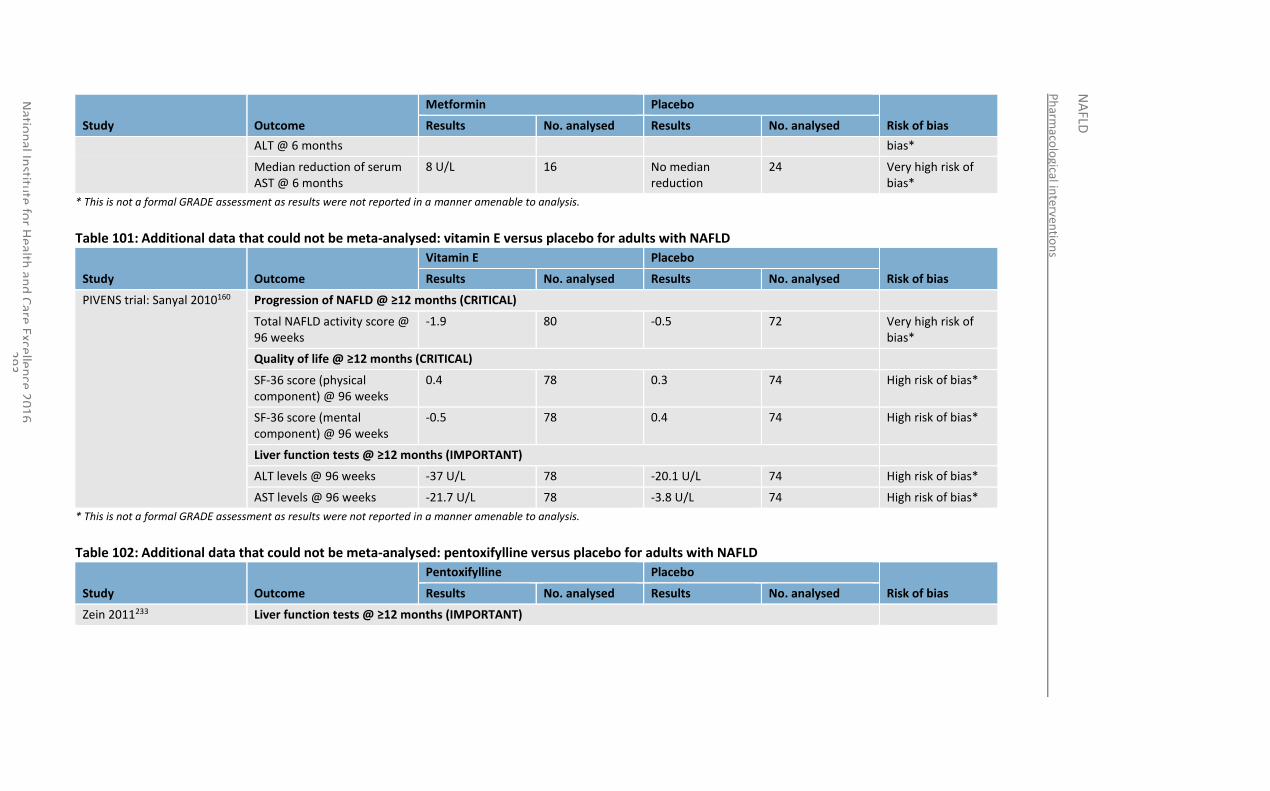
Ph
armaco
logical in
terventio
ns
NA
FLD
Natio
nal In
stitute
for H
ealth an
d C
are Excellen
ce 20
16
2
93
Study Outcome
Metformin Placebo
Risk of bias Results No. analysed Results No. analysed
ALT @ 6 months bias*
Median reduction of serum AST @ 6 months
8 U/L 16 No median reduction
24 Very high risk of bias*
* This is not a formal GRADE assessment as results were not reported in a manner amenable to analysis.
Table 101: Additional data that could not be meta-analysed: vitamin E versus placebo for adults with NAFLD
Study Outcome
Vitamin E Placebo
Risk of bias Results No. analysed Results No. analysed
PIVENS trial: Sanyal 2010160 Progression of NAFLD @ ≥12 months (CRITICAL)
Total NAFLD activity score @ 96 weeks
-1.9 80 -0.5 72 Very high risk of bias*
Quality of life @ ≥12 months (CRITICAL)
SF-36 score (physical component) @ 96 weeks
0.4 78 0.3 74 High risk of bias*
SF-36 score (mental component) @ 96 weeks
-0.5 78 0.4 74 High risk of bias*
Liver function tests @ ≥12 months (IMPORTANT)
ALT levels @ 96 weeks -37 U/L 78 -20.1 U/L 74 High risk of bias*
AST levels @ 96 weeks -21.7 U/L 78 -3.8 U/L 74 High risk of bias*
* This is not a formal GRADE assessment as results were not reported in a manner amenable to analysis.
Table 102: Additional data that could not be meta-analysed: pentoxifylline versus placebo for adults with NAFLD
Study Outcome
Pentoxifylline Placebo
Risk of bias Results No. analysed Results No. analysed
Zein 2011233 Liver function tests @ ≥12 months (IMPORTANT)
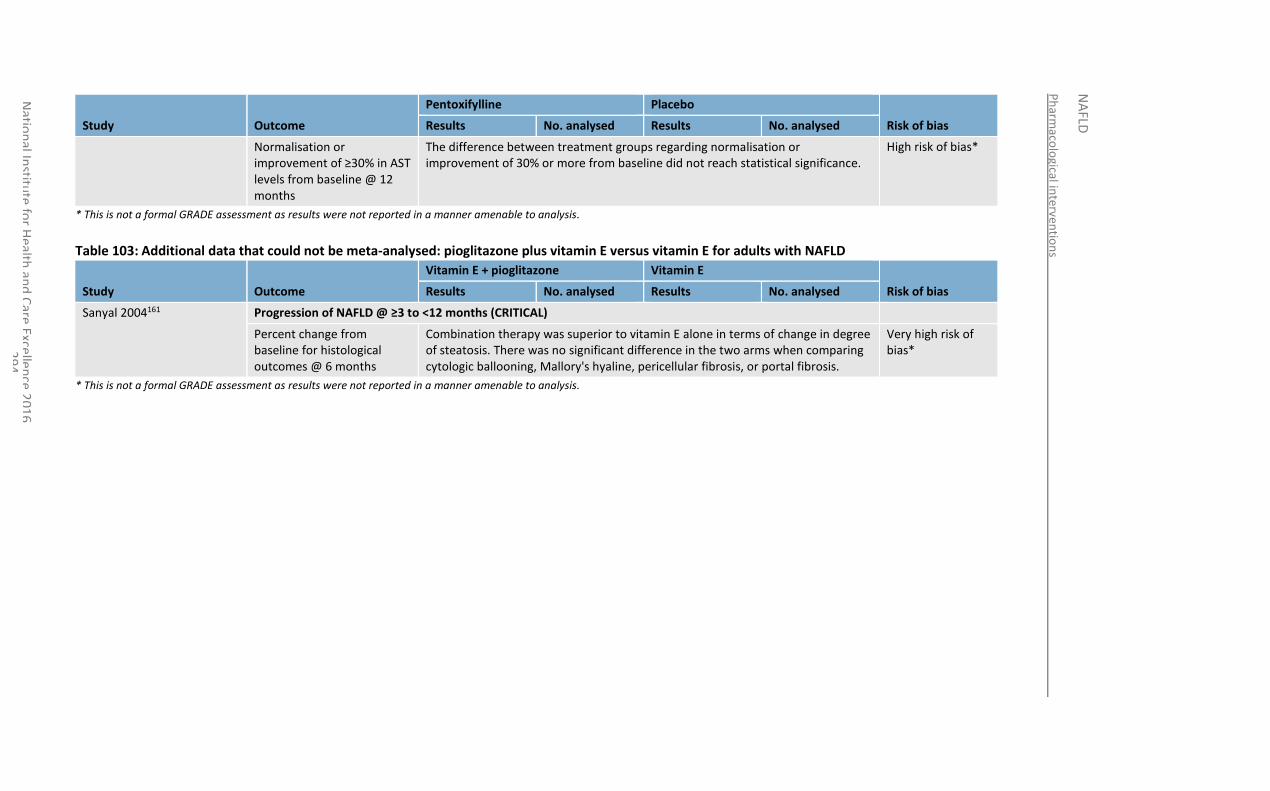
Ph
armaco
logical in
terventio
ns
NA
FLD
Natio
nal In
stitute
for H
ealth an
d C
are Excellen
ce 20
16
2
94
Study Outcome
Pentoxifylline Placebo
Risk of bias Results No. analysed Results No. analysed
Normalisation or improvement of ≥30% in AST levels from baseline @ 12 months
The difference between treatment groups regarding normalisation or improvement of 30% or more from baseline did not reach statistical significance.
High risk of bias*
* This is not a formal GRADE assessment as results were not reported in a manner amenable to analysis.
Table 103: Additional data that could not be meta-analysed: pioglitazone plus vitamin E versus vitamin E for adults with NAFLD
Study Outcome
Vitamin E + pioglitazone Vitamin E
Risk of bias Results No. analysed Results No. analysed
Sanyal 2004161 Progression of NAFLD @ ≥3 to <12 months (CRITICAL)
Percent change from baseline for histological outcomes @ 6 months
Combination therapy was superior to vitamin E alone in terms of change in degree of steatosis. There was no significant difference in the two arms when comparing cytologic ballooning, Mallory's hyaline, pericellular fibrosis, or portal fibrosis.
Very high risk of bias*
* This is not a formal GRADE assessment as results were not reported in a manner amenable to analysis.
Ph
armaco
logical in
terventio
ns
NA
FLD
Natio
nal In
stitute
for H
ealth an
d C
are Excellen
ce 20
16
2
95
Table 104: Additional data that could not be meta-analysed: UDCA plus vitamin E for adults with NAFLD
Ph
armaco
logical in
terventio
ns
NA
FLD
Natio
nal In
stitute
for H
ealth an
d C
are Excellen
ce 20
16
2
96
Study Comparators Outcome UDCA + vitamin E Comparator Risk of bias
Ph
armaco
logical in
terventio
ns
NA
FLD
Natio
nal In
stitute
for H
ealth an
d C
are Excellen
ce 20
16
2
97
Results No. analysed Results No. analysed
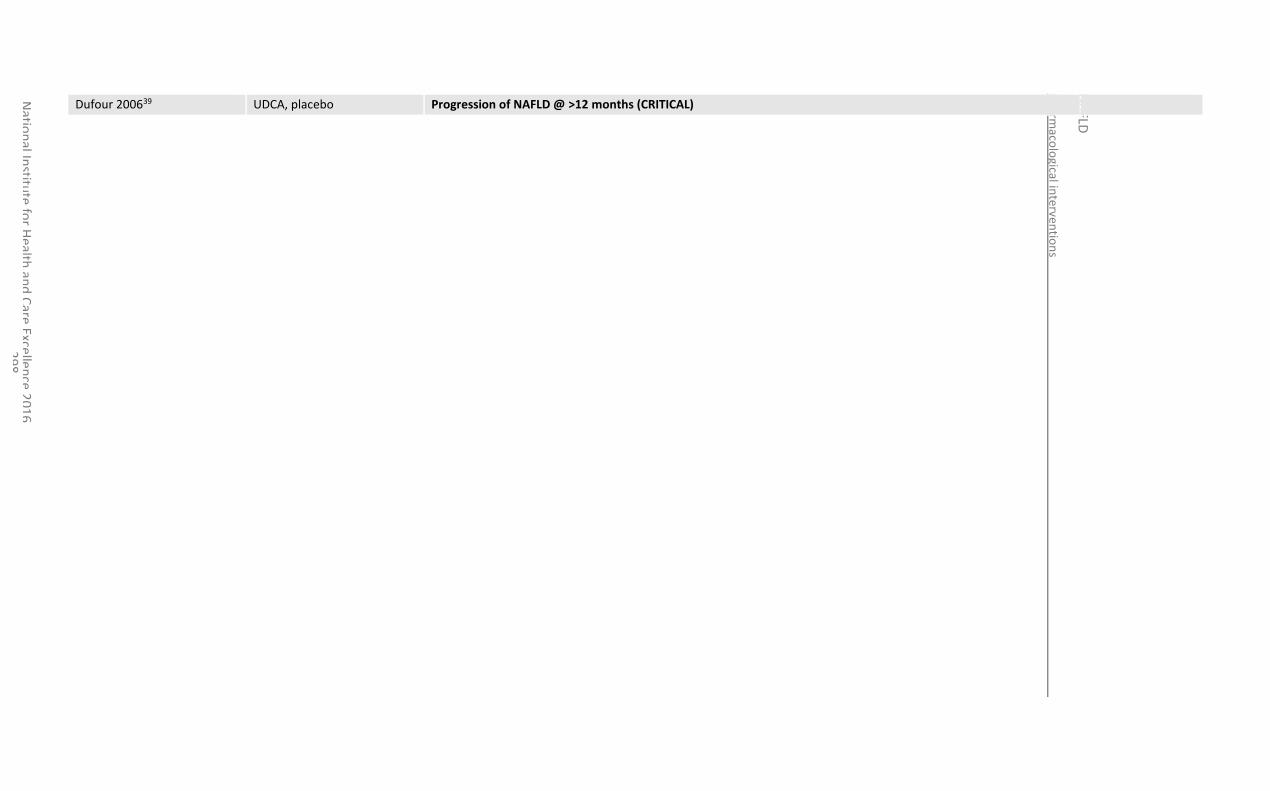
Ph
armaco
logical in
terventio
ns
NA
FLD
Natio
nal In
stitute
for H
ealth an
d C
are Excellen
ce 20
16
2
98
Dufour 200639 UDCA, placebo Progression of NAFLD @ >12 months (CRITICAL)
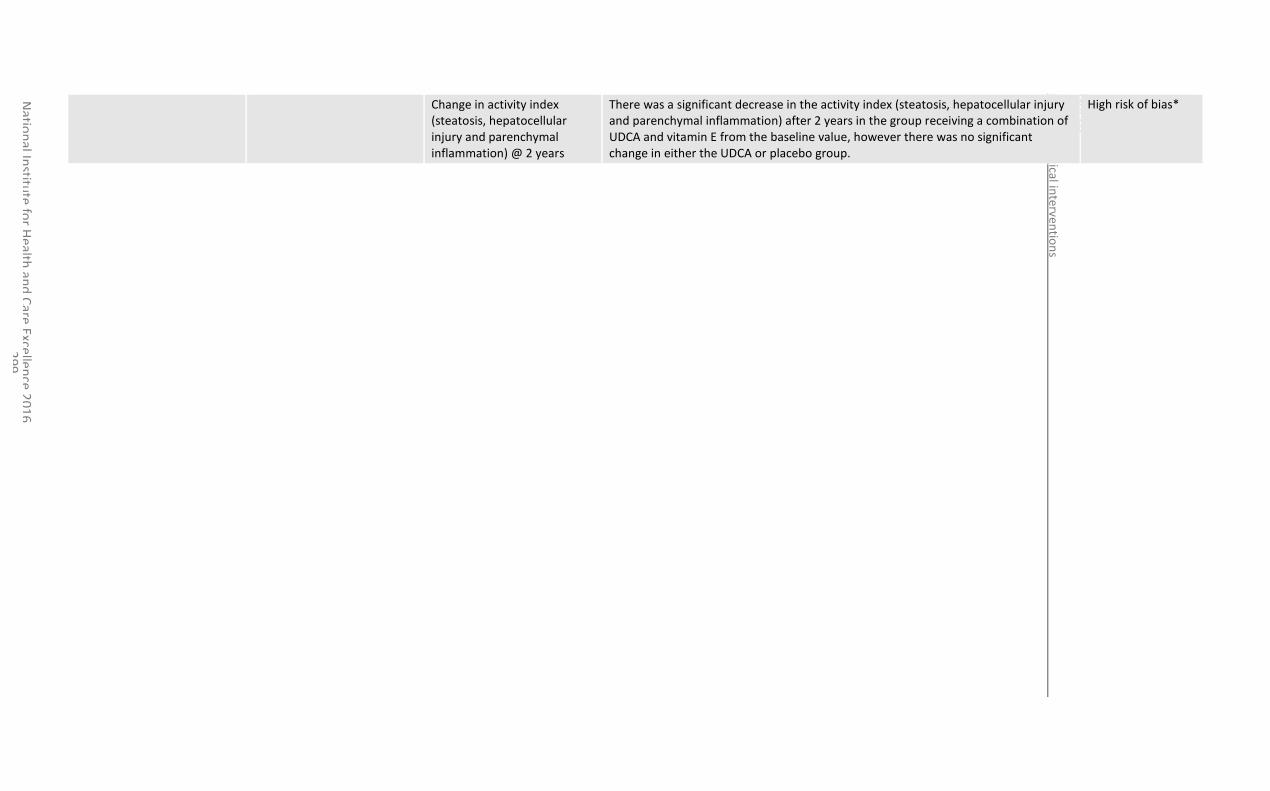
Ph
armaco
logical in
terventio
ns
NA
FLD
Natio
nal In
stitute
for H
ealth an
d C
are Excellen
ce 20
16
2
99
Change in activity index (steatosis, hepatocellular injury and parenchymal inflammation) @ 2 years
There was a significant decrease in the activity index (steatosis, hepatocellular injury and parenchymal inflammation) after 2 years in the group receiving a combination of UDCA and vitamin E from the baseline value, however there was no significant change in either the UDCA or placebo group.
High risk of bias*
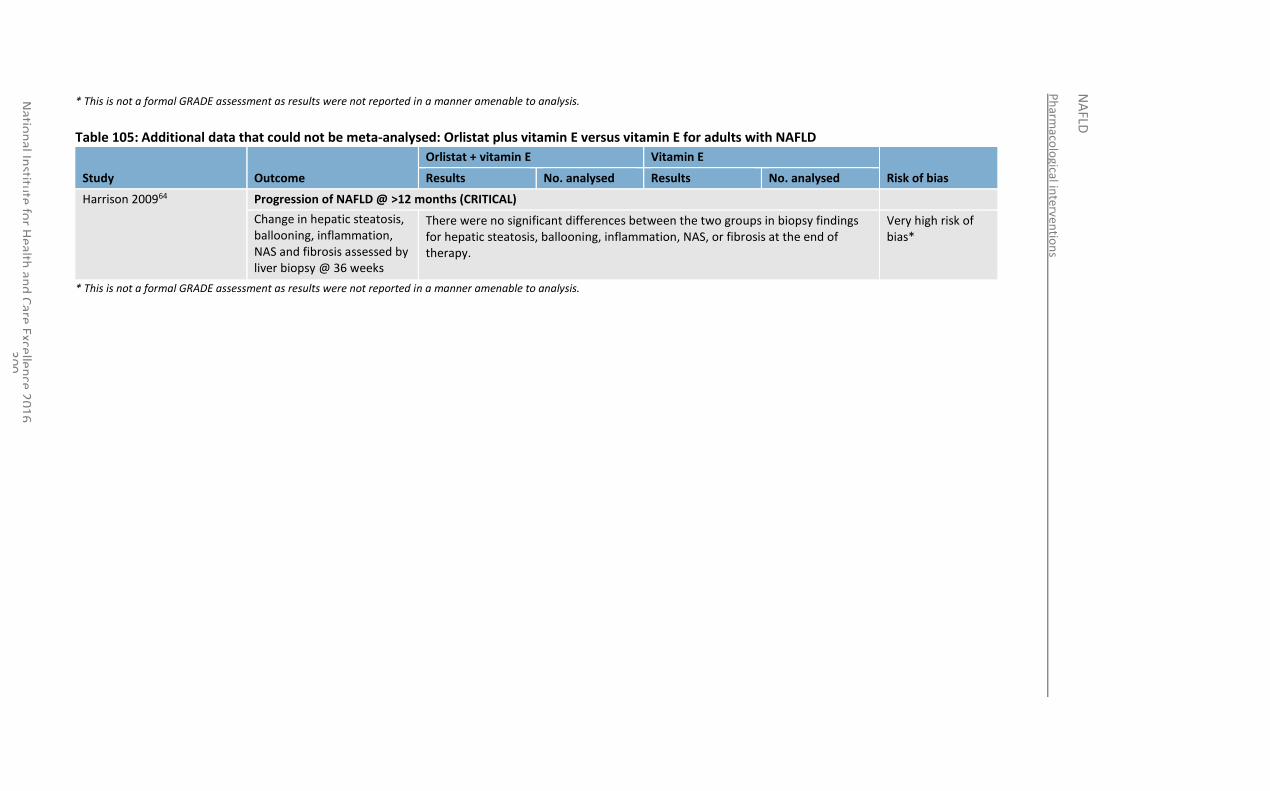
Ph
armaco
logical in
terventio
ns
NA
FLD
Natio
nal In
stitute
for H
ealth an
d C
are Excellen
ce 20
16
3
00
* This is not a formal GRADE assessment as results were not reported in a manner amenable to analysis.
Table 105: Additional data that could not be meta-analysed: Orlistat plus vitamin E versus vitamin E for adults with NAFLD
Study Outcome
Orlistat + vitamin E Vitamin E
Risk of bias Results No. analysed Results No. analysed
Harrison 200964 Progression of NAFLD @ >12 months (CRITICAL)
Change in hepatic steatosis, ballooning, inflammation, NAS and fibrosis assessed by liver biopsy @ 36 weeks
There were no significant differences between the two groups in biopsy findings for hepatic steatosis, ballooning, inflammation, NAS, or fibrosis at the end of therapy.
Very high risk of bias*
* This is not a formal GRADE assessment as results were not reported in a manner amenable to analysis.
National Institute for Health and Care Excellence 2016
NAFLD
Pharmacological interventions
301
17.4 Economic evidence
17.4.1 Published literature
One economic evaluation was identified that compared lifestyle modification, vitamin E and pioglitazone in a cohort of people with NASH.107 This is summarised in the economic evidence profile below (Table 106) and the economic evidence table in Appendix I.
No relevant economic evaluations were identified for any of the other pharmacological interventions considered in this chapter.
See also the economic article selection flow chart in Appendix F.
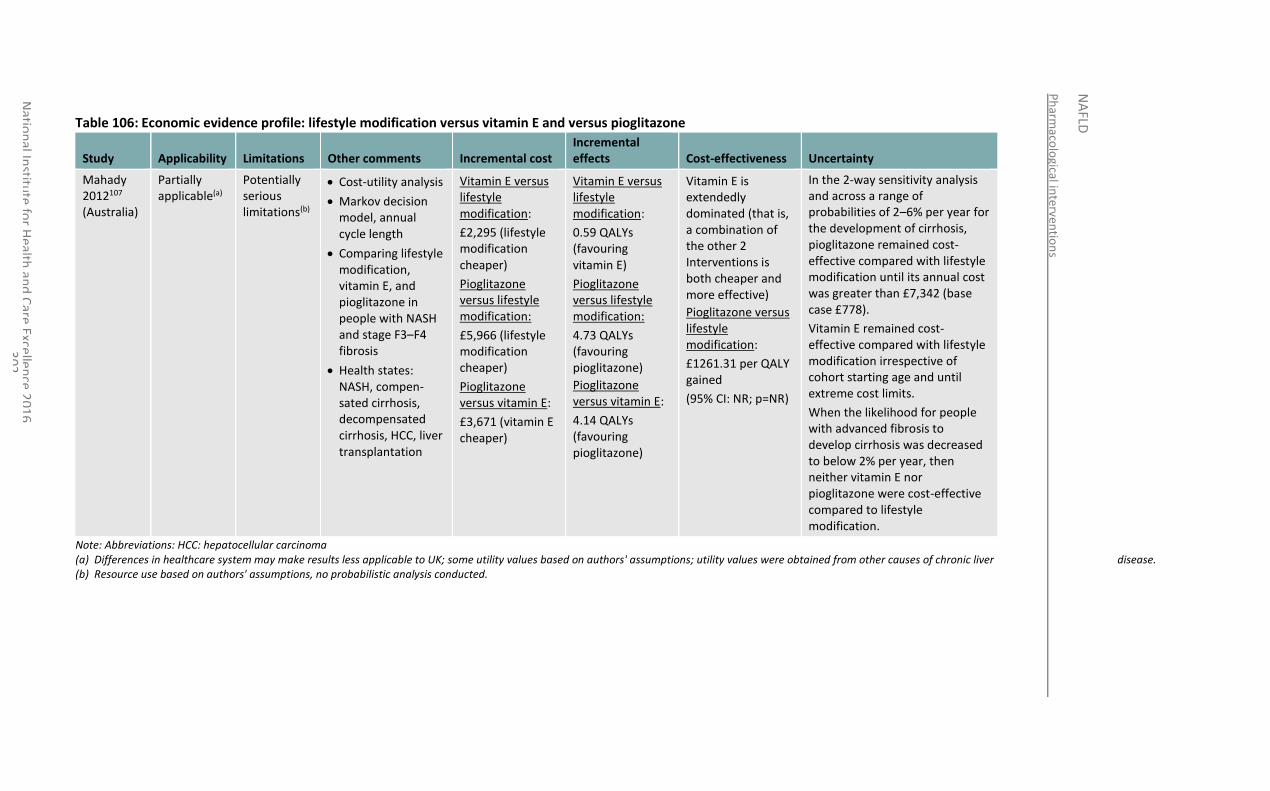
Ph
armaco
logical in
terventio
ns
NA
FLD
Natio
nal In
stitute
for H
ealth an
d C
are Excellen
ce 20
16
3
02
Table 106: Economic evidence profile: lifestyle modification versus vitamin E and versus pioglitazone
Study Applicability Limitations Other comments Incremental cost Incremental effects Cost-effectiveness Uncertainty
Mahady 2012107 (Australia)
Partially applicable(a)
Potentially serious limitations(b)
Cost-utility analysis
Markov decision model, annual cycle length
Comparing lifestyle modification, vitamin E, and pioglitazone in people with NASH and stage F3–F4 fibrosis
Health states: NASH, compen-sated cirrhosis, decompensated cirrhosis, HCC, liver transplantation
Vitamin E versus lifestyle modification:
£2,295 (lifestyle modification cheaper)
Pioglitazone versus lifestyle modification:
£5,966 (lifestyle modification cheaper)
Pioglitazone versus vitamin E:
£3,671 (vitamin E cheaper)
Vitamin E versus lifestyle modification:
0.59 QALYs (favouring vitamin E)
Pioglitazone versus lifestyle modification:
4.73 QALYs (favouring pioglitazone)
Pioglitazone versus vitamin E:
4.14 QALYs (favouring pioglitazone)
Vitamin E is extendedly dominated (that is, a combination of the other 2 Interventions is both cheaper and more effective)
Pioglitazone versus lifestyle modification:
£1261.31 per QALY gained
(95% CI: NR; p=NR)
In the 2-way sensitivity analysis and across a range of probabilities of 2–6% per year for the development of cirrhosis, pioglitazone remained cost-effective compared with lifestyle modification until its annual cost was greater than £7,342 (base case £778).
Vitamin E remained cost-effective compared with lifestyle modification irrespective of cohort starting age and until extreme cost limits.
When the likelihood for people with advanced fibrosis to develop cirrhosis was decreased to below 2% per year, then neither vitamin E nor pioglitazone were cost-effective compared to lifestyle modification.
Note: Abbreviations: HCC: hepatocellular carcinoma (a) Differences in healthcare system may make results less applicable to UK; some utility values based on authors' assumptions; utility values were obtained from other causes of chronic liver disease. (b) Resource use based on authors' assumptions, no probabilistic analysis conducted.
National Institute for Health and Care Excellence 2016
NAFLD
Pharmacological interventions
303
17.4.2 Unit costs
See Table 91 in Appendix O.
17.5 Evidence statements
17.5.1 Clinical
17.5.1.1 Pioglitazone versus placebo for NAFLD
Adult population
Clinical benefit of pioglitazone on the progression of NAFLD when compared to placebo was observed in 3 RCTs, with sample sizes ranging from 18 to 142. Benefit was seen on the improvement of fibrosis at greater than 12 months (high quality), improvement in steatosis at greater than or equal to 3 to less than 12 months (low quality) and greater than12 months (low to moderate quality), decrease in hepatocellular injury at greater than 12 months (moderate quality), improvement of hepatic ballooning at greater than 12 months (low quality), improvement of lobular inflammation at equal to or greater than 3 to less than 12 months (very low quality) and greater than 12 months (low quality), decrease in Mallory-Denk bodies at greater than 12 months (moderate quality) improvement of histologic features of the liver at greater than 12 months (low quality) and the resolution of NASH at greater than 12 months (moderate quality). Outcomes reporting no clinically important benefit were also observed (very low to high quality), although the direction of effect favoured pioglitazone for all the outcomes, with the exception of increase in lobular inflammation which favoured placebo (moderate quality).
Evidence from a single RCT (n=163) demonstrated clinical benefit of pioglitazone when compared to placebo for severe adverse events at greater than12 months (low quality), but no clinically important benefit on adverse cardiovascular events at greater than 12 months (very low quality), although the direction of effect favoured pioglitazone
Evidence from 2 RCTS demonstrated clinical benefit of pioglitazone on ALT levels at equal to or greater than 3 to less than 12 months (n=47, very low quality) and greater than 12 months (n=74, low quality) when compared to placebo. A reduction in the levels of AST was also observed from a single RCT (n=47, very low quality) at equal to or greater than 3 to less than 12 months.
Children and young people
No clinical evidence
17.5.1.2 Metformin versus placebo for NAFLD
Adults population
A single RCT (n=44) demonstrated clinical harm of metformin when compared to placebo for the progression of NAFLD at greater than 12 months (very low to low quality), with the direction of effect favouring placebo.
Evidence from a single RCT showed metformin to have no clinically important benefit on liver enzymes ALT and AST when compared to placebo at equal to or greater than 3 to less than 12 months (n=52) and greater than 12 months (n=41), very low to low quality).
Children and young people
Evidence from a single RCT (n=97) demonstrated no clinically important benefit of metformin on the progression of NAFLD when compared to placebo at greater than 12 months (low to moderate quality), although the direction of effect favoured metformin.
National Institute for Health and Care Excellence 2016
NAFLD
Pharmacological interventions
304
Evidence from a single RCT (n=100) demonstrated no clinically important benefit of metformin on quality of life when compared to placebo at greater than 12 months (moderate to high quality), with the direction of effect favouring placebo.
Evidence from 2 RCTs (with sample sizes of 29 and 115) demonstrated no clinically important benefit of metformin on the reduction liver enzymes ALT and AST when compared to placebo at equal to or greater than 3 to less than 12 months and greater than 12 months (low to moderate quality), although the direction of effect for most the outcomes favoured metformin.
17.5.1.3 Vitamin E versus placebo for NAFLD
Adults population
Clinical benefit of vitamin E on the progression of NAFLD when compared to placebo was observed in a single RCT (n=152). Benefit was seen on the improvement of histologic features of liver disease at greater than 12 months (moderate quality) and improvement in steatosis at greater than 12 months (low quality). Outcomes demonstrating no clinically important benefit were also reported (low quality), although the direction of effect favoured vitamin E for all the outcomes.
Evidence from the RCT demonstrated no clinically important benefit of vitamin E on the occurrence of serious adverse events, adverse events or mortality when compared to placebo at greater than 12 months (very low quality).
Children and young people
A single RCT (n=97) demonstrated clinical benefit of vitamin E on the progression of NAFLD when compared to placebo from the resolution of NASH at greater than 12 months (moderate quality). Outcomes demonstrating no clinically important benefit were also reported (low quality), although the direction of effect favoured vitamin E.
There was no clinically important benefit of vitamin E when compared to placebo on quality of life outcomes from a single study (n=99) at greater than 12 months (moderate to high quality).
Evidence from a single RCT demonstrated no clinically important benefit of vitamin E on the reduction of liver enzymes ALT (n=116) and AST (n=96) when compared to placebo at equal to or greater than 3 to less than 12 months and greater than 12 months (moderate to high quality), although the direction of effect favoured vitamin E.
17.5.1.4 Ursodeoxycholic acid versus placebo for NAFLD
Adults population
Evidence from 3 RCTS (n=27, 137 and 242) showed no clinical benefit of UDCA on the progression of NAFLD when compared to placebo at greater than 12 months (very low to moderate quality).
A single RCT demonstrated clinical benefit of UDCA on normalised ALT levels when compared to placebo from at greater than 12 months (moderate quality). However outcomes from 3 RCTs (n=30, 115 and 118) demonstrated no clinically important benefit on either ALT levels or AST levels at equal to or greater than 3 to less than 12 months and greater than 12 months (very low to low quality) although the direction of effect favoured UDCA.
Children and young people
No clinical evidence
National Institute for Health and Care Excellence 2016
NAFLD
Pharmacological interventions
305
17.5.1.5 Pentoxyfilline versus placebo for NAFLD
Adults population
Evidence from a single RCT (n=46) demonstrated clinical benefit of pentoxyfilline on the progression of NAFLD through a decrease in NAFLD activity score by greater than or equal to 2 points when compared to placebo at greater than 12 months (low quality). However outcomes reported from 2 RCTs (n=72) demonstrated no clinically important benefit at greater than 12 months (low to high quality).
Clinical benefit of pentoxyfilline on the ALT and AST levels was demonstrated by 2 RCTs (sample size for outcomes ranging from 20 to 75 people) when compared to placebo at equal to or greater than 3 to less than 12 months and greater than 12 months (very low to moderate quality). Outcomes reporting no clinically important benefit were also observed (low quality), although the direction of effect favoured pentoxyfilline for all the outcomes.
A single RCT (n=-53) demonstrated no clinically important benefit of pentoxyfilline on adverse events when compared to placebo at greater than 12 months (low quality), although the direction of effect favoured pentoxyfilline.
Children and young people
No clinical evidence
17.5.1.6 Statins versus placebo for NAFLD
Adults population
A single RCT (n=16) demonstrated no clinically important benefit of statins on the progression of NAFLD when compared to placebo at greater than 12 months (very low quality), with the direction of effect favouring placebo. However, clinical benefit of statins on ALT and AST levels when compared to placebo at greater than 12 months (very low quality) was seen.
Children and young people
No clinical evidence
17.5.1.7 Orlistat versus placebo for NAFLD
Adults population
Clinical evidence from a single RCT demonstrated no clinically important benefit of orlistat on the progression of NAFLD when compared to placebo at equal to or greater than 3 to less than 12 months (very low quality), with the direction of effect favouring orlistat for the improvement of fibrosis (n=22) and reversal of fatty liver (n=44), however favouring placebo for improvement of steatosis (n=22).
The RCT also demonstrated no clinically important benefit of orlistat on ALT or AST levels when compared to placebo at greater than 12 months (moderate quality), although the direction of effect favoured orlistat (n=44).
Children and young people
No clinical evidence
17.5.1.8 Pioglitazone versus metformin for NAFLD
Adults population
A single RCT (n=80) demonstrated no clinically important benefit of pioglitazone when compared to metformin on ALT and AST levels at greater than 12 months (moderate quality), with the direction of effect favouring pioglitazone.
National Institute for Health and Care Excellence 2016
NAFLD
Pharmacological interventions
306
Children and young people
No clinical evidence
17.5.1.9 Pioglitazone versus vitamin E for NAFLD
Adults population
A single study (sample sizes for outcomes varying from 142 to 150 people) demonstrated clinical benefit of pioglitazone on the progression of NAFLD when compared to vitamin E at greater than 12 months (low quality). Outcomes reporting no clinically important benefit were also observed at greater than 12 months (low quality).
A single RCT (n=164) demonstrated no clinically important benefit of pioglitazone on mortality when compared to vitamin E at greater than 12 months (very low quality), although the direction of effect favoured pioglitazone. This study also showed no clinically important benefit of pioglitazone on severe adverse events or adverse events when compared to vitamin E at greater than 12 months (very low quality), although the direction of effect favoured pioglitazone.
Children and young people
No clinical evidence
17.5.1.10 Metformin versus vitamin E for NAFLD
Adults population
A single RCT (n=57) demonstrated clinical benefit of metformin on normalised ALT levels when compared to vitamin E at greater than 12 months (moderate quality).
Children and young people
A single RCT (sample size for outcomes varying from 100 to 101) demonstrated no clinically important benefit of metformin on quality of life when compared to vitamin E at greater than 12 months (moderate), although the direction of effect favoured vitamin E for the majority of outcomes.
One RCTs demonstrated clinical benefit of vitamin E on the progression of NAFLD when compared to metformin from the remission of NAFLD at <12 months (n=127, very low quality). Outcomes demonstrating no clinically important benefit were also reported (moderate quality) at greater than 12 months.
A single RCT demonstrated no clinically important benefit of metformin on liver function tests when compared to vitamin E at equal to or greater than 3 to less than 12 months (n=45) and another single RCT at greater than 12 months (n=101, low to high quality), although the direction of effect favoured vitamin E.
A single RCT demonstrated no clinically important benefit of metformin on adverse events when compared to vitamin E at equal to or greater than 3 to less than 12 months (n=101, moderate), although the direction of effect favoured vitamin E.
17.5.1.11 Pentoxyfilline versus pioglitazone for NAFLD
Adult population
Clinical evidence from a single RCT (n=46) demonstrated no clinically important benefit of pentoxyfilline compared to pioglitazone on the progression of NAFLD at equal to or greater than 3 to less than 12 months (very low to low quality).
Clinical evidence from a single RCT (n=59)demonstrated no clinically important benefit of pentoxyfilline compared to pioglitazone on ALT or AST levels at equal to or greater than 3 to less than 12 months (low quality).
National Institute for Health and Care Excellence 2016
NAFLD
Pharmacological interventions
307
Children and young people
No clinical evidence
17.5.1.12 Ursodeoxycholic acid plus vitamin E versus ursodeoxycholic acid for NAFLD
Adult population
Clinical evidence from a single RCT (n=28) demonstrated no clinically important benefit of UDCA plus vitamin E compared to UDCA alone on the progression of NAFLD at greater than 12 months (low quality).
Children and young people
No clinical evidence
17.5.1.13 Ursodeoxycholic acid plus vitamin E versus placebo for NAFLD
Adult population
Clinical evidence from a single RCT (n=27) demonstrated no clinically important benefit of UDCA plus vitamin E compared to UDCA alone on the progression of NAFLD at greater than 12 months (low quality).
Children and young people
No clinical evidence
17.5.1.14 Orlistat plus vitamin E versus vitamin E for NAFLD
Adult population
A single RCT (n=41) demonstrated no clinically important benefit of orlistat plus vitamin E on ALT and AST levels when compared to vitamin E alone at equal to or greater than 3 to less than 12 months and greater than 12 months (very low quality), although the direction of effect favoured vitamin E.
Children and young people
No clinical evidence
17.5.1.15 Pioglitazone plus vitamin E versus vitamin E for NAFLD
Adult population
A single RCT (n=20) demonstrated no clinically important benefit of pioglitazone plus vitamin E on normalised ALT levels when compared to vitamin E alone at equal to or greater than 3 to less than 12 months (very low quality), although the direction of effect favoured vitamin E.
Children and young people
No clinical evidence
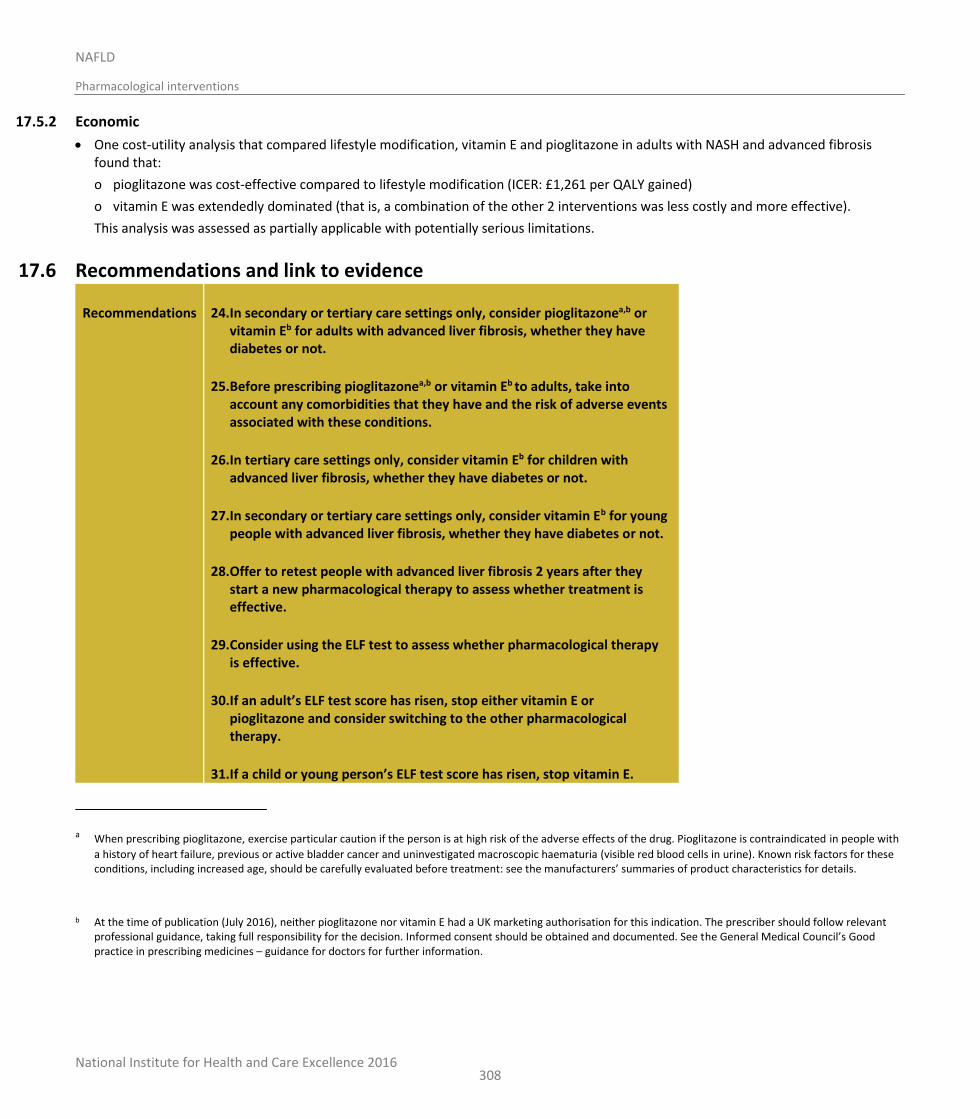
National Institute for Health and Care Excellence 2016
NAFLD
Pharmacological interventions
308
17.5.2 Economic
One cost-utility analysis that compared lifestyle modification, vitamin E and pioglitazone in adults with NASH and advanced fibrosis found that:
o pioglitazone was cost-effective compared to lifestyle modification (ICER: £1,261 per QALY gained)
o vitamin E was extendedly dominated (that is, a combination of the other 2 interventions was less costly and more effective).
This analysis was assessed as partially applicable with potentially serious limitations.
17.6 Recommendations and link to evidence
Recommendations 24. In secondary or tertiary care settings only, consider pioglitazonea,b or vitamin Eb for adults with advanced liver fibrosis, whether they have diabetes or not.
25. Before prescribing pioglitazonea,b or vitamin Eb to adults, take into account any comorbidities that they have and the risk of adverse events associated with these conditions.
26. In tertiary care settings only, consider vitamin Eb for children with advanced liver fibrosis, whether they have diabetes or not.
27. In secondary or tertiary care settings only, consider vitamin Eb for young people with advanced liver fibrosis, whether they have diabetes or not.
28. Offer to retest people with advanced liver fibrosis 2 years after they start a new pharmacological therapy to assess whether treatment is effective.
29. Consider using the ELF test to assess whether pharmacological therapy is effective.
30. If an adult’s ELF test score has risen, stop either vitamin E or pioglitazone and consider switching to the other pharmacological therapy.
31. If a child or young person’s ELF test score has risen, stop vitamin E.
a When prescribing pioglitazone, exercise particular caution if the person is at high risk of the adverse effects of the drug. Pioglitazone is contraindicated in people with
a history of heart failure, previous or active bladder cancer and uninvestigated macroscopic haematuria (visible red blood cells in urine). Known risk factors for these conditions, including increased age, should be carefully evaluated before treatment: see the manufacturers’ summaries of product characteristics for details.
b At the time of publication (July 2016), neither pioglitazone nor vitamin E had a UK marketing authorisation for this indication. The prescriber should follow relevant professional guidance, taking full responsibility for the decision. Informed consent should be obtained and documented. See the General Medical Council’s Good practice in prescribing medicines – guidance for doctors for further information.
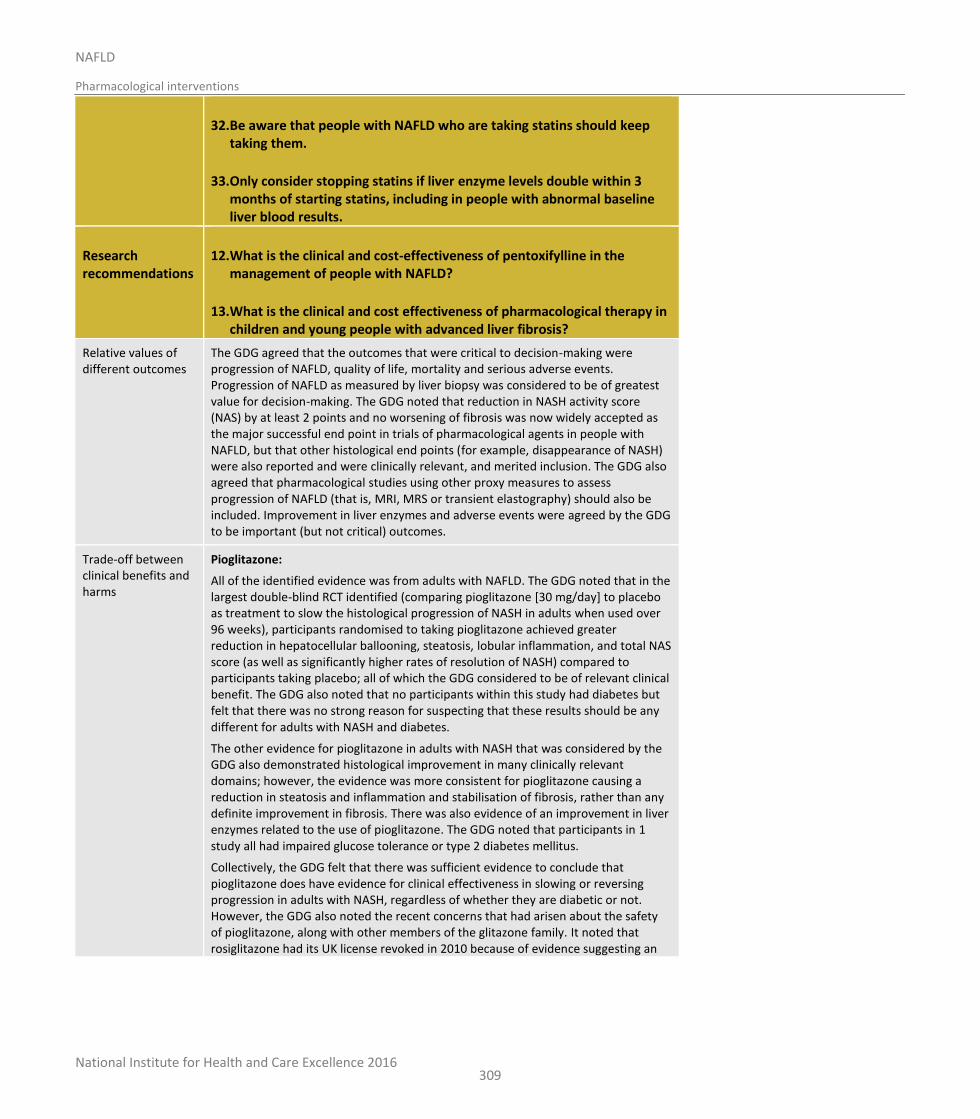
National Institute for Health and Care Excellence 2016
NAFLD
Pharmacological interventions
309
32. Be aware that people with NAFLD who are taking statins should keep taking them.
33. Only consider stopping statins if liver enzyme levels double within 3 months of starting statins, including in people with abnormal baseline liver blood results.
Research recommendations
12. What is the clinical and cost-effectiveness of pentoxifylline in the management of people with NAFLD?
13. What is the clinical and cost effectiveness of pharmacological therapy in children and young people with advanced liver fibrosis?
Relative values of different outcomes
The GDG agreed that the outcomes that were critical to decision-making were progression of NAFLD, quality of life, mortality and serious adverse events. Progression of NAFLD as measured by liver biopsy was considered to be of greatest value for decision-making. The GDG noted that reduction in NASH activity score (NAS) by at least 2 points and no worsening of fibrosis was now widely accepted as the major successful end point in trials of pharmacological agents in people with NAFLD, but that other histological end points (for example, disappearance of NASH) were also reported and were clinically relevant, and merited inclusion. The GDG also agreed that pharmacological studies using other proxy measures to assess progression of NAFLD (that is, MRI, MRS or transient elastography) should also be included. Improvement in liver enzymes and adverse events were agreed by the GDG to be important (but not critical) outcomes.
Trade-off between clinical benefits and harms
Pioglitazone:
All of the identified evidence was from adults with NAFLD. The GDG noted that in the largest double-blind RCT identified (comparing pioglitazone [30 mg/day] to placebo as treatment to slow the histological progression of NASH in adults when used over 96 weeks), participants randomised to taking pioglitazone achieved greater reduction in hepatocellular ballooning, steatosis, lobular inflammation, and total NAS score (as well as significantly higher rates of resolution of NASH) compared to participants taking placebo; all of which the GDG considered to be of relevant clinical benefit. The GDG also noted that no participants within this study had diabetes but felt that there was no strong reason for suspecting that these results should be any different for adults with NASH and diabetes.
The other evidence for pioglitazone in adults with NASH that was considered by the GDG also demonstrated histological improvement in many clinically relevant domains; however, the evidence was more consistent for pioglitazone causing a reduction in steatosis and inflammation and stabilisation of fibrosis, rather than any definite improvement in fibrosis. There was also evidence of an improvement in liver enzymes related to the use of pioglitazone. The GDG noted that participants in 1 study all had impaired glucose tolerance or type 2 diabetes mellitus.
Collectively, the GDG felt that there was sufficient evidence to conclude that pioglitazone does have evidence for clinical effectiveness in slowing or reversing progression in adults with NASH, regardless of whether they are diabetic or not. However, the GDG also noted the recent concerns that had arisen about the safety of pioglitazone, along with other members of the glitazone family. It noted that rosiglitazone had its UK license revoked in 2010 because of evidence suggesting an
National Institute for Health and Care Excellence 2016
NAFLD
Pharmacological interventions
310
increased number of myocardial ischaemic events in association with its use. Rosiglitazone has also been associated with weight gain that is not always fully reversible upon stopping the medication; this could potentially worsen other metabolic parameters in people with NAFLD. The GDG also discussed the evidence for glitazones causing fluid retention and therefore potentially precipitating cardiac failure; this is clearly particularly a limitation for a condition such as NAFLD, where cardiovascular events are the major cause of morbidity and mortality. Concerns have also been raised about an elevated fracture risk in women and a possible increased rate of bladder cancer in relation to the use of the medication.
The GDG concluded that there is a potential role for pioglitazone in treating adults with NASH, but that it should only be prescribed by an expert within secondary care, and only after a balanced evaluation of potential risks and benefits of its use by the prescribing clinician and careful counselling of the recipient of potential side effects.
As there was no evidence for the use of pioglitazone in children and pioglitazone did not have a UK marketing authorisation for us in children at the time of writing, as well as the glitazone safety concerns discussed earlier, the GDG felt they could not extrapolate from the adult evidence to inform a recommendation for children.
Metformin:
Evidence was identified that included children, young people and adults with NAFLD. The GDG noted that no evidence of improvement in any histological domain was found with the use of metformin compared to placebo in adults with NASH. In fact, the GDG noted that participants within the treatment arm tended to have more marked histological progression of NASH than those in the placebo arm. Further data reviewed by the GDG demonstrated that adults with NAFLD treated with metformin had no better liver enzyme values than those treated with placebo.
Evidence for metformin in children and young people with NAFLD was agreed as showing no consistent, clinically significant improvement in histological parameters, liver enzymes or quality of life in those treated with metformin compared to placebo.
The GDG concluded that metformin is not an effective treatment for NAFLD in children, young people or adults, and should not be recommended for this indication.
Vitamin E:
Evidence was identified that included children, young people and adults with NAFLD. The GDG noted that evidence comparing the use of vitamin E to placebo as treatment to slow the histological progression of NASH in adults over 96 weeks, demonstrated clinical benefit of vitamin E on the improvement of hepatocellular ballooning, fibrosis score, and NAS score. No increase in serious adverse events or adverse events was found in the group using vitamin E compared to those treated with placebo. The GDG also noted that all participants within this study were non-diabetic, but felt that there was no strong reason for suspecting that these results should be any different for adults with NASH and diabetes.
The GDG also discussed evidence for progression of NAFLD over 96 weeks in children being treated with either placebo or vitamin E (at 800 IU per day). Approximately 40% of the population had NASH on initial liver biopsy. Evidence indicated a reduction in NAS score and ballooning in those treated with vitamin E, as well as a trend towards a reduction in fibrosis, steatosis and lobular inflammation. A trend
National Institute for Health and Care Excellence 2016
NAFLD
Pharmacological interventions
311
towards improvement in liver enzymes was also noted, although no change in quality of life measures was observed.
As such, the GDG concluded that the evidence demonstrated that vitamin E does have clinical effectiveness at slowing or reversing progression in adults, children or young people with NASH, regardless of whether they are diabetic or not.
Furthermore, the GDG noted that recommending vitamin E for adults with NASH would provide an alternative treatment option to pioglitazone for those people with cardiovascular complications.
However, the GDG also discussed significant concerns that have been raised amongst clinicians regarding the safety of long-term use of vitamin E; specifically, vitamin E use may be associated with an increased risk of haemorrhagic stroke and elevated rates of prostate cancer in men older than 50 years. The increased rates of prostate cancer appear to become significant when vitamin E is administered for more than 3 years. The GDG also discussed data suggesting that long-term vitamin E supplementation is associated with an increase in overall mortality.
The GDG concluded that there is a potential role for vitamin E in treating children, young people and adults with NASH, but that it should only be prescribed by an expert within secondary or tertiary care, and only after a balanced evaluation of potential risks and benefits of its use by the prescribing clinician, and careful counselling of the recipient and their parents or carers of the potential side effects. A decision to prescribe vitamin E should also only be made after taking into account economic considerations of pharmacological management of NAFLD (see below).
Ursodeoxycholic acid (UDCA):
All of the identified evidence was from studies involving adults only. The GDG agreed that overall, the identified evidence demonstrated treatment with UDCA resulted in no improvements in liver histology and liver enzymes better than placebo. As such, the GDG agreed that UDCA should not be recommended as a treatment for NAFLD.
Pentoxifylline:
The GDG reviewed the evidence for pentoxifylline compared to placebo as treatments to slow or reverse progression of NASH in adults; no evidence involving children or young people was identified. Evidence was from 2 RCTs of relatively small populations (55 and 30 participants). The GDG noted that people given 12 months of pentoxifylline had a higher rate of improvement in NAS score (of at least 2 points) compared to those given placebo; however, there was no evidence of a clinically relevant improvement in any other histological parameter that is, fibrosis, statosis, ballooning or lobular inflammation. Histological changes were similar in adults with NASH treated with pentoxifylline compared to those treated with pioglitazone169. Identified studies demonstrated a pattern towards a greater improvement in liver enzymes in those treated with pentoxifylline compared to participants receiving placebo.
The GDG concluded that, although the reviewed data were suggestive of a possible clinical benefit in adults with NAFLD, the small size of the studies and modest evidence supporting improvements in critical outcomes meant that the GDG could not currently recommend pentoxifylline as a treatment for adults with NAFLD. However, the GDG felt that the data reviewed were compelling enough to make a research recommendation for further studies to be undertaken to assess the clinical and cost-effectiveness of pentoxifylline as a treatment for NAFLD.
National Institute for Health and Care Excellence 2016
NAFLD
Pharmacological interventions
312
Statins:
The GDG reviewed evidence from 1 RCT demonstrating an improvement in liver enzymes in those treated with statins, but no improvement of steatosis or fibrosis. The GDG concluded that statins should not be recommended as a treatment for NAFLD.
Orlistat:
All evidence for orlistat was from a single small RCT of adults with NAFLD. The GDG noted that any improvements in liver histology that could be attributable to orlistat were, at most, small. Orlistat in combination with vitamin E did not result in any greater improvement in liver enzymes than treatment with vitamin E alone in adults with NAFLD. The GDG concluded that there was not enough evidence to recommend orlistat as treatment for adults with NAFLD.
Trade-off between net clinical effects and costs
One economic evaluation was identified, comparing lifestyle interventions, pioglitazone and vitamin E in adults with NASH and F3–F4 fibrosis (Mahady 2012). This evaluation used data from the same studies assessing clinical effectiveness of pioglitazone and vitamin E as those reviewed by the GDG. Analysis within this study identified pioglitazone in combination with lifestyle intervention to be cost-effective compared to lifestyle intervention alone (ICER: £1,261.31 per QALY gained), while vitamin E with lifestyle intervention was not cost-effective compared to the other 2 interventions. The GDG noted that the cost of pioglitazone quoted within this evaluation was greater than that currently paid by the NHS, suggesting that this study may in fact underestimate the current cost-effectiveness of pioglitazone with lifestyle intervention.
In light of this economic evaluation, the GDG agreed that where clinicians felt that either pioglitazone or vitamin E were equally as appropriate treatment options for an adult with NASH on grounds of clinical effectiveness, then pioglitazone should be chosen because of its better cost-effectiveness.
Quality of evidence For the majority of evidence in this review, the quality ranged from a GRADE rating of moderate to very low. This was due to the lack of blinding, presence of selection bias and incomplete outcome reporting due to the high number of drop outs in some of the included studies resulting in a high or very high risk of bias rating. Additionally, the imprecise nature of the results extracted and analysed in this review further downgraded the quality of the evidence. High quality GRADE ratings were seen for the critical outcome progression of NAFLD in adult studies when comparing pioglitazone to placebo and pentoxyfilline to placebo. High quality GRADE rating was also seen in evidence for children and young people when comparing metformin to placebo for the outcomes quality of life and ALT and AST levels, vitamin E to placebo for the outcomes progression of NAFLD, quality of life and AST levels, and metformin to vitamin E for the outcomes progression of NAFLD, quality of life and ALT and AST levels.
The poor reporting in some of the trials resulted in inadequate data for pooling of data for meta-analysis. Therefore a considerable body of evidence could only be reported in narrative format and was not adequate for GRADE assessment. Also of note is the limited availability of head to head data. The impression of the GDG was that the randomised studies included tended to be well-designed, with many using strict criteria to diagnose NAFLD and appropriate histological re-evaluation after a reasonable duration of pharmacological treatment as the primary outcome. As
National Institute for Health and Care Excellence 2016
NAFLD
Pharmacological interventions
313
already described, the GDG noted that the single largest RCT that had been included had excluded participants with confirmed diabetes mellitus. The GDG discussed that, although many people with NASH also have diabetes, the advantage of this study design was that it removed diabetes (and the pharmacological treatment of it) as a possible confounding factor.
The economic study included in this review was assessed as partially applicable with potentially serious limitations.
Other considerations The GDG discussed that although the ‘Severity’ review within this guideline has made a recommendation regarding a clinically and cost-effective non-invasive means of identifying advanced fibrosis (F3 and F4) (ELF score greater than or equal to 10.51), no comparable recommendation could be made for the non-invasive identification of NASH. The GDG discussed the implications of this regarding the interpretation of evidence within this review, since histologically confirmed NASH was a component of the entry criterion for many of the RCTs that had been included. The GDG then further discussed that natural history studies of NAFLD had consistently demonstrated that the vast majority of people with NAFLD who have histologically confirmed F3 or F4 fibrosis also have NASH on biopsy (greater than 90%), although many people with NASH on biopsy do not also have advanced fibrosis. As such, the GDG concluded that, within the framework of these guidelines, the non-invasive identification of advanced fibrosis in people with NAFLD should be taken as a means of assuming that the person also has NASH.
The GDG recognised that this approach meant that the majority of people with NASH and advanced hepatic fibrosis would be identified by application of these guidelines, but that people with NASH and no or early fibrosis (F1 or F2) were likely to be missed. However, the GDG discussed further that, since severe hepatic fibrosis (but not NASH) has consistently been shown to be of prognostic value in people with NAFLD (therefore, people with advanced fibrosis are the cohort requiring closest monitoring and who have the most to gain from pharmacotherapy slowing or reversing the condition), that the cohort of people with NASH and severe fibrosis were the most important to identify. The GDG concluded that it would be an acknowledged compromise within these guidelines that the majority of people with NASH and advanced fibrosis would be identified at the expense of missing some people with NASH and early fibrosis.
Given the potential side effect profile of pioglitazone and vitamin E – as well as the observation by the GDG from the reviewed evidence that not all adults with NASH gained clinical benefit from its use - the GDG concluded that assessment of treatment response was merited at some point after starting the medication, to allow re-evaluation about whether the benefits of continuing therapy still outweighed the potential risks. Since the largest RCT examining the role of pioglitazone or vitamin E in treating NASH had reported their histological endpoints after 96 weeks of treatment, the GDG agreed that the repeat ELF should be performed after people had been taking pioglitazone for 2 years. The GDG discussed that people failing to meet this end point of treatment response should either stop pharmacological treatment altogether, or be treated with an alternative pharmacological agent if appropriate. It was noted by the GDG that the summary of product characteristics for pioglitazone recommend review of adequacy of treatment response after 3–6 months of therapy (and potential discontinuation if an inadequate treatment response is observed); however, this advice applies specifically to where pioglitazone is being used as treatment for type 2 diabetes mellitus only, and was therefore felt to have no applicability to where pioglitazone
National Institute for Health and Care Excellence 2016
NAFLD
Pharmacological interventions
314
was being used as therapy for NASH.
The GDG discussed that, although metformin and statins were not to be recommended as pharmacological treatments for NAFLD itself, the strong association between NAFLD and the metabolic syndrome means that many adults with NAFLD have clear indications for their use (that is, type 2 diabetes mellitus or dyslipidaemia). In this review, subgroup analysis was conducted if data were available for treatment effects with people with NAFLD and specific extra-hepatic conditions. The GDG emphasised that there was no suggestion from the reviewed evidence that people with NAFLD already taking these medications should stop them at all. The GDG particularly stressed that statin-related drug-induced liver injury is a much rarer condition than is believed by many clinicians, and that otherwise-unexplained minor abnormalities in liver enzymes in those taking statins were by no means a contraindication to continuing their use. Therefore, based on clinical experience, the GDG suggested doubling in liver blood test values within 3 months (a broadly accepted definition of drug-induced liver injury) as a threshold for considering when to consider stopping statins.
The GDG also discussed the recently published phase 2, multi-centre, double-blind, placebo-controlled trial of the use of obeticholic acid as treatment of non-cirrhotic adults with NASH.126 A reduction in NAS by at least 2 points and no worsening of fibrosis was the primary outcome. The trial was stopped prematurely at a planned interim analysis because of significantly more participants reaching the primary outcome in the treatment arm compared to the placebo arm. However, given that obeticholic acid is not currently licensed for prescription within the UK, no evidence related to its use could be formally considered by the GDG. The GDG was also aware of significant on-going research in the pharmaceutical industry regarding the role of novel therapeutic agents in treating NAFLD (including clinical trials underway at the time of writing these guidelines). The GDG agreed that if these trials reported positive results, an update of this guideline may be warranted.
Research recommendations
The GDG made a research recommendation to investigate the clinical and cost-effectiveness of pentoxifylline to treat NAFLD.
The GDG also made a high-priority research recommendation to investigate the clinical and cost-effectiveness of pharmacological therapy to treat advanced fibrosis in children and young people. See Appendix Q for further details.
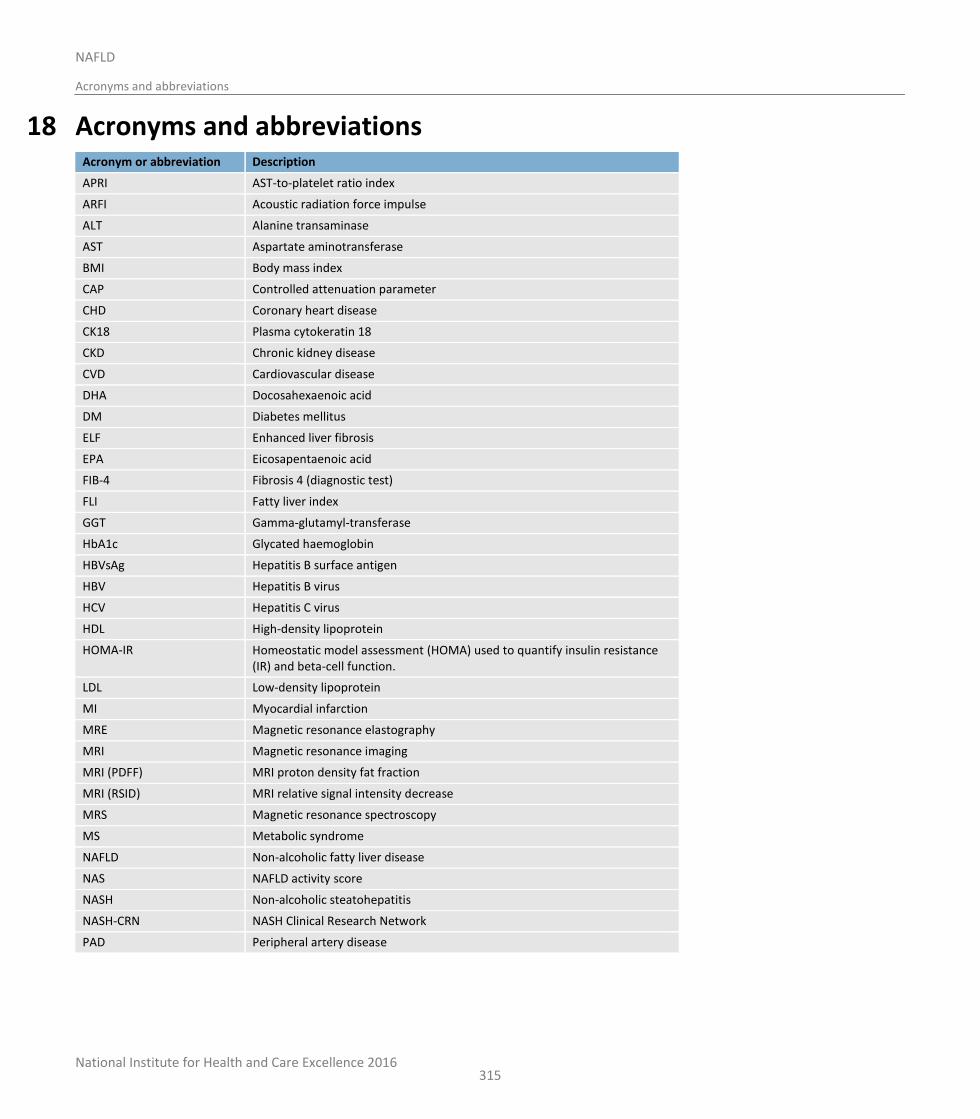
National Institute for Health and Care Excellence 2016
NAFLD
Acronyms and abbreviations
315
18 Acronyms and abbreviations Acronym or abbreviation Description
APRI AST-to-platelet ratio index
ARFI Acoustic radiation force impulse
ALT Alanine transaminase
AST Aspartate aminotransferase
BMI Body mass index
CAP Controlled attenuation parameter
CHD Coronary heart disease
CK18 Plasma cytokeratin 18
CKD Chronic kidney disease
CVD Cardiovascular disease
DHA Docosahexaenoic acid
DM Diabetes mellitus
ELF Enhanced liver fibrosis
EPA Eicosapentaenoic acid
FIB-4 Fibrosis 4 (diagnostic test)
FLI Fatty liver index
GGT Gamma-glutamyl-transferase
HbA1c Glycated haemoglobin
HBVsAg Hepatitis B surface antigen
HBV Hepatitis B virus
HCV Hepatitis C virus
HDL High-density lipoprotein
HOMA-IR Homeostatic model assessment (HOMA) used to quantify insulin resistance (IR) and beta-cell function.
LDL Low-density lipoprotein
MI Myocardial infarction
MRE Magnetic resonance elastography
MRI Magnetic resonance imaging
MRI (PDFF) MRI proton density fat fraction
MRI (RSID) MRI relative signal intensity decrease
MRS Magnetic resonance spectroscopy
MS Metabolic syndrome
NAFLD Non-alcoholic fatty liver disease
NAS NAFLD activity score
NASH Non-alcoholic steatohepatitis
NASH-CRN NASH Clinical Research Network
PAD Peripheral artery disease
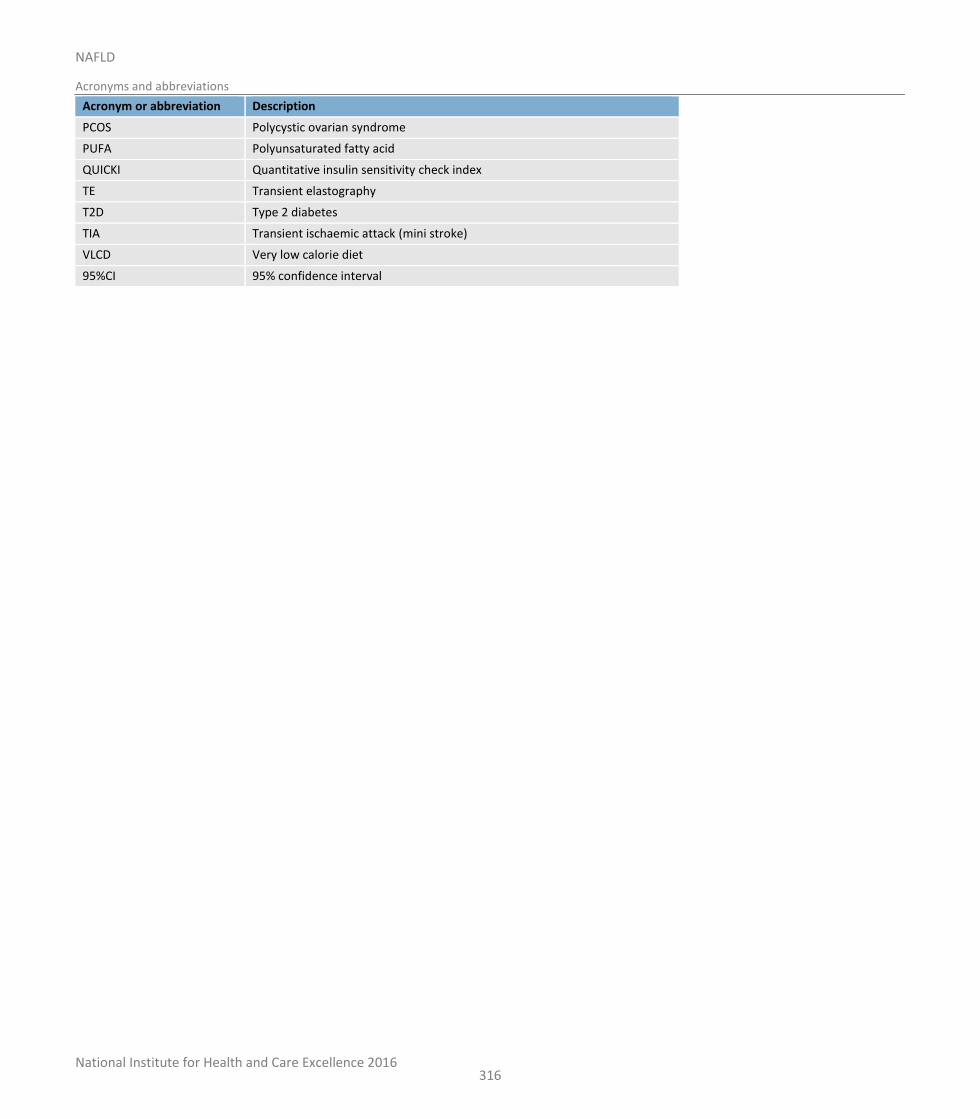
National Institute for Health and Care Excellence 2016
NAFLD
Acronyms and abbreviations
316
Acronym or abbreviation Description
PCOS Polycystic ovarian syndrome
PUFA Polyunsaturated fatty acid
QUICKI Quantitative insulin sensitivity check index
TE Transient elastography
T2D Type 2 diabetes
TIA Transient ischaemic attack (mini stroke)
VLCD Very low calorie diet
95%CI 95% confidence interval
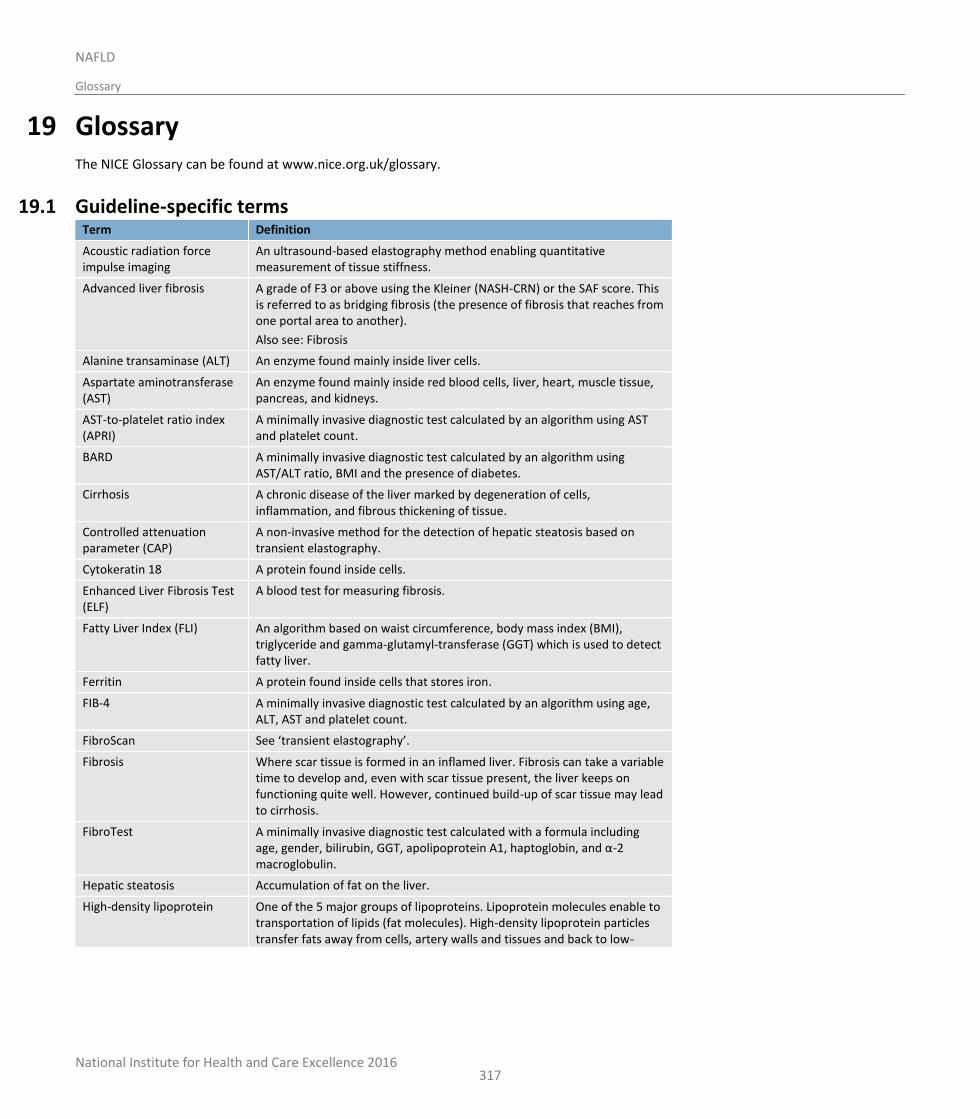
National Institute for Health and Care Excellence 2016
NAFLD
Glossary
317
19 Glossary The NICE Glossary can be found at www.nice.org.uk/glossary.
19.1 Guideline-specific terms Term Definition
Acoustic radiation force impulse imaging
An ultrasound-based elastography method enabling quantitative measurement of tissue stiffness.
Advanced liver fibrosis A grade of F3 or above using the Kleiner (NASH-CRN) or the SAF score. This is referred to as bridging fibrosis (the presence of fibrosis that reaches from one portal area to another).
Also see: Fibrosis
Alanine transaminase (ALT) An enzyme found mainly inside liver cells.
Aspartate aminotransferase (AST)
An enzyme found mainly inside red blood cells, liver, heart, muscle tissue, pancreas, and kidneys.
AST-to-platelet ratio index (APRI)
A minimally invasive diagnostic test calculated by an algorithm using AST and platelet count.
BARD A minimally invasive diagnostic test calculated by an algorithm using AST/ALT ratio, BMI and the presence of diabetes.
Cirrhosis A chronic disease of the liver marked by degeneration of cells, inflammation, and fibrous thickening of tissue.
Controlled attenuation parameter (CAP)
A non-invasive method for the detection of hepatic steatosis based on transient elastography.
Cytokeratin 18 A protein found inside cells.
Enhanced Liver Fibrosis Test (ELF)
A blood test for measuring fibrosis.
Fatty Liver Index (FLI) An algorithm based on waist circumference, body mass index (BMI), triglyceride and gamma-glutamyl-transferase (GGT) which is used to detect fatty liver.
Ferritin A protein found inside cells that stores iron.
FIB-4 A minimally invasive diagnostic test calculated by an algorithm using age, ALT, AST and platelet count.
FibroScan See ‘transient elastography’.
Fibrosis Where scar tissue is formed in an inflamed liver. Fibrosis can take a variable time to develop and, even with scar tissue present, the liver keeps on functioning quite well. However, continued build-up of scar tissue may lead to cirrhosis.
FibroTest A minimally invasive diagnostic test calculated with a formula including age, gender, bilirubin, GGT, apolipoprotein A1, haptoglobin, and α-2 macroglobulin.
Hepatic steatosis Accumulation of fat on the liver.
High-density lipoprotein One of the 5 major groups of lipoproteins. Lipoprotein molecules enable to transportation of lipids (fat molecules). High-density lipoprotein particles transfer fats away from cells, artery walls and tissues and back to low-
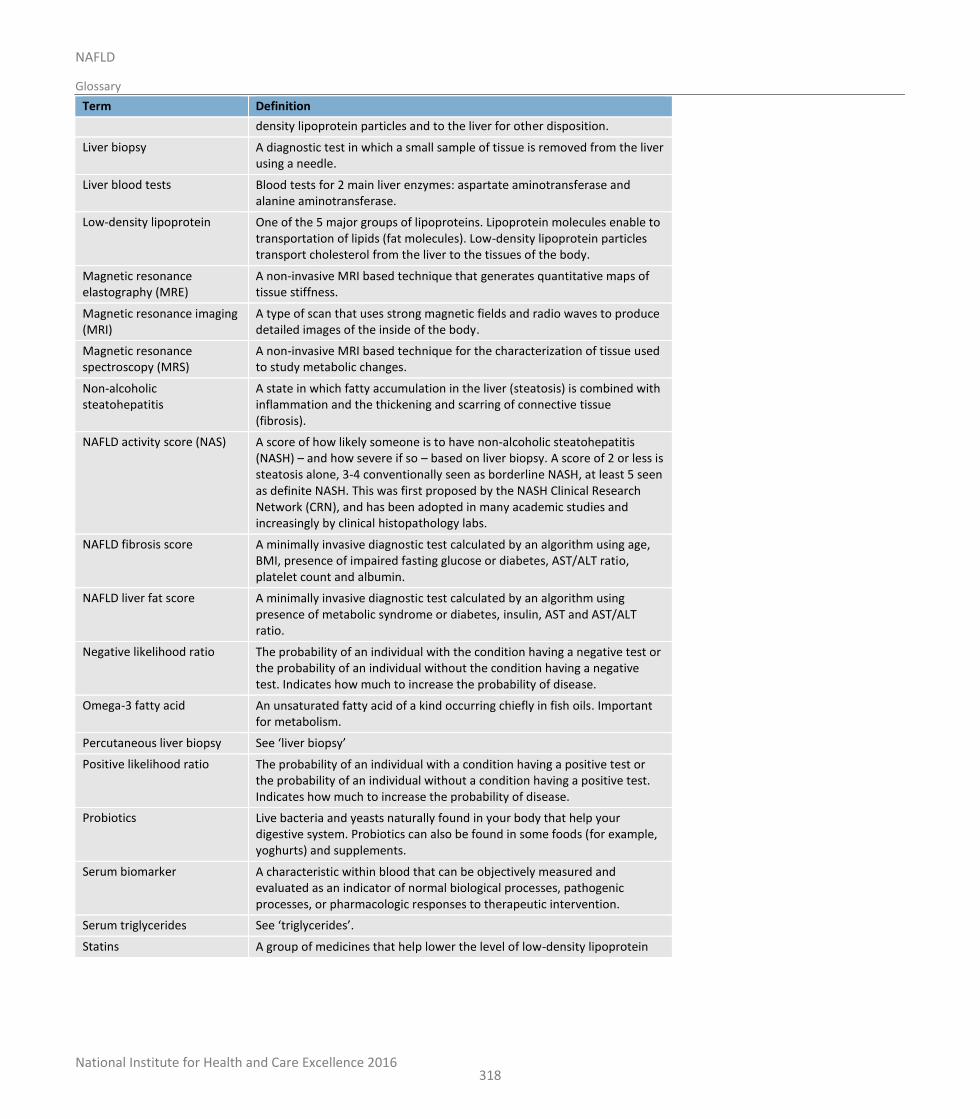
National Institute for Health and Care Excellence 2016
NAFLD
Glossary
318
Term Definition
density lipoprotein particles and to the liver for other disposition.
Liver biopsy A diagnostic test in which a small sample of tissue is removed from the liver using a needle.
Liver blood tests Blood tests for 2 main liver enzymes: aspartate aminotransferase and alanine aminotransferase.
Low-density lipoprotein One of the 5 major groups of lipoproteins. Lipoprotein molecules enable to transportation of lipids (fat molecules). Low-density lipoprotein particles transport cholesterol from the liver to the tissues of the body.
Magnetic resonance elastography (MRE)
A non-invasive MRI based technique that generates quantitative maps of tissue stiffness.
Magnetic resonance imaging (MRI)
A type of scan that uses strong magnetic fields and radio waves to produce detailed images of the inside of the body.
Magnetic resonance spectroscopy (MRS)
A non-invasive MRI based technique for the characterization of tissue used to study metabolic changes.
Non-alcoholic steatohepatitis
A state in which fatty accumulation in the liver (steatosis) is combined with inflammation and the thickening and scarring of connective tissue (fibrosis).
NAFLD activity score (NAS) A score of how likely someone is to have non-alcoholic steatohepatitis (NASH) – and how severe if so – based on liver biopsy. A score of 2 or less is steatosis alone, 3-4 conventionally seen as borderline NASH, at least 5 seen as definite NASH. This was first proposed by the NASH Clinical Research Network (CRN), and has been adopted in many academic studies and increasingly by clinical histopathology labs.
NAFLD fibrosis score A minimally invasive diagnostic test calculated by an algorithm using age, BMI, presence of impaired fasting glucose or diabetes, AST/ALT ratio, platelet count and albumin.
NAFLD liver fat score A minimally invasive diagnostic test calculated by an algorithm using presence of metabolic syndrome or diabetes, insulin, AST and AST/ALT ratio.
Negative likelihood ratio The probability of an individual with the condition having a negative test or the probability of an individual without the condition having a negative test. Indicates how much to increase the probability of disease.
Omega-3 fatty acid An unsaturated fatty acid of a kind occurring chiefly in fish oils. Important for metabolism.
Percutaneous liver biopsy See ‘liver biopsy’
Positive likelihood ratio The probability of an individual with a condition having a positive test or the probability of an individual without a condition having a positive test. Indicates how much to increase the probability of disease.
Probiotics Live bacteria and yeasts naturally found in your body that help your digestive system. Probiotics can also be found in some foods (for example, yoghurts) and supplements.
Serum biomarker A characteristic within blood that can be objectively measured and evaluated as an indicator of normal biological processes, pathogenic processes, or pharmacologic responses to therapeutic intervention.
Serum triglycerides See ‘triglycerides’.
Statins A group of medicines that help lower the level of low-density lipoprotein
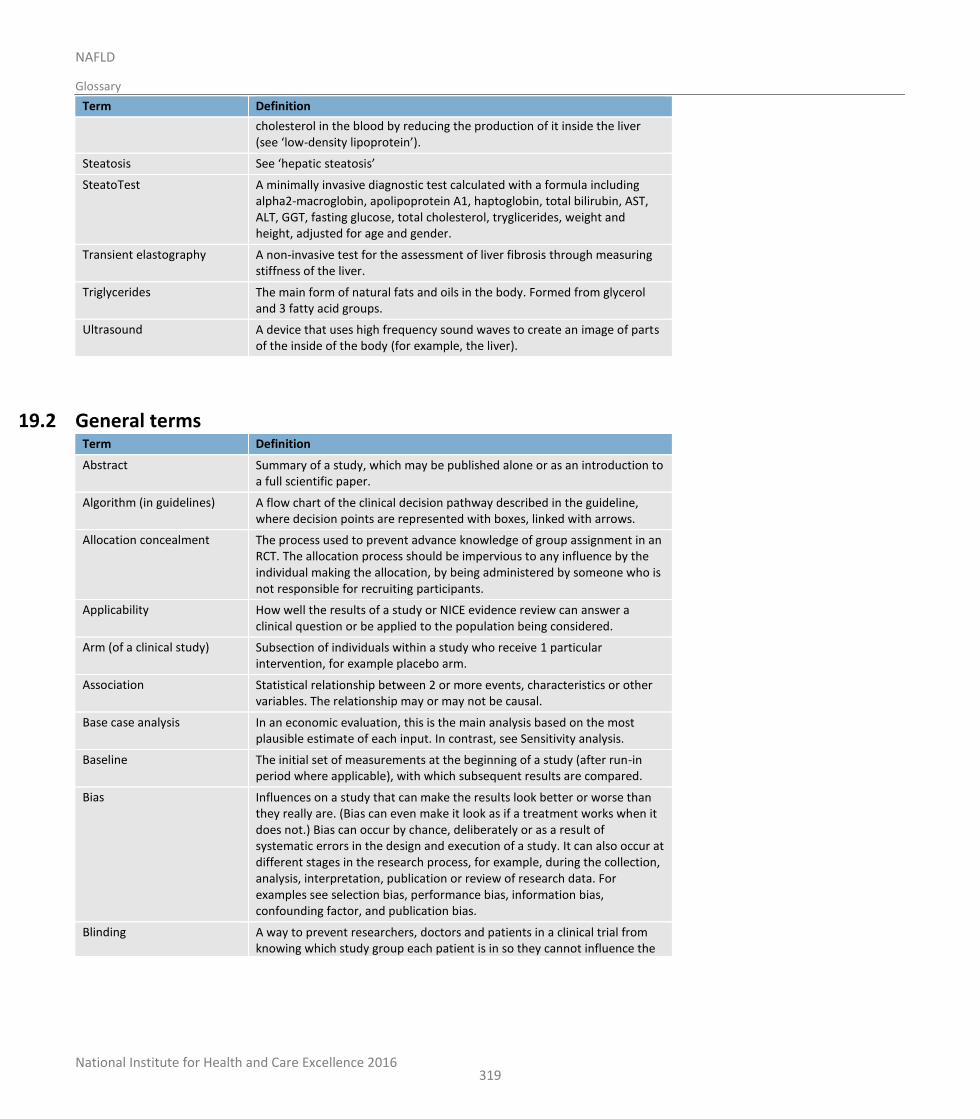
National Institute for Health and Care Excellence 2016
NAFLD
Glossary
319
Term Definition
cholesterol in the blood by reducing the production of it inside the liver (see ‘low-density lipoprotein’).
Steatosis See ‘hepatic steatosis’
SteatoTest A minimally invasive diagnostic test calculated with a formula including alpha2-macroglobin, apolipoprotein A1, haptoglobin, total bilirubin, AST, ALT, GGT, fasting glucose, total cholesterol, tryglicerides, weight and height, adjusted for age and gender.
Transient elastography A non-invasive test for the assessment of liver fibrosis through measuring stiffness of the liver.
Triglycerides The main form of natural fats and oils in the body. Formed from glycerol and 3 fatty acid groups.
Ultrasound A device that uses high frequency sound waves to create an image of parts of the inside of the body (for example, the liver).
19.2 General terms Term Definition
Abstract Summary of a study, which may be published alone or as an introduction to a full scientific paper.
Algorithm (in guidelines) A flow chart of the clinical decision pathway described in the guideline, where decision points are represented with boxes, linked with arrows.
Allocation concealment The process used to prevent advance knowledge of group assignment in an RCT. The allocation process should be impervious to any influence by the individual making the allocation, by being administered by someone who is not responsible for recruiting participants.
Applicability How well the results of a study or NICE evidence review can answer a clinical question or be applied to the population being considered.
Arm (of a clinical study) Subsection of individuals within a study who receive 1 particular intervention, for example placebo arm.
Association Statistical relationship between 2 or more events, characteristics or other variables. The relationship may or may not be causal.
Base case analysis In an economic evaluation, this is the main analysis based on the most plausible estimate of each input. In contrast, see Sensitivity analysis.
Baseline The initial set of measurements at the beginning of a study (after run-in period where applicable), with which subsequent results are compared.
Bias Influences on a study that can make the results look better or worse than they really are. (Bias can even make it look as if a treatment works when it does not.) Bias can occur by chance, deliberately or as a result of systematic errors in the design and execution of a study. It can also occur at different stages in the research process, for example, during the collection, analysis, interpretation, publication or review of research data. For examples see selection bias, performance bias, information bias, confounding factor, and publication bias.
Blinding A way to prevent researchers, doctors and patients in a clinical trial from knowing which study group each patient is in so they cannot influence the
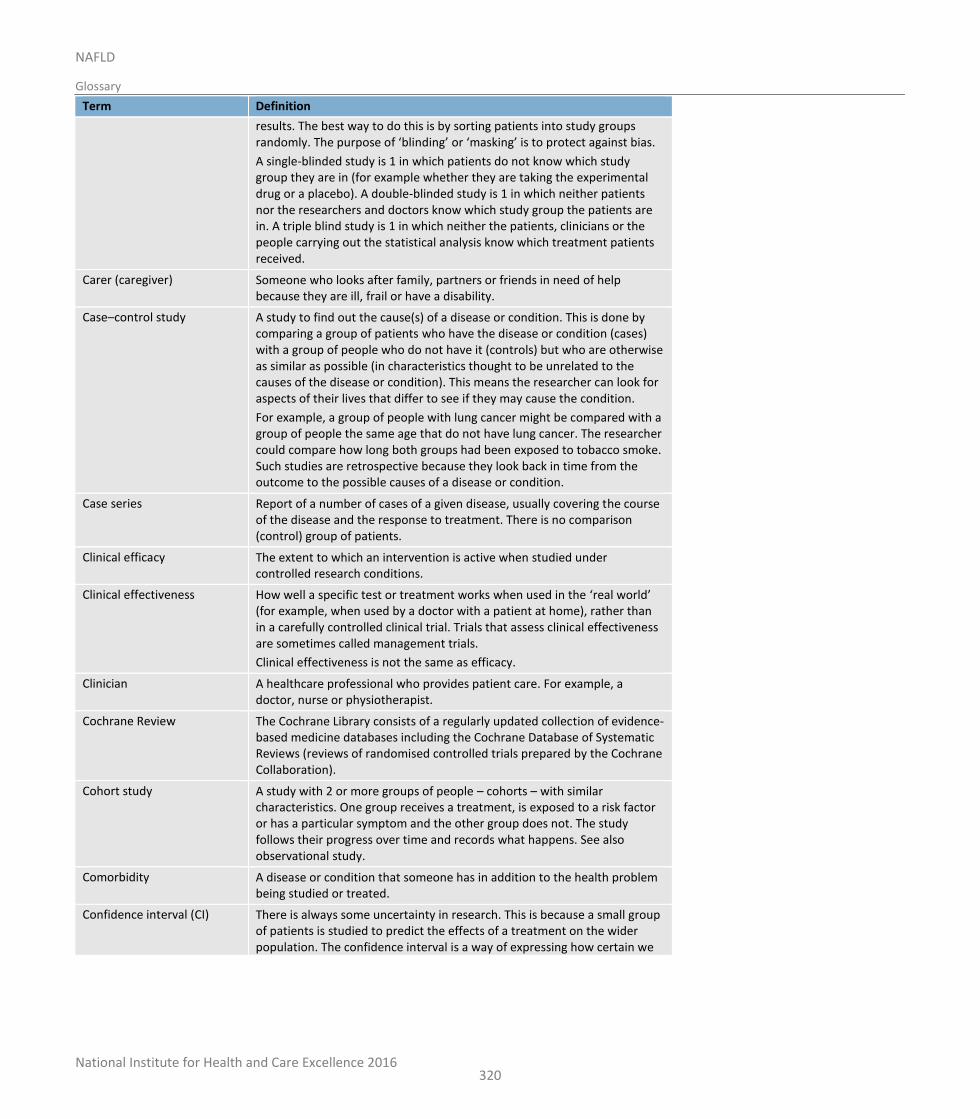
National Institute for Health and Care Excellence 2016
NAFLD
Glossary
320
Term Definition
results. The best way to do this is by sorting patients into study groups randomly. The purpose of ‘blinding’ or ‘masking’ is to protect against bias.
A single-blinded study is 1 in which patients do not know which study group they are in (for example whether they are taking the experimental drug or a placebo). A double-blinded study is 1 in which neither patients nor the researchers and doctors know which study group the patients are in. A triple blind study is 1 in which neither the patients, clinicians or the people carrying out the statistical analysis know which treatment patients received.
Carer (caregiver) Someone who looks after family, partners or friends in need of help because they are ill, frail or have a disability.
Case–control study A study to find out the cause(s) of a disease or condition. This is done by comparing a group of patients who have the disease or condition (cases) with a group of people who do not have it (controls) but who are otherwise as similar as possible (in characteristics thought to be unrelated to the causes of the disease or condition). This means the researcher can look for aspects of their lives that differ to see if they may cause the condition.
For example, a group of people with lung cancer might be compared with a group of people the same age that do not have lung cancer. The researcher could compare how long both groups had been exposed to tobacco smoke. Such studies are retrospective because they look back in time from the outcome to the possible causes of a disease or condition.
Case series Report of a number of cases of a given disease, usually covering the course of the disease and the response to treatment. There is no comparison (control) group of patients.
Clinical efficacy The extent to which an intervention is active when studied under controlled research conditions.
Clinical effectiveness How well a specific test or treatment works when used in the ‘real world’ (for example, when used by a doctor with a patient at home), rather than in a carefully controlled clinical trial. Trials that assess clinical effectiveness are sometimes called management trials.
Clinical effectiveness is not the same as efficacy.
Clinician A healthcare professional who provides patient care. For example, a doctor, nurse or physiotherapist.
Cochrane Review The Cochrane Library consists of a regularly updated collection of evidence-based medicine databases including the Cochrane Database of Systematic Reviews (reviews of randomised controlled trials prepared by the Cochrane Collaboration).
Cohort study A study with 2 or more groups of people – cohorts – with similar characteristics. One group receives a treatment, is exposed to a risk factor or has a particular symptom and the other group does not. The study follows their progress over time and records what happens. See also observational study.
Comorbidity A disease or condition that someone has in addition to the health problem being studied or treated.
Confidence interval (CI) There is always some uncertainty in research. This is because a small group of patients is studied to predict the effects of a treatment on the wider population. The confidence interval is a way of expressing how certain we
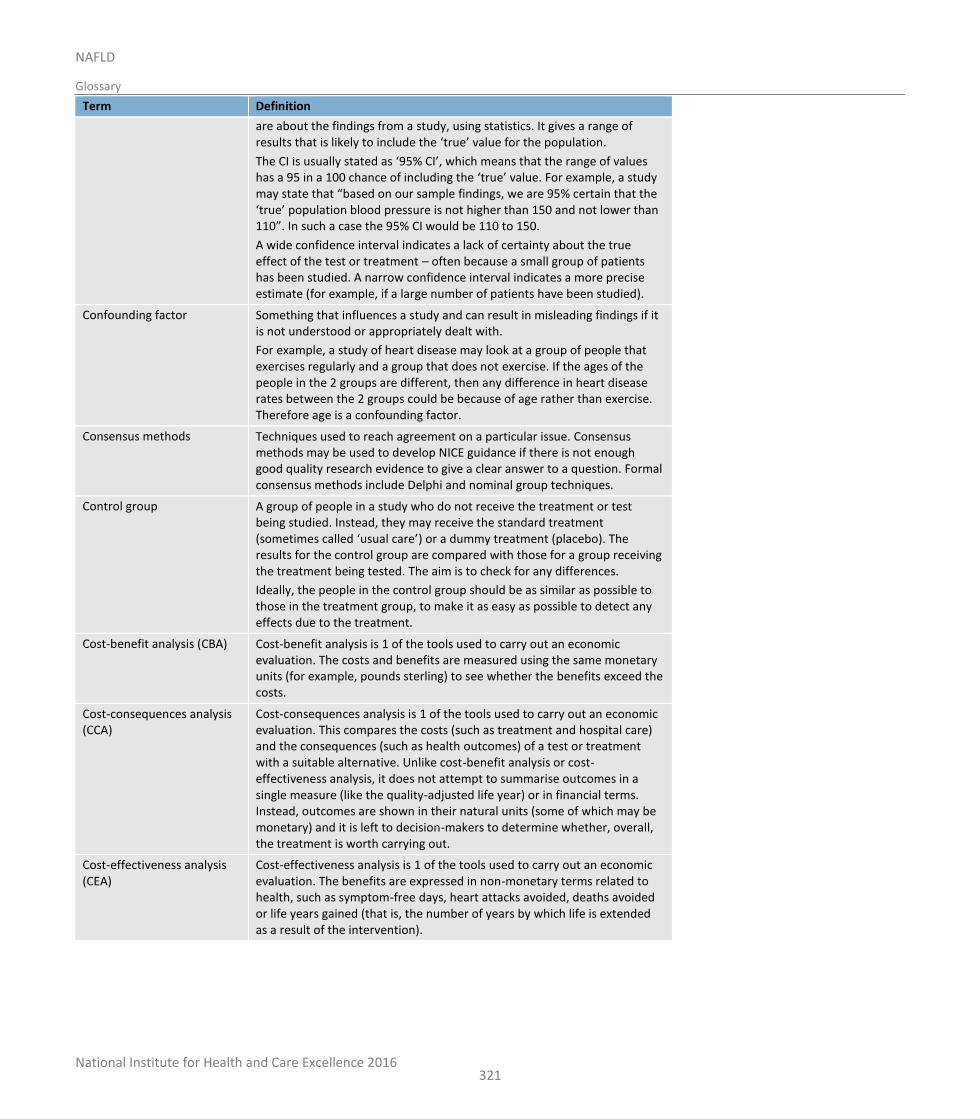
National Institute for Health and Care Excellence 2016
NAFLD
Glossary
321
Term Definition
are about the findings from a study, using statistics. It gives a range of results that is likely to include the ‘true’ value for the population.
The CI is usually stated as ‘95% CI’, which means that the range of values has a 95 in a 100 chance of including the ‘true’ value. For example, a study may state that “based on our sample findings, we are 95% certain that the ‘true’ population blood pressure is not higher than 150 and not lower than 110”. In such a case the 95% CI would be 110 to 150.
A wide confidence interval indicates a lack of certainty about the true effect of the test or treatment – often because a small group of patients has been studied. A narrow confidence interval indicates a more precise estimate (for example, if a large number of patients have been studied).
Confounding factor Something that influences a study and can result in misleading findings if it is not understood or appropriately dealt with.
For example, a study of heart disease may look at a group of people that exercises regularly and a group that does not exercise. If the ages of the people in the 2 groups are different, then any difference in heart disease rates between the 2 groups could be because of age rather than exercise. Therefore age is a confounding factor.
Consensus methods Techniques used to reach agreement on a particular issue. Consensus methods may be used to develop NICE guidance if there is not enough good quality research evidence to give a clear answer to a question. Formal consensus methods include Delphi and nominal group techniques.
Control group A group of people in a study who do not receive the treatment or test being studied. Instead, they may receive the standard treatment (sometimes called ‘usual care’) or a dummy treatment (placebo). The results for the control group are compared with those for a group receiving the treatment being tested. The aim is to check for any differences.
Ideally, the people in the control group should be as similar as possible to those in the treatment group, to make it as easy as possible to detect any effects due to the treatment.
Cost-benefit analysis (CBA) Cost-benefit analysis is 1 of the tools used to carry out an economic evaluation. The costs and benefits are measured using the same monetary units (for example, pounds sterling) to see whether the benefits exceed the costs.
Cost-consequences analysis (CCA)
Cost-consequences analysis is 1 of the tools used to carry out an economic evaluation. This compares the costs (such as treatment and hospital care) and the consequences (such as health outcomes) of a test or treatment with a suitable alternative. Unlike cost-benefit analysis or cost-effectiveness analysis, it does not attempt to summarise outcomes in a single measure (like the quality-adjusted life year) or in financial terms. Instead, outcomes are shown in their natural units (some of which may be monetary) and it is left to decision-makers to determine whether, overall, the treatment is worth carrying out.
Cost-effectiveness analysis (CEA)
Cost-effectiveness analysis is 1 of the tools used to carry out an economic evaluation. The benefits are expressed in non-monetary terms related to health, such as symptom-free days, heart attacks avoided, deaths avoided or life years gained (that is, the number of years by which life is extended as a result of the intervention).
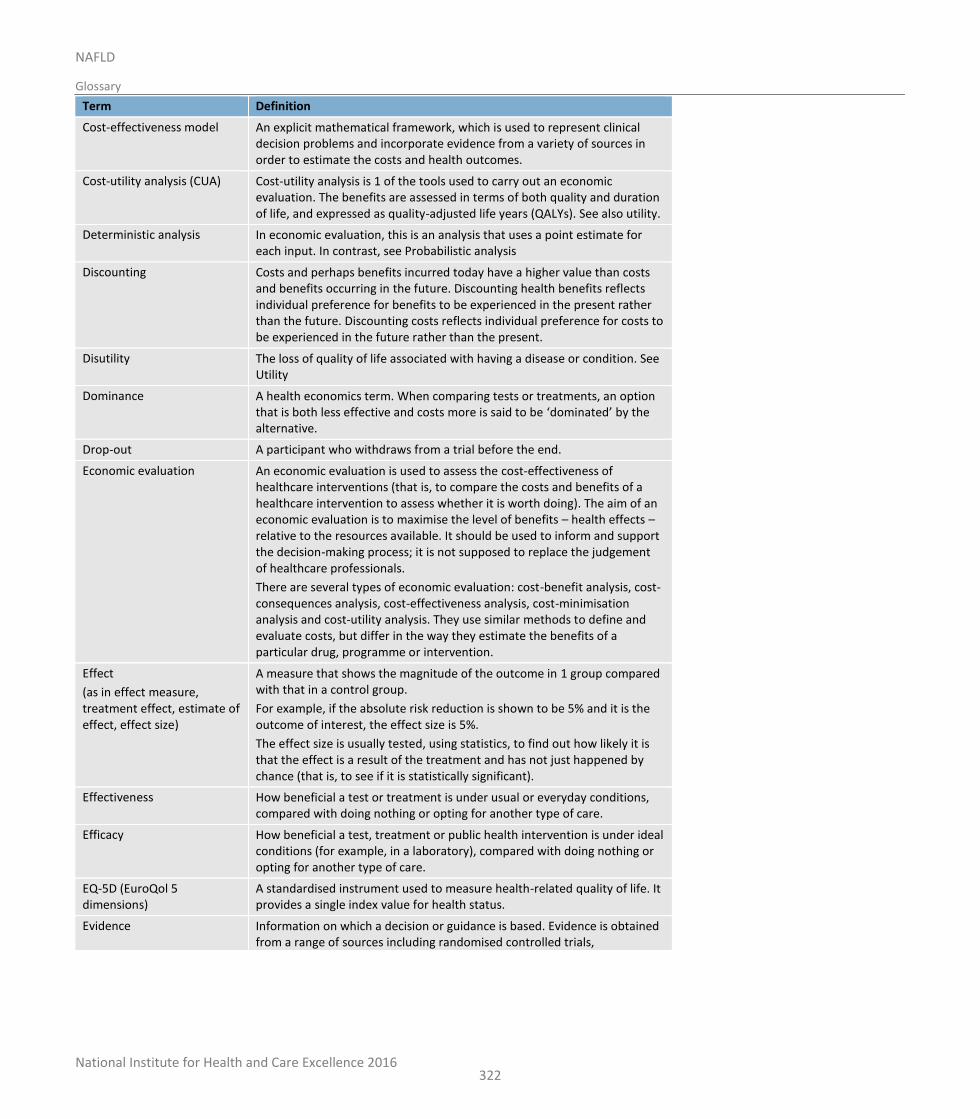
National Institute for Health and Care Excellence 2016
NAFLD
Glossary
322
Term Definition
Cost-effectiveness model An explicit mathematical framework, which is used to represent clinical decision problems and incorporate evidence from a variety of sources in order to estimate the costs and health outcomes.
Cost-utility analysis (CUA) Cost-utility analysis is 1 of the tools used to carry out an economic evaluation. The benefits are assessed in terms of both quality and duration of life, and expressed as quality-adjusted life years (QALYs). See also utility.
Deterministic analysis In economic evaluation, this is an analysis that uses a point estimate for each input. In contrast, see Probabilistic analysis
Discounting Costs and perhaps benefits incurred today have a higher value than costs and benefits occurring in the future. Discounting health benefits reflects individual preference for benefits to be experienced in the present rather than the future. Discounting costs reflects individual preference for costs to be experienced in the future rather than the present.
Disutility The loss of quality of life associated with having a disease or condition. See Utility
Dominance A health economics term. When comparing tests or treatments, an option that is both less effective and costs more is said to be ‘dominated’ by the alternative.
Drop-out A participant who withdraws from a trial before the end.
Economic evaluation An economic evaluation is used to assess the cost-effectiveness of healthcare interventions (that is, to compare the costs and benefits of a healthcare intervention to assess whether it is worth doing). The aim of an economic evaluation is to maximise the level of benefits – health effects – relative to the resources available. It should be used to inform and support the decision-making process; it is not supposed to replace the judgement of healthcare professionals.
There are several types of economic evaluation: cost-benefit analysis, cost-consequences analysis, cost-effectiveness analysis, cost-minimisation analysis and cost-utility analysis. They use similar methods to define and evaluate costs, but differ in the way they estimate the benefits of a particular drug, programme or intervention.
Effect
(as in effect measure, treatment effect, estimate of effect, effect size)
A measure that shows the magnitude of the outcome in 1 group compared with that in a control group.
For example, if the absolute risk reduction is shown to be 5% and it is the outcome of interest, the effect size is 5%.
The effect size is usually tested, using statistics, to find out how likely it is that the effect is a result of the treatment and has not just happened by chance (that is, to see if it is statistically significant).
Effectiveness How beneficial a test or treatment is under usual or everyday conditions, compared with doing nothing or opting for another type of care.
Efficacy How beneficial a test, treatment or public health intervention is under ideal conditions (for example, in a laboratory), compared with doing nothing or opting for another type of care.
EQ-5D (EuroQol 5 dimensions)
A standardised instrument used to measure health-related quality of life. It provides a single index value for health status.
Evidence Information on which a decision or guidance is based. Evidence is obtained from a range of sources including randomised controlled trials,
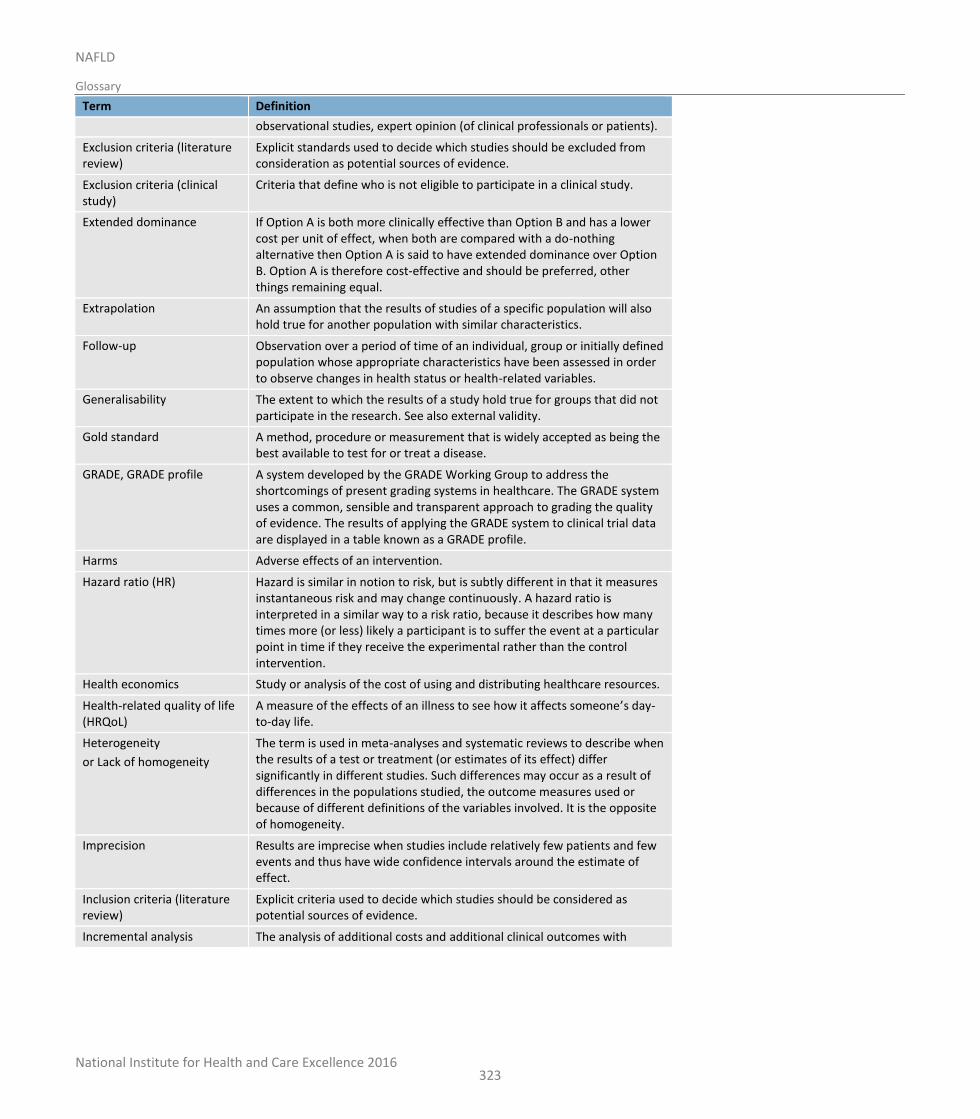
National Institute for Health and Care Excellence 2016
NAFLD
Glossary
323
Term Definition
observational studies, expert opinion (of clinical professionals or patients).
Exclusion criteria (literature review)
Explicit standards used to decide which studies should be excluded from consideration as potential sources of evidence.
Exclusion criteria (clinical study)
Criteria that define who is not eligible to participate in a clinical study.
Extended dominance If Option A is both more clinically effective than Option B and has a lower cost per unit of effect, when both are compared with a do-nothing alternative then Option A is said to have extended dominance over Option B. Option A is therefore cost-effective and should be preferred, other things remaining equal.
Extrapolation An assumption that the results of studies of a specific population will also hold true for another population with similar characteristics.
Follow-up Observation over a period of time of an individual, group or initially defined population whose appropriate characteristics have been assessed in order to observe changes in health status or health-related variables.
Generalisability The extent to which the results of a study hold true for groups that did not participate in the research. See also external validity.
Gold standard A method, procedure or measurement that is widely accepted as being the best available to test for or treat a disease.
GRADE, GRADE profile A system developed by the GRADE Working Group to address the shortcomings of present grading systems in healthcare. The GRADE system uses a common, sensible and transparent approach to grading the quality of evidence. The results of applying the GRADE system to clinical trial data are displayed in a table known as a GRADE profile.
Harms Adverse effects of an intervention.
Hazard ratio (HR) Hazard is similar in notion to risk, but is subtly different in that it measures instantaneous risk and may change continuously. A hazard ratio is interpreted in a similar way to a risk ratio, because it describes how many times more (or less) likely a participant is to suffer the event at a particular point in time if they receive the experimental rather than the control intervention.
Health economics Study or analysis of the cost of using and distributing healthcare resources.
Health-related quality of life (HRQoL)
A measure of the effects of an illness to see how it affects someone’s day-to-day life.
Heterogeneity
or Lack of homogeneity
The term is used in meta-analyses and systematic reviews to describe when the results of a test or treatment (or estimates of its effect) differ significantly in different studies. Such differences may occur as a result of differences in the populations studied, the outcome measures used or because of different definitions of the variables involved. It is the opposite of homogeneity.
Imprecision Results are imprecise when studies include relatively few patients and few events and thus have wide confidence intervals around the estimate of effect.
Inclusion criteria (literature review)
Explicit criteria used to decide which studies should be considered as potential sources of evidence.
Incremental analysis The analysis of additional costs and additional clinical outcomes with
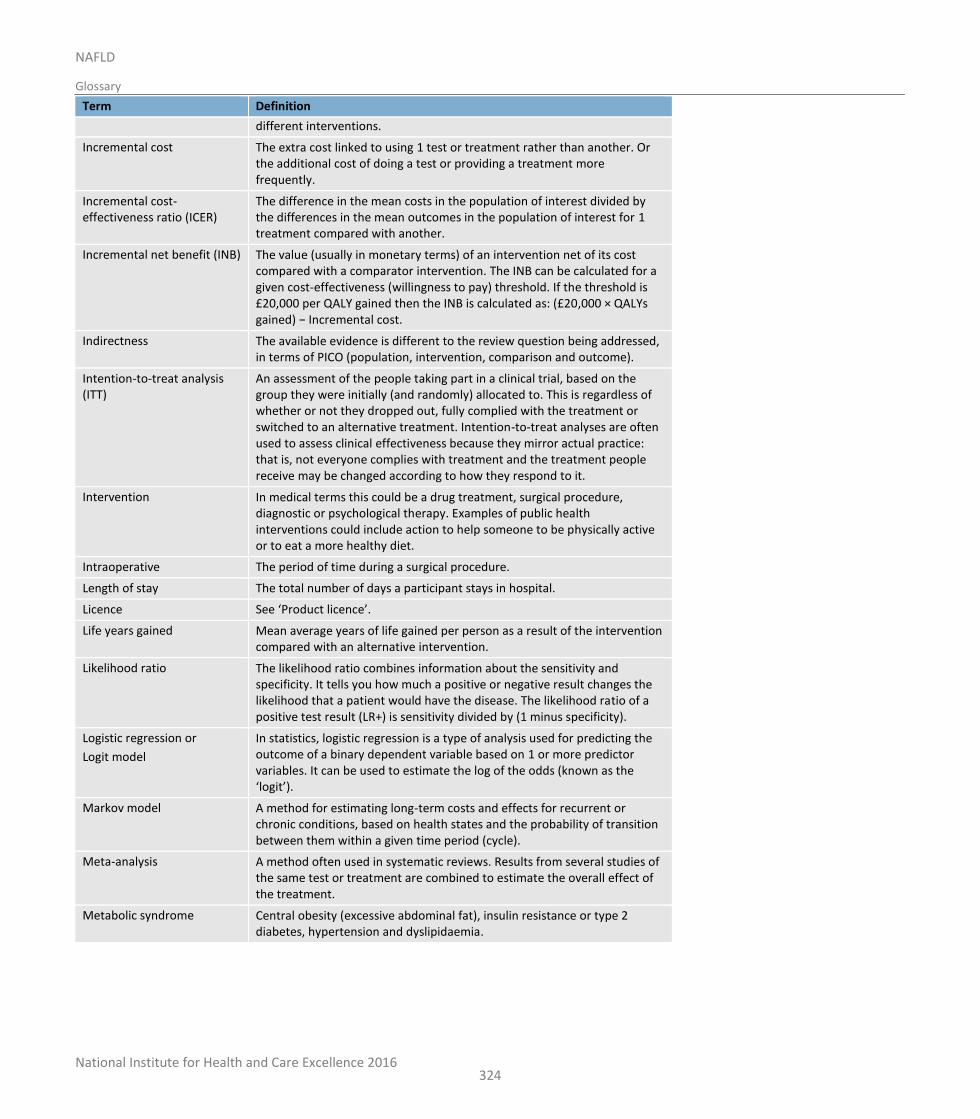
National Institute for Health and Care Excellence 2016
NAFLD
Glossary
324
Term Definition
different interventions.
Incremental cost The extra cost linked to using 1 test or treatment rather than another. Or the additional cost of doing a test or providing a treatment more frequently.
Incremental cost-effectiveness ratio (ICER)
The difference in the mean costs in the population of interest divided by the differences in the mean outcomes in the population of interest for 1 treatment compared with another.
Incremental net benefit (INB) The value (usually in monetary terms) of an intervention net of its cost compared with a comparator intervention. The INB can be calculated for a given cost-effectiveness (willingness to pay) threshold. If the threshold is £20,000 per QALY gained then the INB is calculated as: (£20,000 × QALYs gained) − Incremental cost.
Indirectness The available evidence is different to the review question being addressed, in terms of PICO (population, intervention, comparison and outcome).
Intention-to-treat analysis (ITT)
An assessment of the people taking part in a clinical trial, based on the group they were initially (and randomly) allocated to. This is regardless of whether or not they dropped out, fully complied with the treatment or switched to an alternative treatment. Intention-to-treat analyses are often used to assess clinical effectiveness because they mirror actual practice: that is, not everyone complies with treatment and the treatment people receive may be changed according to how they respond to it.
Intervention In medical terms this could be a drug treatment, surgical procedure, diagnostic or psychological therapy. Examples of public health interventions could include action to help someone to be physically active or to eat a more healthy diet.
Intraoperative The period of time during a surgical procedure.
Length of stay The total number of days a participant stays in hospital.
Licence See ‘Product licence’.
Life years gained Mean average years of life gained per person as a result of the intervention compared with an alternative intervention.
Likelihood ratio The likelihood ratio combines information about the sensitivity and specificity. It tells you how much a positive or negative result changes the likelihood that a patient would have the disease. The likelihood ratio of a positive test result (LR+) is sensitivity divided by (1 minus specificity).
Logistic regression or
Logit model
In statistics, logistic regression is a type of analysis used for predicting the outcome of a binary dependent variable based on 1 or more predictor variables. It can be used to estimate the log of the odds (known as the ‘logit’).
Markov model A method for estimating long-term costs and effects for recurrent or chronic conditions, based on health states and the probability of transition between them within a given time period (cycle).
Meta-analysis A method often used in systematic reviews. Results from several studies of the same test or treatment are combined to estimate the overall effect of the treatment.
Metabolic syndrome Central obesity (excessive abdominal fat), insulin resistance or type 2 diabetes, hypertension and dyslipidaemia.
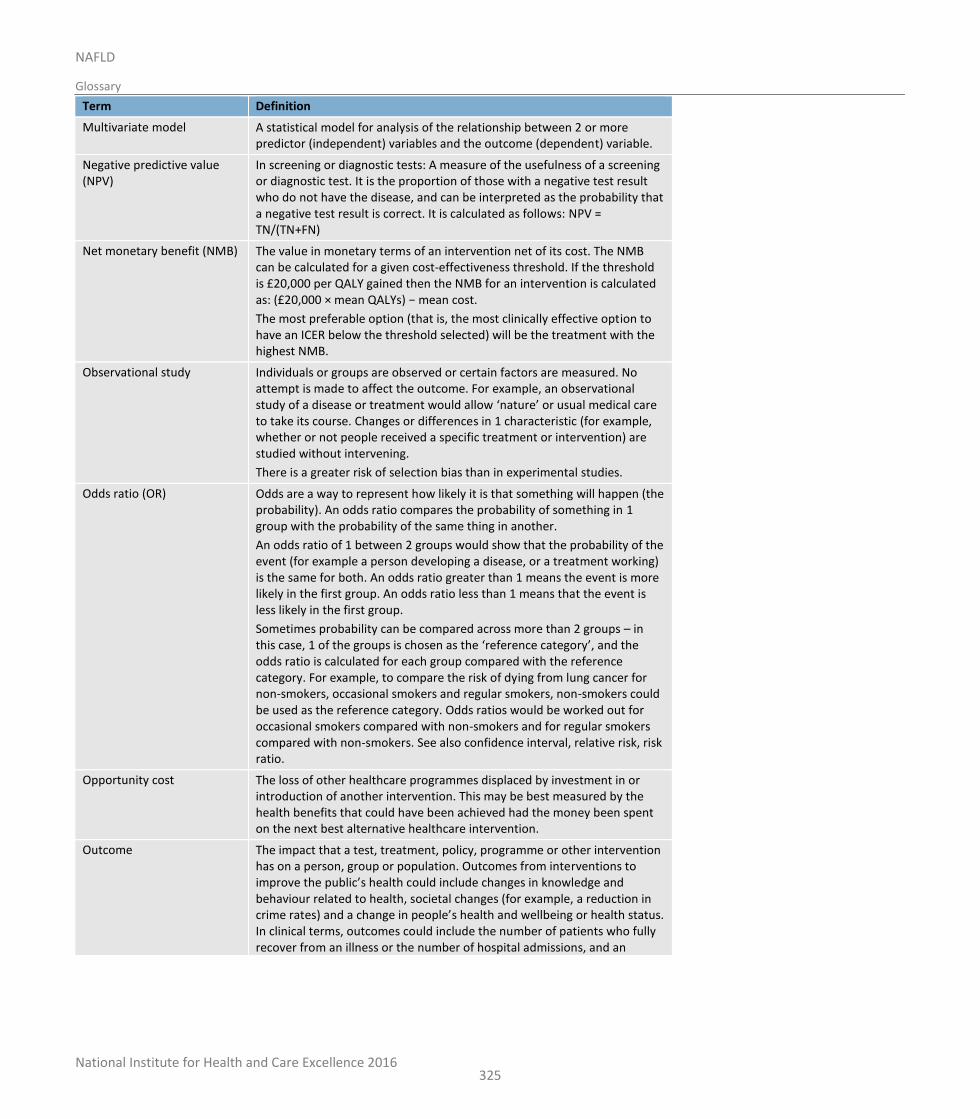
National Institute for Health and Care Excellence 2016
NAFLD
Glossary
325
Term Definition
Multivariate model A statistical model for analysis of the relationship between 2 or more predictor (independent) variables and the outcome (dependent) variable.
Negative predictive value (NPV)
In screening or diagnostic tests: A measure of the usefulness of a screening or diagnostic test. It is the proportion of those with a negative test result who do not have the disease, and can be interpreted as the probability that a negative test result is correct. It is calculated as follows: NPV = TN/(TN+FN)
Net monetary benefit (NMB) The value in monetary terms of an intervention net of its cost. The NMB can be calculated for a given cost-effectiveness threshold. If the threshold is £20,000 per QALY gained then the NMB for an intervention is calculated as: (£20,000 × mean QALYs) − mean cost.
The most preferable option (that is, the most clinically effective option to have an ICER below the threshold selected) will be the treatment with the highest NMB.
Observational study Individuals or groups are observed or certain factors are measured. No attempt is made to affect the outcome. For example, an observational study of a disease or treatment would allow ‘nature’ or usual medical care to take its course. Changes or differences in 1 characteristic (for example, whether or not people received a specific treatment or intervention) are studied without intervening.
There is a greater risk of selection bias than in experimental studies.
Odds ratio (OR) Odds are a way to represent how likely it is that something will happen (the probability). An odds ratio compares the probability of something in 1 group with the probability of the same thing in another.
An odds ratio of 1 between 2 groups would show that the probability of the event (for example a person developing a disease, or a treatment working) is the same for both. An odds ratio greater than 1 means the event is more likely in the first group. An odds ratio less than 1 means that the event is less likely in the first group.
Sometimes probability can be compared across more than 2 groups – in this case, 1 of the groups is chosen as the ‘reference category’, and the odds ratio is calculated for each group compared with the reference category. For example, to compare the risk of dying from lung cancer for non-smokers, occasional smokers and regular smokers, non-smokers could be used as the reference category. Odds ratios would be worked out for occasional smokers compared with non-smokers and for regular smokers compared with non-smokers. See also confidence interval, relative risk, risk ratio.
Opportunity cost The loss of other healthcare programmes displaced by investment in or introduction of another intervention. This may be best measured by the health benefits that could have been achieved had the money been spent on the next best alternative healthcare intervention.
Outcome The impact that a test, treatment, policy, programme or other intervention has on a person, group or population. Outcomes from interventions to improve the public’s health could include changes in knowledge and behaviour related to health, societal changes (for example, a reduction in crime rates) and a change in people’s health and wellbeing or health status. In clinical terms, outcomes could include the number of patients who fully recover from an illness or the number of hospital admissions, and an
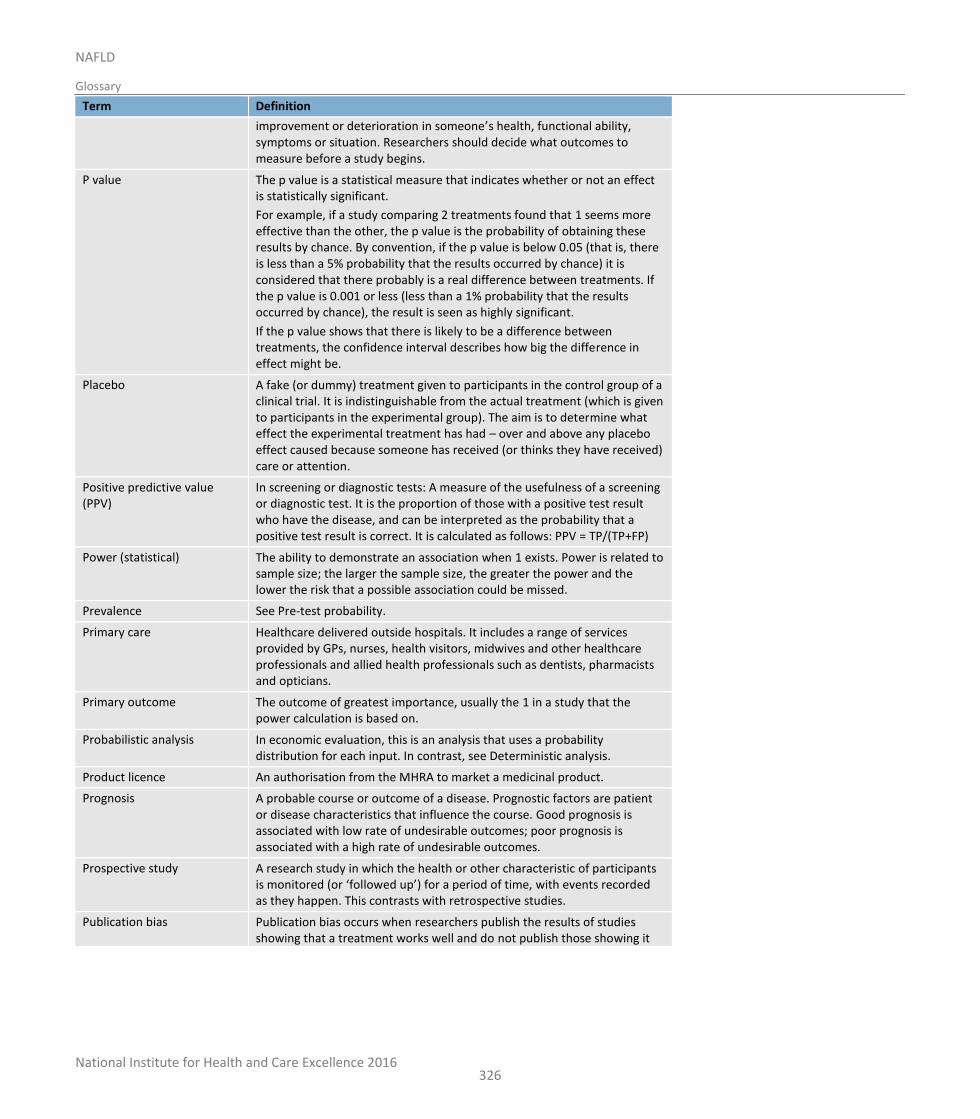
National Institute for Health and Care Excellence 2016
NAFLD
Glossary
326
Term Definition
improvement or deterioration in someone’s health, functional ability, symptoms or situation. Researchers should decide what outcomes to measure before a study begins.
P value The p value is a statistical measure that indicates whether or not an effect is statistically significant.
For example, if a study comparing 2 treatments found that 1 seems more effective than the other, the p value is the probability of obtaining these results by chance. By convention, if the p value is below 0.05 (that is, there is less than a 5% probability that the results occurred by chance) it is considered that there probably is a real difference between treatments. If the p value is 0.001 or less (less than a 1% probability that the results occurred by chance), the result is seen as highly significant.
If the p value shows that there is likely to be a difference between treatments, the confidence interval describes how big the difference in effect might be.
Placebo A fake (or dummy) treatment given to participants in the control group of a clinical trial. It is indistinguishable from the actual treatment (which is given to participants in the experimental group). The aim is to determine what effect the experimental treatment has had – over and above any placebo effect caused because someone has received (or thinks they have received) care or attention.
Positive predictive value (PPV)
In screening or diagnostic tests: A measure of the usefulness of a screening or diagnostic test. It is the proportion of those with a positive test result who have the disease, and can be interpreted as the probability that a positive test result is correct. It is calculated as follows: PPV = TP/(TP+FP)
Power (statistical) The ability to demonstrate an association when 1 exists. Power is related to sample size; the larger the sample size, the greater the power and the lower the risk that a possible association could be missed.
Prevalence See Pre-test probability.
Primary care Healthcare delivered outside hospitals. It includes a range of services provided by GPs, nurses, health visitors, midwives and other healthcare professionals and allied health professionals such as dentists, pharmacists and opticians.
Primary outcome The outcome of greatest importance, usually the 1 in a study that the power calculation is based on.
Probabilistic analysis In economic evaluation, this is an analysis that uses a probability distribution for each input. In contrast, see Deterministic analysis.
Product licence An authorisation from the MHRA to market a medicinal product.
Prognosis A probable course or outcome of a disease. Prognostic factors are patient or disease characteristics that influence the course. Good prognosis is associated with low rate of undesirable outcomes; poor prognosis is associated with a high rate of undesirable outcomes.
Prospective study A research study in which the health or other characteristic of participants is monitored (or ‘followed up’) for a period of time, with events recorded as they happen. This contrasts with retrospective studies.
Publication bias Publication bias occurs when researchers publish the results of studies showing that a treatment works well and do not publish those showing it
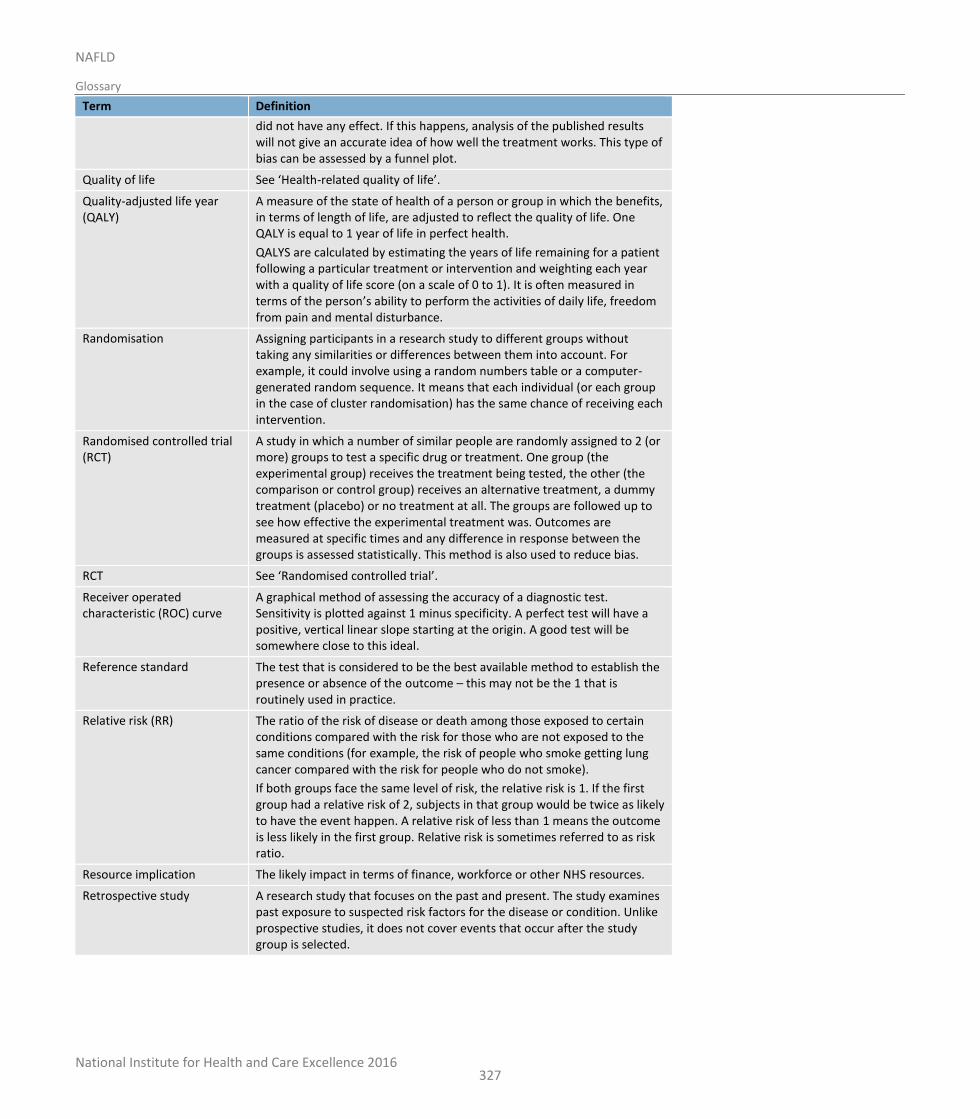
National Institute for Health and Care Excellence 2016
NAFLD
Glossary
327
Term Definition
did not have any effect. If this happens, analysis of the published results will not give an accurate idea of how well the treatment works. This type of bias can be assessed by a funnel plot.
Quality of life See ‘Health-related quality of life’.
Quality-adjusted life year (QALY)
A measure of the state of health of a person or group in which the benefits, in terms of length of life, are adjusted to reflect the quality of life. One QALY is equal to 1 year of life in perfect health.
QALYS are calculated by estimating the years of life remaining for a patient following a particular treatment or intervention and weighting each year with a quality of life score (on a scale of 0 to 1). It is often measured in terms of the person’s ability to perform the activities of daily life, freedom from pain and mental disturbance.
Randomisation Assigning participants in a research study to different groups without taking any similarities or differences between them into account. For example, it could involve using a random numbers table or a computer-generated random sequence. It means that each individual (or each group in the case of cluster randomisation) has the same chance of receiving each intervention.
Randomised controlled trial (RCT)
A study in which a number of similar people are randomly assigned to 2 (or more) groups to test a specific drug or treatment. One group (the experimental group) receives the treatment being tested, the other (the comparison or control group) receives an alternative treatment, a dummy treatment (placebo) or no treatment at all. The groups are followed up to see how effective the experimental treatment was. Outcomes are measured at specific times and any difference in response between the groups is assessed statistically. This method is also used to reduce bias.
RCT See ‘Randomised controlled trial’.
Receiver operated characteristic (ROC) curve
A graphical method of assessing the accuracy of a diagnostic test. Sensitivity is plotted against 1 minus specificity. A perfect test will have a positive, vertical linear slope starting at the origin. A good test will be somewhere close to this ideal.
Reference standard The test that is considered to be the best available method to establish the presence or absence of the outcome – this may not be the 1 that is routinely used in practice.
Relative risk (RR) The ratio of the risk of disease or death among those exposed to certain conditions compared with the risk for those who are not exposed to the same conditions (for example, the risk of people who smoke getting lung cancer compared with the risk for people who do not smoke).
If both groups face the same level of risk, the relative risk is 1. If the first group had a relative risk of 2, subjects in that group would be twice as likely to have the event happen. A relative risk of less than 1 means the outcome is less likely in the first group. Relative risk is sometimes referred to as risk ratio.
Resource implication The likely impact in terms of finance, workforce or other NHS resources.
Retrospective study A research study that focuses on the past and present. The study examines past exposure to suspected risk factors for the disease or condition. Unlike prospective studies, it does not cover events that occur after the study group is selected.
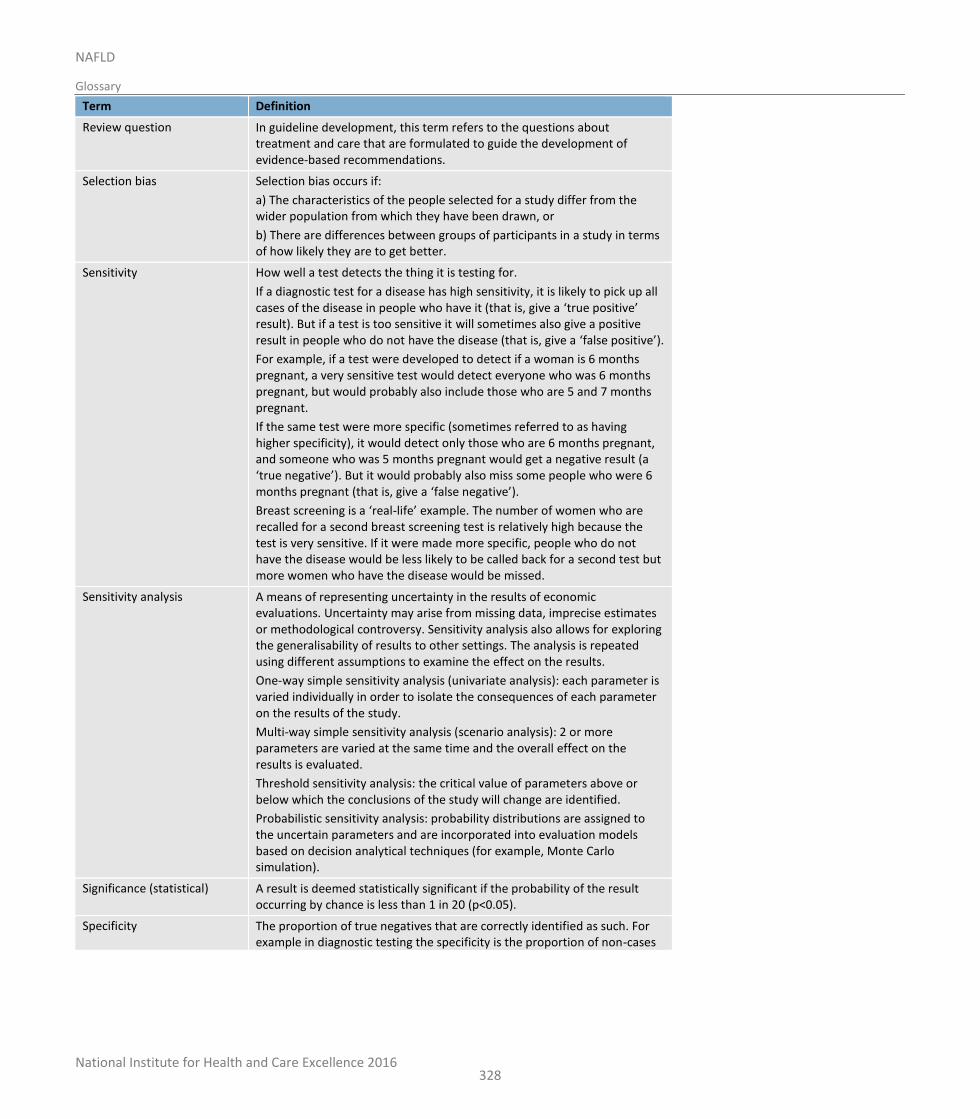
National Institute for Health and Care Excellence 2016
NAFLD
Glossary
328
Term Definition
Review question In guideline development, this term refers to the questions about treatment and care that are formulated to guide the development of evidence-based recommendations.
Selection bias Selection bias occurs if:
a) The characteristics of the people selected for a study differ from the wider population from which they have been drawn, or
b) There are differences between groups of participants in a study in terms of how likely they are to get better.
Sensitivity How well a test detects the thing it is testing for.
If a diagnostic test for a disease has high sensitivity, it is likely to pick up all cases of the disease in people who have it (that is, give a ‘true positive’ result). But if a test is too sensitive it will sometimes also give a positive result in people who do not have the disease (that is, give a ‘false positive’).
For example, if a test were developed to detect if a woman is 6 months pregnant, a very sensitive test would detect everyone who was 6 months pregnant, but would probably also include those who are 5 and 7 months pregnant.
If the same test were more specific (sometimes referred to as having higher specificity), it would detect only those who are 6 months pregnant, and someone who was 5 months pregnant would get a negative result (a ‘true negative’). But it would probably also miss some people who were 6 months pregnant (that is, give a ‘false negative’).
Breast screening is a ‘real-life’ example. The number of women who are recalled for a second breast screening test is relatively high because the test is very sensitive. If it were made more specific, people who do not have the disease would be less likely to be called back for a second test but more women who have the disease would be missed.
Sensitivity analysis A means of representing uncertainty in the results of economic evaluations. Uncertainty may arise from missing data, imprecise estimates or methodological controversy. Sensitivity analysis also allows for exploring the generalisability of results to other settings. The analysis is repeated using different assumptions to examine the effect on the results.
One-way simple sensitivity analysis (univariate analysis): each parameter is varied individually in order to isolate the consequences of each parameter on the results of the study.
Multi-way simple sensitivity analysis (scenario analysis): 2 or more parameters are varied at the same time and the overall effect on the results is evaluated.
Threshold sensitivity analysis: the critical value of parameters above or below which the conclusions of the study will change are identified.
Probabilistic sensitivity analysis: probability distributions are assigned to the uncertain parameters and are incorporated into evaluation models based on decision analytical techniques (for example, Monte Carlo simulation).
Significance (statistical) A result is deemed statistically significant if the probability of the result occurring by chance is less than 1 in 20 (p<0.05).
Specificity The proportion of true negatives that are correctly identified as such. For example in diagnostic testing the specificity is the proportion of non-cases
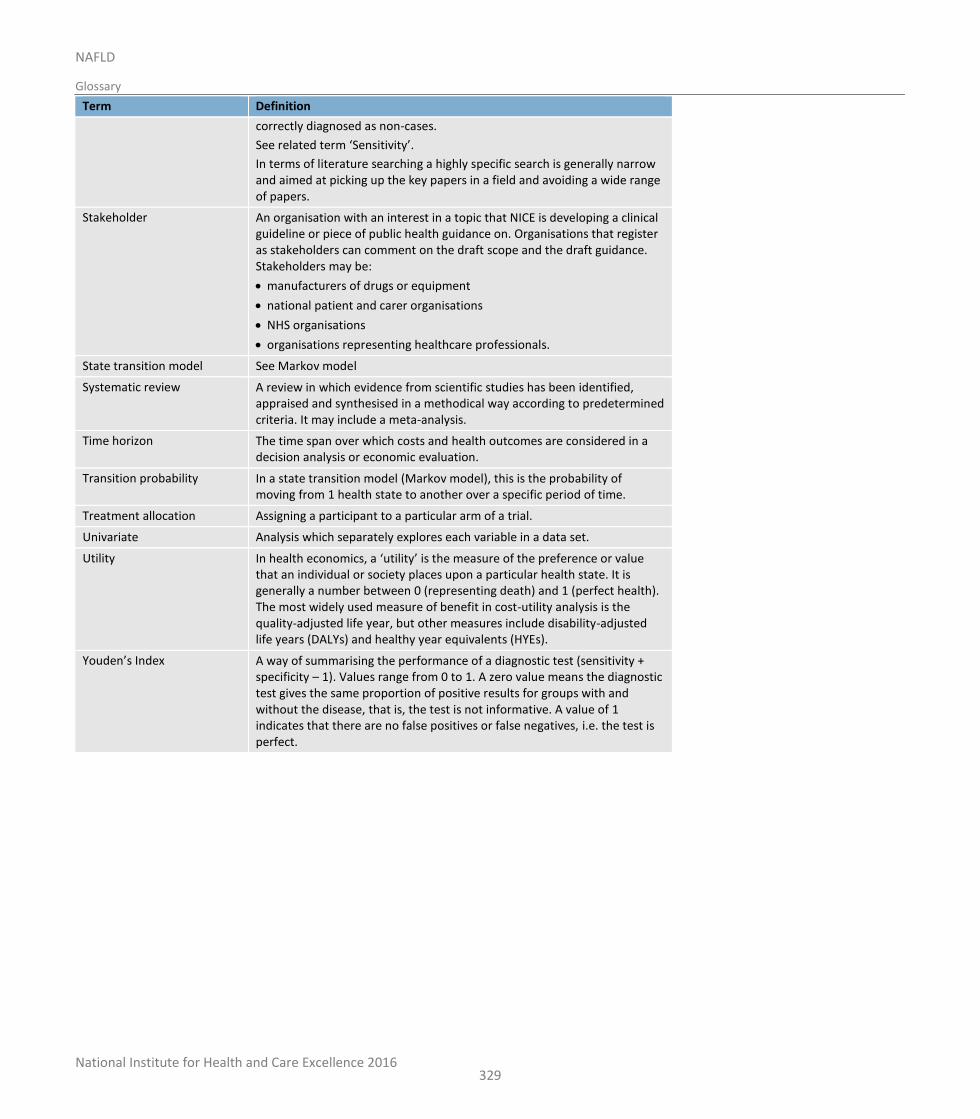
National Institute for Health and Care Excellence 2016
NAFLD
Glossary
329
Term Definition
correctly diagnosed as non-cases.
See related term ‘Sensitivity’.
In terms of literature searching a highly specific search is generally narrow and aimed at picking up the key papers in a field and avoiding a wide range of papers.
Stakeholder An organisation with an interest in a topic that NICE is developing a clinical guideline or piece of public health guidance on. Organisations that register as stakeholders can comment on the draft scope and the draft guidance. Stakeholders may be:
manufacturers of drugs or equipment
national patient and carer organisations
NHS organisations
organisations representing healthcare professionals.
State transition model See Markov model
Systematic review A review in which evidence from scientific studies has been identified, appraised and synthesised in a methodical way according to predetermined criteria. It may include a meta-analysis.
Time horizon The time span over which costs and health outcomes are considered in a decision analysis or economic evaluation.
Transition probability In a state transition model (Markov model), this is the probability of moving from 1 health state to another over a specific period of time.
Treatment allocation Assigning a participant to a particular arm of a trial.
Univariate Analysis which separately explores each variable in a data set.
Utility In health economics, a ‘utility’ is the measure of the preference or value that an individual or society places upon a particular health state. It is generally a number between 0 (representing death) and 1 (perfect health). The most widely used measure of benefit in cost-utility analysis is the quality-adjusted life year, but other measures include disability-adjusted life years (DALYs) and healthy year equivalents (HYEs).
Youden’s Index A way of summarising the performance of a diagnostic test (sensitivity + specificity – 1). Values range from 0 to 1. A zero value means the diagnostic test gives the same proportion of positive results for groups with and without the disease, that is, the test is not informative. A value of 1 indicates that there are no false positives or false negatives, i.e. the test is perfect.

National Institute for Health and Care Excellence 2016
NAFLD
Glossary
330

National Institute for Health and Care Excellence 2016
NAFLD
Reference list
331
20 Reference list
1 Review Manager (RevMan) [Computer program]. Version 5. Copenhagen. The Nordic Cochrane Centre, The Cochrane Collaboration, 2015. Available from: http://tech.cochrane.org/Revman
2 WinBUGS [Computer programme] version 1.4. Cambridge. MRC Biostatistics Unit, University of Cambridge, 2015. Available from: http://www.mrc-bsu.cam.ac.uk/software/bugs/the-bugs-project-winbugs/
3 Adams LA, George J, Bugianesi E, Rossi E, De Boer WB, van der Poorten D et al. Complex non-invasive fibrosis models are more accurate than simple models in non-alcoholic fatty liver disease. Journal of Gastroenterology and Hepatology. 2011; 26(10):1536-1543
4 Adams LA, Sanderson S, Lindor KD, Angulo P. The histological course of nonalcoholic fatty liver disease: a longitudinal study of 103 patients with sequential liver biopsies. Journal of Hepatology. 2005; 42:132-138
5 Aida Y, Abe H, Tomita Y, Nagano T, Seki N, Sugita T et al. Serum cytokeratin 18 fragment level as a noninvasive biomarker for non-alcoholic fatty liver disease. International Journal of Clinical and Experimental Medicine. 2014; 7(11):4191-4198
6 Aithal GP, Thomas JA, Kaye PV, Lawson A, Ryder SD, Spendlove I et al. Randomized, placebo-controlled trial of pioglitazone in nondiabetic subjects with nonalcoholic steatohepatitis. Gastroenterology. 2008; 135(4):1176-1184
7 Akcam M, Boyaci A, Pirgon O, Kaya S, Uysal S, Dundar BN. Therapeutic effect of metformin and vitamin E versus prescriptive diet in obese adolescents with fatty liver. International Journal for Vitamin and Nutrition Research. 2011; 81(6):398-406
8 Al-Jiffri O, Al-Sharif FM, Abd El-Kader SM, Ashmawy EM. Weight reduction improves markers of hepatic function and insulin resistance in type-2 diabetic patients with non-alcoholic fatty liver. African Health Sciences. 2013; 13(3):667-672
9 Alisi A, Bedogni G, Baviera G, Giorgio V, Porro E, Paris C et al. Randomised clinical trial: The beneficial effects of VSL#3 in obese children with non-alcoholic steatohepatitis. Alimentary Pharmacology and Therapeutics. 2014; 39(11):1276-1285
10 Aller R, de Luis DA, Izaola O, Conde R, Gonzalez Sagrado M, Primo D et al. Effect of a probiotic on liver aminotransferases in nonalcoholic fatty liver disease patients: a double blind randomized clinical trial. European Review for Medical and Pharmacological Sciences. 2011; 15(9):1090-1095
11 Angulo P, George J, Day CP, Vanni E, Russell L, De la Cruz AC et al. Serum ferritin levels lack diagnostic accuracy for liver fibrosis in patients with nonalcoholic fatty liver disease. Clinical Gastroenterology and Hepatology. 2014; 12(7):1163
12 Angulo P, Hui JM, Marchesini G, Bugianesi E, George J, Farrell GC et al. The NAFLD fibrosis score: A noninvasive system that identifies liver fibrosis in patients with NAFLD. Hepatology. 2007; 45(4):846-854
13 Angulo P, Kleiner DE, Dam-Larsen S, Adams LA, Bjornsson ES, Charatcharoenwitthaya P et al. Liver fibrosis, but no other histologic features, is associated with long-term outcomes of patients with nonalcoholic fatty liver disease. Gastroenterology. 2015; 149(2):389-397
14 Argo CK, Patrie JT, Lackner C, Henry TD, De Lange EE, Weltman AL et al. Effects of n-3 fish oil on metabolic and histological parameters in NASH: A double-blind, randomized, placebo-controlled trial. Journal of Hepatology. 2015; 62(1):190-197
National Institute for Health and Care Excellence 2016
NAFLD
Reference list
332
15 Bae JC, Rhee EJ, Lee WY, Park SE, Park CY, Oh KW et al. Combined effect of nonalcoholic fatty liver disease and impaired fasting glucose on the development of type 2 diabetes: A 4-year retrospective longitudinal study. Diabetes Care. 2011; 34(3):727-729
16 Balmer ML, Siegrist K, Zimmermann A, Dufour JF. Effects of ursodeoxycholic acid in combination with vitamin E on adipokines and apoptosis in patients with nonalcoholic steatohepatitis. Liver International. 2009; 29(8):1184-1188
17 Belfort R, Harrison SA, Brown K, Darland C, Finch J, Hardies J et al. A placebo-controlled trial of pioglitazone in subjects with nonalcoholic steatohepatitis. New England Journal of Medicine. 2006; 355(22):2297-2307
18 Bell LN, Wang J, Muralidharan S, Chalasani S, Fullenkamp AM, Wilson LA et al. Relationship between adipose tissue insulin resistance and liver histology in nonalcoholic steatohepatitis: a pioglitazone versus vitamin E versus placebo for the treatment of nondiabetic patients with nonalcoholic steatohepatitis trial follow-up study. Hepatology. 2012; 56(4):1311-1318
19 Borman MA, Ladak F, Crotty P, Pollett A, Kirsch R, Pomier-Layrargues G et al. The Fatty Liver Index has limited utility for the detection and quantification of hepatic steatosis in obese patients. Hepatology International. 2013; 7(2):592-599
20 Browning JD, Szczepaniak LS, Dobbins R, Nuremberg P, Horton JD, Cohen JC et al. Prevalence of hepatic steatosis in an urban population in the United States: impact of ethnicity. Hepatology (Baltimore, Md ). 2004; 40(6):1387-1395
21 Bugianesi E, Gentilcore E, Manini R, Natale S, Vanni E, Villanova N et al. A randomized controlled trial of metformin versus vitamin E or prescriptive diet in nonalcoholic fatty liver disease. American Journal of Gastroenterology. 2005; 100(5):1082-1090
22 Catalano D, Martines GF, Tonzuso A, Pirri C, Trovato FM, Trovato GM. Protective role of coffee in non-alcoholic fatty liver disease (NAFLD). Digestive Diseases and Sciences. 2010; 55(11):3200-3206
23 Chan WK, Ida NH, Cheah PL, Goh KL. Progression of liver disease in non-alcoholic fatty liver disease: a prospective clinicopathological follow-up study. Journal of Digestive Diseases. 2014; 15:545-552
24 Chan W-K, Sthaneshwar P, Mustapha NRN, Mahadeva S. Limited utility of plasma M30 in discriminating non-alcoholic steatohepatitis from steatosis - A comparison with routine biochemical markers. PLoS One. 2014; 9(9)
25 Chang Y, Jung H-S, Yun KE, Cho J, Cho YK, Ryu S. Cohort study of non-alcoholic fatty liver disease, nafld fibrosis score, and the risk of incident diabetes in a korean population. American Journal of Gastroenterology. 2013; 108(12):1861-1868
26 Chang Y, Ryu S, Sung E, Woo H-Y, Oh E, Cha K et al. Nonalcoholic fatty liver disease predicts chronic kidney disease in nonhypertensive and nondiabetic Korean men. Metabolism: Clinical and Experimental. 2008; 57(4):569-576
27 Chen SM, Liu CY, Li SR, Huang HT, Tsai CY, Jou HJ. Effects of therapeutic lifestyle program on ultrasound-diagnosed nonalcoholic fatty liver disease. Journal of the Chinese Medical Association. 2008; 71(11):551-558
28 Chiang HJ, Lin LH, Li CW, Lin CC, Chiang HW, Huang TL et al. Magnetic resonance fat quantification in living donor liver transplantation. Transplantation Proceedings. 2014; 46(3):666-668
29 Chon YE, Jung KS, Kim SU, Park JY, Park YN, Kim DY et al. Controlled attenuation parameter (CAP) for detection of hepatic steatosis in patients with chronic liver diseases: a prospective study of a native Korean population. Liver International. 2014; 34(1):102-109
30 Cichoz-Lach H, Celinski K, Prozorow-Krol B, Swatek J, Slomka M, Lach T. The BARD score and the NAFLD fibrosis score in the assessment of advanced liver fibrosis in nonalcoholic fatty liver disease. Medical Science Monitor. 2012; 18(12):CR735-CR740
National Institute for Health and Care Excellence 2016
NAFLD
Reference list
333
31 Crossan C, Tsochatzis EA, Longworth L, Gurusamy K, Davidson B, Rodriguez-Peralvarez M et al. Cost-effectiveness of non-invasive methods for assessment and monitoring of liver fibrosis and cirrhosis in patients with chronic liver disease: systematic review and economic evaluation. Health Technology Assessment (Winchester, England). 2015; 19(9):1-410
32 Cui J, Ang B, Haufe W, Hernandez C, Verna EC, Sirlin CB et al. Comparative diagnostic accuracy of magnetic resonance elastography vs. eight clinical prediction rules for non-invasive diagnosis of advanced fibrosis in biopsy-proven non-alcoholic fatty liver disease: a prospective study. Alimentary Pharmacology and Therapeutics. 2015; 41(12):1271-1280
33 Cusi K, Chang Z, Harrison S, Lomonaco R, Bril F, Orsak B et al. Limited value of plasma cytokeratin-18 as a biomarker for NASH and fibrosis in patients with non-alcoholic fatty liver disease. Journal of Hepatology. 2014; 60(1):167-174
34 Dasarathy S, Dasarathy J, Khiyami A, Joseph R, Lopez R, McCullough AJ. Validity of real time ultrasound in the diagnosis of hepatic steatosis: a prospective study. Journal of Hepatology. 2009; 51(6):1061-1067
35 de Ledinghen V, Vergniol J, Foucher J, Merrouche W, Le Bail B. Non-invasive diagnosis of liver steatosis using controlled attenuation parameter (CAP) and transient elastography. Liver International. 2012; 32(6):911-918
36 de Marco R, Locatelli F, Zoppini G, Verlato G, Bonora E, Muggeo M. Cause-specific mortality in type 2 diabetes. The Verona Diabetes Study. Diabetes Care. 1999; 22(5):756-761
37 de Moura Almeida A, Cotrim HP, Barbosa DBV, de Athayde LGM, Santos AS, Bitencourt AGV et al. Fatty liver disease in severe obese patients: diagnostic value of abdominal ultrasound. World Journal of Gastroenterology. 2008; 14(9):1415-1418
38 Demir M, Lang S, Schlattjan M, Drebber U, Wedemeyer I, Nierhoff D et al. NIKEI: A New Inexpensive and Non-Invasive Scoring System to Exclude Advanced Fibrosis in Patients with NAFLD. PLoS One. 2013; 8(3)
39 Dufour JF, Oneta CM, Gonvers JJ, Bihl F, Cerny A, Cereda JM et al. Randomized placebo-controlled trial of ursodeoxycholic acid with vitamin e in nonalcoholic steatohepatitis. Clinical Gastroenterology and Hepatology. 2006; 4(12):1537-1543
40 Dvorak K, Stritesky J, Petrtyl J, Vitek L, Sroubkova R, Lenicek M et al. Use of non-invasive parameters of non-alcoholic steatohepatitis and liver fibrosis in daily practice - An exploratory case-control study. PLoS One. 2014; 9(10)
41 Eckard C, Cole R, Lockwood J, Torres DM, Williams CD, Shaw JC et al. Prospective histopathologic evaluation of lifestyle modification in nonalcoholic fatty liver disease: a randomized trial. Therapeutic Advances in Gastroenterology. 2013; 6(4):249-259
42 Ekstedt M, Franzen LE, Holmqvist M, Bendtsen P, Mathiesen UL, Bodemar G et al. Alcohol consumption is associated with progression of hepatic fibrosis in non-alcoholic fatty liver disease. Scandinavian Journal of Gastroenterology. 2009; 44(3):366-374
43 Ekstedt M, Franzen LE, Mathiesen UL, Kechagias S. Low clinical relevance of the nonalcoholic fatty liver disease activity score (NAS) in predicting fibrosis progression. Scandinavian Journal of Gastroenterology. 2012; 47:108-115
44 Ekstedt M, Hagstrom H, Nasr P, Fredrikson M, Stal P, Kechagias S et al. Fibrosis stage is the strongest predictor for disease-specific mortality in NAFLD after up to 33 years of follow-up. Hepatology (Baltimore, Md ). 2014;
45 El Azeem HA, Khalek ESA, El-Akabawy H, Naeim H, Khalik HA, Alfifi AA. Association between nonalcoholic fatty liver disease and the incidence of cardiovascular and renal events. Journal of the Saudi Heart Association. 2013; 25(4):239-246
46 Eslamparast T, Poustchi H, Zamani F, Sharafkhah M, Malekzadeh R, Hekmatdoost A. Synbiotic supplementation in nonalcoholic fatty liver disease: a randomized, double-blind, placebo-controlled pilot study. American Journal of Clinical Nutrition. 2014; 99(3):535-542
National Institute for Health and Care Excellence 2016
NAFLD
Reference list
334
47 Evans CD, Oien KA, MacSween RN, Mills PR. Non-alcoholic steatohepatitis: a common cause of progressive chronic liver injury? Journal of Clinical Pathology. 2002; 55:689-692
48 Fassio E, Alvarez E, Dominguez N, Landeira G, Longo C. Natural history of nonalcoholic steatohepatitis: a longitudinal study of repeat liver biopsies. Hepatology. 2004; 40(4):820-826
49 Fedchuk L, Nascimbeni F, Pais R, Charlotte F, Housset C, Ratziu V et al. Performance and limitations of steatosis biomarkers in patients with nonalcoholic fatty liver disease. Alimentary Pharmacology and Therapeutics. 2014; 40(10):1209-1222
50 Feldstein AE, Alkhouri N, De VR, Alisi A, Lopez R, Nobili V. Serum cytokeratin-18 fragment levels are useful biomarkers for nonalcoholic steatohepatitis in children. American Journal of Gastroenterology. 2013; 108(9):1526-1531
51 Feldstein AE, Papouchado BG, Angulo P, Sanderson S, Adams L, Gores GJ. Hepatic stellate cells and fibrosis progression in patients with nonalcoholic fatty liver disease. Clinical Gastroenterology and Hepatology. 2005; 3:384-389
52 Feldstein AE, Wieckowska A, Lopez AR, Liu Y-C, Zein NN, McCullough AJ. Cytokeratin-18 fragment levels as noninvasive biomarkers for nonalcoholic steatohepatitis: A multicenter validation study. Hepatology. 2009; 50(4):1072-1078
53 Ferraioli G, Tinelli C, Lissandrin R, Zicchetti M, Dal Bello B, Filice G et al. Controlled attenuation parameter for evaluating liver steatosis in chronic viral hepatitis. World Journal of Gastroenterology. 2014; 20(21):6626-6631
54 Funatsu K, Yamashita T, Nakamura H. Coffee consumption is associated with a lower incidence of fatty liver in middle-aged men. Journal of Health Science. 2011; 57(5):406-413
55 Goh GBB, Pagadala MR, Dasarathy J, Unalp-Arida A, Sargent R, Hawkins C et al. Clinical spectrum of non-alcoholic fatty liver disease in diabetic and non-diabetic patients. BBA Clinical. 2015; 3:141-145
56 GRADE Working Group. The Grading of Recommendations Assessment, Development and Evaluation (GRADE) Working Group website. 2011. Available from: http://www.gradeworkinggroup.org/ [Last accessed: 1 October 2011]
57 Grigorescu M, Crisan D, Radu C, Grigorescu MD, Sparchez Z, Serban A. A novel pathophysiological-based panel of biomarkers for the diagnosis of nonalcoholic steatohepatitis. Journal of Physiology and Pharmacology. 2012; 63(4):347-353
58 Guha IN, Parkes J, Roderick P, Chattopadhyay D, Cross R, Harris S et al. Noninvasive markers of fibrosis in nonalcoholic fatty liver disease: Validating the European liver fibrosis panel and exploring simple markers. Hepatology. 2008; 47(2):455-460
59 Hallsworth K, Fattakhova G, Hollingsworth K, Thoma C, Moore S, Taylor R et al. Resistance exercise improves liver lipid, fat oxidation and glucose control in adults with non-alcoholic fatty liver disease independent of weight loss. Journal of Hepatology. 2011; 54:S337
60 Hallsworth K, Fattakhova G, Hollingsworth KG, Thoma C, Moore S, Day CP et al. Resistance exercise improves liver fat and glucose control in people with non-alcoholic fatty liver disease. Diabetologia. 2011; 54:S246-S247
61 Hallsworth K, Fattakhova G, Hollingsworth KG, Thoma C, Moore S, Taylor R et al. Resistance exercise reduces liver fat and its mediators in non-alcoholic fatty liver disease independent of weight loss. Gut. 2011; 60(9):1278-1283
62 Hamabe A, Uto H, Imamura Y, Kusano K, Mawatari S, Kumagai K et al. Impact of cigarette smoking on onset of nonalcoholic fatty liver disease over a 10-year period. Journal of Gastroenterology. 2011; 46(6):769-778
63 Hamaguchi E, Takamura T, Sakurai M, Mizukoshi E, Zen Y, Takeshita Y et al. Histological course of nonalcoholic fatty liver disease in Japanese patients: tight glycemic control, rather than weight reduction, ameliorates liver fibrosis. Diabetes Care. 2010; 33:284-286
National Institute for Health and Care Excellence 2016
NAFLD
Reference list
335
64 Harrison SA, Fecht W, Brunt EM, Neuschwander-Tetri BA. Orlistat for overweight subjects with nonalcoholic steatohepatitis: A randomized, prospective trial. Hepatology. 2009; 49(1):80-86
65 Harrison SA, Torgerson S, Hayashi PH. The natural history of nonalcoholic fatty liver disease: a clinical histopathological study. American Journal of Gastroenterology. 2003; 98:2042-2047
66 Hashimoto Y, Hamaguchi M, Kojima T, Ohshima Y, Ohbora A, Kato T et al. The modest alcohol consumption reduces the incidence of fatty liver in men: A population-based large-scale cohort study. Journal of Gastroenterology and Hepatology. 2015; 30(3):546-552
67 Haukeland JW, Konopski Z, Eggesbø HB, Volkmann HL, Raschpichler G, Bjøro K et al. Metformin in patients with non-alcoholic fatty liver disease: a randomized, controlled trial. Scandinavian Journal of Gastroenterology. 2009; 44(7):853-860
68 Health and Safety Legislation. The Ionising Radiation (Medical Exposure) Regulations 2000 (Statutory Instrument 2000 No. 1059). 2000. Available from: http://www.legislation.hmso.gov.uk/si/si2000/20001059.htm [Last accessed: 19 November 2015]
69 Hepburn MJ, Vos JA, Fillman EP, Lawitz EJ. The accuracy of the report of hepatic steatosis on ultrasonography in patients infected with hepatitis C in a clinical setting: a retrospective observational study. BMC Gastroenterology. 2005; 5:14
70 HH AK, Henderson J, Vanhoesen K, Ghishan F, Bhattacharyya A. Nonalcoholic fatty liver disease in children: a single center experience. Clinical Gastroenterology and Hepatology. 2008; 6:799-802
71 Huang K-W, Leu H-B, Wang Y-J, Luo J-C, Lin H-C, Lee F-Y et al. Patients with nonalcoholic fatty liver disease have higher risk of colorectal adenoma after negative baseline colonoscopy. Colorectal Disease. 2013; 15(7):830-835
72 Hui AY, Wong VW, Chan HL, Liew CT, Chan JL, Chan FK et al. Histological progression of non-alcoholic fatty liver disease in Chinese patients. Alimentary Pharmacology and Therapeutics. 2005; 21:407-413
73 Imamura Y, Uto H, Hiramine Y, Hosoyamada K, Ijuin S, Yoshifuku S et al. Increasing prevalence of diabetes mellitus in association with fatty liver in a Japanese population. Journal of Gastroenterology. 2014; 49(10):1406-1413
74 Janczyk W, Lebensztejn D, Wierzbicka-Rucinska A, Mazur A, Neuhoff-Murawska J, Matusik P et al. Omega-3 Fatty acids therapy in children with nonalcoholic Fatty liver disease: a randomized controlled trial. Journal of Pediatrics. 2015; 166(6):1358-1363
75 Jenks SJ, Conway BR, Hor TJ, Williamson RM, Mclachlan S, Robertson C et al. Hepatic steatosis and non-alcoholic fatty liver disease are not associated with decline in renal function in people with Type 2 diabetes. Diabetic Medicine. 2014; 31(9):1039-1046
76 Joka D, Wahl K, Moeller S, Schlue J, Vaske B, Bahr MJ et al. Prospective biopsy-controlled evaluation of cell death biomarkers for prediction of liver fibrosis and nonalcoholic steatohepatitis. Hepatology. 2012; 55(2):455-464
77 Jun MJ, Shim JH, Kim SY, Seo N, Kim KM, Lim YS et al. Clinical implications of preoperative and intraoperative liver biopsies for evaluating donor steatosis in living related liver transplantation. Liver Transplantation. 2014; 20(4):437-445
78 Junior WS, Nonino-Borges CB. Clinical predictors of different grades of nonalcoholic fatty liver disease. Obesity Surgery. 2012; 22(2):248-252
79 Kasturiratne A, Weerasinghe S, Dassanayake AS, Rajindrajith S, de Silva AP, Kato N et al. Influence of non-alcoholic fatty liver disease on the development of diabetes mellitus. Journal of Gastroenterology and Hepatology. 2013; 28(1):142-147
80 Kawamura Y, Saitoh S, Arase Y, Ikeda K, Fukushima T, Hara T et al. Three-dimensional magnetic resonance imaging for stringent diagnosis of advanced fibrosis associated with nonalcoholic steatohepatitis. Hepatology International. 2013; 7(3):850-858
National Institute for Health and Care Excellence 2016
NAFLD
Reference list
336
81 Khosravi S, Alavian SM, Zare A, Fereshtehnejad S-M, Daryani NE, Keramati MR et al. Non-alcoholic fatty liver disease and correlation of serum alanin aminotransferase level with histopathologic findings. Hepatitis Monthly. 2011; 11(6):452-458
82 Kim CH, Park JY, Lee KU, Kim JH, Kim HK. Fatty liver is an independent risk factor for the development of Type 2 diabetes in Korean adults. Diabetic Medicine. 2008; 25(4):476-481
83 Kim D, Kim WR, Talwalkar JA, Kim HJ, Ehman RL. Advanced fibrosis in nonalcoholic fatty liver disease : Noninvasive assessment with MR elastography. Radiology. 2013; 268(2):411-419
84 Kim NH, Kim JH, Kim YJ, Yoo HJ, Kim HY, Seo JA et al. Clinical and metabolic factors associated with development and regression of nonalcoholic fatty liver disease in nonobese subjects. Liver International. 2014; 34(4):604-611
85 Kim YS, Jung ES, Hur W, Bae SH, Choi JY, Song MJ et al. Noninvasive predictors of nonalcoholic steatohepatitis in Korean patients with histologically proven nonalcoholic fatty liver disease. Clinical and Molecular Hepatology. 2013; 19(2):120-130
86 Kleiner DE, Brunt EM, Van NM, Behling C, Contos MJ, Cummings OW et al. Design and validation of a histological scoring system for nonalcoholic fatty liver disease. Hepatology. 2005; 41(6):1313-1321
87 Koelblinger C, Krssak M, Maresch J, Wrba F, Kaczirek K, Gruenberger T et al. Hepatic steatosis assessment with 1H-spectroscopy and chemical shift imaging at 3.0 T before hepatic surgery: reliable enough for making clinical decisions? European Journal of Radiology. 2012; 81(11):2990-2995
88 Kruger FC, Daniels CR, Kidd M, Swart G, Brundyn K, van RC et al. APRI: A simple bedside marker for advanced fibrosis that can avoid liver biopsy in patients with NAFLD/NASH. South African Medical Journal. 2011; 101(7):477-480
89 Kumar R, Rastogi A, Sharma MK, Bhatia V, Tyagi P, Sharma P et al. Liver stiffness measurements in patients with different stages of nonalcoholic fatty liver disease: Diagnostic performance and clinicopathological correlation. Digestive Diseases and Sciences. 2013; 58(1):265-274
90 Lassailly G, Caiazzo R, Hollebecque A, Buob D, Leteurtre E, Arnalsteen L et al. Validation of noninvasive biomarkers (FibroTest, SteatoTest, and NashTest) for prediction of liver injury in patients with morbid obesity. European Journal of Gastroenterology and Hepatology. 2011; 23(6):499-506
91 Lau K, Lorbeer R, Haring R, Schmidt CO, Wallaschofski H, Nauck M et al. The association between fatty liver disease and blood pressure in a population-based prospective longitudinal study. Journal of Hypertension. 2010; 28(9):1829-1835
92 Lavine JE, Schwimmer JB, Molleston JP, Chalasani NP, Rosenthal P, Murray KF et al. Vitamin E, metformin or placebo for treatment of nonalcoholic fatty liver disease in children. Hepatology. 2010; 52(Suppl S1):374A
93 Lavine JE, Schwimmer JB, Natta ML, Molleston JP, Murray KF, Rosenthal P et al. Effect of vitamin E or metformin for treatment of nonalcoholic fatty liver disease in children and adolescents: the TONIC randomized controlled trial. JAMA. 2011; 305(16):1659-1668
94 Lazo M, Hernaez R, Bonekamp S, Kamel IR, Brancati FL, Guallar E et al. Non-alcoholic fatty liver disease and mortality among US adults: Prospective cohort study. BMJ. 2011; 343(7836):1245
95 Lee JY, Kim KM, Lee SG, Yu E, Lim YS, Lee HC et al. Prevalence and risk factors of non-alcoholic fatty liver disease in potential living liver donors in Korea: a review of 589 consecutive liver biopsies in a single center. Journal of Hepatology. 2007; 47(2):239-244
National Institute for Health and Care Excellence 2016
NAFLD
Reference list
337
96 Lee K. Metabolic syndrome predicts the incidence of hepatic steatosis in Koreans. Obesity Research and Clinical Practice. 2010; 4(3):e217-e224
97 Lee SS, Park SH, Kim HJ, Kim SY, Kim MY, Kim DY et al. Non-invasive assessment of hepatic steatosis: prospective comparison of the accuracy of imaging examinations. Journal of Hepatology. 2010; 52(4):579-585
98 Lee TH, Han SH, Yang JD, Kim D, Ahmed M. Prediction of advanced fibrosis in nonalcoholic fatty liver disease: An enhanced model of BARD score. Gut and Liver. 2013; 7(3):323-328
99 Lee YI, Lim Y-S, Park HS. Colorectal neoplasms in relation to non-alcoholic fatty liver disease in Korean women: A retrospective cohort study. Journal of Gastroenterology and Hepatology. 2012; 27(1):91-95
100 Lee Y-M, Sutedja DS, Wai C-T, Dan Y-Y, Aung M-O, Zhou L et al. A randomized controlled pilot study of Pentoxifylline in patients with non-alcoholic steatohepatitis (NASH). Hepatology International. 2008; 2(2):196-201
101 Leuschner UF, Lindenthal B, Herrmann G, Arnold JC, Rössle M, Cordes HJ et al. High-dose ursodeoxycholic acid therapy for nonalcoholic steatohepatitis: a double-blind, randomized, placebo-controlled trial. Hepatology. 2010; 52(2):472-479
102 Lindor KD, Kowdley KV, Heathcote EJ, Harrison ME, Jorgensen R, Angulo P et al. Ursodeoxycholic acid for treatment of nonalcoholic steatohepatitis: results of a randomized trial. Hepatology. 2004; 39(3):770-778
103 Loomba R, Wolfson T, Ang B, Hooker J, Behling C, Peterson M et al. Magnetic resonance elastography predicts advanced fibrosis in patients with nonalcoholic fatty liver disease: a prospective study. Hepatology. 2014; 60(6):1920-1928
104 Lupsor M, Badea R, Stefanescu H, Grigorescu M, Serban A, Radu C et al. Performance of unidimensional transient elastography in staging non-alcoholic steatohepatitis. Journal of Gastrointestinal and Liver Diseases. 2010; 19(1):53-60
105 Lupsor-Platon M, Feier D, Stefanescu H, Tamas A, Botan E, Sparchez Z et al. Diagnostic accuracy of controlled attenuation parameter measured by transient elastography for the non-invasive assessment of liver steatosis: a prospective study. Journal of Gastrointestinal and Liver Diseases. 2015; 24(1):35-42
106 Mahadeva S, Mahfudz AS, Vijayanathan A, Goh K-L, Kulenthran A, Cheah P-L. Performance of transient elastography (TE) and factors associated with discordance in non-alcoholic fatty liver disease. Journal of Digestive Diseases. 2013; 14(11):604-610
107 Mahady SE, Wong G, Craig JC, George J. Pioglitazone and vitamin E for nonalcoholic steatohepatitis: a cost utility analysis. Hepatology. 2012; 56(6):2172-2179
108 Malik R, Chang M, Bhaskar K, Nasser I, Curry M, Schuppan D et al. The clinical utility of biomarkers and the nonalcoholic steatohepatitis CRN liver biopsy scoring system in patients with nonalcoholic fatty liver disease. Journal of Gastroenterology and Hepatology. 2009; 24(4):564-568
109 Manousou P, Kalambokis G, Grillo F, Watkins J, Xirouchakis E, Pleguezuelo M et al. Serum ferritin is a discriminant marker for both fibrosis and inflammation in histologically proven non-alcoholic fatty liver disease patients. Liver International : Official Journal of the International Association for the Study of the Liver. 2011; 31(5):730-739
110 Marsman HA, van der Pool AE, Verheij J, Padmos J, Ten Kate FJW, Dwarkasing RS et al. Hepatic steatosis assessment with CT or MRI in patients with colorectal liver metastases after neoadjuvant chemotherapy. Journal of Surgical Oncology. 2011; 104(1):10-16
National Institute for Health and Care Excellence 2016
NAFLD
Reference list
338
111 Masaki K, Takaki S, Hyogo H, Kobayashi T, Fukuhara T, Naeshiro N et al. Utility of controlled attenuation parameter measurement for assessing liver steatosis in Japanese patients with chronic liver diseases. Hepatology Research. 2013; 43(11):1182-1189
112 Mathiesen UL, Franzen LE, Aselius H, Resjo M, Jacobsson L, Foberg U et al. Increased liver echogenicity at ultrasound examination reflects degree of steatosis but not of fibrosis in asymptomatic patients with mild/moderate abnormalities of liver transaminases. Digestive and Liver Disease. 2002; 34(7):516-522
113 McPherson S, Stewart SF, Henderson E, Burt AD, Day CP. Simple non-invasive fibrosis scoring systems can reliably exclude advanced fibrosis in patients with non-alcoholic fatty liver disease. Gut. 2010; 59(9):1265-1269
114 McPherson S, Hardy T, Henderson E, Burt AD, Day CP, Anstee QM. Evidence of NAFLD progression from steatosis to fibrosing-steatohepatitis using paired biopsies: Implications for prognosis and clinical management. Journal of Hepatology. 2014;(0)
115 Mennesson N, Dumortier J, Hervieu V, Milot L, Guillaud O, Scoazec JY et al. Liver steatosis quantification using magnetic resonance imaging: a prospective comparative study with liver biopsy. Journal of Computer Assisted Tomography. 2009; 33(5):672-677
116 Morling JR, Fallowfield JA, Williamson RM, Robertson CM, Glancy S, Guha IN et al. gamma-Glutamyltransferase, but not markers of hepatic fibrosis, is associated with cardiovascular disease in older people with type 2 diabetes mellitus: the Edinburgh Type 2 Diabetes Study. Diabetologia. 2015; 58(7):1484-1493
117 Myers RP, Pollett A, Kirsch R, Pomier-Layrargues G, Beaton M, Levstik M et al. Controlled Attenuation Parameter (CAP): a noninvasive method for the detection of hepatic steatosis based on transient elastography. Liver International. 2012; 32(6):902-910
118 National Guideline Centre. Cirrhosis: assessment and management of cirrhosis. NICE clinical guideline. {In development, NG number unknown, due to publish June 2016}. London. National Guideline Centre, 2016. Available from: https://www.nice.org.uk/guidance/indevelopment/gid-cgwave0683; {update webpage when published}
119 National Institute for Health and Care Excellence. Managing overweight and obesity among children and young people: lifesyle weight management services. NICE public health guidance 47. London. National Institute for Health and Care Excellence, 2013. Available from: http://guidance.nice.org.uk/PH47
120 National Institute for Health and Care Excellence. Developing NICE guidelines: the manual. London. National Institute for Health and Care Excellence, 2014. Available from: http://www.nice.org.uk/article/PMG20/chapter/1%20Introduction%20and%20overview
121 National Institute for Health and Care Excellence. Managing overweight and obesity in adults - lifestyle weight management services. NICE public health guidance 53. London. National Institute for Health and Care Excellence, 2014. Available from: http://guidance.nice.org.uk/PH53
122 National Institute for Health and Clinical Excellence. Social value judgements: principles for the development of NICE guidance. 2nd edition. London: National Institute for Health and Clinical Excellence; 2008. Available from: http://www.nice.org.uk/media/C18/30/SVJ2PUBLICATION2008.pdf
123 National Institute for Health and Clinical Excellence. The guidelines manual. London: National Institute for Health and Clinical Excellence; 2012. Available from: http://publications.nice.org.uk/the-guidelines-manual-pmg6/
124 National Institute for Health and Clinical Excellence. Guide to the methods of technology appraisal 2013. 2nd edition. London: National Institute for Health and Clinical Excellence; 2013. Available from: http://publications.nice.org.uk/pmg9
National Institute for Health and Care Excellence 2016
NAFLD
Reference list
339
125 Nelson A, Torres DM, Morgan AE, Fincke C, Harrison SA. A pilot study using simvastatin in the treatment of nonalcoholic steatohepatitis: A randomized placebo-controlled trial. Journal of Clinical Gastroenterology. 2009; 43(10):990-994
126 Neuschwander-Tetri BA, Loomba R, Sanyal AJ, Lavine JE, Van Natta ML, Abdelmalek MF et al. Farnesoid X nuclear receptor ligand obeticholic acid for non-cirrhotic, non-alcoholic steatohepatitis (FLINT): a multicentre, randomised, placebo-controlled trial. The Lancet. 2015; 385(9972):956-965
127 Neuschwander-Tetri BA, Clark JM, Bass NM, Van Natta ML, Unalp-Arida A, Tonascia J et al. Clinical, laboratory and histological associations in adults with nonalcoholic fatty liver disease. Hepatology. 2010; 52(3):913-924
128 Nobili V, Alisi A, Della CC, Rise P, Galli C, Agostoni C et al. Docosahexaenoic acid for the treatment of fatty liver: randomised controlled trial in children. Nutrition, Metabolism, and Cardiovascular Diseases : NMCD. 2013; 23(11):1066-1070
129 Nobili V, Parkes J, Bottazzo G, Marcellini M, Cross R, Newman D et al. Performance of ELF Serum Markers in Predicting Fibrosis Stage in Pediatric Non-Alcoholic Fatty Liver Disease. Gastroenterology. 2009; 136(1):160-167
130 Nobili V, Vizzutti F, Arena U, Abraldes JG, Marra F, Pietrobattista A et al. Accuracy and reproducibility of transient elastography for the diagnosis of fibrosis in pediatric nonalcoholic steatohepatitis. Hepatology. 2008; 48(2):442-448
131 Novielli N, Cooper NJ, Abrams KR, Sutton AJ. How is evidence on test performance synthesized for economic decision models of diagnostic tests? A systematic appraisal of Health Technology Assessments in the UK since 1997. Value in Health. 2010; 13(8):952-957
132 Organisation for Economic Co-operation and Development (OECD). Purchasing power parities (PPP). 2014. Available from: http://www.oecd.org/std/ppp [Last accessed: 15 January 2014]
133 Pacifico L, Bonci E, Di MM, Versacci P, Andreoli G, Silvestri LM et al. A double-blind, placebo-controlled randomized trial to evaluate the efficacy of docosahexaenoic acid supplementation on hepatic fat and associated cardiovascular risk factors in overweight children with nonalcoholic fatty liver disease. Nutrition, Metabolism, and Cardiovascular Diseases : NMCD. 2015; 25(8):734-741
134 Pais R, Charlotte F, Fedchuk L, Bedossa P, Lebray P, Poynard T et al. A systematic review of follow-up biopsies reveals disease progression in patients with non-alcoholic fatty liver. Journal of Hepatology. 2013; 59:550-556
135 Palmentieri B, de Sio I, La Mura V, Masarone M, Vecchione R, Bruno S et al. The role of bright liver echo pattern on ultrasound B-mode examination in the diagnosis of liver steatosis. Digestive and Liver Disease. 2006; 38(7):485-489
136 Palmeri ML, Wang MH, Rouze NC, Abdelmalek MF, Guy CD, Moser B et al. Noninvasive evaluation of hepatic fibrosis using acoustic radiation force-based shear stiffness in patients with nonalcoholic fatty liver disease. Journal of Hepatology. 2011; 55(3):666-672
137 Paparo F, Cenderello G, Revelli M, Bacigalupo L, Rutigliani M, Zefiro D et al. Diagnostic value of MRI proton density fat fraction for assessing liver steatosis in chronic viral C hepatitis. BioMed Research International. 2015; 2015:758164
138 Papatheodoridis GV, Hadziyannis E, Tsochatzis E, Georgiou A, Kafiri G, Tiniakos DG et al. Serum apoptotic caspase activity in chronic hepatitis C and nonalcoholic fatty liver disease. Journal of Clinical Gastroenterology. 2010; 44(4):e87-e95
139 Park SK, Seo MH, Shin HC, Ryoo J-H. Clinical availability of non-alcoholic fatty liver disease as an early predictor of type 2 diabetes mellitus in Korean men: 5-year prospective cohort study. Hepatology. 2013; 57(4):1378-1383
140 Pathik P, Ravindra S, Ajay C, Prasad B, Jatin P, Prabha S. Fibroscan versus simple noninvasive screening tools in predicting fibrosis in high-risk nonalcoholic fatty liver disease patients from western India. Annals of Gastroenterology. 2015; 28(2):281-286

National Institute for Health and Care Excellence 2016
NAFLD
Reference list
340
141 Perazzo H, Ngo Y, Lebray P, Seurat N, Rutka F, Couteau M et al. Prognostic value of liver fibrosis and steatosis biomarkers in type-2 diabetes and dyslipidaemia. Alimentary Pharmacology and Therapeutics. 2014; 40(9):1081-1093
142 Perez NE, Siddiqui FA, Mutchnick MG, Dhar R, Tobi M, Ullah N et al. Ultrasound diagnosis of fatty liver in patients with chronic liver disease: a retrospective observational study. Journal of Clinical Gastroenterology. 2007; 41(6):624-629
143 Perez-Gutierrez OZ, Hernandez-Rocha C, Candia-Balboa RA, Arrese MA, Benitez C, Brizuela-Alcantara DC et al. Validation study of systems for noninvasive diagnosis of fibrosis in nonalcoholic fatty liver disease in Latin population. Annals of Hepatology. 2013; 12(3):416-424
144 Petta S, Di M, V, Camma C, Butera G, Cabibi D, Craxi A. Reliability of liver stiffness measurement in non-alcoholic fatty liver disease: The effects of body mass index. Alimentary Pharmacology and Therapeutics. 2011; 33(12):1350-1360
145 Pickhardt PJ, Hahn L, Munoz del Rio A, Park SH, Reeder SB, Said A. Natural history of hepatic steatosis: observed outcomes for subsequent liver and cardiovascular complications. AJR American Journal of Roentgenology. 2014; 202(4):752-758
146 Pisto P, Santaniemi M, Bloigu R, Ukkola O, Kesaniemi YA. Fatty liver predicts the risk for cardiovascular events in middle-aged population: A population-based cohort study. BMJ Open. 2014; 4(3)
147 Promrat K, Kleiner DE, Niemeier HM, Jackvony E, Kearns M, Wands JR et al. Randomized controlled trial testing the effects of weight loss on nonalcoholic steatohepatitis. Hepatology. 2010; 51(1):121-129
148 Pugh CJA, Cuthbertson DJ, Sprung VS, Kemp GJ, Richardson P, Umpleby AM et al. Exercise training improves cutaneous microvascular function in nonalcoholic fatty liver disease. American Journal of Physiology Endocrinology and Metabolism. 2013; 305(1):E50-E58
149 Qureshi K, Clements RH, Abrams GA. The utility of the "NAFLD fibrosis score" in morbidly obese subjects with NAFLD. Obesity Surgery. 2008; 18(3):264-270
150 Raszeja-Wyszomirska J, Szymanik B, Lawniczak M, Kajor M, Chwist A, Milkiewicz P et al. Validation of the BARD scoring system in Polish patients with nonalcoholic fatty liver disease (NAFLD). BMC Gastroenterology. 2010; 10:67
151 Ratziu V, Ledinghen V, Oberti F, Mathurin P, Wartelle-Bladou C, Renou C et al. A randomized controlled trial of high-dose ursodesoxycholic acid for nonalcoholic steatohepatitis. Journal of Hepatology. 2011; 54(5):1011-1019
152 Ratziu V, Massard J, Charlotte F, Messous D, Imbert-Bismut F, Bonyhay L et al. Diagnostic value of biochemical markers (FibroTest-FibroSURE) for the prediction of liver fibrosis in patients with non-alcoholic fatty liver disease. BMC Gastroenterology. 2006; 6:6
153 Razavizade M, Jamali R, Arj A, Matini SM, Moraveji A, Taherkhani E. The effect of pioglitazone and metformin on liver function tests, insulin resistance, and liver fat content in nonalcoholic fatty liver disease: A randomized double blinded clinical trial. Hepatitis Monthly. 2013; 13(5)
154 Reinehr T, Schmidt C, Toschke AM, Andler W. Lifestyle intervention in obese children with non-alcoholic fatty liver disease: 2-year follow-up study. Archives of Disease in Childhood. 2009; 94(6):437-442
155 Reitsma JB, Glas AS, Rutjes AW, Scholten RJ, Bossuyt PM, Zwinderman AH. Bivariate analysis of sensitivity and specificity produces informative summary measures in diagnostic reviews. J Clin Epidemiol. 2005; 58(10):982-990
156 Ruffillo G, Fassio E, Alvarez E, Landeira G, Longo C, Dominguez N et al. Comparison of NAFLD fibrosis score and BARD score in predicting fibrosis in nonalcoholic fatty liver disease. Journal of Hepatology. 2011; 54(1):160-163
National Institute for Health and Care Excellence 2016
NAFLD
Reference list
341
157 Ryoo JH, Suh YJ, Shin HC, Cho YK, Choi JM, Park SK. Clinical association between non-alcoholic fatty liver disease and the development of hypertension. Journal of Gastroenterology and Hepatology. 2014; 29(11):1926-1931
158 Santos VN, Lanzoni VP, Szejnfeld J, Shigueoka D, Parise ER. A randomized double-blind study of the short-time treatment of obese patients with nonalcoholic fatty liver disease with ursodeoxycholic acid. Brazilian Journal of Medical and Biological Research = Revista Brasileira De Pesquisas Médicas e Biológicas / Sociedade Brasileira De Biofísica [Et Al ]. 2003; 36(6):723-729
159 Sanyal AJ, Abdelmalek MF, Suzuki A, Cummings OW, Chojkier M. No significant effects of ethyl-eicosapentanoic acid on histologic features of nonalcoholic steatohepatitis in a phase 2 trial. Gastroenterology. 2014; 147(2):377-384
160 Sanyal AJ, Chalasani N, Kowdley KV, McCullough A, Diehl AM, Bass NM et al. Pioglitazone, vitamin E, or placebo for nonalcoholic steatohepatitis. New England Journal of Medicine. 2010; 362(18):1675-1685
161 Sanyal AJ, Mofrad PS, Contos MJ, Sargeant C, Luketic VA, Sterling RK et al. A pilot study of vitamin E versus vitamin E and pioglitazone for the treatment of nonalcoholic steatohepatitis. Clinical Gastroenterology and Hepatology. 2004; 2(12):1107-1115
162 Sasso M, Tengher-Barna I, Ziol M, Miette V, Fournier C, Sandrin L et al. Novel controlled attenuation parameter for noninvasive assessment of steatosis using Fibroscan(): validation in chronic hepatitis C. Journal of Viral Hepatitis. 2012; 19(4):244-253
163 Sasso M, Beaugrand M, de Ledinghen V, Douvin C, Marcellin P, Poupon R et al. Controlled attenuation parameter (CAP): a novel VCTE guided ultrasonic attenuation measurement for the evaluation of hepatic steatosis: preliminary study and validation in a cohort of patients with chronic liver disease from various causes. Ultrasound in Medicine and Biology. 2010; 36(11):1825-1835
164 Schwimmer JB, Middleton MS, Behling C, Newton KP, Awai HI, Paiz MN et al. Magnetic resonance imaging and liver histology as biomarkers of hepatic steatosis in children with nonalcoholic fatty liver disease. Hepatology (Baltimore, Md ). 2015; 61(6):1887-1895
165 Scorletti E, Bhatia L, McCormick KG, Clough GF, Nash K, Calder PC et al. Design and rationale of the WELCOME trial: a randomised, placebo controlled study to test the efficacy of purified long chain omega-3 fatty treatment in non-alcoholic fatty liver disease. Contemporary Clinical Trials. 2014; 37(2):301-311
166 Scorletti E, Bhatia L, McCormick KG, Clough GF, Nash K, Hodson L et al. Effects of purified eicosapentaenoic and docosahexaenoic acids in non-alcoholic fatty liver disease: Results from the *WELCOME study. Hepatology. 2014;
167 Shah AG, Lydecker A, Murray K, Tetri BN, Contos MJ, Sanyal AJ. Comparison of Noninvasive Markers of Fibrosis in Patients With Nonalcoholic Fatty Liver Disease. Clinical Gastroenterology and Hepatology. 2009; 7(10):1104-1112
168 Shargorodsky M, Omelchenko E, Matas Z, Boaz M, Gavish D. Relation between augmentation index and adiponectin during one-year metformin treatment for nonalcoholic steatohepatosis: effects beyond glucose lowering? Cardiovascular Diabetology. 2012; 11:61
169 Sharma BC, Kumar A, Garg V, Reddy RS, Sakhuja P, Sarin SK. A Randomized Controlled Trial Comparing Efficacy of Pentoxifylline and Pioglitazone on Metabolic Factors and Liver Histology in Patients with Non-alcoholic Steatohepatitis. Journal of Clinical and Experimental Hepatology. 2012; 2(4):333-337
170 Shen F, Zheng RD, Mi YQ, Wang XY, Pan Q, Chen GY et al. Controlled attenuation parameter for non-invasive assessment of hepatic steatosis in Chinese patients. World Journal of Gastroenterology. 2014; 20(16):4702-4711
171 Shen J, Chan HL, Wong GL, Chan AW, Choi PC, Chan HY et al. Assessment of non-alcoholic fatty liver disease using serum total cell death and apoptosis markers. Alimentary Pharmacology and Therapeutics. 2012; 36(11-12):1057-1066

National Institute for Health and Care Excellence 2016
NAFLD
Reference list
342
172 Shiasi Arani K, Taghavi Ardakani A, Moazami Goudarzi R, Talari HR, Hami K, Akbari H et al. Effect of vitamin E and metformin on fatty liver disease in obese children- randomized clinical trial. Iranian Journal of Public Health. 2014; 43(10):1417-1423
173 Shibata M, Kihara Y, Taguchi M, Tashiro M, Otsuki M. Nonalcoholic fatty liver disease is a risk factor for type 2 diabetes in middle-aged Japanese men. Diabetes Care. 2007; 30(11):2940-2944
174 Shields WW, Thompson KE, Grice GA, Harrison SA, Coyle WJ. The effect of metformin and standard therapy versus standard therapy alone in nondiabetic patients with insulin resistance and nonalcoholic steatohepatitis (NASH): A pilot trial. Therapeutic Advances in Gastroenterology. 2009; 2(3):157-163
175 Singh DK, Sakhuja P, Malhotra V, Gondal R, Sarin SK. Independent predictors of steatohepatitis and fibrosis in Asian Indian patients with non-alcoholic steatohepatitis. Digestive Diseases and Sciences. 2008; 53(7):1967-1976
176 Singh S, Allen AM, Wang Z, Prokop LJ, Murad MH, Loomba R. Fibrosis Progression in Nonalcoholic Fatty Liver vs Nonalcoholic Steatohepatitis: A Systematic Review and Meta-analysis of Paired-Biopsy Studies. Clinical Gastroenterology and Hepatology. 2014; epublication
177 Sookoian S, Castano G, Burgueno AL, Gianotti TF, Rosselli MS, Pirola CJ. A diagnostic model to differentiate simple steatosis from nonalcoholic steatohepatitis based on the likelihood ratio form of Bayes theorem. Clinical Biochemistry. 2009; 42(7-8):624-629
178 Sorrentino P, Terracciano L, D'Angelo S, Ferbo U, Bracigliano A, Vecchione R. Predicting fibrosis worsening in obese patients with NASH through parenchymal fibronectin, HOMA-IR, and hypertension. American Journal of Gastroenterology. 2010; 105(2):336-344
179 Spadaro L, Magliocco O, Spampinato D, Piro S, Oliveri C, Alagona C et al. Effects of n-3 polyunsaturated fatty acids in subjects with nonalcoholic fatty liver disease. Digestive and Liver Disease. 2008; 40(3):194-199
180 Speliotes EK, Massaro JM, Hoffmann U, Vasan RS, Meigs JB, Sahani DV et al. Fatty liver is associated with dyslipidemia and dysglycemia independent of visceral fat: the Framingham Heart Study. Hepatology. 2010; 51(6):1979-1987
181 Steadman R, Myers RP, Leggett L, Lorenzetti D, Noseworthy T, Rose S et al. A health technology assessment of transient elastography in adult liver disease. Canadian Journal of Gastroenterology. 2013; 27(3):149-158
182 Sullivan S, Kirk EP, Patterson B, Klein S. Effect of endurance exercise on non-alcoholic fatty liver disease. Gastroenterology. 2011; 140(5 SUPPL. 1):S700
183 Sullivan S, Kirk EP, Mittendorfer B, Patterson BW, Klein S. Randomized trial of exercise effect on intrahepatic triglyceride content and lipid kinetics in nonalcoholic fatty liver disease. Hepatology. 2012; 55(6):1738-1745
184 Sumida Y, Yoneda M, Hyogo H, Itoh Y, Ono M, Fujii H et al. Validation of the FIB4 index in a Japanese nonalcoholic fatty liver disease population. BMC Gastroenterology. 2012; 12
185 Sung KC, Kim BS, Cho YK, Park DI, Woo S, Kim S et al. Predicting incident fatty liver using simple cardio-metabolic risk factors at baseline. BMC Gastroenterology. 2012; 12:84
186 Sung KC, Wild SH, Byrne CD. Development of new fatty liver, or resolution of existing fatty liver, over five years of follow-up, and risk of incident hypertension. Journal of Hepatology. 2014; 60(5):1040-1045
187 Tang A, Desai A, Hamilton G, Wolfson T, Gamst A, Lam J et al. Accuracy of MR imaging-estimated proton density fat fraction for classification of dichotomized histologic steatosis grades in nonalcoholic fatty liver disease. Radiology. 2015; 274(2):416-425

National Institute for Health and Care Excellence 2016
NAFLD
Reference list
343
188 Targher G, Bertolini LF, Rodella S FAU - Tessari R, Tessari RF, Zenari LF, Lippi GF et al. Nonalcoholic fatty liver disease is independently associated with an increased incidence of cardiovascular events in type 2 diabetic patients. Cardiovascular and Metabolic Risk. 2005;(1935-5548 (Electronic))
189 Targher G, Mantovani A, Pichiri I, Mingolla L, Cavalieri V, Mantovani W et al. Nonalcoholic fatty liver disease is independently associated with an increased incidence of chronic kidney disease in patients with type 1 diabetes. Diabetes Care. 2014; 37(6):1729-1736
190 Targher G, Valbusa F, Bonapace S, Bertolini L, Zenari L, Rodella S et al. Non-Alcoholic Fatty Liver Disease Is Associated with an Increased Incidence of Atrial Fibrillation in Patients with Type 2 Diabetes. PLoS One. 2013; 8(2)
191 Targher G, Chonchol M, Bertolini L, Rodella S, Zenari L, Lippi G et al. Increased risk of CKD among type 2 diabetics with nonalcoholic fatty liver disease. Journal of the American Society of Nephrology. 2008; 19(8):1564-1570
192 Teli MR, James OF, Burt AD, Bennett MK, Day CP. The natural history of nonalcoholic fatty liver: a follow-up study. Hepatology. 1995; 22:1714-1719
193 Thoma C, Hallsworth K, Hollingsworth K, Anstee Q, Taylor R, Day C et al. High-intensity intermittent exercise therapy reduces liver fat and improves body composition in adults with non-alcoholic fatty liver disease. Journal of Hepatology. 2013; 58:S550-S551
194 Thoma C, Hallsworth K, Hollingsworth K, Taylor R, Day CP, Trenell M. Unsupervised high-intensity intermittent training reduces liver fat and improves body composition in adults with non-alcoholic fatty liver disease (NAFLD). Diabetic Medicine. 2013; 30:60
195 Tock L, Damaso AR, de Piano A, Carnier J, Sanches PL, Lederman HM et al. Long-term effects of metformin and lifestyle modification on nonalcoholic Fatty liver disease obese adolescents. Journal of Obesity. 2010; 2010
196 Ueno T, Sugawara H, Sujaku K, Hashimoto O, Tsuji R, Tamaki S et al. Therapeutic effects of restricted diet and exercise in obese patients with fatty liver. Journal of Hepatology. 1997; 27(1):103-107
197 Urdzik J, Bjerner T, Wanders A, Weis J, Duraj F, Haglund U et al. The value of pre-operative magnetic resonance spectroscopy in the assessment of steatohepatitis in patients with colorectal liver metastasis. Journal of Hepatology. 2012; 56(3):640-646
198 Vajro P, Mandato C, Licenziati MR, Franzese A, Vitale DF, Lenta S et al. Effects of Lactobacillus rhamnosus strain GG in pediatric obesity-related liver disease. Journal of Pediatric Gastroenterology and Nutrition. 2011; 52(6):740-743
199 Van Houwelingen HC, Arends LR, Stijnen T. Advanced methods in meta-analysis: multivariate approach and meta-regression. Statistics in Medicine. 2002; 21(4):589-624
200 Van Houwelingen HC, Zwinderman KH, Stijnen T. A bivariate approach to meta-analysis. Statistics in Medicine. 1993; 12(24):2273-2284
201 van Werven JR, Marsman HA, Nederveen AJ, Smits NJ, ten Kate FJ, van Gulik TM et al. Assessment of hepatic steatosis in patients undergoing liver resection: comparison of US, CT, T1-weighted dual-echo MR imaging, and point-resolved 1H MR spectroscopy. Radiology. 2010; 256(1):159-168
202 van Werven JR, Schreuder TCMA, Aarts EO, Nederveen AJ, Meijer JWR, Berends FJ et al. Hepatic steatosis in morbidly obese patients undergoing gastric bypass surgery: assessment with open-system 1H-MR spectroscopy. AJR American Journal of Roentgenology. 2011; 196(6):W736-W742
National Institute for Health and Care Excellence 2016
NAFLD
Reference list
344
203 Verma S, Jensen D, Hart J, Mohanty SR. Predictive value of ALT levels for non-alcoholic steatohepatitis (NASH) and advanced fibrosis in non-alcoholic fatty liver disease (NAFLD). Liver International. 2013; 33(9):1398-1405
204 Wagner LB, Koppe SW, Brunt EM, Gottstein J, Gardikiotes K, Green RM et al. Pentoxifylline for the treatment of non-alcoholic steatohepatitis: a randomized controlled trial. Annals of Hepatology. 2011; 10(3):277-286
205 Wang CC, Hsieh TC, Tseng TC, Wang PC, Hsu CS, Lin HH et al. Factors affecting the diagnostic accuracy of ultrasonography in assessing the severity of hepatic steatosis. Journal of the Formosan Medical Association. 2014; 113(4):249-254
206 Wang CY, Lu W, Hu DS, Wang GD, Cheng XJ. Diagnostic value of controlled attenuation parameter for liver steatosis in patients with chronic hepatitis B. World Journal of Gastroenterology. 2014; 20(30):10585-10590
207 Wang JH, Hung CH, Kuo FY, Eng HL, Chen CH, Lee CM et al. Ultrasonographic quantification of hepatic-renal echogenicity difference in hepatic steatosis diagnosis. Digestive Diseases and Sciences. 2013; 58(10):2993-3000
208 Webb M, Yeshua H, Zelber-Sagi S, Santo E, Brazowski E, Halpern Z et al. Diagnostic value of a computerized hepatorenal index for sonographic quantification of liver steatosis. AJR American Journal of Roentgenology. 2009; 192(4):909-914
209 Williams R, Ashton K, Aspinall R, Bellis MA, Bosanquet J, Cramp ME et al. Implementation of the Lancet Standing Commission on Liver Disease in the UK. Lancet (London, England). 2015; 386(10008):2098-2111
210 Williams R, Aspinall R, Bellis M, Camps-Walsh G, Cramp M, Dhawan A et al. Addressing liver disease in the UK: A blueprint for attaining excellence in health care and reducing premature mortality from lifestyle issues of excess consumption of alcohol, obesity, and viral hepatitis. The Lancet. 2014; 384(9958):1953-1997
211 Wong VW, Wong GL, Choi PC, Chan AW, Li MK, Chan HY et al. Disease progression of non-alcoholic fatty liver disease: a prospective study with paired liver biopsies at 3 years. Gut. 2010; 59:969-974
212 Wong VWS, Vergniol J, Wong GLH, Foucher J, Chan AWH, Chermak F et al. Liver stiffness measurement using XL probe in patients with nonalcoholic fatty liver disease. American Journal of Gastroenterology. 2012; 107(12):1862-1871
213 Wong VWS, Vergniol J, Wong GLH, Foucher J, Chan HLY, Le BB et al. Diagnosis of fibrosis and cirrhosis using liver stiffness measurement in nonalcoholic fatty liver disease. Hepatology. 2010; 51(2):454-462
214 Wong VWS, Wong GLH, Chim AML, Tse AML, Tsang SWC, Hui AY et al. Validation of the NAFLD fibrosis score in a Chinese population with low prevalence of advanced fibrosis. American Journal of Gastroenterology. 2008; 103(7):1682-1688
215 Wong VWS, Wong GLH, Yip GWK, Lo AOS, Limquiaco J, Chu WCW et al. Coronary artery disease and cardiovascular outcomes in patients with non-alcoholic fatty liver disease. Gut. 2011; 60(12):1721-1727
216 Wong VW-S, Chan RS-M, Wong GL-H, Cheung BH-K, Chu WC-W, Yeung DK-W et al. Community-based lifestyle modification programme for non-alcoholic fatty liver disease: a randomized controlled trial. Journal of Hepatology. 2013; 59(3):536-542
217 Wong VW-S, Won GL-H, Chim AM-L, Chu WC-W, Yeung DK-W, Li KC-T et al. Treatment of nonalcoholic steatohepatitis with probiotics. A proof-of-concept study. Annals of Hepatology. 2013; 12(2):256-262
218 Wu CH, Ho MC, Jeng YM, Hsu CY, Liang PC, Hu RH et al. Quantification of hepatic steatosis: a comparison of the accuracy among multiple magnetic resonance techniques. Journal of Gastroenterology and Hepatology. 2014; 29(4):807-813

National Institute for Health and Care Excellence 2016
NAFLD
Reference list
345
219 Xu C, Yu C, Ma H, Xu L, Miao M, Li Y. Prevalence and risk factors for the development of nonalcoholic fatty liver disease in a nonobese Chinese population: the Zhejiang Zhenhai Study. American Journal of Gastroenterology. 2013; 108(8):1299-1304
220 Xun YH, Fan JG, Zang GQ, Liu H, Jiang YM, Xiang J et al. Suboptimal performance of simple noninvasive tests for advanced fibrosis in Chinese patients with nonalcoholic fatty liver disease. Journal of Digestive Diseases. 2012; 13(11):588-595
221 Yajima Y, Ohta K, Narui T, Abe R, Suzuki H, Ohtsuki M. Ultrasonographical diagnosis of fatty liver: significance of the liver-kidney contrast. Tohoku Journal of Experimental Medicine. 1983; 139(1):43-50
222 Yamada T, Fukatsu M, Suzuki S, Wada T, Yoshida T, Joh T. Fatty liver predicts impaired fasting glucose and type 2 diabetes mellitus in Japanese undergoing a health checkup. Journal of Gastroenterology and Hepatology. 2010; 25(2):352-356
223 Yamazaki H, Tsuboya T, Tsuji K, Dohke M, Maguchi H. Independent association between improvement of nonalcoholic fatty liver disease and reduced incidence of type 2 diabetes. Diabetes Care. 2015; 38(9):1673-1679
224 Yilmaz Y, Dolar E, Ulukaya E, Akgoz S, Keskin M, Kiyici M et al. Soluble forms of extracellular cytokeratin 18 may differentiate simple steatosis from nonalcoholic steatohepatitis. World Journal of Gastroenterology. 2007; 13(6):837-844
225 Yoneda M, Imajo K, Eguchi Y, Fujii H, Sumida Y, Hyogo H et al. Noninvasive scoring systems in patients with nonalcoholic fatty liver disease with normal alanine aminotransferase levels. Journal of Gastroenterology. 2013; 48(9):1051-1060
226 Yoneda M, Mawatari H, Fujita K, Endo H, Iida H, Nozaki Y et al. Noninvasive assessment of liver fibrosis by measurement of stiffness in patients with nonalcoholic fatty liver disease (NAFLD). Digestive and Liver Disease. 2008; 40(5):371-378
227 Yoneda M, Suzuki K, Kato S, Fujita K, Nozaki Y, Hosono K et al. Nonalcoholic fatty liver disease: US-based acoustic radiation force impulse elastography. Radiology. 2010; 256(2):640-647
228 Yoneda M, Thomas E, Sumida Y, Imajo K, Eguchi Y, Hyogo H et al. Clinical usage of serum ferritin to assess liver fibrosis in patients with non-alcoholic fatty liver disease: Proceed with caution. Hepatology Research. 2015; 44(14):E499-E502
229 Younossi ZM, Koenig AB, Abdelatif D, Fazel Y, Henry L, Wymer M. Global Epidemiology of Non-Alcoholic Fatty Liver Disease-Meta-Analytic Assessment of Prevalence, Incidence and Outcomes. Hepatology. 2015; epublication
230 Younossi ZM, Otgonsuren M, Henry L, Venkatesan C, Mishra A, Erario M et al. Association of Non-alcoholic Fatty Liver Disease (NAFLD) with Hepatocellular Carcinoma (HCC) in the United States from 2004-2009. Hepatology (Baltimore, Md ). 2015;
231 Younossi ZM, Page S, Rafiq N, Birerdinc A, Stepanova M, Hossain N et al. A biomarker panel for non-alcoholic steatohepatitis (NASH) and NASH-related fibrosis. Obesity Surgery. 2011; 21(4):431-439
232 Younossi ZM, Stepanova M, Rafiq N, Makhlouf H, Younoszai Z, Agrawal R et al. Pathologic criteria for nonalcoholic steatohepatitis: interprotocol agreement and ability to predict liver-related mortality. Hepatology. 2011; 53(6):1874-1882
233 Zein CO, Yerian LM, Gogate P, Lopez R, Kirwan JP, Feldstein AE et al. Pentoxifylline improves nonalcoholic steatohepatitis: a randomized placebo-controlled trial. Hepatology. 2011; 54(5):1610-1619
234 Zelber-Sagi S, Buch A, Webb M, Yeshua H, Kiss O, Fliss N et al. The effect of resistance training on non-alcoholic fatty liver disease (NAFLD) a randomized clinical trial. Journal of Hepatology. 2012; 56:S526-S527
235 Zelber-Sagi S, Kessler A, Brazowsky E, Webb M, Lurie Y, Santo M et al. A double-blind randomized placebo-controlled trial of orlistat for the treatment of nonalcoholic fatty liver disease. Clinical Gastroenterology and Hepatology. 2006; 4(5):639-644

National Institute for Health and Care Excellence 2016
NAFLD
Reference list
346
236 Zelber-Sagi S, Buch A, Yeshua H, Vaisman N, Webb M, Harari G et al. Effect of resistance training on non-alcoholic fatty-liver disease a randomized-clinical trial. World Journal of Gastroenterology. 2014; 20(15):4382-4392
237 Zelber-Sagi S, Nitzan-Kaluski D, Halpern Z, Oren R. Prevalence of primary non-alcoholic fatty liver disease in a population-based study and its association with biochemical and anthropometric measures. Liver International. 2006; 26(7):856-863