![Measure and map noise pollution with your mobile phone · noise pollution. NoiseTube[1] is a research project of the Sony Comput-er Science Laboratory[2] in Paris. The project is](https://static.fdocuments.net/doc/165x107/60441586c73732349342a567/measure-and-map-noise-pollution-with-your-mobile-phone-noise-pollution-noisetube1.jpg)
NoiseTube: Measuring and mapping noise pollution with ...
15
NoiseTube: Measuring and mapping noise pollution with mobile phones Nicolas Maisonneuve Sony Computer Science Laboratory Paris Matthias Stevens SOFT, Dept. Of Computer Science, Vrije Universiteit Brussel Maria E. Niessen Dept. of Artificial Intelligence, University of Groningen Luc Steels Sony Computer Science Laboratory Paris / ARTI, Dept. Of Computer Science, Vrije Universiteit Brussel Published in: Information Technologies in Environmental Engineering (ITEE 2009) Proceedings of the 4th International ICSC Symposium, Thessaloniki, Greece, May 28-29, 2009 Ioannis N. Athanasiadis, Pericles A. Mitkas, Andrea E. Rizzoli & Jorge Marx Gómez (Eds.) Published by Springer Berlin Heidelberg pp. 215-228 Abstract In this paper we present a new approach for the assessment of noise pollution involving the general public. The goal of this project is to turn GPS-equipped mobile phones into noise sensors that enable citizens to measure their personal exposure to noise in their everyday environment. Thus each user can contribute by sharing their geo- localised measurements and further personal annotation to produce a collective noise map. Acknowledgements This work was partially supported by the EU under contract IST-34721 (TAGora). The TAGora project is funded by the Future and Emerging Technologies program (IST-FET) of the European Commission. Matthias Stevens is a research assistant of the Fund for Scientific Research, Flanders (Aspirant van het Fonds Wetenschappelijk Onderzoek - Vlaanderen). Links ITEE 2009 conference: http://www.itee2009.org Published paper: http://dx.doi.org/10.1007/978-3-540-88351-7_16 Full proceedings: http://dx.doi.org/10.1007/978-3-540-88351-7 NoiseTube project: http://www.noisetube.net
Transcript of NoiseTube: Measuring and mapping noise pollution with ...

NoiseTube: Measuring and mapping noise pollution with mobile phones
Nicolas Maisonneuve Sony Computer Science Laboratory Paris
Matthias Stevens SOFT, Dept. Of Computer Science, Vrije Universiteit Brussel
Maria E. Niessen Dept. of Artificial Intelligence, University of Groningen
Luc Steels Sony Computer Science Laboratory Paris / ARTI, Dept. Of Computer Science, Vrije Universiteit Brussel
Published in:
Information Technologies in Environmental Engineering (ITEE 2009)
Proceedings of the 4th International ICSC Symposium, Thessaloniki, Greece, May 28-29, 2009
Ioannis N. Athanasiadis, Pericles A. Mitkas, Andrea E. Rizzoli & Jorge Marx Gómez (Eds.)
Published by Springer Berlin Heidelberg
pp. 215-228
Abstract
In this paper we present a new approach for the assessment of noise pollution involving the general public. The goal
of this project is to turn GPS-equipped mobile phones into noise sensors that enable citizens to measure their
personal exposure to noise in their everyday environment. Thus each user can contribute by sharing their geo-
localised measurements and further personal annotation to produce a collective noise map.
Acknowledgements
This work was partially supported by the EU under contract IST-34721 (TAGora). The TAGora project is funded by the
Future and Emerging Technologies program (IST-FET) of the European Commission. Matthias Stevens is a research
assistant of the Fund for Scientific Research, Flanders (Aspirant van het Fonds Wetenschappelijk Onderzoek -
Vlaanderen).
Links
ITEE 2009 conference: http://www.itee2009.org
Published paper: http://dx.doi.org/10.1007/978-3-540-88351-7_16
Full proceedings: http://dx.doi.org/10.1007/978-3-540-88351-7
NoiseTube project: http://www.noisetube.net

NoiseTube: Measuring and mapping noise
pollution with mobile phones
Nicolas Maisonneuve, Matthias Stevens, Maria E. Niessen & Luc
Steels,
Sony Computer Science Laboratory Paris, France
Dept. of Computer Science, Vrije Universiteit Brussel, Belgium
Dept. of Artificial Intelligence, University of Groningen, The Netherlands
Abstract:
In this paper we present a new approach for the assessment of noise pollu-
tion involving the general public. The goal of this project is to turn GPS-
equipped mobile phones into noise sensors that enable citizens to measure
their personal exposure to noise in their everyday environment. Thus each
user can contribute by sharing their geo-localised measurements and fur-
ther personal annotation to produce a collective noise map.
Keywords: Noise pollution, citizen science, participatory sensing, people-
centric sensing, geo-localisation, tagging, mobile phones.
1. Introduction
Noise pollution is a major problem in urban environments, affecting hu-
man behaviour, well-being, productivity and health [11], as well as the be-
haviour and habitat of animals [30]. Recognising this as a prime issue, the
European Commission adopted a directive [12] requiring major cities to
gather real-world data on noise exposure in order to produce local action
plans [13].
Numerous international reports (e.g. Principle 10 of the Rio Declaration
on Environment and Development) have expressed the importance of pub-
lic participation to move towards sustainable development. But often par-
ticipation is only proposed at the decision making level. Could citizens al-

so participate in the assessment of environmental issues? Can we transfer
the user-generated content practices from the digital world (cfr. Web 2.0
[17]) into a real-world and environmental context by democratizing envi-
ronmental measurement devices? How will the practice of pollution moni-
toring change if every citizen can contribute to it using personal mobile
environmental measuring devices?
In this paper we present the NoiseTube project1, which follows a novel
approach to noise pollution monitoring involving the general public. Our
goal is to investigate how participative and people-centric data collection
can be used to create a low-cost, open platform to measure, annotate and
localise noise pollution as it is perceived by the citizens themselves. In
continuation of earlier research, we want to apply the potential of commu-
nity memories [27, 28] and citizen science [19] to noise monitoring.
The next section provides an overview of current and alternative meth-
ods for the assessment of environmental noise. Then we describe our ap-
proach in section 3 and our prototype platform in section 4. Next, section 5
we discuss the credibility of the sensor data and section 6 provides addi-
tional background and discussion. Finally, section 7 concludes this paper.
2. Assessment of environmental noise
2.1 Noise level measurement
Noise level or loudness is generally measured as the equivalent continuous
sound level or Leq. Measured in decibel (dB), Leq captures the sound pres-
sure level of a constant noise source over the time interval T that has the
same acoustic energy as the actual varying sound level pressure over the
same interval. Furthermore the human ear perceives the loudness differ-
ently depending on the frequency of the sound. Standard “weighted scale”
frequency functions have been developed to reflect human perception, no-
tably the A-weighting scale, written dB(A) is commonly used.
p = sound level pressure (SLP) recorded
p0 = minimal audible SLP
1 http://www.noisetube.net
2.2 Traditional measuring approach
Nowadays noise assessments in urban areas are usually carried out by offi-
cials who collect data at a sparse set of locations, e.g. close to roads, rail-
ways, airports and industrial estates, by setting up sound level meters dur-
ing a short period of time. Propagation models are then used to generate
noise maps by extrapolating local measurements to wider areas. This prac-
tice has a number of limitations:
Spatio-temporal data granularity: computational models often produce
results with an unknown error margin, which may lead to incorrect conclu-
sions regarding caused uncomfort [16]. As stated by the EU practise guide
[13] real data with high granularity in both time and space is required.
However, data collection at sparse locations hardly scales to meet such re-
quirements. Furthermore, strategic noise mapping only allows detecting
general noise conditions. How can we monitor unusual local or short-term
noise pollution?
Cost: the cost of such noise mapping campaigns is high due to the need
of expertise and human resources, the deployment of expensive sound
level meter equipment and the processing effort. This restricts cities with
limited budgets from conducting such assessments.
Public noise exposure assessment: the EU practise guide [13] requires
detailed assessment of the level of noise citizens are actually exposed to.
However, few efforts have been done to combine noise mapping and popu-
lation data to assess the noise exposure of citizens [26].
Indoor noise assessment: current noise mapping only covers environ-
mental noise, i.e. outdoor noise. However, most people spend a significant
portion of their time indoors.
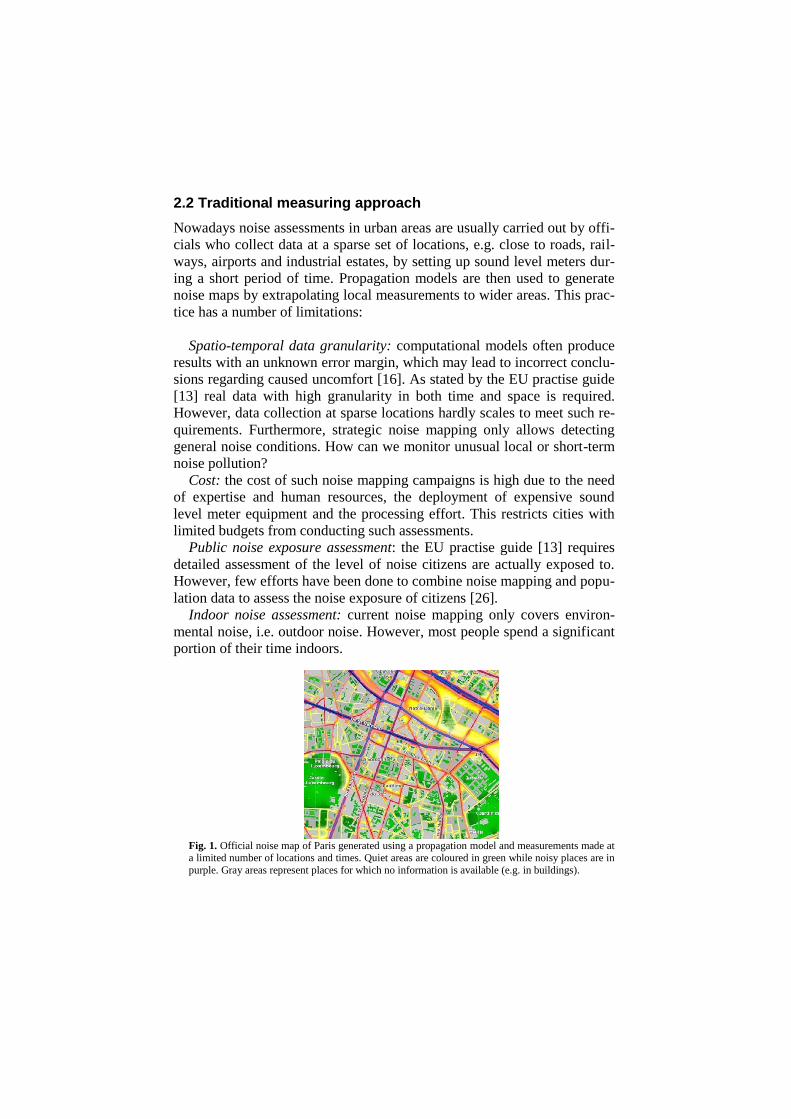
Fig. 1. Official noise map of Paris generated using a propagation model and measurements made at a limited number of locations and times. Quiet areas are coloured in green while noisy places are in
purple. Gray areas represent places for which no information is available (e.g. in buildings).

2.3 Alternative approaches
2.2.1 Wireless sensor networks
Recent years have seen an increasing interest in wireless sensor networks
(WSN) for environmental monitoring [23] and urban sensing [8]. Wireless
sensor networks have the potential to revolutionize environmental assess-
ment, notably regarding spatio-temporal granularity. Rather than relying
on a limited number of expensive, accurate, stationary sensing equipment,
a WSN uses large numbers of cheap, simple, compact sensor devices. Sen-
sors can be directly embedding into the environment and operate continu-
ously, enabling real-time monitoring of environmental phenomena or hu-
man activities. A recent example of using WSNs for noise monitoring is
discussed in [24]. In this project custom-made noise sensors were placed at
fixed locations in the city. However, it remains questionable whether this
is cheaper than traditional approaches for large-scale deployments.
2.2.2 Participation of citizens
To implement the requirements of the European Noise Directive [12] –
END for short – involvement of citizens is key. This is especially impor-
tant with regards to local action plans, which often directly affect people
living nearby. But citizens can also contribute in earlier phases, such as the
actual assessment of noise pollution.
In geography and urban planning there is also trend to support such par-
ticipation. Under the flag of participatory GIS [7] new methodologies are
being researched to better support the participation and involvement of
citizens in projects that are typically tackled using geographical informa-
tion systems (GIS). An interesting example in the context of noise pollu-
tion monitoring is [9]. In this project researchers equipped volunteers with
noise level meters to create noise maps accessible through an online GIS
system. However the need for rather expensive professional devices could
limit the creation of real-world campaigns initiated by communities.
3. Approach
Taking inspiration from wireless sensor networks and the trend towards
participation of citizens we intend to use GPS-equipped mobile phones as
noise sensors and involve the citizens that carry them to measure, locate

and provide qualitative input for the monitoring of urban noise pollution.
In this section we discuss and motivate this approach in detail.
3.1 Mobile phone as an environmental sensor
The growing popularity of smart phones with high computational power,
Internet access and integrated sensors (e.g. cameras, GPS, motion sensors)
represent a cheap but powerful WSN platform that is readily available and
widely deployed. In this perspective mobile phones can serve as sensors
which are carried by humans rather than placed at static locations. In addi-
tion to carrying around sensors, citizens can also be more directly involved
in the sensing process by entering qualitative inputs (noise source tagging,
annoyance rating). Thanks to the aggregated mobility of users, this ap-
proach enables sensing coverage of large public spaces over time long pe-
riods of time.
3.1.1 Mobile sensing
This idea is related to the concept of participatory sensing [4], which ad-
vocates the use of mobile devices to form sensor networks that enable pub-
lic and professional users to gather, analyze and share local knowledge. At
the same time, people as individuals or in groups can apply these new
sensing networks with a more personal focus. Their individual stories of
everyday life can be aggregated to document the urban environment, fed
back into a collective experience in urban public spaces, enabling people-
centric sensing [5], for personal, peer or public purposes.
3.1.2 Democratising noise pollution measurement
Despite some research projects involving volunteers and specific meas-
urement devices, e.g. for air pollution monitoring [21] the participatory
sensing paradigm has not been validated empirically by real world use in
an environmental domain due to the cost and lack of access to environ-
mental sensors for the general public. In the context of noise pollution, by
turning mobile phones into noise pollution sensors, we strongly lower the
entrance barrier of such environmental measurement technology.
NoiseTube has the potential to set up new kinds of experiments by enlarg-
ing the scope of potential participants. In the spirit of the Web 2.0 culture
[20] and its user-generated content model, we expect novel mobile device
applications and networked participation models to emerge for environ-
mental monitoring (e.g. for noise pollution) that fully tap into the potential
of citizen science [22].

3.2 Measuring pollution at the individual level
3.2.1 A persuasion tool
Giving the possibility to any citizen to measure their personal noise expo-
sure in their daily environment could influence their perceptions and po-
tentially support the raising of awareness of environmental issues, the first
stage in the adoption of new behaviour [22]. Personalized pollution infor-
mation could have a bigger impact than general statistics provided by envi-
ronmental agencies to change habits towards a more sustainable lifestyle.
With its ubiquity, the cell phone has already demonstrated its value as a
persuasion tool in several cases (education, health and marketing) [14] and
may have an equally big potential in an environmental context.
3.2.2 People- vs. place-centric exposure
As described in [4], people can use participatory sensing instruments in the
context of grassroots campaigns to collect pollution measures at specific
locations. In a sense, this is a mobile extension of what is often done using
(statically deployed) wireless sensing networks. The cell phone is also
situated in an environment typically co-located with the user. Therefore, it
could be used as a tool to self-monitor one‟s individual exposure to inform
the community about it. The usefulness of such people-centric data has
been demonstrated in health-related projects such as [29], in which chil-
dren were equipped with sensors for air pollution to understand the factors
affecting asthma. Measuring noise pollution, not only from a geographical
point of view, but also through the people‟s exposure opens potential links
with epidemiological studies at a larger scale.
3.3 Enabling participatory culture
3.3.1 Supporting local democracy and citizen science
The NoiseTube project is situated in the growing movement of local de-
mocracy. We intend to provide tools for citizens to collect fine grained
data (e.g. evidence of harmful noise exposure levels) to convince local au-
thorities and influence decision making on local issues, without waiting for
officials to gather the data. We envision that the NoiseTube web platform
could serve as a tool to help existing organisations (e.g. groups focused on

well-identified noise pollution problems, such as in communities close to
airports) to gather credible data.
3.3.2 Social translucence mechanism
NoiseTube uses the concept of social translucence consisting in making
participants and their activities visible to one another. The role of social
translucence is to inform, to create awareness and to enforce accountability
[10]. These mechanisms also influence the level of the motivation of the
individual and the group via social stimulation happening via social com-
parison [15], by reinforcing the perception of self-efficacy in a social con-
text [1] or by displaying the value of contribution [25]. As pointed out in
[6] despite the individual use of popular Web 2.0 services, such as
Wikipedia and YouTube, opportunistic cooperation emerges among indi-
viduals due to interactions (e.g. comments) created by the visibility of their
personal productions. Thus by making individual noise exposure public we
intended to create opportunities to forge new relations among people fac-
ing to similar problems, which can then result it collective action, over-
coming the cold start effect.
3.3.3 Unconstrained participation
Even though the ubiquity of mobile phones makes mass participation fea-
sible, as attempted in [5, 20], it remains questionable how the general pub-
lic can be motivated to voluntary do so. How to involve the hidden major-
ity of citizens who do not participate in local organizations and want to use
such technology for personal purposes? In our noise pollution context, the
goal is to not force people to make their measures public and thus to al-
ways contribute at to a collective mapping process. By allowing users to
choose if they want to share or not all or a part of their measurements, we
also want to avoid privacy concerns.
4. NoiseTube platform
The current prototype of the NoiseTube platform consists of an application
which the participants must install on their mobile phone to turn it into a
noise sensor device. The mobile sensing application runs on GPS-equipped
mobile phones. This application collects local information from different
sensors (noise, GPS coordinates, time, user input) and sends it to the
NoiseTube server, where the data is centralised and processed.

4.1 Measuring loudness in real time
The mobile application contains a real-time signal processing algorithm
which measures the loudness level of the microphone recording the envi-
ronmental sound (at 22500 Hz, 16 bits) over 1 second at a chosen interval.
An A-weighting filter is then applied to the recorded sound and the equiva-
lent sound level (Leq)2, measured in dB(A), is computed.
The calculated loudness is displayed (see Fig. 2) in real time using a graph
and as a value in dB(A). To add meaning to this value it is associated with
a colour that represents the health risk of the current exposure level: < 70:
green (no risk); > 70 and < 80: yellow (be careful); > 80: red (risky).
Fig.1 – The Mobile sensing application. Includ-
ing 3 components: (1) The visualization of the
loudness measured and a color representing the
danger (2) The noise tagging (3) The tagging of the location (for indoor location for instance)
Fig.2 - Noise map of two subway lines (indoor
location) reconstructed thanks to the geo-tagging
feature in the mobile sensing application
4.2 Tagging
In addition to measured loudness, public noise maps often only provide
very limited information regarding the source or context of noise. This sort
of semantic information is vital to make such maps meaningful for both
citizens and decision makers.
Environmental tagging: In order to better support this, users can directly
annotate sound in specifying the source of a noise (e.g.: cars, aircraft,
neighbours) and give an annoyance rating or any additional contextual in-
formation in the form of free words (tags).
Geo-tagging: Because indoor positioning is virtually impossible with
GPS (see 5.2), we let users precise their location using a map or a list of
favourite places (e.g. “home”, “office”). Afterwards this information can
then be matched with actual coordinates. For example, by specifying sub-
way stations a path followed in the subway can be reconstructed after-
wards (see fig. 3).
2 Leq is the standard loudness measure as required by the END [12].

4.3 Visualising noise maps
Once the measured data is sent the server, any user can see his own contri-
butions or exposures by going to the NoiseTube website and visualize
them on a map using Google Earth. A collective noise map is also publicly
available. This map is constructed by aggregating all the shared measure-
ments. Each map can show a layer of tags entered by participants to add
context and meaning to the loudness data. A real time monitoring of the
loudness readings of all participants is also available.
Fig. 3 – Visualisation with Google Earth. On the left, the collective noise map generated by all
the measures. On the right, a real time visualization of the collective noise exposure.
4.4 Building environmental exposure profiles
As mentioned before we have attempted to develop features related to the
concept of social translucence to motivate and create accountability. In-
spired by the concept of blogs with developed the idea of an Elog, or “En-
vironmental Log”. In our noise pollution context, an Elog would enable
individuals to show their life through their current noise exposure or their
contributions to the noise monitoring of their city. Thanks to this public
profile we also attempt to support opportunistic connection and interaction
among people facing similar problems.
4.5 Web API to access public data
Currently, the raw measures are generally not directly accessible for public
or scientists, limiting their exploitations by third-parties. The EC directive
[12] requires only a web user interface to improve the accessibility of
noise maps for the public. To avoid creating an inaccessible information
silo we want to go further than that. Therefore, the NoiseTube platform
exposes a simple web API for publishing or accessing data. Using this API
scientists or developers can use individual or collective noise exposure
data to create web mash-ups or analyse data for scientific purposes.

4.6 Implementation
The current version of the mobile application was written in Java and is
aimed primarily at smart phones running the Symbian/S60 operating sys-
tem. The program was mainly tested on a Nokia N95 8GB smart phone.
Although untested, many other phone brands3 and models are supported as
well, as long as the device supports the Java J2ME platform, with multi-
media and localisation extensions4. A GPS receiver (built-in or an external
unit that is connected via Bluetooth) is needed to localise measures. A ver-
sion for the Apple iPhone is also planned. The server side is implemented
using Ruby on Rails, MySQL, Google Maps and Google Earth.
5. Data credibility
The credibility of measurements is fundamental issue of low-cost sensing.
5.1 Mobile phone as Sound Level Meter
Without proper calibration, sensor devices produce data that may not be
representative or can even be misleading. Experimentation has been con-
ducted to measure the precision of the loudness computed with a mobile
phone compared to a sound level meter5. We generated a pink noise at dif-
ferent levels of decibels (every 5 dB, from 30 to 105) and measured the re-
sults of our algorithm on the Nokia N95 8GB.
Fig. 5. Blue line: results of the distortion of the N95 phone‟s microphone compared to a sound level
meter in the computation of the loudness (Leq). Red line: results after applying post-processing.
3 Initial tests with Sony-Ericsson phones are underway. 4 To be exact the phone should support Java J2ME profile CLDC v1.1 with MIDP
v2.0 (or newer), JSR-179 (Location API) and JSR-135 (Mobile Media API). 5 We used a Voltcraft SL 100, rated DIN EN 60651 Class 3 (precision ± 2.5 dB)

The blue curve on figure 5 shows the response of the microphone com-
pared to a sound level meter. According to this result this phone can be
used as a sound level meter in the interval [35, 100 dB] due to the curve‟s
bijectivity. After applying the inverse function as a post-processing correc-
tor we obtained results with a final precision of ± 4 dB (red line).
5.2 Positioning accuracy
Using the Nokia N95 8GB with its built-in GPS chip an acceptable level of
positioning accuracy in outdoor situations can be achieved. Errors are
rarely bigger than 30 meters, which is still good enough to localise noise
sources within a specific neighbourhood or street. When using an external
GPS receiver positioning accuracy can be slightly improved and the start-
up time is generally shorter. Using an external receiver also has the added
benefit that the phone's battery life is less affected. However, in both cases
indoor positioning is virtually impossible.
6. Discussion and future work
Democratisation of technologies such as NoiseTube will bring new appli-
cations and new questions for the participatory sensing paradigm.
6.1 Roles of citizens
How to sustain a human network at a larger scale and for a longer time
than a local and short-term experimentation or campaign? How to design a
network mixing humans and machines to monitor environmental re-
sources? As far as we know, these questions have not been tackled yet by
the current research on participatory sensing due to the small amount of
participants and so the lack of complex structures. No explicit network to-
pology has been used for the experimentation except the basic „stars‟ to-
pology. But further investigation could take advantage of social relation-
ships, shared interests or reputation (expert/scientist) among the
participants as a solution for problems as data and analysis credibility by
using them not only as sensors but also as filters or regulators.

6.2 Soundscape assessment
Besides the widely deployed loudness measure in noise annoyance re-
search, several studies have shown that acoustics alone can only explain
part of the subjective evaluation of annoyance to sounds [32]. As a conse-
quence other important aspects in the experience of sound perception are
underexposed. It has been shown that things such as the visual aspect,
temperature, wind and sunshine can all influence the evaluation of a
soundscape [29]. Democratising noise pollution measurements provides a
way to gather a most complete picture of the subjective experience, since it
can incorporate acoustic measurements as well as subjective assessments.
6.3 User feedback and awareness
The user experience, especially with the mobile phone application, is cru-
cial to motivate users to contribute. Even though the current version allows
users to visualize noise exposure in real-time, we would like to improve
the feedback by giving interesting insights coming from the collective ex-
perience, e.g. a map to highlight unusual pollution measured by other par-
ticipants, in order to support local decision-making. Furthermore, we are
planning to develop more features related to the social translucence to sus-
tain motivation, accountability and participation.
6.4 Data credibility at the collective level
Until now we have focussed on the credibility of the sensors (micro-
phones, GPS). However, once a collective collection of noise data is un-
derway we will also need to deal with data credibility among users, e.g. in
case of contradictory measurements. This will affect the way the system
aggregates, analyses and filters measurements.
7. Conclusion
In this paper we presented NoiseTube, a project aimed at developing a par-
ticipative noise pollution monitoring network to enable citizens as well as
governmental bodies and non-governmental organisations to gain aware-
ness of and insight into the problem of urban noise pollution and its social
implications. We discussed our approach and the supporting rationale as
well as a prototype implementation. While this project is still in an early

stage we are planning to open up a first public experiment soon to evaluate
user experiences and participation, as well as the credibility of the gener-
ated noise maps compared to traditional ones.
8. Acknowledgements
This work was partially supported by the EU under contract IST-34721
(TAGora). The TAGora project is funded by the Future and Emerging
Technologies program (IST-FET) of the European Commission. Matthias
Stevens is a research assistant of the Fund for Scientific Research, Flan-
ders (Aspirant van het Fonds Wetenschappelijk Onderzoek - Vlaanderen).
9. References
[1] Bandura, A. (2001). Social cognitive theory: An agentic perspective. Annual Re-
view of Psychology, 52(1), pp. 1-26, Annual Reviews.
[2] Nardi B. A., Schiano D.J. and Gumbrecht M. (2004). Blogging as Social Activity or
‘Would You Let 900 Million People Read Your Diary?’. Proceedings of the 2004
ACM conference on Computer supported cooperative work, pp. 222-231, ACM.
[4] Burke J. et al. (2006). Participatory Sensing. In ACM Sensys workshop on World-
Sensor-Web (WSW‟06): Mobile Device Centric Sensor Networks and Applications.
[5] Campbell A. T. et al. (2008). The Rise of People-Centric Sensing. In IEEE Internet
Computing, 12(4), special issue on sensor networks, pp. 12-21, IEEE Computer So-
ciety.
[6] Cardon. D, Aguiton C. (2007). The Strength of Weak Cooperation: an Attempt to
Understand the Meaning of Web 2.0. Communications & Strategies, 65, pp. 51-65.
[7] Corbett J. et al. (2006). Mapping for Change: The emergence of a new practice.
PLA 54:13-19 IIED, London, UK.
[8] Cuff D., Hansen M. and Kang J. (2008). Urban Sensing: out of the woods. Commu-
nications of the ACM, 51(3), pp. 24-33, March 2008, ACM.
[9] Ellul C., Haklay M. (2008). Creating Community Maps for the London Thames
Gateway. IBG Annual International Conference.
[10] Erickson T. & Kellogg W. (2003). Social Translucence: Using Minimalist Visuali-
zations of Social Activity to Support Collective Interaction. Designing Information
Spaces: The Social Navigation Approach, pp 17-42, Series: Computer Supported
Cooperative Work, Springer.
[11] European Commission (1996). Green Paper on Future Noise Policy.
[12] European Commission (2002), Directive 2002/49/EC Assessment and management
of environmental noise.
[13] European Commission Working Group: Assessment of Exposure to Noise (WG-
AEN) (2006). Good practice guide for strategic noise mapping and the production
of data on noise exposure, Version 2.

[14] Fogg B.J. (2007). Mobile Persuasion: 20 Perspectives on the Future of Behavior
Change, Stanford Captology Media.
[15] Harper M. et al. (2007). Social Comparisons to Motivate Contributions to an Online
Community. Persuasive Technology, Lecture Notes in Computer Science, 4744, pp.
148-159, Springer.
[16] Hepworth P. (2006). Accuracy implications of computerized noise predictions for
environmental noise mapping. International congress on Noise Control Engineering
(Inter-Noise 2006).
[17] Musser J, O'Reilly T. and the O'Reilly Radar Team (2007). Web 2.0: Principles and
Best Practices. O'Reilly Media.
[18] Paulos, E. et al. (2007). Sensing Atmosphere. ACM Conference on Embedded Net-
worked Sensor Systems (SenSys 2007).
[19] Paulos, E. et al. (2008). Citizen Science: Enabling Participatory Urbanism. Hand-
book of Research on Urban Informatics: The Practice and Promise of the Real-
Time City, Marcus Foth (Ed.), pp. 414-436, Idea Group.
[20] Paxton, M. (2008). Participate: Producing A Mass Scale Environmental Campaign
for Pervasive Technology. International conference on Pervasive Computing (Per-
vasive 2008), Workshop on Pervasive Persuasive Technology and Environmental
Sustainability (PPT&ES).
[21] Rashid, A. M. et al (2006). Motivating participation by displaying the value of con-
tribution. Proceedings of the SIGCHI conference on Human Factors in computing
systems, pp. 955-958, ACM.
[22] Rogers. E. M. (2003). Diffusion of Innovations, 5th Edition. Free Press.
[23] Romer K. and Mattern F. (2004). The design space of wireless sensor networks.
IEEE Wireless Communications, 11(6), pp. 54-61, IEEE Communications Society.
[24] Santini, S. et al. (2008). First experiences using wireless sensor networks for noise
pollution monitoring. European Conference on Computer Systems: Proceedings of
the workshop on Real-world wireless sensor networks (REALWSN‟08), pp. 61-65,
ACM.
[25] Stapelfeldt H. (2001). Building noise maps, Public Servant Daily.
[26] Stapelfeldt H. and A. Jellyman (2003).Using GIS in Noise exposure analysis , Inter-
national Congress and Exposition on Noise Control Engineering (Inter-Noise 2003).
[27] Steels, L. and Tiselli E. (2008). Social Tagging in Community Memories. Proceed-
ings of the AAAI Spring Symposium on Social Information Processing, AAAI.
[28] Steels, L. and Tiselli E. (2008). Interfaces for Community Memories. Proceedings of
the ACM International User Interface Conference IUI-2008, Workshop
on Intelligent User Interfaces for Developing Regions, pp. 23-28, ACM.
[29] Wahlgren. E, (2008). Pocket Protector. Journal of life of sciences, Febr. 13, 2008.
[30] Yong E. (2008). City songbirds change their tune. New Scientist, 197(2649), pp.
33-35, Reed Business Information/Elsevier.
[31] Yu L. and Kang J. (2008). Effects of social, demographical and behavioral factors
on the sound level evaluation in urban open spaces. Journal of the Acoustical Soci-
ety of America, 123(2), pp. 772-83.
[32] Zhang M. & Kang J. (2007). Towards the evaluation, description, and creation of
soundscapes in urban open spaces. Environment and Planning B-Planning & De-
sign, 34(1), pp. 68-86.