NOISE TECHNICAL REPORT - Montgomery Planning · The assessment of noise for the proposed Purple...
41
NOISE TECHNICAL REPORT AUGUST 2013
-
Upload
nguyendang -
Category
Documents
-
view
217 -
download
0
Transcript of NOISE TECHNICAL REPORT - Montgomery Planning · The assessment of noise for the proposed Purple...
NOISETECHNICALREPORT
AUGUST2013
August 2013 Purple Line – Noise Technical Report
i
Table of Contents
1. Introduction and Project Description ..................................................................................................................... 1
1.1 Introduction ................................................................................................................................................... 1
1.2 Project Description ....................................................................................................................................... 1
1.2.1 Preferred Alternative ................................................................................................................................ 1
2. Regulatory Context and Methodology ................................................................................................................... 3
2.1 Overview of Noise ........................................................................................................................................ 3
2.2 Methodology ................................................................................................................................................. 4
2.3 FTA Criteria .................................................................................................................................................. 4
3. Affected Environment ............................................................................................................................................ 8
4. Environmental Consequences ............................................................................................................................ 15
4.1 Long-term Operational Effects .................................................................................................................... 15
4.1.1 Noise Sources Related to LRT Vehicle Operations................................................................................ 15
Transit Line Operating Assumptions ............................................................................................................... 15
Operational Noise Effects ............................................................................................................................... 16
4.1.2 Other Noise Sources .............................................................................................................................. 17
4.1.3 Avoidance and Minimization ................................................................................................................... 17
4.1.4 Mitigation ................................................................................................................................................ 22
4.2 Short-term Construction Effects .................................................................................................................. 22
4.2.1 Construction Methods ............................................................................................................................ 22
4.2.2 Potential Impacts .................................................................................................................................... 22
4.2.3 Avoidance and Minimization ................................................................................................................... 23
5. References .......................................................................................................................................................... 24
Appendices
Appendix A – List of Acronyms and Abbreviations
Appendix B – Glossary/Terminology
Appendix C – Calibration Certificates
August 2013 Purple Line – Noise Technical Report
ii Purple Line Final Environmental Impact Statement and Draft Section 4(f) Evaluation
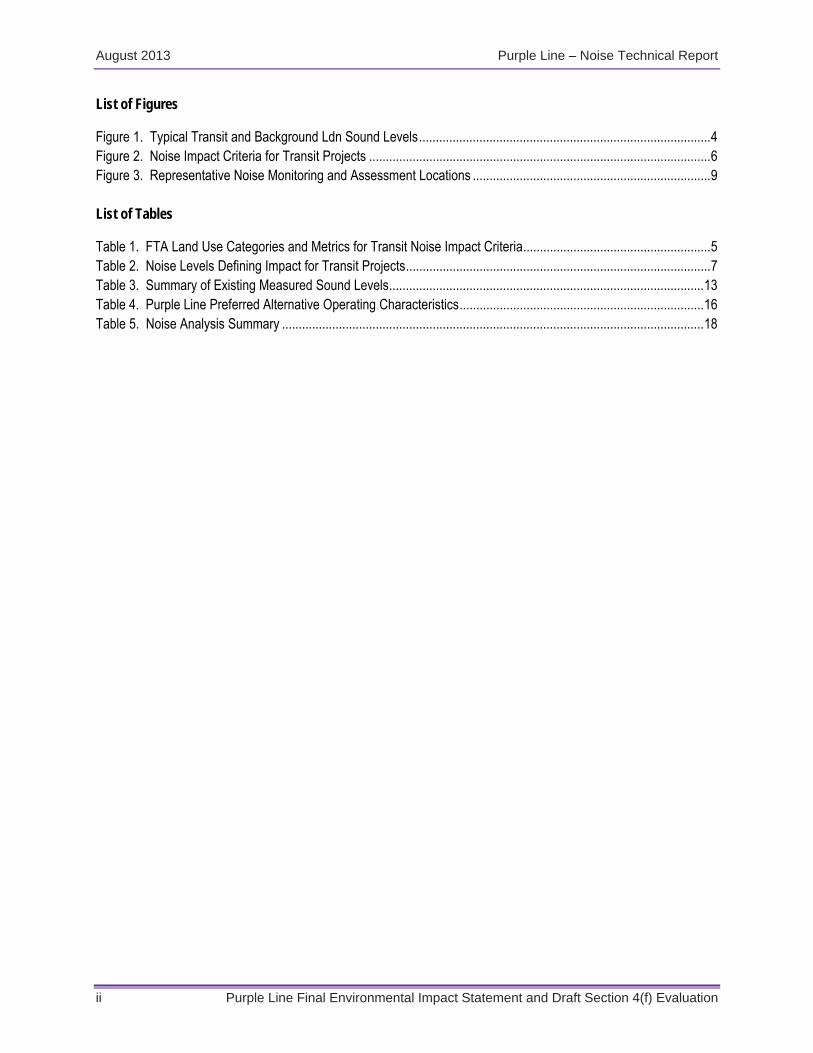
List of Figures
Figure 1. Typical Transit and Background Ldn Sound Levels ....................................................................................... 4 Figure 2. Noise Impact Criteria for Transit Projects ...................................................................................................... 6 Figure 3. Representative Noise Monitoring and Assessment Locations ....................................................................... 9 List of Tables
Table 1. FTA Land Use Categories and Metrics for Transit Noise Impact Criteria ........................................................ 5 Table 2. Noise Levels Defining Impact for Transit Projects ........................................................................................... 7 Table 3. Summary of Existing Measured Sound Levels .............................................................................................. 13 Table 4. Purple Line Preferred Alternative Operating Characteristics ......................................................................... 16 Table 5. Noise Analysis Summary .............................................................................................................................. 18
August 2013 Purple Line – Noise Technical Report
Purple Line Final Environmental Impact Statement and Draft Section 4(f) Evaluation 1
1. Introduction and Project Description
1.1 Introduction The construction and operation of the Purple Line has the potential to increase noise levels at sensitive land uses near the project corridor. Whether an increase in noise generated from the operation of the proposed Purple Line light rail system is perceptible depends on the relationship between noises generated by the operations of the light rail transit system relative to existing community background noise levels. The following analysis describes the existing noise environment, estimates project-related noise exposure, and then compares the project generated noise levels against the appropriate FTA impact criteria..
This Noise Technical Report documents the impact assessment methodology used to evaluate potential noise impacts associated with the operation of the Preferred Alternative. The report provides an assessment at a series of representative receptor sites identified throughout the project study area, and it describes measures that have been incorporated into the design to reduce project-related noise.
The assessment of noise for the proposed Purple Line followed procedures outlined in the Federal Transit Administration (FTA) Transit Noise and Vibration Impact Assessment (May 2006) manual.
1.2 Project Description The Purple Line is a proposed 16.2-mile transit line located north and northeast of Washington DC, inside the circumferential I-95/I-495 Capital Beltway. The Purple Line would extend between Bethesda in Montgomery County and New Carrollton in Prince George’s County. The “Purple Line corridor” includes five major activity centers: Bethesda, Silver Spring, Takoma/Langley Park, College Park, and New Carrollton.
The purposes of the Purple Line project are the following:
Provide faster, more direct, and more reliable east-west transit service connecting the major activity centers in the Purple Line corridor at Bethesda, Silver Spring, Takoma/Langley Park, College Park, and New Carrollton,
Provide better connections to Metrorail services located in the corridor, and Improve connectivity to the communities in the corridor located between the Metrorail lines.
The noise analysis does not assess the effects of the No Build Alternative, or compare the Preferred Alternative to the No Build Alternative. Instead the Purple Line Preferred Alternative service operations, as described below, will be discussed and compared to FTA noise exposure and impact criteria.
1.2.1 Preferred Alternative The Preferred Alternative would be at grade except for one short tunnel section and three sections elevated on structures. The Preferred Alternative would operate mainly in dedicated or exclusive lanes, providing fast, reliable transit operations.
There following 21 stations are planned for the Preferred Alternative:
Bethesda Chevy Chase Lake Lyttonsville Woodside/16th Street Silver Spring Transit Center Silver Spring Library
Riggs Road Adelphi Road/West Campus UM Campus Center East Campus College Park M Square
August 2013 Purple Line – Noise Technical Report
2 Purple Line Final Environmental Impact Statement and Draft Section 4(f) Evaluation
Dale Drive Manchester Place Long Branch Piney Branch Road Takoma/Langley Transit Center
Riverdale Park Beacon Heights Annapolis Road/Glenridge New Carrollton
Stations would include ticket vending machines, weather shelters for passengers, lighting, wayfinding and informational signage, trash receptacles, seating, and security equipment such as emergency telephones and closed circuit television cameras. Most riders would walk to the stations or transfer from other transit services. Access plans for each station have been developed to enhance pedestrian and transit access for nearby communities. The stations would have either side or center platforms depending on the site characteristics and space availability.
Two storage and maintenance facilities are proposed: one at Lyttonsville in Montgomery County and the other at Glenridge in Prince George’s County. Additionally, traction power substations, used to convert electric power to appropriate voltage and type to power the light rail vehicles, would be required approximately every mile.
As part of the Preferred Alternative the permanent Capital Crescent Trail would be constructed within the Georgetown Branch right-of-way for a distance of 3.3 miles between Bethesda and the CSXT Metropolitan Branch. At the junction with the CSXT the trail is planned to continue on the north side of the CSXT corridor to the SSTC. The permanent Capital Crescent Trail would replace the existing Georgetown Branch Interim Trail which currently extends from Bethesda to Stewart Avenue within the Georgetown Branch right-of-way. The completion of the trail along the CSXT corridor is contingent on agreement with CSXT on the use of their property on the north side of the CSXT tracks for the trail. If agreement is not reached by the time the Purple Line construction occurs, MTA would construct the trail from Bethesda to Talbot Avenue. From Talbot Avenue to Silver Spring an interim signed bike route on local streets would be used. MTA will plan, design, and construct the permanent Capital Crescent Trail between Bethesda and Silver Spring concurrently with the Purple Line. The Capital Crescent Trail will be owned and operated by Montgomery County, which will be responsible for providing the funds to construct it.

August 2013 Purple Line – Noise Technical Report
Purple Line Final Environmental Impact Statement and Draft Section 4(f) Evaluation 3
2. Regulatory Context and Methodology
2.1 Overview of Noise Noise is typically defined as unwanted or undesirable sound. Physically in the natural environment, sound is generated by the vibration of the air molecules. The vibrations of the air molecules result in small fluctuations in air pressure. A sound wave is created when a series of these pressure changes move through the air. Sound waves vibrate at different rates (number of times per second) or "frequencies." The faster an object vibrates, the higher the frequency of the sound wave and the resulting sound level. The basic parameters of environmental noise that affect human subjective response are: (1) intensity or level; (2) frequency content; and (3) variation with time. Intensity or level is determined by how greatly the sound pressure fluctuates above and below the atmospheric pressure, and is expressed on a logarithmic compressed scale in units of decibels (dB). By using this scale, the range of normally encountered sound can be expressed by values between 0 and 120 decibels. On a relative basis, a 3-decibel change in sound level generally represents a barely-noticeable change outside the laboratory, whereas a 10-decibel change in sound level would typically be perceived as a doubling (or halving) in the loudness of a sound.
The frequency content of noise is related to the tone or pitch of the sound, and is expressed based on the rate of the air pressure fluctuation in terms of cycles per second (called Hertz and abbreviated as Hz). The human ear can detect a wide range of frequencies from about 20 Hz to 17,000 Hz. However, because the sensitivity of human hearing varies with frequency, an octave band weighting system is commonly used when measuring environmental noise to provide a single number descriptor that correlates well with human subjective response to changes in sound. Noise levels measured using this weighting system are called “A-weighted” noise levels and are expressed in decibel notation as “dB(A).” The A-weighted noise level is widely accepted by acousticians as a best unit for describing human response to environmental noise and all federal and state impact criteria or exposure measures have been developed use the dB(A) weighting metric.
Because environmental noise fluctuates from moment to moment, it is common practice to condense all of this information into a single number, called the “equivalent” noise level (Leq). Leq can be thought of as the steady noise level that represents the same sound energy as the varying noise levels over a specified time period (typically 1-hour). Often the Leq values over a 24-hour period are used to calculate cumulative noise exposure. One such measure is the Day-Night Sound Level (Ldn). The Ldn noise descriptor is the A-weighed Leq for a 24-hour period with a 10-decibel penalty added to noise levels that occur during the nighttime hours (between 10 PM and 7 AM). The Ldn descriptor was developed to account for the fact that people tend to be more sensitive to sound during the typical sleeping hours. Many surveys have shown that Ldn is well correlated with human annoyance, and therefore this descriptor is widely used to describe how humans perceive environmental noise. Figure 1 provides examples of typical noise levels generated by various activities in terms of Ldn. While the extremes of Ldn are typically range from 50 dB(A) in a small town residential environment to 80 dB(A) in a downtown city, Ldn is generally found to range between 55 dB(A) and 75 dB(A) in most communities.

August 2013 Purple Line – Noise Technical Report
4 Purple Line Final Environmental Impact Statement and Draft Section 4(f) Evaluation
Figure 1. Typical Transit and Background Ldn Sound Levels
Source: Transit Noise and Vibration Impact Assessment, FTA, May 2006
2.2 Methodology The following methodology was implemented for the noise analysis:
Identify representative noise-sensitive properties and land uses within the study area that would potentially be adversely affected by the operation of the Preferred Alternative.
Measure existing ambient noise levels at each representative noise-sensitive receptor location. Estimate project-related noise exposure levels at each receptor location and compare with the FTA impact
criteria. Identify reasonable and feasible design refinements that would reduce project-related noise and incorporate
them into the project.
2.3 FTA Criteria The noise impact assessment was completed in accordance with procedures and analysis methodologies contained in the FTA’s Transit Noise and Vibration Impact Assessment (FTA 2006). The initial review of the

August 2013 Purple Line – Noise Technical Report
Purple Line Final Environmental Impact Statement and Draft Section 4(f) Evaluation 5
project aerial maps determined noise sensitive areas and/or receivers of interest were present within or adjacent to the proposed action.
The noise criteria and descriptors required by FTA to determine impacts depend on land use type as shown in Table 1. The FTA criteria groups noise sensitive land uses into the following three categories:
Category 1: Tracts of land where quiet is an essential element in their intended purpose. This category includes lands set aside for serenity and quiet and such land uses as recording studios and concert halls. National historic landmarks with significant outdoor usage would also be included in this category.
Category 2: Residences and buildings where people normally sleep. This category includes residences, hospitals, motels, and hotels where sensitivity to nighttime noise is assumed to be of utmost importance.
Category 3: Institutional land uses with primarily daytime and evening use. This category includes schools, libraries, theaters, and churches where it is important to avoid interference with such activities as speech, meditation, and concentration on reading material, as well as other uses listed in Table 1.
Table 1. FTA Land Use Categories and Metrics for Transit Noise Impact Criteria
Land Use Category
Noise Metric (dBA) Description of Land Use Category
1 Outdoor Leq(h)*
Tracts of land whe re quiet is an essential element in their intended purpose. This category includes lands set aside for s erenity and quiet and such land uses as outdoor theater and concert pavilions.
2 Outdoor Ldn Residences and buildings where people normally sleep. This cat egory includes homes, hospitals and hotels where a nighttime sensitivity to noise is assumed to be of utmost importance.
3 Outdoor Leq(h)*
Institutional land uses with primarily daytime and evening use. This category includes schools, libraries, and churches where it is important to avoid interference with such activities as speech, meditation and concentration on reading material. Active parks. Buildings with interior spaces where quiet is important, such as medical offices and conference rooms, recording studios and concert halls, fall into this category. Places of worship, meditation or study associated with c emeteries, monuments, museums and certain historical sites are also included.
Land use Categories 1 and 3 (primarily daytime uses) were assessed using the peak hour equivalent noise level (Leq(h)) descriptor, while land use Category 2 (daytime and nighttime use) was assessed using the previously-described Ldn descriptor. Both the Leq(h) and Ldn descriptors report noise as dB(A) levels. The FTA criteria do not generally apply to industrial or commercial areas since those areas are generally not considered noise sensitive and are compatible with places consistent with high ambient noise conditions.
The FTA impact criteria compare existing measured ambient outdoor noise levels with the noise estimated to be generated solely by the transit noise sources as defined by the service operations of the Preferred Alternative. The severity of noise impact is characterized by two curves (illustrated in Figure 2) that allow for higher project noise exposure where there are higher levels of existing background noise, up to a threshold level beyond which project noise exposure would result in an impact. The left vertical axis in Figure 2 applies to FTA land use Categories 1 and 2 and the right vertical axis to Category 3. Noise levels above the top curve are considered to cause Severe Impact resulting in a substantial percentage of people living in the area to be highly annoyed by the new noise source. Noise levels in the range between the two curves are deemed to be Moderate Impacts, and levels below the bottom curve are deemed to cause No Impact. Table 2 shows this same information in a tabular format.

August 2013 Purple Line – Noise Technical Report
6 Purple Line Final Environmental Impact Statement and Draft Section 4(f) Evaluation
Figure 2. Noise Impact Criteria for Transit Projects
Source: Transit Noise and Vibration Impact Assessment, FTA, 2006

August 2013 Purple Line – Noise Technical Report
Purple Line Final Environmental Impact Statement and Draft Section 4(f) Evaluation 7
Table 2. Noise Levels Defining Impact for Transit Projects
Source: Transit Noise and Vibration Impact Assessment, Federal Transit Administration, May 2006

August 2013 Purple Line – Noise Technical Report
8 Purple Line Final Environmental Impact Statement and Draft Section 4(f) Evaluation
3. Affected Environment The FTA recommends applying a screening procedure to determine if there is a likelihood of noise impact from a project. The areas defined by the screening distances are meant to be sufficiently large to encompass all potentially impacted locations, and they are determined using relatively high-capacity scenarios for a given project type. The FTA screening distance for transitways is 350 feet for sites with an unobstructed line of sight to the transit facility. For proposed yard and maintenance facilities, the screening distance is 1,000 feet. These screening distances were applied from the centerline of the proposed transit corridor to determine the study area limits for noise analysis purposes.
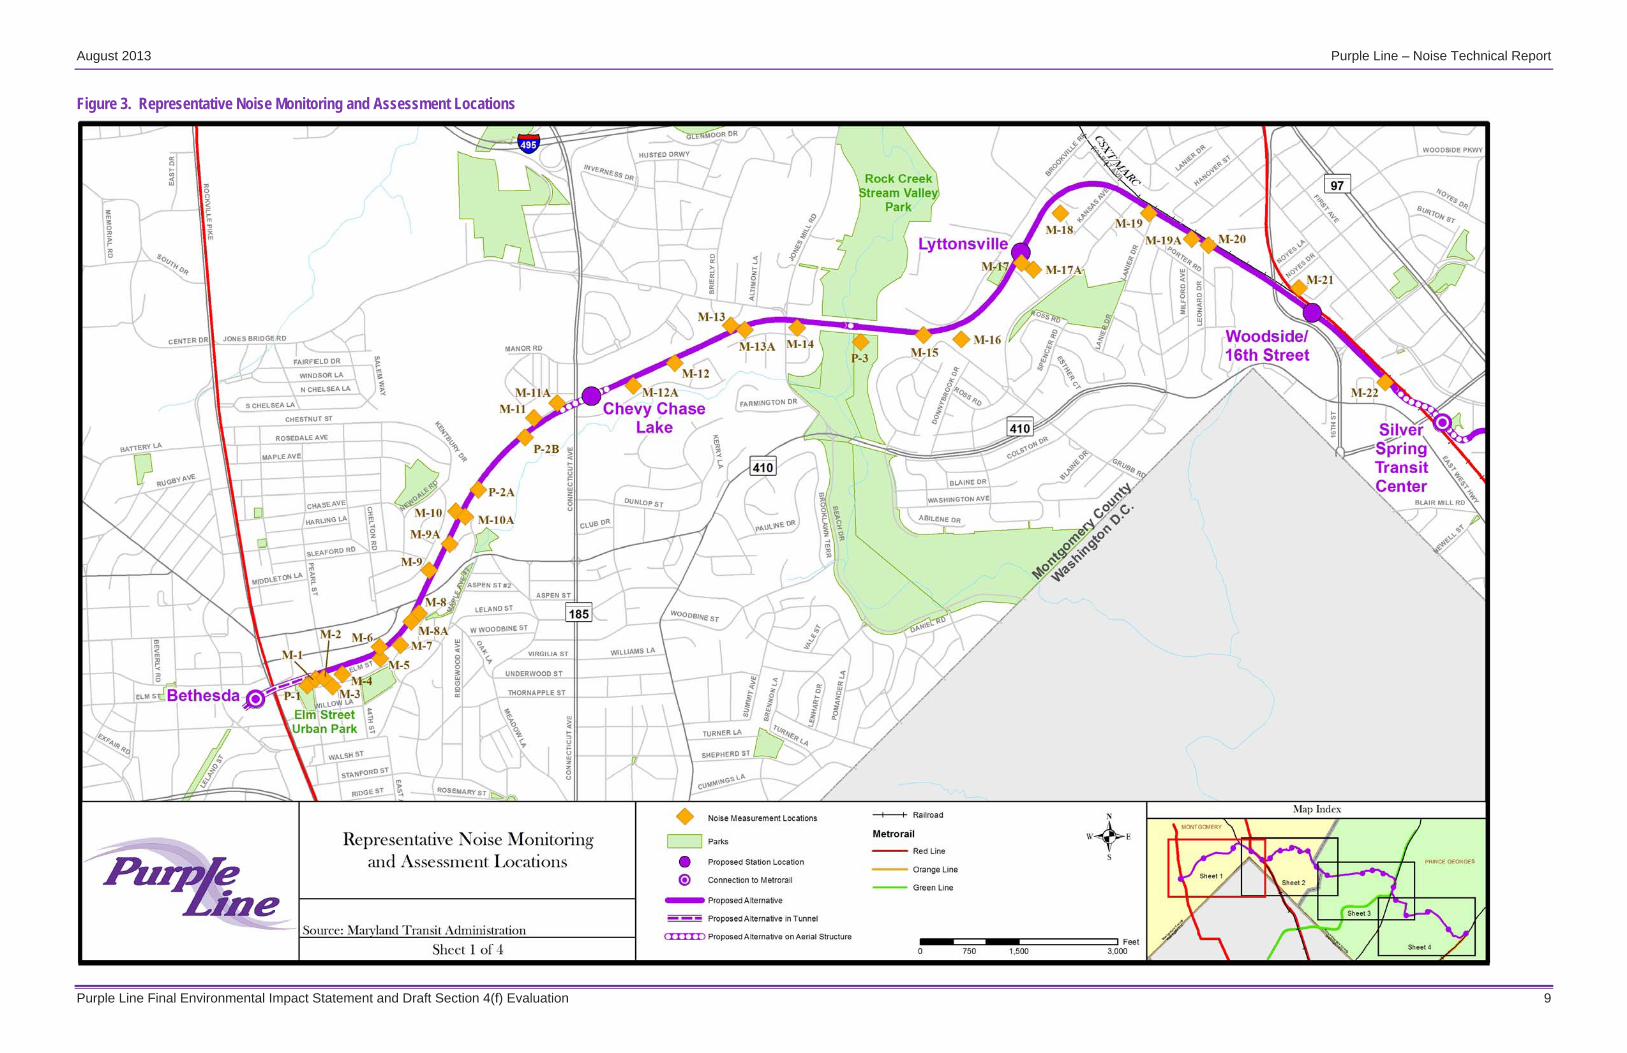
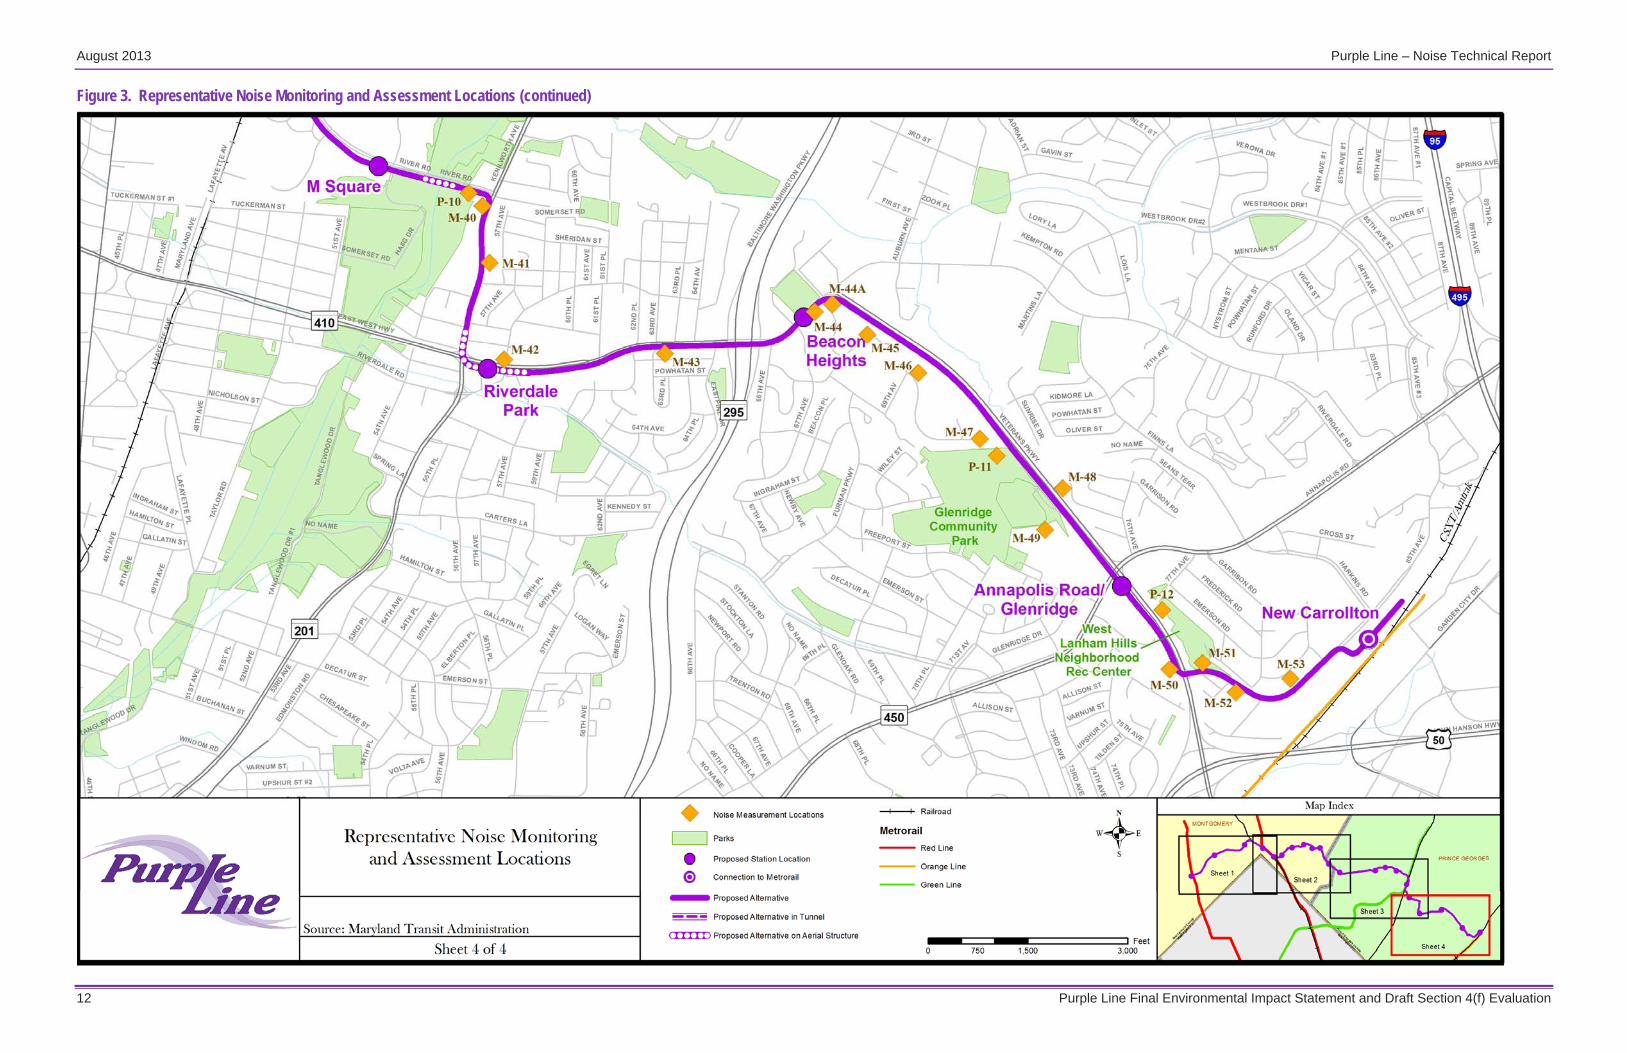
As depicted in Figure 3, eighty-three representative sites within this study area were chosen for noise monitoring and analysis. Within a given land use category, noise measurements recorded at one site may be representative of existing conditions and future noise exposure at that site and all other similarly located nearby sites within that FTA land use category. Therefore, some monitoring locations were selected on the basis of site equivalence where the measurement results collected at one site were applied to multiple sites. Physical and operational parameters that would produce the worst-case noise effect—such as train speed, frequency of operation, and distance to track—were accounted for in the determination of representative 24-hour noise measurement sites.
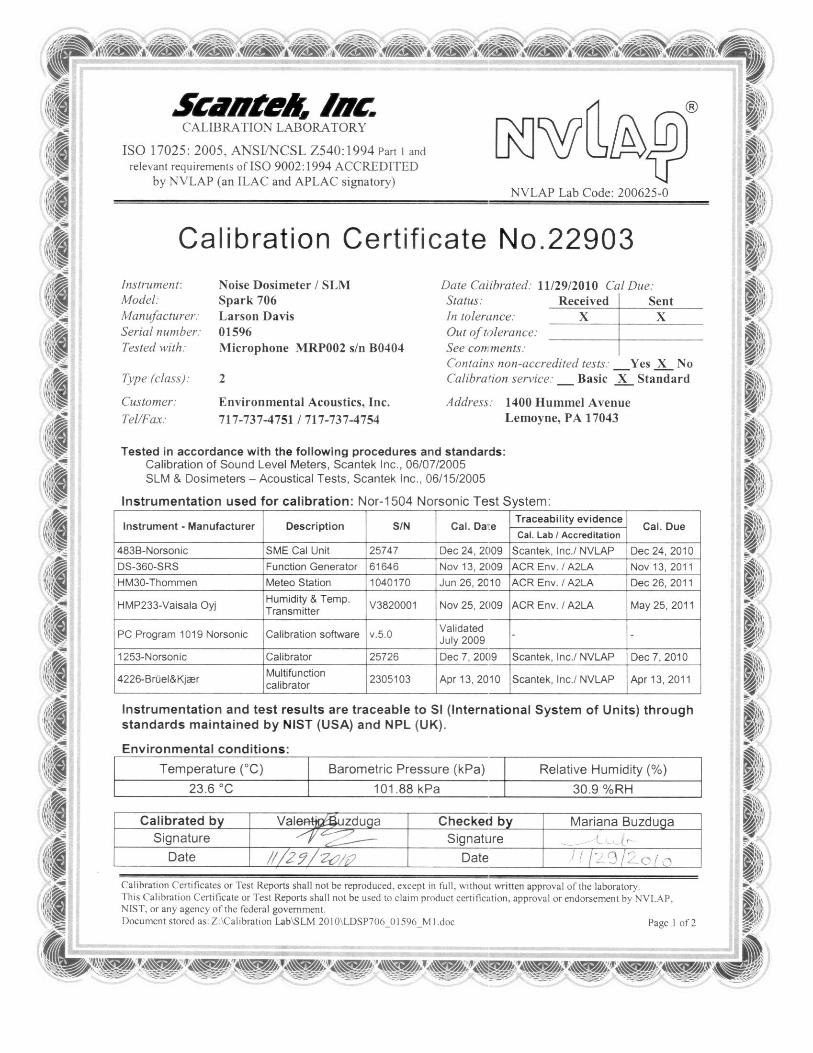
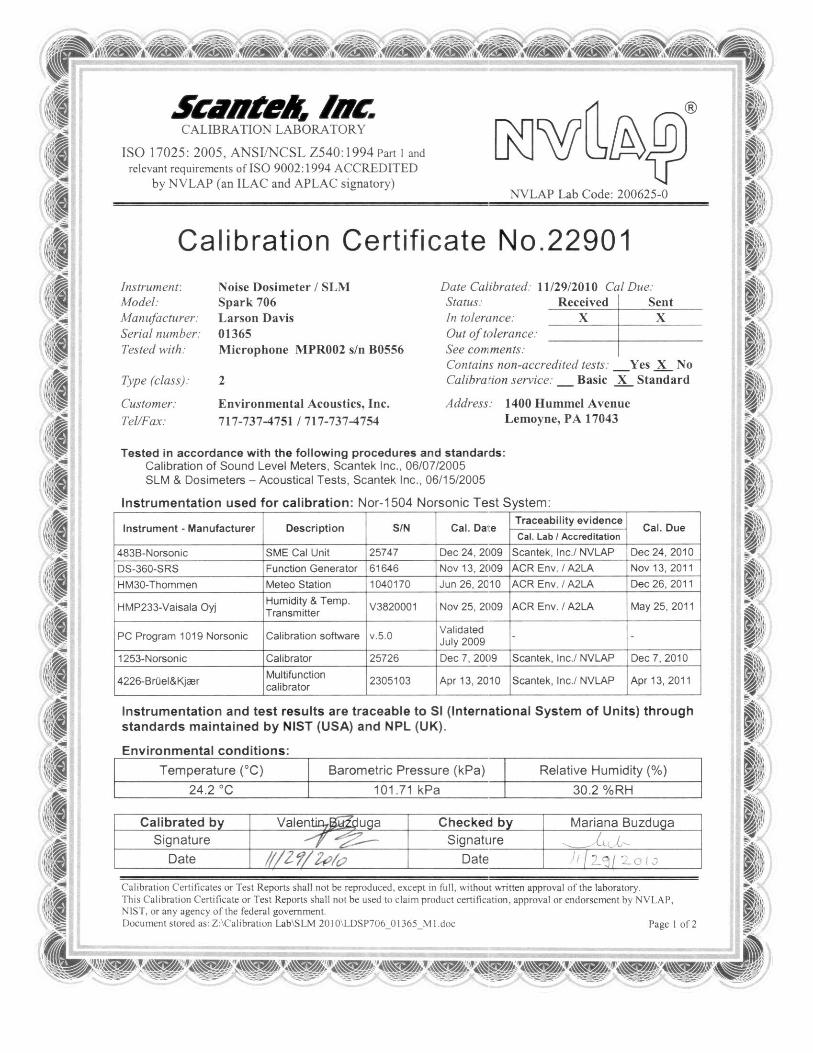
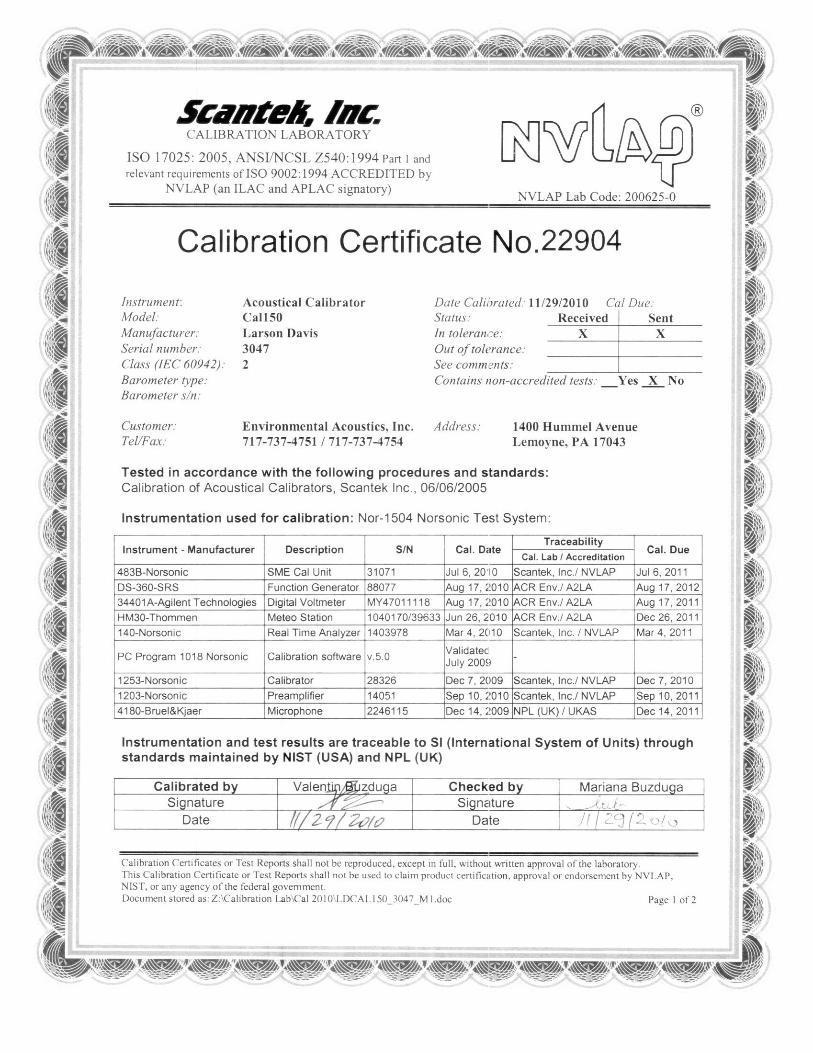
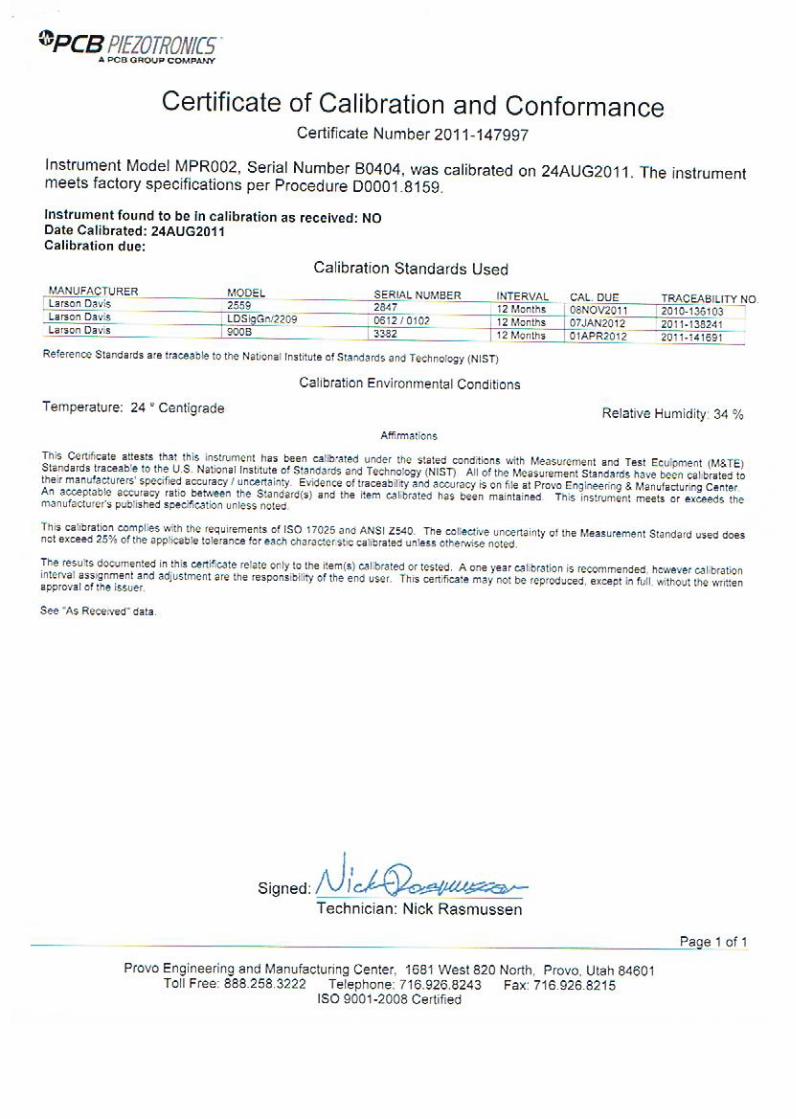
All field measurements were collected in accordance with the procedures described in FHWA’s Measurement of Highway-Related Noise (Report Number FHWA-DP-96-046, May 1996). A calibrated set of Rion and Larson Davis noise measuring equipment was used in the study, including Rion NA-28 and NA-27 and Larson Davis (LD) 706 meters. The Rion equipment was used for all short-term peak hour noise readings, with the LD 706 noise meter used for collecting long-term noise measurements. All noise measurements were collected under acceptable weather and roadway conditions (rain free days with dry roadway pavements and wind speeds less than 12 mph).
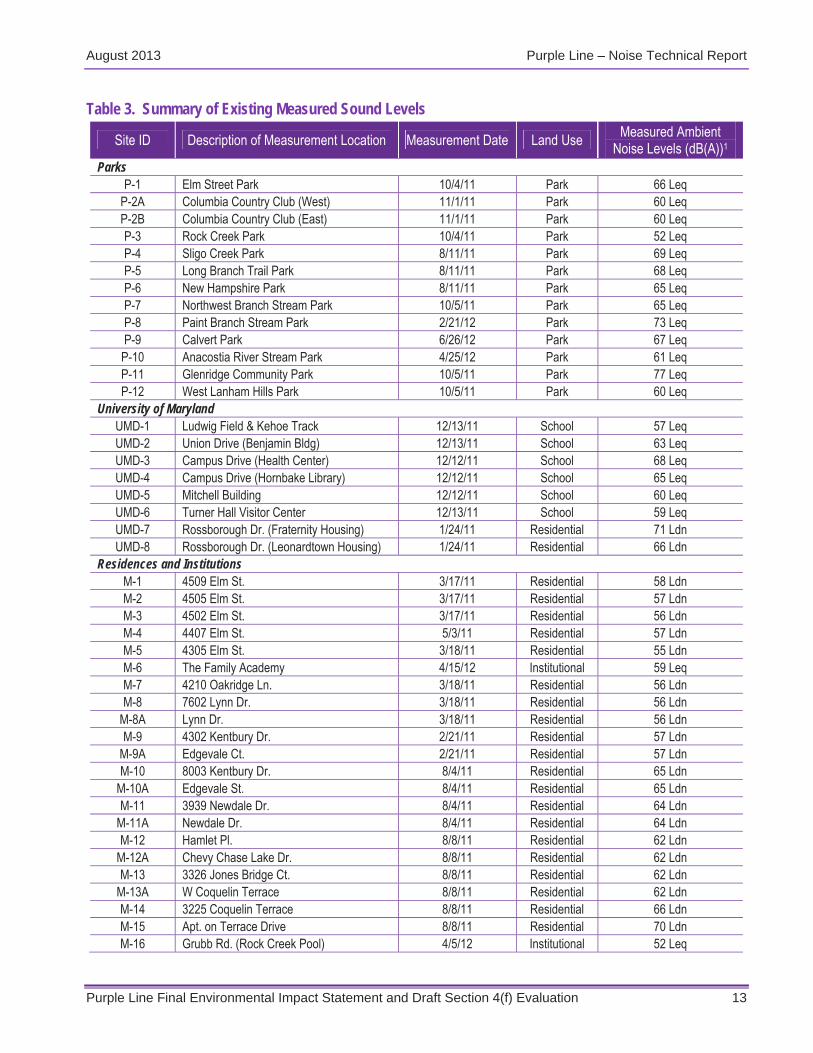
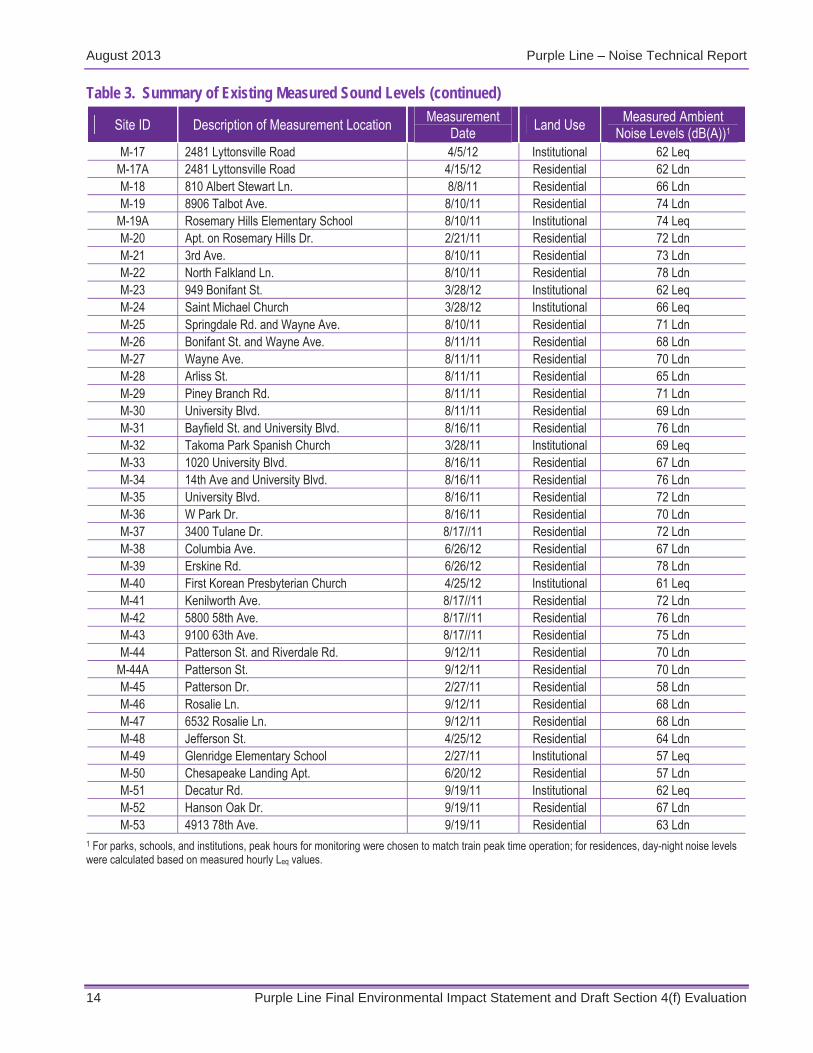
The MTA requested access to residential properties throughout the corridor to monitor existing noise levels and received consent from all property owners prior to initiation of monitoring activities. Noise measurements were collected between January 2011 and June 2012. Table 3 provides a summary of the measurements collected at 13 park locations, 8 locations at the University of Maryland College Park campus, and 62 residential and institutional (e.g., schools, churches, and pools) sites.
As shown in Table 3, the calculated Ldn values based on measured Leq noise levels at residential land uses within the study area ranged from 55 dB(A) at Receptor M-5 (single-family residences along Elm Street in Chevy Chase) to 78 dB(A) at Receptor Sites M-22 (multi-family residences along Falkland Lane in Silver Spring) and M-39 (a residential property on Erskine Road in College Park). In general, the lower Ldn noise levels occurred in suburban communities, while the higher noise levels typically occurred in more urban areas and adjacent to roadways with greater vehicular traffic.
Measured Leq noise levels at parks within the study area ranged from 52 dB(A) at Receptor P-3 (Rock Creek Stream Valley Park) to 77 dB(A) at Receptor P-11 (Glenridge Community Park). Leq noise levels measured at University of Maryland receptors within the study area ranged from 57 dB(A) at Receptor UMD-1 (Ludwig Field & Kehoe Track) to 68 dB(A) at Receptor UMD-3 (Health Center on Campus Drive). Calculated Ldn noise levels based on measurements taken at residential properties located within the university campus property along Rossborough Drive ranged from 66 dB(A) at Site UMD-8 (Leonardtown Housing) to 71 dB(A) at Site UMD-7 (Fraternity Housing). Measured Leq noise levels at institutional receptors in the study area ranged from 52 dB(A) at Receptor M-16 (Rock Creek Pool on Grubb Road) to 74 dB(A) at Receptor M-19A (Rosemary Hills Elementary School). Based on the field measurement data, the high ambient noise conditions reported at some residential and other noise-sensitive monitoring locations reflect their close proximity to active roadways and existing freight rail corridors.
August 2013 Purple Line – Noise Technical Report
Purple Line Final Environmental Impact Statement and Draft Section 4(f) Evaluation 9
Figure 3. Representative Noise Monitoring and Assessment Locations
August 2013 Purple Line – Noise Technical Report
10 Purple Line Final Environmental Impact Statement and Draft Section 4(f) Evaluation
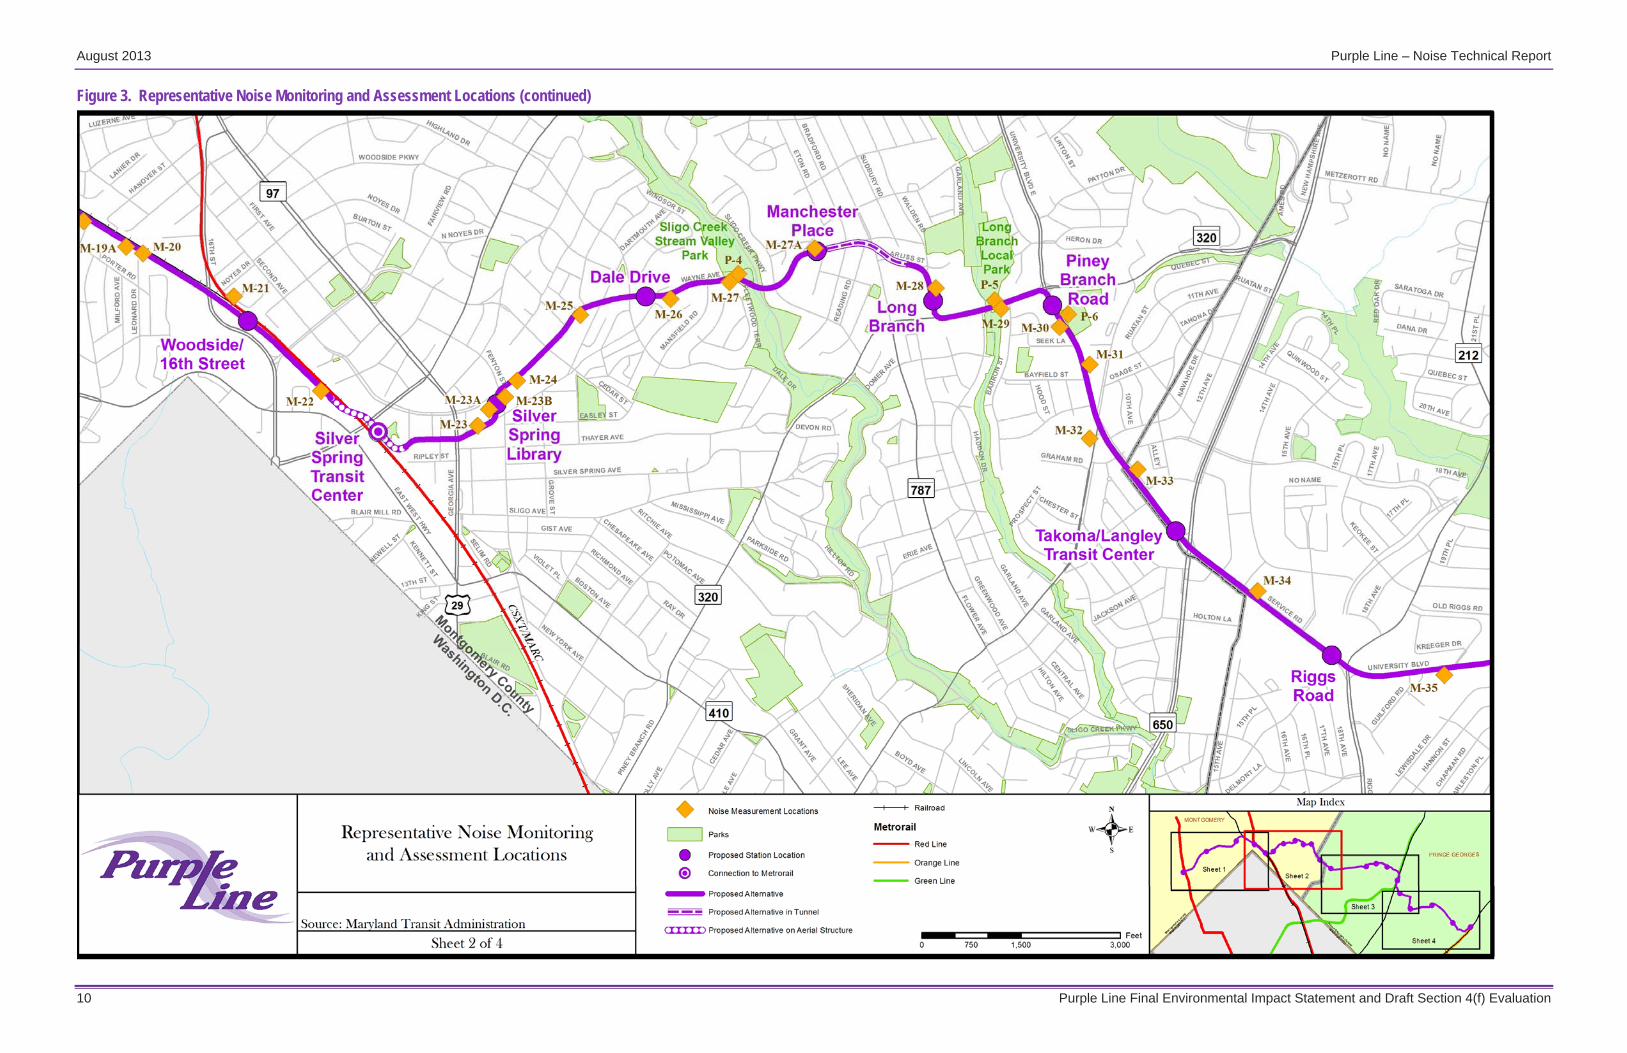
Figure 3. Representative Noise Monitoring and Assessment Locations (continued)

August 2013 Purple Line – Noise Technical Report
Purple Line Final Environmental Impact Statement and Draft Section 4(f) Evaluation 11
Figure 3. Representative Noise Monitoring and Assessment Locations (continued)
August 2013 Purple Line – Noise Technical Report
12 Purple Line Final Environmental Impact Statement and Draft Section 4(f) Evaluation
Figure 3. Representative Noise Monitoring and Assessment Locations (continued)
August 2013 Purple Line – Noise Technical Report
Purple Line Final Environmental Impact Statement and Draft Section 4(f) Evaluation 13
Table 3. Summary of Existing Measured Sound Levels
Site ID Description of Measurement Location Measurement Date Land Use Measured Ambient Noise Levels (dB(A))1
Parks P-1 Elm Street Park 10/4/11 Park 66 Leq
P-2A Columbia Country Club (West) 11/1/11 Park 60 Leq P-2B Columbia Country Club (East) 11/1/11 Park 60 Leq P-3 Rock Creek Park 10/4/11 Park 52 Leq P-4 Sligo Creek Park 8/11/11 Park 69 Leq P-5 Long Branch Trail Park 8/11/11 Park 68 Leq P-6 New Hampshire Park 8/11/11 Park 65 Leq P-7 Northwest Branch Stream Park 10/5/11 Park 65 Leq P-8 Paint Branch Stream Park 2/21/12 Park 73 Leq P-9 Calvert Park 6/26/12 Park 67 Leq P-10 Anacostia River Stream Park 4/25/12 Park 61 Leq P-11 Glenridge Community Park 10/5/11 Park 77 Leq P-12 West Lanham Hills Park 10/5/11 Park 60 Leq
University of Maryland UMD-1 Ludwig Field & Kehoe Track 12/13/11 School 57 Leq UMD-2 Union Drive (Benjamin Bldg) 12/13/11 School 63 Leq UMD-3 Campus Drive (Health Center) 12/12/11 School 68 Leq UMD-4 Campus Drive (Hornbake Library) 12/12/11 School 65 Leq UMD-5 Mitchell Building 12/12/11 School 60 Leq UMD-6 Turner Hall Visitor Center 12/13/11 School 59 Leq UMD-7 Rossborough Dr. (Fraternity Housing) 1/24/11 Residential 71 Ldn UMD-8 Rossborough Dr. (Leonardtown Housing) 1/24/11 Residential 66 Ldn
Residences and Institutions M-1 4509 Elm St. 3/17/11 Residential 58 Ldn M-2 4505 Elm St. 3/17/11 Residential 57 Ldn M-3 4502 Elm St. 3/17/11 Residential 56 Ldn M-4 4407 Elm St. 5/3/11 Residential 57 Ldn M-5 4305 Elm St. 3/18/11 Residential 55 Ldn M-6 The Family Academy 4/15/12 Institutional 59 Leq M-7 4210 Oakridge Ln. 3/18/11 Residential 56 Ldn M-8 7602 Lynn Dr. 3/18/11 Residential 56 Ldn
M-8A Lynn Dr. 3/18/11 Residential 56 Ldn M-9 4302 Kentbury Dr. 2/21/11 Residential 57 Ldn
M-9A Edgevale Ct. 2/21/11 Residential 57 Ldn M-10 8003 Kentbury Dr. 8/4/11 Residential 65 Ldn
M-10A Edgevale St. 8/4/11 Residential 65 Ldn M-11 3939 Newdale Dr. 8/4/11 Residential 64 Ldn
M-11A Newdale Dr. 8/4/11 Residential 64 Ldn M-12 Hamlet Pl. 8/8/11 Residential 62 Ldn
M-12A Chevy Chase Lake Dr. 8/8/11 Residential 62 Ldn M-13 3326 Jones Bridge Ct. 8/8/11 Residential 62 Ldn
M-13A W Coquelin Terrace 8/8/11 Residential 62 Ldn M-14 3225 Coquelin Terrace 8/8/11 Residential 66 Ldn M-15 Apt. on Terrace Drive 8/8/11 Residential 70 Ldn M-16 Grubb Rd. (Rock Creek Pool) 4/5/12 Institutional 52 Leq
August 2013 Purple Line – Noise Technical Report
14 Purple Line Final Environmental Impact Statement and Draft Section 4(f) Evaluation
Table 3. Summary of Existing Measured Sound Levels (continued)
Site ID Description of Measurement Location Measurement Date Land Use Measured Ambient
Noise Levels (dB(A))1 M-17 2481 Lyttonsville Road 4/5/12 Institutional 62 Leq
M-17A 2481 Lyttonsville Road 4/15/12 Residential 62 Ldn M-18 810 Albert Stewart Ln. 8/8/11 Residential 66 Ldn M-19 8906 Talbot Ave. 8/10/11 Residential 74 Ldn
M-19A Rosemary Hills Elementary School 8/10/11 Institutional 74 Leq M-20 Apt. on Rosemary Hills Dr. 2/21/11 Residential 72 Ldn M-21 3rd Ave. 8/10/11 Residential 73 Ldn M-22 North Falkland Ln. 8/10/11 Residential 78 Ldn M-23 949 Bonifant St. 3/28/12 Institutional 62 Leq M-24 Saint Michael Church 3/28/12 Institutional 66 Leq M-25 Springdale Rd. and Wayne Ave. 8/10/11 Residential 71 Ldn M-26 Bonifant St. and Wayne Ave. 8/11/11 Residential 68 Ldn M-27 Wayne Ave. 8/11/11 Residential 70 Ldn M-28 Arliss St. 8/11/11 Residential 65 Ldn M-29 Piney Branch Rd. 8/11/11 Residential 71 Ldn M-30 University Blvd. 8/11/11 Residential 69 Ldn M-31 Bayfield St. and University Blvd. 8/16/11 Residential 76 Ldn M-32 Takoma Park Spanish Church 3/28/11 Institutional 69 Leq M-33 1020 University Blvd. 8/16/11 Residential 67 Ldn M-34 14th Ave and University Blvd. 8/16/11 Residential 76 Ldn M-35 University Blvd. 8/16/11 Residential 72 Ldn M-36 W Park Dr. 8/16/11 Residential 70 Ldn M-37 3400 Tulane Dr. 8/17//11 Residential 72 Ldn M-38 Columbia Ave. 6/26/12 Residential 67 Ldn M-39 Erskine Rd. 6/26/12 Residential 78 Ldn M-40 First Korean Presbyterian Church 4/25/12 Institutional 61 Leq M-41 Kenilworth Ave. 8/17//11 Residential 72 Ldn M-42 5800 58th Ave. 8/17//11 Residential 76 Ldn M-43 9100 63th Ave. 8/17//11 Residential 75 Ldn M-44 Patterson St. and Riverdale Rd. 9/12/11 Residential 70 Ldn
M-44A Patterson St. 9/12/11 Residential 70 Ldn M-45 Patterson Dr. 2/27/11 Residential 58 Ldn M-46 Rosalie Ln. 9/12/11 Residential 68 Ldn M-47 6532 Rosalie Ln. 9/12/11 Residential 68 Ldn M-48 Jefferson St. 4/25/12 Residential 64 Ldn M-49 Glenridge Elementary School 2/27/11 Institutional 57 Leq M-50 Chesapeake Landing Apt. 6/20/12 Residential 57 Ldn M-51 Decatur Rd. 9/19/11 Institutional 62 Leq M-52 Hanson Oak Dr. 9/19/11 Residential 67 Ldn M-53 4913 78th Ave. 9/19/11 Residential 63 Ldn
1 For parks, schools, and institutions, peak hours for monitoring were chosen to match train peak time operation; for residences, day-night noise levels were calculated based on measured hourly Leq values.
August 2013 Purple Line – Noise Technical Report
Purple Line Final Environmental Impact Statement and Draft Section 4(f) Evaluation 15
4. Environmental Consequences
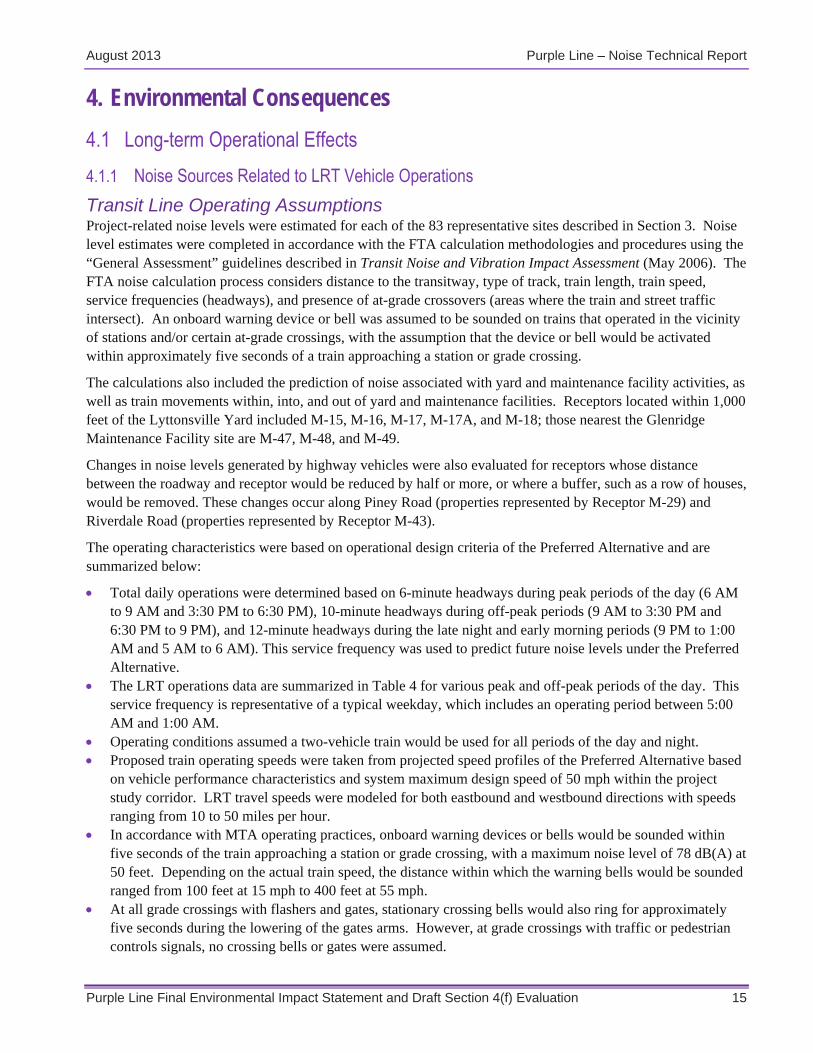
4.1 Long-term Operational Effects 4.1.1 Noise Sources Related to LRT Vehicle Operations Transit Line Operating Assumptions Project-related noise levels were estimated for each of the 83 representative sites described in Section 3. Noise level estimates were completed in accordance with the FTA calculation methodologies and procedures using the “General Assessment” guidelines described in Transit Noise and Vibration Impact Assessment (May 2006). The FTA noise calculation process considers distance to the transitway, type of track, train length, train speed, service frequencies (headways), and presence of at-grade crossovers (areas where the train and street traffic intersect). An onboard warning device or bell was assumed to be sounded on trains that operated in the vicinity of stations and/or certain at-grade crossings, with the assumption that the device or bell would be activated within approximately five seconds of a train approaching a station or grade crossing.
The calculations also included the prediction of noise associated with yard and maintenance facility activities, as well as train movements within, into, and out of yard and maintenance facilities. Receptors located within 1,000 feet of the Lyttonsville Yard included M-15, M-16, M-17, M-17A, and M-18; those nearest the Glenridge Maintenance Facility site are M-47, M-48, and M-49.
Changes in noise levels generated by highway vehicles were also evaluated for receptors whose distance between the roadway and receptor would be reduced by half or more, or where a buffer, such as a row of houses, would be removed. These changes occur along Piney Road (properties represented by Receptor M-29) and Riverdale Road (properties represented by Receptor M-43).
The operating characteristics were based on operational design criteria of the Preferred Alternative and are summarized below:
Total daily operations were determined based on 6-minute headways during peak periods of the day (6 AM to 9 AM and 3:30 PM to 6:30 PM), 10-minute headways during off-peak periods (9 AM to 3:30 PM and 6:30 PM to 9 PM), and 12-minute headways during the late night and early morning periods (9 PM to 1:00 AM and 5 AM to 6 AM). This service frequency was used to predict future noise levels under the Preferred Alternative.
The LRT operations data are summarized in Table 4 for various peak and off-peak periods of the day. This service frequency is representative of a typical weekday, which includes an operating period between 5:00 AM and 1:00 AM.
Operating conditions assumed a two-vehicle train would be used for all periods of the day and night. Proposed train operating speeds were taken from projected speed profiles of the Preferred Alternative based
on vehicle performance characteristics and system maximum design speed of 50 mph within the project study corridor. LRT travel speeds were modeled for both eastbound and westbound directions with speeds ranging from 10 to 50 miles per hour.
In accordance with MTA operating practices, onboard warning devices or bells would be sounded within five seconds of the train approaching a station or grade crossing, with a maximum noise level of 78 dB(A) at 50 feet. Depending on the actual train speed, the distance within which the warning bells would be sounded ranged from 100 feet at 15 mph to 400 feet at 55 mph.
At all grade crossings with flashers and gates, stationary crossing bells would also ring for approximately five seconds during the lowering of the gates arms. However, at grade crossings with traffic or pedestrian controls signals, no crossing bells or gates were assumed.

August 2013 Purple Line – Noise Technical Report
16 Purple Line Final Environmental Impact Statement and Draft Section 4(f) Evaluation
In accordance with current MTA procedures, onboard warning bells would also be sounded for approximately five seconds as trains approach the station. At an average speed of approximately 30 mph, the warning bells would be sounded within a distance of 200 feet of the station.
The LRT train would operate on a mix of track types (e.g., Ballasted, Direct Fixation, Green Track, and Embedded). Although, several case studies have shown that noise levels can be reduced after use of vegetation in Track (Green Tracks), the noise modeling did not account for any reduction due the use of the Green Tracks, which is being considered within the existing Georgetown Branch right-of-way.
Between Bethesda and Rock Creek Stream Valley Park, the transitway design would have a four-foot high noise wall on the south side of the transitway. On the north side of the transitway, either the trail would be elevated more than four feet above the tracks or a four-foot high noise wall would be included between the Capital Crescent Trail and the adjacent community. The four-foot high noise/retaining wall would provide a 4 dB reduction of LRT vehicle-related noise levels.
LRT vehicles would be manufactured with vehicle skirt panels to reduce the noise caused by the interaction of, and friction between, the wheels pressing down on the rails as the train travels along the transitway. This design feature was predicted to reduce the vehicle noise by 8 dB along the entire length of the project corridor. For portions of the Purple Line corridor near the four-foot high barrier/retaining walls, the combination of both measures was estimated to provide a 12 dB noise reduction.
To provide greater operational flexibility, special track work, such as crossovers, are proposed at several locations along the Preferred Alternative. Crossovers allow trains to move between parallel tracks. Noise from crossovers comes from a small gap in the central part of the switch known as a “frog.” This noise analysis incorporated the noise associated with crossovers.
Table 4. Purple Line Preferred Alternative Operating Characteristics
Time of Day Headway (Minutes) No. of Trips/Hour Total Number of Trips 5 AM to 6 AM 12 5 5 6 AM to 7 AM 6 10 10 7 AM to 9 AM 6 10 20
9 AM to 3:30 PM 10 6 39 3:30 PM to 6:30 PM 6 10 30
6:30 PM to 9 PM 10 6 15 9 PM to 10 PM 12 5 5 10 PM to 1 AM 12 5 15
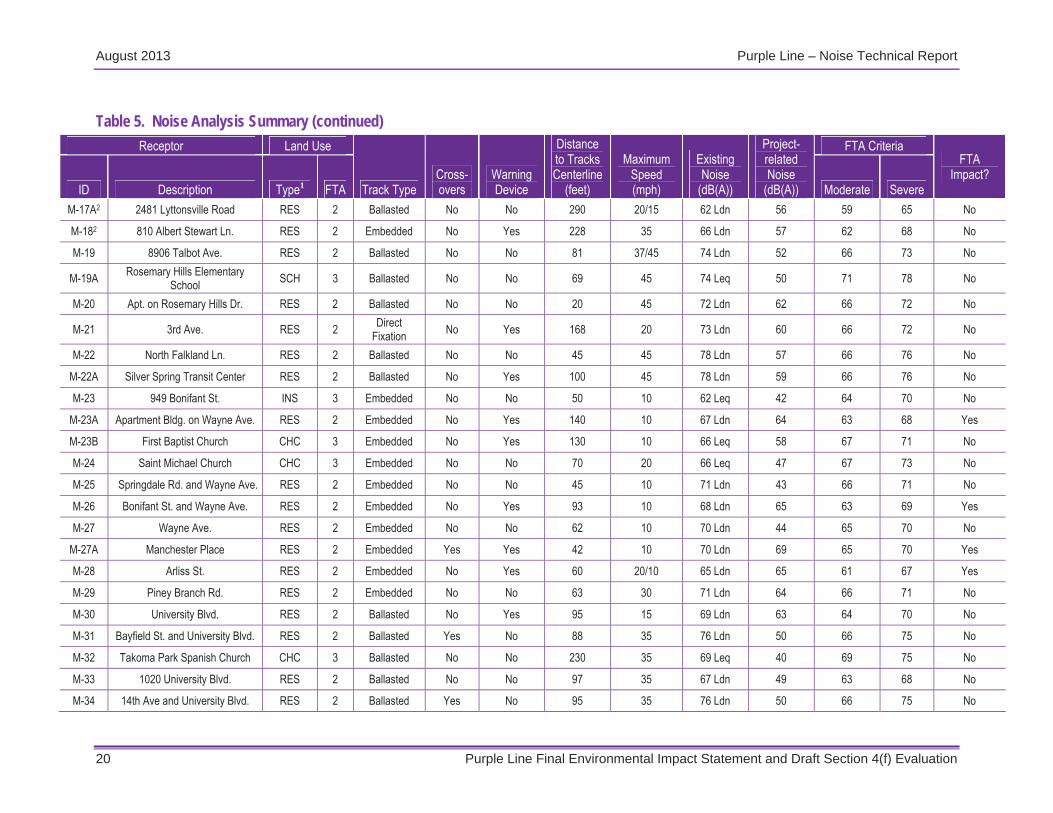
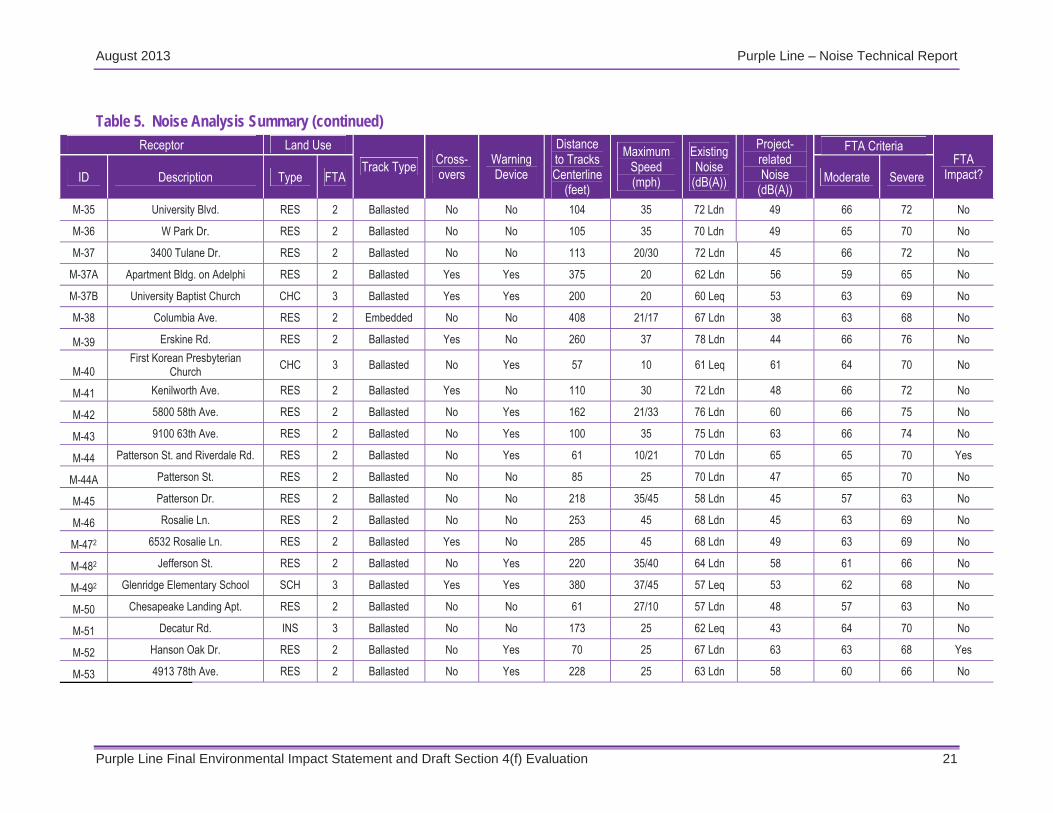
Operational Noise Effects The predicted sound levels from operations with the Preferred Alternative are summarized in Table 5 for each of the representative receptor locations where ambient noise levels were measured. The predicted sound levels were compared to the existing sound levels at each location to identify sites that would result in future operational noise exposure constituting either an FTA-based moderate impact or severe impact condition. The analysis found that none of the studied representative sensitive receptors would experience project-related sound levels that would exceed the FTA Severe Impact threshold. Moderate impacts due to Purple Line operations are projected to occur at 11 residential properties comprising seven single-family residences represented by Receptors M-26, M-27A, and M-52, and four apartment buildings (containing a total of approximately 140 units) represented by sites M-23A, M-27A, M-28, and M-44. Five sites (M-23A, M-26, M-27A, M-28 and M-44) are representative of residential properties that are within 200 feet of a station. The sixth site, M-52, is located within 200 feet of a grade crossing. The noise exposure projected at all of these sites is due primarily to horn soundings which are required as the LRT approaches stations and grade crossings.
August 2013 Purple Line – Noise Technical Report
Purple Line Final Environmental Impact Statement and Draft Section 4(f) Evaluation 17
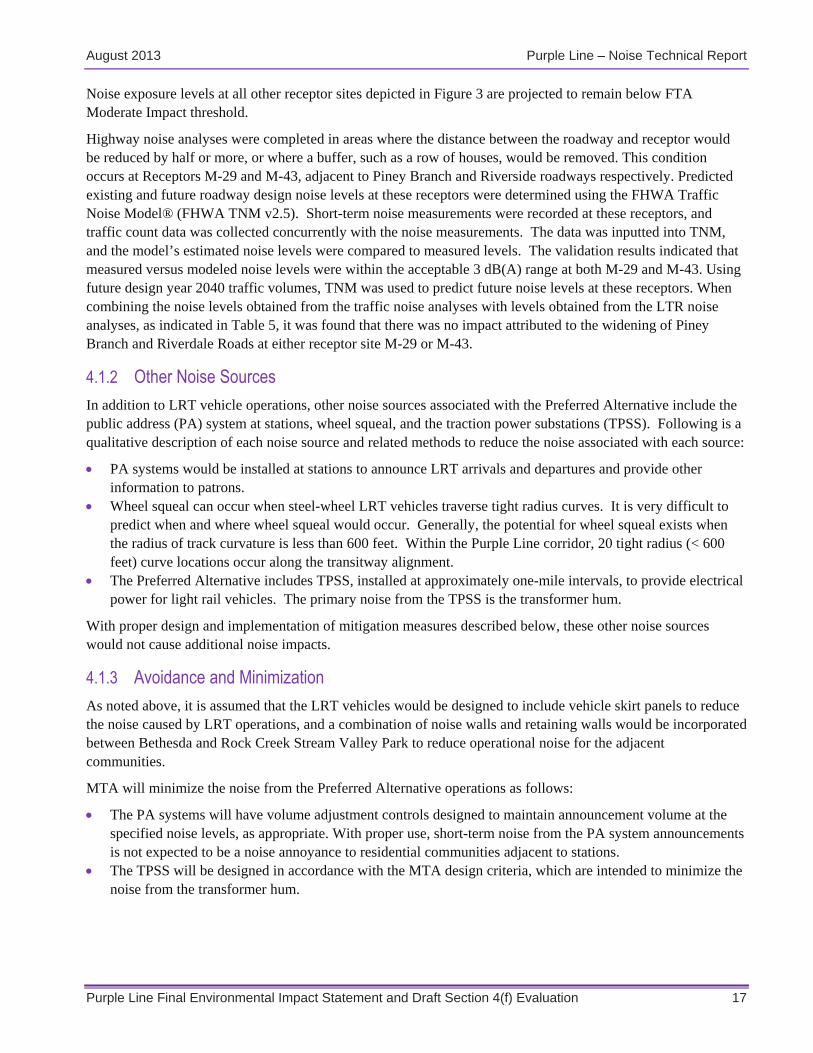
Noise exposure levels at all other receptor sites depicted in Figure 3 are projected to remain below FTA Moderate Impact threshold.
Highway noise analyses were completed in areas where the distance between the roadway and receptor would be reduced by half or more, or where a buffer, such as a row of houses, would be removed. This condition occurs at Receptors M-29 and M-43, adjacent to Piney Branch and Riverside roadways respectively. Predicted existing and future roadway design noise levels at these receptors were determined using the FHWA Traffic Noise Model® (FHWA TNM v2.5). Short-term noise measurements were recorded at these receptors, and traffic count data was collected concurrently with the noise measurements. The data was inputted into TNM, and the model’s estimated noise levels were compared to measured levels. The validation results indicated that measured versus modeled noise levels were within the acceptable 3 dB(A) range at both M-29 and M-43. Using future design year 2040 traffic volumes, TNM was used to predict future noise levels at these receptors. When combining the noise levels obtained from the traffic noise analyses with levels obtained from the LTR noise analyses, as indicated in Table 5, it was found that there was no impact attributed to the widening of Piney Branch and Riverdale Roads at either receptor site M-29 or M-43.
4.1.2 Other Noise Sources In addition to LRT vehicle operations, other noise sources associated with the Preferred Alternative include the public address (PA) system at stations, wheel squeal, and the traction power substations (TPSS). Following is a qualitative description of each noise source and related methods to reduce the noise associated with each source:
PA systems would be installed at stations to announce LRT arrivals and departures and provide other information to patrons.
Wheel squeal can occur when steel-wheel LRT vehicles traverse tight radius curves. It is very difficult to predict when and where wheel squeal would occur. Generally, the potential for wheel squeal exists when the radius of track curvature is less than 600 feet. Within the Purple Line corridor, 20 tight radius (< 600 feet) curve locations occur along the transitway alignment.
The Preferred Alternative includes TPSS, installed at approximately one-mile intervals, to provide electrical power for light rail vehicles. The primary noise from the TPSS is the transformer hum.
With proper design and implementation of mitigation measures described below, these other noise sources would not cause additional noise impacts.
4.1.3 Avoidance and Minimization As noted above, it is assumed that the LRT vehicles would be designed to include vehicle skirt panels to reduce the noise caused by LRT operations, and a combination of noise walls and retaining walls would be incorporated between Bethesda and Rock Creek Stream Valley Park to reduce operational noise for the adjacent communities.
MTA will minimize the noise from the Preferred Alternative operations as follows:
The PA systems will have volume adjustment controls designed to maintain announcement volume at the specified noise levels, as appropriate. With proper use, short-term noise from the PA system announcements is not expected to be a noise annoyance to residential communities adjacent to stations.
The TPSS will be designed in accordance with the MTA design criteria, which are intended to minimize the noise from the transformer hum.

August 2013 Purple Line – Noise Technical Report
18 Purple Line Final Environmental Impact Statement and Draft Section 4(f) Evaluation
Table 5. Noise Analysis Summary Receptor Land Use
Track Type Cross
-overs
Warning Device
Distance to Tracks
Centerline (feet)
Maximum Speed (mph)
Existing Noise
(dB(A))
Project-related Noise
(dB(A))
FTA Criteria FTA
Impact? ID Description Type1 FTA Moderate Severe
P-1 Elm St. Park Park 3 Green Yes No 240 37/45 66 Leq 37 67 73 No
P-2A Columbia Country Club (West) Park 3 Green No No 42 45 60 Leq 49 63 69 No
P-2B Columbia Country Club (East) Park 3 Green No No 30 45 60 Leq 51 63 69 No P-3 Rock Creek Park Park 3 Green Yes No 233 45 52 Leq 38 60 66 No P-4 Sligo Creek Park Park 3 Embedded No No 52 10 69 Leq 42 69 75 No P-5 Long Branch Trail Park Park 3 Embedded No No 64 30 68 Leq 50 68 74 No P-6 New Hampshire Park Park 3 Ballasted No Yes 127 15 65 Leq 56 66 72 No P-7 Northwest Branch Stream Park Park 3 Ballasted No No 105 35 65 Leq 45 66 72 No P-8 Paint Branch Stream Park Park 3 Embedded No No 58 21/17 74 Leq 47 71 78 No P-9 Calvert Park Park 3 Ballasted Yes No 260 37 67 Leq 40 68 73 No
P-10 Anacostia River Stream Park Park 3 Ballasted No Yes 57 57 61 Leq 61 64 70 No P-11 Glenridge Community Park Park 3 Ballasted No No 285 45 64 Leq 41 66 71 No
P-12 West Lanham Hills Park Park 3 Ballasted No No 238 40/32 60 Leq 40 63 69 No
UMD-1 Ludwig Field & Kehoe Track SCH 3 Embedded No No 100 10 57 Leq 38 62 68 No
UMD-2 Union Drive (Benjamin Bldg) SCH 3 Embedded No No 53 10 63 Leq 42 65 71 No
UMD-3 Campus Drive (Health Center) SCH 3 Embedded No Yes 43 10 68 Leq 63 68 74 No
UMD-4 Campus Drive (Hornbake Library) SCH 3 Embedded No No 50 10 65 Leq 42 66 72 No
UMD-5 Mitchell Building SCH 3 Embedded Yes No 25 15 60 Leq 53 63 69 No
UMD-6 Turner Hall Visitor Center SCH 3 Embedded No No 95 15 59 Leq 41 63 69 No
UMD-7 Rossborough Dr. (Fraternity Housing) RES 2 Embedded No Yes 185 15 71 Ldn 61 66 71 No
UMD-8 Rossborough Dr. (Leonardtown Housing) RES 2 Embedded No No 65 17/21 66 Ldn 50 62 68 No

August 2013 Purple Line – Noise Technical Report
Purple Line Final Environmental Impact Statement and Draft Section 4(f) Evaluation 19
Table 5. Noise Analysis Summary (continued) Receptor Land Use
Track Type Cross-overs
Warning Device
Distance to Tracks Centerline
(feet)
Maximum Speed (mph)
Existing Noise
(dB(A))
Project-related Noise
(dB(A))
FTA Criteria FTA
Impact? *ID Description Type1 FTA Moderate Severe
M-1 4509 Elm St. RES 2 Green Yes No 72 37/45 58 Ldn 49 57 63 No
M-2 4505 Elm St. RES 2 Green Yes No 104 40/45 57 Ldn 47 57 63 No
M-3 4502 Elm St. RES 2 Green No No 263 45 56 Ldn 41 56 63 No
M-4 4407 Elm St. RES 2 Green No No 138 45 57 Ldn 45 57 63 No
M-5 4305 Elm St. RES 2 Green No No 115 45 55 Ldn 46 56 62 No
M-6 The Family Academy SCH 3 Green No No 44 45 59 Leq 53 63 69 No
M-7 4210 Oakridge Ln. RES 2 Green No No 130 45 56 Ldn 46 56 63 No
M-8 7602 Lynn Dr. RES 2 Green No No 66 45 56 Ldn 50 56 63 No
M-8A Lynn Dr. RES 2 Green No No 40 45 56 Ldn 53 56 63 No
M-9 4302 Kentbury Dr. RES 2 Green No No 62 45 57 Ldn 50 57 63 No
M-9A Edgevale Ct. RES 2 Green No No 40 45 57 Ldn 53 57 63 No
M-10 8003 Kentbury Dr. RES 2 Green No No 94 45 65 Ldn 48 61 67 No
M-10A Edgevale St. RES 2 Green No No 74 45 65 Ldn 49 61 67 No
M-11 3939 Newdale Dr. RES 2 Green No No 117 45 64 Ldn 50 61 66 No
M-11A Newdale Dr. RES 2 Direct Fixation No Yes 120 43/35 64 Ldn 59 61 66 No
M-12 Hamlet Pl. RES 2 Green No No 70 50 62 Ldn 51 59 65 No
M-12A Chevy Chase Lake Dr. RES 2 Green No No 120 35/45 62 Ldn 57 59 65 No
M-13 3326 Jones Bridge Ct. RES 2 Green No No 81 45 62 Ldn 49 59 65 No
M-13A W Coquelin Terrace RES 2 Green No No 63 45 62 Ldn 50 59 65 No
M-14 3225 Coquelin Terrace RES 2 Green No No 113 45 66 Ldn 47 62 68 No
M-152 Apt. on Terrace Drive RES 2 Green No No 48 50 70 Ldn 58 65 70 No
M-162 Grubb Rd. (Rock Creek Pool) INS 3 Green No No 160 45 52 Leq 50 60 66 No
M-172 2481 Lyttonsville Road INS 3 Ballasted No No 85 20/15 62 Leq 61 64 70 No
August 2013 Purple Line – Noise Technical Report
20 Purple Line Final Environmental Impact Statement and Draft Section 4(f) Evaluation
Table 5. Noise Analysis Summary (continued)
Receptor Land Use
Track Type Cross-overs
Warning Device
Distance to Tracks Centerline
(feet)
Maximum Speed (mph)
Existing Noise
(dB(A))
Project-related Noise
(dB(A))
FTA Criteria FTA
Impact? ID Description Type1 FTA Moderate Severe
M-17A2 2481 Lyttonsville Road RES 2 Ballasted No No 290 20/15 62 Ldn 56 59 65 No
M-182 810 Albert Stewart Ln. RES 2 Embedded No Yes 228 35 66 Ldn 57 62 68 No
M-19 8906 Talbot Ave. RES 2 Ballasted No No 81 37/45 74 Ldn 52 66 73 No
M-19A Rosemary Hills Elementary School SCH 3 Ballasted No No 69 45 74 Leq 50 71 78 No
M-20 Apt. on Rosemary Hills Dr. RES 2 Ballasted No No 20 45 72 Ldn 62 66 72 No
M-21 3rd Ave. RES 2 Direct Fixation No Yes 168 20 73 Ldn 60 66 72 No
M-22 North Falkland Ln. RES 2 Ballasted No No 45 45 78 Ldn 57 66 76 No
M-22A Silver Spring Transit Center RES 2 Ballasted No Yes 100 45 78 Ldn 59 66 76 No
M-23 949 Bonifant St. INS 3 Embedded No No 50 10 62 Leq 42 64 70 No
M-23A Apartment Bldg. on Wayne Ave. RES 2 Embedded No Yes 140 10 67 Ldn 64 63 68 Yes
M-23B First Baptist Church CHC 3 Embedded No Yes 130 10 66 Leq 58 67 71 No
M-24 Saint Michael Church CHC 3 Embedded No No 70 20 66 Leq 47 67 73 No
M-25 Springdale Rd. and Wayne Ave. RES 2 Embedded No No 45 10 71 Ldn 43 66 71 No
M-26 Bonifant St. and Wayne Ave. RES 2 Embedded No Yes 93 10 68 Ldn 65 63 69 Yes
M-27 Wayne Ave. RES 2 Embedded No No 62 10 70 Ldn 44 65 70 No
M-27A Manchester Place RES 2 Embedded Yes Yes 42 10 70 Ldn 69 65 70 Yes
M-28 Arliss St. RES 2 Embedded No Yes 60 20/10 65 Ldn 65 61 67 Yes
M-29 Piney Branch Rd. RES 2 Embedded No No 63 30 71 Ldn 64 66 71 No
M-30 University Blvd. RES 2 Ballasted No Yes 95 15 69 Ldn 63 64 70 No
M-31 Bayfield St. and University Blvd. RES 2 Ballasted Yes No 88 35 76 Ldn 50 66 75 No
M-32 Takoma Park Spanish Church CHC 3 Ballasted No No 230 35 69 Leq 40 69 75 No
M-33 1020 University Blvd. RES 2 Ballasted No No 97 35 67 Ldn 49 63 68 No
M-34 14th Ave and University Blvd. RES 2 Ballasted Yes No 95 35 76 Ldn 50 66 75 No
August 2013 Purple Line – Noise Technical Report
Purple Line Final Environmental Impact Statement and Draft Section 4(f) Evaluation 21
Table 5. Noise Analysis Summary (continued) Receptor Land Use
Track Type Cross-overs
Warning Device
Distance to Tracks Centerline
(feet)
Maximum Speed (mph)
Existing Noise
(dB(A))
Project-related Noise
(dB(A))
FTA Criteria FTA
Impact? ID Description Type FTA Moderate Severe
M-35 University Blvd. RES 2 Ballasted No No 104 35 72 Ldn 49 66 72 No
M-36 W Park Dr. RES 2 Ballasted No No 105 35 70 Ldn 49 65 70 No
M-37 3400 Tulane Dr. RES 2 Ballasted No No 113 20/30 72 Ldn 45 66 72 No
M-37A Apartment Bldg. on Adelphi RES 2 Ballasted Yes Yes 375 20 62 Ldn 56 59 65 No
M-37B University Baptist Church CHC 3 Ballasted Yes Yes 200 20 60 Leq 53 63 69 No
M-38 Columbia Ave. RES 2 Embedded No No 408 21/17 67 Ldn 38 63 68 No
M-39 Erskine Rd. RES 2 Ballasted Yes No 260 37 78 Ldn 44 66 76 No
M-40 First Korean Presbyterian
Church CHC 3 Ballasted No Yes 57 10 61 Leq 61 64 70 No
M-41 Kenilworth Ave. RES 2 Ballasted Yes No 110 30 72 Ldn 48 66 72 No
M-42 5800 58th Ave. RES 2 Ballasted No Yes 162 21/33 76 Ldn 60 66 75 No
M-43 9100 63th Ave. RES 2 Ballasted No Yes 100 35 75 Ldn 63 66 74 No
M-44 Patterson St. and Riverdale Rd. RES 2 Ballasted No Yes 61 10/21 70 Ldn 65 65 70 Yes
M-44A Patterson St. RES 2 Ballasted No No 85 25 70 Ldn 47 65 70 No
M-45 Patterson Dr. RES 2 Ballasted No No 218 35/45 58 Ldn 45 57 63 No
M-46 Rosalie Ln. RES 2 Ballasted No No 253 45 68 Ldn 45 63 69 No
M-472 6532 Rosalie Ln. RES 2 Ballasted Yes No 285 45 68 Ldn 49 63 69 No
M-482 Jefferson St. RES 2 Ballasted No Yes 220 35/40 64 Ldn 58 61 66 No
M-492 Glenridge Elementary School SCH 3 Ballasted Yes Yes 380 37/45 57 Leq 53 62 68 No
M-50 Chesapeake Landing Apt. RES 2 Ballasted No No 61 27/10 57 Ldn 48 57 63 No
M-51 Decatur Rd. INS 3 Ballasted No No 173 25 62 Leq 43 64 70 No
M-52 Hanson Oak Dr. RES 2 Ballasted No Yes 70 25 67 Ldn 63 63 68 Yes
M-53 4913 78th Ave. RES 2 Ballasted No Yes 228 25 63 Ldn 58 60 66 No

August 2013 Purple Line – Noise Technical Report
22 Purple Line Final Environmental Impact Statement and Draft Section 4(f) Evaluation
4.1.4 Mitigation MTA’s analysis found that the further minimization and mitigation of operational noise at impacted sites is not reasonable. Much of the noise impact is derived from use of transit warning horns at stations and crossings, and eliminating the transit horn is not possible due to safety concerns. Another common noise-reduction measure – the construction of noise walls – is not feasible for this project because these barriers would block driveway access and pedestrian walkways, as well as introducing visual impacts. Therefore, these additional measures are not proposed.
4.2 Short-term Construction Effects 4.2.1 Construction Methods Constructing the Purple Line would involve a wide range of activities, including clearing the rail right-of-way, tunnel construction, constructing grade crossings, bridge construction, yard and maintenance facility construction, laying track, and constructing stations and other system elements.
Stations, shafts, cut-and-cover tunnels, and portals require very similar construction techniques. Excavation associated with the cut-and-cover construction would result in noise generated by backhoes, bulldozers, cranes, concrete mixers, concrete delivery trucks, dump trucks, delivery trucks, front-end loaders, pile drivers, and jackhammers. A general discussion of noise associated with the major construction operations for new tunnel construction, cut-and-cover construction, and work at various yards is presented below.
Airborne noise from tunneling activity, including noise generated from tunnel boring machines, is not anticipated to be discernible in outdoor areas, as most noise would be contained underground and would be masked by existing ambient noise. However, noise impacts are anticipated during hauling of excavated materials from the muck shafts and the shipping of liner segments, concrete, and other materials to the shafts.
Noise at construction sites is generated by both mobile and stationary sources. Mobile equipment such as dozers, scrapers, and graders may operate in a cyclic fashion in which a period of full power is followed by a period of reduced power. Mobile equipment such as delivery trucks may produce steady noise and are generally associated with supply of materials to the construction sites and disposal of waste materials from construction sites. Stationary equipment consists primarily of non-mobile equipment that generates noise from one general area and includes items such as pumps, generators, and compressors. These types of equipment typically operate at a constant noise level under normal operation and are classified as non-impact equipment. Other types of stationary equipment such as pile drivers, jackhammers, pavement breakers, and blasting operations produce variable, sporadic noise and impact-type noises.
4.2.2 Potential Impacts Noise levels during construction are difficult to predict, and they vary depending on the type and duration of construction activity and the number and type of equipment used during each stage of work. Specifically, the location of sensitive receptors in relation to the construction activity and the duration of construction activities affect the potential for noise impact. Track-related construction would move continuously along the corridor; therefore, the duration of exposure to construction-related noise at any one property would be limited.
Some specialized construction work does have a greater potential to create noise impacts. This includes the following types of work:

August 2013 Purple Line – Noise Technical Report
Purple Line Final Environmental Impact Statement and Draft Section 4(f) Evaluation 23
Tunneling operations (Plymouth Street tunnel) Pile driving Heavy equipment use (Silver Spring Transit Center and associated structures, and sections along the
transitway with extensive bridge and retaining wall work).
However, the noise impacts for these activities would be realized only for sensitive receptors in close proximity to these specific locations and not along the entire length of the transitway.
4.2.3 Avoidance and Minimization As part of the Purple Line contract specification documents, MTA would establish performance standards for construction equipment to reduce noise associated with the construction activities. MTA is committed to abiding by local noise ordinances, whenever feasible and reasonable, in accordance with its own performance standards, which will include, but not necessarily be limited to, the following:
Conduct construction activities during the daytime whenever possible. Conduct truck loading, unloading, and hauling operations in a manner that minimizes noise. Route construction equipment and other vehicles carrying spoil, concrete, or other materials over
routes that would cause the least disturbance to residents in the vicinity of the activity. Locate site stationary equipment away from residential areas to the extent reasonably feasible within
the site/staging area. Employ the best available control technologies to limit excessive noise when working near residences Adequately notify the public in advance of construction operations and schedules including methods
such as construction-alert publications and a Noise Complaint Hotline to handle complaints quickly.
August 2013 Purple Line – Noise Technical Report
24 Purple Line Final Environmental Impact Statement and Draft Section 4(f) Evaluation
5. References Federal Transit Administration (FTA). T ransit Noise and Vibration Impact Assessment. U.S. Department of Transportation Report No. FTA-VA-90-1003-06, May 2006. Federal Highway Administration (FHWA) Measurement of Highway-Related Noise, Report Number FHWA-DP-96-046, May 1996

August 2013 Purple Line – Noise Technical Report
Purple Line Final Environmental Impact Statement and Draft Section 4(f) Evaluation 25
APPENDIX A – List of Acronyms and Abbreviations
August 2013 Purple Line – Noise Technical Report
26 Purple Line Final Environmental Impact Statement and Draft Section 4(f) Evaluation
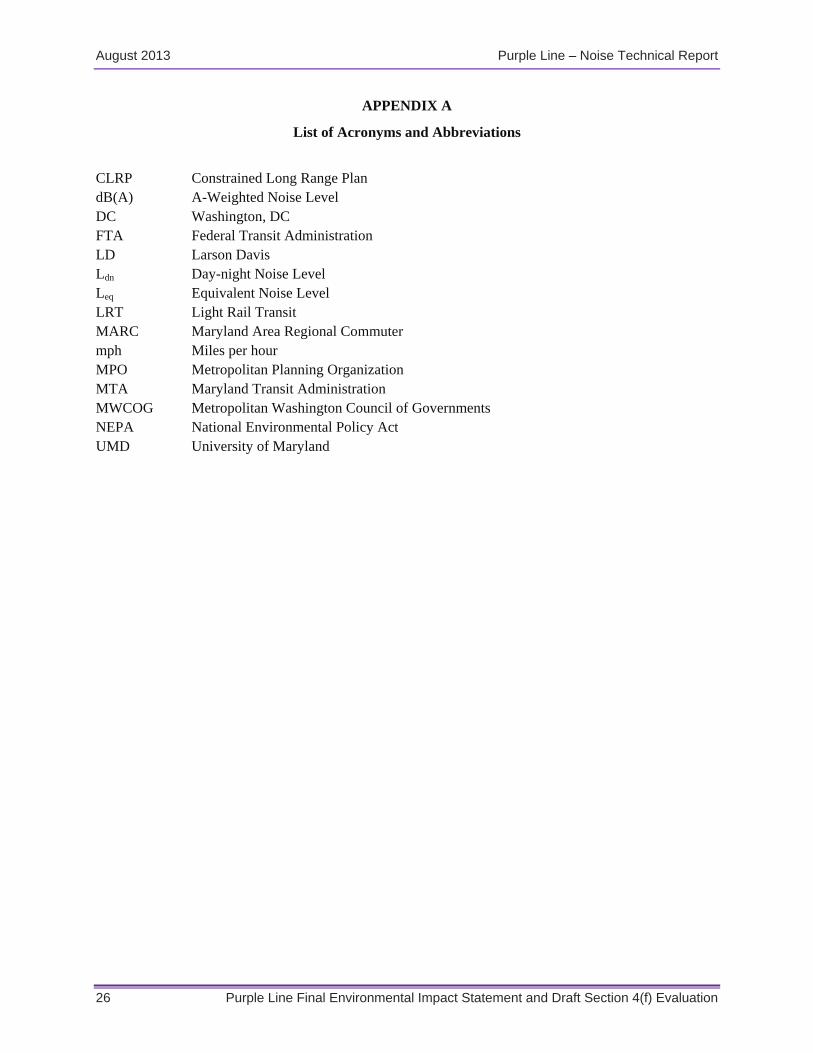
APPENDIX A
List of Acronyms and Abbreviations
CLRP Constrained Long Range Plan dB(A) A-Weighted Noise Level DC Washington, DC FTA Federal Transit Administration LD Larson Davis Ldn Day-night Noise Level Leq Equivalent Noise Level LRT Light Rail Transit MARC Maryland Area Regional Commuter mph Miles per hour MPO Metropolitan Planning Organization MTA Maryland Transit Administration MWCOG Metropolitan Washington Council of Governments NEPA National Environmental Policy Act UMD University of Maryland
August 2013 Purple Line – Noise Technical Report
Purple Line Final Environmental Impact Statement and Draft Section 4(f) Evaluation 27
APPENDIX B – Glossary/Terminology
August 2013 Purple Line – Noise Technical Report
28 Purple Line Final Environmental Impact Statement and Draft Section 4(f) Evaluation
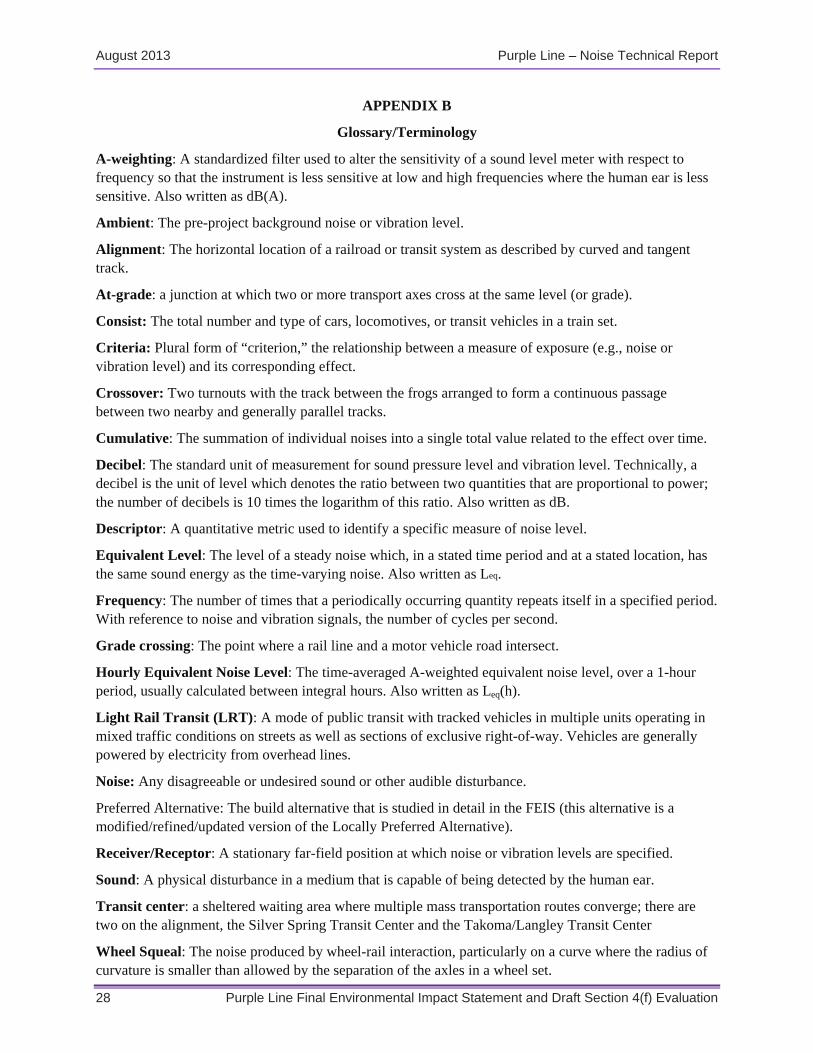
APPENDIX B
Glossary/Terminology
A-weighting: A standardized filter used to alter the sensitivity of a sound level meter with respect to frequency so that the instrument is less sensitive at low and high frequencies where the human ear is less sensitive. Also written as dB(A).
Ambient: The pre-project background noise or vibration level.
Alignment: The horizontal location of a railroad or transit system as described by curved and tangent track.
At-grade: a junction at which two or more transport axes cross at the same level (or grade).
Consist: The total number and type of cars, locomotives, or transit vehicles in a train set.
Criteria: Plural form of “criterion,” the relationship between a measure of exposure (e.g., noise or vibration level) and its corresponding effect.
Crossover: Two turnouts with the track between the frogs arranged to form a continuous passage between two nearby and generally parallel tracks.
Cumulative: The summation of individual noises into a single total value related to the effect over time.
Decibel: The standard unit of measurement for sound pressure level and vibration level. Technically, a decibel is the unit of level which denotes the ratio between two quantities that are proportional to power; the number of decibels is 10 times the logarithm of this ratio. Also written as dB.
Descriptor: A quantitative metric used to identify a specific measure of noise level.
Equivalent Level: The level of a steady noise which, in a stated time period and at a stated location, has the same sound energy as the time-varying noise. Also written as Leq.
Frequency: The number of times that a periodically occurring quantity repeats itself in a specified period. With reference to noise and vibration signals, the number of cycles per second.
Grade crossing: The point where a rail line and a motor vehicle road intersect.
Hourly Equivalent Noise Level: The time-averaged A-weighted equivalent noise level, over a 1-hour period, usually calculated between integral hours. Also written as Leq(h).
Light Rail Transit (LRT): A mode of public transit with tracked vehicles in multiple units operating in mixed traffic conditions on streets as well as sections of exclusive right-of-way. Vehicles are generally powered by electricity from overhead lines.
Noise: Any disagreeable or undesired sound or other audible disturbance.
Preferred Alternative: The build alternative that is studied in detail in the FEIS (this alternative is a modified/refined/updated version of the Locally Preferred Alternative).
Receiver/Receptor: A stationary far-field position at which noise or vibration levels are specified.
Sound: A physical disturbance in a medium that is capable of being detected by the human ear.
Transit center: a sheltered waiting area where multiple mass transportation routes converge; there are two on the alignment, the Silver Spring Transit Center and the Takoma/Langley Transit Center
Wheel Squeal: The noise produced by wheel-rail interaction, particularly on a curve where the radius of curvature is smaller than allowed by the separation of the axles in a wheel set.
August 2013 Purple Line – Noise Technical Report
Purple Line Final Environmental Impact Statement and Draft Section 4(f) Evaluation
APPENDIX C – Calibration Certificates