Noise in Load Cell Signal in an Automatic Weighing System...
10
Research Article Noise in Load Cell Signal in an Automatic Weighing System Based on a Belt Conveyor Kyoo Nam Choi Department of Information and Telecommunication Engineering, Incheon National University, Incheon 22012, Republic of Korea Correspondence should be addressed to Kyoo Nam Choi; [email protected] Received 23 April 2017; Revised 23 June 2017; Accepted 12 July 2017; Published 8 August 2017 Academic Editor: Stephane Evoy Copyright © 2017 Kyoo Nam Choi. is is an open access article distributed under the Creative Commons Attribution License, which permits unrestricted use, distribution, and reproduction in any medium, provided the original work is properly cited. Noise in load cell signal in an automatic weighing system based on a belt conveyor has been examined experimentally in time and frequency domains to enhance signal quality. e noise frequency spectrum showed nonlinearly increasing multiple resonance peaks as speed increased. e noise reduction process using noise reduction algorithm, by sharply rejecting peak noise frequency component and aſterward forming optimum pulse width ratio through filter slope control using selective switching of 6 LPF stages, was used for enhanced accuracy. e effectiveness of proposed method, controlling both cutoff frequency and slope of LPF, was evaluated by feeding 50 g test mass, and this noise reduction process showed better noise filtering with enhanced accuracy than fixed cutoff frequency control method. e ratio of top to bottom pulse width showed that LPF cutoff frequency above 5Hz had the ratio above 50% up to 80 m/min speed range. 1. Introduction e conveyor belt is widely used, for sensing application, to measure continuously the physical parameters of an object in many fields [1]. e vision sensors are used for tracking and identifying an object moving on a conveyor belt [2– 4], and range sensors are used for volume measurement [5]. e automatic weighing and sorting system is used in food and pharmaceutical industry where continuous and precise mass measurement of small objects is required [6, 7]. e belt conveyor is used for automatic weighing to continuously feed products under measurement [8–12]. However the horizontal and rotational movements of belt conveyor eventually cause vibration [13], and these behave as noise source to the output of load cell sensor [14, 15]. High signal-to-noise ratio (SNR) is needed to improve accuracy and resolution of weighing machine; thus noise reduction is essential process [16–19]. e electric motor, AC induction or BLDC motor, is used to actuate belt conveyor [20–22], which has different vibration characteristics. Also other individual components of belt conveyor, such as bearing, belt, and roller, with accompa- nying vibration, transfer noise to load cell sensor [23]. e way to reduce the vibration noise of belt conveyor has been investigated [24, 25], and the method to locate the fault point in belt conveyor has been attempted by analyzing audible signal from belt conveyor [26, 27]. Also the investigation to driving motor to reduce the noise was conducted [28]. e work to improve accuracy through modeling has been performed for weighing machine adapting belt conveyor [29]. Further efforts to enhance continuous measurement accuracy for high speed mass measurement have been performed [30, 31]. In respect of analysis method, the algorithm adapting frequency analysis [32, 33] or digital filter [34] was attempted. In this paper, the noise in load cell signal in an automatic weighing system based on a belt conveyor is analyzed, and the method to reduce the noise component in load cell sensor is investigated. 2. Vibration Noise Analysis Noise, (, ), from belt conveyor contains not only the operating vibration but also the environment noise, as shown in (1). e environment noise, (, ), has the characteris- tics of either white noise or nonstationary process; however the operating vibration, (, ), has the characteristics of wide sense stationary process. ese noises from individual components of belt conveyor can be analyzed in time domain and frequency domains. e objective of this study is to Hindawi Journal of Sensors Volume 2017, Article ID 1524782, 9 pages https://doi.org/10.1155/2017/1524782
-
Upload
nguyenkhanh -
Category
Documents
-
view
219 -
download
0
Transcript of Noise in Load Cell Signal in an Automatic Weighing System...

Research ArticleNoise in Load Cell Signal in an Automatic Weighing SystemBased on a Belt Conveyor
Kyoo Nam Choi
Department of Information and Telecommunication Engineering, Incheon National University, Incheon 22012, Republic of Korea
Correspondence should be addressed to Kyoo Nam Choi; [email protected]
Received 23 April 2017; Revised 23 June 2017; Accepted 12 July 2017; Published 8 August 2017
Academic Editor: Stephane Evoy
Copyright © 2017 Kyoo Nam Choi. This is an open access article distributed under the Creative Commons Attribution License,which permits unrestricted use, distribution, and reproduction in any medium, provided the original work is properly cited.
Noise in load cell signal in an automatic weighing system based on a belt conveyor has been examined experimentally in time andfrequency domains to enhance signal quality. The noise frequency spectrum showed nonlinearly increasing multiple resonancepeaks as speed increased. The noise reduction process using noise reduction algorithm, by sharply rejecting peak noise frequencycomponent and afterward forming optimum pulse width ratio through filter slope control using selective switching of 6 LPF stages,was used for enhanced accuracy. The effectiveness of proposed method, controlling both cutoff frequency and slope of LPF, wasevaluated by feeding 50 g test mass, and this noise reduction process showed better noise filtering with enhanced accuracy thanfixed cutoff frequency control method. The ratio of top to bottom pulse width showed that LPF cutoff frequency above 5Hz hadthe ratio above 50% up to 80m/min speed range.
1. Introduction
The conveyor belt is widely used, for sensing application, tomeasure continuously the physical parameters of an objectin many fields [1]. The vision sensors are used for trackingand identifying an object moving on a conveyor belt [2–4], and range sensors are used for volume measurement [5].The automatic weighing and sorting system is used in foodand pharmaceutical industry where continuous and precisemass measurement of small objects is required [6, 7].The beltconveyor is used for automatic weighing to continuously feedproducts undermeasurement [8–12]. However the horizontaland rotational movements of belt conveyor eventually causevibration [13], and these behave as noise source to the outputof load cell sensor [14, 15]. High signal-to-noise ratio (SNR)is needed to improve accuracy and resolution of weighingmachine; thus noise reduction is essential process [16–19].The electric motor, AC induction or BLDC motor, is used toactuate belt conveyor [20–22], which has different vibrationcharacteristics. Also other individual components of beltconveyor, such as bearing, belt, and roller, with accompa-nying vibration, transfer noise to load cell sensor [23]. Theway to reduce the vibration noise of belt conveyor has beeninvestigated [24, 25], and the method to locate the fault point
in belt conveyor has been attempted by analyzing audiblesignal from belt conveyor [26, 27]. Also the investigationto driving motor to reduce the noise was conducted [28].The work to improve accuracy through modeling has beenperformed forweighingmachine adapting belt conveyor [29].Further efforts to enhance continuousmeasurement accuracyfor high speed mass measurement have been performed [30,31]. In respect of analysis method, the algorithm adaptingfrequency analysis [32, 33] or digital filter [34] was attempted.In this paper, the noise in load cell signal in an automaticweighing system based on a belt conveyor is analyzed, and themethod to reduce the noise component in load cell sensor isinvestigated.
2. Vibration Noise Analysis
Noise, 𝑌𝑋(𝑡, 𝑥), from belt conveyor contains not only theoperating vibration but also the environment noise, as shownin (1). The environment noise, 𝑁𝑋(𝑡, 𝑥), has the characteris-tics of either white noise or nonstationary process; howeverthe operating vibration, 𝑆𝑋(𝑡, 𝑥), has the characteristics ofwide sense stationary process. These noises from individualcomponents of belt conveyor can be analyzed in time domainand frequency domains. The objective of this study is to
HindawiJournal of SensorsVolume 2017, Article ID 1524782, 9 pageshttps://doi.org/10.1155/2017/1524782

2 Journal of Sensors
(a) (b)
(c)
Figure 1: Measurement setup. (a) Weighing machine. (b) Pulley. (c) Belt conveyor.
reduce the noise from operating vibration by analyzing noisecomponents through actual measurement.
2.1. Noise Components from Operating Vibration. The maincomponents of noise 𝑆𝑋(𝑡, 𝑥) are influenced by the lengthof conveyor, 𝑙𝐶, the radius of belt pulley, 𝑟𝑝, the number oftoothed belt pulley’s teeth, 𝑛𝑝, and the number of toothedmotor pulley’s teeth, 𝑛𝑚, in terms of elapsed time, t, andmotoraxis position, x. Fourier transform of noise 𝑆𝑋(𝑡, 𝑥) can bedecomposed into the noise from belt conveyor, 𝐵𝑋(𝑓, 𝑥), thenoise from belt pulley, 𝑃𝑋(𝑓, 𝑥), and the noise from drivingmotor, 𝑀𝑋(𝑓, 𝑥), in terms of frequency, 𝑓, and position, 𝑥,as shown in (2). Fourier transform of noise 𝑁𝑋(𝑡, 𝑥) can beexpressed as random variable, 𝐶, as shown in (3).
𝑌𝑋 (𝑡, 𝑥) = 𝑆𝑋 (𝑡, 𝑥) + 𝑁𝑋 (𝑡, 𝑥) , (1)
I (𝑆𝑋 (𝑡, 𝑥)) = 𝐵𝑋 (𝑓, 𝑥) + 𝑃𝑋 (𝑓, 𝑥) +𝑀𝑋 (𝑓, 𝑥) , (2)
I (𝑁𝑋 (𝑡, 𝑥)) = 𝐶. (3)
The originating fundamental noise frequency, 𝑓 = 𝑅rpm/60, is from driving motor revolution per minute, 𝑅rpm. Theconsequential noise components, which are random process,can be represented in terms of 𝑓, if we fix 𝑥 to a particularvalue, with corresponding magnitude, 𝑎𝑛, as follows. In casewe represent above expression in terms of belt speed, V𝑐, 𝑓is replaced by 𝑓 = (1/2𝜋𝑟𝑝)(𝑛𝑝/𝑛𝑚)V𝑐. Parameters whichare used in the experiment are as in Table 1. However theresonance between each noise components and physical
Table 1: Belt conveyor parameters.
Symbol Value𝑅rpm 1800/N𝑓 30Hz/N𝑟𝑝 9mm𝑛𝑝 20𝑛𝑚 40𝑙𝐶 300mm
structure makes constructive and destructive interference;thus it needs to be verified through actual measurement.
𝐵 (𝑓) = 𝑎1𝑙𝑐
(2𝜋𝑟𝑝 (𝑛𝑚/𝑛𝑝) 𝑓), (4)
𝑃 (𝑓) = (𝑎2 + 𝑎3𝑛𝑝)𝑛𝑚𝑛𝑝𝑓, (5)
𝑀(𝑓) = (𝑎4 + 𝑎5𝑛𝑚) 𝑓. (6)
2.2. Measurement of Noise from Belt Conveyor. Noise hasbeen measured in time and frequency domains by usingbelt conveyor, having 200mm width, of automatic weighingmachine as shown in Figure 1. Signal and noise are pickedup at the load cell, having 3 kg rated capacity, and amplified1,000 times before ADC (analog to digital conversion). Thebelt conveyor speed was varied from 10m/min to 80m/min,which is equivalent to 167∼1,333mm/sec or to 𝑓 = 1.48∼

Journal of Sensors 3
11.8Hz, and the received waveform was measured at thetest point before ADC. From (4)∼(6), we can induce thatnoise spectrum lies in the frequency range between 𝑓 and itsharmonic frequencies; however it will be hard to figure outnoise spectrum unless measured experimentally.
Typical snap shot waveforms at the belt conveyor speedof 20m/min, 50m/min, and 70m/min are shown in time andfrequency domains as shown in Figure 2. Time domainwave-forms are shown in 50mV/div, 500mV/div, and 100mV/div,respectively, for 𝑦-scale and in 10ms for 𝑥-scale. Frequencyspectrums were measured by using NI PCI-6251 DAQ boardand LabVIEW software with 5 averages at RMS averagingmode. For clock settings of DAQ, one hundred samples wereread at 1000Hz rate. Frequency spectrums are shown in 0∼−45 dBV2rms for 𝑦-scale and in 0∼500Hz for 𝑥-scale.
The distribution of peak noise in frequency spectrumshowed that the peak noise frequency had a tendency toincrease linearity with ∼0.7Hz/(m/min) rate through 40∼55m/min belt speed range. Also the resonance frequencywas found to be ∼36Hz at 47m/min belt speed as shown inFigure 3. However the nonlinearity was observed when thebelt speed was approaching to resonance speed of 47m/min.This is due to pulling effect; the tendency to maintain theconstant peak noise frequency of ∼34.5Hz in the vicinityof 36Hz resonance frequency, through 40∼55m/min beltspeed range. Also multiple frequency peaks are observed,in frequency spectrum except resonance condition, due tomultiple noise components.
3. Noise Reduction Technique
The signal, which contains measured weight informationand noise while in operation, is picked up from the loadcell sensor. In general, it will be advantageous to obtainbetter signal-to-noise ratio by limiting frequency bandwidthusing narrower frequency limiting filters. However, this willeventually distort the input waveform, and the relativelyshorter plateau of input square waveform will be obtained.When the belt speed is low, the pulse duration of input squarewaveform will be longer, and when the belt speed is high,the pulse duration will be shorter. Thus the figure of meritis determined using pulse width ratio, 𝑅PW, which is the ratioof top pulse width, 𝐿Top, to bottom pulse width, 𝐿Bot, of inputwaveform after passing frequency limiting filters as shown in(7) and in Figure 4.
𝑅PW =𝐿Top𝐿Bot. (7)
3.1. Noise Reduction Algorithm. The input signal was filteredthrough LPF having variable cutoff frequency and slopecontrolling capability to obtain the bigger pulse width ratioand the more than minimum top pulse width of input signaldepending on the belt conveyor speed. The cutoff frequencyof LPF was chosen by tracking the peak noise frequencycomponent and comparing with the predetermined valuealong with belt speed. And the slope of LPF was controlledby monitoring the pulse width ratio to keep more thanminimum top pulse width of input signal.The predetermined
value overrides to the calculated LPF cutoff frequency andslope unless the measured magnitude of noise frequencyis lower than the predetermined value. This is to maintainstable noise rejection when the belt speed correspondsto off resonance frequency where multiple noise compo-nent presents in the noise spectrum. The block diagramshowing this noise reduction (NR) process is shown inFigure 5.
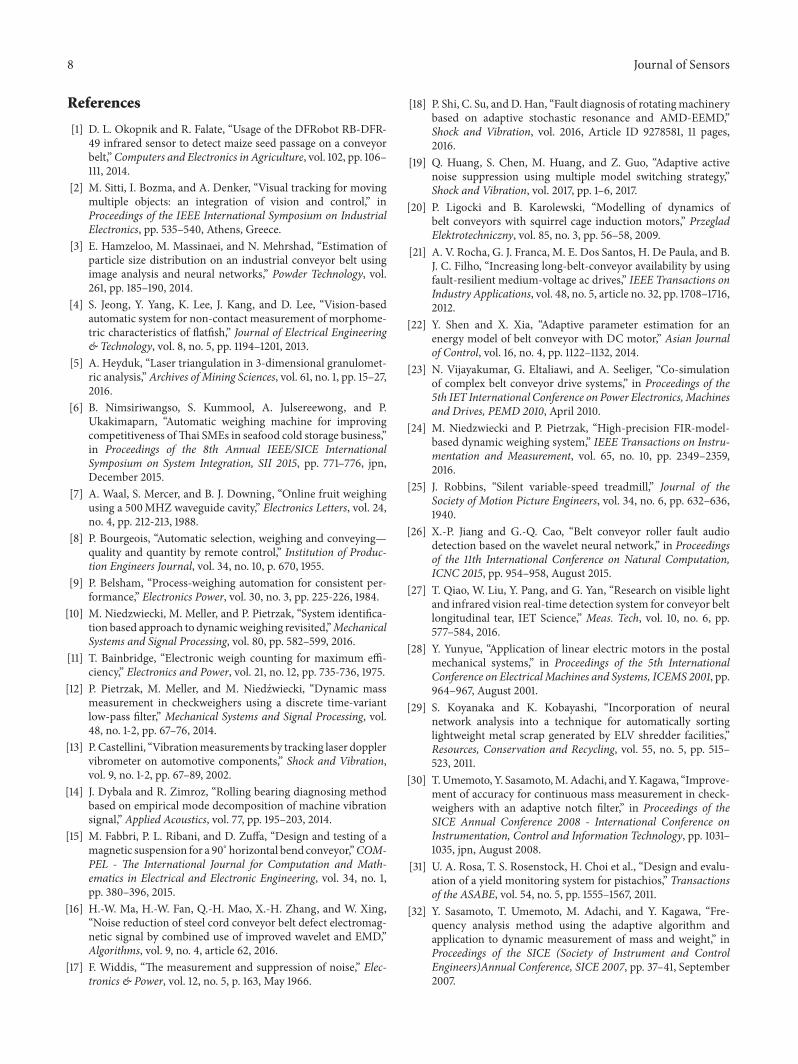
3.2. Variable Cutoff Frequency and Slope LPF. The proposedLPF having variable cutoff frequency and slope controlcapability is consisted with primary LPF for cutoff frequencycontrol, which is followed by secondary 6 stages of LPF forslope control. The primary LPF adapted 8th-order ellipticfilter having continuous variable cutoff frequency controlcapability to reject peak noise components in the wide noisefrequency spectrumdistribution.The secondary LPF adapted6 stages of LPF having Sallen-Key topology to obtain biggerpulse width ratio while rejecting unwanted noise spectrum.The discrete switches having digital control capability wereused to selectively control each stage of LPF.The primary LPFused the dedicated IC, LTC1066-1, which had the externalclock-tunable feature for sharp cutoff frequency controlling.The secondary LPF used the 6-stage LPFs having staggeredcutoff frequencies. The block diagram of proposed LPF is asshown in Figure 6. The microprocessor was used to controlcutoff frequency and slope control.
4. Noise Measurement
The characteristics of proposed LPF having variable cutofffrequency were examined by varying input frequency. Theeffectiveness of the proposed noise reduction technique wasevaluated by flowing actual mass on the belt conveyor andmonitoring the mass information recovery from the noisybackground. The peak noise frequency components wereremoved by primary LPF, and optimum pulse width ratiowas controlled by secondary LPF using cutoff frequency slopecontrol.The cutoff frequency of primary LPFwas determinedby analyzing noise frequency spectrum using the 9 band-pass filters during calibration stage. The passband frequencyspan of band-pass filters was 5Hz, and the range of frequencymonitoring was from 17.5Hz to 62.5Hz. In the initial stage,the cutoff frequency of primary LPF was to set to 65Hzto cover unmonitored frequency band, and optimum pulsewidth ratio was controlled. The filter bypass switches insecondary LPF were used for LPF slope control. The top andbottom pulse widths of output signal pulse containing thetest mass information were monitored by flowing test massand selectively switching the combination of 4 LPF bypassswitches in secondary LPF during calibration stage.The pulsewidth ratio was calculated from this width information, andthe optimum switching logic was determined from the bestpulse width ratio information.
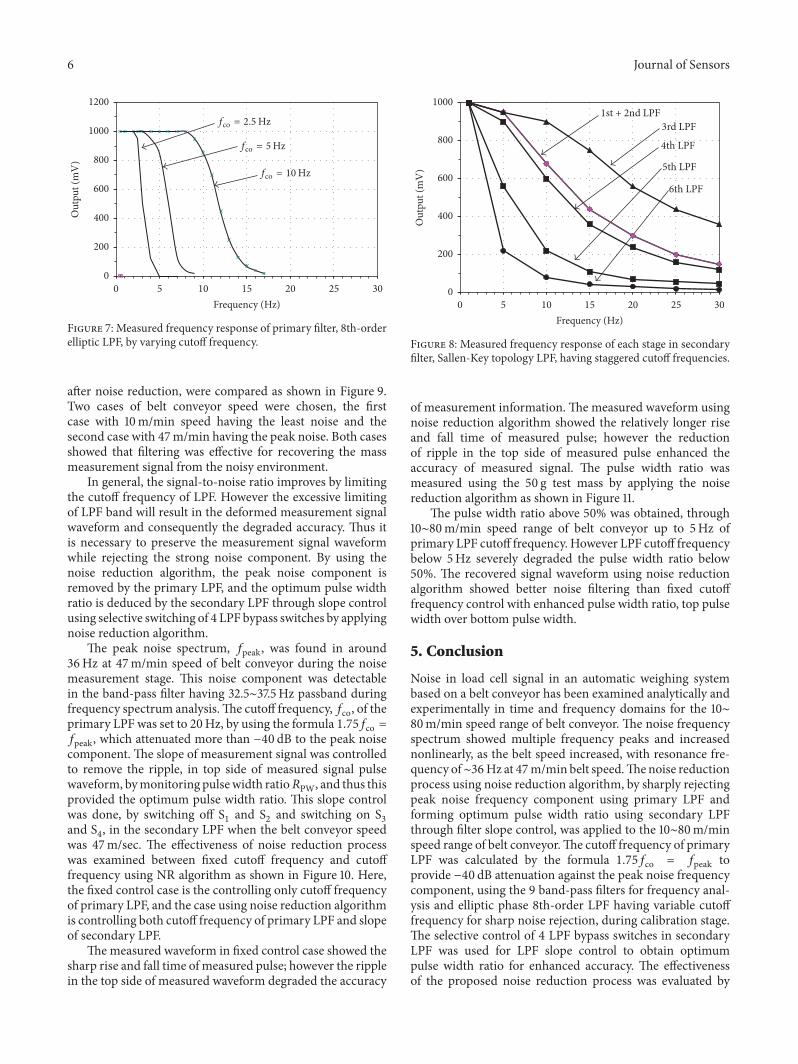
4.1. Characteristics of LPF Having Variable Cutoff Frequency.The measured frequency response of primary filter, 8th-order elliptic low pass filter adapting LTC1066-1, showedattenuation characteristics as shown in Figure 7. Also the

4 Journal of Sensors
0
50
100
150
200
250
300
350
400
0 10 20 30 40 50 60 70 80 90 100 110 120
Out
put (
mV
)
Time (ms)
0 100 200 300 400 500Frequency (Hz)
−5
−15
−25
−35
−45
Out
put (
dB6
2 LGM)
(a)
0
500
1000
1500
2000
2500
3000
3500
4000
0 10 20 30 40 50 60 70 80 90 100 110 120
Out
put (
mV
)
Time (ms)
0 100 200 300 400 500Frequency (Hz)
−5
−15
−25
−35
−45
Out
put (
dB6
2 LGM)
(b)
0
100
200
300
400
500
600
700
800
0 10 20 30 40 50 60 70 80 90 100 110 120
Out
put (
mV
)
Time (ms)
0 100 200 300 400 500Frequency (Hz)
−5
−15
−25
−35
−45
Out
put (
dB6
2 LGM)
(c)
Figure 2: Noise waveforms in time (upper) and frequency (lower) domains. (a) V𝑐 = 20m/min. (b) V𝑐 = 50m/min. (c) V𝑐 = 70m/min.

Journal of Sensors 5
30
32
34
36
38
40
42
40 45 50 55
Noi
se fr
eque
ncy
(Hz)
Displayed belt speed (m/min)
(a)
0
300
600
900
1200
1500
40 45 50 55
Noi
se v
olt (
mVp
g)
Displayed belt speed (m/min)
(b)
0
400
800
1200
1600
0 20 40 60 80 100
Noi
se v
olt (
mV
)
Frequency (Hz)
(c)
Figure 3: Noise intensity and frequency variation along with belt conveyor speed. (a) Peak noise frequency versus speed. (b) Noise intensityversus speed. (c) Noise intensity versus frequency.
Bottom pulse width
Top pulse width
20%
80%100%
Input signal
t
Figure 4: Definition of parameters in pulse width ratio.
Loadcell Amp.
Frequencyspectrumanalysis
LPFcontrol
Signal output
Belt conveyorspeed controller
Predeterminedfrequency table
MeasureR07
and slope LPFVariable f=I
Figure 5: Block diagram showing noise reduction process byutilizing LPF with variable cutoff frequency and slope.
Secondary LPF
S1 S2
S3 S4
Input
Pri, LPFvar. f=I
1st + 2nd LPFf=I = 13(T
3rd LPFf=I = 22(T
4th LPFf=I = 11(T
5th LPFf=I = 6(T
6th LPFf=I = 3(T
Figure 6: Block diagram of variable 𝑓co and slope LPF.
measured frequency responses of secondary filter are asshown in Figure 8.
4.2. Mass Measurement after Noise Reduction. The test massof 50 g weight was flown to the belt conveyor, and two signals,received signal before noise reduction and recovered signal
6 Journal of Sensors
0
200
400
600
800
1000
1200
0 5 10 15 20 25 30
Out
put (
mV
)
Frequency (Hz)
f=I = 2.5 (T
f=I = 5(T
f=I = 10(T
Figure 7: Measured frequency response of primary filter, 8th-orderelliptic LPF, by varying cutoff frequency.
after noise reduction, were compared as shown in Figure 9.Two cases of belt conveyor speed were chosen, the firstcase with 10m/min speed having the least noise and thesecond case with 47m/min having the peak noise. Both casesshowed that filtering was effective for recovering the massmeasurement signal from the noisy environment.
In general, the signal-to-noise ratio improves by limitingthe cutoff frequency of LPF. However the excessive limitingof LPF band will result in the deformed measurement signalwaveform and consequently the degraded accuracy. Thus itis necessary to preserve the measurement signal waveformwhile rejecting the strong noise component. By using thenoise reduction algorithm, the peak noise component isremoved by the primary LPF, and the optimum pulse widthratio is deduced by the secondary LPF through slope controlusing selective switching of 4 LPF bypass switches by applyingnoise reduction algorithm.
The peak noise spectrum, 𝑓peak, was found in around36Hz at 47m/min speed of belt conveyor during the noisemeasurement stage. This noise component was detectablein the band-pass filter having 32.5∼37.5Hz passband duringfrequency spectrum analysis.The cutoff frequency,𝑓co, of theprimary LPF was set to 20Hz, by using the formula 1.75𝑓co =𝑓peak, which attenuated more than −40 dB to the peak noisecomponent. The slope of measurement signal was controlledto remove the ripple, in top side of measured signal pulsewaveform, bymonitoring pulsewidth ratio𝑅PW, and thus thisprovided the optimum pulse width ratio. This slope controlwas done, by switching off S1 and S2 and switching on S3and S4, in the secondary LPF when the belt conveyor speedwas 47m/sec. The effectiveness of noise reduction processwas examined between fixed cutoff frequency and cutofffrequency using NR algorithm as shown in Figure 10. Here,the fixed control case is the controlling only cutoff frequencyof primary LPF, and the case using noise reduction algorithmis controlling both cutoff frequency of primary LPF and slopeof secondary LPF.
Themeasured waveform in fixed control case showed thesharp rise and fall time of measured pulse; however the ripplein the top side of measured waveform degraded the accuracy
0
200
400
600
800
1000
0 5 10 15 20 25 30
Out
put (
mV
)
Frequency (Hz)
1st + 2nd LPF3rd LPF
4th LPF
5th LPF
6th LPF
Figure 8: Measured frequency response of each stage in secondaryfilter, Sallen-Key topology LPF, having staggered cutoff frequencies.
of measurement information.The measured waveform usingnoise reduction algorithm showed the relatively longer riseand fall time of measured pulse; however the reductionof ripple in the top side of measured pulse enhanced theaccuracy of measured signal. The pulse width ratio wasmeasured using the 50 g test mass by applying the noisereduction algorithm as shown in Figure 11.
The pulse width ratio above 50% was obtained, through10∼80m/min speed range of belt conveyor up to 5Hz ofprimary LPF cutoff frequency. However LPF cutoff frequencybelow 5Hz severely degraded the pulse width ratio below50%. The recovered signal waveform using noise reductionalgorithm showed better noise filtering than fixed cutofffrequency control with enhanced pulse width ratio, top pulsewidth over bottom pulse width.
5. Conclusion
Noise in load cell signal in an automatic weighing systembased on a belt conveyor has been examined analytically andexperimentally in time and frequency domains for the 10∼80m/min speed range of belt conveyor. The noise frequencyspectrum showed multiple frequency peaks and increasednonlinearly, as the belt speed increased, with resonance fre-quency of∼36Hz at 47m/min belt speed.Thenoise reductionprocess using noise reduction algorithm, by sharply rejectingpeak noise frequency component using primary LPF andforming optimum pulse width ratio using secondary LPFthrough filter slope control, was applied to the 10∼80m/minspeed range of belt conveyor.The cutoff frequency of primaryLPF was calculated by the formula 1.75𝑓co = 𝑓peak toprovide −40 dB attenuation against the peak noise frequencycomponent, using the 9 band-pass filters for frequency anal-ysis and elliptic phase 8th-order LPF having variable cutofffrequency for sharp noise rejection, during calibration stage.The selective control of 4 LPF bypass switches in secondaryLPF was used for LPF slope control to obtain optimumpulse width ratio for enhanced accuracy. The effectivenessof the proposed noise reduction process was evaluated by

Journal of Sensors 7
Ch. 1before reduction
Ch. 2after reduction
Time (500 ms/div)
Ch. 2
(100
G6/>
CP)
Ch. 1
(100
G6/>
CP),
(a)
Ch. 1before reduction
Ch. 2after reduction
Time (250 ms/div)
Ch. 2
(100
G6/>
CP)
Ch. 1
(500
G6/>
CP),
(b)
Figure 9: 50 g mass measurement signals before and after noise reduction. (a) V𝑐 = 10m/min. (b) V𝑐 = 47m/min.
Ch. 1fixed control
Ch. 2NR algorithm
Time (1 sec/div)
Ch. 2
(100
G6/>
CP)
Ch. 1
(100
G6/>
CP),
(a)
Ch. 1fixed control
Ch. 2NR algorithm
Time (500 ms/div)
Ch. 2
(100
G6/>
CP)
Ch. 1
(100
G6/>
CP),
(b)
Figure 10: 50 g mass measurement signals between fixed cutoff frequency control and cutoff frequency control using NR algorithm. (a)V𝑐 = 10m/min. (b) V𝑐 = 47m/min.
020406080
100
0 5 10 15 20
Pulse
wid
thra
tio (%
)
LPF cutoff frequency (Hz)
c = 80G/Gc = 47G/G
c = 10G/G
(a)
020406080
100
0 20 40 60 80
Pulse
wid
thra
tio (%
)
Belt speed (m/min)
f=I = 2.5 (T
f=I = 1.25 (T
f=I = 20(T f=I = 10(T
f=I = 5(T
(b)
Figure 11: Pulse width ratio of 50 g mass measurement signals between cutoff frequency of primary LPF and belt conveyor speed.
feeding 50 g test mass and monitored accordingly. The resultshowed that noise reduction process using noise reductionalgorithm had better pulse width ratio, implying betteraccuracy, than fixed cutoff frequency control for recoveringthe mass information from the noisy environment.The pulsewidth ratio above 50% was obtained, through 10∼80m/minspeed range of belt conveyor up to 5Hz of primary LPF cutofffrequency.However LPF cutoff frequency below 5Hz severelydegraded the pulse width ratio below 50%.
Conflicts of Interest
The author declares that there are no conflicts of interestregarding the publication of this paper.
Acknowledgments
This work was supported by Incheon National UniversityResearch Grant in 2016.
8 Journal of Sensors
References
[1] D. L. Okopnik and R. Falate, “Usage of the DFRobot RB-DFR-49 infrared sensor to detect maize seed passage on a conveyorbelt,”Computers and Electronics in Agriculture, vol. 102, pp. 106–111, 2014.
[2] M. Sitti, I. Bozma, and A. Denker, “Visual tracking for movingmultiple objects: an integration of vision and control,” inProceedings of the IEEE International Symposium on IndustrialElectronics, pp. 535–540, Athens, Greece.
[3] E. Hamzeloo, M. Massinaei, and N. Mehrshad, “Estimation ofparticle size distribution on an industrial conveyor belt usingimage analysis and neural networks,” Powder Technology, vol.261, pp. 185–190, 2014.
[4] S. Jeong, Y. Yang, K. Lee, J. Kang, and D. Lee, “Vision-basedautomatic system for non-contact measurement of morphome-tric characteristics of flatfish,” Journal of Electrical Engineering& Technology, vol. 8, no. 5, pp. 1194–1201, 2013.
[5] A. Heyduk, “Laser triangulation in 3-dimensional granulomet-ric analysis,” Archives of Mining Sciences, vol. 61, no. 1, pp. 15–27,2016.
[6] B. Nimsiriwangso, S. Kummool, A. Julsereewong, and P.Ukakimaparn, “Automatic weighing machine for improvingcompetitiveness ofThai SMEs in seafood cold storage business,”in Proceedings of the 8th Annual IEEE/SICE InternationalSymposium on System Integration, SII 2015, pp. 771–776, jpn,December 2015.
[7] A. Waal, S. Mercer, and B. J. Downing, “Online fruit weighingusing a 500MHZ waveguide cavity,” Electronics Letters, vol. 24,no. 4, pp. 212-213, 1988.
[8] P. Bourgeois, “Automatic selection, weighing and conveying—quality and quantity by remote control,” Institution of Produc-tion Engineers Journal, vol. 34, no. 10, p. 670, 1955.
[9] P. Belsham, “Process-weighing automation for consistent per-formance,” Electronics Power, vol. 30, no. 3, pp. 225-226, 1984.
[10] M. Niedzwiecki, M. Meller, and P. Pietrzak, “System identifica-tion based approach to dynamicweighing revisited,”MechanicalSystems and Signal Processing, vol. 80, pp. 582–599, 2016.
[11] T. Bainbridge, “Electronic weigh counting for maximum effi-ciency,” Electronics and Power, vol. 21, no. 12, pp. 735-736, 1975.
[12] P. Pietrzak, M. Meller, and M. Niedzwiecki, “Dynamic massmeasurement in checkweighers using a discrete time-variantlow-pass filter,” Mechanical Systems and Signal Processing, vol.48, no. 1-2, pp. 67–76, 2014.
[13] P. Castellini, “Vibrationmeasurements by tracking laser dopplervibrometer on automotive components,” Shock and Vibration,vol. 9, no. 1-2, pp. 67–89, 2002.
[14] J. Dybala and R. Zimroz, “Rolling bearing diagnosing methodbased on empirical mode decomposition of machine vibrationsignal,” Applied Acoustics, vol. 77, pp. 195–203, 2014.
[15] M. Fabbri, P. L. Ribani, and D. Zuffa, “Design and testing of amagnetic suspension for a 90∘ horizontal bend conveyor,”COM-PEL - The International Journal for Computation and Math-ematics in Electrical and Electronic Engineering, vol. 34, no. 1,pp. 380–396, 2015.
[16] H.-W. Ma, H.-W. Fan, Q.-H. Mao, X.-H. Zhang, and W. Xing,“Noise reduction of steel cord conveyor belt defect electromag-netic signal by combined use of improved wavelet and EMD,”Algorithms, vol. 9, no. 4, article 62, 2016.
[17] F. Widdis, “The measurement and suppression of noise,” Elec-tronics & Power, vol. 12, no. 5, p. 163, May 1966.
[18] P. Shi, C. Su, andD. Han, “Fault diagnosis of rotatingmachinerybased on adaptive stochastic resonance and AMD-EEMD,”Shock and Vibration, vol. 2016, Article ID 9278581, 11 pages,2016.
[19] Q. Huang, S. Chen, M. Huang, and Z. Guo, “Adaptive activenoise suppression using multiple model switching strategy,”Shock and Vibration, vol. 2017, pp. 1–6, 2017.
[20] P. Ligocki and B. Karolewski, “Modelling of dynamics ofbelt conveyors with squirrel cage induction motors,” PrzegladElektrotechniczny, vol. 85, no. 3, pp. 56–58, 2009.
[21] A. V. Rocha, G. J. Franca, M. E. Dos Santos, H. De Paula, and B.J. C. Filho, “Increasing long-belt-conveyor availability by usingfault-resilient medium-voltage ac drives,” IEEE Transactions onIndustry Applications, vol. 48, no. 5, article no. 32, pp. 1708–1716,2012.
[22] Y. Shen and X. Xia, “Adaptive parameter estimation for anenergy model of belt conveyor with DC motor,” Asian Journalof Control, vol. 16, no. 4, pp. 1122–1132, 2014.
[23] N. Vijayakumar, G. Eltaliawi, and A. Seeliger, “Co-simulationof complex belt conveyor drive systems,” in Proceedings of the5th IET International Conference on Power Electronics,Machinesand Drives, PEMD 2010, April 2010.
[24] M. Niedzwiecki and P. Pietrzak, “High-precision FIR-model-based dynamic weighing system,” IEEE Transactions on Instru-mentation and Measurement, vol. 65, no. 10, pp. 2349–2359,2016.
[25] J. Robbins, “Silent variable-speed treadmill,” Journal of theSociety of Motion Picture Engineers, vol. 34, no. 6, pp. 632–636,1940.
[26] X.-P. Jiang and G.-Q. Cao, “Belt conveyor roller fault audiodetection based on the wavelet neural network,” in Proceedingsof the 11th International Conference on Natural Computation,ICNC 2015, pp. 954–958, August 2015.
[27] T. Qiao, W. Liu, Y. Pang, and G. Yan, “Research on visible lightand infrared vision real-time detection system for conveyor beltlongitudinal tear, IET Science,” Meas. Tech, vol. 10, no. 6, pp.577–584, 2016.
[28] Y. Yunyue, “Application of linear electric motors in the postalmechanical systems,” in Proceedings of the 5th InternationalConference on ElectricalMachines and Systems, ICEMS 2001, pp.964–967, August 2001.
[29] S. Koyanaka and K. Kobayashi, “Incorporation of neuralnetwork analysis into a technique for automatically sortinglightweight metal scrap generated by ELV shredder facilities,”Resources, Conservation and Recycling, vol. 55, no. 5, pp. 515–523, 2011.
[30] T.Umemoto, Y. Sasamoto,M.Adachi, andY.Kagawa, “Improve-ment of accuracy for continuous mass measurement in check-weighers with an adaptive notch filter,” in Proceedings of theSICE Annual Conference 2008 - International Conference onInstrumentation, Control and Information Technology, pp. 1031–1035, jpn, August 2008.
[31] U. A. Rosa, T. S. Rosenstock, H. Choi et al., “Design and evalu-ation of a yield monitoring system for pistachios,” Transactionsof the ASABE, vol. 54, no. 5, pp. 1555–1567, 2011.
[32] Y. Sasamoto, T. Umemoto, M. Adachi, and Y. Kagawa, “Fre-quency analysis method using the adaptive algorithm andapplication to dynamic measurement of mass and weight,” inProceedings of the SICE (Society of Instrument and ControlEngineers)Annual Conference, SICE 2007, pp. 37–41, September2007.

Journal of Sensors 9
[33] A. T. EL-Sayed andH. S. Bauomy, “Nonlinear analysis of verticalconveyor with positive position feedback (PPF) controllers,”Nonlinear Dynamics, vol. 83, no. 1-2, pp. 919–939, 2016.
[34] R. Tasaki, T. Yamazaki, H.Ohnishi,M.Kobayashi, and S. Kurosu,“Continuous weighing on a multi-stage conveyor belt with FIRfilter,”Measurement, vol. 40, no. 7-8, pp. 794–799, 2007.

RoboticsJournal of
Hindawi Publishing Corporationhttp://www.hindawi.com Volume 2014
Hindawi Publishing Corporationhttp://www.hindawi.com Volume 2014
Active and Passive Electronic Components
Control Scienceand Engineering
Journal of
Hindawi Publishing Corporationhttp://www.hindawi.com Volume 2014
International Journal of
RotatingMachinery
Hindawi Publishing Corporationhttp://www.hindawi.com Volume 2014
Hindawi Publishing Corporation http://www.hindawi.com
Journal of
Volume 201
Submit your manuscripts athttps://www.hindawi.com
VLSI Design
Hindawi Publishing Corporationhttp://www.hindawi.com Volume 201
Hindawi Publishing Corporationhttp://www.hindawi.com Volume 2014
Shock and Vibration
Hindawi Publishing Corporationhttp://www.hindawi.com Volume 2014
Civil EngineeringAdvances in
Acoustics and VibrationAdvances in
Hindawi Publishing Corporationhttp://www.hindawi.com Volume 2014
Hindawi Publishing Corporationhttp://www.hindawi.com Volume 2014
Electrical and Computer Engineering
Journal of
Advances inOptoElectronics
Hindawi Publishing Corporation http://www.hindawi.com
Volume 2014
The Scientific World JournalHindawi Publishing Corporation http://www.hindawi.com Volume 2014
SensorsJournal of
Hindawi Publishing Corporationhttp://www.hindawi.com Volume 2014
Modelling & Simulation in EngineeringHindawi Publishing Corporation http://www.hindawi.com Volume 2014
Hindawi Publishing Corporationhttp://www.hindawi.com Volume 2014
Chemical EngineeringInternational Journal of Antennas and
Propagation
International Journal of
Hindawi Publishing Corporationhttp://www.hindawi.com Volume 2014
Hindawi Publishing Corporationhttp://www.hindawi.com Volume 2014
Navigation and Observation
International Journal of
Hindawi Publishing Corporationhttp://www.hindawi.com Volume 2014
DistributedSensor Networks
International Journal of