No.ENG/PSC/66(29)2012-Monthly report Date:...
21
1 भारत सरकार / GOVERNMENT OF INDIA पोत पररवहन मंालय / MINISTRY OFSHIPPING नौवहन महाननदेशालय/ DIRECTORATE GENERAL OF SHIPPING टेलीफोन: 91-22-25752040/1/2/3/5 “निटा निडंग”, 9 वी मंनिल / “BETA BUILDING”, 9 th FLOOR Tele: 91-22-25752040/1/2/3/5 फैस: 25752029/35 आय-नंक टेनो कॅ पस/ I-THINK TECHNO CAMPUS Fax: 25752029/35 ई-मेल: [email protected] कांिुरमागग (ईट) / KANJUR MARG (EAST) E-mail: [email protected] वेि: www.dgshipping.gov.in मुंिई/ MUMBAI – 400 042 Web: www.dgshipping.gov.in No.ENG/PSC/66(29)2012-Monthly report Date: 08.11.2017 PSC/FSI Inspection Report for September 2017 A. PORT STATE INSPECTIONS OF FOREIGN FLAG VESSELS IN INDIA a) There was a total of 38 inspections in September 17. This is a 7.3% reduction in inspection numbers compared to August. The Kochi district conducted maximum number of PSC inspections among all district with a total of 12 inspections, that is, 31.6% of total inspections. b) About 65.8% of the vessels inspected were in IOMOU high risk category compared to 80.5% in August 17. c) In terms of performance, there was one detention in September. The deficiency index reduced from 4.66 in August to 3.8 in September, while the nil deficiency index has increased from 0.122 in August to 0.184 in September. d) Risk based performance: Medium risk vessels continue to perform poorly with one detentions and the highest deficiency index of 4.83 compared to deficiency ratios 2.84 and 0 respectively for high and low risk vessels. e) Type based performance: General cargo vessels were the poor performing type category in September 2017, with one detention and a highest deficiency ratio of 5.83.
Transcript of No.ENG/PSC/66(29)2012-Monthly report Date:...
1
भारत सरकार / GOVERNMENT OF INDIA
पोत पररवहन मंत्रालय / MINISTRY OFSHIPPING
नौवहन महाननदेशालय/ DIRECTORATE GENERAL OF SHIPPING टेलीफोन: 91-22-25752040/1/2/3/5 “निटा निल्डंग”, 9 वी मंनिल / “BETA BUILDING”, 9th FLOOR Tele: 91-22-25752040/1/2/3/5
फैक् स: 25752029/35 आय-न ंक टेक् नो कॅम् पस/ I-THINK TECHNO CAMPUS Fax: 25752029/35
ई-मेल: [email protected] कांिुरमागग (ईस् ट) / KANJUR MARG (EAST) E-mail: [email protected]
वेि: www.dgshipping.gov.in मंुिई/ MUMBAI – 400 042 Web: www.dgshipping.gov.in
No.ENG/PSC/66(29)2012-Monthly report Date: 08.11.2017
PSC/FSI Inspection Report for September 2017
A. PORT STATE INSPECTIONS OF FOREIGN FLAG VESSELS IN INDIA
a) There was a total of 38 inspections in September 17. This is a 7.3%
reduction in inspection numbers compared to August. The Kochi district
conducted maximum number of PSC inspections among all district with a
total of 12 inspections, that is, 31.6% of total inspections.
b) About 65.8% of the vessels inspected were in IOMOU high risk category
compared to 80.5% in August 17.
c) In terms of performance, there was one detention in September. The
deficiency index reduced from 4.66 in August to 3.8 in September, while
the nil deficiency index has increased from 0.122 in August to 0.184 in
September.
d) Risk based performance: Medium risk vessels continue to perform poorly
with one detentions and the highest deficiency index of 4.83 compared to
deficiency ratios 2.84 and 0 respectively for high and low risk vessels.
e) Type based performance: General cargo vessels were the poor performing
type category in September 2017, with one detention and a highest
deficiency ratio of 5.83.
2
f) Recognized Organizations: Compared to other RO’s whose vessels were
inspected, BV Class was the least performer in September, with one
detention and a deficiency index of 5. RINA and VR were equally poor
performers, though with no detentions, but with a deficiency ratio of 5 and
9 respectively.
g) Flags performance: Belize flag had one and the only detention in India in
September and also the highest deficiency ratio of 15 among all the flags
whose vessels were inspected.
h) 17% of all the deficiencies given in September pertained to Seafarers
working and living conditions while 12.4% were related to
water/weathertight conditions.
i) Detained Vessel
Name of Vessels IMO No. Flag RO Type/Age
ESI ANAX 9214587 Belize BV GC/17
B. Flag State Inspections of Indian Flag Vessels
a) There were 40 Flag state inspections in July. Mumbai district conducted the
maximum of 15 inspections followed by Kolkata with 11 inspections. Kandla
district conducted the least number of inspections.
b) Compared to August, there was one detention in September constituting
2.5% detention rate. The overall performance has dropped in September
when compared to August with deficiency index increasing from 7.3 to 8.8
and nil-deficiency ration reducing from 0.08 to 0.025.
c) Performance based on size and type: General Cargo/OCV had one
detention and with 22 inspections constituted about 4.5% detention rate.
These vessels had a higher than average deficiency index of 11.4 and also
higher than average nil deficiency index of 0.045 indicating a mix
performance.
d) Recognized Organizations: Dual IRS-BV Class vessels had one detention and
the highest deficiency index of 22 while IRS-LR Class vessel had the least
deficiency index of 5.

3
e) Owners/Managers: Among all the companies whose ships were inspected
for Flag State inspections, the vessels managed by GOL Offshore had the
one and only detention in September and a deficiency ratio of 22 while
Hind Off-shore had the highest deficiency index of 24.5, while those
managed by Sea Sparkle Harbour Services had nil deficiency index.
f) The top three areas of deficiencies included Working conditions, Safety of
Navigation and fire safety measures.
C. Port State Inspection of Indian Flag Vessels abroad
a) There was a total of 16 Indian Flag vessels inspected in August 2017 in 5
regional MOU/ PSC regimes.
b) Compared to August, the performance of Indian Flag vessels has dropped in
September with 1 detention and detention rate increasing from 5% in
August to 6.2% in September. The deficiency index however reduced from
1.55 in August to 1.375 and nil deficiency index also reducing from 0.7 to
0.625.
c) With three inspections in Riyadh MOU and 1 detention and more than
average deficiency index of 1.67, the performance was below average
performance of Indian Flag. However, a nil-deficiency index of 0.66
indicates that this poor performance is due to the single detained vessel.
d) Among all ship type, the performance of Bulk Carriers and Containers above
15 years of age was below average with a deficiency index of 5 each. The
only vessel detained in September was a Container vessel. The
performance of oil tanker between 5-15 years was well above average
Indian Flag with a deficiency ratio of 0.25 and nil deficiency index of 0.75
e) Among all the shipping companies, the only vessel detained was managed
by Quadrant Maritime. The performance of GESCO was well above the
average with 10 inspections and 80% of those resulting in no deficiencies.
f) Among Recognized Organizations, Single IRS Class vessels recorded 1
detention and a deficiency index of 5.
g) Life-saving appliances and Fire Safety measures continue to be an area of
concern.
4
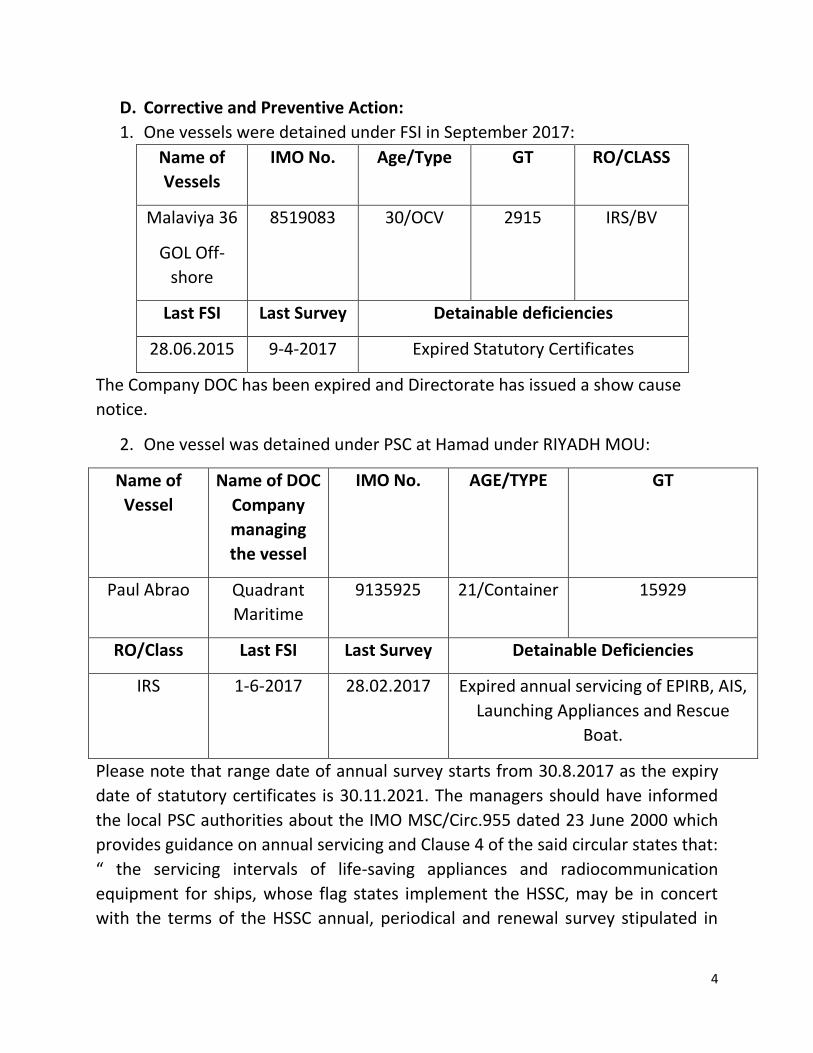
D. Corrective and Preventive Action:
1. One vessels were detained under FSI in September 2017:
Name of
Vessels
IMO No. Age/Type GT RO/CLASS
Malaviya 36
GOL Off-
shore
8519083 30/OCV 2915 IRS/BV
Last FSI Last Survey Detainable deficiencies
28.06.2015 9-4-2017 Expired Statutory Certificates
The Company DOC has been expired and Directorate has issued a show cause
notice.
2. One vessel was detained under PSC at Hamad under RIYADH MOU:
Name of
Vessel
Name of DOC
Company
managing
the vessel
IMO No. AGE/TYPE GT
Paul Abrao Quadrant
Maritime
9135925 21/Container 15929
RO/Class Last FSI Last Survey Detainable Deficiencies
IRS 1-6-2017 28.02.2017 Expired annual servicing of EPIRB, AIS,
Launching Appliances and Rescue
Boat.
Please note that range date of annual survey starts from 30.8.2017 as the expiry
date of statutory certificates is 30.11.2021. The managers should have informed
the local PSC authorities about the IMO MSC/Circ.955 dated 23 June 2000 which
provides guidance on annual servicing and Clause 4 of the said circular states that:
“ the servicing intervals of life-saving appliances and radiocommunication
equipment for ships, whose flag states implement the HSSC, may be in concert
with the terms of the HSSC annual, periodical and renewal survey stipulated in

5
the 1988 SOLAS Protocol not withstanding regulations III/20.8, III/20.9 and
IV/15.9 of the 1974 SOLAS Convention, as amended”.
Graphical Representation of Port State Inspection of Foreign Ships in India
1. Port State Inspection of Foreign Ships in India
Figure 1: Number of Inspections and Risk based Inspection trends
Figure 2: Trends in detentions: 2017
38
114
123
8
0
10
20
30
40
Number of inspections and distribution: September
2017
71.80%80.50%
65.80%
17.90% 12.20%31.60%
10.30%7.80% 2.60%0.00%
50.00%
100.00%
July August September
Trends in percentage of Risk based inspections: July-
August 17
High Risk Medium Risk Low Risk
4
1
3 3
0 0
6
01
0
1
2
3
4
5
6
7
Trends in number of detentions: January-
September 17
9.10%
2.30%
6.80%7.70%
0.00% 0.00%
15.30%
0.00%
2.60%
0.00%
2.00%
4.00%
6.00%
8.00%
10.00%
12.00%
14.00%
16.00%
18.00%
Trends in detention percentage: Jan-September 2017

6
Risk Type Number of
Inspections
Number of
detentions
Deficiency
Ratio
Nil-deficiency
Ratio
All Vessels 38 1 3.4 0.184
High Vessels 25 0 2.84 0.24
Medium Vessels 12 1 4.83 0
Low Risk Vessels 1 0 0 1
Table 1: Risk based Performance Parameters: September 17
Type of Vessel Number of
Inspections
Number of
detentions
Deficiency
Ratio
Nil-deficiency
Ratio
All Vessels 38 1 3.4 0.184
Bulk Carrier 15 0 2.13 0.2
Chemical Tanker 6 0 3.66 0.166
Container Vessels 3 0 4.66 0
Gas Carriers 1 0 4 0
General Cargo 10 1 5.6 0.1
Oil Tankers 3 0 0.33 0.66
Table 2: Performance parameters ship type
Name of
Recognized
Organization
Number of
inspections
Number of
detentions
Deficiency Ratio Nil-deficiency ratio
All Vessels 38 1 3.4 0.184
ABS 3 0 0.66 0.66
BV 7 1 5 0.142
CCS 1 0 3 0
DNV/GL/DNV-GL(AS) 2 0 3.5 0
KRS 3 0 4 0.33
LR 5 0 2 0.2
NK 15 0 3.06 0.133
RINA 1 0 5 0
VR 1 0 9 0
Table 3: Performance of Recognized Organizations

7
Flag No. of
inspections
No. of
detentions
Deficiency
Index
Nil-Deficiency
Index
All Vessels 38 1 3.4 0.184
Antigua &
Bermuda
1 0 7 0
Belize 1 1 15 0
Cyprus 2 0 1 0.5
Denmark 1 0 1 0
Gibraltar 1 0 5 0
Hong Kong 2 0 1.5 0.5
Republic of Korea 2 0 2 0.5
Liberia 1 0 1 0
Malta 3 0 3 0.33
Marshall Island 2 0 1 0.5
Panama 13 0 3.61 0.077
Philippines 1 0 1 0
Portugal 1 0 2 0
Singapore 3 0 4.33 0
Thailand 1 0 4 0
Tuvalu 1 0 4 0
Vietnam 2 0 4.5 0.5
Table 4: Performance of Flags
8
Code Type Number (%age
of total)
Typical deficiencies
011 Certificates & Documentation (Ship
Certificates)
5(3.8%)
012 Certificates & Documentation (Crew
Certificates)
1(0.77%)
013 Certificates & Documentation-
Documents
10(7.7%) Rest hours records/Garbage Record book
021 Structural Conditions 3(2.3%) Hull/Other structural
031 Water/Weathertight Conditions 16(12.4%) Ventilators, air pipes and casings/Machinery
space openings
041 Emergency Systems 6(4.6%) Emergency Generators/Emergency
Batteries
051 Radio Communications 3(2.3%) MF/HF Radio
061 Cargo Operations including equipment 3(2.3%) Cargo securing manual
071 Fire Safety 8(6.2%) Fire detection and alarm system
081 Alarms 2(1.6%)
091 Working and Living Conditions- Living
Conditions
5(3.9%) Medical equipment/Sanitary
facilities/Accommodation ventilation
092 Working and Living Conditions-
Working Conditions
22(17%) Accident prevention/Gangway Ladder/E.R
Cleanliness
101 Safety of Navigation 9(7%) VDR
111 Life Saving Appliances 5(3.9%) Other life-saving
131 Propulsion and Auxiliary Machinery 14(10.9%) Gauges & Thermometers/Bilge Pumping
arrangements
141 Pollution Prevention: Marpol Annex I 3(2.3%) 15 PPM alarm
144 Pollution Prevention: Marpol Annex IV 6(4.6%) Sewage Treatment Plant
145 Pollution Prevention: Marpol Annex V 4(3.1%)
146 Pollution Prevention: Marpol Annex VI 1(0.77%) Record of Engine Parameters
148 Ballast Water Management 1(0.77%) Ballast Water Record Book
151 ISM 1(0.77%) Shipboard operations
161 ISPS 1(0.77%) Security related defects
Table 5: Deficiencies break up

9
2. Flag State Inspections
Figure 4: FSI Inspections in September 17: Break-up
Fig 5: Trends in detentions
40
9
4
1115
10
5
10
15
20
25
30
35
40
45
Total ChennaiDistrict
Kochi District KolkataDistrict
MumbaiDistrict
KandlaDistrict
Number of Inspections: September 17
0
1 1
2
3 3
4
0
1
00.5
11.5
22.5
33.5
44.5
Monthly detention number trends: Jan-
September 17
0%
4.30% 3%6.20%
12%
30%
11.80%
0%2.50%
0%
5%
10%
15%
20%
25%
30%
35%
Monthly detention percentage trends: Jan-Sept
17

10
Fig 6: Trends in performance parameters: July-September 17
Type of vessel Number of
inspections
Number of
detentions
Deficiency
Ratio
Nil-Deficiency
Ratio
All Vessels 40 1 8.87 0.025
Bulk Carrier 4 0 5.75 0
Container 1 0 7 0
Gas Carrier 2 0 4 0
General
Cargo/Other
Cargo Ship
22 1 11.4 0.045
Off-shore
vessels
1 0 12 0
Oil Tankers 2 0 3.5 0
Passenger
Vessels
1 0 12 0
Tug Boat 7 0 5.1 0
Table 6: Performance of vessels based on ship type
4
01
7.87.3
8.8
0.03 0.080.025
0
1
2
3
4
5
6
7
8
9
10
July August September
Performance trends: July-September 17
Number of detentions Deficiency Ratio Nil-Deficiency Ratio

11
Ship Type
0-5 Years 5-15 Years
No. of
insps.
No. of
detns.
Def.
ratio
Nil
def.
ratio
No. of
insps.
No. of
detns.
Def.
ratio
Nil def
ratio
Bulk Carrier 0 NA NA NA 1 0 4 0
Container 0 NA NA NA 0 NA NA NA
Gas Carrier 0 NA NA NA 0 NA NA NA
General Cargo/Other
Cargo Vessels
3 0 7.7 0 4 0 12.5 0
Off shore service
vessels
0 NA NA NA 1 0 12 0
Oil Tankers NA NA NA NA 1 0 2 0
Passenger Vessels 0 NA NA NA 1 0 12 0
Tug Boats 1 0 6 0 2 0 6.5 0
Ship Type
15-25 Years >25 Years
No. of
insps.
No. of
detns.
Def.
ratio
Nil
def.
ratio
No. of
insps.
No. of
detns.
Def.
ratio
Nil def
ratio
Bulk Carrier 3 0 6.33 0 0 NA NA NA
Container 1 0 7 0 0 NA NA NA
Gas Carrier 1 0 2 0 1 0 6 0
General Cargo/Other
Cargo Vessels
8 0 5.6 0.125 7 1 18.8 0
Off shore service
vessels
0 NA NA NA 0 NA NA NA
Oil Tankers 1 0 5 0 0 NA NA NA
Passenger Vessels 0 NA NA NA 0 NA NA NA
Tug Boats 3 0 3.7 0 1 0 6 0
Table 7: Performance Parameters based upon ship type and age

12
Vessels< 500GT No. of
insps.
No. of
detns.
Def. ratio Nil def. ratio
All Vessels inspected < 500GT 11 0 6 0.09
General Cargo/Other Cargo
Vessels
4 0 6 0.25
Passenger Vessels 1 0 12 0
Tug Boats 6 0 5 0
Table 7: Performance of vessels below 500GT based upon type inspected.
Vessels >= 500GT &< 3000gt No. of
insps.
No. of
detns.
Def. ratio Nil def. ratio
All Vessels inspected
>=500GT &< 3000GT
14 1 13.9 0
General Cargo/Other Cargo
Vessels
13 0 14.5 0
Tug Boats 1 0 6 0
Table 8: Performance of vessels>= 500GT but <3000GT based upon type inspected.
Vessels >= 3000gt No. of
insps.
No. of
detns.
Def. ratio Nil def. ratio
All Vessels inspected >=
3000GT
15 0 6.3 0
Bulk Carrier 4 0 5.75 0
Container 1 0 7 0
Gas Carrier 2 0 4 0
Offshore Service 1 0 12 0
Oil Tanker 2 0 3.5 0
Other Cargo Vessels 4 0 7.4 0
Table 9: Performance of vessels>= 3000GT based upon type inspected.

13
Recognized
Organization/s
Number of
Inspections
Number of
detentions
Deficiency
Ratio
Nil Deficiency
Ratio
All Vessels 40 1 8.87 0.025
BV/IRS 1 1 22 0
IRS/DNV/GL/DNV-
GL(AS)
1 0 6 0
IRS/LR 3 0 5 0
IRS/NK 3 0 6 0
IRS 32 0 9.2 0.031
Table 10: Performance of Recognized Organizations
Name of Company Number of
Inspections
Number of
Detentions
Deficiency
Ratio
Nil-Deficiency
Ratio
All Cargo Logistics 1 0 9 0
Amba Shipping 1 0 5 0
Ambuja Cements Ltd. 1 0 3 0
Fleet Management India
Ltd
2 0 5.5 0
GOL Off-shore 1 1 22 0
Great Offshore(India) Ltd 1 0 12 0
Halani Shipping Pvt. Ltd. 1 0 8 0
Hind Offshore Pvt. Ltd. 2 0 24.5 0
ITT Shipping(Pvt.) Ltd. 3 0 15 0
K Steamship Agencies
Ltd.
1 0 4 0
M.Pallonji Logistics Pvt.
Ltd.
1 0 12 0
Ocean Sparkle 5 0 4.4 0
Mercator Ltd 1 0 10 0
Sanmar Shipping 1 0 5 0
Sea sparkle harbour
services Ltd.
1 0 0 1
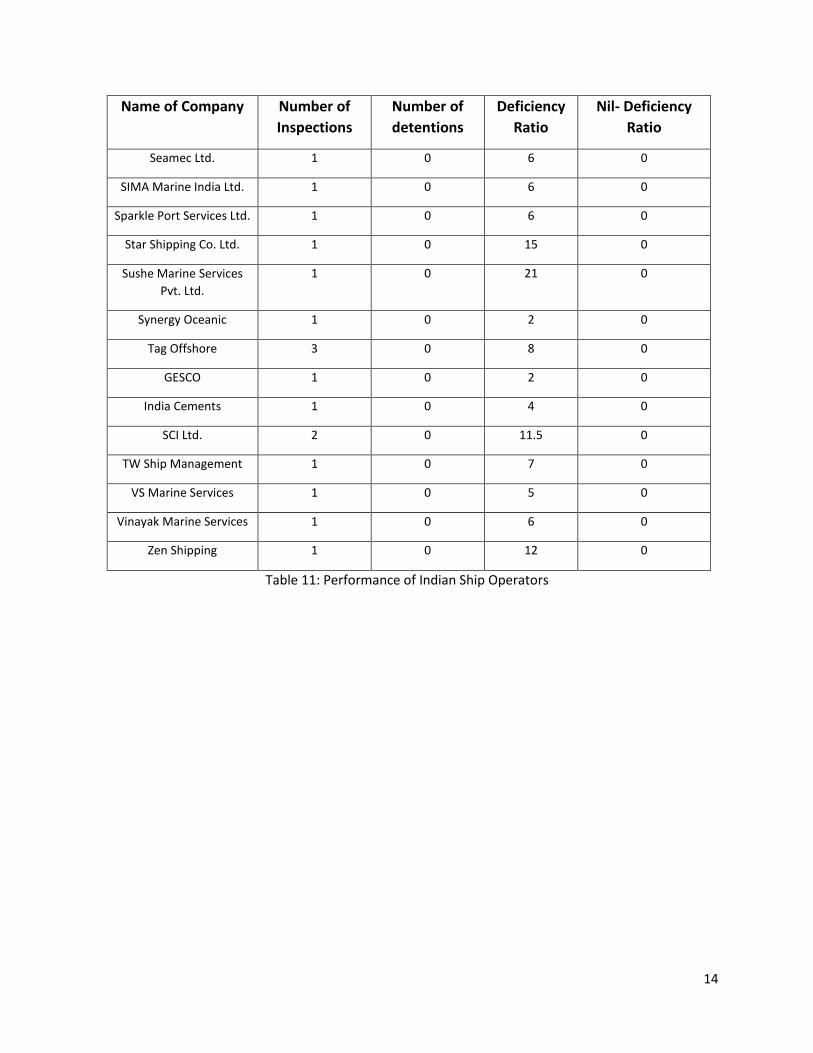
14
Name of Company Number of
Inspections
Number of
detentions
Deficiency
Ratio
Nil- Deficiency
Ratio
Seamec Ltd. 1 0 6 0
SIMA Marine India Ltd. 1 0 6 0
Sparkle Port Services Ltd. 1 0 6 0
Star Shipping Co. Ltd. 1 0 15 0
Sushe Marine Services
Pvt. Ltd.
1 0 21 0
Synergy Oceanic 1 0 2 0
Tag Offshore 3 0 8 0
GESCO 1 0 2 0
India Cements 1 0 4 0
SCI Ltd. 2 0 11.5 0
TW Ship Management 1 0 7 0
VS Marine Services 1 0 5 0
Vinayak Marine Services 1 0 6 0
Zen Shipping 1 0 12 0
Table 11: Performance of Indian Ship Operators

15
Code Type Number (%age
of total)
Typical deficiencies
011 Certificates & Documentation (Ship
Certificates)
20(5.6%)
012 Certificates & Documentation (Crew
Certificates)
1(0.3%)
013 Certificates & Documentation-
Documents
21(5.9%) Rest hour; sign & indications
021 Structural Conditions 26(7.3%) Deck corrosion
031 Water/Weathertight Conditions 21(5.9%) Freeboard openings; Machinery space
openings
041 Emergency Systems 13(3.7%) Emergency batteries and generators
051 Radio Communications 8(2.3%) VHF, Reserve source of energy
061 Cargo Operations including equipment 2(0.6%)
071 Fire Safety 31(8.7%) Fire detection and alarm; Fire pumps and
pipes
081 Alarms 7(2%) Fire alarm
091 Working and Living Conditions- Living
Conditions
23(6.5%) Cleanliness, Lighting, Ventilation of
accommodation
092 Working and Living Conditions-
Working Conditions
63(17.7%) Lighting, cleanliness, electrical
101 Safety of Navigation 26(7.3%) Radar, VDR, Nautical Publications
111 Life Saving Appliances 39(11%) Lifeboats
131 Propulsion and Auxiliary Machinery 13(3.7%) Main Engine
141 Pollution Prevention: Marpol Annex I 6(1.7%)
144 Pollution Prevention: Marpol Annex IV 6(1.7%)
145 Pollution Prevention: Marpol Annex V 11(3.1%)
146 Pollution Prevention: Marpol Annex VI 5(1.4%)
151 ISM 3(0.8%) Company Responsibility; Resources and
Personnel
161 ISPS 3(0.8%)
171 Other Safety in general 7(2%)
Table 12: Break up of deficiencies
16
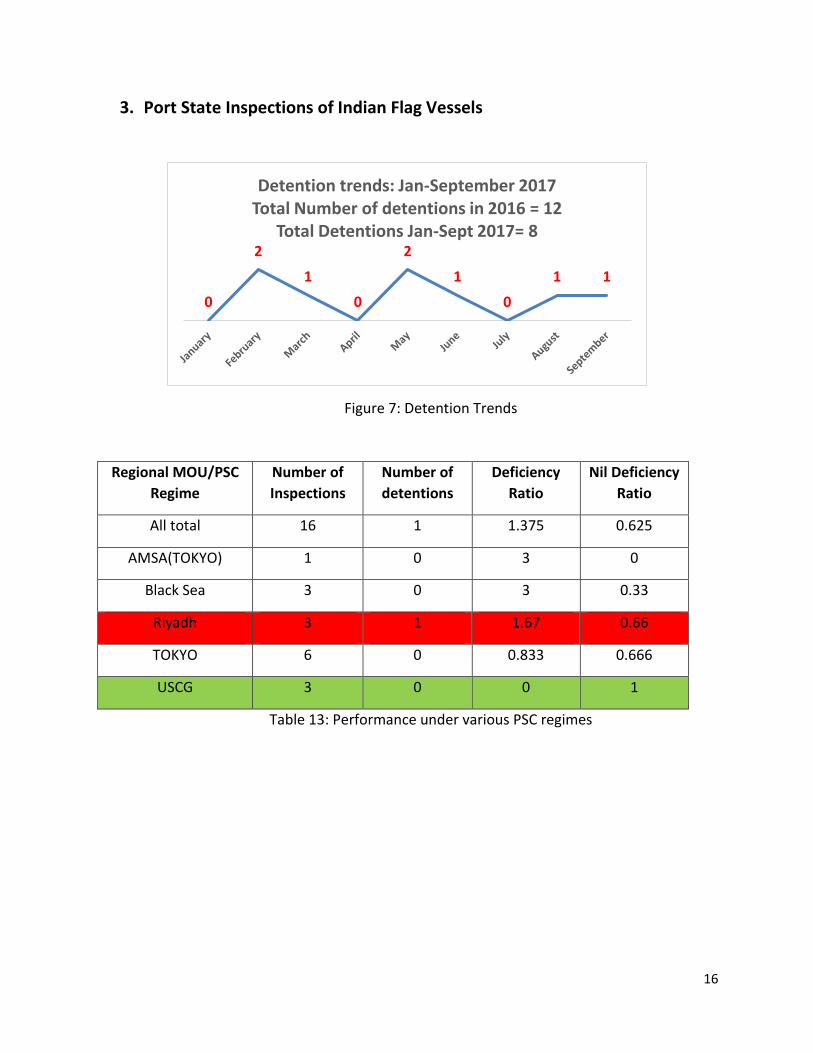
3. Port State Inspections of Indian Flag Vessels
Figure 7: Detention Trends
Regional MOU/PSC
Regime
Number of
Inspections
Number of
detentions
Deficiency
Ratio
Nil Deficiency
Ratio
All total 16 1 1.375 0.625
AMSA(TOKYO) 1 0 3 0
Black Sea 3 0 3 0.33
Riyadh 3 1 1.67 0.66
TOKYO 6 0 0.833 0.666
USCG 3 0 0 1
Table 13: Performance under various PSC regimes
0
2
1
0
2
1
0
1 1
Detention trends: Jan-September 2017Total Number of detentions in 2016 = 12
Total Detentions Jan-Sept 2017= 8
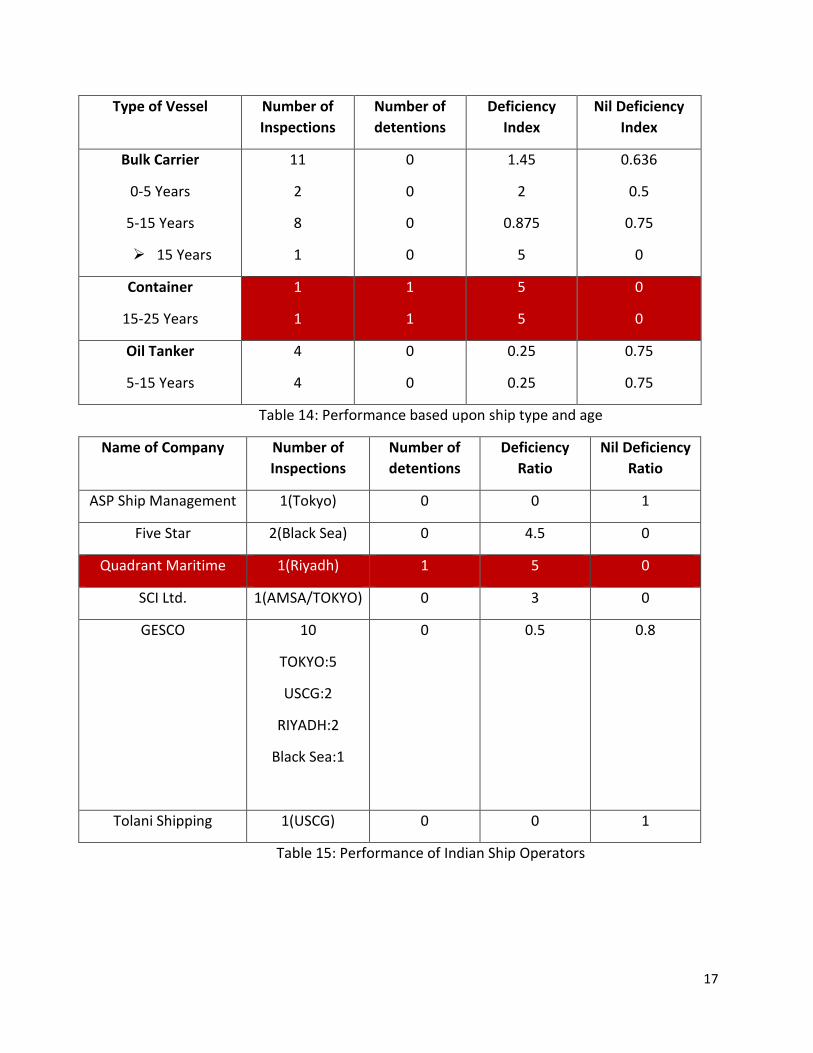
17
Type of Vessel Number of
Inspections
Number of
detentions
Deficiency
Index
Nil Deficiency
Index
Bulk Carrier
0-5 Years
5-15 Years
➢ 15 Years
11
2
8
1
0
0
0
0
1.45
2
0.875
5
0.636
0.5
0.75
0
Container
15-25 Years
1
1
1
1
5
5
0
0
Oil Tanker
5-15 Years
4
4
0
0
0.25
0.25
0.75
0.75
Table 14: Performance based upon ship type and age
Name of Company Number of
Inspections
Number of
detentions
Deficiency
Ratio
Nil Deficiency
Ratio
ASP Ship Management 1(Tokyo) 0 0 1
Five Star 2(Black Sea) 0 4.5 0
Quadrant Maritime 1(Riyadh) 1 5 0
SCI Ltd. 1(AMSA/TOKYO) 0 3 0
GESCO 10
TOKYO:5
USCG:2
RIYADH:2
Black Sea:1
0 0.5 0.8
Tolani Shipping 1(USCG) 0 0 1
Table 15: Performance of Indian Ship Operators

18
Recognized
Organization
Number of
inspections
Number of
detentions
Deficiency
Ratio
Nil Deficiency
Ratio
IRS/ABS 4 0 2.25 0.5
IRS/BV 1 0 3 0
IRS/DNV, GL, DNV-GL(AS) 1 0 0 1
IRS/LR 3 0 1.33 0.66
IRS/NK 6 0 0.166 0.83
IRS 1 1 5 0
Table 16: Performance of Recognized Organizations
Code Type Number (%age
of total)
Typical deficiencies
011 Certificates & Documentation (Ship
Certificates)
2(9.1%) MSMD
012 Certificates & Documentation (Crew
Certificates)
2(9.1%)
13 Certificates &Documentation
(Documentation)
2(9.1%) AIS test report
021 Structural Conditions 1(4.5%) Load lines
041 Emergency Systems 1(4.5%)
061 Cargo Operations including equipment 1(4.5%) CO2 gas detector
071 Fire Safety 3(13.7) Fire safety
101 Safety of Navigation 2(9.1%) Echo sounder, Light, Shapes and
signals
111 Life Saving Appliances 5(22.8%) Operational readiness of life
saving appliances
146 Pollution Prevention: Marpol Annex VI 1(4.5%)
184 2(9.1%) Medical equipment
Table 17: Break up of deficiencies
xxxxxxxxxxxxxxxxxxxxxxxxxxx
Prepared by: Shri Vikrant Rai, Engineer and Ship Surveyor
Approved by: Shri B.R.Sekhar, Chief Surveyor

19
List of Authorized Surveyors September 2017
Sr.No Name of the
PSCO MMD FSI PSC
September , 2017
Authorization FSI PSC
1. Capt S.K.Das DYNA
Chennai Yes Yes NA NA
2. Shri A.K.Choudhury
Chennai Yes Yes 3 2
3. Shri Shirish Kumar
Chennai Yes Yes 2 2
4. Captain Tapesh Ghosh NS
Chennai Not yet
authorised Not yet
authorised NA NA
5. Shri S.S.Murty E&SS
Vizag Yes Yes 0 4
6. Shri Gopikrishna C e&SS
Tuticorin Yes Yes 0 3
7. Shri Ravi Moka SS
Chennai Yes
Not yet authorised
4 NA
8. Shri Sajendra Oraon E&SS
Jamnagar Yes Yes 0 4
9. Captain A.K.Patel
Kandla Yes Yes 1 0
10. Shri Y Jaisinghania SS
Kandla Not yet
authorized Not yet
authorized NA NA
11. Shri. P. C. Majhi, E & SS
Kandla Yes Yes 0 0
12. Shri A.K.Sinha Port Blair Yes
Not yet authorised
5 NA
13. Captain R.Sagar, DYNA
Kolkata Yes
Not yet authorized
0 NA
14. Shri K.M.Rao E&SS
Kolkata Yes
Not yet authorized
2 NA
15. Shri S.K.Das, E&SS
Kolkata Yes Yes 1 2
16. Shri U.Rehman Kolkata Yes Yes 0 1
17. Captain N.Mandal
Paradip Not yet authorized
Not yet authorized
NA NA
18. Shri A.Chaki E&SS
Haldia Yes Yes 0 0
19. Shri R.R.Subbarao E&SS
Paradip Yes
Not yet authorised
3 NA
20. Shri Nishant SS
Kolkata Not yet
authorized
Not yet authorize
d NA NA
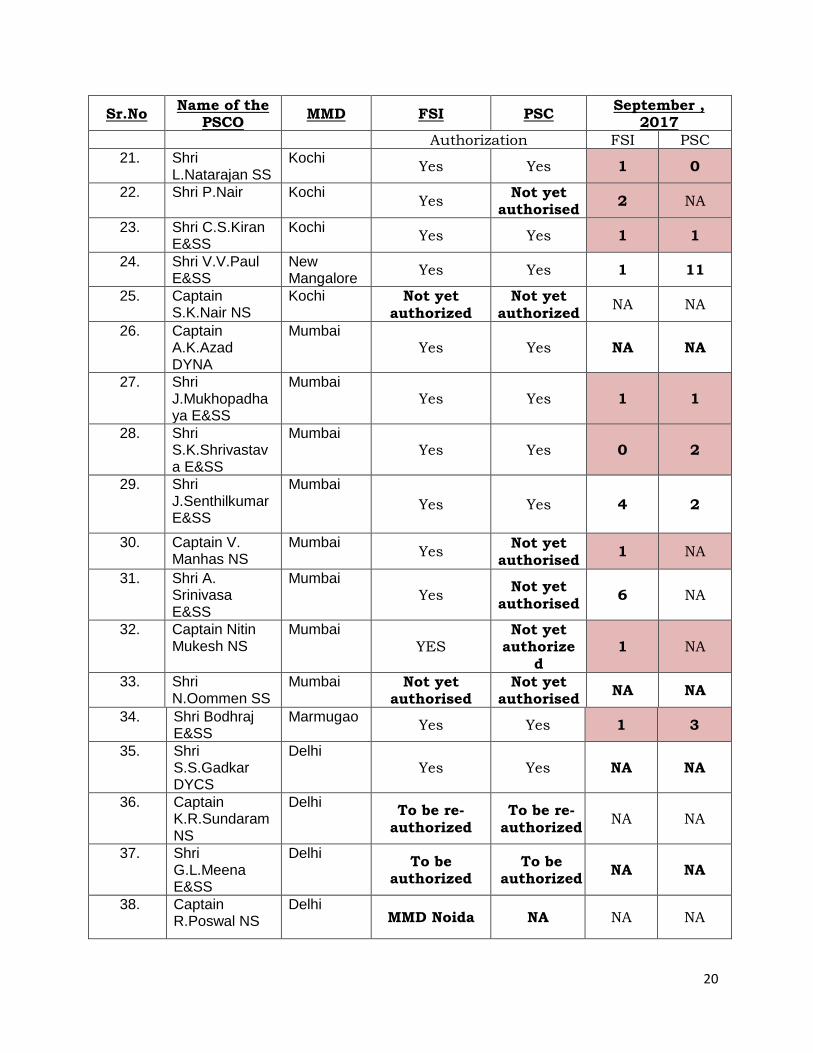
20
Sr.No Name of the
PSCO MMD FSI PSC
September , 2017
Authorization FSI PSC
21. Shri L.Natarajan SS
Kochi Yes Yes 1 0
22. Shri P.Nair Kochi Yes
Not yet authorised
2 NA
23. Shri C.S.Kiran E&SS
Kochi Yes Yes 1 1
24. Shri V.V.Paul E&SS
New Mangalore
Yes Yes 1 11
25. Captain S.K.Nair NS
Kochi Not yet authorized
Not yet authorized
NA NA
26. Captain A.K.Azad DYNA
Mumbai Yes Yes NA NA
27. Shri J.Mukhopadhaya E&SS
Mumbai Yes Yes 1 1
28. Shri S.K.Shrivastava E&SS
Mumbai Yes Yes 0 2
29. Shri J.Senthilkumar E&SS
Mumbai
Yes Yes 4 2
30. Captain V. Manhas NS
Mumbai Yes
Not yet
authorised 1 NA
31. Shri A. Srinivasa E&SS
Mumbai Yes
Not yet authorised
6 NA
32. Captain Nitin Mukesh NS
Mumbai
YES Not yet
authorized
1 NA
33. Shri N.Oommen SS
Mumbai Not yet authorised
Not yet authorised
NA NA
34. Shri Bodhraj E&SS
Marmugao Yes Yes 1 3
35. Shri S.S.Gadkar DYCS
Delhi Yes Yes NA NA
36. Captain K.R.Sundaram NS
Delhi To be re-
authorized To be re-
authorized NA NA
37. Shri G.L.Meena E&SS
Delhi To be
authorized To be
authorized NA NA
38. Captain R.Poswal NS
Delhi MMD Noida NA NA NA

21
Sr.No Name of the
PSCO MMD FSI/PSC
September , 2017
Authorization FSI PSC
39. Captain Jayakumar DYNA
DGS Yes NA NA
40. Captain Muduli DYNA
DGS Yes NA NA
41. Captain Darokar NS
DGS To be re-authorized NA NA
42. Shri A.B.Dutta E&SS
DGS To be re-authorized NA NA
43. Shri S.Kamath E&SS
DGS To be re-authorized NA NA
44. Shri A.Wankhade E&SS
DGS To be re-authorized NA NA
45. Shri Gopinandan E&SS
DGS To be re-authorized NA NA
46. Shri Vikrant Rai E&SS
DGS To be re-authorized NA NA
47. Captain Mohit Behl NS
DGS To be authorized NA NA
48. Captain A.Joseph NS
DGS To be authorized NA NA
49. Captain P.C.Meena NS
DGS To be authorized NA NA
50. Captain D.Joseph NS
DGS To be authorized NA NA
51. Shri S. Pradeep SS
DGS To be authorized NA NA
Total 40 38