Nod2 deficiency protects mice from cholestatic liver...
37
Nod2 deficiency protects mice from cholestatic liver disease by increasing renal excretion of bile acids Lirui Wang, Phillipp Hartmann, Michael Haimerl, Sai P Bathena, Christopher Sjöwall, Sven Almer, Yazen Alnouti, Alan F Hofmann and Bernd Schnabl Linköping University Post Print N.B.: When citing this work, cite the original article. Original Publication: Lirui Wang, Phillipp Hartmann, Michael Haimerl, Sai P Bathena, Christopher Sjöwall, Sven Almer, Yazen Alnouti, Alan F Hofmann and Bernd Schnabl, Nod2 deficiency protects mice from cholestatic liver disease by increasing renal excretion of bile acids, 2014, Journal of Hepatology, (60), 6, 1259-1267. http://dx.doi.org/10.1016/j.jhep.2014.02.012 Copyright: Elsevier http://www.elsevier.com/ Postprint available at: Linköping University Electronic Press http://urn.kb.se/resolve?urn=urn:nbn:se:liu:diva-107236
Transcript of Nod2 deficiency protects mice from cholestatic liver...
Nod2 deficiency protects mice from cholestatic
liver disease by increasing renal excretion of
bile acids
Lirui Wang, Phillipp Hartmann, Michael Haimerl, Sai P Bathena, Christopher Sjöwall, Sven
Almer, Yazen Alnouti, Alan F Hofmann and Bernd Schnabl
Linköping University Post Print
N.B.: When citing this work, cite the original article.
Original Publication:
Lirui Wang, Phillipp Hartmann, Michael Haimerl, Sai P Bathena, Christopher Sjöwall, Sven
Almer, Yazen Alnouti, Alan F Hofmann and Bernd Schnabl, Nod2 deficiency protects mice
from cholestatic liver disease by increasing renal excretion of bile acids, 2014, Journal of
Hepatology, (60), 6, 1259-1267.
http://dx.doi.org/10.1016/j.jhep.2014.02.012
Copyright: Elsevier
http://www.elsevier.com/
Postprint available at: Linköping University Electronic Press
http://urn.kb.se/resolve?urn=urn:nbn:se:liu:diva-107236

1
Nod2 deficiency protects mice from cholestatic liver disease by increasing renal
excretion of bile acids
Lirui Wang1, Phillipp Hartmann1, Michael Haimerl1, Sai P. Bathena2, Christopher Sjöwall3, Sven Almer4,
Yazen Alnouti2, Alan F. Hofmann1, and Bernd Schnabl1
1Department of Medicine, University of California San Diego, La Jolla, CA,
2Department of Pharmaceutical Sciences, University of Nebraska Medical Center, Omaha, NE,
3Rheumatology/AIR, Department of Clinical and Experimental Medicine, Linköping University, Sweden,
4Karolinska Institute, Division of Gastroenterology and Karolinska University Hospital, GastroCentrum,
Stockholm, Sweden
Correspondence to: Bernd Schnabl, M.D., Department of Medicine, University of California San Diego,
MC0702, 9500 Gilman Drive, La Jolla, CA 92093, Phone 858-822-5311, Fax 858-822-5370, Email
Word count: 4963
4 figures
Abbreviations: NASH, non-alcoholic steatohepatitis; Nod, nucleotide oligomerization domain; MDP,
muramyl dipeptide; IL, interleukin; BDL, bile duct ligation; ALT, alanine aminotransferase; ALP, alkaline
phosphatase; TNF, tumor necrosis factor; LPS, lipopolysaccharide; CCl4, carbon tetrachloride; GDCA,
glycodeoxycholic acid; PI, propidium iodide; LDH, lactate dehydrogenase; MCA, muricholic acid; NTCP,
Na-taurocholate cotransporting polypeptide; Slc, solute carrier family; OATP, organic anion transporting
polypeptide; Slco, solute carrier organic anion transporter family; MRP, multidrug resistance-associated

2
protein; Abc, ATP-binding cassette; OST, organic solute transporter; BSEP, bile salt export pump; MDR,
multidrug resistance protein; CYP, Cytochrome P450; ASBT, sodium-dependent bile salt transporter
None of the authors has a financial, personal or professional conflict of interest to disclose.
Financial support: This study was supported in part by NIH grants K08 DK081830, U01 AA021856 and
R01 AA020703, and by ABMRF/The Foundation for Alcohol Research (all to BS).

3
Abstract
Background & aims: Chronic liver disease is characterized by fibrosis that may progress to cirrhosis.
Nucleotide oligomerization domain 2 (Nod2), a member of the Nod-like receptor (NLR) family of
intracellular immune receptors, plays an important role in the defense against bacterial infection through
binding to the ligand muramyl dipeptide (MDP). Here, we investigated the role of Nod2 in the
development of liver fibrosis.
Methods: We studied experimental cholestatic liver disease induced by bile duct ligation or toxic liver
disease induced by carbon tetrachloride in wild type and Nod2-/- mice.
Results: Nod2 deficiency protected mice from cholestatic but not toxin-induced liver injury and fibrosis.
Most notably, the hepatic bile acid concentration was lower in Nod2-/- mice than wild type mice following
bile duct ligation for 3 weeks. In contrast to wild type mice, Nod2-/- mice had increased urinary excretion
of bile acids, including sulfated bile acids, and an upregulation of the bile acid efflux transporters MRP2
and MRP4 in tubular epithelial cells of the kidney. MRP2 and MRP4 were downregulated by IL-1 in a
Nod2 dependent fashion.
Conclusions: Our findings indicate that Nod2 deficiency protects mice from cholestatic liver injury and
fibrosis through enhancing renal excretion of bile acids that in turn contributes to decreased
concentration of bile acids in the hepatocyte.
Word count: 211
Keywords: Chronic liver disease, bile acids transporter, IL-1, renal tubular epithelial cells, bacterial
translocation, microbiome

4
Introduction
Liver fibrosis results from chronic liver injury commonly caused by cholestasis, toxins, alcohol
abuse, viral infections or non-alcoholic steatohepatitis (NASH). Hepatic fibrosis can progress to cirrhosis,
which is associated with a significant morbidity and mortality. Effective anti-fibrotic therapies are still
lacking. Therefore, elucidating the molecular mechanisms initiating and driving liver fibrosis is crucial for
the development of anti-fibrotic strategies that should prevent this fatal disease [1-3].
Nucleotide oligomerization domain 2 (Nod2) belongs to the Nod-like receptor (NLR) family which
consists of intracellular innate immune receptors for bacterial peptidoglycans. These immune receptors
play a crucial role in the host response to bacterial infection [4, 5]. Muramyl dipeptide (MDP), the
minimal motif of peptidoglycan from both Gram-positive and Gram-negative bacteria, was identified as
the ligand of Nod2 [6]. MDP recognition by Nod2 activates transcription factor NF-B and induce
pro-inflammatory cytokine production by interacting with the RIP-like interacting CLARP kinase
(RICK/RIP2) [7]. MDP stimulation also activates Nod2 to process and release mature interleukin (IL)-1
in a caspase-1-dependent fashion [8, 9]. Genetic studies in humans have linked mutations in the Nod2
gene to higher susceptibility to Crohn’s disease in a subset of patients [10]. Additionally, Nod2 plays an
important role in intestinal microbial homeostasis [11], intestinal immunity [12] and gut barrier function
[13, 14].
The role of Nod2 in liver fibrosis is not known. Using wild type and Nod2 deficient mice, the
function of Nod2 in experimental cholestasis- or toxin-induced liver fibrosis was investigated.
5
Materials and Methods
Material and Methods are described in the Supplementary Data section.
Results
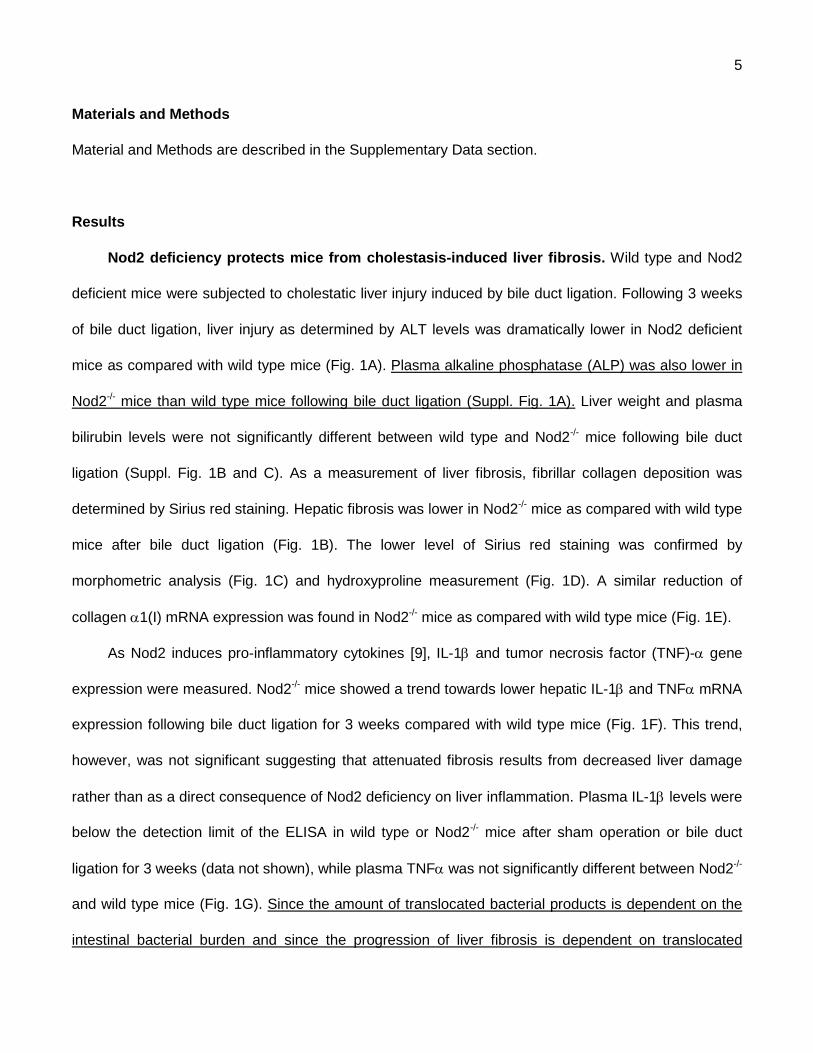
Nod2 deficiency protects mice from cholestasis-induced liver fibrosis. Wild type and Nod2
deficient mice were subjected to cholestatic liver injury induced by bile duct ligation. Following 3 weeks
of bile duct ligation, liver injury as determined by ALT levels was dramatically lower in Nod2 deficient
mice as compared with wild type mice (Fig. 1A). Plasma alkaline phosphatase (ALP) was also lower in
Nod2-/- mice than wild type mice following bile duct ligation (Suppl. Fig. 1A). Liver weight and plasma
bilirubin levels were not significantly different between wild type and Nod2-/- mice following bile duct
ligation (Suppl. Fig. 1B and C). As a measurement of liver fibrosis, fibrillar collagen deposition was
determined by Sirius red staining. Hepatic fibrosis was lower in Nod2-/- mice as compared with wild type
mice after bile duct ligation (Fig. 1B). The lower level of Sirius red staining was confirmed by
morphometric analysis (Fig. 1C) and hydroxyproline measurement (Fig. 1D). A similar reduction of
collagen 1(I) mRNA expression was found in Nod2-/- mice as compared with wild type mice (Fig. 1E).
As Nod2 induces pro-inflammatory cytokines [9], IL-1 and tumor necrosis factor (TNF)- gene
expression were measured. Nod2-/- mice showed a trend towards lower hepatic IL-1 and TNF mRNA
expression following bile duct ligation for 3 weeks compared with wild type mice (Fig. 1F). This trend,
however, was not significant suggesting that attenuated fibrosis results from decreased liver damage
rather than as a direct consequence of Nod2 deficiency on liver inflammation. Plasma IL-1 levels were
below the detection limit of the ELISA in wild type or Nod2-/- mice after sham operation or bile duct
ligation for 3 weeks (data not shown), while plasma TNF was not significantly different between Nod2-/-
and wild type mice (Fig. 1G). Since the amount of translocated bacterial products is dependent on the
intestinal bacterial burden and since the progression of liver fibrosis is dependent on translocated

6
bacterial products [15], bacterial overgrowth and translocation of microbial products from the gut lumen
to the systemic circulation was investigated. There was no significant difference in bacterial overgrowth
between wild type and Nod2-/- mice after bile duct ligation (data not shown). Plasma LPS levels were
also not significantly different between wild type and Nod2-/- mice following bile duct ligation for 3 weeks
(Fig. 1G). Taken together, Nod2 deficient mice are protected from bile duct ligation-induced liver injury
and fibrosis which is not explained by a stabilized intestinal mucosal barrier.
Nod2 deficient mice are not protected from toxin-induced liver injury and fibrosis. To
determine whether Nod2 deficiency suppresses hepatic fibrosis induced by a different etiology, toxic
liver injury was induced by repeated intraperitoneal injections of carbon tetrachloride (CCl4). In contrast
to cholestatic liver injury, carbon tetrachloride-induced liver injury was not different in Nod2-/- mice
compared with wild type mice as evidenced by plasma ALT levels (Suppl. Fig. 2A). Similarly, hepatic
collagen deposition (Suppl. Fig. 2B and C) and collagen 1 (I) mRNA expression (Suppl. Fig. 2D)
showed no significant difference between wild type and Nod2-/- mice following carbon tetrachloride
injections. Wild type and Nod2-/- mice subjected to carbon tetrachloride injections showed similar hepatic
levels of the inflammatory cytokines IL-1 and TNF as compared with wild type mice (Suppl. Fig. 2D).
These and the preceding results indicate that Nod2 deficiency protects from cholestatic, but not
toxin-induced liver fibrosis in mice.
Bile acid-induced hepatocyte death is uninfluenced by Nod2. The mode of hepatocyte death
is one of the major differences between the cholestatic and toxic model of chronic liver disease.
Following cholestasis, an accumulation of bile acids in hepatocytes contributes to cell death and is one
of the major pathogenic factors resulting in chronic liver damage and fibrosis. In contrast, carbon
tetrachloride is metabolized in hepatocytes to free radicals via the cytochrome p450 enzyme CYP2E1

7
causing immediate lipid peroxidation and hepatocyte death [16]. To explain the different hepatic
phenotype between cholestatic and toxin-induced liver fibrosis in Nod2 deficient mice, we initially
investigated whether Nod2 deficiency affects bile acid-induced hepatocyte death. Primary hepatocytes
were isolated, treated with MDP control or MDP to stimulate Nod2, and hepatocyte death was induced
with glycodeoxycholic acid (GDCA) [17]. Glycodeoxycholic acid induced significant death in cultured wild
type and Nod2-/- hepatocytes uninfluenced by the presence of MDP as assessed by propidium iodide (PI)
staining (Suppl. Fig. 3A). Quantification of glycodeoxycholic acid-induced cytotoxicity showed
non-significant differences between wild type and Nod2 deficient hepatocytes, as evidenced by similar
levels of ALT in the supernatant and cell death assessed by lactate dehydrogenase release (LDH)
(Suppl. Fig. 3B and C). These results demonstrate that the hepatoprotection is not mediated via Nod2 in
hepatocytes during cholestasis.
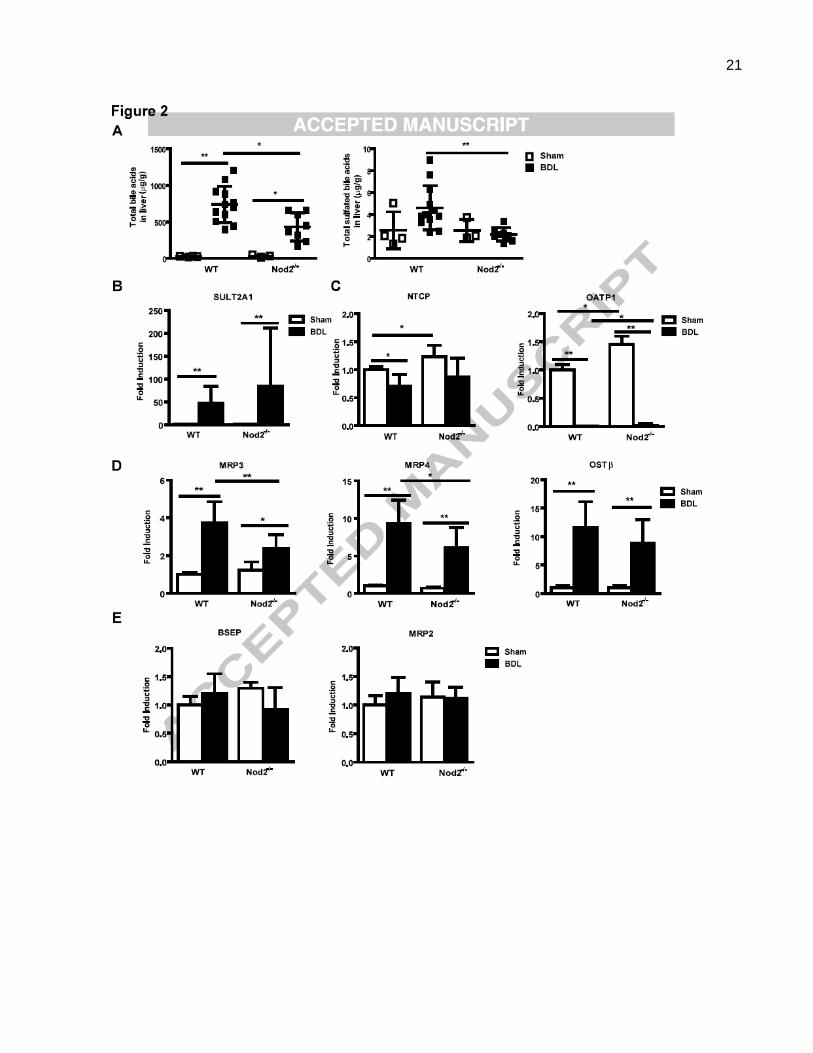
Hepatic bile acid concentration is lower in Nod2 deficient mice following bile duct ligation.
We then focused on bile acid levels and composition as a decreased bile acid pool or change in bile acid
composition can modulate hepatoxicity and fibrosis under cholestatic conditions [18, 19]. As expected
total liver bile acids were elevated after 3 weeks of bile duct ligation, but hepatic levels were significantly
lower in Nod2 deficient mice as compared with wild type mice (Fig. 2A). Additional hydroxylation and
sulfation, as well as upregulation of alternative bile acid transporters serve to decrease bile acid-induced
injury in cholestatic hepatocytes [20, 21]. Taurine amidated muricholic acid (T-MCA) was the major bile
acid accumulating in cholestatic liver. T-MCA was significantly lower in bile duct ligated Nod2 deficient
compared with wild type mice (Suppl. Table 1). Total sulfated bile acids were higher in the liver of wild
type as compared with Nod2 deficient mice following bile duct ligation for 3 weeks (Fig. 2A). Hepatic
gene expression of sulfotransferase (SULT) 2A1, which mediates sulfation of bile acids [20], was
induced after bile duct ligation, but was not significantly different between the two groups (Fig. 2B). Thus,

8
the major difference between the Nod2-/- mice and the wild type mice after bile duct ligation was a
considerably decreased concentration of bile acids in the liver, providing a possible explanation for the
protection of Nod2-/- mice from cholestasis-induced liver injury and disease.
The concentration of bile acids in the hepatocyte is determined by the balance between uptake
mediated by basolateral (sinusoidal) transporters and efflux from the hepatocyte mediated by both
canalicular and apical transporters in animals with an intact enterohepatic circulation. In the bile duct
ligated animal, the only sources of bile acids are absorption of those bile acids present in the intestine at
the time of duct ligation, and those generated by continuing bile acid synthesis. We therefore assessed
expression of genes involved in hepatocyte bile acid transport and synthesis [22, 23]. Gene expression
of Na-taurocholate cotransporting polypeptide (NTCP; also called solute carrier family 10, member 1 or
Slc10a1), the major basolateral bile acid uptake transporter, and organic anion transporting polypeptide
(OATP; also called solute carrier organic anion transporter family, member 1a1 or Slco1a1) 1, one of the
basolateral (sodium-independent) organic anion transporters was examined. Although NTCP mRNA
was not differently expressed in wild type or Nod2-/- mice following bile duct ligation, cholestasis-induced
inhibition of OATP1 gene expression was lower in Nod2-/- as compared with wild type mice (Fig. 2C). A
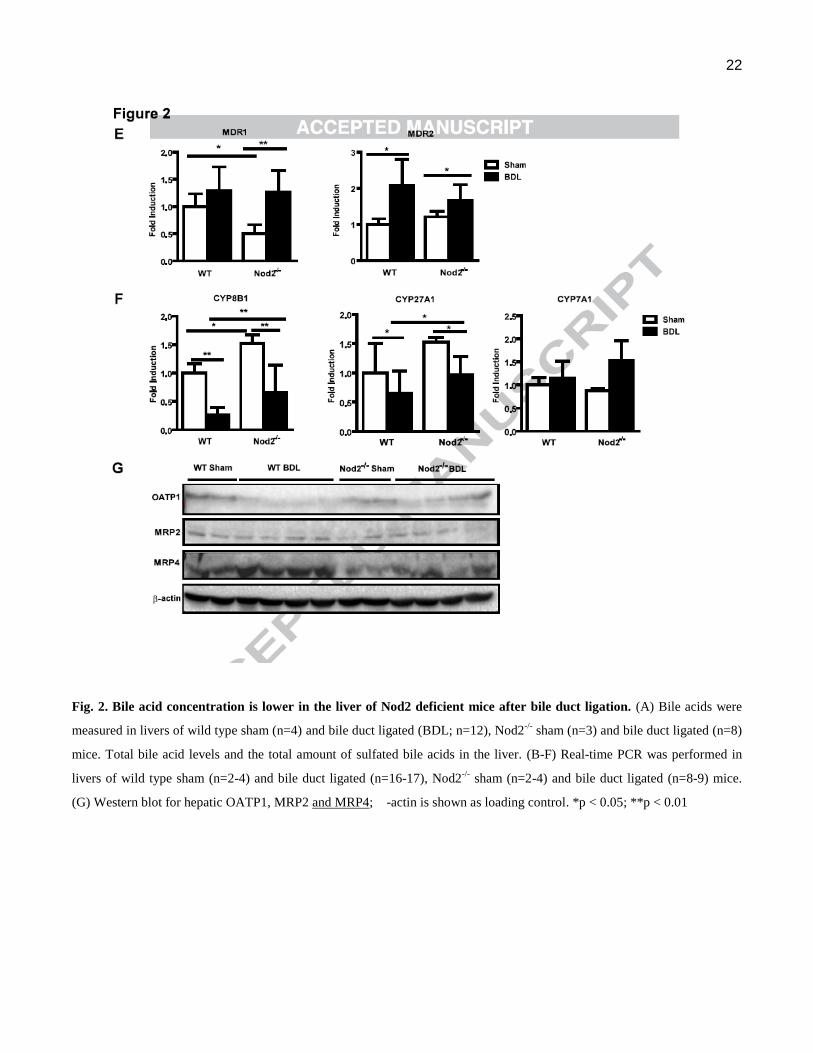
similar trend was observed on the protein expression level for OATP1 (Fig. 2G). Bile duct
ligation-induced mRNA levels of basolateral bile acid export transporters multidrug
resistance-associated protein (MRP; also called ATP-binding cassette, sub-family C, member 3 or
Abcc3) 3 and MRP4 (Abcc4) were lower in Nod2 deficient mice as compared with wild type mice (Fig.
2D). A similar trend was observed on the protein expression level for MRP4 (Fig. 2G). The bidirectional
transporter organic solute transporter alpha (OST; also called solute carrier family 51, beta subunit or
Slc51b) β mRNA was similar in wild type and Nod2 deficient mice 3 weeks after bile duct ligation (Fig.
2D). Gene expression of canalicular export pumps including the bile salt export pump (BSEP; also called
ATP-binding cassette, sub-family B member 11 or Abcb11), MRP2 (Abcc2), multidrug resistance protein

9
(MDR; also called ATP-binding cassette, sub-family B, member 1B or Abcb1b)1 and MDR2 (Abcb4)
showed no significant difference between wild type and Nod2-/- mice in cholestasis (Fig. 2E). Hepatic
MRP2 protein was similarly expressed among the two groups (Fig. 2G).
The rate limiting enzyme in the major pathway of bile acid synthesis, gene CYP7A1 (mediating
cholesterol 7α-hydroxylation) showed no significant difference between cholestatic groups (Fig. 2F).
Cholestasis-induced suppression of hepatic CYP8B1 (mediating sterol 12-hydroxylation) and CYP27A1
(mediating the initial step in side chain oxidation of cholesterol) mRNA, resulted in these key enzymes
for bile acid synthesis being significantly lower in Nod2-/- as compared with wild type counterparts (Fig.
2F). Taken together, Nod2 deficient mice showed a marked decrease in total liver bile acid
concentration, despite relatively small differences in the level of mRNA for bile acid synthesis enzymes
and hepatocyte bile acid transporters. These changes in expression may be an adaptive and secondary
response to a lower total amount of hepatic bile acids in cholestatic Nod2-/- mice. Presumably, the
animals are in steady state with newly synthesized bile acids passing into and out of the hepatocyte at
the basolateral domains. In addition, there is likely to be continued secretion into the canaliculus
followed by an equal amount of ductular reabsorption.
To further delineate the mechanism resulting in a decreased liver bile acid concentration in Nod2
deficient mice following bile duct ligation, bile acid profiles were measured in plasma, feces and urine.
Total plasma bile acids were remarkably elevated after bile duct ligation for 3 weeks, but no significant
difference was observed between wild type and Nod2-/- mice (Fig. 3A). The composition of bile acids and
hence the toxicity profile was similar in cholestatic wild type and Nod2-/- mice (Suppl. Table 2). Total bile
acids in feces were reduced to negligible values after bile duct ligation, but no difference in total amount
or extent of sulfation or amidation was observed between wild type and Nod2-/- mice during cholestasis
(Fig. 3B; Suppl. Table 3).

10
FXR is a major regulator of liver injury in cholestasis, and selective intestinal activation of FXR
protects the liver from cholestasis in mice [24]. Therefore, FXR and its target gene Fibroblast growth
factor (FGF) 15 were determined in the terminal ileum. FXR and FGF15 mRNA expression was similar
in wild type and Nod2 deficient mice following bile duct ligation for 3 weeks (Suppl. Fig. 4A and B).
Urinary elimination of bile acids is increased in Nod2 deficient mice following bile duct
ligation. Renal excretion is the major route for bile acid elimination during cholestasis [25]. Following
bile duct ligation, urinary elimination should eventually become equal to bile acid synthesis. Total bile
acids in urine were markedly increased by bile duct ligation (Fig. 3C). A major finding was that urinary
bile acid levels were significantly higher in Nod2-/- as compared with wild type mice (Fig. 3C). There was
no obvious difference in urine volume between wild type and Nod2-/- mice following bile duct ligation
(data not shown). In addition, the total amount of sulfated bile acids was increased in the urine of Nod2-/-
as compared with wild type mice after bile duct ligation (Fig. 3C; Suppl. Table 4). Renal gene expression
of SULT2A1 was significantly higher in Nod2-/- mice following bile duct ligation (Fig. 3D). Thus, increased
elimination of bile acids via the kidney with steady state plasma levels appears to offer an explanation
for the lower bile acid concentration in the liver of Nod2 deficient mice.
To determine the underlying mechanism for increased renal elimination of bile acids in Nod2-/- mice,
gene expression of bile acid transporters in the kidney was examined. Two important renal apical bile
acid efflux transporters are MRP2 (mediating sulfated and some unsulfated bile acid transport) [23] and
MRP4 (mediating co-transport of bile acids and glutathione). MRP2 mRNA was suppressed in wild type
mice, but induced in Nod2-/- mice after bile duct ligation. The level of MRP2 was significantly higher in
Nod2 deficient as compared with wild type mice after 3 weeks of bile duct ligation (Fig. 3E). This was
confirmed on the protein level (Fig. 3F). Bile duct ligated Nod2 deficient mice had significantly higher
MRP4 gene expression in the kidney compared with wild type mice (Fig. 3G). In contrast, the apical bile

11
acid uptake transporter sodium-dependent bile salt transporter (ASBT; also called Slc10a2) was
detected at a similar level in the two cholestatic groups (Fig. 3G). No differences in the expression of the
basolateral efflux transporter MRP3 (mediating bile acid glucuronide transport) and the basolateral
bi-directional bile acid transporters OST and OSTwere detected in wild type and Nod2-/- mice
following bile duct ligation (Fig. 3H). FXR gene expression in the kidney was similar in wild type and
Nod2 deficient mice following bile duct ligation for 3 weeks (Suppl. Fig. 4C). These results suggest that a
higher expression of the bile acid secreting transporters MRP2 and MRP4 accounts for the increased
excretion of bile acids into urine of Nod2 deficient mice. Increased renal sulfation of bile acids might
additionally contribute to the process of higher urinary elimination of sulfated bile acids.
Nod2-dependent IL-1 production suppresses bile acid export transporters in renal tubular
epithelial cells. Since Nod2 is an important regulator of inflammation, cytokine expression was
examined in the kidney. The mRNA expression of IL-1 was significantly lower in sham operated and
bile duct ligated Nod2-/- mice as compared with wild type mice, but there was no difference in TNF and
IL-6 gene expression in wild type or Nod2-/- mice following sham operation or bile duct ligation (Fig. 4A).
Immunofluorescence confirmed decreased expression of IL-1 protein in the kidney of Nod2-/- mice
following bile duct ligation (Fig. 4B and C). Immunofluorescence double staining with IL-1 and F4/80 as
macrophage markers, showed no double positive cells suggesting that macrophages are not the primary
source for IL-1 in the kidney (Fig. 4B). Indeed, tubular epithelial cells showed a strong staining for IL-1
(Fig. 4D). We therefore assessed the effect of IL-1 on MRP2/3/4 mRNA expression in HK2 cells, a
proximal tubular epithelial cell line from normal human kidney. Consistent with in vivo results, IL-1
treatment resulted in a marked reduction of MRP2 and MRP4 mRNA expression, while MRP3
expression was not affected by IL-1 (Fig. 4E). To further substantiate our data, IL-1 was administered
to wild type mice and renal transporters were assessed. IL-1 inhibited gene expression of MRP2 and
12
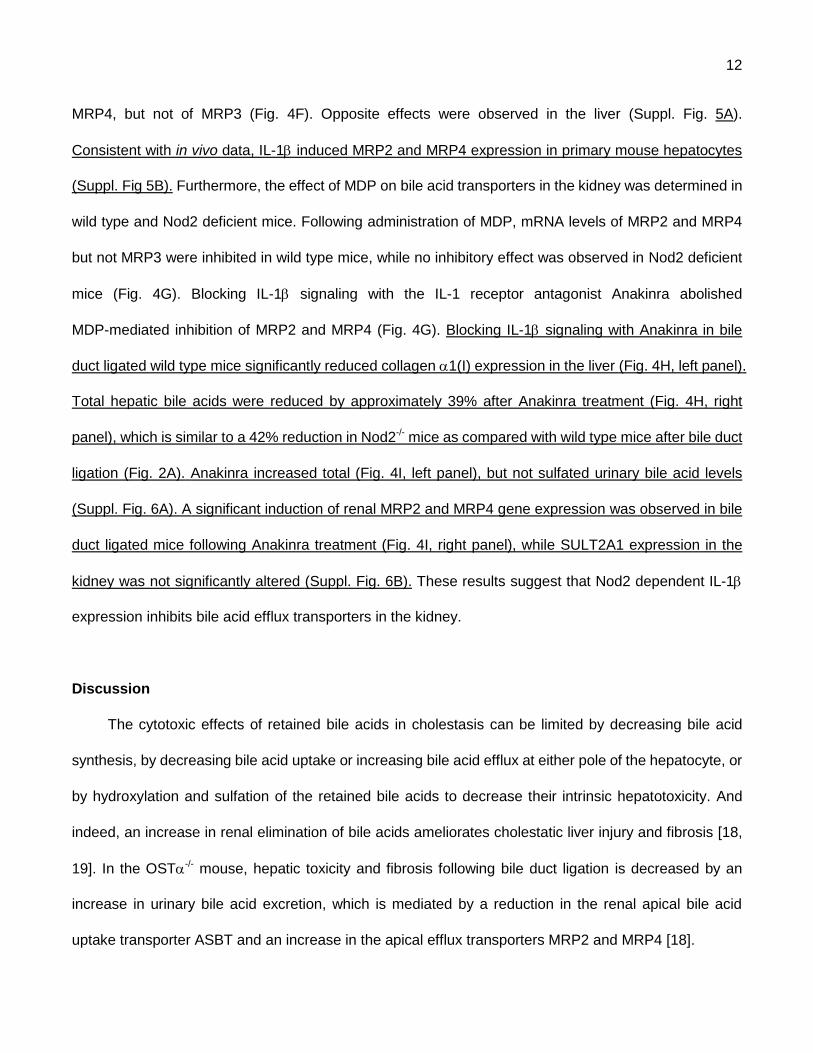
MRP4, but not of MRP3 (Fig. 4F). Opposite effects were observed in the liver (Suppl. Fig. 5A).
Consistent with in vivo data, IL-1 induced MRP2 and MRP4 expression in primary mouse hepatocytes
(Suppl. Fig 5B). Furthermore, the effect of MDP on bile acid transporters in the kidney was determined in
wild type and Nod2 deficient mice. Following administration of MDP, mRNA levels of MRP2 and MRP4
but not MRP3 were inhibited in wild type mice, while no inhibitory effect was observed in Nod2 deficient
mice (Fig. 4G). Blocking IL-1 signaling with the IL-1 receptor antagonist Anakinra abolished
MDP-mediated inhibition of MRP2 and MRP4 (Fig. 4G). Blocking IL-1 signaling with Anakinra in bile
duct ligated wild type mice significantly reduced collagen 1(I) expression in the liver (Fig. 4H, left panel).
Total hepatic bile acids were reduced by approximately 39% after Anakinra treatment (Fig. 4H, right
panel), which is similar to a 42% reduction in Nod2-/- mice as compared with wild type mice after bile duct
ligation (Fig. 2A). Anakinra increased total (Fig. 4I, left panel), but not sulfated urinary bile acid levels
(Suppl. Fig. 6A). A significant induction of renal MRP2 and MRP4 gene expression was observed in bile
duct ligated mice following Anakinra treatment (Fig. 4I, right panel), while SULT2A1 expression in the
kidney was not significantly altered (Suppl. Fig. 6B). These results suggest that Nod2 dependent IL-1
expression inhibits bile acid efflux transporters in the kidney.
Discussion
The cytotoxic effects of retained bile acids in cholestasis can be limited by decreasing bile acid
synthesis, by decreasing bile acid uptake or increasing bile acid efflux at either pole of the hepatocyte, or
by hydroxylation and sulfation of the retained bile acids to decrease their intrinsic hepatotoxicity. And
indeed, an increase in renal elimination of bile acids ameliorates cholestatic liver injury and fibrosis [18,
19]. In the OST-/- mouse, hepatic toxicity and fibrosis following bile duct ligation is decreased by an
increase in urinary bile acid excretion, which is mediated by a reduction in the renal apical bile acid
uptake transporter ASBT and an increase in the apical efflux transporters MRP2 and MRP4 [18].
13
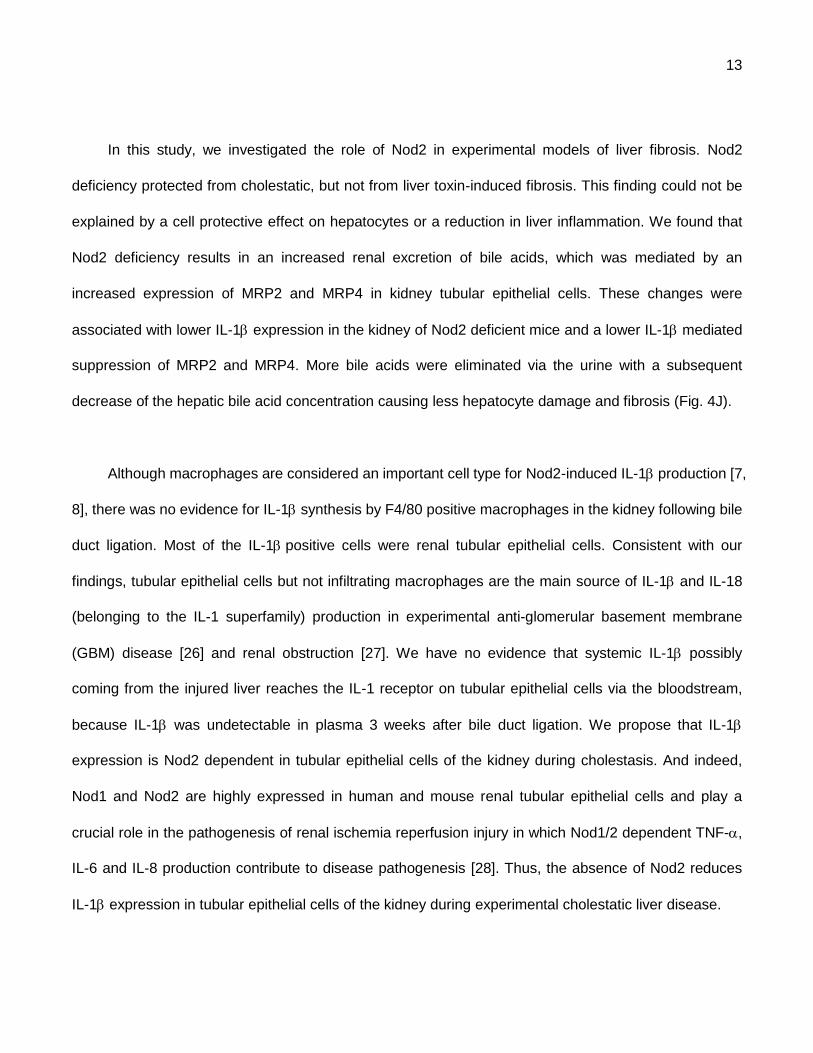
In this study, we investigated the role of Nod2 in experimental models of liver fibrosis. Nod2
deficiency protected from cholestatic, but not from liver toxin-induced fibrosis. This finding could not be
explained by a cell protective effect on hepatocytes or a reduction in liver inflammation. We found that
Nod2 deficiency results in an increased renal excretion of bile acids, which was mediated by an
increased expression of MRP2 and MRP4 in kidney tubular epithelial cells. These changes were
associated with lower IL-1 expression in the kidney of Nod2 deficient mice and a lower IL-1 mediated
suppression of MRP2 and MRP4. More bile acids were eliminated via the urine with a subsequent
decrease of the hepatic bile acid concentration causing less hepatocyte damage and fibrosis (Fig. 4J).
Although macrophages are considered an important cell type for Nod2-induced IL-1production [7,
8], there was no evidence for IL-1 synthesis by F4/80 positive macrophages in the kidney following bile
duct ligation. Most of the IL-1positive cells were renal tubular epithelial cells. Consistent with our
findings, tubular epithelial cells but not infiltrating macrophages are the main source of IL-1 and IL-18
(belonging to the IL-1 superfamily) production in experimental anti-glomerular basement membrane
(GBM) disease [26] and renal obstruction [27]. We have no evidence that systemic IL-1 possibly
coming from the injured liver reaches the IL-1 receptor on tubular epithelial cells via the bloodstream,
because IL-1 was undetectable in plasma 3 weeks after bile duct ligation. We propose that IL-1
expression is Nod2 dependent in tubular epithelial cells of the kidney during cholestasis. And indeed,
Nod1 and Nod2 are highly expressed in human and mouse renal tubular epithelial cells and play a
crucial role in the pathogenesis of renal ischemia reperfusion injury in which Nod1/2 dependent TNF-,
IL-6 and IL-8 production contribute to disease pathogenesis [28]. Thus, the absence of Nod2 reduces
IL-1 expression in tubular epithelial cells of the kidney during experimental cholestatic liver disease.

14
Hepatic and intestinal MRP2 expression was down-regulated in obstructive cholestasis of rats
which was associated with IL-1 upregulation [29, 30]. These studies only revealed an association but
not a causative relation between IL-1 and MRP2 expression. IL-1 treatment decreased MRP2
expression in rat and human hepatocytes [31]. In contrast with these studies, MRP2 expression
increased following IL-1 injection in wild type mice or following IL-1 treatment of primary mouse
hepatocytes. Thus, species differences might account for these obvious different results. Bile duct
ligation did not increase hepatic MRP2 expression in our study suggesting that other factors than IL-1
contribute to gene regulation during cholestasis. On the other hand, hepatic MRP4 expression increased
after IL-1 injection and following bile duct ligation in wild type mice. Similarly, IL-1 induced MRP4 in
primary mouse hepatocytes.
MRP2 and 4 expression in the kidney in response to IL-1 has not been investigated. In this study,
renal MRP2 and MRP4 expression were higher in bile duct ligated Nod2 deficient mice, which, in turn,
was associated with decreased IL-1levels in the kidney. Using in vivo experiments, Nod2 stimulation
induced IL-1, which in turn reduced the expression of MRP2 and MRP4 in an autocrine fashion. In
health, the renal tubule absorbs filtered bile acids, whereas in cholestasis, the polarity of the proximal
renal tubular cell is completely reversed, with the renal tubules secreting rather than absorbing bile acids.
The renal apical transporter MRP2 mediates the efflux of sulfated bile acids [23]. And indeed, the total
amount of sulfated bile acids was higher in the urine of Nod2 deficient mice as compared with wild type
mice following 3 weeks of bile duct ligation. Although sulfated bile acids were detected in our study as
opposed to others using one week of bile duct ligation [21], sulfation might be a time-dependent slow
adaptation to cholestasis in the mouse. Thus, we propose a concept in which Nod2-dependent IL-1
production suppresses the bile acid efflux transporters MRP2 and MRP4 in tubular epithelial cells during
cholestasis. More bile acids are excreted via the urine during cholestasis, which eventually limits
15
cholestatic liver disease. However, at baseline other mediators than IL-1 might be important for the
regulation of renal MRP2 and MRP4, because their expression in sham operated Nod2 deficient mice
was not different compared with sham operated wild type mice despite lower renal levels of IL-1.
Our study demonstrates that deficiency of Nod2 protects from cholestatic liver injury and fibrosis.
Our findings imply that Nod2-mediated inflammation plays an important role in the regulation of bile acid
transporters in the kidney and this regulation decreases the hepatic bile acid concentration in the bile
duct ligated mouse. This in turn significantly affects hepatocyte death and liver fibrosis. There are
currently no data available about the clinical course of patients with primary sclerosing cholangitis (PSC)
carrying a NOD2/CARD15 mutation. It will be of great interest to specifically determine the NOD2
haplotype in patients with PSC, determine bile acid metabolism and compare their clinical course in
future studies. Taken together, our study confirms and extends the concept of greatly enhanced renal
elimination of bile acids as a major renal adaptation during cholestasis. Treatments (e.g. through IL-1R
antagonism) that enhance renal elimination of bile acids should, in principle, be beneficial in cholestatic
liver disease.
Acknowledgements
We thank David A. Brenner for helpful discussion and Diantha La Vine for help with the illustration.

16
References
[1] Rockey DC. Current and future anti-fibrotic therapies for chronic liver disease. Clin Liver Dis
2008;12:939-962, xi.
[2] Torok NJ. Recent advances in the pathogenesis and diagnosis of liver fibrosis. J Gastroenterol
2008;43:315-321.
[3] Mormone E, George J, Nieto N. Molecular pathogenesis of hepatic fibrosis and current therapeutic
approaches. Chem Biol Interact 2011;193:225-231.
[4] Brodsky IE, Monack D. NLR-mediated control of inflammasome assembly in the host response
against bacterial pathogens. Seminars in immunology 2009;21:199-207.
[5] Stutz A, Golenbock DT, Latz E. Inflammasomes: too big to miss. The Journal of clinical
investigation 2009;119:3502-3511.
[6] Girardin SE, Boneca IG, Viala J, Chamaillard M, Labigne A, Thomas G, et al. Nod2 is a general
sensor of peptidoglycan through muramyl dipeptide (MDP) detection. The Journal of biological
chemistry 2003;278:8869-8872.
[7] Ogura Y, Inohara N, Benito A, Chen FF, Yamaoka S, Nunez G. Nod2, a Nod1/Apaf-1 family
member that is restricted to monocytes and activates NF-kappaB. The Journal of biological
chemistry 2001;276:4812-4818.
[8] Hedl M, Abraham C. Distinct roles for Nod2 protein and autocrine interleukin-1beta in muramyl
dipeptide-induced mitogen-activated protein kinase activation and cytokine secretion in human
macrophages. The Journal of biological chemistry 2011;286:26440-26449.
[9] Pan Q, Mathison J, Fearns C, Kravchenko VV, Da Silva Correia J, Hoffman HM, et al. MDP-induced
interleukin-1beta processing requires Nod2 and CIAS1/NALP3. Journal of leukocyte biology
2007;82:177-183.
[10] Ogura Y, Bonen DK, Inohara N, Nicolae DL, Chen FF, Ramos R, et al. A frameshift mutation in
NOD2 associated with susceptibility to Crohn's disease. Nature 2001;411:603-606.
[11] Rehman A, Sina C, Gavrilova O, Hasler R, Ott S, Baines JF, et al. Nod2 is essential for temporal
development of intestinal microbial communities. Gut 2011;60:1354-1362.
[12] Biswas A, Petnicki-Ocwieja T, Kobayashi KS. Nod2: a key regulator linking microbiota to intestinal
mucosal immunity. Journal of molecular medicine 2012;90:15-24.
[13] Barreau F, Meinzer U, Chareyre F, Berrebi D, Niwa-Kawakita M, Dussaillant M, et al.
CARD15/NOD2 is required for Peyer's patches homeostasis in mice. PloS one 2007;2:e523.
[14] Barreau F, Madre C, Meinzer U, Berrebi D, Dussaillant M, Merlin F, et al. Nod2 regulates the host
response towards microflora by modulating T cell function and epithelial permeability in mouse
Peyer's patches. Gut 2010;59:207-217.

17
[15] Hartmann P, Haimerl M, Mazagova M, Brenner DA, Schnabl B. Toll-like receptor 2-mediated
intestinal injury and enteric tumor necrosis factor receptor I contribute to liver fibrosis in mice.
Gastroenterology 2012;143:1330-1340 e1331.
[16] Jaeschke H, Gores GJ, Cederbaum AI, Hinson JA, Pessayre D, Lemasters JJ. Mechanisms of
hepatotoxicity. Toxicological sciences : an official journal of the Society of Toxicology
2002;65:166-176.
[17] Higuchi H, Yoon JH, Grambihler A, Werneburg N, Bronk SF, Gores GJ. Bile acids stimulate cFLIP
phosphorylation enhancing TRAIL-mediated apoptosis. The Journal of biological chemistry
2003;278:454-461.
[18] Soroka CJ, Mennone A, Hagey LR, Ballatori N, Boyer JL. Mouse organic solute transporter alpha
deficiency enhances renal excretion of bile acids and attenuates cholestasis. Hepatology
2010;51:181-190.
[19] Jang JH, Rickenbacher A, Humar B, Weber A, Raptis DA, Lehmann K, et al. Serotonin protects
mouse liver from cholestatic injury by decreasing bile salt pool after bile duct ligation. Hepatology
2012;56:209-218.
[20] Alnouti Y. Bile Acid sulfation: a pathway of bile acid elimination and detoxification. Toxicological
sciences : an official journal of the Society of Toxicology 2009;108:225-246.
[21] Marschall HU, Wagner M, Bodin K, Zollner G, Fickert P, Gumhold J, et al. Fxr(-/-) mice adapt to
biliary obstruction by enhanced phase I detoxification and renal elimination of bile acids. J Lipid Res
2006;47:582-592.
[22] Chiang JY. Bile acids: regulation of synthesis. Journal of lipid research 2009;50:1955-1966.
[23] Halilbasic E, Claudel T, Trauner M. Bile acid transporters and regulatory nuclear receptors in the
liver and beyond. Journal of hepatology 2013;58:155-168.
[24] Modica S, Petruzzelli M, Bellafante E, Murzilli S, Salvatore L, Celli N, et al. Selective activation of
nuclear bile acid receptor FXR in the intestine protects mice against cholestasis. Gastroenterology
2012;142:355-365 e351-354.
[25] Trauner M, Boyer JL. Bile salt transporters: molecular characterization, function, and regulation.
Physiological reviews 2003;83:633-671.
[26] Tesch GH, Yang N, Yu H, Lan HY, Foti R, Chadban SJ, et al. Intrinsic renal cells are the major
source of interleukin-1 beta synthesis in normal and diseased rat kidney. Nephrology, dialysis,
transplantation : official publication of the European Dialysis and Transplant Association - European
Renal Association 1997;12:1109-1115.
[27] VanderBrink BA, Asanuma H, Hile K, Zhang H, Rink RC, Meldrum KK. Interleukin-18 stimulates a
positive feedback loop during renal obstruction via interleukin-18 receptor. The Journal of urology
2011;186:1502-1508.

18
[28] Shigeoka AA, Kambo A, Mathison JC, King AJ, Hall WF, da Silva Correia J, et al. Nod1 and nod2
are expressed in human and murine renal tubular epithelial cells and participate in renal ischemia
reperfusion injury. Journal of immunology 2010;184:2297-2304.
[29] Denson LA, Bohan A, Held MA, Boyer JL. Organ-specific alterations in RAR alpha:RXR alpha
abundance regulate rat Mrp2 (Abcc2) expression in obstructive cholestasis. Gastroenterology
2002;123:599-607.
[30] Dietrich CG, Geier A, Salein N, Lammert F, Roeb E, Oude Elferink RP, et al. Consequences of bile
duct obstruction on intestinal expression and function of multidrug resistance-associated protein 2.
Gastroenterology 2004;126:1044-1053.
[31] Diao L, Li N, Brayman TG, Hotz KJ, Lai Y. Regulation of MRP2/ABCC2 and BSEP/ABCB11
expression in sandwich cultured human and rat hepatocytes exposed to inflammatory cytokines
TNF-{alpha}, IL-6, and IL-1{beta}. The Journal of biological chemistry 2010;285:31185-31192.

19

20
Fig. 1. Liver fibrosis is prevented in Nod2 deficient mice following 3 weeks of bile duct ligation. Wild type and Nod2
deficient mice underwent sham operation (n=3-8 for wild type mice; n=3-7 for Nod2 deficient mice) or bile duct ligation
(BDL; n=7-13 for wild type mice; n=7-9 for Nod2 deficient mice). (A) Plasma ALT levels. (B and C) Sirius red staining of
liver sections are shown and quantitated by image analysis. (D) Hepatic hydroxyproline measurement. (E and F) Hepatic
, IL- gene expression. (G) and LPS levels. *p < 0.05; **p < 0.01; ***p < 0.001
21
22
Fig. 2. Bile acid concentration is lower in the liver of Nod2 deficient mice after bile duct ligation. (A) Bile acids were
measured in livers of wild type sham (n=4) and bile duct ligated (BDL; n=12), Nod2-/-
sham (n=3) and bile duct ligated (n=8)
mice. Total bile acid levels and the total amount of sulfated bile acids in the liver. (B-F) Real-time PCR was performed in
livers of wild type sham (n=2-4) and bile duct ligated (n=16-17), Nod2-/-
sham (n=2-4) and bile duct ligated (n=8-9) mice.
(G) Western blot for hepatic OATP1, MRP2 and MRP4; -actin is shown as loading control. *p < 0.05; **p < 0.01

23

24
Fig. 3. Urine bile acid excretion is increased in Nod2 deficient mice following bile duct ligation. Wild type sham (n=6-8)
and bile duct ligated (BDL; n=10-13), Nod2 -/-
sham (n=4-7) and bile duct ligated (n=13) mice were used. Total bile acid
levels (A) in the plasma and (B) feces. (C) Total bile acids and total sulfated bile acids in the urine. (D, E, G and H)
Real-time PCR was performed in kidneys of wild type sham (n=8-11) and bile duct ligated (n=11-16), Nod2-/-
sham (n=7)
and bile duct ligated (n=11) mice. (F) Western blot and immunohistochemistry for renal MRP2; -actin is shown as loading
control. *p < 0.05; **p < 0.01; ***p < 0.001

25

26

27
Fig. 4. Nod2-dependent IL-
cells. (A) Mice underwent sham (n=7-8) and bile duct ligation (BDL; n=11-13) for 3 weeks. IL- -6 gene
expression in the kidney. (B) Immunofluorescent staining for IL-1 (green) and F4/80 (red), and (C) quantification of
IL-1 in kidney sections (n=4 for each group). (D) Immunohistochemistry for IL-1 (brown) was performed in kidney
sections of wild type mice following 3 weeks of bile duct ligation. (E) HK2 cells were treated with PBS as control or IL-1
(1 ng/ml) for 16 hrs. MRP2, MRP3 and MRP4 mRNA expression was examined (n = 4 independent experiments performed
in duplicate). (F) Wild type mice were injected with PBS (n=5) or IL- (n=5) and renal MRP2, MRP3 and MRP4 mRNA
expression was examined 24hrs later. (G) Wild type or Nod2-/-
mice were injected with MDP control (n=3-4) or MDP (n=4)
and treated with or without Anakinra (n=5-9). Gene expression for MRP2, MRP3 and MRP4 in the kidney was assessed
24hrs after the injection. (H and I) Bile duct ligation was performed in wild type mice for a total of 3 weeks. Mice were
injected with saline (n=4) or Anakinra (n=6-7) for 4 days prior to harvesting. Collagen mRNA expression in the liver
(H, left panel). Total bile acids in the liver (H, right panel). Total bile acids in the urine (I, left panel). Gene expression for
renal MRP2, MRP3 and MRP4 (I, right panel). (J) Schematic representation of the proposed protective role of Nod2
deficiency in cholestasis. Following cholestatic liver injury, Nod2 dependent IL-
cells inhibits the expression of bile acid efflux transporters MRP2 and MRP4 in an autocrine fashion. Less bile acids are
excreted in the urine, and an accumulation of bile acids in the liver results in hepatocyte damage and fibrosis. Bile acids (BA)
are indicated as green dots. Grey font color denotes unchanged transporter or enzyme expression between wild type and
Nod2-/-
mice following bile duct ligation. Up-regulated transporter or enzyme expression between wild type and Nod2-/-
mice
following bile duct ligation is indicated by a black font color and an increased size of the arrow head. CH, cholesterol; BDL,
bile duct ligation.*p < 0.05; **p < 0.01
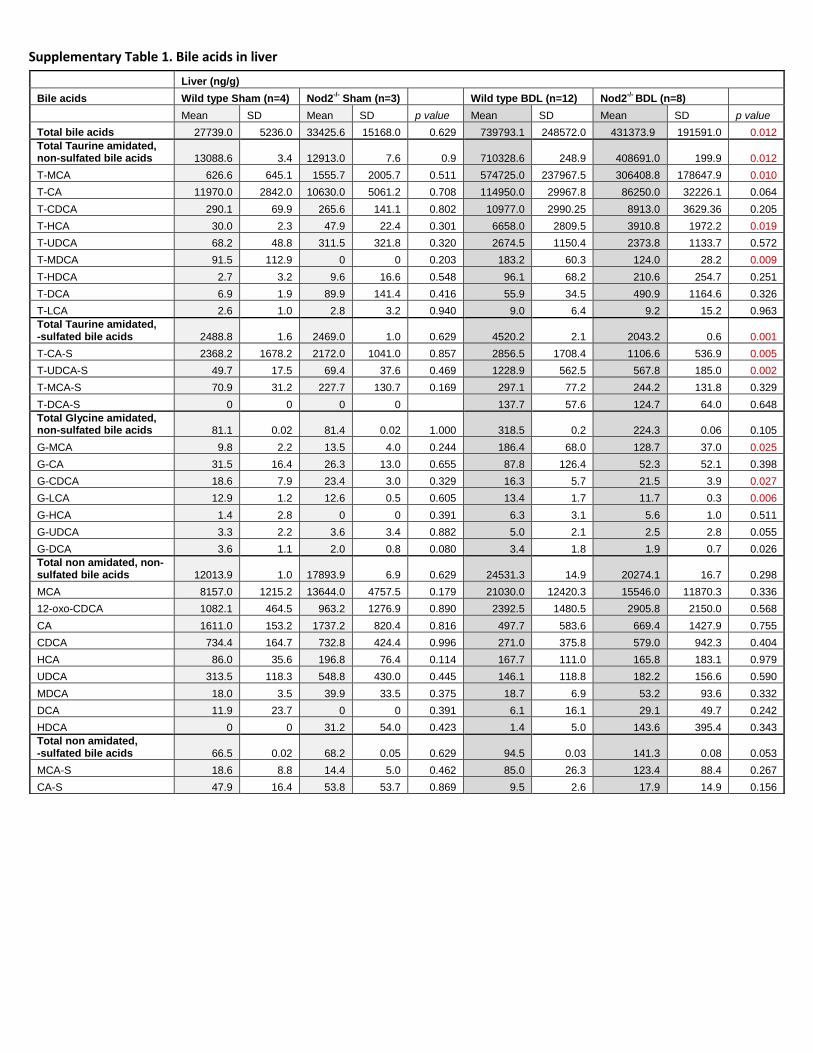
Supplementary Table 1. Bile acids in liver
Liver (ng/g)
Bile acids Wild type Sham (n=4) Nod2-/-
Sham (n=3) Wild type BDL (n=12) Nod2-/-
BDL (n=8)
Mean SD Mean SD p value Mean SD Mean SD p value
Total bile acids 27739.0 5236.0 33425.6 15168.0 0.629 739793.1 248572.0 431373.9 191591.0 0.012
Total Taurine amidated, non-sulfated bile acids 13088.6 3.4 12913.0 7.6 0.9 710328.6 248.9 408691.0 199.9 0.012
T-MCA 626.6 645.1 1555.7 2005.7 0.511 574725.0 237967.5 306408.8 178647.9 0.010
T-CA 11970.0 2842.0 10630.0 5061.2 0.708 114950.0 29967.8 86250.0 32226.1 0.064
T-CDCA 290.1 69.9 265.6 141.1 0.802 10977.0 2990.25 8913.0 3629.36 0.205
T-HCA 30.0 2.3 47.9 22.4 0.301 6658.0 2809.5 3910.8 1972.2 0.019
T-UDCA 68.2 48.8 311.5 321.8 0.320 2674.5 1150.4 2373.8 1133.7 0.572
T-MDCA 91.5 112.9 0 0 0.203 183.2 60.3 124.0 28.2 0.009
T-HDCA 2.7 3.2 9.6 16.6 0.548 96.1 68.2 210.6 254.7 0.251
T-DCA 6.9 1.9 89.9 141.4 0.416 55.9 34.5 490.9 1164.6 0.326
T-LCA 2.6 1.0 2.8 3.2 0.940 9.0 6.4 9.2 15.2 0.963
Total Taurine amidated, -sulfated bile acids 2488.8 1.6 2469.0 1.0 0.629 4520.2 2.1 2043.2 0.6 0.001
T-CA-S 2368.2 1678.2 2172.0 1041.0 0.857 2856.5 1708.4 1106.6 536.9 0.005
T-UDCA-S 49.7 17.5 69.4 37.6 0.469 1228.9 562.5 567.8 185.0 0.002
T-MCA-S 70.9 31.2 227.7 130.7 0.169 297.1 77.2 244.2 131.8 0.329
T-DCA-S 0 0 0 0 137.7 57.6 124.7 64.0 0.648
Total Glycine amidated, non-sulfated bile acids 81.1 0.02 81.4 0.02 1.000 318.5 0.2 224.3 0.06 0.105
G-MCA 9.8 2.2 13.5 4.0 0.244 186.4 68.0 128.7 37.0 0.025
G-CA 31.5 16.4 26.3 13.0 0.655 87.8 126.4 52.3 52.1 0.398
G-CDCA 18.6 7.9 23.4 3.0 0.329 16.3 5.7 21.5 3.9 0.027
G-LCA 12.9 1.2 12.6 0.5 0.605 13.4 1.7 11.7 0.3 0.006
G-HCA 1.4 2.8 0 0 0.391 6.3 3.1 5.6 1.0 0.511
G-UDCA 3.3 2.2 3.6 3.4 0.882 5.0 2.1 2.5 2.8 0.055
G-DCA 3.6 1.1 2.0 0.8 0.080 3.4 1.8 1.9 0.7 0.026
Total non amidated, non-sulfated bile acids 12013.9 1.0 17893.9 6.9 0.629 24531.3 14.9 20274.1 16.7 0.298
MCA 8157.0 1215.2 13644.0 4757.5 0.179 21030.0 12420.3 15546.0 11870.3 0.336
12-oxo-CDCA 1082.1 464.5 963.2 1276.9 0.890 2392.5 1480.5 2905.8 2150.0 0.568
CA 1611.0 153.2 1737.2 820.4 0.816 497.7 583.6 669.4 1427.9 0.755
CDCA 734.4 164.7 732.8 424.4 0.996 271.0 375.8 579.0 942.3 0.404
HCA 86.0 35.6 196.8 76.4 0.114 167.7 111.0 165.8 183.1 0.979
UDCA 313.5 118.3 548.8 430.0 0.445 146.1 118.8 182.2 156.6 0.590
MDCA 18.0 3.5 39.9 33.5 0.375 18.7 6.9 53.2 93.6 0.332
DCA 11.9 23.7 0 0 0.391 6.1 16.1 29.1 49.7 0.242
HDCA 0 0 31.2 54.0 0.423 1.4 5.0 143.6 395.4 0.343
Total non amidated, -sulfated bile acids 66.5 0.02 68.2 0.05 0.629 94.5 0.03 141.3 0.08 0.053
MCA-S 18.6 8.8 14.4 5.0 0.462 85.0 26.3 123.4 88.4 0.267
CA-S 47.9 16.4 53.8 53.7 0.869 9.5 2.6 17.9 14.9 0.156

Supplementary Table 2. Bile acids in plasma
Plasma (nM)
Bile acids Wild type Sham (n=6) Nod2-/-
Sham (n=4) Wild type BDL (n=15) Nod2-/-
BDL (n=15)
Mean SD Mean SD p value Mean SD Mean SD p value
Total bile acids 547.1 547.4 1263.7 1390.0 0.257 547607.7 468319.0 645487.0 525755.0 0.798
Total Taurine amidated, non-sulfated bile acids 352.0 536.3 892.6 914 0.171 534443.5 501119.7 634020.2 555945.9 0.7976
T-MCA 122.8 188.7 534.5 666.6 0.308 321426.5 330042.6 438283.5 379465.1 0.411
T-CA 83.7 61.7 301.8 233.9 0.158 170946.4 143293.4 171458.2 136896.5 0.993
T-CDCA 9.7 7.1 26.9 15.1 0.103 22080.5 9800.5 14956.4 8007.3 0.054
T-UDCA 9.2 3.0 16.2 10.6 0.287 10433.0 4335.2 6811.7 4866.6 0.057
T-HCA 124.4 304.1 9.6 6.5 0.397 8858.4 5866.6 2062.9 1865.6 0.001
T-HDCA 1.0 2.3 0.9 1.7 0.887 314.9 177.0 187.8 104.5 0.038
T-DCA 1.1 0.4 2.8 2.0 0.183 199.9 92.5 211.1 115.0 0.786
T-MDCA 0 0 0 0 174.0 124.9 41.4 70.2 0.003
T-LCA 0 0 0 0 9.9 6.8 7.2 5.4 0.282
Total Taurine amidated, -sulfated bile acids 23.1 25 38.7 58.8 0.914 7996.5 3042.6 8030.60 6456.3 0.7976
T-CA-S 14.4 14.1 38.1 57.7 0.475 4809.8 3117.6 6486.9 5538.9 0.353
T-UDCA-S 0 0 0 0 1919.3 1115.6 930.2 633.2 0.012
T-CDCA-S 8.7 21.4 0 0 0.363 955.1 357.8 281.1 309.0 0.00003
T-MCA-S 0 0 0.6 1.2 0.391 312.4 230.3 332.4 309.4 0.853
Total Glycine amidated, non-sulfated bile acids 3.6 3.2 2.9 3.2 0.610 260.5 225.8 137.3 98.8 0.0649
G-MCA 0.4 0.5 0.3 0.4 0.922 129.0 88.6 69.1 46.8 0.045
G-CA 0.7 0.6 0.8 0.4 0.805 115.3 117.9 58.1 44.9 0.123
G-HCA 0 0 0 0 5.0 2.5 2.0 1.8 0.002
G-CDCA 1.5 2.0 1.2 1.5 0.743 4.5 4.3 4.9 6.4 0.847
G-UDCA 0.6 0.7 0.5 0.9 0.874 3.9 3.3 1.4 1.1 0.018
G-HDCA 0 0 0 0 2.3 2.4 1.2 0.9 0.147
G-DCA 0.4 0.4 0.2 0.1 0.246 0.5 0.5 0.6 0.8 0.640
Total Glycine amidated, -sulfated bile acids 0 0 0 0 16.8 11.7 9.2 9.7 0.087
G-LCA-S 0 0 0 0 16.8 11.7 9.2 9.7 0.087
Total non amidated, non-sulfated bile acids 166.0 157.2 325.4 418 0.352 4505.2 6069.0 3008.9 3220.4 0.4728
MCA 75.2 76.1 186.3 274.6 0.483 3227.6 3810.7 1946.8 1981.7 0.296
CA 19.2 20.2 27.4 41.1 0.730 903.2 1362.4 641.6 857.8 0.564
12-oxo-CDCA 15.3 18.3 17.4 30.8 0.909 210.9 395.8 160.3 203.0 0.686
CDCA 19.0 14.3 26.1 10.4 0.385 80.5 91.2 53.3 71.4 0.406
DCA 28.0 26.1 50.0 46.9 0.438 34.2 44.4 158.0 306.3 0.174
UDCA 8.5 10.2 15.8 19.2 0.527 33.6 39.7 19.0 14.9 0.232
HCA 0 0 0 0 7.2 18.1 12.3 16.1 0.450
HDCA 0 0 1.1 2.2 0.391 4.6 5.9 12.7 25.7 0.288
MDCA 0.9 0.7 0.8 1.5 0.964 3.5 2.8 2.5 2.9 0.385
LCA 0 0 0.5 1.0 0.391 0.02 0.1 2.5 8.9 0.341
Total non amidated, -sulfated bile acids 2.4 2.2 4.1 3.4 0.352 385.1 206.0 280.7 193.3 0.151
MCA-S 1.9 2.2 2.5 0.4 0.520 352.1 180.8 249.6 180.3 0.161
UDCA-S 0.2 0.4 0 0 0.363 23.7 16.2 10.7 8.2 0.019
CA-S 0 0 1.6 3.1 0.391 5.5 5.4 16.5 37.2 0.309
DCA-S 0.4 0.6 0 0 0.175 3.8 2.8 3.8 4.5 0.987
CDCA-S 0 0 0 0 0.1 0.4 0.1 0.4 0.961

Supplementary Table 3. Bile acids in feces
Feces (nmol/g)
Bile acids Wild type Sham (n=8) Nod2 Sham (n=7) Wild type BDL (n=10) Nod2 BDL (n=13)
Mean SD Mean SD p value Mean SD Mean SD p value
Total bile acids 7535.7 3364.8 7779.6 1670.4 0.955 151.7 131.2 128.3 57.0 0.975
Total Taurine amidated, non-sulfated bile acids 37.4 32.0 31.5 15.1 0.613 0.8 0.3 1.3 0.7 0.145
T-MCA 21.8 19.5 18.2 7.0 0.635 0.3 0.2 0.5 0.3 0.078
T-CA 9.5 9.6 10.2 5.8 0.859 0.4 0.2 0.7 0.4 0.073
T-DCA 2.0 1.4 1.1 1.5 0.262 0.01 0.003 0.01 0.007 0.371
T-UDCA 1.3 1.7 0.9 0.4 0.455 0.01 0.006 0.02 0.007 0.104
T-CDCA 1.3 1.1 0.8 0.4 0.323 0.1 0.1 0.2 0.1 0.573
T-HDCA 1.2 0.8 0.3 0.3 0.013 0.001 0.003 0.002 0.004 0.826
T-HCA 0.1 0.1 0.1 0.1 0.229 0 0 0.001 0 0.114
T-LCA 0.1 0.1 0.04 0.03 0.017 0.01 0.003 0.01 0.004 0.905
Total Taurine amidated, -sulfated bile acids 191.5 494.6 14.6 14.0 0.536 0.2 0.09 0.3 1.1 0.0772
T-CA-S 187.8 488.7 11.5 12.2 0.342 0.1 0.1 0.1 0.1 0.920
T-MCA-S 2.3 5.1 0.7 0.4 0.374 0.1 0.03 0.1 0.04 0.066
T-DCA-S 0.8 0.6 0.2 0.2 0.076 0 0 0.002 0.008 0.337
T-CDCA-S 0.4 0.3 0.6 0.4 0.390 0 0 0.1 0.07 0.036
T-UDCA-S 0.2 0.3 1.6 2.8 0.248 0 0 0 0
T-LCA-S 0.02 0.02 0.03 0.03 0.644 0 0 0 0
Total Glycine amidated, non-sulfated bile acids 0.7 0.3 1.6 1.3 0.093 0.03 0.009 0.03 0.007 0.9724
G-MCA 0.3 0.3 0.7 0.5 0.111 0.01 0.006 0.01 0.004 0.219
G-DCA 0.2 0.1 0.2 0.1 0.353 0 0 0 0
G-CA 0.1 0.3 0.7 0.7 0.103 0.01 0.003 0.01 0 0.678
G-UDCA 0.03 0.01 0.02 0.01 0.066 0 0 0 0
G-CDCA 0.03 0.01 0.02 0.008 0.590 0.01 0.003 0.01 0.004 0.533
G-HDCA 0.02 0.02 0.01 0.005 0.017 0 0 0 0
G-LCA 0.01 0.003 0.01 0.003 0.022 0 0 0 0
G-HCA 0.01 0.01 0.01 0.03 0.956 0 0 0 0
Total Glycine amidated, -sulfated bile acids 1.7 0.8 21.7 15.3 0.0003 0 0 0 0
G-CA-S 1.6 0.8 21.5 15.3 0.014 0 0 0 0
G-DCA-S 0.1 0.1 0.2 0.1 0.132 0 0 0 0
Total non amidated, non-sulfated bile acids 4099.1 1975.1 3229.6 1362.7 0.463 133.7 126.8 90.7 33.2 0.7802
MCA 1843.0 1089.9 1708.6 632.5 0.772 92.6 105.1 64.7 25.3 0.430
DCA 983.2 391.7 706.7 315.5 0.155 12.1 10.0 6.9 4.5 0.152
12-oxo-LCA 327.7 187.2 116.5 70.8 0.016 6.2 5.2 3.1 1.9 0.099
HDCA 257.7 155.8 53.7 40.6 0.007 5.1 12.0 0.6 0.4 0.262
CA 204.1 176.2 325.3 275.5 0.341 5.4 1.7 2.9 1.2 0.001
UDCA 180.2 66.5 26.2 11.9 0.0003 3.3 2.3 2.2 1.4 0.240
12-oxo-CDCA 127.6 99.5 155.8 88.1 0.571 5.5 3.8 7.4 3.2 0.226
CDCA 50.9 18.9 20.5 13.4 0.003 0.8 0.3 0.8 0.5 0.817
6-oxo-LCA 29.7 22.1 5.8 4.6 0.018 0.6 1.3 0.2 0.1 0.330
isoDCA 28.2 8.8 40.0 24.8 0.270 0.2 0.2 0.2 0.2 0.713
HCA 22.4 10.2 24.9 40.3 0.877 0.3 0.2 0.4 0.2 0.465
LCA 21.5 5.9 17.8 9.3 0.387 1.0 0.9 0.6 0.4 0.291
MDCA 10.7 4.5 10.4 7.9 0.932 0.1 0.3 0.1 0.07 0.956
7-oxo-LCA 4.5 2.0 4.7 4.2 0.913 0.1 0.06 0.3 0.1 0.0002
isoLCA 4.5 1.4 1.6 0.8 0.001 0.3 0.3 0.2 0.1 0.289
3-dehydroCA 3.1 2.0 11.1 14.3 0.189 0.2 0.09 0.2 0.07 0.952
Total non amidated, -sulfated bile acids 3205.3 1899.6 4480.5 1095.2 0.232 16.9 15.8 35.9 35.0 0.0586
CA-S 3077.6 1807.9 4247.1 1092.7 0.151 8.8 12.4 3.6 2.7 0.220
MCA-S 81.8 64.2 156.8 73.2 0.058 8.1 5.6 32.1 34.7 0.030
DCA-S 44.4 32.2 76.2 34.8 0.091 0.03 0.03 0.2 0.4 0.090
UDCA-S 1.4 1.1 0.1 0.1 0.014 0.01 0.006 0.1 0.04 0.009
CDCA-S 0.2 0.3 0.3 0.2 0.274 0 0 0 0

Supplementary Table 4. Bile acids in urine
Urine (nM)
Bile acids Wild type Sham (n=8) Nod2 Sham (n=7) Wild type BDL (n=10) Nod2 BDL (n=13)
Mean SD Mean SD p value Mean SD Mean SD p value
Total bile acids 1177.1 1301.6 481.3 115.5 0.152 63291.0 26406.3 88106.6 23684.9 0.032
Total Taurine amidated, non-sulfated bile acids 52.8 72.7 34.9 59.5 0.694 20666.2 9388.0 27036.8 10223.5 0.251
T-MCA 8.0 20.9 0.4 0.3 0.333 13160.5 6951.0 17286.2 7681.0 0.192
T-CA 32.5 44.8 22.8 42.3 0.675 6768.6 2359.8 8052.8 2507.1 0.222
T-UDCA 0 0 0 0 582.1 491.7 1428.3 757.4 0.004
T-CDCA 12.1 18.1 11.8 16.9 0.971 120.9 83.2 211.8 130.3 0.055
T-HCA 0 0 0 0 30.7 19.9 55.9 34.7 0.041
T-HDCA 0.2 0.6 0 0 0.351 2.5 5.1 1.6 3.2 0.660
T-DCA 0 0 0 0 0.8 1.3 0.2 0.7 0.192
Total Taurine amidated, -sulfated bile acids 817.0 867.1 247.0 92.6 0.054 38828.0 16353.9 55189.0 14075.4 0.0378
T-CA-S 634.7 815.9 105.3 63.5 0.110 34614.2 15681.3 50670.4 13631.7 0.019
T-MCA-S 119.0 43.8 99.0 37.0 0.355 3249.4 1040.0 3621.3 1803.6 0.541
T-UDCA-S 58.5 38.7 39.3 11.9 0.218 512.2 320.9 306.5 165.0 0.088
T-CDCA-S 1.1 1.1 13 0.8 0.703 326.8 194.5 410.4 139.3 0.267
T-DCA-S 0 0 0 0 103.9 39.5 158.3 40.8 0.004
T-LCA-S 3.7 4.0 2.1 1.6 0.295 21.5 14.2 22.1 14.1 0.921
Total Glycine amidated, non-sulfated bile acids 2.0 1.7 1.3 0.8 0.613 19.7 13.3 22.4 8.7 0.2778
G-MCA 0.5 0.6 0.2 0.3 0.193 10.7 7.3 14.6 6.1 0.183
G-CA 0.3 0.7 0 0 0.182 7.6 6.6 6.4 2.9 0.599
G-CDCA 1.0 0.4 0.9 0.3 0.444 1.4 0.9 1.4 0.7 0.996
G-HCA 0.2 0.3 0.3 0.5 0.643 0 0 0 0
Total Glycine amidated, -sulfated bile acids 25.3 23.5 15.1 8.5 0.397 12.4 7.9 9.7 5.1 0.4025
G-MCA-S 18.8 13.3 12.4 6.6 0.253 7.9 5.1 6.6 2.5 0.448
G-CA-S 6.5 10.7 2.7 0 0.359 4.5 4.1 3.1 2.5 0.375
Total non amidated, non-sulfated bile acids 177.7 203.3 114.1 54.2 0.779 717.9 329.8 1293.6 715.5 0.017
MCA 19.2 26.6 5.7 4.5 0.199 544.4 275.1 1109.7 697.1 0.017
CA 76.5 160.9 16.0 31.2 0.330 140.3 302.9 136.3 137.5 0.969
CDCA 5.6 14.1 2.7 5.3 0.600 12.7 22.1 26.8 32.5 0.228
UDCA 0.6 1.3 0.7 1.3 0.953 11.8 6.6 13.1 4.7 0.590
HCA 75.0 66.4 88.0 35.2 0.640 7.8 4.1 6.1 1.1 0.235
DCA 0.1 0.4 0.4 1.1 0.565 0.5 0.6 1.2 1.8 0.207
isoDCA 0.7 0.6 0.7 0.5 0.918 0.4 0.6 0.3 0.4 0.620
Total non amidated, -sulfated bile acids 102.2 164.0 68.8 100.8 0.397 3046.9 2233.3 4555.0 1736.0 0.145
MCA-S 31.2 42.7 15.3 12.2 0.344 2951.6 2218.8 4474.9 1736.8 0.091
UDCA-S 5.3 8.8 0 0 0.128 54.4 54.1 38.2 24.5 0.395
CA-S 65.6 113.1 53.3 99.2 0.827 33.2 37.0 26.9 18.8 0.633
DCA-S 0.2 0.6 0.2 0.5 0.995 7.7 3.2 15.0 5.1 0.0004
The value of bile acids which were not mentioned in this table was below the determination limit. MCA, muricholic acid; CA, cholic acid; UDCA, ursodeoxycholic acid; DCA, deoxycholic acid; CDCA, chenodeoxycholic acid; HCA, hyocholic acid; LCA; lithocholic acid
1
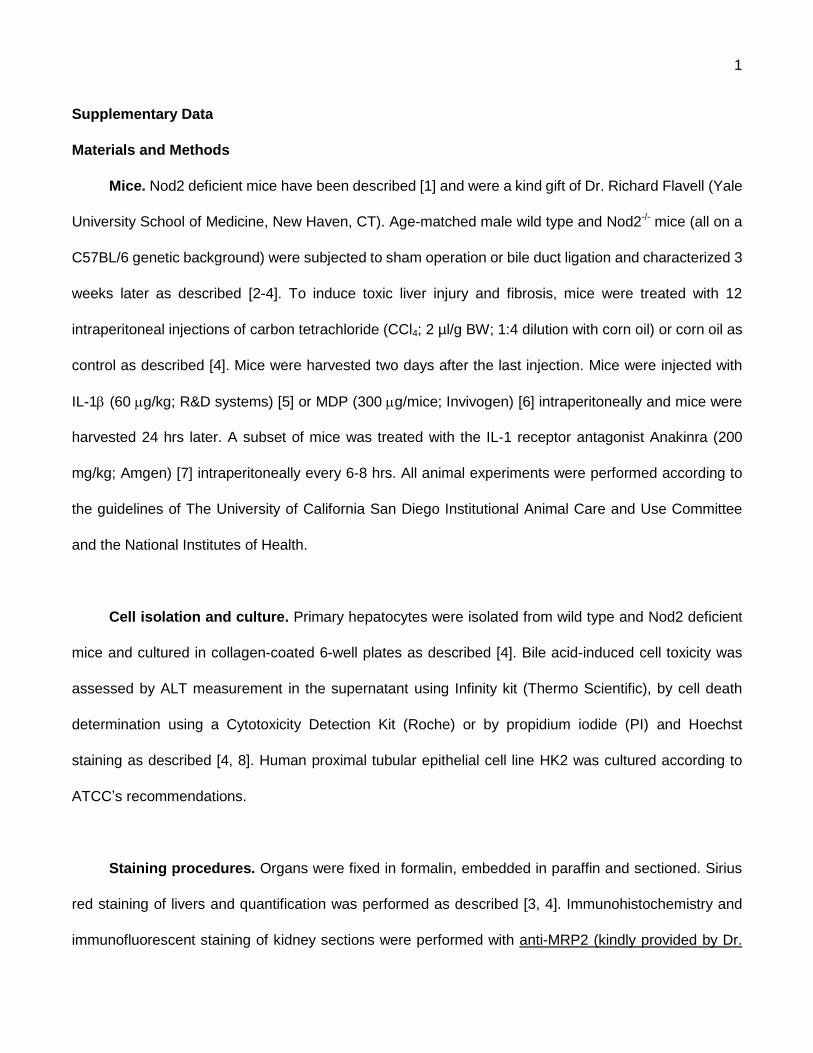
Supplementary Data
Materials and Methods
Mice. Nod2 deficient mice have been described [1] and were a kind gift of Dr. Richard Flavell (Yale
University School of Medicine, New Haven, CT). Age-matched male wild type and Nod2-/- mice (all on a
C57BL/6 genetic background) were subjected to sham operation or bile duct ligation and characterized 3
weeks later as described [2-4]. To induce toxic liver injury and fibrosis, mice were treated with 12
intraperitoneal injections of carbon tetrachloride (CCl4; 2 µl/g BW; 1:4 dilution with corn oil) or corn oil as
control as described [4]. Mice were harvested two days after the last injection. Mice were injected with
IL-1 (60 g/kg; R&D systems) [5] or MDP (300 g/mice; Invivogen) [6] intraperitoneally and mice were
harvested 24 hrs later. A subset of mice was treated with the IL-1 receptor antagonist Anakinra (200
mg/kg; Amgen) [7] intraperitoneally every 6-8 hrs. All animal experiments were performed according to
the guidelines of The University of California San Diego Institutional Animal Care and Use Committee
and the National Institutes of Health.
Cell isolation and culture. Primary hepatocytes were isolated from wild type and Nod2 deficient
mice and cultured in collagen-coated 6-well plates as described [4]. Bile acid-induced cell toxicity was
assessed by ALT measurement in the supernatant using Infinity kit (Thermo Scientific), by cell death
determination using a Cytotoxicity Detection Kit (Roche) or by propidium iodide (PI) and Hoechst
staining as described [4, 8]. Human proximal tubular epithelial cell line HK2 was cultured according to
ATCC’s recommendations.
Staining procedures. Organs were fixed in formalin, embedded in paraffin and sectioned. Sirius
red staining of livers and quantification was performed as described [3, 4]. Immunohistochemistry and
immunofluorescent staining of kidney sections were performed with anti-MRP2 (kindly provided by Dr.
2
Bruno Stieger, University Hospital, Zurich, Switzerland), anti-IL-1 (Abcam) and anti-F4/80 antibodies
(eBioscience) using standard staining methods [3, 4]. Quantification of IL-1staining was performed by
taking 4-5 high power fields (200 x), which captures the entire cortex of the kidney. Images were
analyzed using NIH Image J, and results are shown as percentage area positively stained for IL-1.
Western blot analysis. Western blot analysis was performed as described [3] using anti-MRP2
and anti-OATP1 (kindly provided by Dr. Bruno Stieger, University Hospital, Zurich, Switzerland), and
-actin antibodies (Sigma).
Hydroxyproline measurement. Liver Hydroxyproline content was measured as describe [4].
Real-time PCR. Total RNA was extracted with TRIZOL (Invitrogen), digested with DNase using
the DNA-free kit (Ambion) and reverse transcribed with the High Capacity cDNA Reverse Transcription
kit (ABI). Real-time PCR was performed using SYBR Premix (Biorad) for 40 cycles of 15 s at 95 °C and
60 s at 60 °C on an ABI StepOnePlus instrument. Published primer sequences for OST, mouse MRP3
and MRP4 were used [9, 10]. All other primer sequences were obtained from the NIH mouse and human
qprimer depot. The relative expression of the target genes was obtained by calculating from a standard
curve and normalized to 18S as internal control. Values are expressed relative to wild type control mice.
Bile acid measurement. Bile acids were measured in liver, plasma and urine by liquid
chromatography/mass spectrometry as described [11, 12]. The method determines both amidated and
non-amidated sulfates as well as tetra- and penta-hydroxy bile acids, although the latter could not be
quantified with certainty because of lack of appropriate deutered internal standards. For fecal samples,
approximately 100 mg of feces were homogenized in 9 volumes of deionized H2O. A 100 μl aliquot of
3
undiluted or 20-fold diluted was spiked with 10 μl IS and 2 ml of ice-cold alkaline (5% NH4OH)
acetonitrile was added. Samples were vortexed continuously for 30 min and centrifuged at 16,000 × g
for 10 min. The supernatant was aspirated and the pellet was extracted with another 1 ml of ice-cold
alkaline acetonitrile. Supernatants from the two extraction steps were pooled, evaporated, reconstituted
in a 100 μl of 50% methanol, and analyzed by LC-MS/MS. Total urinary bile acids were measured in bile
duct ligated mice after treatment with Anakinra (Fig. 4H) using a kit from Crystal Chem. Inc..
Plasma assaysLPS was measured as described [2]. Results are expressed relative to wild type
control mice. TNF and IL-1 in mouse plasma were measured using ELISA (eBioscience). Plasma ALT
was measured using a kit from Infinity. Total plasma bilirubin was measured using a kit from Bioassay
Systems.
Statistical Analysis. All results are reported as mean ± SD. Comparison between two groups was
performed by Mann-Whitney test. A p-value < 0.05 was considered statistically significant.
Figure Legends
Supplementary Fig. 1. Liver weight and plasma bilirubin following 3 weeks of bile duct ligation.
Wild type and Nod2 deficient mice underwent sham operation (n=7-8 for each group) or bile duct ligation
(BDL; n=4-7 for wild type mice; n=4-6 for Nod2 deficient mice). (A) Liver weight. (B) Plasma bilirubin
levels.
Supplementary Fig. 2. Liver fibrosis is not decreased in Nod2 deficient mice following carbon
tetrachloride injection. Wild type and Nod2 deficient mice were injected with oil as control (n=4 for

4
each group) or carbon tetrachloride (CCl4; n=14 for wild type mice; n=10 for Nod2 deficient mice). (A)
Plasma ALT levels. (B and C) Sirius red staining for collagen deposition is shown and quantitated by
image analysis. (D) Hepatic collagen 1 (I), IL-1 and TNF mRNA expression was assessed. *p < 0.05;
**p < 0.01
Supplementary Fig. 3. Glycodeoxycholic acid-induced hepatocyte death is independent from
Nod2. (A) Hepatocytes isolated from wild type and Nod2 deficient mice were treated with muramyl
dipeptide (MDP) control (10g/ml), MDP (10g/ml), and glycodeoxycholic acid (GDCA; 100M) for 6
hours. Cells were used for Propidium iodide (PI) and Hoechst staining. (B) ALT and (C) cell death
determination in the supernatant (n = 4 independent experiments performed in triplicate). *p < 0.05
Supplementary Fig. 4. Effect of IL-1 on canalicular transporters in the liver of wild type mice.
Wild type mice were injected with PBS (n=5) or IL-1 (n=5) and hepatic MRP2, MRP3 and MRP4 mRNA
expression was examined 24hrs later.

5
References
[1] Kobayashi KS, Chamaillard M, Ogura Y, Henegariu O, Inohara N, Nunez G, et al.
Nod2-dependent regulation of innate and adaptive immunity in the intestinal tract. Science
2005;307:731-734.
[2] Fouts DE, Torralba M, Nelson KE, Brenner DA, Schnabl B. Bacterial translocation and
changes in the intestinal microbiome in mouse models of liver disease. J Hepatol 2012;56:1283-1292.
[3] Hartmann P, Haimerl M, Mazagova M, Brenner DA, Schnabl B. Toll-like receptor 2-mediated
intestinal injury and enteric tumor necrosis factor receptor I contribute to liver fibrosis in mice.
Gastroenterology 2012;143:1330-1340 e1331.
[4] Iwaisako K, Haimerl M, Paik YH, Taura K, Kodama Y, Sirlin C, et al. Protection from liver
fibrosis by a peroxisome proliferator-activated receptor delta agonist. Proc Natl Acad Sci U S A
2012;109:E1369-1376.
[5] Dunn AJ. Effects of cytokines and infections on brain neurochemistry. Clin Neurosci Res
2006;6:52-68.
[6] Kim YG, Park JH, Shaw MH, Franchi L, Inohara N, Nunez G. The cytosolic sensors Nod1 and
Nod2 are critical for bacterial recognition and host defense after exposure to Toll-like receptor ligands.
Immunity 2008;28:246-257.
[7] Maeda S, Hsu LC, Liu H, Bankston LA, Iimura M, Kagnoff MF, et al. Nod2 mutation in
Crohn's disease potentiates NF-kappaB activity and IL-1beta processing. Science 2005;307:734-738.
[8] Higuchi H, Yoon JH, Grambihler A, Werneburg N, Bronk SF, Gores GJ. Bile acids stimulate
cFLIP phosphorylation enhancing TRAIL-mediated apoptosis. J Biol Chem 2003;278:454-461.
[9] Ballatori N, Christian WV, Lee JY, Dawson PA, Soroka CJ, Boyer JL, et al.
OSTalpha-OSTbeta: a major basolateral bile acid and steroid transporter in human intestinal, renal, and
biliary epithelia. Hepatology 2005;42:1270-1279.
[10] Stedman C, Liddle C, Coulter S, Sonoda J, Alvarez JG, Evans RM, et al. Benefit of farnesoid X
receptor inhibition in obstructive cholestasis. Proc Natl Acad Sci U S A 2006;103:11323-11328.
[11] Alnouti Y, Csanaky IL, Klaassen CD. Quantitative-profiling of bile acids and their conjugates
in mouse liver, bile, plasma, and urine using LC-MS/MS. J Chromatogr B Analyt Technol Biomed Life
Sci 2008;873:209-217.
[12] Huang J, Bathena SP, Csanaky IL, Alnouti Y. Simultaneous characterization of bile acids and
their sulfate metabolites in mouse liver, plasma, bile, and urine using LC-MS/MS. J Pharm Biomed Anal
2011;55:1111-1119.