NOAA’s Operational Air Quality Forecasting: Progress … · NOAA’s Operational . Air Quality...
30
NOAA’s Operational Air Quality Forecasting: Progress and Challenges Ivanka Stajner 1 , Jeff McQueen 2 , Pius Lee 3 , Ariel Stein 3 , Phil Dickerson 4 , Sikchya Upadhayay 1,5 1 NOAA NWS/OSTI 2 NOAA NWS/NCEP 3 NOAA ARL 4 EPA 5 Syneren Technologies with contributions from the entire NAQFC Implementation Team International Workshop on Air Quality Forecasting and Research September 1, 2015
Transcript of NOAA’s Operational Air Quality Forecasting: Progress … · NOAA’s Operational . Air Quality...

NOAA’s Operational Air Quality Forecasting:
Progress and Challenges
Ivanka Stajner1, Jeff McQueen2, Pius Lee3, Ariel Stein3, Phil Dickerson4, Sikchya Upadhayay1,5
1 NOAA NWS/OSTI 2 NOAA NWS/NCEP 3 NOAA ARL 4 EPA 5 Syneren Technologies
with contributions from the entire NAQFC Implementation Team
International Workshop on Air Quality Forecasting and Research September 1, 2015

National Air Quality Forecast Capability status in 9/2015
• Improving the basis for air quality alerts • Providing air quality information for people at risk
Prediction Capabilities: • Operations:
Ozone nationwide Smoke nationwide
Dust over CONUS
• Developmental testing: Components for particulate matter
(PM) predictions
2004: ozone
2005: ozone
2007: ozone and smoke 2012: dust
2009: smoke 2010: ozone 2010: ozone
and smoke
2

Ozone predictions Operational predictions at http://airquality.weather.gov
over expanding domains since 2004
3
Model: Linked numerical prediction system Operationally integrated on NCEP’s supercomputer • NOAA/EPA Community Multiscale Air Quality (CMAQ)
model • NOAA/NCEP North American Mesoscale (NAM) numerical
weather prediction
Observational Input: • NWS compilation weather observations • EPA emissions inventory
Gridded forecast guidance products • On NWS servers: airquality.weather.gov and ftp-servers
(12km resolution, hourly for 48 hours) • On EPA servers • Updated 2x daily
Verification basis, near-real time: Ground-level AIRNow observations of surface ozone
Customer outreach/feedback • State & Local AQ forecasters coordinated with EPA • Public and Private Sector AQ constituents
CONUS, wrt 75 ppb Threshold Operational
Maintaining prediction accuracy as the warning threshold was lowered and emissions of pollutants are changing
0.98 0.99
0.80.9
1
6/1/2015 6/30/2015 7/29/2015

Performance of operational ozone predictions
4
Fraction correct for 8h daily maximum of NOAA’s operational ozone predictions for CONUS with respect to two thresholds
showing performance for May, June, July & August for each year

Evaluation of experimental CB05 NAQFC ozone predictions for 2010,
prior to emissions update
• T. Chai et al., Geosci. Model Dev., 2013 (http://www.geosci-model-dev.net/6/1831/2013/gmd-6-1831-2013.html)
• Ozone overestimation in August is larger in rural areas, during morning hours, and in the southeast US
• NO2 overestimation in August is larger at night time • Ozone biases higher on weekends, but NO2 biases higher on weekdays
5
Based on NEI 2005

NOx changes
Atlanta
Philadelphia
6
Com
pari
son
to 2
005
valu
es
Com
pari
son
to 2
005
valu
es
OMI NO2
AQS NOX NAQFC NOX Emissions
OMI = Ozone monitoring Instrument on NASA’s Aura Satellite AQS = Air Quality System
• Difference between NOx emissions used in 2012 and 2011 (blue indicates decrease in 2012).
• Mobile and nonroad emissions were updated based on projections for 2012.
Atlanta
Philadelphia
Comparison of projected emissions with surface and satellite observations shows that projected reductions from 2005 to 2012 are similar to observed (Tong et. al. Long-term NOx trends over large cities in US, Atm. Env. 2015).
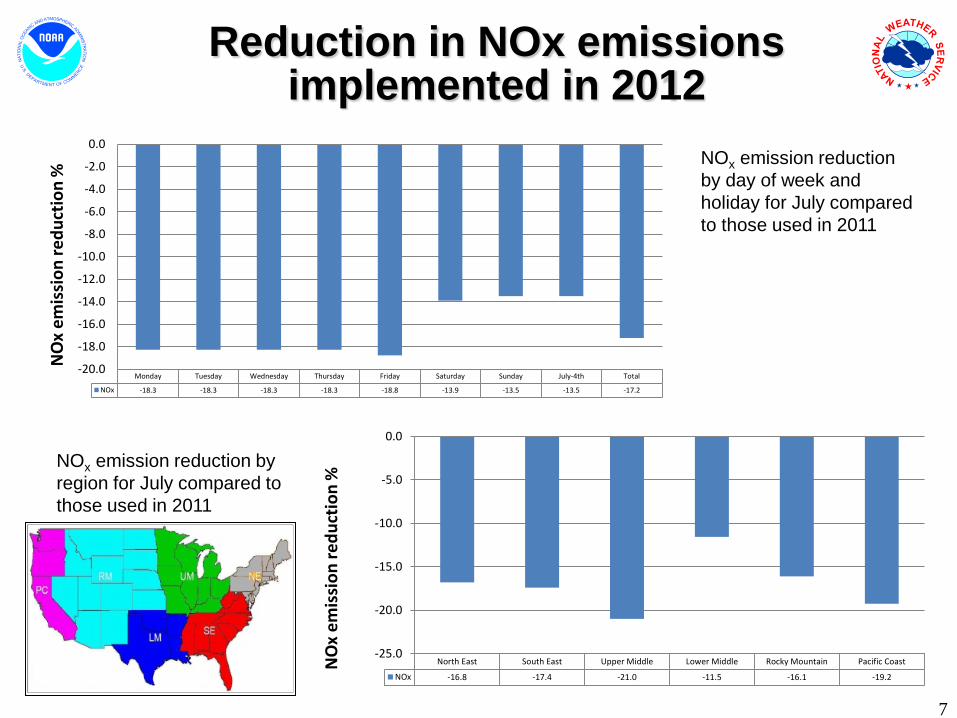
NOx emission reduction by region for July compared to those used in 2011
NOx emission reduction by day of week and holiday for July compared to those used in 2011
Reduction in NOx emissions implemented in 2012
7
Monday Tuesday Wednesday Thursday Friday Saturday Sunday July-4th Total
NOx -18.3 -18.3 -18.3 -18.3 -18.8 -13.9 -13.5 -13.5 -17.2
-20.0
-18.0
-16.0
-14.0
-12.0
-10.0
-8.0
-6.0
-4.0
-2.0
0.0
North East South East Upper Middle Lower Middle Rocky Mountain Pacific Coast
NOx -16.8 -17.4 -21.0 -11.5 -16.1 -19.2
-25.0
-20.0
-15.0
-10.0
-5.0
0.0
NO
x em
issi
on re
duct
ion
%
NO
x em
issi
on re
duct
ion
%

Impact of NOx emissions update on ozone predictions
8
Peak Ozone bias in summertime is reduced with updated emissions (Pan et. al., Assessment of NOx and Ozone forecasting performance in the US NAQFC before and after the 2012 major emissions updates, Atmospheric Environment, 2014).
NOx emission used in July 2012 are 17.2% lower than those used in July 2011
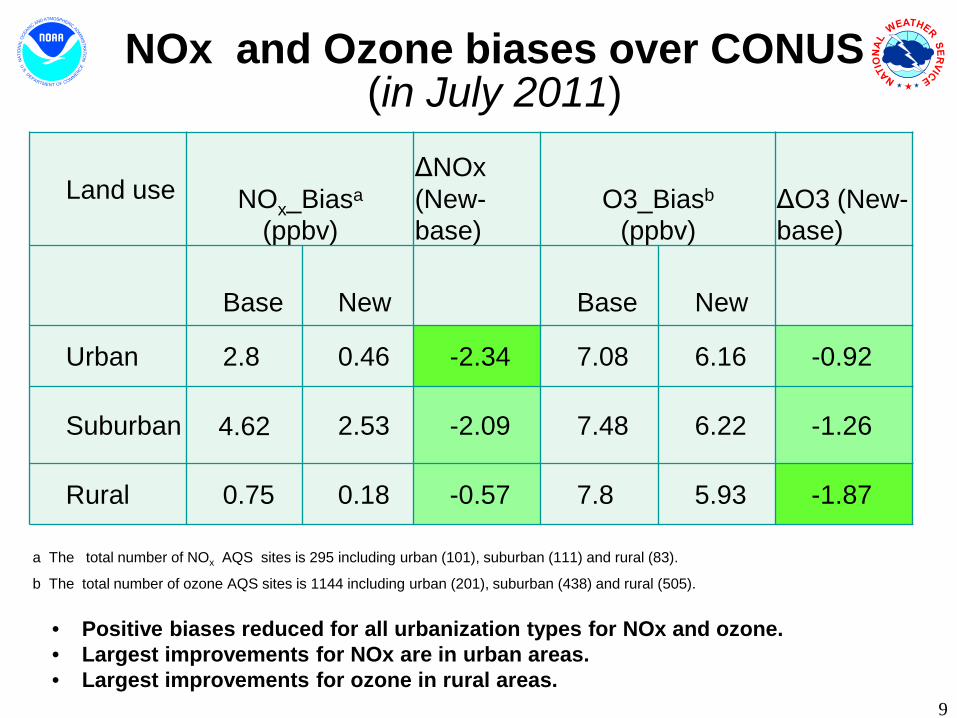
Land use NOx_Biasa
(ppbv)
ΔNOx (New-base)
O3_Biasb (ppbv)
ΔO3 (New-base)
Base
New
Base
New
Urban 2.8 0.46 -2.34 7.08 6.16 -0.92
Suburban 4.62 2.53 -2.09 7.48 6.22 -1.26
Rural 0.75 0.18 -0.57 7.8 5.93 -1.87
9
a The total number of NOx AQS sites is 295 including urban (101), suburban (111) and rural (83).
b The total number of ozone AQS sites is 1144 including urban (201), suburban (438) and rural (505).
NOx and Ozone biases over CONUS (in July 2011)
• Positive biases reduced for all urbanization types for NOx and ozone. • Largest improvements for NOx are in urban areas. • Largest improvements for ozone in rural areas.

Impacts of model and emission updates on other species
10
NO2 bias by time of the day was reduced following experimental model update in 2011 and emission update in 2012 (Courtesy: Hyun-Cheol Kim)
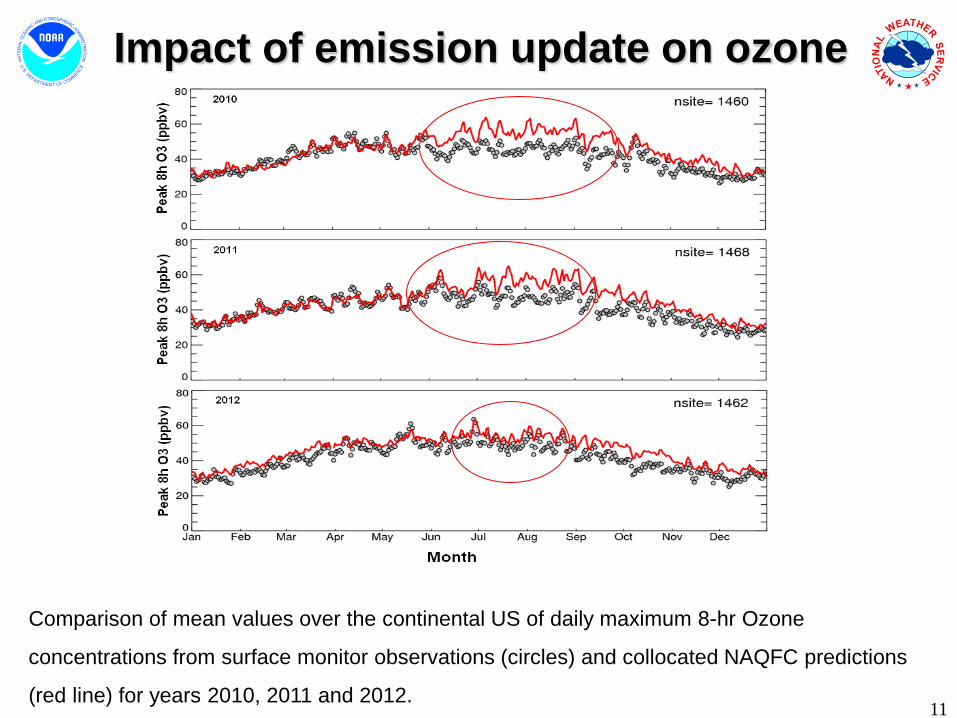
Impact of emission update on ozone
11
Comparison of mean values over the continental US of daily maximum 8-hr Ozone
concentrations from surface monitor observations (circles) and collocated NAQFC predictions
(red line) for years 2010, 2011 and 2012.

Smoke predictions • Smoke predictions for CONUS
(continental US), Alaska and Hawaii
• NESDIS provides wildfire locations
• Bluesky provides emissions estimates
• HYSPLIT model for transport, dispersion and deposition (Rolph et. al., W&F, 2009)
• Increased plume rise, decreased wet deposition, changes in daily emissions cycling
• Developed satellite product for verification (Kondragunta and Zeng)
Recent updates includes
• Automated detection of fires in Canada, Mexico and Central America
• 3-D particle model approach (rather than horizontal puffs) to properly represent the additional fires identified with automatic fire detection
Current testing includes
• Updated BlueSky System for smoke emissions
12
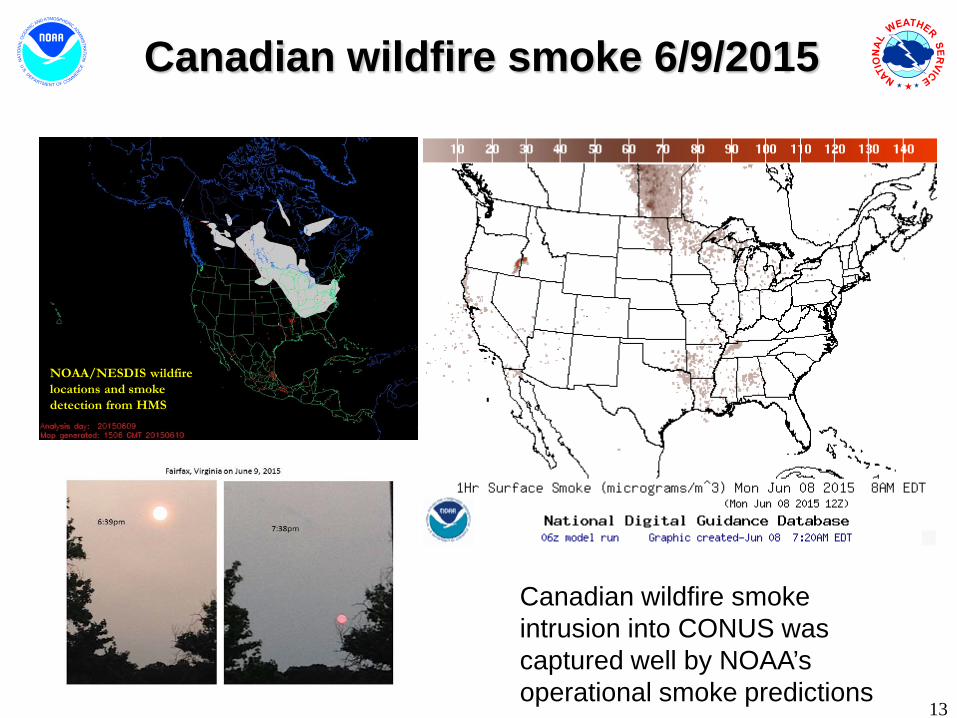
Canadian wildfire smoke 6/9/2015
13
Canadian wildfire smoke intrusion into CONUS was captured well by NOAA’s operational smoke predictions
NOAA/NESDIS wildfire locations and smoke detection from HMS

Standalone prediction of airborne dust from dust storms:
•Wind-driven dust emitted where surface winds exceed thresholds over source regions
• Source regions with emission potential estimated from MODIS deep blue climatology for 2003-2006 (Ginoux et. al. 2010).
• Emissions modulated by real-time soil moisture.
• HYSPLIT model for transport, dispersion and deposition (Draxler et al., JGR, 2010)
• Wet deposition updates in July 2013
• Developed satellite product for verification (Ciren et.al., JGR 2014)
CONUS dust predictions Operational Predictions at http://airquality.weather.gov/
14

• Improving sources for wildfire smoke and dust – in testing since summer 2014
• Chemical mechanisms eg. SOA • Meteorology eg. PBL height • Chemical boundary conditions/trans-
boundary inputs
Testing of PM2.5 predictions
Forecast challenges
AQ Forecaster Focus group access only. Test predictions produced by operational air quality system since January 2015
Aerosols over CONUS
From NEI sources only before summer 2014 • CMAQ: CB05 gases, AERO-4 aerosols • Sea salt emissions
• Seasonal prediction bias, testing bias correction post-
processing algorithm
15 NAQFC PM2.5 test predictions

Seasonal bias in PM2.5 prediction
The bias in the total mass of PM2.5 is dominated by overpredictions of unspecified PM in the winter and by underpredictions of carbon aerosols in the summer. (Foley et. al., Incremental testing of the Community Multiscale Air Quality (CMAQ) modeling system version 4.7, Geosci. Model Dev., 3, 205-226, 2010) Saylor et. al. found same type of seasonal speciation biases in the CMAQ v4.6 for IMPROVE sites.
Mean (star), median (triangle), and inter-quartile ranges of model bias (model value – observed value) for multiple fine-particle species measured at CSN sites in the 12km domain. The number of model/observation pairs for each species is shown above the x-axis.
16

Updates to CMAQ system for CONUS domain in January 2015
- Carbon Bond gas-phase Mechanisms (CB05) with updated rate constants and linkage with the particulate phase through heterogeneous reactions,
- Monthly varying lateral boundary conditions for 36 gaseous and aerosol species below 7 km altitude,
- Modified dry deposition velocity calculation,
- Planetary boundary layer height in the model constrained to be at least 50 m,
- Faster removal of organic nitrate from the atmosphere,
- Windblown dust emissions are included using threshold friction velocity and soil wetness fraction with climatological source composition and locations.
- Inclusion of particulate emissions from wild fires based on wildfire locations observed over the previous day,
- Suppression of soil emissions when terrain is covered by ice or snow,
Simplify maintenance of AQ predictions by unifying prediction code for CONUS, AK and HI.
17

18
Blowing dust event in testing of PM2.5 predictions
Independent NOAA/NESDIS analysis narrative based on satellite imagery:

Impact of forest fires in testing of PM2.5 predictions
Difference between two PM2.5 predictions: with-minus-without fire emissions
NOAA NESDIS Hazard Mapping System Fire and Smoke Analysis Detection of wildfire locations from satellite imagery

Snow/ice suppression of soil emissions
20
Case Mean (ug/m3) Bias (ug/m3) NME (%) RMSE (ug/m3) Corr. coef., r
UM Jan 2015 (data-size=650)
observations 9.42
emission updates 15.93 6.51 69 11.7 0.48
emission updates + snow/ice cover
suppression 12.52 3.1 33 8.94 0.46
UM
Current testing of CMAQ updates and near-term plans
21
• Partial update of emissions using NEI 2011 (since May 2015)
• Including lateral boundary conditions from global dust predictions
• Increased vertical resolution from 22 to 35 layers
• Testing analog forecast technique for PM2.5 bias correction (Djalalova I, Delle Monache L, Wilczak: PM2.5 analog forecast and Kalman filter post-processing for the Community Multiscale Air Quality (CMAQ) model, Atmospheric Environment, 2015)
• Update to a newer version of BlueSky smoke emission system

Bias Correction for developmental PM2.5 predictions
22
Eastern US Western US

Summary and plans
US national AQ forecasting capability:
• Operational ozone prediction nationwide; CMAQ with CB05 mechanism • Operational smoke prediction nationwide
• Operational dust prediction from CONUS sources
• Prototype CMAQ PM2.5 predictions with NEI, wildfire and dust emissions:
‾ Bias correction and linkages with global dust predictions in testing
‾ Evaluation for potential experimental (public) release.
23

Operational AQ forecast guidance airquality.weather.gov
Further information: www.nws.noaa.gov/ost/air_quality
Ozone products Nationwide since 2010
Smoke Products Nationwide since 2010 Dust Products Implemented 2012
24

Acknowledgments: AQF implementation team members
Special thanks to previous NOAA and EPA team members who contributed to the system development
NOAA/NWS/OSTI Ivanka Stajner NAQFC Manager NWS/AFSO Jannie Ferrell Outreach, Feedback NWS/OD Cynthia Jones Data Communications NWS/OSTI/MDL Jerry Gorline, Marc Saccucci, Dev. Verification, NDGD Product Development Dave Ruth NWS/OSTI Sikchya Upadhayay Program Support NESDIS/NCDC Alan Hall Product Archiving NWS/NCEP
Jeff McQueen, Jianping Huang, Ho-Chun Huang AQF model interface development, testing, & integration Jun Wang, *Sarah Lu Global dust aerosol and feedback testing *Brad Ferrier, *Eric Rogers, NAM coordination *Hui-Ya Chuang Geoff Manikin Smoke and dust product testing and integration Rebecca Cosgrove, Chris Magee NCO transition and systems testing Mike Bodner, Andrew Orrison HPC coordination and AQF webdrawer
NOAA/OAR/ARL Pius Lee, Daniel Tong, Tianfeng Chai CMAQ development, adaptation of AQ simulations for AQF Li Pan, Hyun-Cheol Kim, Youhua Tang Ariel Stein HYSPLIT adaptations
NESDIS/STAR Shobha Kondragunta Smoke and dust verification product development
NESDIS/OSDPD Liqun Ma, Mark Ruminski Production of smoke and dust verification products,
HMS product integration with smoke forecast tool
EPA/OAQPS partners:
Chet Wayland, Phil Dickerson, Brad Johns, John White AIRNow development, coordination with NAQFC
* Guest Contributors 25

Backup
26

Testing new display of AQ predictions
http://preview.weather.gov/graphical/?dataset=aq 27

Summary of Emission Data Sources for 2014
Area Sources US EPA Projected 2012 Nonroad + 2005 NEIs for other sectors; Canada 2006 Emission Inventory; Mexico 1996 EI for six border states;
Mobile Sources (onroad) 2005 NEI with Cross-State Air Pollution Rule (CSAPR) projection for US sources Canada 2006 Emission Inventory;
Point Sources (EGUs and non-EGUs) NEI 2005 for base year; Updated with 2012 Continuous Emission Monitoring (CEM) data for EGUs; Projected into forecast year using DOE Annual Energy Outlook (2014) factors;
Natural Sources Terrestrial biogenic emission: BEIS model v3.14 Sea-salt emission: CMAQ online Sea-salt emission model;
28

Removal of Bias in PM2.5 predictions
29
Unsystematic component of the RMSE (top panel) and systematic component of RMSE (bottom panel) using hourly values for the month of November evaluated at the 518 AIRNow PM2.5 sites.
Raw: Hourly AIRNow data available in real-time
PERS: Persistence forecast
7-day: 7-day running mean subtraction
KF: Kalman-filter approach
ANKF: Analog forecast technique followed by Kalman filter approach
AN: Analog Forecast technique
KF-AN: Kalman-filter approach followed by Analog forecast technique
•Quality control of the observations is essential •Five different post-processing techniques were tested
Djalalova I, Delle Monache L, Wilczak: PM2.5 analog forecast and Kalman filter post-processing for the Community Multiscale Air Quality (CMAQ) model, Atmospheric Environment, 2015.

Partnering with AQ Forecasters
Focus group, State/local AQ forecasters:
• Participate in real-time developmental testing of new capabilities, e.g. aerosol predictions
• Provide feedback on reliability, utility of test products
• Local episodes/case studies emphasis
• Regular meetings; working together with EPA’s AIRNow and NOAA
• Feedback is essential for refining/improving coordination
Examples of AQ forecaster feedback after emissions update in 2012: • In Maryland, NOAA ozone predictions have
improved since 2011: significant improvement in false alarm ratio (FAR) with some decrease in probability of detection (POD). (Laura Landry, Maryland Department of the Environment)
Updates in 2014: • In Connecticut, The late summer over-
prediction has been nearly eliminated. The CB05/AERO-4 model looks good for production. (Michael Geigert, Connecticut Department of Energy and Environmental Protection)
30
Currently evaluating updates in ozone, smoke and dust predictions and updates in testing of PM2.5 predictions