NOAA Technical Report NESDIS 142 - LP DAAC · NOAA Technical Report NESDIS 142. Visible Infrared...
49
NOAA Technical Report NESDIS 142 Visible Infrared Imaging Radiometer Suite (VIIRS) Sensor Data Record (SDR) User’s Guide Version 1.2 Washington, D.C. 10 September 2013 U.S. DEPARTMENT OF COMMERCE National Oceanic and Atmospheric Administration National Environmental Satellite, Data, and Information Service NOAA TECHNICAL REPORTS
Transcript of NOAA Technical Report NESDIS 142 - LP DAAC · NOAA Technical Report NESDIS 142. Visible Infrared...
NOAA Technical Report NESDIS 142
Visible Infrared Imaging Radiometer Suite (VIIRS) Sensor Data Record (SDR) User’s Guide Version 1.2
Washington, D.C. 10 September 2013
U.S. DEPARTMENT OF COMMERCE National Oceanic and Atmospheric Administration National Environmental Satellite, Data, and Information Service
NOAA TECHNICAL REPORTS
National Environmental Satellite, Data, and Information Service
The National Environmental Satellite, Data, and Information Service (NESDIS) manages the Nation’s civilian Earth-observing satellite systems, as well as global national data bases for meteorology, oceanography, geophysics, and solar-terrestrial sciences. From these sources, it develops and disseminates environmental data and information products critical to the protection of life and property, national defense, the national economy, energy development and distribution, global food supplies, and the development of natural resources. Publication in the NOAA Technical Report series does not preclude later publication in scientific journals in expanded or modified form. The NESDIS series of NOAA Technical Reports is a continuation of the former NESS and EDIS series of NOAA Technical Reports and the NESC and EDS series of Environmental Science Services Administration (ESSA) Technical Reports. An electronic copy of this report may be obtained at: https://cs.star.nesdis.noaa.gov/NCC/VIIRS A limited number of copies of earlier reports are available by contacting, NOAA/NESDIS/STAR, 5830 University Research Ct, Suite 2600, College Park, Maryland 20740, Phone: 301 683-3490. A partial listing of more recent reports appears below: NESDIS 111 An Algorithm for Correction of Lunar Contamination in AMSU-A Data. Seiichiro Kigawa
and Tsan Mo, December 2002. NESDIS 112 Sampling Errors of the Global Mean Sea Level Derived from TOPEX/Poseidon Altimetry.
Chang-Kou Tai and Carl Wagner, December 2002. NESDIS 113 Proceedings of the International GODAR Review Meeting: Abstracts. Sponsors:
Intergovernmental Oceanographic Commission, U.S. National Oceanic and Atmospheric Administration, and the European Community, May 2003.
NESDIS 114 Satellite Rainfall Estimation Over South America: Evaluation of Two Major Events. Daniel A. Vila, Roderick A. Scofield, Robert J. Kuligowski, and J. Clay Davenport, May 2003.
NESDIS 115 Imager and Sounder Radiance and Product Validations for the GOES-12 Science Test. Donald W. Hillger, Timothy J. Schmit, and Jamie M. Daniels, September 2003.
NESDIS 116 Microwave Humidity Sounder Calibration Algorithm. Tsan Mo and Kenneth Jarva, October 2004.
NESDIS 117 Building Profile Plankton Databases for Climate and EcoSystem Research. Sydney Levitus, Satoshi Sato, Catherine Maillard, Nick Mikhailov, Pat Cadwell, Harry Dooley, June 2005.
NESDIS 118 Simultaneous Nadir Overpasses for NOAA-6 to NOAA-17 Satellites from 1980 and 2003 for the Intersatellite Calibration of Radiometers. Changyong Cao, Pubu Ciren, August 2005.
NESDIS 119 Calibration and Validation of NOAA 18 Instruments. Fuzhong Weng and Tsan Mo, December 2005.
NESDIS 120 The NOAA/NESDIS/ORA Windsat Calibration/Validation Collocation Database. Laurence Connor, February 2006.
NESDIS 121 Calibration of the Advanced Microwave Sounding Unit-A Radiometer for METOP-A. Tsan Mo, August 2006.
NOAA Technical Report NESDIS 142 Visible Infrared Imaging Radiometer Suite (VIIRS) Sensor Data Record (SDR) User’s Guide Version 1.2 Changyong Cao1, Xiaoxiong (Jack) Xiong2, Robert Wolfe2, Frank DeLuccia3, Quanhua (Mark) Liu1, Slawomir Blonski1, Guoqing (Gary) Lin2, Masahiro Nishihama2, Dave Pogorzala1, Hassan Oudrari2, and Don Hillger1 1NOAA/NESDIS/STAR College Park, MD 20740 2NASA/GSFC Greenbelt, MD 20771 3The Aerospace Corporation Los Angeles, CA 90009 Washington, DC September 2013
U.S. DEPARTMENT OF COMMERCE John Bryson, Secretary National Oceanic and Atmospheric Administration Dr. Jane Lubchenco, Under Secretary of Commerce for Oceans and Atmosphere and NOAA Administrator National Environmental Satellite, Data, and Information Service Mary Kicza, Assistant Administrator
iv
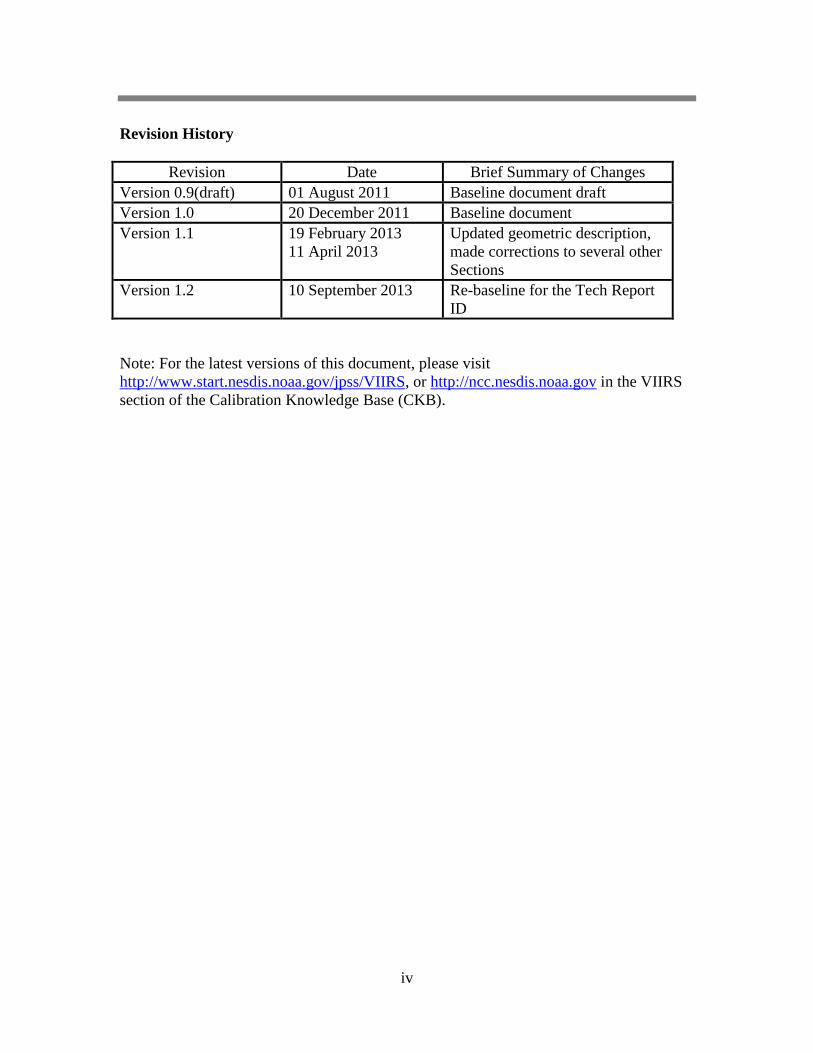
Revision History
Revision Date Brief Summary of Changes Version 0.9(draft) 01 August 2011 Baseline document draft Version 1.0 20 December 2011 Baseline document Version 1.1 19 February 2013
11 April 2013 Updated geometric description, made corrections to several other Sections
Version 1.2 10 September 2013 Re-baseline for the Tech Report ID
Note: For the latest versions of this document, please visit http://www.start.nesdis.noaa.gov/jpss/VIIRS, or http://ncc.nesdis.noaa.gov in the VIIRS section of the Calibration Knowledge Base (CKB).
i
1. INTRODUCTION..................................................................................................... 1
1.1 PURPOSE OF THIS GUIDE ...................................................................................... 2 1.2 VIIRS HERITAGE ................................................................................................. 2
2. AN OVERVIEW OF THE VIIRS INSTRUMENT ............................................... 4
2.1 VIIRS DESIGN ..................................................................................................... 4 2.1.1 VIIRS Special Geometric Features ................................................................. 7
2.2 VIIRS SPECTRAL BANDS ..................................................................................... 9 2.3 VIIRS ONBOARD CALIBRATION AND RADIOMETRIC PERFORMANCE................. 11 2.4 VIIRS POSTLAUNCH CALIBRATION/VALIDATION .............................................. 13
3. VIIRS DATA RECORDS....................................................................................... 15
3.1 RAW DATA RECORDS (RDR) ............................................................................. 15 3.2 SENSOR DATA RECORDS (SDR)......................................................................... 16 3.3 ENVIRONMENTAL DATA RECORDS (EDR) ......................................................... 17 3.4 QUALITY FLAGS, GRANULE AND AGGREGATION-LEVEL METADATA ................. 18
4. DATA PROCESSING AND RADIOMETRIC CALIBRATION ...................... 20
4.1 DATA PROCESSING FLOW .................................................................................. 21 4.1.1 SDR Algorithms Overview ............................................................................ 22 4.1.2 Calibration Algorithms and Coefficients for the TEBs ................................. 22 4.1.3 Calibration Algorithms and Coefficients for the RSBs ................................. 24 4.1.4 Day-Night-Band (DNB) ................................................................................ 26
4.2 LOOK UP TABLES (LUTS).................................................................................. 27
5. GEOLOCATION AND GEOMETRIC PERFORMANCE ............................... 28
5.1 GEOLOCATION ALGORITHM ............................................................................... 28 5.2 BAND-TO-BAND REGISTRATION (BBR) ............................................................. 31 5.3 SPATIAL RESPONSE, SPATIAL RESOLUTION, AND IMAGE QUALITY .................... 32
6. DATA DISTRIBUTION, ACCESS, AND DISPLAY .......................................... 35
6.1 DISTRIBUTION AND ACCESS ............................................................................... 35 6.2 DATA FILES AND SOFTWARE TOOLS .................................................................. 35 6.3 DIRECT READOUT (DRO) .................................................................................. 36
7. REFERENCES ........................................................................................................ 37
8. ACKNOWLEDGEMENTS ................................................................................... 38
9. APPENDIX: ACRONYMS (AND ABBREVIATIONS) USED IN THIS REPORT .......................................................................................................................... 39

1
1. Introduction
The Joint Polar Satellite System (JPSS) is our nation's next generation polar-orbiting operational environmental satellite system, procured by the National Oceanic and Atmospheric Administration (NOAA) through the National Aeronautics and Space Administration (NASA). JPSS will provide continuity of critical observations for accurate weather forecasting, reliable severe storm outlooks, global measurements of atmospheric, oceanic, and land surface variables such as atmospheric temperature and water vapor profiles, clouds, sea surface temperatures, vegetation, fire, aerosols, ocean color, and others.
The JPSS was established in year 2010 as a result of restructuring the National Polar-orbiting Operational Environmental Satellite System (NPOESS), to provide the continuity for NOAA’s polar-orbiting operational environmental satellite system (POES). As a result of the restructuring, NOAA and NASA were instructed by the U.S. President’s Office of Science and Technology to develop a mission that addresses afternoon orbit (~1:30 PM local equator crossing time at ascending node) data collection with a 16-day repeat cycle, while the EUMETSAT is responsible for the mid-morning orbit with their MetOp series which carry both NOAA and EUMETSAT instruments, and the U.S. Department of Defense (DoD) would be responsible for the early morning orbit. Development and subsequent operation of a shared Common Ground System (CGS) will supersede the Interface Data Processing Segment (IDPS) while the IDPS continues uninterrupted before the CGS takes over. In the early days of planning for NPOESS, it was deemed appropriate and necessary to perform a risk-reduction in the development, implementation, launch, and operation of the NPOESS through its Preparatory Project (NPP). The NPP satellite was declared operational, rather than risk-reduction as originally planned in order to bridge the mission gaps due to schedule delays, and was renamed the Suomi National Polar-orbiting Partnership (S-NPP) after successful launch and early on-orbit checkout. S-NPP provides an opportunity to demonstrate and validate new instruments and data processing algorithms, as well as to demonstrate and validate aspects of the JPSS command, control, communications, and ground processing capabilities prior to the launch of the first JPSS spacecraft. Upon successful achievement of orbit, NASA conducts an engineering evaluation and checkout of each satellite. During the instrument checkout and intensive calibration and validation (cal/val) periods, the NASA and NOAA teams work together to analyze engineering data to verify that the instrument performance meets the specifications. Upon completion of testing, the satellite is turned over to NOAA for routine operations providing data to the numerical weather predictions and other user communities 24 hours a day, 7 days a week un-interrupted. The Visible Infrared Imaging Radiometer Suite (VIIRS) is one of the five major Earth observing instruments onboard S-NPP and JPSS. The VIIRS observations primarily focus on clouds and Earth surface variables, while the other instruments (CrIS, OMPS, ATMS, and CERES) are designed mainly to measure atmospheric variables and earth radiation budget. The VIIRS provides two “Key Performance Parameters” (KPP) based
2
on the Integrated Operational Requirements Document (IORD) II. These two KPPs are Sea Surface Temperature (SST) and Imagery.
1.1 Purpose of this Guide This VIIRS Sensor Data Record User’s Guide (hereinafter referred to as the User’s Guide) is intended for users of the Sensor Data Records (SDR) generated from the VIIRS. It provides a general introduction to the VIIRS instrument, data products, format, content, and their applications. It also serves as a reference to more detailed technical documents on VIIRS such as the Algorithm Theoretical Basis Documents (ATBDs) for radiometric and geolocation calibration algorithms as listed in the reference section [1-4]. This User’s Guide is intended for the VIIRS instrument as-built onboard the S-NPP satellite. Technical data may be updated for VIIRS onboard the JPSS satellites in the future.
1.2 VIIRS Heritage VIIRS was developed based on a long heritage of legacy operational and research instruments, which dates back as early as the late 1970s. Key heritage instruments include:
• Advanced Very-high Resolution Radiometer (AVHRR) on NOAA’s Polar-orbiting Environmental Satellites (POES).
• Moderate-resolution Imaging Spectroradiometer (MODIS) on NASA’s Earth Observing System (EOS) satellites.
• Sea-viewing Wide Field-of-view Sensor (SeaWiFS) on GeoEye’s SeaStar satellite.
• Operational Linescan System (OLS) on DoD’s Defense Meteorological Satellite Program (DMSP) satellites.
The AVHRR on NOAA satellites consists of visible/near-infrared and thermal infrared bands originally designed to detect clouds and the surface properties. Over the years applications have been expanded to include a large number of quantitative environmental products including sea surface temperature, vegetation index, aerosols, fire and smoke, as well as for climate data records using its long time series. The first AVHRR was launched on TIROS-N in 1978 with a 4-channel radiometer. It was subsequently improved to a 5-channel instrument (AVHRR/2) that was initially carried on NOAA-7 (launched June 1981). The latest version AVHRR/3 has 6 channels, first carried on NOAA-15 launched in May 1998. However, data from only 5 channels can be obtained at any given time due to its legacy design in the onboard processing system, by switching between the near-infrared and shortwave infrared channels. Despite what the name suggests, the AVHRR is a traditional radiometer with a single detector for each channel, a simple design that has served us well for over three decades. A major drawback of the AVHRR design is the
3
image rotation towards large scan angles due to the use of the 45° scan mirror. The early AVHRRs observed the Earth in early morning (~7:30am) and afternoon (~1:30pm) orbits. Starting with NOAA-17 in 2002, followed by the MetOp series, the early morning orbit was changed to a mid-morning orbit. The NOAA satellite orbits are not tightly controlled, which led to the orbital drift and related problems over the mission life. The MODIS is a key instrument aboard the mid-morning Terra and afternoon Aqua satellites. With 36 spectral bands (“bands” are synonymous with “channels” used in the AVHRR) from 0.412 µm to 14.235 µm, MODIS represents a major step forward in Earth observations. Other improvements included the fine spatial resolution (up to 250 m) at nadir (compared to the 1 km of AVHRR). The MODIS onboard calibration devices significantly improved the accuracy of the measurements which in turn enabled a number of quantitative products. The Terra and Aqua spacecraft orbits are tightly controlled which avoids the orbital drift and related problems such as those for NOAA satellites. The VIIRS design was largely built upon the success of MODIS with similar features. Major improvements include pixel size control in the scan direction, the lack of sounding bands for VIIRS, the use of a rotating telescope to reduce the response-versus-scan-angle (RVS) variation and to control straylight and polarization effects, and the addition of a panchromatic Day-Night-Band (DNB). The SeaWiFS is a follow-on experiment to the Coastal Zone Color Scanner on Nimbus 7. SeaWiFS began scientific operations on 18 September 1997 and stopped collecting data on 11 December 2010. The sensor spatial resolution is 1.1 km for local area coverage (LAC), and 4.5 km for global area coverage (GAC). It has 8 spectral bands from 0.402 to 0.885 µm. The instrument was specifically designed to monitor ocean characteristics such as chlorophyll-a concentration and water clarity. It was able to tilt up to 20° to avoid sun-glint from the sea surface. This feature is important at equatorial latitudes where glint from sunlight often obscures water color. SeaWiFS had used the Marine Optical Buoy (MOBY) for vicarious calibration. The SeaWiFS instrument uses a rotating telescope and a half-angle mirror which became the heritage design of VIIRS. This configuration permits a minimum level of polarization without field-of-view rotation, over the maximum scan angle of 58.3°. The absence of field-of-view rotation permits the use of a multichannel, time-delay and integration (TDI) processing in each of the eight spectral bands to achieve the required signal-to-noise ratio (SNR). The SeaWiFS Mission is an industry/government partnership, with NASA's Ocean Biology Processing Group at Goddard Space Flight Center having responsibility for the data collection, processing, calibration, validation, archive and distribution. The OLS on DMSP is the operational visible/infrared scanner for the DoD. It consists of two telescopes, one scanning in the visible/near-infrared portion of the spectrum (0.59-0.91 µm), and the other in the infrared region (10.3-12.9 µm). For purposes of night time lightning detection, the visible sensor is used in conjunction with a photomultiplier tube
4
(PMT). The OLS scans across the ground track with a resolution of 2.7 km when used with the PMT. The unique strengths of OLS are controlled growth in spatial resolution through the use of segmented detectors and rotation of the ground instantaneous field of view (GIFOV) and the use of a low-level light sensor (LLLS) capable of detecting visible lights at night. OLS has primarily served as a data source for manual analysis of imagery. The VIIRS DNB is designed based on OLS with enhanced capabilities and functions.
2. An Overview of the VIIRS Instrument 2.1 VIIRS Design The VIIRS instrument is a whiskbroom scanning radiometer with a field of regard of 112.56o in the cross-track direction. At a nominal altitude of 829 km, the swath width is 3060 km, providing full daily coverage both in the day and night side of the Earth. VIIRS has 22 spectral bands covering the spectrum between 0.412 µm and 12.01 µm, including 16 moderate resolution bands (M-bands) with a spatial resolution of 750 m at nadir, 5 imaging resolution bands (I-bands) – 375 m at nadir, and one panchromatic DNB with a 750 m spatial resolution throughout the scan. The M-bands include 11 Reflective Solar Bands (RSB) and 5 Thermal Emissive Bands (TEBs). The I-bands include 3 RSBs and 2 TEBs. VIIRS uses six dual-gain RSBs with a wide dynamic range needed for ocean color applications, at the same time without saturating the sensor when observing high reflectance surfaces such as land and clouds. The dynamic range of the dual gain bands in high gain is comparable to that of the MODIS ocean color bands, while the dynamic range in the low-gain state is comparable to those of the similar MODIS land bands. The dynamic ranges across all other bands are similar to their MODIS counterparts. VIIRS also has a dual-gain TEB for fire detection. VIIRS uses a unique approach of pixel aggregation which controls the pixel growth towards the end of the scan – a problem that exists for MODIS, AVHRR, and other instruments. As a result, the VIIRS spatial resolutions for nadir and edge-of-scan data are more comparable. To save transmission bandwidth, VIIRS also uses a “bow-tie removal” approach that removes duplicated pixels in the off-nadir areas where there is an overlap of several pixels between adjacent scans. This however does introduce visual artifacts in the raw image due to the aggregation and removal of duplicated pixels beyond mid-scan on each side. These artifacts can be removed through interpolation when the image is displayed. As noted earlier, the heritage of the rotating telescope design of VIIRS came from the SeaWiFS, which provides better straylight control at high scan angles, while at the same time reduces the response vs. scan angle effects that MODIS has (paddle mirror on MODIS vs. half angle mirror on VIIRS). The higher S-NPP and JPSS orbits (824 km, vs. 705 km nominal altitude for EOS MODIS platforms) allows full global coverage in one day but also requires better straylight control. Figure 1 shows a block diagram and the
5
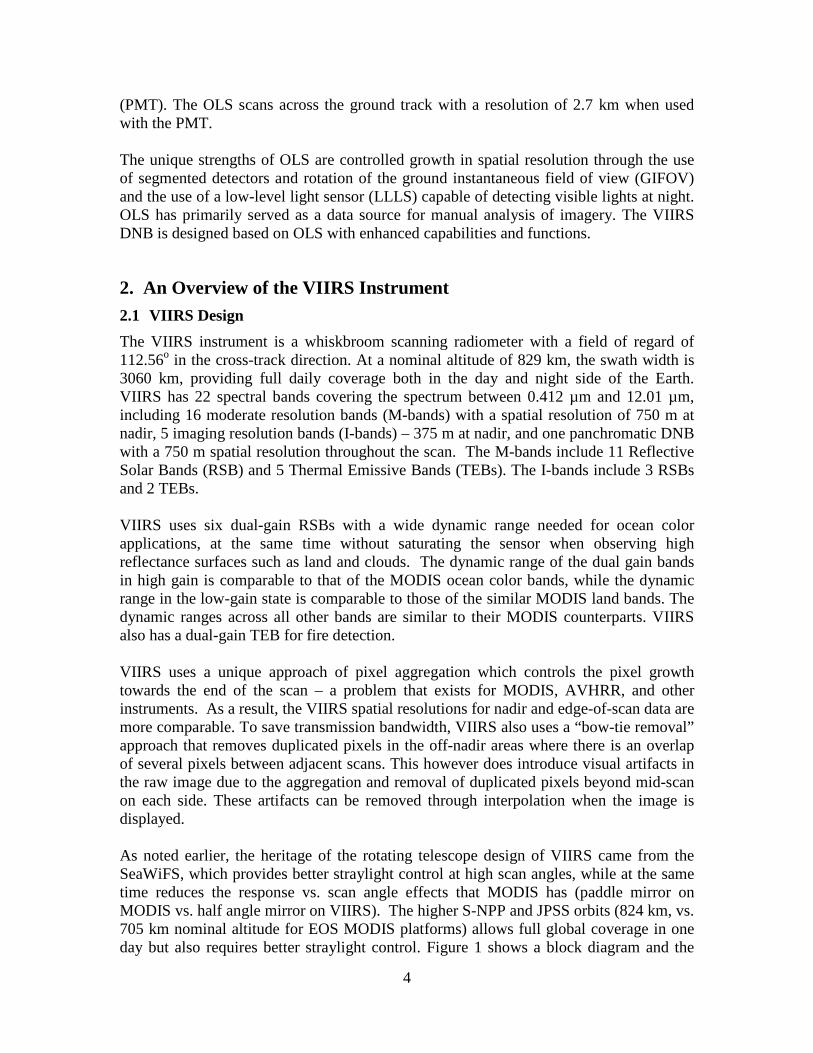
major components of the VIIRS sensor. A brief discussion is provided here as an introduction to the instrument design. More details can be found in the VIIRS design review documents.
(a) Block Diagram
(a) Components
Figure 1. The VIIRS Instrument (source: Gleason et al. [14]) Reflected and emitted radiation from the Earth enters the sensor through the Rotating Telescope Assembly (RTA) and is reflected from a rotating Half Angle Mirror (HAM) into a stationary aft-optics subsystem. The light is then spectrally and spatially separated by dichroic beamsplitters and directed to three separate focal plane assemblies (FPAs): the Visible/Near Infrared (VisNIR) FPA, the Shortwave/Midwave Infrared (SW/MWIR)
6
FPA, and the Longwave Infrared (LWIR) FPA. The VisNIR FPA is at instrument ambient temperature while the SW/MWIR and LWIR FPAs are cooled down to 80 K. The light is detected and converted to analog electrical signals in these FPAs and further processed prior to analog-to-digital (A/D) conversion with 12-bit quantization. The digital signals are then processed and multiplexed into the instrument output data stream. Housekeeping data in the form of instrument health, safety, and engineering telemetry are also generated from measurements of internal temperatures, voltages, and currents. These telemetry measurements are reported for every scan.
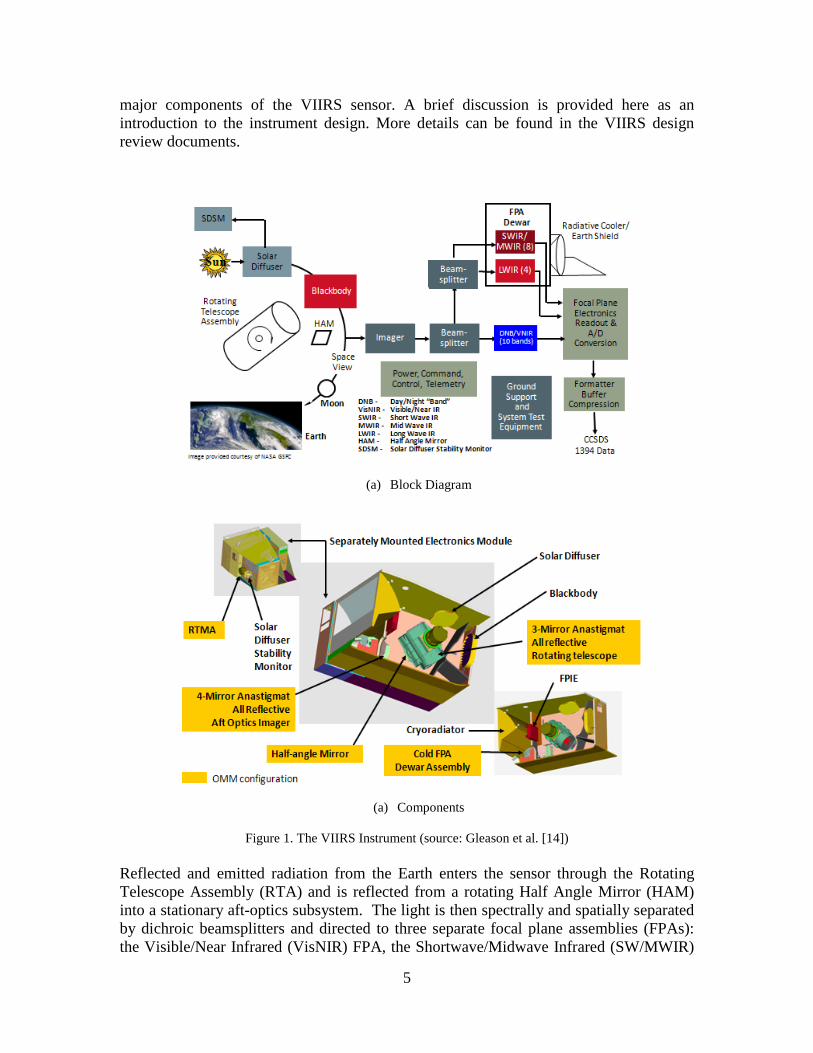
The panchromatic DNB, with a spectral coverage from 0.50 µm to 0.90 µm, shares the same optical path with the Vis/NIR FPA but uses a unique detector technology. DNB measures night lights, reflected solar and/or moon lights with a large dynamic range of 45,000,000:1, which allows the detection of reflected signals from as low as quarter moon illumination to the brightest daylight. To achieve this large dynamic range it uses four charge-coupled device (CCD) arrays in three gain stages. The band maintains a nearly constant 750 m resolution over the entire 3000 km swath using an on-board aggregation scheme. As is discussed later, this also makes the calibration of the DNB band a challenge.
Figure 2. VIIRS Scan Views (The number of samples in the Space, SD and BB views are for M-bands and
DNB, the number for I-bands is doubled)
Scan rate 1.779 sec/rev 202.3 deg/sec
Half-Angle Mirror side change
-134.01°
Solar Diffuser View 158.575° to 159.425°
48 samples/det
Blackbody View99.575° to 100.425°
48 samples/det
Space View-66.10° to -65.25°48 samples/det
56.28° 56.28°
+56.28°Scan angles
relative to Nadir
-56.28°
Earth View ±56.28°
DNB: 4064 pixels at 0.149 to 0.894 mrad/pixel
Nadir
M bands: 6304 samples at 0.312 mrad/sample (3200 aggregated pixels)
I bands: 12608 samples at 0.156 mrad/sample (6400 aggregated pixels)
7
The four VIIRS scan “views” are shown in Figure 2. A scan starts from the Earth view (EV), and then to the onboard calibrators of blackbody, solar diffuser, and space views (SVs). The half angle mirror changes side between the solar diffuser and SVs. The EV scan angle range is +/- 56.28⁰ from nadir. VIIRS is calibrated every scan-line for the TEBs, while the RSB calibration relies on the solar illumination in part of the orbit. Calibration related data are stored in the Onboard Calibration (OBC) Intermediate Product (IP) files which together with the calibration Look Up Tables (LUT) are used for radiometric calibration. Spacecraft ephemeris and attitude data reported once a second is combined into raw data stream for geolocation calculation.
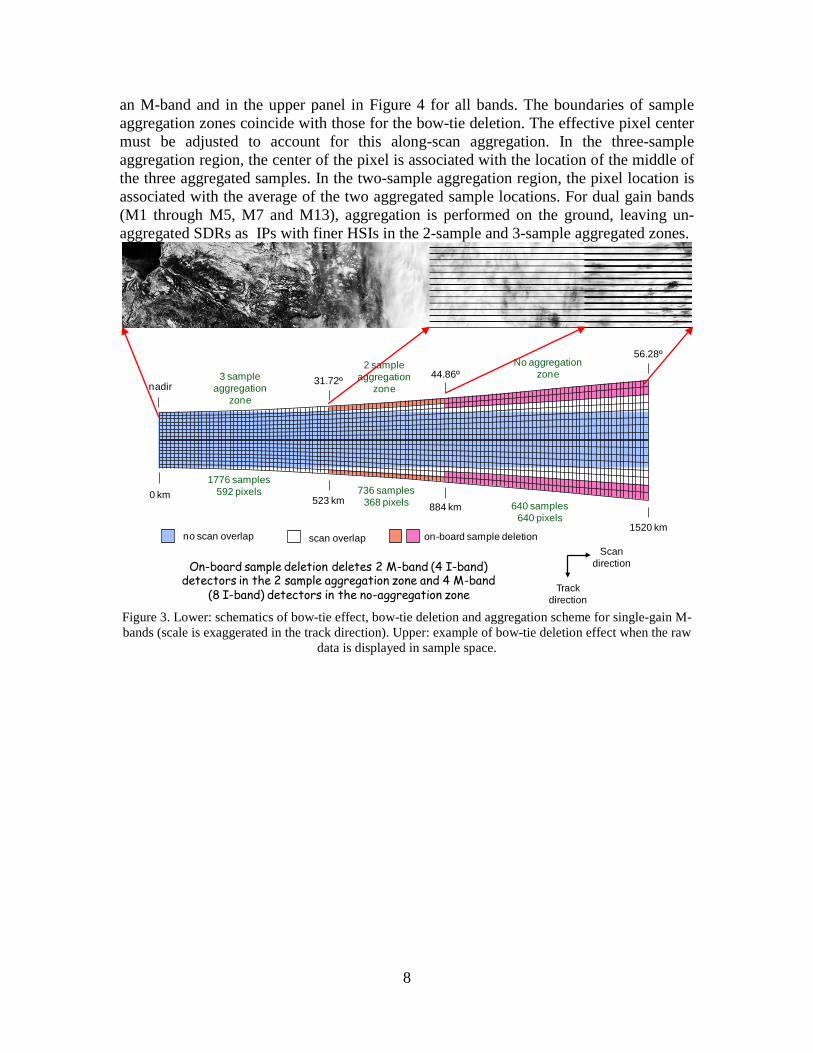
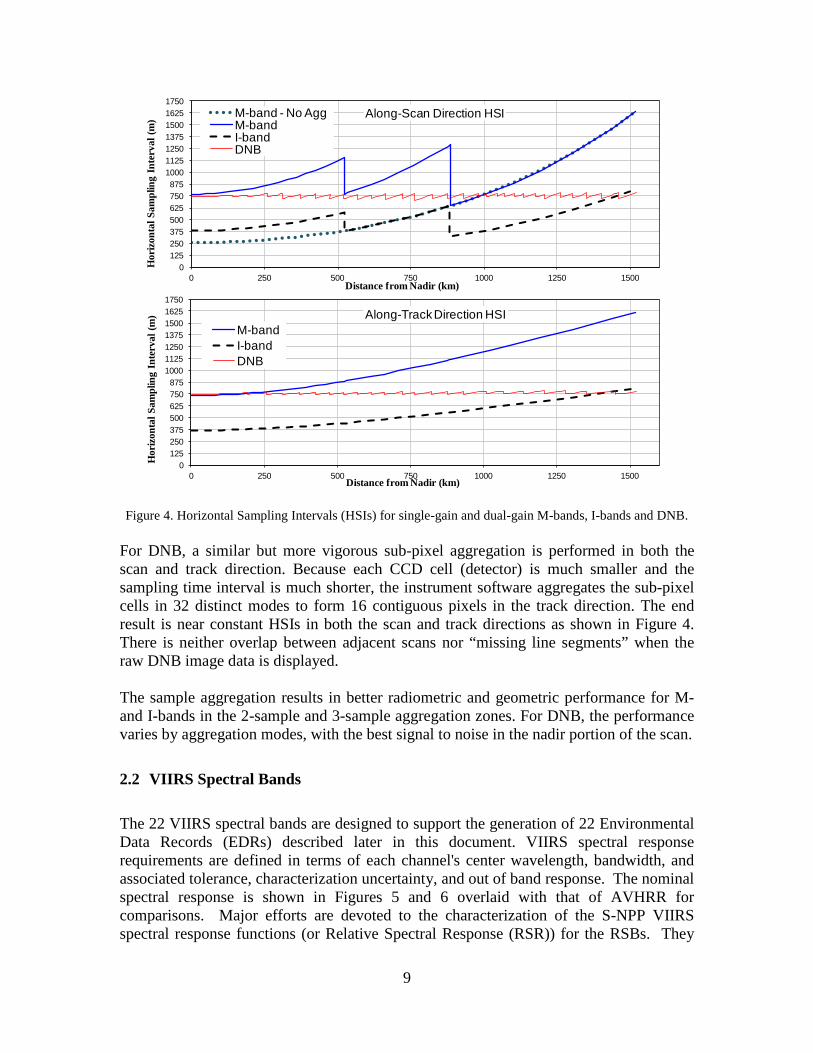
2.1.1 VIIRS Special Geometric Features The VIIRS instrument design draws from those of the heritage moderate resolution instruments with a few notable improvements from the geometric perspective. These special geometric features are introduced below. Each VIIRS M-band has 16 detectors (I-band with 32 detectors) in the along-track direction. These detectors are rectangular in shape with the smaller dimension in the along scan direction. The design takes into account the different pixel growth rates in the scan and track directions. As RTA scans the Earth, these detectors sweep out a swath between scan angles -56.28° and +56.28°. The detector size and scan timing are designed such that under nominal conditions the scan width at nadir is the same as the traveling distance of the sub-satellite point in one scan period, leaving no gap between adjacent scans. Because VIIRS detector spacing is constant, the angular sampling interval (ASI) is constant. However, the corresponding horizontal sampling interval (HSI), or ground sample distance, in the along-track direction grows as the scan angle moves away from nadir, mainly due to the increased distance between the sensor and the ground, as shown in the lower panel in Figure 4. The scan width increases from 11.7 km at nadir to 25.8 km at the end of scan due to this panoramic effect, called the "bow-tie" effect. The bow-tie effect leads to scan-to-scan overlap, which start to show visibly at scan angles greater than approximately 19°, as shown in the lower panel in Figure 3. The size of overlap is more than 1 and 2 M-band pixels at scan angle greater than 31.72° and 44.86°, respectively. To save the downlink bandwidth, the radiometric readings from these pixels are not transmitted to the ground and will be assigned fill values by the ground software. This is called “bow-tie deletion”. As a result, visual artifact of “missing scan line segments” shows up in raw images if the data is displayed in sample space, as shown in the example (upper panel in Figure 3). This artifact does not appear when the image is displayed when the scan is projected (gridded) onto the Earth’s surface. In the scan (cross-track) direction, the constant sampling time interval also results in the growth of HSI as a function of scan angle. The HSI change in the cross-track direction is even larger than that in the along-track direction because it is affected by the Earth’s curvature in addition to the increased range between the sensor and the ground. This is shown by the dotted line for the un-aggregated M-band in the upper panel in Figure 4. To minimize variation of the HSI in the scan direction, there are three pixel aggregation modes in the along-scan direction, as shown in the lower panel in Figure 3 for the case of
8
an M-band and in the upper panel in Figure 4 for all bands. The boundaries of sample aggregation zones coincide with those for the bow-tie deletion. The effective pixel center must be adjusted to account for this along-scan aggregation. In the three-sample aggregation region, the center of the pixel is associated with the location of the middle of the three aggregated samples. In the two-sample aggregation region, the pixel location is associated with the average of the two aggregated sample locations. For dual gain bands (M1 through M5, M7 and M13), aggregation is performed on the ground, leaving un-aggregated SDRs as IPs with finer HSIs in the 2-sample and 3-sample aggregated zones.
Figure 3. Lower: schematics of bow-tie effect, bow-tie deletion and aggregation scheme for single-gain M-bands (scale is exaggerated in the track direction). Upper: example of bow-tie deletion effect when the raw
data is displayed in sample space.
nadir 31.72º 44.86º
56.28º
0 km 523 km 884 km
1520 km
3 sample aggregation
zone
No aggregation zone
2 sample aggregation
zone
no scan overlap scan overlap on-board sample deletionScan
direction
Track direction
On-board sample deletion deletes 2 M-band (4 I-band) detectors in the 2 sample aggregation zone and 4 M-band
(8 I-band) detectors in the no-aggregation zone
1776 samples 592 pixels 736 samples
368 pixels 640 samples 640 pixels
9
Figure 4. Horizontal Sampling Intervals (HSIs) for single-gain and dual-gain M-bands, I-bands and DNB.
For DNB, a similar but more vigorous sub-pixel aggregation is performed in both the scan and track direction. Because each CCD cell (detector) is much smaller and the sampling time interval is much shorter, the instrument software aggregates the sub-pixel cells in 32 distinct modes to form 16 contiguous pixels in the track direction. The end result is near constant HSIs in both the scan and track directions as shown in Figure 4. There is neither overlap between adjacent scans nor “missing line segments” when the raw DNB image data is displayed. The sample aggregation results in better radiometric and geometric performance for M- and I-bands in the 2-sample and 3-sample aggregation zones. For DNB, the performance varies by aggregation modes, with the best signal to noise in the nadir portion of the scan.
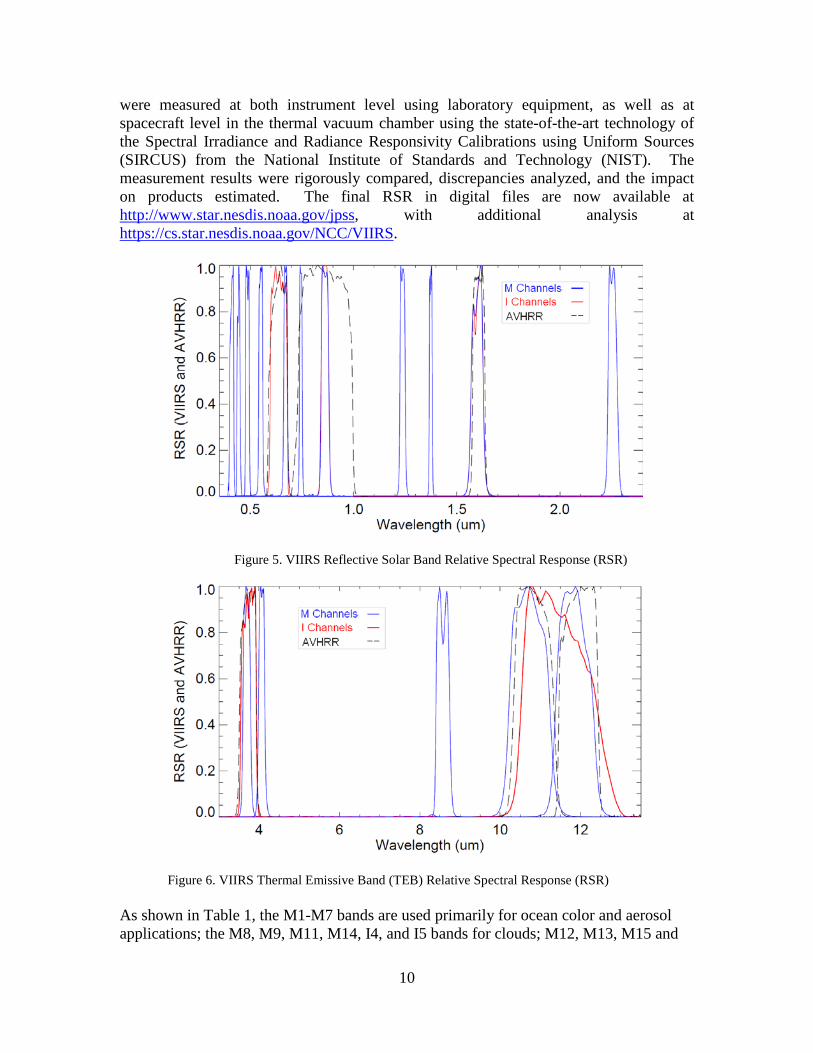
2.2 VIIRS Spectral Bands The 22 VIIRS spectral bands are designed to support the generation of 22 Environmental Data Records (EDRs) described later in this document. VIIRS spectral response requirements are defined in terms of each channel's center wavelength, bandwidth, and associated tolerance, characterization uncertainty, and out of band response. The nominal spectral response is shown in Figures 5 and 6 overlaid with that of AVHRR for comparisons. Major efforts are devoted to the characterization of the S-NPP VIIRS spectral response functions (or Relative Spectral Response (RSR)) for the RSBs. They
0125250375500625750875
1000112512501375150016251750
0 250 500 750 1000 1250 1500
Hor
izon
tal S
ampl
ing
Inte
rval
(m)
Distance from Nadir (km)
Along-Scan Direction HSIM-band - No AggM-bandI-bandDNB
0125250375500625750875
1000112512501375150016251750
0 250 500 750 1000 1250 1500
Hor
izon
tal S
ampl
ing
Inte
rval
(m)
Distance from Nadir (km)
Along-Track Direction HSIM-bandI-bandDNB
10
were measured at both instrument level using laboratory equipment, as well as at spacecraft level in the thermal vacuum chamber using the state-of-the-art technology of the Spectral Irradiance and Radiance Responsivity Calibrations using Uniform Sources (SIRCUS) from the National Institute of Standards and Technology (NIST). The measurement results were rigorously compared, discrepancies analyzed, and the impact on products estimated. The final RSR in digital files are now available at http://www.star.nesdis.noaa.gov/jpss, with additional analysis at https://cs.star.nesdis.noaa.gov/NCC/VIIRS.
Figure 5. VIIRS Reflective Solar Band Relative Spectral Response (RSR)
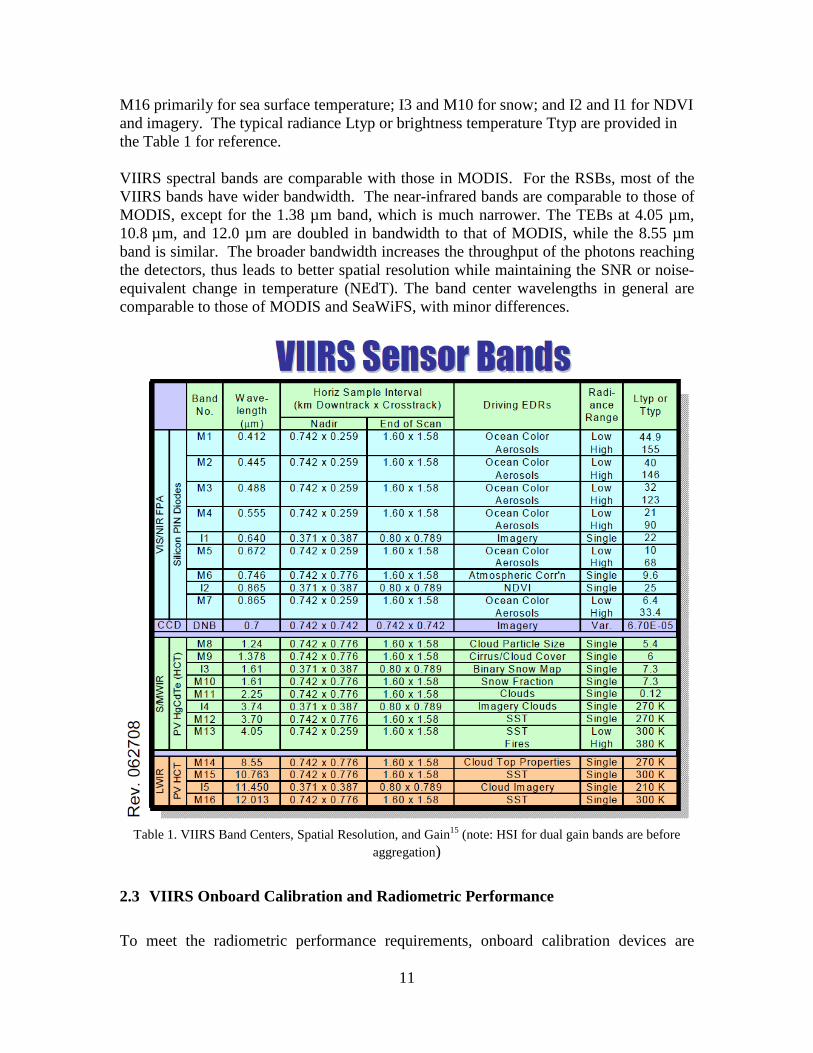
Figure 6. VIIRS Thermal Emissive Band (TEB) Relative Spectral Response (RSR) As shown in Table 1, the M1-M7 bands are used primarily for ocean color and aerosol applications; the M8, M9, M11, M14, I4, and I5 bands for clouds; M12, M13, M15 and
11
M16 primarily for sea surface temperature; I3 and M10 for snow; and I2 and I1 for NDVI and imagery. The typical radiance Ltyp or brightness temperature Ttyp are provided in the Table 1 for reference. VIIRS spectral bands are comparable with those in MODIS. For the RSBs, most of the VIIRS bands have wider bandwidth. The near-infrared bands are comparable to those of MODIS, except for the 1.38 µm band, which is much narrower. The TEBs at 4.05 µm, 10.8 µm, and 12.0 µm are doubled in bandwidth to that of MODIS, while the 8.55 µm band is similar. The broader bandwidth increases the throughput of the photons reaching the detectors, thus leads to better spatial resolution while maintaining the SNR or noise-equivalent change in temperature (NEdT). The band center wavelengths in general are comparable to those of MODIS and SeaWiFS, with minor differences.
Table 1. VIIRS Band Centers, Spatial Resolution, and Gain15 (note: HSI for dual gain bands are before
aggregation) 2.3 VIIRS Onboard Calibration and Radiometric Performance To meet the radiometric performance requirements, onboard calibration devices are
12
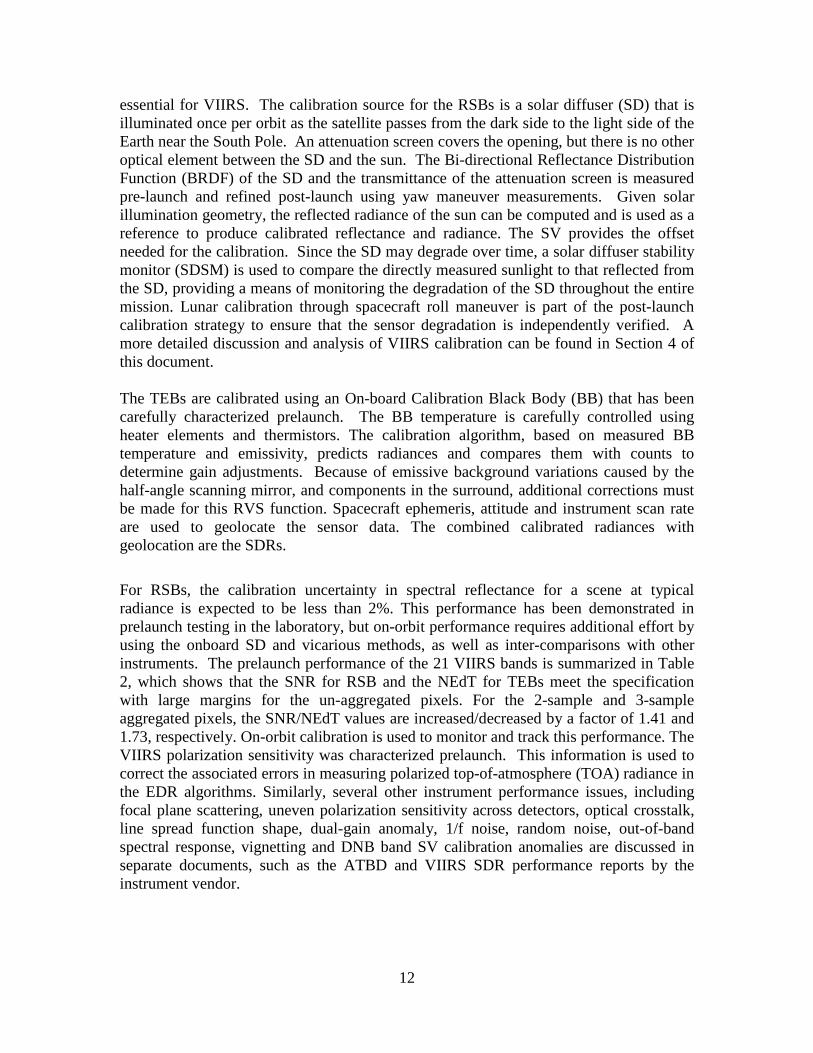
essential for VIIRS. The calibration source for the RSBs is a solar diffuser (SD) that is illuminated once per orbit as the satellite passes from the dark side to the light side of the Earth near the South Pole. An attenuation screen covers the opening, but there is no other optical element between the SD and the sun. The Bi-directional Reflectance Distribution Function (BRDF) of the SD and the transmittance of the attenuation screen is measured pre-launch and refined post-launch using yaw maneuver measurements. Given solar illumination geometry, the reflected radiance of the sun can be computed and is used as a reference to produce calibrated reflectance and radiance. The SV provides the offset needed for the calibration. Since the SD may degrade over time, a solar diffuser stability monitor (SDSM) is used to compare the directly measured sunlight to that reflected from the SD, providing a means of monitoring the degradation of the SD throughout the entire mission. Lunar calibration through spacecraft roll maneuver is part of the post-launch calibration strategy to ensure that the sensor degradation is independently verified. A more detailed discussion and analysis of VIIRS calibration can be found in Section 4 of this document. The TEBs are calibrated using an On-board Calibration Black Body (BB) that has been carefully characterized prelaunch. The BB temperature is carefully controlled using heater elements and thermistors. The calibration algorithm, based on measured BB temperature and emissivity, predicts radiances and compares them with counts to determine gain adjustments. Because of emissive background variations caused by the half-angle scanning mirror, and components in the surround, additional corrections must be made for this RVS function. Spacecraft ephemeris, attitude and instrument scan rate are used to geolocate the sensor data. The combined calibrated radiances with geolocation are the SDRs.
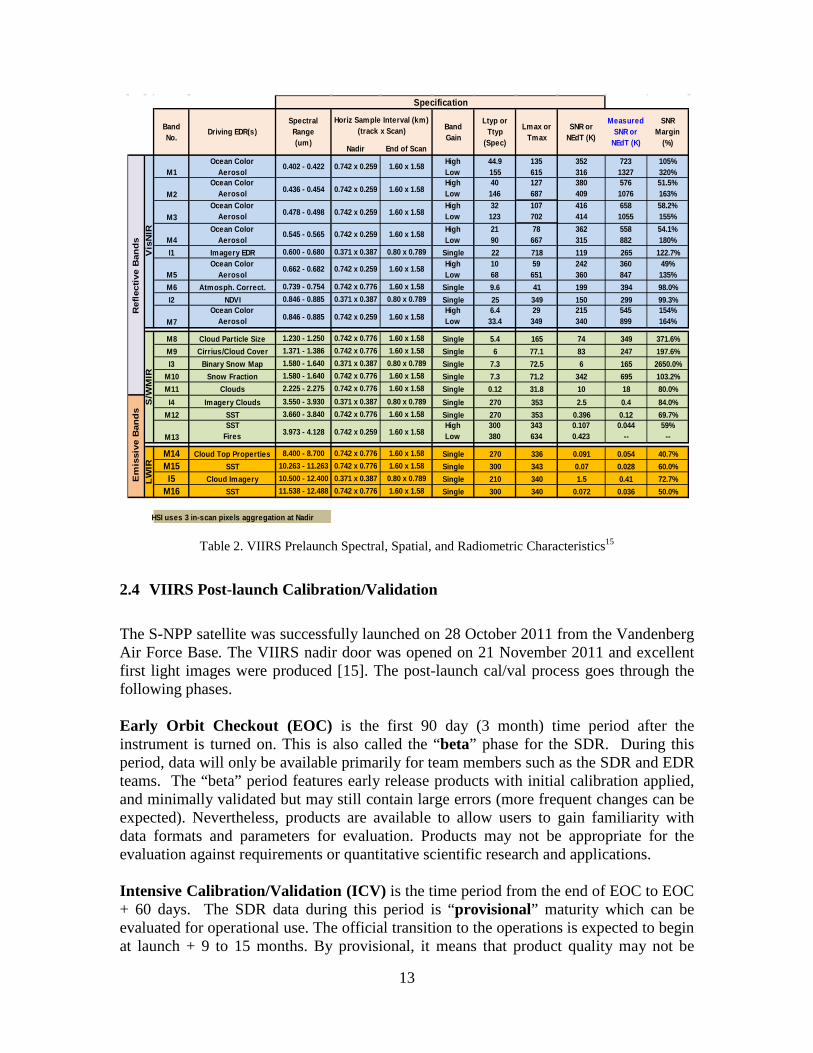
For RSBs, the calibration uncertainty in spectral reflectance for a scene at typical radiance is expected to be less than 2%. This performance has been demonstrated in prelaunch testing in the laboratory, but on-orbit performance requires additional effort by using the onboard SD and vicarious methods, as well as inter-comparisons with other instruments. The prelaunch performance of the 21 VIIRS bands is summarized in Table 2, which shows that the SNR for RSB and the NEdT for TEBs meet the specification with large margins for the un-aggregated pixels. For the 2-sample and 3-sample aggregated pixels, the SNR/NEdT values are increased/decreased by a factor of 1.41 and 1.73, respectively. On-orbit calibration is used to monitor and track this performance. The VIIRS polarization sensitivity was characterized prelaunch. This information is used to correct the associated errors in measuring polarized top-of-atmosphere (TOA) radiance in the EDR algorithms. Similarly, several other instrument performance issues, including focal plane scattering, uneven polarization sensitivity across detectors, optical crosstalk, line spread function shape, dual-gain anomaly, 1/f noise, random noise, out-of-band spectral response, vignetting and DNB band SV calibration anomalies are discussed in separate documents, such as the ATBD and VIIRS SDR performance reports by the instrument vendor.
13
Table 2. VIIRS Prelaunch Spectral, Spatial, and Radiometric Characteristics15
2.4 VIIRS Post-launch Calibration/Validation The S-NPP satellite was successfully launched on 28 October 2011 from the Vandenberg Air Force Base. The VIIRS nadir door was opened on 21 November 2011 and excellent first light images were produced [15]. The post-launch cal/val process goes through the following phases. Early Orbit Checkout (EOC) is the first 90 day (3 month) time period after the instrument is turned on. This is also called the “beta” phase for the SDR. During this period, data will only be available primarily for team members such as the SDR and EDR teams. The “beta” period features early release products with initial calibration applied, and minimally validated but may still contain large errors (more frequent changes can be expected). Nevertheless, products are available to allow users to gain familiarity with data formats and parameters for evaluation. Products may not be appropriate for the evaluation against requirements or quantitative scientific research and applications. Intensive Calibration/Validation (ICV) is the time period from the end of EOC to EOC + 60 days. The SDR data during this period is “provisional” maturity which can be evaluated for operational use. The official transition to the operations is expected to begin at launch + 9 to 15 months. By provisional, it means that product quality may not be
Nadir End of Scan
M1Ocean Color
Aerosol0.402 - 0.422 0.742 x 0.259 1.60 x 1.58 High
Low44.9155
135615
352316
7231327
105%320%
M2Ocean Color
Aerosol 0.436 - 0.454 0.742 x 0.259 1.60 x 1.58HighLow
40146
127687
380409
5761076
51.5%163%
M3Ocean Color
Aerosol 0.478 - 0.498 0.742 x 0.259 1.60 x 1.58HighLow
32123
107702
416414
6581055
58.2%155%
M4Ocean Color
Aerosol0.545 - 0.565 0.742 x 0.259 1.60 x 1.58 High
Low2190
78667
362315
558882
54.1%180%
I1 Imagery EDR 0.600 - 0.680 0.371 x 0.387 0.80 x 0.789 Single 22 718 119 265 122.7%
M5Ocean Color
Aerosol0.662 - 0.682 0.742 x 0.259 1.60 x 1.58 High
Low1068
59651
242360
360847
49%135%
M6 Atmosph. Correct. 0.739 - 0.754 0.742 x 0.776 1.60 x 1.58 Single 9.6 41 199 394 98.0%I2 NDVI 0.846 - 0.885 0.371 x 0.387 0.80 x 0.789 Single 25 349 150 299 99.3%
M7Ocean Color
Aerosol 0.846 - 0.885 0.742 x 0.259 1.60 x 1.58HighLow
6.433.4
29349
215340
545899
154%164%
M8 Cloud Particle Size 1.230 - 1.250 0.742 x 0.776 1.60 x 1.58 Single 5.4 165 74 349 371.6%M9 Cirrius/Cloud Cover 1.371 - 1.386 0.742 x 0.776 1.60 x 1.58 Single 6 77.1 83 247 197.6%I3 Binary Snow Map 1.580 - 1.640 0.371 x 0.387 0.80 x 0.789 Single 7.3 72.5 6 165 2650.0%
M10 Snow Fraction 1.580 - 1.640 0.742 x 0.776 1.60 x 1.58 Single 7.3 71.2 342 695 103.2%M11 Clouds 2.225 - 2.275 0.742 x 0.776 1.60 x 1.58 Single 0.12 31.8 10 18 80.0%I4 Imagery Clouds 3.550 - 3.930 0.371 x 0.387 0.80 x 0.789 Single 270 353 2.5 0.4 84.0%
M12 SST 3.660 - 3.840 0.742 x 0.776 1.60 x 1.58 Single 270 353 0.396 0.12 69.7%
M13SST
Fires 3.973 - 4.128 0.742 x 0.259 1.60 x 1.58HighLow
300380
343634
0.1070.423
0.044--
59%--
M14 Cloud Top Properties 8.400 - 8.700 0.742 x 0.776 1.60 x 1.58 Single 270 336 0.091 0.054 40.7%M15 SST 10.263 - 11.263 0.742 x 0.776 1.60 x 1.58 Single 300 343 0.07 0.028 60.0%I5 Cloud Imagery 10.500 - 12.400 0.371 x 0.387 0.80 x 0.789 Single 210 340 1.5 0.41 72.7%
M16 SST 11.538 - 12.488 0.742 x 0.776 1.60 x 1.58 Single 300 340 0.072 0.036 50.0%
HSI uses 3 in-scan pixels aggregation at Nadir
Specification
Vis
NIR
S/W
MIR
LWIR
Ref
lect
ive
Ban
dsE
mis
sive
Ban
ds
Horiz Sample Interval (km)(track x Scan)Band
No.
SpectralRange(um)
Driving EDR(s) SNR orNEdT (K)
BandGain
Ltyp orTtyp
(Spec)
Lmax orTmax
MeasuredSNR or
NEdT (K)
SNR Margin
(%)
14
optimal. Incremental product improvements are still occurring as calibration parameters are adjusted with sensor on-orbit characterization. The general research community is encouraged to participate in the quality assessment and validation of the products, but need to be aware that these activities are ongoing. Users are urged to contact JPSS S-NPP VIIRS SDR Team leads or representatives prior to use of the data in publications. Products may be replaced in the archive when the validated products become available. Towards the end of this provisional period, the data product is considered “validated”. On-orbit sensor performance is characterized and calibration parameters are adjusted accordingly in SDR. EDR product uncertainties are well defined over a range of representative conditions. EDR products are ready for use by the Centrals and for scientific research. There may be later improved versions. This is a continuous process and requires rigorous version control with good documentation. Long-term Monitoring (LTM) is the period from the end of ICV until the end of mission when the data is relatively mature for operational use, although anomalies and updates are still expected. Also, it is expected that the data may be reprocessed when the SDRs and EDRs can be improved significantly as they progress through the stages of validation described above as an iterative process. However, reprocessing is not in the current baseline of the S-NPP/JPSS program at this time and will require additional work later. As the VIIRS cal/val progresses through different phases, a number of cal/val tasks are executed by the VIIRS SDR team. The current plan calls for 57 tasks including 7 tasks for Functional Performance & Format evaluation (FPF), 7 tasks for Calibration System Evaluation (CSE), 4 tasks for Image Quality Evaluation (IMG), 25 tasks for radiometric evaluation (RAD), 9 tasks for Geometric Evaluation (GEO), and 5 tasks for Performance and Telemetry Trending (PTT). Descriptions of these tasks can be found in the VIIRS SDR Operations Concept (OPSCON) and cal/val plan documents. Additional cal/val at selected cal/val sites are planned in conjunction with the aircraft campaigns. A number of cal/val sites have been identified and some are endorsed by the Committee on Earth Observation Satellites (CEOS), including but not limited to: 1) The Dome C in Antarctica; 2) The Libyan desert calibration sites (both Libya-4 and the Libya NOAA site); 3) MOBY site for ocean color bands; 4) Railroad valley; 5) Lake Tahoe; and 6) Sonoran desert. Collaborative field campaigns are planned in conjunction with other instruments such as CrIS and ATMS to leverage aircraft underflight, operational RAOBs, and ARM-CART (TWP, SGP, NSA) sites. To ensure that the VIIRS measurements are consistent with those from other satellite radiometers such as MODIS, rigorous inter-comparisons are performed. In particular, VIIRS and MODIS measurements are inter-compared at the simultaneous nadir overpasses (SNO) in the low latitudes, since there are events when S-NPP flies the Aqua satellite in the low latitudes, viewing the same location on the Earth within a short period of time of each other. The SNOs are being routinely predicted using the latest orbital perturbation model (SGP4 v2008) and the results are readily available from the website
15
at: https://cs.star.nesdis.noaa.gov/NCC/SNOPredictions. The daily S-NPP satellite trajectory can also be found at the same website. 3. VIIRS Data Records The VIIRS data are divided into three levels: the Raw Data Records (RDRs or level 0), SDRs (or level 1), and EDRs (or level 2). The RDR data contain engineering and house-keeping data for spacecraft and sensor monitoring, and science data for SDR production. The SDR data are calibrated radiance/reflectance and brightness temperatures with geolocation. The SDR data are the inputs to EDRs algorithms for applications such as cloud and aerosol properties, ocean color, sea and land surface temperature, ice motion and temperature, fires, and Earth's albedo. Climatologists will also use VIIRS data to improve our understanding of global climate change. The VIIRS data are stored in Version 5 Hierarchical Data Format (HDF5), which is based on a data model and a set of libraries. It is used to store, manage, and archive high-volume, complex data. More information about the HDF5 may be found at http://www.hdfgroup.org/HDF5/doc/UG/UG_frame13Attributes.html, and its implementation in the EOS environment at http://hdfeos.net/index.php. S-NPP-specific information is found at http://www.hdfgroup.org/projects/npoess/. The HDF5 standardization makes it useful for many disciplines. The standard also allows for flexible temporal aggregation, with granules appended by extending the dataset dimension. In the following, the three-level data and their geolocation, quality flags, and granule and aggregation metadata are introduced. 3.1 Raw Data Records (RDR) The S-NPP RDR is an accumulation of binary data generated by sensors on board the S-NPP spacecraft and is assembled into groups called application packets (APs). Unique Application Packet Identifier (APID) numbers represent each discrete AP type. The S-NPP ground processing software collects one or more groups of related APs together into granules which are then assembled into common RDR structures and combined with metadata to create the delivered HDF5 file. The APs are accumulated per discrete period and a granule refers to the data accumulated and organized for that discrete period. The APs are logically grouped into science, diagnostic, dwell, dump, and telemetry RDRs. A science RDR data product generally contains all the necessary APs to construct a SDR. Diagnostic, dwell, and dump RDRs generally contain APs that are only generated while the sensor is in diagnostic mode. Telemetry RDRs generally contain APs that describe the health and status of the sensor. The required inputs for generating SDR products are the verified VIIRS Raw Data Records (vRDRs), which contain the basic digital numbers (DNs) from all viewing sectors to be converted into calibrated TOA radiance, reflectance, and brightness temperature, as well as engineering, health and safety data, and onboard calibrator-view data that are required by the radiometric calibration algorithm. These data have been
16
unpacked from VIIRS RDR packets in standard Consultative Committee for Space Data System (CCSDS) format, and assembled into scan cube structures. As part of the unpacking these data are uncompressed, band identified and quality checked through a re-computation of embedded checksums.
The VIIRS provides seven types of RDRs in CCSDS packet format. They are:
• Memory Dump • High Rate Data (HRD) • Housekeeping Telemetry • Engineering • Launch, Early Orbit and Activation (LEO&A) • Calibration • Time of Day and Ephemeris
In the process of verifying the RDR data, quality flags, triggered by missing or corrupted data, are included along with the Earth-view counts, the space-view counts, the BB and the solar diffuser-view counts. If any of these are flagged as bad, this quality flag is passed through to the SDR output quality flag for each pixel. In the cases of calibrator quality flags, a bad detector in the calibrator causes a bad quality flag to be set for the entire scan or scans that use that calibration data. Details on the structure and contents of the VIIRS RDRs can be found from the common data format control documents at: http://www.star.nesdis.noaa.gov/jpss/.
3.2 Sensor Data Records (SDR) SDRs (or Level 1b) are the calibrated and geolocated radiance and reflectance data produced based on the RDRs. There are 22 VIIRS SDRs: 16 moderate-resolution, narrow-spectral-band products, made up of 11 RSBs and 5 TEBs; five imaging-resolution, narrow-spectral-band products, made up of 3 RSBs and 2 TEBs; and 1 DNB imaging broadband product. These SDRs are then used to produce the EDRs. An SDR contains the following elements:
• Calibrated sensor radiometric data • Geolocation data • Quality flags • Metadata at the granule and aggregation levels
Within HDF5, processed VIIRS data for S-NPP are organized and described by the Unified Modeling Language (UML). This standard modeling language is used to design structured or object-oriented software applications, and provides a uniform means of data retrieval for further use, thus lowering development costs. Details of M-, I-, and DNB SDR HDF5 data format and content can be found in Appendix A: SDR Data Contents
17
and Related Information. Complete details on the VIIRS SDR formats are available from the common data format control documents at: http://www.star.nesdis.noaa.gov/jpss/. There are three types of geophysical data in the VIIRS SDRs:
• Calibrated TOA Radiances for all bands • Calibrated TOA Reflectance for the RSBs • Calibrated TOA Brightness Temperature for the TEBs
To obtain these calibrated data types, radiometric calibration is performed following the Earth location of VIIRS pixels. Calibration coefficients are applied to raw instrument counts and the results are scaled to integer values. The calibration coefficients are determined during pre-launch testing and updated as needed operationally through calibration and validation (cal/val) analysis. Provisions are included to incorporate adjustments into the radiometric calibration to account for instrument temperature, changes in incoming solar flux, and to correct for instrument degradation. The VIIRS radiometric calibration algorithm is implemented as part of the VIIRS raw data processing software in order to convert raw DNs from EV observations into the various SDR radiance products. As part of this algorithm, DNs from the BB, SV and SD views are processed in order to adjust DNs for background signal levels and to update reflective band and emissive band calibration coefficients.
While part of the SDR algorithm is common to the heritage instruments, VIIRS has its unique features such as extensive use of dual gain, the DNB band, and the along-scan aggregation to limit pixel growth from nadir to end of scan. These features receive special treatments in the SDR algorithm. The VIIRS Radiometric Calibration ATBD contains the details about transferring VIIRS pre-launch calibration to VIIRS on-orbit data. These details include corrections of raw instrument counts to account for nonlinearities in analog-to-digital conversion, detector-specific response characteristics, focal plane temperature, background emission, and scan angle effects. These corrections are based in part on the heritage of the MODIS instrument and are applied as appropriate to the design of the VIIRS instrument specifics. Additional calibration processing details are found in Section 4 of this document.
For the SDRs, in addition to the radiance/reflectance/brightness temperature products described, pixel geolocation (i.e., geodetic latitude and longitude) and geolocation related data, such as terrain height, satellite-ground range, satellite and solar geometry, and lunar geometry (for the DNB), are included as part of the SDR product. More detailed discussion on the SDR geolocation products can be found in Section 5 (Geolocation and Geometric Performance).
3.3 Environmental Data Records (EDR)
18
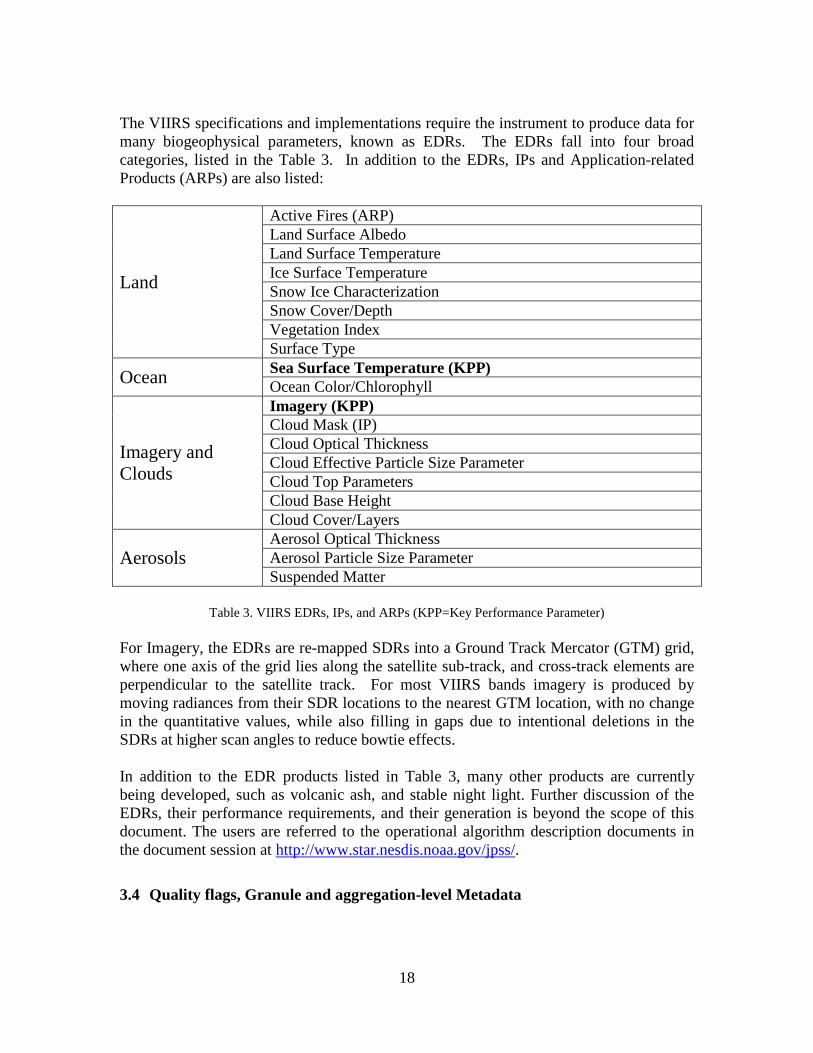
The VIIRS specifications and implementations require the instrument to produce data for many biogeophysical parameters, known as EDRs. The EDRs fall into four broad categories, listed in the Table 3. In addition to the EDRs, IPs and Application-related Products (ARPs) are also listed:
Land
Active Fires (ARP) Land Surface Albedo Land Surface Temperature Ice Surface Temperature Snow Ice Characterization Snow Cover/Depth Vegetation Index Surface Type
Ocean Sea Surface Temperature (KPP) Ocean Color/Chlorophyll
Imagery and Clouds
Imagery (KPP) Cloud Mask (IP) Cloud Optical Thickness Cloud Effective Particle Size Parameter Cloud Top Parameters Cloud Base Height Cloud Cover/Layers
Aerosols Aerosol Optical Thickness Aerosol Particle Size Parameter Suspended Matter
Table 3. VIIRS EDRs, IPs, and ARPs (KPP=Key Performance Parameter)
For Imagery, the EDRs are re-mapped SDRs into a Ground Track Mercator (GTM) grid, where one axis of the grid lies along the satellite sub-track, and cross-track elements are perpendicular to the satellite track. For most VIIRS bands imagery is produced by moving radiances from their SDR locations to the nearest GTM location, with no change in the quantitative values, while also filling in gaps due to intentional deletions in the SDRs at higher scan angles to reduce bowtie effects. In addition to the EDR products listed in Table 3, many other products are currently being developed, such as volcanic ash, and stable night light. Further discussion of the EDRs, their performance requirements, and their generation is beyond the scope of this document. The users are referred to the operational algorithm description documents in the document session at http://www.star.nesdis.noaa.gov/jpss/.
3.4 Quality flags, Granule and aggregation-level Metadata
19
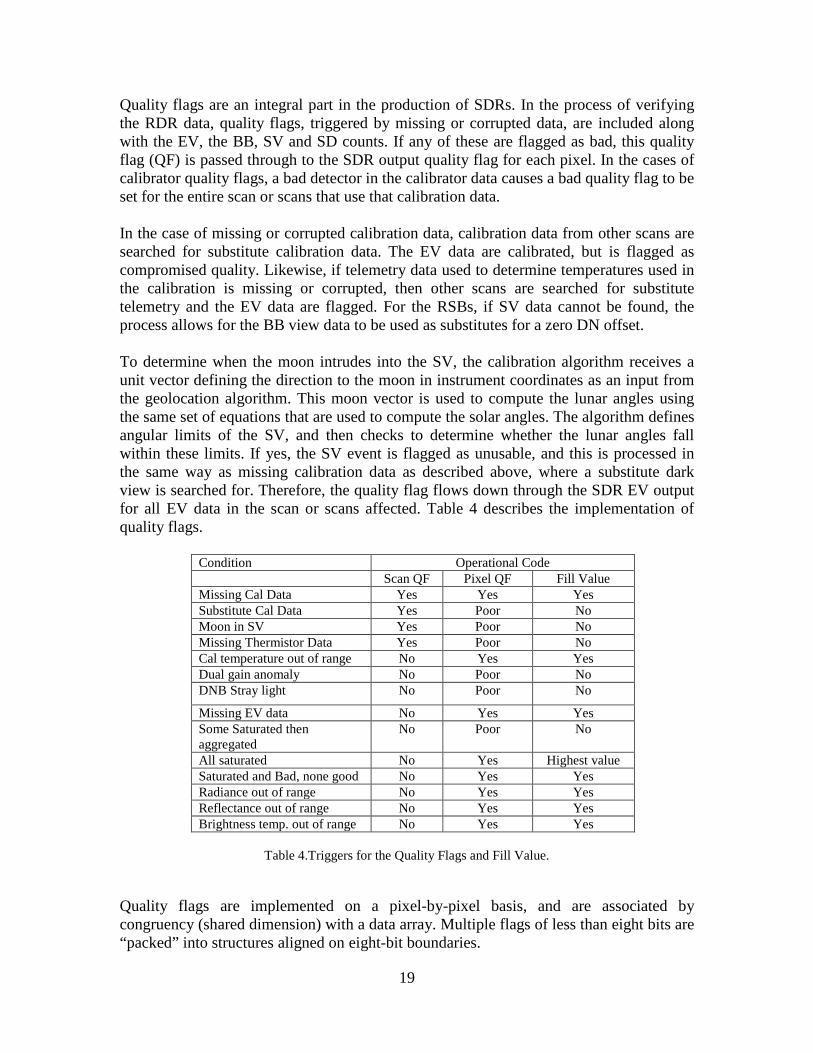
Quality flags are an integral part in the production of SDRs. In the process of verifying the RDR data, quality flags, triggered by missing or corrupted data, are included along with the EV, the BB, SV and SD counts. If any of these are flagged as bad, this quality flag (QF) is passed through to the SDR output quality flag for each pixel. In the cases of calibrator quality flags, a bad detector in the calibrator data causes a bad quality flag to be set for the entire scan or scans that use that calibration data. In the case of missing or corrupted calibration data, calibration data from other scans are searched for substitute calibration data. The EV data are calibrated, but is flagged as compromised quality. Likewise, if telemetry data used to determine temperatures used in the calibration is missing or corrupted, then other scans are searched for substitute telemetry and the EV data are flagged. For the RSBs, if SV data cannot be found, the process allows for the BB view data to be used as substitutes for a zero DN offset. To determine when the moon intrudes into the SV, the calibration algorithm receives a unit vector defining the direction to the moon in instrument coordinates as an input from the geolocation algorithm. This moon vector is used to compute the lunar angles using the same set of equations that are used to compute the solar angles. The algorithm defines angular limits of the SV, and then checks to determine whether the lunar angles fall within these limits. If yes, the SV event is flagged as unusable, and this is processed in the same way as missing calibration data as described above, where a substitute dark view is searched for. Therefore, the quality flag flows down through the SDR EV output for all EV data in the scan or scans affected. Table 4 describes the implementation of quality flags.
Condition Operational Code Scan QF Pixel QF Fill Value Missing Cal Data Yes Yes Yes Substitute Cal Data Yes Poor No Moon in SV Yes Poor No Missing Thermistor Data Yes Poor No Cal temperature out of range No Yes Yes Dual gain anomaly No Poor No DNB Stray light No Poor No
Missing EV data No Yes Yes Some Saturated then aggregated
No Poor No
All saturated No Yes Highest value Saturated and Bad, none good No Yes Yes Radiance out of range No Yes Yes Reflectance out of range No Yes Yes Brightness temp. out of range No Yes Yes
Table 4.Triggers for the Quality Flags and Fill Value.
Quality flags are implemented on a pixel-by-pixel basis, and are associated by congruency (shared dimension) with a data array. Multiple flags of less than eight bits are “packed” into structures aligned on eight-bit boundaries.
20
Metadata for the VIIRS SDRs are produced from the input Verified VIIRS RDRs and VIIRS Geolocation IPs. Included are the following granule metadata:
• Granule ID – a unique identifier that identifies the VIIRS flight model, the band type (i.e., ‘M’, ‘I’, or DNB), the data start time, data version, and SDR creation time
• Ground processing software identification (module, version number, and version date)
• Time and location at start of granule • Minimum and maximum solar, sensor, and lunar (DNB only) azimuth and zenith
angles • Geographic coverage • Detector quality
In addition, the following metadata are included for each scan:
• Scan number • Scan start time • Minimum and maximum solar zenith angle • VIIRS operational mode • HAM side
Pixel level metadata are limited to quality flags. At a minimum, each pixel requires a 1-bit good/bad (i.e., use/don’t use) flag. In the case of the single-gain bands, which require 15 bits to store radiance, the unused bit is utilized to indicate pixel quality. Missing, bad quality, or saturated pixels are identified using this bit and the raw DN is stored in the radiance bits if the quality bit is set to 1, which allows the SDR user to ascertain whether the pixel was saturated by inspecting both the quality bit and the fill value. Operational algorithms expand quality flagging to accommodate requirements for on-orbit calibration and validation during the ICV phase. Beginning with raw (un-aggregated) data, sub-pixel samples from the VIIRS dual gain bands are aggregated along-scan during post-calibration ground processing. Additional flagging is required to identify cases when non-nominal sets of un-aggregated data have been combined. A full list of Data Quality Flags is found in Appendix B: Data Quality Flags. Details about the metadata profiles and formats for the mission are found from common data format control documents at: http://www.star.nesdis.noaa.gov/jpss/.
4. Data Processing and Radiometric Calibration Once the VIIRS telemetry is down-linked from the satellite to the Centrals, the data are processed in the ground processing system to produce the data records. The IDPS is the official system at the Centrals for ingesting VIIRS RDRs and generating the SDRs and EDRs. The process includes data transfer, ingestion, processing, monitoring, and
21
distribution. An important part of the data processing is the calibration algorithm and software which are used to convert the RDRs to SDRs.
4.1 Data Processing Flow VIIRS Data down-linked from the satellite will be sent to the Command, Control, and Communications Segment (C3S). Sensor and spacecraft data packets, calibration LUTs , spacecraft databases, data recovery requests, schedules, reports, tasking, and status from C3S and data from the Global Positioning System (GPS) will then be sent to the IDPS, which will be handled by Interface Data Processors (IDPs) at the following two S-NPP mission “Centrals”:
• NOAA Satellite Operations Facility (NSOF), National Environmental Satellite, Data, and Information Service (NESDIS), Suitland, MD
• Air Force Weather Agency (AFWA), Offutt Air Force Base, Omaha, NE
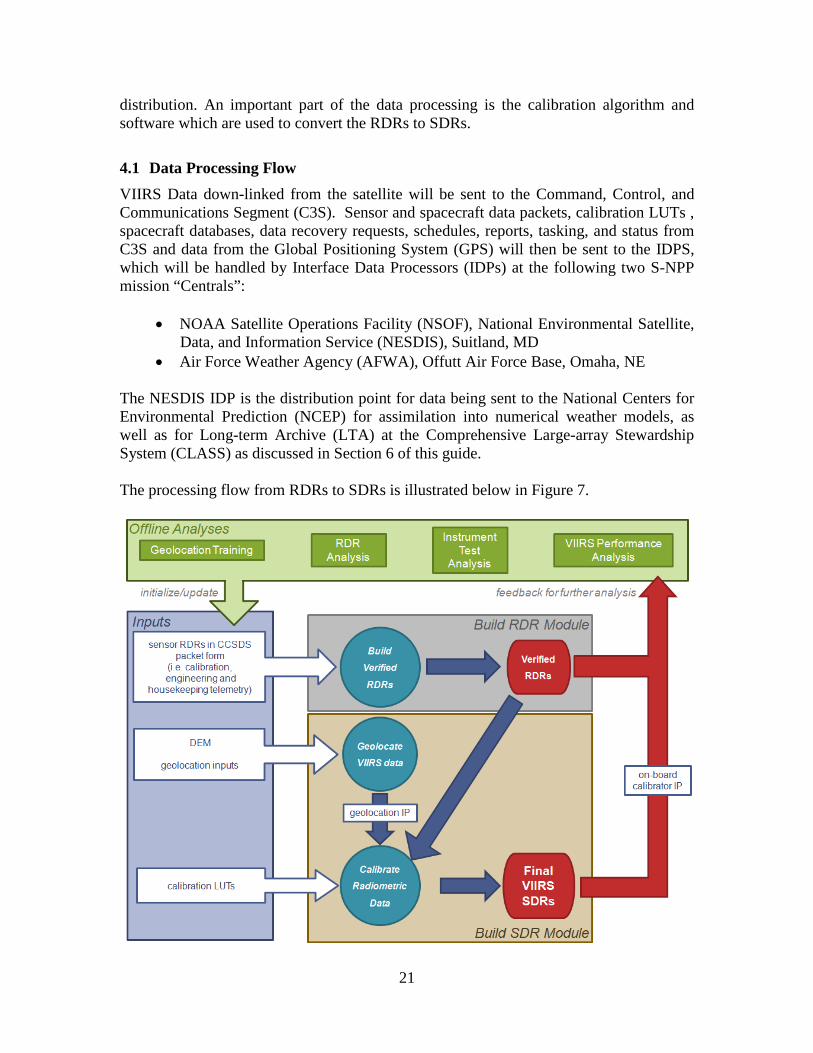
The NESDIS IDP is the distribution point for data being sent to the National Centers for Environmental Prediction (NCEP) for assimilation into numerical weather models, as well as for Long-term Archive (LTA) at the Comprehensive Large-array Stewardship System (CLASS) as discussed in Section 6 of this guide. The processing flow from RDRs to SDRs is illustrated below in Figure 7.
22
Figure 7. Data Processing Flow from RDR to SDR
The VIIRS RDR granule contains all of the instrument data needed to create its corresponding SDR granule. Processing an RDR into SDR involves unpacking and decompressing the Application Packet (AP) data, applying radiometric calibration with artifact corrections, and finally geolocating pixels using ephemeris, attitude and Earth model information with feedback from ground truth. 4.1.1 SDR Algorithms Overview The SDR radiometric calibration algorithms convert RDRs in DNs from EV observations into SDR radiance, reflectance and brightness temperature products. Fundamentally, this is a traditional two-point calibration approach using two calibration points: the Onboard Calibration Blackbody (BB), and SD as the high points for the TEB and RSBs respectively, and SV for offset subtraction for both bands. Given the VIIRS observations at these two calibration points, the instrument gain can be derived. In addition, nonlinearity determined during prelaunch testing (despite being small) is also corrected. Provisions are included to incorporate adjustments to the radiometric calibration to account for instrument artifacts, operating environment changes, and to correct for instrument degradation based on independent monitoring and calibration, such as Lunar and inter-calibration with other satellites. The derived calibration coefficients are then applied to the EV RDRs to produce the SDRs.
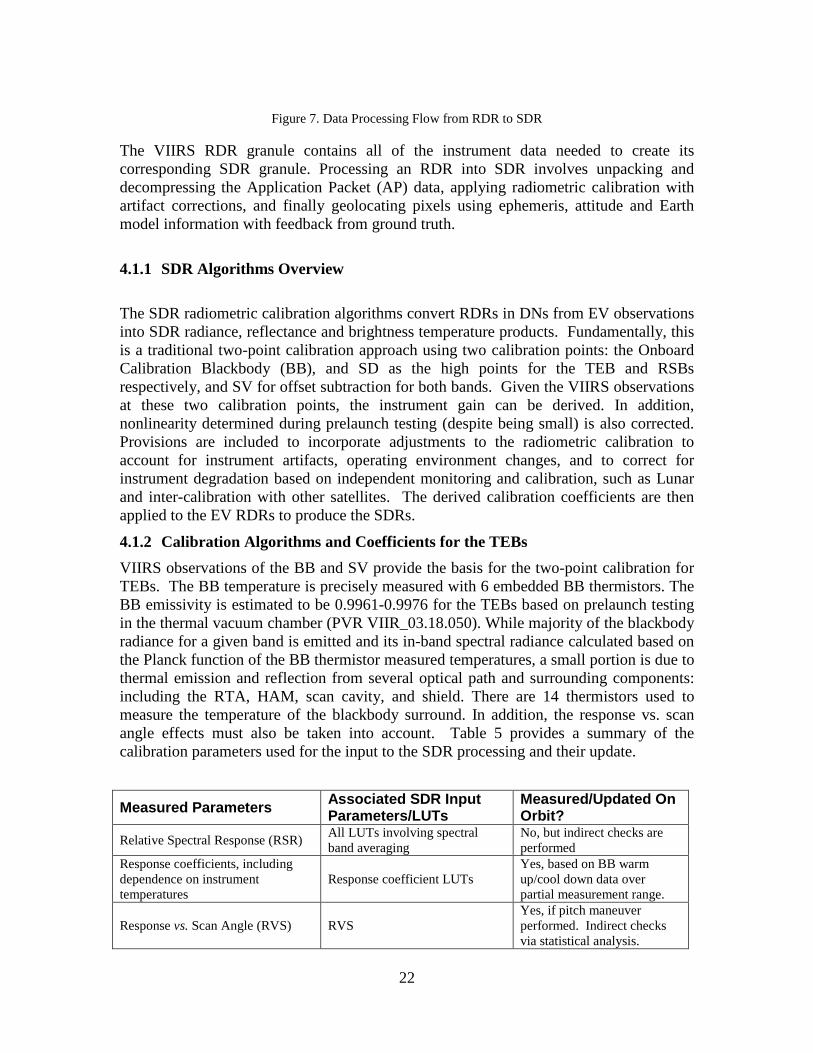
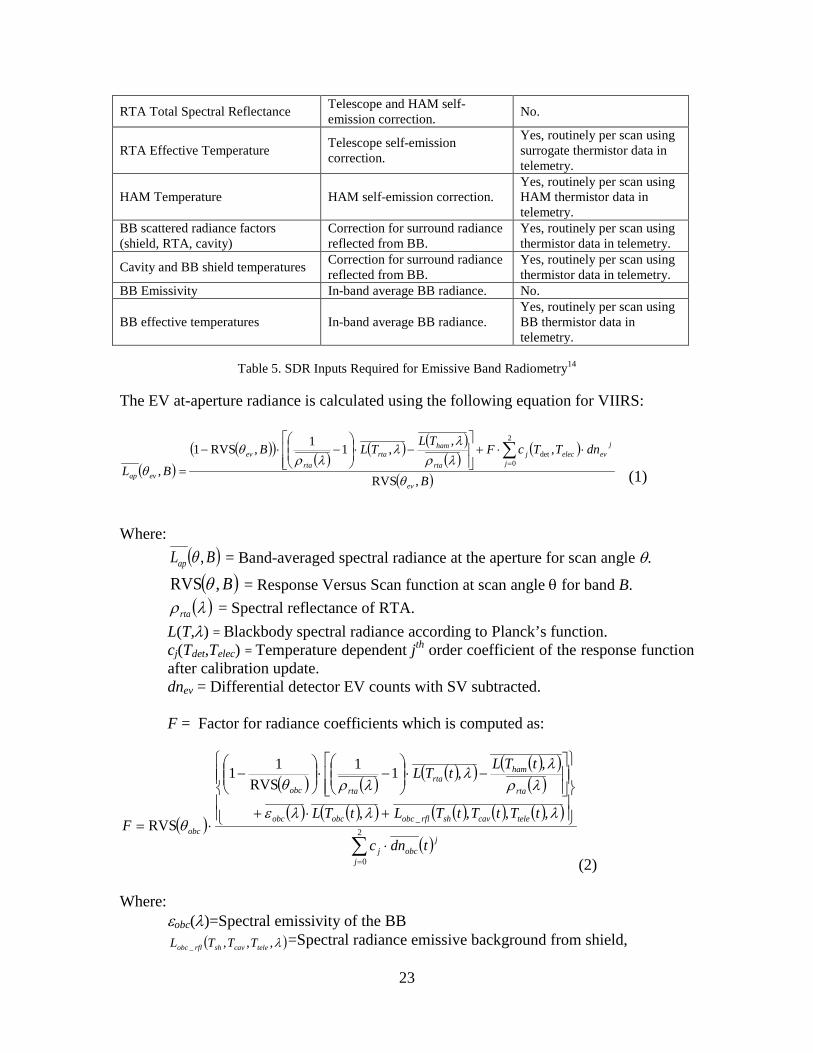
4.1.2 Calibration Algorithms and Coefficients for the TEBs VIIRS observations of the BB and SV provide the basis for the two-point calibration for TEBs. The BB temperature is precisely measured with 6 embedded BB thermistors. The BB emissivity is estimated to be 0.9961-0.9976 for the TEBs based on prelaunch testing in the thermal vacuum chamber (PVR VIIR_03.18.050). While majority of the blackbody radiance for a given band is emitted and its in-band spectral radiance calculated based on the Planck function of the BB thermistor measured temperatures, a small portion is due to thermal emission and reflection from several optical path and surrounding components: including the RTA, HAM, scan cavity, and shield. There are 14 thermistors used to measure the temperature of the blackbody surround. In addition, the response vs. scan angle effects must also be taken into account. Table 5 provides a summary of the calibration parameters used for the input to the SDR processing and their update.
Measured Parameters Associated SDR Input Parameters/LUTs
Measured/Updated On Orbit?
Relative Spectral Response (RSR) All LUTs involving spectral band averaging
No, but indirect checks are performed
Response coefficients, including dependence on instrument temperatures
Response coefficient LUTs Yes, based on BB warm up/cool down data over partial measurement range.
Response vs. Scan Angle (RVS) RVS Yes, if pitch maneuver performed. Indirect checks via statistical analysis.
23
Table 5. SDR Inputs Required for Emissive Band Radiometry14
The EV at-aperture radiance is calculated using the following equation for VIIRS:
(1)
Where: ( )BLap ,θ = Band-averaged spectral radiance at the aperture for scan angle θ.
( )B,RVS θ = Response Versus Scan function at scan angle θ for band B. ( )λρrta = Spectral reflectance of RTA.
L(T,λ) = Blackbody spectral radiance according to Planck’s function. cj(Tdet,Telec) = Temperature dependent jth order coefficient of the response function after calibration update. dnev = Differential detector EV counts with SV subtracted. F = Factor for radiance coefficients which is computed as:
( )
( ) ( )( )( ) ( )( )
( )( ) ( )( ) ( ) ( ) ( )( )
( )∑=
⋅
+⋅+
−⋅
−⋅
−
⋅= 2
0
_ ,,,,
,,11RVS
11
RVS
j
jobcj
telecavshrflobcobcobc
rta
hamrta
rtaobc
obc
tdnc
tTtTtTLtTL
tTLtTL
Fλλλε
λρλλ
λρθ
θ
(2) Where: εobc(λ)=Spectral emissivity of the BB
( )λ,,,_ telecavshrflobc TTTL =Spectral radiance emissive background from shield,
RTA Total Spectral Reflectance Telescope and HAM self-emission correction. No.
RTA Effective Temperature Telescope self-emission correction.
Yes, routinely per scan using surrogate thermistor data in telemetry.
HAM Temperature HAM self-emission correction. Yes, routinely per scan using HAM thermistor data in telemetry.
BB scattered radiance factors (shield, RTA, cavity)
Correction for surround radiance reflected from BB.
Yes, routinely per scan using thermistor data in telemetry.
Cavity and BB shield temperatures Correction for surround radiance reflected from BB.
Yes, routinely per scan using thermistor data in telemetry.
BB Emissivity In-band average BB radiance. No.
BB effective temperatures In-band average BB radiance. Yes, routinely per scan using BB thermistor data in telemetry.
( )( )( )
( )( ) ( )
( )( )
( )B
dnTTcFTL
TLB
BLev
j
jevelecj
rta
hamrta
rtaev
evap ,RVS
,,
,11,RVS1
,
2
0det
θλρλ
λλρ
θ
θ∑=
⋅⋅+
−⋅
−⋅−
=
24
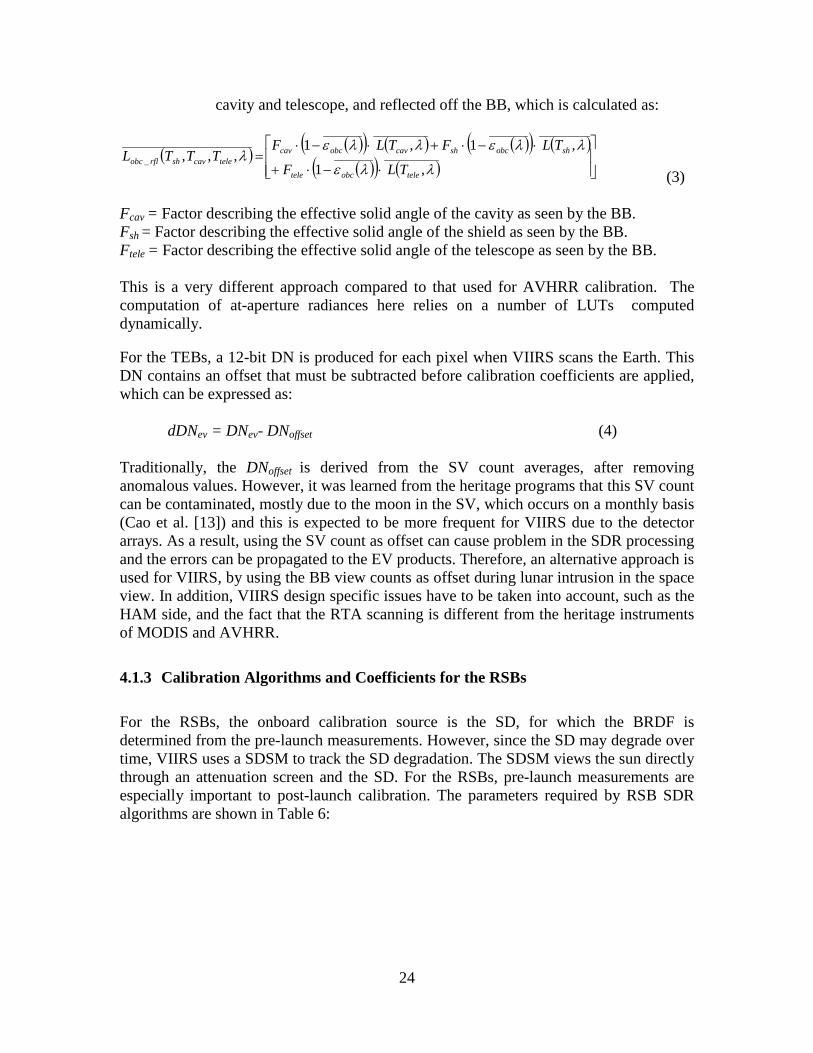
cavity and telescope, and reflected off the BB, which is calculated as:
( ) ( )( ) ( ) ( )( ) ( )( )( ) ( )
⋅−⋅+
⋅−⋅+⋅−⋅=
λλε
λλελλελ
,1
,1,1,,,_
teleobctele
shobcshcavobccavtelecavshrflobc
TLF
TLFTLFTTTL
(3) Fcav = Factor describing the effective solid angle of the cavity as seen by the BB. Fsh = Factor describing the effective solid angle of the shield as seen by the BB. Ftele = Factor describing the effective solid angle of the telescope as seen by the BB. This is a very different approach compared to that used for AVHRR calibration. The computation of at-aperture radiances here relies on a number of LUTs computed dynamically.
For the TEBs, a 12-bit DN is produced for each pixel when VIIRS scans the Earth. This DN contains an offset that must be subtracted before calibration coefficients are applied, which can be expressed as:
dDNev = DNev- DNoffset (4) Traditionally, the DNoffset is derived from the SV count averages, after removing anomalous values. However, it was learned from the heritage programs that this SV count can be contaminated, mostly due to the moon in the SV, which occurs on a monthly basis (Cao et al. [13]) and this is expected to be more frequent for VIIRS due to the detector arrays. As a result, using the SV count as offset can cause problem in the SDR processing and the errors can be propagated to the EV products. Therefore, an alternative approach is used for VIIRS, by using the BB view counts as offset during lunar intrusion in the space view. In addition, VIIRS design specific issues have to be taken into account, such as the HAM side, and the fact that the RTA scanning is different from the heritage instruments of MODIS and AVHRR.
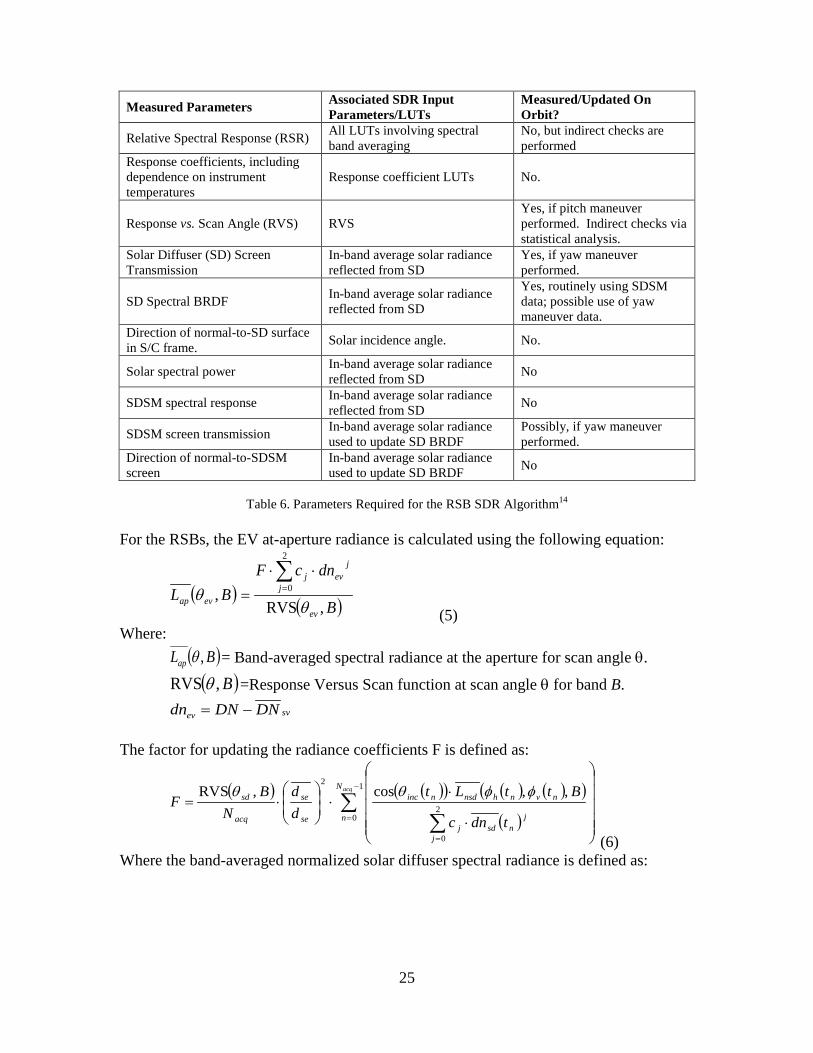
4.1.3 Calibration Algorithms and Coefficients for the RSBs For the RSBs, the onboard calibration source is the SD, for which the BRDF is determined from the pre-launch measurements. However, since the SD may degrade over time, VIIRS uses a SDSM to track the SD degradation. The SDSM views the sun directly through an attenuation screen and the SD. For the RSBs, pre-launch measurements are especially important to post-launch calibration. The parameters required by RSB SDR algorithms are shown in Table 6:
25
Table 6. Parameters Required for the RSB SDR Algorithm14
For the RSBs, the EV at-aperture radiance is calculated using the following equation:
( ) ( )B
dncFBL
ev
j
jevj
evap ,RVS,
2
0
θθ
∑=
⋅⋅=
(5) Where: ( )BLap ,θ = Band-averaged spectral radiance at the aperture for scan angle θ.
( )B,RVS θ =Response Versus Scan function at scan angle θ for band B. svev DNDNdn −=
The factor for updating the radiance coefficients F is defined as:
( ) ( )( ) ( ) ( )( )
( )∑
∑
−
=
=
⋅
⋅⋅
⋅=
1
02
0
2,,cos,RVS acqN
n
j
jnsdj
nvnhnsdninc
se
se
acq
sd
tdnc
BttLtdd
NB
Fφφθθ
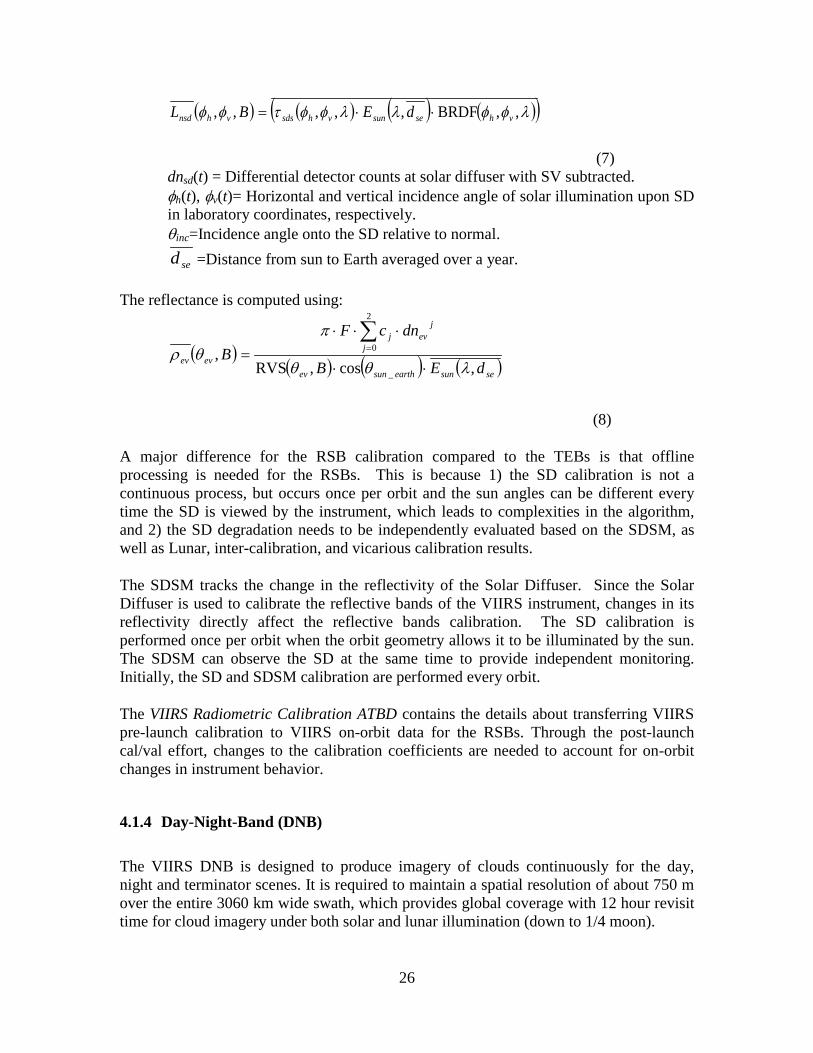
(6) Where the band-averaged normalized solar diffuser spectral radiance is defined as:
Measured Parameters Associated SDR Input Parameters/LUTs
Measured/Updated On Orbit?
Relative Spectral Response (RSR) All LUTs involving spectral band averaging
No, but indirect checks are performed
Response coefficients, including dependence on instrument temperatures
Response coefficient LUTs No.
Response vs. Scan Angle (RVS) RVS Yes, if pitch maneuver performed. Indirect checks via statistical analysis.
Solar Diffuser (SD) Screen Transmission
In-band average solar radiance reflected from SD
Yes, if yaw maneuver performed.
SD Spectral BRDF In-band average solar radiance reflected from SD
Yes, routinely using SDSM data; possible use of yaw maneuver data.
Direction of normal-to-SD surface in S/C frame. Solar incidence angle. No.
Solar spectral power In-band average solar radiance reflected from SD No
SDSM spectral response In-band average solar radiance reflected from SD No
SDSM screen transmission In-band average solar radiance used to update SD BRDF
Possibly, if yaw maneuver performed.
Direction of normal-to-SDSM screen
In-band average solar radiance used to update SD BRDF No
26
( ) ( ) ( ) ( )( )λφφλλφφτφφ ,,BRDF,,,,, vhsesunvhsdsvhnsd dEBL ⋅⋅=
(7) dnsd(t) = Differential detector counts at solar diffuser with SV subtracted.
φh(t), φv(t)= Horizontal and vertical incidence angle of solar illumination upon SD in laboratory coordinates, respectively. θinc=Incidence angle onto the SD relative to normal.
sed =Distance from sun to Earth averaged over a year.
The reflectance is computed using:
( )( ) ( ) ( )sesunearthsunev
j
jevj
evev dEB
dncFB
,cos,RVS,
_
2
0
λθθ
πθρ
⋅⋅
⋅⋅⋅=
∑=
(8)
A major difference for the RSB calibration compared to the TEBs is that offline processing is needed for the RSBs. This is because 1) the SD calibration is not a continuous process, but occurs once per orbit and the sun angles can be different every time the SD is viewed by the instrument, which leads to complexities in the algorithm, and 2) the SD degradation needs to be independently evaluated based on the SDSM, as well as Lunar, inter-calibration, and vicarious calibration results.
The SDSM tracks the change in the reflectivity of the Solar Diffuser. Since the Solar Diffuser is used to calibrate the reflective bands of the VIIRS instrument, changes in its reflectivity directly affect the reflective bands calibration. The SD calibration is performed once per orbit when the orbit geometry allows it to be illuminated by the sun. The SDSM can observe the SD at the same time to provide independent monitoring. Initially, the SD and SDSM calibration are performed every orbit.
The VIIRS Radiometric Calibration ATBD contains the details about transferring VIIRS pre-launch calibration to VIIRS on-orbit data for the RSBs. Through the post-launch cal/val effort, changes to the calibration coefficients are needed to account for on-orbit changes in instrument behavior.
4.1.4 Day-Night-Band (DNB) The VIIRS DNB is designed to produce imagery of clouds continuously for the day, night and terminator scenes. It is required to maintain a spatial resolution of about 750 m over the entire 3060 km wide swath, which provides global coverage with 12 hour revisit time for cloud imagery under both solar and lunar illumination (down to 1/4 moon).
27
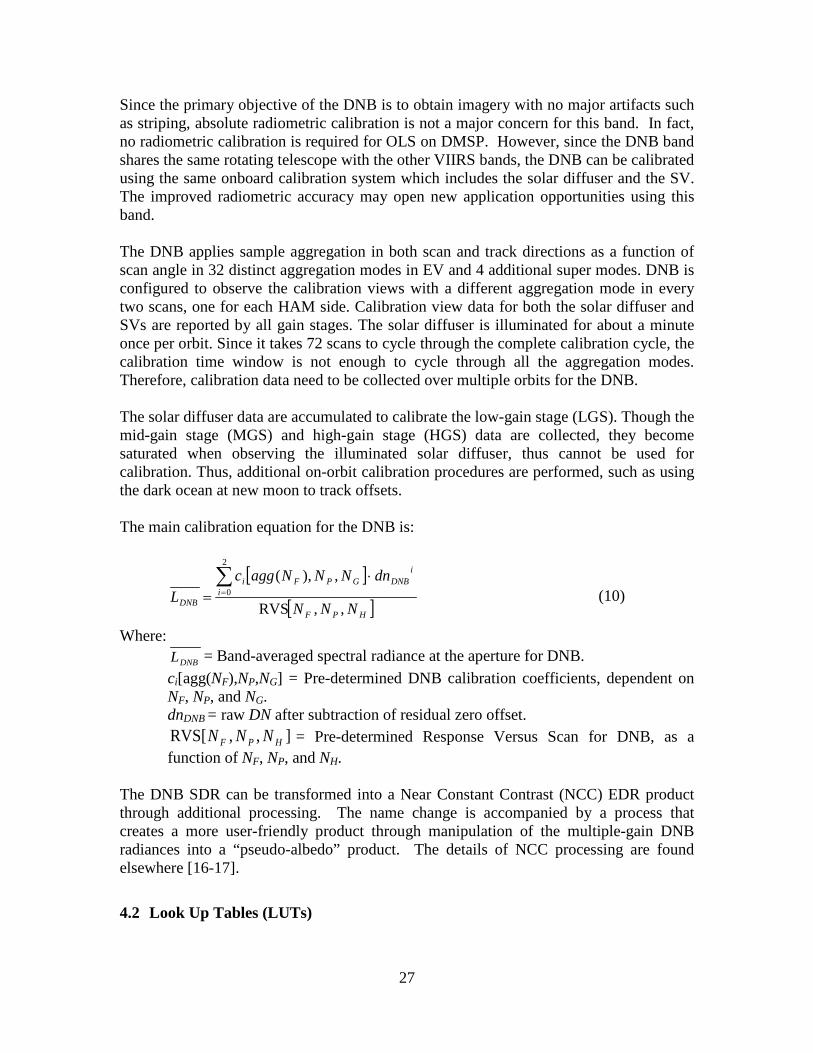
Since the primary objective of the DNB is to obtain imagery with no major artifacts such as striping, absolute radiometric calibration is not a major concern for this band. In fact, no radiometric calibration is required for OLS on DMSP. However, since the DNB band shares the same rotating telescope with the other VIIRS bands, the DNB can be calibrated using the same onboard calibration system which includes the solar diffuser and the SV. The improved radiometric accuracy may open new application opportunities using this band. The DNB applies sample aggregation in both scan and track directions as a function of scan angle in 32 distinct aggregation modes in EV and 4 additional super modes. DNB is configured to observe the calibration views with a different aggregation mode in every two scans, one for each HAM side. Calibration view data for both the solar diffuser and SVs are reported by all gain stages. The solar diffuser is illuminated for about a minute once per orbit. Since it takes 72 scans to cycle through the complete calibration cycle, the calibration time window is not enough to cycle through all the aggregation modes. Therefore, calibration data need to be collected over multiple orbits for the DNB. The solar diffuser data are accumulated to calibrate the low-gain stage (LGS). Though the mid-gain stage (MGS) and high-gain stage (HGS) data are collected, they become saturated when observing the illuminated solar diffuser, thus cannot be used for calibration. Thus, additional on-orbit calibration procedures are performed, such as using the dark ocean at new moon to track offsets. The main calibration equation for the DNB is:
[ ]
[ ]HPF
i
iDNBGPFi
DNB NNN
dnNNNaggcL
,,RVS
,),(2
0∑=
⋅= (10)
Where:
DNBL = Band-averaged spectral radiance at the aperture for DNB. ci[agg(NF),NP,NG] = Pre-determined DNB calibration coefficients, dependent on
NF, NP, and NG. dnDNB = raw DN after subtraction of residual zero offset.
],,RVS[ HPF NNN = Pre-determined Response Versus Scan for DNB, as a function of NF, NP, and NH.
The DNB SDR can be transformed into a Near Constant Contrast (NCC) EDR product through additional processing. The name change is accompanied by a process that creates a more user-friendly product through manipulation of the multiple-gain DNB radiances into a “pseudo-albedo” product. The details of NCC processing are found elsewhere [16-17].
4.2 Look Up Tables (LUTs)
28
The VIIRS SDR software uses the look up tables (LUTs) extensively for the calibration input parameters. Using pre-launch measurements, many LUTs and other data required for calibration are generated. Currently 41 LUTs are used in the IDPS for the generation of VIIRS SDRs. These LUTs capture the measured values of the parameters appearing in the radiometric and geolocation equations implemented in the SDR algorithm for different bands, detectors, gain states, scan mirror side, electronics configuration, and instrument temperatures. This data typically covers a broad, multi-dimensional parameter space which is unique to each algorithm. The forms of the equations that express retrieved radiance or reflectance in terms of DNs measured on orbit and a set of parameter values are assumed to be fixed. The VIIRS calibration requirements impose stringent derived requirements on the uncertainties of these LUT parameters, particularly those that cannot be updated by on-orbit calibration activities. The test program also provides the performance baseline for the on-orbit long-term monitoring and trending of instrument characteristics.
5. Geolocation and Geometric Performance Knowledge of the Earth location (geolocation) latitude and longitude is essential to put the VIIRS data in a geographic context and with other spatially referenced data sets, including other VIIRS data, and to provide a uniform, worldwide spatial reference system for all data products. Although the output seen in an SDR is an array of data, for a number of reasons such as the terrain relief parallax and the “bow-tie” effect described in Section 2.1.1, the actual measurements from VIIRS are not necessarily contiguous within the array. Therefore, each geolocation data point should be used to accurately georeference the data, especially when using data from multiple scans.
5.1 Geolocation Algorithm The VIIRS geolocation algorithm is part of the VIIRS raw data processing software. Its purpose is to provide Earth location and related spatial information for the various VIIRS data products. The geolocation algorithm uses Earth ellipsoid, geoid and terrain surface information in conjunction with spacecraft ephemeris and attitude data, and knowledge of the VIIRS instrument and satellite geometry to compute geodetic coordinates (latitude and longitude) and related parameters for each SDR pixel. The heart of the algorithm is a mathematical procedure that intersects the VIIRS instrument's line-of-sight vector with the WGS84 (World Geodetic System 1984) ellipsoid and with the Earth's geoid and terrain surface defined by the digital elevation model based on the SRTM30 Version 2 data (which uses USGS GTOPO30 data for areas north of 60° N and south of 60° S). Intersecting the line-of-sight with the Earth surface and with the ellipsoid generates two sets of geolocation data: with and without terrain correction, respectively. Both sets are provided in separate SDR geolocation products. Adjusting the geolocation for terrain height rectifies the terrain relief parallax, the high spatial frequency variations in the
29
locations of off-nadir pixels caused by differences in surface elevation. When effects of the parallax are not corrected, pixels in data sets acquired with different viewing geometry can be incorrectly located relative to each other in areas of high relief. The geolocation data are computed for each VIIRS pixel in the M-band, I-band, and DNB SDR products and stored in the following fields:
• Geodetic latitude • Longitude • Height
o Geoid height above Ellipsoid (for SDR geolocation products without terrain correction for M, I and DNB geolocation files)
o Surface height above ellipsoid (geoid height + height above geoid) (for terrain-corrected SDR geolocation products for M-band and I-band geolocation files. Terrain-corrected DNB geolocation was not in the original design but is being added.)
• Satellite zenith angle • Satellite azimuth • Range to the satellite • Solar zenith angle • Solar azimuth • Lunar zenith angle (DNB only) • Lunar azimuth (DNB only) • Lunar phase (DNB only, one per granule)
The zenith angles are measured with respect to the local normal, and the azimuths are relative to the local geodetic North. In addition to the ellipsoid, geoid, and surface elevation data described above, the geolocation algorithm requires the following inputs defined by the internal geometry of the VIIRS instrument and the spacecraft:
• Effective Focal Length • FPA-to-Aft-Optics Rotation • HAM Wedge Angle • RTA Encoder-to-Angle Conversion • HAM Encoder-to-Angle Conversion • Aft-Optics-to-Instrument Transformation Matrix • HAM-to-Instrument Transformation Matrix • RTA-to-Instrument Transformation Matrix • Entrance Aperture Basis Vectors in Telescope Coordinate System • Deviation of Exit Aperture Basis Vectors from Telescope Coordinate Axes • Instrument-to-Spacecraft Transformation Matrix • Band Center x, y Offsets • Detector Center spacing in Track
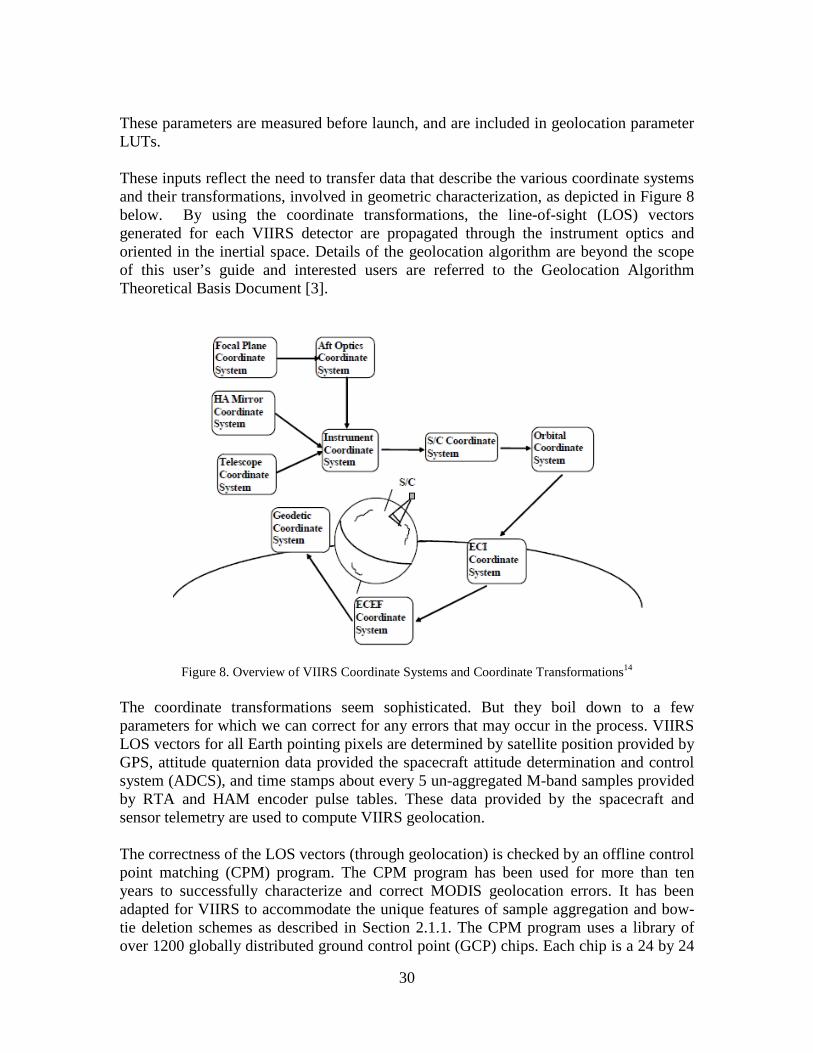
30
These parameters are measured before launch, and are included in geolocation parameter LUTs. These inputs reflect the need to transfer data that describe the various coordinate systems and their transformations, involved in geometric characterization, as depicted in Figure 8 below. By using the coordinate transformations, the line-of-sight (LOS) vectors generated for each VIIRS detector are propagated through the instrument optics and oriented in the inertial space. Details of the geolocation algorithm are beyond the scope of this user’s guide and interested users are referred to the Geolocation Algorithm Theoretical Basis Document [3].
Figure 8. Overview of VIIRS Coordinate Systems and Coordinate Transformations14
The coordinate transformations seem sophisticated. But they boil down to a few parameters for which we can correct for any errors that may occur in the process. VIIRS LOS vectors for all Earth pointing pixels are determined by satellite position provided by GPS, attitude quaternion data provided the spacecraft attitude determination and control system (ADCS), and time stamps about every 5 un-aggregated M-band samples provided by RTA and HAM encoder pulse tables. These data provided by the spacecraft and sensor telemetry are used to compute VIIRS geolocation. The correctness of the LOS vectors (through geolocation) is checked by an offline control point matching (CPM) program. The CPM program has been used for more than ten years to successfully characterize and correct MODIS geolocation errors. It has been adapted for VIIRS to accommodate the unique features of sample aggregation and bow-tie deletion schemes as described in Section 2.1.1. The CPM program uses a library of over 1200 globally distributed ground control point (GCP) chips. Each chip is a 24 by 24
31
km Landsat sub-scenes based on the 30 m resolution red band. These chips are used to simulate images of VIIRS band I1 375 m nadir resolution with their corresponding projection of ideal point spread function (PSF). The simulated images are then correlated with VIIRS images. The shift in a VIIRS simulated image location at the maximum cross-correlation with the control point is the control point residual. These residuals are analyzed for corrections of various sensor parameters stored in the geolocation algorithm LUT. This band I1 geolocation error correction is transferred to other M- and I-bands through knowledge of the band-to-band registration (BBR). Currently, the Instrument-to-Spacecraft Transformation Matrices in the LUTs are corrected for geolocation errors for M-band, I-band and DNB geolocation. Since DNB was not required to be aligned with other bands with specification, additional DNB geolocation error is corrected for through Band Center x, y Offsets in DNB geolocation LUT, using a method similar to CPM program. There may be secondary trends of geolocation errors with respect to HAM Wedge Angles and other parameters not listed in the LUTs such as sun angle and seasonal variation. They may need to be further corrected by refining geolocation parameter LUTs, as is done for the MODIS geolocation.
5.2 Band-to-band Registration (BBR) BBR is the degree to which footprints of corresponding pixels from different bands overlap in both the track and scan directions. Such co-registration is critical for EDRs that use data from multiple bands, as most EDRs do. Band-to-band registration within the VIIRS electronics produces nominally aligned samples from I- and M-bands. A moderate resolution frame (i.e., 16 along-track M-band pixels assigned to a particular observation time) has nearly the same ground coverage as two I-band frames of 32 along-track pixels per I-band frame. This band-to-band registration allows geolocation to be performed quite accurately to an “ideal” band target where the “ideal” band is chosen to be near the VIIRS optical axis and as the best representation of all bands of a particular resolution. However, there are factors that may induce pixel footprint from one band to not be exactly on top of the corresponding pixel footprint from another band. Some factors include mis-match between scan rate and effective focal length, structural mis-placement of the FPAs, thermal distortion, g-release, and on-orbit jitter. Table 7 tabulates the BBR performance in the upper right triangle from ground test (“static” without dynamic effects from launch, g-release and on-orbit jitter) at nominal temperature plateau under thermal vacuum conditions. The lower left triangle lists the BBR specifications.
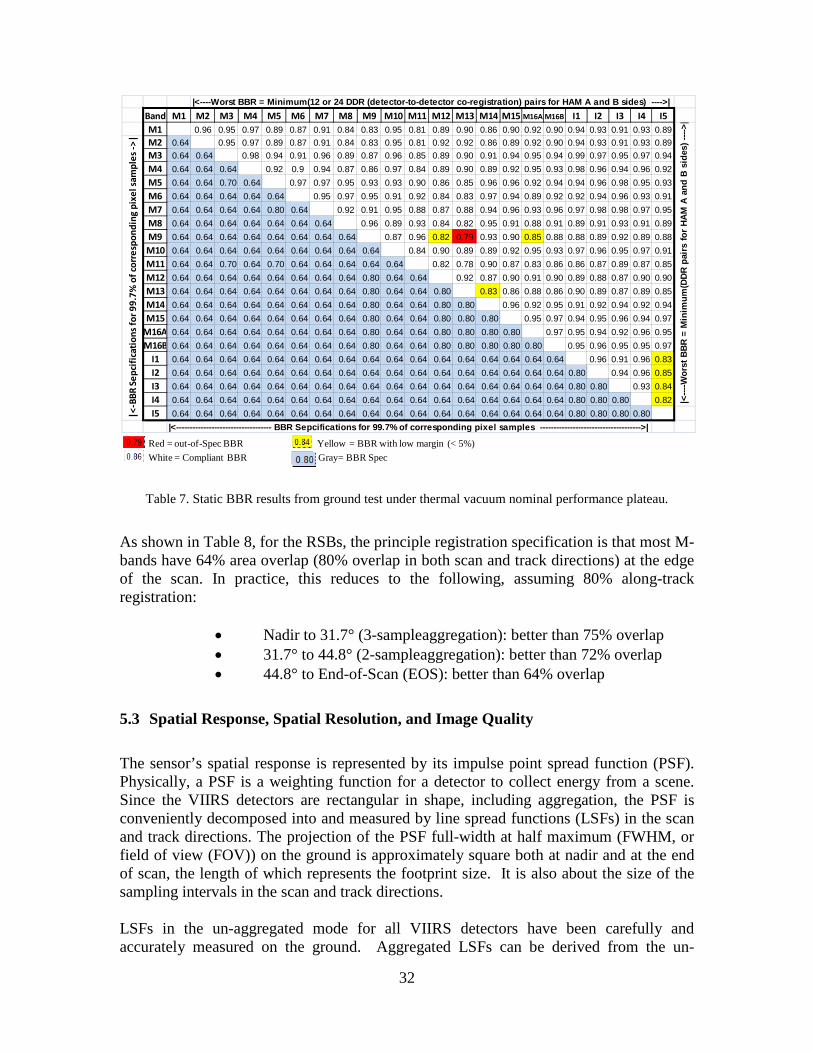
32
Table 7. Static BBR results from ground test under thermal vacuum nominal performance plateau.
As shown in Table 8, for the RSBs, the principle registration specification is that most M-bands have 64% area overlap (80% overlap in both scan and track directions) at the edge of the scan. In practice, this reduces to the following, assuming 80% along-track registration:
• Nadir to 31.7° (3-sampleaggregation): better than 75% overlap • 31.7° to 44.8° (2-sampleaggregation): better than 72% overlap • 44.8° to End-of-Scan (EOS): better than 64% overlap
5.3 Spatial Response, Spatial Resolution, and Image Quality The sensor’s spatial response is represented by its impulse point spread function (PSF). Physically, a PSF is a weighting function for a detector to collect energy from a scene. Since the VIIRS detectors are rectangular in shape, including aggregation, the PSF is conveniently decomposed into and measured by line spread functions (LSFs) in the scan and track directions. The projection of the PSF full-width at half maximum (FWHM, or field of view (FOV)) on the ground is approximately square both at nadir and at the end of scan, the length of which represents the footprint size. It is also about the size of the sampling intervals in the scan and track directions. LSFs in the un-aggregated mode for all VIIRS detectors have been carefully and accurately measured on the ground. Aggregated LSFs can be derived from the un-
Band M1 M2 M3 M4 M5 M6 M7 M8 M9 M10 M11 M12 M13 M14 M15 M16A M16B I1 I2 I3 I4 I5M1 0.96 0.95 0.97 0.89 0.87 0.91 0.84 0.83 0.95 0.81 0.89 0.90 0.86 0.90 0.92 0.90 0.94 0.93 0.91 0.93 0.89M2 0.64 0.95 0.97 0.89 0.87 0.91 0.84 0.83 0.95 0.81 0.92 0.92 0.86 0.89 0.92 0.90 0.94 0.93 0.91 0.93 0.89M3 0.64 0.64 0.98 0.94 0.91 0.96 0.89 0.87 0.96 0.85 0.89 0.90 0.91 0.94 0.95 0.94 0.99 0.97 0.95 0.97 0.94M4 0.64 0.64 0.64 0.92 0.9 0.94 0.87 0.86 0.97 0.84 0.89 0.90 0.89 0.92 0.95 0.93 0.98 0.96 0.94 0.96 0.92M5 0.64 0.64 0.70 0.64 0.97 0.97 0.95 0.93 0.93 0.90 0.86 0.85 0.96 0.96 0.92 0.94 0.94 0.96 0.98 0.95 0.93M6 0.64 0.64 0.64 0.64 0.64 0.95 0.97 0.95 0.91 0.92 0.84 0.83 0.97 0.94 0.89 0.92 0.92 0.94 0.96 0.93 0.91M7 0.64 0.64 0.64 0.64 0.80 0.64 0.92 0.91 0.95 0.88 0.87 0.88 0.94 0.96 0.93 0.96 0.97 0.98 0.98 0.97 0.95M8 0.64 0.64 0.64 0.64 0.64 0.64 0.64 0.96 0.89 0.93 0.84 0.82 0.95 0.91 0.88 0.91 0.89 0.91 0.93 0.91 0.89M9 0.64 0.64 0.64 0.64 0.64 0.64 0.64 0.64 0.87 0.96 0.82 0.79 0.93 0.90 0.85 0.88 0.88 0.89 0.92 0.89 0.88M10 0.64 0.64 0.64 0.64 0.64 0.64 0.64 0.64 0.64 0.84 0.90 0.89 0.89 0.92 0.95 0.93 0.97 0.96 0.95 0.97 0.91M11 0.64 0.64 0.70 0.64 0.70 0.64 0.64 0.64 0.64 0.64 0.82 0.78 0.90 0.87 0.83 0.86 0.86 0.87 0.89 0.87 0.85M12 0.64 0.64 0.64 0.64 0.64 0.64 0.64 0.64 0.80 0.64 0.64 0.92 0.87 0.90 0.91 0.90 0.89 0.88 0.87 0.90 0.90M13 0.64 0.64 0.64 0.64 0.64 0.64 0.64 0.64 0.80 0.64 0.64 0.80 0.83 0.86 0.88 0.86 0.90 0.89 0.87 0.89 0.85M14 0.64 0.64 0.64 0.64 0.64 0.64 0.64 0.64 0.80 0.64 0.64 0.80 0.80 0.96 0.92 0.95 0.91 0.92 0.94 0.92 0.94M15 0.64 0.64 0.64 0.64 0.64 0.64 0.64 0.64 0.80 0.64 0.64 0.80 0.80 0.80 0.95 0.97 0.94 0.95 0.96 0.94 0.97
M16A 0.64 0.64 0.64 0.64 0.64 0.64 0.64 0.64 0.80 0.64 0.64 0.80 0.80 0.80 0.80 0.97 0.95 0.94 0.92 0.96 0.95M16B 0.64 0.64 0.64 0.64 0.64 0.64 0.64 0.64 0.80 0.64 0.64 0.80 0.80 0.80 0.80 0.80 0.95 0.96 0.95 0.95 0.97
I1 0.64 0.64 0.64 0.64 0.64 0.64 0.64 0.64 0.64 0.64 0.64 0.64 0.64 0.64 0.64 0.64 0.64 0.96 0.91 0.96 0.83I2 0.64 0.64 0.64 0.64 0.64 0.64 0.64 0.64 0.64 0.64 0.64 0.64 0.64 0.64 0.64 0.64 0.64 0.80 0.94 0.96 0.85I3 0.64 0.64 0.64 0.64 0.64 0.64 0.64 0.64 0.64 0.64 0.64 0.64 0.64 0.64 0.64 0.64 0.64 0.80 0.80 0.93 0.84I4 0.64 0.64 0.64 0.64 0.64 0.64 0.64 0.64 0.64 0.64 0.64 0.64 0.64 0.64 0.64 0.64 0.64 0.80 0.80 0.80 0.82I5 0.64 0.64 0.64 0.64 0.64 0.64 0.64 0.64 0.64 0.64 0.64 0.64 0.64 0.64 0.64 0.64 0.64 0.80 0.80 0.80 0.80
|<----------------------------------- BBR Sepcifications for 99.7% of corresponding pixel samples ------------------------------------->|
|<----Worst BBR = Minimum(12 or 24 DDR (detector-to-detector co-registration) pairs for HAM A and B sides) ---->|
|<---
-Wor
st B
BR =
Min
imum
(DDR
pai
rs fo
r HAM
A a
nd B
sid
es) -
--->|
|<-B
BR S
epci
ficat
ions
for 9
9.7%
of c
orre
spon
ding
pix
el sa
mpl
es ->
|
Red = out-of-Spec BBR Yellow = BBR with low margin (< 5%)White = Compliant BBR 0. Gray= BBR Spec
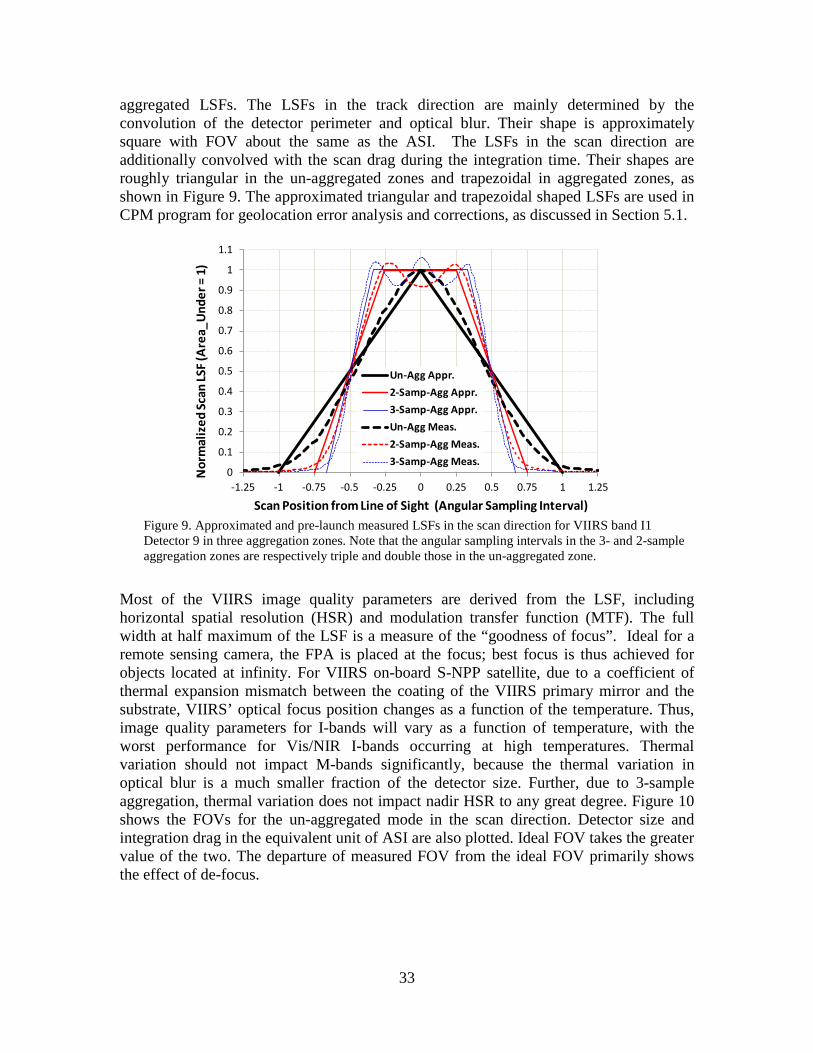
33
aggregated LSFs. The LSFs in the track direction are mainly determined by the convolution of the detector perimeter and optical blur. Their shape is approximately square with FOV about the same as the ASI. The LSFs in the scan direction are additionally convolved with the scan drag during the integration time. Their shapes are roughly triangular in the un-aggregated zones and trapezoidal in aggregated zones, as shown in Figure 9. The approximated triangular and trapezoidal shaped LSFs are used in CPM program for geolocation error analysis and corrections, as discussed in Section 5.1.
Figure 9. Approximated and pre-launch measured LSFs in the scan direction for VIIRS band I1 Detector 9 in three aggregation zones. Note that the angular sampling intervals in the 3- and 2-sample aggregation zones are respectively triple and double those in the un-aggregated zone.
Most of the VIIRS image quality parameters are derived from the LSF, including horizontal spatial resolution (HSR) and modulation transfer function (MTF). The full width at half maximum of the LSF is a measure of the “goodness of focus”. Ideal for a remote sensing camera, the FPA is placed at the focus; best focus is thus achieved for objects located at infinity. For VIIRS on-board S-NPP satellite, due to a coefficient of thermal expansion mismatch between the coating of the VIIRS primary mirror and the substrate, VIIRS’ optical focus position changes as a function of the temperature. Thus, image quality parameters for I-bands will vary as a function of temperature, with the worst performance for Vis/NIR I-bands occurring at high temperatures. Thermal variation should not impact M-bands significantly, because the thermal variation in optical blur is a much smaller fraction of the detector size. Further, due to 3-sample aggregation, thermal variation does not impact nadir HSR to any great degree. Figure 10 shows the FOVs for the un-aggregated mode in the scan direction. Detector size and integration drag in the equivalent unit of ASI are also plotted. Ideal FOV takes the greater value of the two. The departure of measured FOV from the ideal FOV primarily shows the effect of de-focus.
0
0.1
0.2
0.3
0.4
0.5
0.6
0.7
0.8
0.9
1
1.1
-1.25 -1 -0.75 -0.5 -0.25 0 0.25 0.5 0.75 1 1.25
Nor
mal
ized
Sca
n LS
F (A
rea_
Und
er =
1)
Scan Position from Line of Sight (Angular Sampling Interval)
Un-Agg Appr.2-Samp-Agg Appr.3-Samp-Agg Appr.Un-Agg Meas.2-Samp-Agg Meas.3-Samp-Agg Meas.
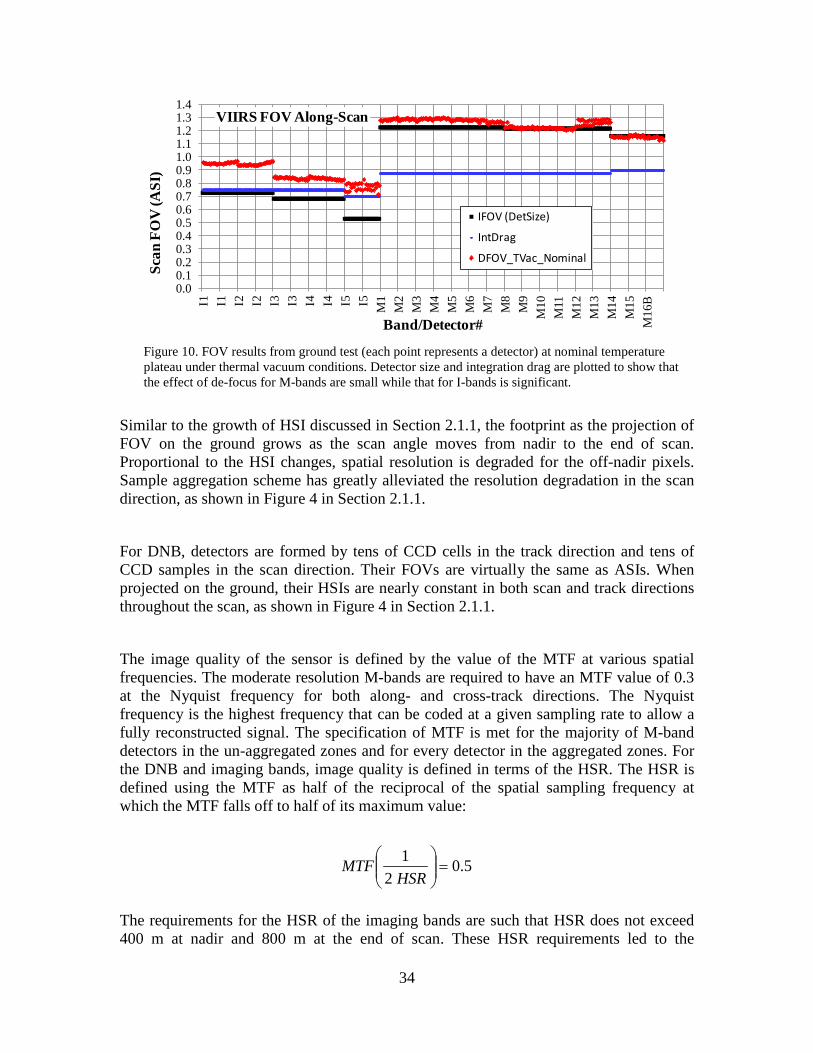
34
Figure 10. FOV results from ground test (each point represents a detector) at nominal temperature plateau under thermal vacuum conditions. Detector size and integration drag are plotted to show that the effect of de-focus for M-bands are small while that for I-bands is significant.
Similar to the growth of HSI discussed in Section 2.1.1, the footprint as the projection of FOV on the ground grows as the scan angle moves from nadir to the end of scan. Proportional to the HSI changes, spatial resolution is degraded for the off-nadir pixels. Sample aggregation scheme has greatly alleviated the resolution degradation in the scan direction, as shown in Figure 4 in Section 2.1.1.
For DNB, detectors are formed by tens of CCD cells in the track direction and tens of CCD samples in the scan direction. Their FOVs are virtually the same as ASIs. When projected on the ground, their HSIs are nearly constant in both scan and track directions throughout the scan, as shown in Figure 4 in Section 2.1.1.
The image quality of the sensor is defined by the value of the MTF at various spatial frequencies. The moderate resolution M-bands are required to have an MTF value of 0.3 at the Nyquist frequency for both along- and cross-track directions. The Nyquist frequency is the highest frequency that can be coded at a given sampling rate to allow a fully reconstructed signal. The specification of MTF is met for the majority of M-band detectors in the un-aggregated zones and for every detector in the aggregated zones. For the DNB and imaging bands, image quality is defined in terms of the HSR. The HSR is defined using the MTF as half of the reciprocal of the spatial sampling frequency at which the MTF falls off to half of its maximum value:
5.02
1=
HSR
MTF
The requirements for the HSR of the imaging bands are such that HSR does not exceed 400 m at nadir and 800 m at the end of scan. These HSR requirements led to the
0.00.10.20.30.40.50.60.70.80.91.01.11.21.31.4
I1 I1 I2 I2 I3 I3 I4 I4 I5 I5 M1
M2
M3
M4
M5
M6
M7
M8
M9
M10
M11
M12
M13
M14
M15
M16
B
Scan
FO
V (A
SI)
Band/Detector#
VIIRS FOV Along-Scan
IFOV (DetSize)
IntDrag
DFOV_TVac_Nominal
35
application of the aggregation scheme in the scan direction, as described above and in more detail in Section 2.1.1. Even though the MTF requirement is only specified for the M-bands, MTF values can be calculated for the DNB and imaging bands and they would meet the M-band specification if the requirement were the same as that for the M-bands.
6. Data Distribution, Access, and Display Similar to the data from other instruments, the S-NPP and JPSS VIIRS data are down-linked to the ground processing system, where the RDRs are calibrated into SDRs, which are used to produce the EDRs. Due to the large volume of VIIRS data, only a portion of the data and EDR products will be used by the Centrals for numerical weather predictions. Local receiving stations or Field Terminals (FTs) will be used to downlink real-time regional data. HDF5 is the standard data format for VIIRS SDRs and EDRs.
6.1 Distribution and Access Two Centrals are recognized as the central hubs in the distribution and access of S-NPP/JPSS data. One central is the AFWA at Offutt Air Force Base, Omaha, NE. On the civilian side, the NOAA/NESDIS facilities at Suitland and College Park is the central hub for the VIIRS data. However, specific data access options are evolving. To support S-NPP launch, the GRAVITE system is used in conjunction with the CLASS for the distribution of RDR, SDR, and EDR to the team members. For most end-users and the general public, the CLASS is probably the best option for data access. While GRAVITE provides single-granule files for geolocation data and for each radiometric band, CLASS combines 4 granules into a single file. In addition, CLASS can supply multiple bands along with geolocation data into a single HDF5 file. CLASS is an online data management system that provides data to user communities and the public with their archived data products and documentation. The data access latency depends on the status of the data with respect to such things as near-line storage. The CLASS web site for data access as well as related information can be found at: http://www.class.noaa.gov. The data access from CLASS is free, although one will need to register an account online. A graphic user interface is provided for searching VIIRS SDR and EDR data sets. Once selected, the order can be checked out and submitted. An email notification will be sent to the email address provided by the user with instructions to download the data through ftp. If large volume of data sets is needed from CLASS, automated scripts can be developed to do so, or special arrangements can be made with the CLASS personnel. To facilitate VIIRS data access, CLASS has also setup an ftp site at ftp://ftp-npp.class.ngdc.noaa.gov/ for all VIIRS SDR data for the last 90 days.
6.2 Data Files and Software Tools
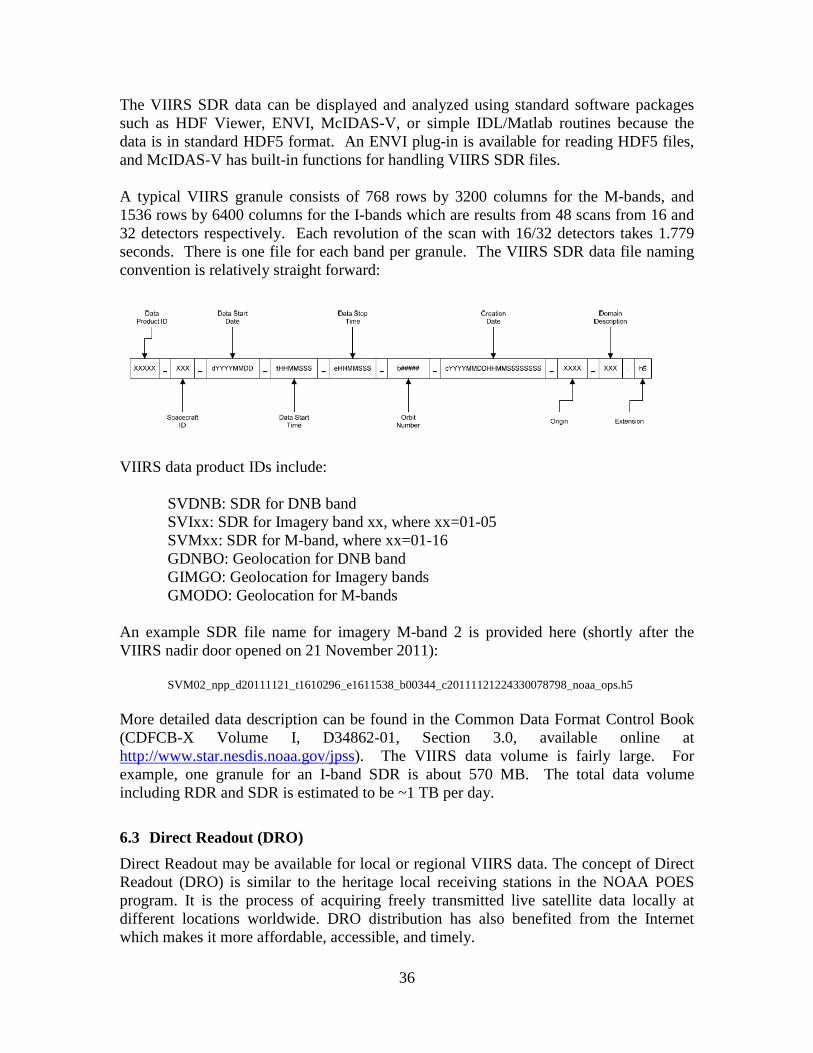
36
The VIIRS SDR data can be displayed and analyzed using standard software packages such as HDF Viewer, ENVI, McIDAS-V, or simple IDL/Matlab routines because the data is in standard HDF5 format. An ENVI plug-in is available for reading HDF5 files, and McIDAS-V has built-in functions for handling VIIRS SDR files. A typical VIIRS granule consists of 768 rows by 3200 columns for the M-bands, and 1536 rows by 6400 columns for the I-bands which are results from 48 scans from 16 and 32 detectors respectively. Each revolution of the scan with 16/32 detectors takes 1.779 seconds. There is one file for each band per granule. The VIIRS SDR data file naming convention is relatively straight forward:
VIIRS data product IDs include: SVDNB: SDR for DNB band SVIxx: SDR for Imagery band xx, where xx=01-05 SVMxx: SDR for M-band, where xx=01-16
GDNBO: Geolocation for DNB band GIMGO: Geolocation for Imagery bands GMODO: Geolocation for M-bands An example SDR file name for imagery M-band 2 is provided here (shortly after the VIIRS nadir door opened on 21 November 2011):
SVM02_npp_d20111121_t1610296_e1611538_b00344_c20111121224330078798_noaa_ops.h5 More detailed data description can be found in the Common Data Format Control Book (CDFCB-X Volume I, D34862-01, Section 3.0, available online at http://www.star.nesdis.noaa.gov/jpss). The VIIRS data volume is fairly large. For example, one granule for an I-band SDR is about 570 MB. The total data volume including RDR and SDR is estimated to be ~1 TB per day.
6.3 Direct Readout (DRO) Direct Readout may be available for local or regional VIIRS data. The concept of Direct Readout (DRO) is similar to the heritage local receiving stations in the NOAA POES program. It is the process of acquiring freely transmitted live satellite data locally at different locations worldwide. DRO distribution has also benefited from the Internet which makes it more affordable, accessible, and timely.
37
In the DRO design, the software and algorithms used is the same operational algorithms and data format as the IDPS. One important difference is that the products will start and end with the local overpass. As a result, they will not directly align in timestamp with the products that might be produced at the IDPS for global data. FTs will be located worldwide, including land- and ship-based, fixed, and mobile deployments. Only HRD FTs will be implemented for S-NPP. HRD will be accessible on X-band at 12-15 Mbps. The International Polar Orbiter Processing Package (IPOPP) software package will enable the user community to smoothly transition from EOS to S-NPP and, ultimately, JPSS. The IPOPP will host the government-sanctioned algorithms that will enable the community to process, visualize, and evaluate S-NPP SDRs and EDRs. The implementation of IPOPP provides the user community with user-friendly processing packages for regionally optimized applications, enables a global feedback loop for S-NPP cal/val campaigns, facilitates the research-to-operations for the S-NPP/JPSS DRO mission, and allows industry to integrate government-provided technology into their product lines tailored to their customers’ requirements. More detailed information on DRO is available from http://directreadout.sci.gsfc.nasa.gov.
7. References The main sources that may be of direct interest and utility to the SDR users are the ATBDs for calibration, geolocation, and common data format control which are readily available from the JPSS website at http://www.star.nesdis.noaa.gov/jpss. Users may find the following documents particularly useful: 1. VIIRS Radiometric Calibration Algorithm Theoretical Basis Document ATBD, 22
April 2011 2. Visible/Infrared Imager/Radiometer Suite (VIIRS) Sensor Data Record (SDR)
Calibration Plan for NPP, Northrop Grumman Space and Mission Systems Corporation, D47854-01-B, 17 September 2010.
3. NASA Joint Polar Satellite System (JPSS) Ground Project, “Joint Polar Satellite System (JPPS) VIIRS Geolocation Algorithm Theoretical Basis Document (ATBD)”, document No. 474-00053, Goddard Space Flight Center, Greenbelt, Maryland, 31 July 2011.
4. NPOESS Operational Algorithm Description Document for VIIRS Geolocation (GEO) Sensor Data Record (SDR) and Calibration (CAL) SDR, Raytheon Company, D41868, 29 September 2010.
5. Operational Concept Description – VIIRS, The Raytheon Company, OCD154640-101, 13 September 2005.
6. Mooneyham, Carrie, Discussion on SDSM Positioning, The Raytheon Company, Y22114, 15 February 2007.
38
7. Prime Item Development Specification (PIDS) – VIIRS, The Raytheon Company, PS154640-103, 18 January 2006.
8. NPOESS System Specification, Northrop Grumman Space Technology, SY15-0007, 20 August 2003.
9. VIIRS Command, Telemetry, Science & Engineering Data Description, Revision P, The Raytheon Company, EDD154640-104, 16 October 2009.
10. VIIRS Alarm Limit Definitions and Response Handbook, The Raytheon Company, EDD154640-155, 4 November 2008.
11. NPOESS Common Data Format Control Book - External, Vols. I – VIII, Northrop Grumman Airborne Systems, D34862-01, 22 July 2010.
12. Cao, C., F. DeLuccia, and J. Xiong, Presentation at the NPP VIIRS SDR data user readiness, NPP user readiness workshop, IGARSS, 2011, available from https://cs.star.nesdis.noaa.gov/NCC/VIIRS
13. Cao, C., E. Vermote, X. Xiong, Using AVHRR Lunar Observations for NDVI Long-term Climate Change Detection, Journal of Geophysical Research, 114, D20105, 9 pp., 2009 doi:10.1029/2009JD012179
14. Gleason, J., J. Butler, and C. Hsu, NPP/VIIRS Status, available at: http://modis.gsfc.nasa.gov/sci_team/meetings/201105/presentations/plenary/gleason.pptx
15. Cao, C., F. DeLuccia, X. Xiong, R. Wolfe, and F. Weng, Early On-orbit Performance of the Visible Infrared Imaging Radiometer Suite (VIIRS) onboard the Suomi National Polar-orbiting Partnership (S-NPP) Satellite, IEEE Transaction on Geoscience and Remote Sensing, in press, 2013.
16. Joint Polar Satellite System (JPSS_ Operational Algorithm Description (OAD) Document for VIIRS Near Constant Contrast (NCC) Imagery Environmental Data Record (EDR), Revision A, 2012.
17. Joint Polar Satellite System (JPSS) VIIRS Imagery Products Algorithm Theoretical Basis Document (ATBD), 2011.
8. Acknowledgements The authors would like to thank Drs. Lihang Zhou, Laurie Rokke, Fuzhong Weng, Xi Shao, and Mr. Sirish Uprety for their critical review, comments, and suggestions for this manuscript. Thanks are extended to all VIIRS SDR and EDR team members for their hard work validating and ensuring the VIIRS SDR data quality. Funding for this work was provided by the NOAA JPSS program. The manuscript contents are solely the opinions of the authors and do not constitute a statement of policy, decision, or position on behalf of NOAA or the U.S. government.
39
9. Appendix: Acronyms (and Abbreviations) Used in this Report ADCS Attitude Determination and Control System AFWA Air Force Weather Agency AP Application Packet APID Application Packet Identifier ARP Application-Related Products ASI Angular Sampling Interval ATBD Algorithm Theoretical Basis Document ATMS Advanced Technology Microwave Sounder AVHRR Advanced Very-high Resolution Radiometer A/D Analog-to-Digital BB Blackbody BBR Band-to-Band Registration Cal/Val Calibration and Validation CCD Charge-Coupled Device CDFCB Common Data Format Control Book CCSDS Consultative Committee for Space Data System CEOS Committee on Earth Observation Satellites CERES Clouds and Earth's Radiant Energy System CGS Common Ground System CKB Calibration Knowledge Base CLASS Comprehensive Large-array Stewardship System CPM Control Point Matching CrIS Cross-track Infrared Sounder CSE Calibration System Evaluation C3S Command, Control, and Communications Segment DMSP Defense Meteorological Satellite System DN Digital Number DNB Day-Night-Band DoD Department of Defense DRO Direct ReadOut EDR Environmental Data Record ENVI Exelis Visual Information Solutions EOC Early Orbit Checkout EOS Earth Observing System EUMETSAT European Organisation for the Exploitation of Meteorological Satellites EV Earth View FOV Field Of View FPA Focal Plane Assembly FPF Functional Performance & Format (evaluation) FT Field Terminals GAC Global Area Coverage GCP Ground Control Point GIFOV Ground Instantaneous Field Of View GPS Global Positioning System

40
GRAVITE Government Resource for Algorithm Verification, Independent Testing, and Evaluation
GSFC Goddard Space Flight Center GTM Ground Track Mercator HAM Half Angle Mirror HDF Hierarchical Data Format HGS High-Gain Stage HRD High Rate Data HSI Horizontal Sampling Interval ICV Intensive Calibration/Validation ID IDentification IDL Interactive Data Language IDP Interface Data Processor IDPS Interface Data Processing Segment IP Intermediate Products IPOPP International Polar Orbiter Processing Package I-band Imagery-resolution band JPSS Joint Polar Satellite System KPP Key Performance Parameter LAC Local Area Coverage LGS Low-Gain Stage LLLS Low-Level Light Sensor LOS Line-Of-Sight LSF Line Spread Function LTA Long-term Archive LTM Long-Term Monitoring LUT Look Up Table LWIR LongWave InfraRed McIDAS Man computer Interactive Data Access System MetOp Meteorological Operational (satellite) MGS Mid-Gain Stage MOBY Marine Optical Buoy MODIS Moderate-resolution Imaging Spectroradiometer MTF Modulation Transfer Function MWIR MediumWave InfraRed M-band Moderate-resolution band NASA National Aeronautics and Space Administration NCC Near Constant Contrast NCEP National Centers for Environmental Prediction NEdT Noise-Equivalent change in Temperature NESDIS National Environmental Satellite, Data, and Information Service NIR Near InfraRed NIST National Institute for Standards and Technology NOAA National Oceanic and Atmospheric Administration NPOESS National Polar-Orbiting Environmental Satellite System NPP (Suomi) National Polar-orbiting Partnership
41
NSOF NOAA Satellite Operations Facility OLS Operational Linescan System OMPS Ozone Mapping Profiler Suite OPSCON OPerationS CONcept PMT PhotoMultiplier Tube POES Polar Orbiting Environmental Satellite PRT Platinum Resistance Thermometer PTT Performance and Telemetry Trending QF Quality Flag RDR Raw Data Record RSB Reflective Solar Band RSR Relative Spectral Response RTA Rotating Telescope Assembly RVS Response-Versus-Scan-angle SD Solar Diffuser SDR Sensor Data Record SDSM Solar Diffuser Stability Monitor SeaWiFS Sea-viewing Wide Field-of-view Sensor SIRCUS Spectral Irradiance and Radiance Responsivity Calibrations using Uniform
Sources SNO Simultaneous Nadir Overpass STAR Center for Satellite Applications and Research SV Space View SWIR ShortWave InfraRed S-NPP Suomi National Polar-orbiting Partnership TDI Time-Delay and Integration TEB Thermal Emissive Band TIROS Television and InfraRed Observation Satellite TOA Top of Atmosphere UML Unified Modeling Language USGS US Geological Survey VIIRS Visible Infrared Imaging Radiometer Suite WGS World Geodetic System
42
NESDIS 122 JCSDA Community Radiative Transfer Model (CRTM). Yong Han, Paul van Delst, Quanhua Liu, Fuzhong Weng, Banghua Yan, Russ Treadon, and John Derber, December 2005.
NESDIS 123 Comparing Two Sets of Noisy Measurements. Lawrence E. Flynn, April 2007. NESDIS 124 Calibration of the Advanced Microwave Sounding Unit-A for NOAA-N’. Tsan Mo,
September 2007. NESDIS 125 The GOES-13 Science Test: Imager and Sounder Radiance and Product Validations.
Donald W. Hillger and Timothy J. Schmit, September 2007. NESDIS 126 A QA/QC Manual of the Cooperative Summary of the Day Processing System.
William E. Angel, January 2008. NESDIS 127 The Easter Freeze of April 2007: A Climatological Perspective and Assessment of
Impacts and Services. Ray Wolf, Jay Lawrimore, April 2008. NESDIS 128 Influence of the ozone and water vapor on the GOES Aerosol and Smoke Product
(GASP) retrieval. Hai Zhang, Raymond Hoff, Kevin McCann, Pubu Ciren, Shobha Kondragunta, and Ana Prados, May 2008.
NESDIS 129 Calibration and Validation of NOAA-19 Instruments. Tsan Mo and Fuzhong Weng, editors, July 2009.
NESDIS 130 Calibration of the Advanced Microwave Sounding Unit-A Radiometer for METOP-B. Tsan Mo, August 2010.
NESDIS 131 The GOES-14 Science Test: Imager and Sounder Radiance and Product Validations. Donald W. Hillger and Timothy J. Schmit, August 2010.
NESDIS 132 Assessing Errors in Altimetric and Other Bathymetry Grids. Karen M. Marks and Walter H.F. Smith, January 2011.
NESDIS 133 The NOAA/NESDIS Near Real Time CrIS Channel Selection for Data Assimilation and Retrieval Purposes. Antonia Gambacorta and Chris Barnet, August 2011.
NESDIS 134 Report from the Workshop on Continuity of Earth Radiation Budget (CERB) Observations: Post-CERES Requirements. John J. Bates and Xuepeng Zhao, May 2011.
NESDIS 135 Averaging along-track altimeter data between crossover points onto the midpoint gird: Analytic formulas to describe the resolution and aliasing of the filtered results. Chang-Kou Tai, August 2011.
NESDIS 136 Separating the Standing and Net Traveling Spectral Components in the Zonal-Wavenumber and Frequency Spectra to Better Describe Propagating Features in Satellite Altimetry. Chang-Kou Tai, August 2011.
NESDIS 137 Water Vapor Eye Temperature vs. Tropical Cyclone Intensity. Roger B. Weldon, August 2011.
NESDIS 138 Changes in Tropical Cyclone Behavior Related to Changes in the Upper Air Environment. Roger B. Weldon, August 2011.
NESDIS 139 Computing Applications for Satellite Temperature Datasets: A Performance Evaluation of Graphics Processing Units. Timothy F.R. Burgess and Scott F. Heron, January 2011.
NESDIS 140 Microburst Nowcasting Applications of GOES. Ken Pryor, September 2011. NESDIS 141 The GOES-15 Science Test: Imager and Sounder Radiance and Product Validations. Donald W. Hillger and Timothy J. Schmit, November 2011.

43
NOAA SCIENTIFIC AND TECHNICAL PUBLICATIONS
The National Oceanic and Atmospheric Administration was established as part of the Department of Commerce on October 3, 1970. The mission responsibilities of NOAA are to assess the socioeconomic impact of natural and technological changes in the environment and to monitor and predict the state of the solid Earth, the oceans and their living resources, the atmosphere, and the space environment of the Earth.
The major components of NOAA regularly produce various types of scientific and technical information in the following types of publications
PROFESSIONAL PAPERS – Important definitive research results, major techniques, and special investigations. CONTRACT AND GRANT REPORTS – Reports prepared by contractors or grantees under NOAA sponsorship. ATLAS – Presentation of analyzed data generally in the form of maps showing distribution of rainfall, chemical and physical conditions of oceans and atmosphere, distribution of fishes and marine mammals, ionospheric conditions, etc.
TECHNICAL SERVICE PUBLICATIONS – Reports containing data, observations, instructions, etc. A partial listing includes data serials; prediction and outlook periodicals; technical manuals, training papers, planning reports, and information serials; and miscellaneous technical publications. TECHNICAL REPORTS – Journal quality with extensive details, mathematical developments, or data listings. TECHNICAL MEMORANDUMS – Reports of preliminary, partial, or negative research or technology results, interim instructions, and the like.
U.S. DEPARTMENT OF COMMERCE National Oceanic and Atmospheric Administration
National Environmental Satellite, Data, and Information Service Washington, D.C. 20233