Educational Intervention to Improve Self-Efficacy and Self ...

No Free Lunch: Using Technology toImprove the Efficacy of School Feeding
ProgramsBrookings, Delhi
Sisir Debnath 1 Sheetal Sekhri 2
1Indian School of Business2University of Virginia
July 27, 2018

Welfare Programs in Developing Countries
I Leakages and inefficiencies in social welfare programs.
I Benefits often do not reach the intended beneficiaries (WorldBank, 2003).
I Institutional capacity to implement programs is thin enough tobeing labelled ‘Failing’ (Pritchett, 2009).
I This results in undermining of development outcomes.
I Revamping the entire system is costly and implausible.
I Are there scalable, low cost mechanisms to improve currentinstitutional capacity?

Related Literature
I Incentive to teachers based on attendance (Duflo, Hanna, andRyan 2012)
I Biometric attendance technology improved attendance of publichealth workers by 15 percent (Dhaliwal and Hanna, 2016)
I Biometrically-authenticated payments lead to a reduction inleakages in public programs (Muralidharan, Niehaus, Sukhtankar,2016)
I Community monitoring versus audits (Olken, 2007)

Context and Study
I MDM, initiated in 1995 to combat malnutrition among schoolgoing children.
I Entitles each enrolled child to a meal on the school premises eachday
→ Currently benefits 120 million primary school going children.
I Anecdotal evidence that the program is fraught with leakages.
I Challenge: Information provided by middle level bureaucrats forperformance assessment.
I Room for siphoning and over reporting beneficiary take up.
I How to improve information flow from grass root level to the toptier?

The Policy Reform
I In 2012, Bihar side stepped the beneficiary take-up informationprovided by the middle tier of the delivery machinery andintroduced IVRS.
I IVRS is a fully automated platform that calls one school teacher inevery school every day to record provision of meal.
I Reasons to expect Improvements.
→ Information provided by the middle tier can be cross tallied.→ Non performing schools can be identified and middle tier
bureaucrats held accountable for improving the cases.→ Beneficiary take up information is accessible to the public through
a web-interface.

Main Empirical Challenges
I We can examine changes within districts of Bihar before and afterthe program.
I Eliminates concerns that time invariant districts characteristics (eg.distance from the capital) could be confounding the effects.
I But cannot rule out that unobserved secular trends are responsiblefor changes that we are falsely attributing to the policy.
I Use districts from the neighboring states with comparable profilesas controls.

Main Empirical Challenges
I Compare outcomes in Bihar districts before and after the policychange to the control districts (DiD)
I Control for a wide variety of time varying controls variables
I Further allay selection concerns by:
→ Estimating a generalized DiD (matching on baseline characteristicsand then carrying out DiD)
→ Control for district-specific trends

Road Map
I Background about the MDM delivery system and the IVRS reform.
I Data and Contextual Information.
I Estimation Strategy.
I Results.
I Robustness Checks.
I Concluding remarks.

Mid Day Meals
I 1995: The National Program of Nutritional Support to PrimaryEducation launched.
I 2004: Transition from raw grains to cooked meals.
I 2006: Major changes in the program introduced.
→ Micronutrients added to the program→ Minimum calorie requirements increased.→ Coverage expanded to include upper primary grades in
Government and Government aided schools.
I Central government provides free grains, while state governmentsshare cooking costs (conversion costs)
I Grants to schools are either recurring and/or non-recurring.
I These grants vary by school.

Fund Flow
I Schools report their annual requirement to Block ResourcePersons.→ Reports include the number of beneficiaries, details of meals
served, and the status of funds and food grains supplied.
I Block officials submit these to district offices and ultimately to thestate mid day meal director.
I These data are aggregated at the block, district, and state levels.
I Based on these aggregated reports, state governments prepare anAnnual Work Plan and Budget (AWP&B) and submit them to theProject Approval Board for review and approval.
I Actual allocations and release of funds are based on the PABapprovals.
I Sanctioned funds flow back to the schools following the samechannel.

IVRS
I Each school had to register cellular numbers of 5 teachers.
I The IVRS calls any one of the five teachers and collects data onthe numbers of meals served in each school every day.
I If no meals were served the teacher is supposed to press 0 andprovide reason for the same.
I In 2012, over 99 percent of a total of 70,000 head masters had amobile phone. Headmasters with Mobile Phones
I After completing the calls a software summarizes the data at thedistrict, block, village, and school level.
→ District level reports are e-mailed and texted to DistrictMagistrates.
→ Block level reports are sent to the Block Education Officer.→ Uploaded on a publicly accessible web-site.

Flow of Beneficiary Information
Who: School Head Master What: Beneficiary take-up, funds and grain use data
How-Manually To Who: a) BRP for the MDM system (every month) ,
b)Administration of the District System for Education (every year)

Flow of Beneficiary Information
Who: School Head Master What: Beneficiary take-up, funds and grain use data
How-Manually To Who: a) BRP for the MDM system (every month) ,
b)Administration of the District System for Education (every year)
Who- BRP What: Block reports based on head master's reporting
How: Manually or in MISTo Who: district in charge.
Other functions: BRP also periodically audit schools to verify school reports
Who: District In charge What: District reports based on BRP reporting
How: Manually or in MISTo Who: MDM Directorate
Directorate: then releases funds and food grains

Flow of Beneficiary Information
Who: School Head Master / TeachersWhat: Delivered MDM? If not, why?
How: Automated IVRS To Who: Cloud (every day)
Who- BRP What: Block reports based on head master's reporting
How: Manually or in MISTo Who: district in charge.
Other functions: BRP also periodically audit schools to verify school reports
Who: District In charge What: District reports based on BRP reporting
How: Manually or in MISTo Who: MDM Directorate
Directorate: then releases funds and food grains

Data Sources - Independent Assessment
I Main data - Annual Status of Education Report (ASER).
I Period choice 2009-13 for five states in India: Bihar, Chhattisgarh,Jharkhand, Orissa, and Madhya Pradesh.
I Repeated cross section at school and household level.
I For each village surveyed under ASER, one government school (ifany) is inspected randomly.
I For each of the inspected schools ASER collected:
→ MDM was served in the school on the date of interview.→ If interviewer found any evidence of meals being served.→ If interviewer saw food being cooked.→ School infrastructure.
I The sample includes 5041 schools for Bihar and 19771 schools forthe five states.

Data Sources - State Official Data
I District level Annual Work Plan Budgets (AWPB) submitted bythe state midday meal authorities to the Government of India.
I Variables:
→ Total number of schools serving midday meals→ Children availing meals→ Amount of rice consumed→ Cooking cost→ Expenditure on cook’s wages
I Our Bihar data has 38 districts and 189 district-year observations.Our event study analysis is based on this sample.
I Overall, there are 157 districts and 785 district-year observations inour sample of five states.

Summary StatisticsBihar All states
Obs Mean S.D. Obs Mean S.D.
Panel A: AWPB Data.
Percent of schools serving MDM: Primary 228 99.01 2.39 948 99.58 1.62Percent of schools serving MDM: Upper Primary 228 98.63 2.71 932 99.57 1.64Percent of students availing MDM: Primary 228 91.01 12.79 948 88.31 37.74Percent of students availing MDM: Upper Primary 228 88.62 15.42 948 86.02 26.47Rice consumption (in M.T.): Primary 228 2892.95 1438.61 832 1791.64 1365.34Rice consumption (in M.T.): Upper Primary 228 1438.96 889.73 832 1056.91 822.21Cooking cost (in Million Rs.): Primary 228 89.58 49.23 948 63.15 38.48Cooking cost (in Million Rs.): Upper Primary 224 46.17 30.69 944 58.73 95.10
Panel B: ASER School Level Data.
School provides meals 6105 0.65 0.48 23980 0.84 0.37Meals were cooked on the day of visit 6069 0.58 0.49 23781 0.73 0.44Tap or hand-pump for drinking water 6153 0.93 0.25 24236 0.88 0.32No. of teachers appointed 4815 2.76 2.85 18178 2.64 2.52No. of teachers present 4815 2.23 2.29 18178 2.18 2.08Common toilet in the school 4937 0.53 0.50 19576 0.48 0.50Separate boys toilet in the school 5175 0.62 0.48 20335 0.60 0.49Separate girls toilet in the school 5306 0.66 0.47 20740 0.65 0.48School has boundary wall 6098 0.49 0.50 23977 0.42 0.49

Monthly Average Dialed and Completed Calls
0
10
20
30N
o. o
f cal
ls
Apr2012 Oct2012 Apr2013 Oct2013 Apr2014 Oct2014Month
Average Dialed Calls Average Completed Calls

Call Completion Rates
Call Completion0.53620.84161.381.5
Estimation
Event study framework (within Bihar)
ydt = α0 +∑
−3≤k≤1
αk × IVRS operational for k periods +
αXXdt + δd + εdt
I ydt : Outcome variable for district d in year t
I Xdt : Average school characteristics for district d in year t
I δd : District fixed effects
Diff-in-Diff framework
ydt = β0 +∑
−3≤k≤1
βk × Bihar× IVRS operational for k periods
+βXXdt + δd + ηdt

Mid-Day Meals in Primary Schools
Figure: Percentage of Schools Providing Meals in Bihar and Other StatesOver Time (ASER Data)
.5
.7
.9
Ave
rage
Pro
visi
on o
fM
id-D
ay M
eals
2009 2010 2011 2012 2013 2014Year
Bihar Other States

Event Study: MDM in Schools, ASER Data
Dependent Var. School Provides Meal MDM Cooked
Baseline average 56.203 56.203 50.309 50.309
(1) (2) (3) (4)
Two years before IVRS -0.63 -0.88 3.64 4.63(3.52) (3.63) (3.54) (3.83)
One year before IVRS -3.47 -5.94 2.40 0.48(3.97) (3.89) (4.17) (3.95)
IVRS year 17.4*** 13.8*** 18.5*** 15.3***(3.47) (3.52) (4.11) (4.07)
One year after IVRS 15.0*** 10.5** 14.4*** 10.6**(4.21) (4.33) (4.62) (4.51)
Two years after IVRS 11.4** 7.38* 15.0*** 11.8***(4.37) (4.14) (4.70) (4.32)
Post IVRS - Pre IVRS 18.47*** 16.4*** 12.01** 10.12**School Characteristics No Yes No YesR Squared 0.067 0.069 0.074 0.081No. of Observations 6105 4854 6069 4828

DiD: MDM in Schools, ASER Data
Dependent Var. School Provides Meal MDM Cooked
Baseline average 56.203 56.203 50.309 50.309
(1) (2) (3) (4)
Bihar × 2010 -2.38 -2.98 -5.81 -6.13(3.62) (3.69) (3.87) (4.16)
Bihar × 2011 -4.82 -6.44 -6.17 -8.27*(4.07) (3.96) (4.50) (4.24)
Bihar × 2012 17.5*** 15.9*** 19.3*** 16.8***(3.63) (3.66) (4.50) (4.50)
Bihar × 2013 16.3*** 13.8*** 17.4*** 14.1***(4.37) (4.47) (4.95) (4.94)
Bihar × 2014 13.8*** 11.6*** 18.2*** 15.5***(4.59) (4.44) (5.13) (4.92)
Post IVRS - Pre IVRS 21.14*** 20.28*** 23.61*** 22.41**School Characteristics No Yes No YesR Squared 0.149 0.147 0.110 0.114No. of Observations 23980 18798 23781 18667

Mid-Day Meals in Primary Schools
Figure: Percentage of Schools Providing Meals in Bihar and Other StatesOver Time (AWPB Data)
.9
1
1.1
Ave
rage
Pro
visi
on o
fM
id-D
ay M
eals
2009 2010 2011 2012 2013 2014Year
Bihar Other States

Event Study: MDM in Schools, AWPB Data
Dependent Variable Percentage of Schools Serving Percentage of Enrolled ChildrenMDM Availing MDM
Primary UpperPrimary
Primary UpperPrimary
Baseline average 100 100 100 100
(1) (2) (3) (4)
Two years before IVRS -0.00 -0.00 -0.00 -0.00(0.25) (0.23) (0.31) (0.57)
One year before IVRS -0.00 -0.00 -0.00 0.00(0.25) (0.23) (0.31) (0.57)
IVRS year -1.01** -1.24** -4.91*** -6.74***(0.50) (0.59) (0.31) (1.83)
One year after IVRS -1.37*** -5.33*** -34.08*** -36.73***(0.43) (0.34) (1.01) (1.19)
Two years after IVRS -3.55*** -1.64*** -14.97*** -24.81***(0.42) (0.32) (0.55) (0.57)
Post IVRS - Pre IVRS -1.37*** -5.33*** -34.08*** -36.73***R Squared 0.451 0.600 0.956 0.890No. of Observations 228 228 228 228
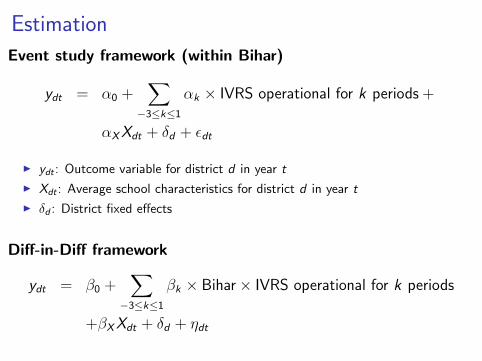
DiD: MDM in Schools, AWPB Data
Dependent Variable Percentage of Schools Serving Percentage of Enrolled ChildrenMDM Availing MDM
Primary UpperPrimary
Primary UpperPrimary
Baseline average 100 100 100 100
(1) (2) (3) (4)
Bihar × 2010 0.49** 0.16* 2.77 4.56(0.21) (0.09) (7.39) (4.83)
Bihar × 2011 0.18* 0.15* -3.15 5.37(0.09) (0.09) (5.30) (3.70)
Bihar × 2012 -0.67 -1.03 -9.50 -20.4***(0.54) (0.71) (6.56) (4.88)
Bihar × 2013 -1.07** -5.08*** -41.6*** -47.6***(0.52) (0.40) (4.26) (3.34)
Bihar × 2014 -3.43*** -1.60*** -29.2*** -37.6***(0.51) (0.33) (1.92) (2.48)
Post IVRS - Pre IVRS -1.25** -5.22*** -38.41*** -52.94***R Squared 0.399 0.560 0.407 0.402No. of Observations 947 931 947 947

DiD: All Districts
Dependent Var. School Provides Meal MDM Cooked
Bihar × Post 0.23*** 0.27***(0.05) (0.05)
R Squared 0.651 0.570No. of Observations 891 891

DiD: All Districts with Dist. Specific Trend
Dependent Var. School Provides Meal MDM Cooked
Bihar × Post 0.23*** 0.26***(0.06) (0.06)
R Squared 0.760 0.691No. of Observations 891 891

Generalized DiD
Figure: Common Support in Predicted Probability of Use of IVRS
0.2
.4.6
.8D
ensi
ty
-3 -2 -1 0 1Predicted Use of IVRS
Bihar Chhattisgarh, Jharkhand, M.P. and Orissa

Covariate Balance: On Common Support
Control Bihar
Obs. Avg. Obs. Avg. Diff. t-stat p-values(1) (2) (3) (4) (5) (6) (7)
Panel A: Districts on the Common SupportTap or hand-pump for drinking water 122 0.904 80 0.912 0.008 0.86 0.3883No. of Teachers appointed 122 2.863 80 3.092 0.229 1.6 0.1105No. of Teachers present 122 2.39 80 2.523 0.133 1.06 0.2887Common toilet in the school 122 0.596 80 0.633 0.037 1.38 0.1681Separate boys toilet in the school 122 0.512 80 0.508 -0.004 0.14 0.8883Separate girls toilet in the school 122 0.531 80 0.521 -0.011 0.38 0.7053School has boundary wall 122 0.461 80 0.489 0.028 1.38 0.1689

DiD: Districts on Common Support
Dependent Var. School Provides Meal MDM Cooked
Bihar × Post 0.26*** 0.28***(0.05) (0.06)
R Squared 0.691 0.616No. of Observations 583 583

Covariate Balance: Propensity Score Weighted
Control Bihar
Obs. Avg. Obs. Avg. Diff. t-stat p-values(1) (2) (3) (4) (5) (6) (7)
Panel B: Propensity Score Weighted Covariate BalanceTap or hand-pump for drinking water 331 0.907 111 0.902 -0.004 0.6 0.5517No. of Teachers appointed 331 3 111 3.105 0.105 0.94 0.3489No. of Teachers present 331 2.471 111 2.511 0.04 0.43 0.6697Common toilet in the school 331 0.613 111 0.618 0.005 0.28 0.7763Separate boys toilet in the school 331 0.521 111 0.518 -0.003 0.15 0.8839Separate girls toilet in the school 331 0.544 111 0.53 -0.014 0.66 0.5096School has boundary wall 331 0.47 111 0.467 -0.003 0.18 0.8554

DiD: Propensity Score Weighted Results
Dependent Var. School Provides Meal MDM Cooked
Bihar × Post 0.18*** 0.24***(0.03) (0.03)
R Squared 0.508 0.322No. of Observations 888 888

Event Study: Rice Consumed & Lifted
Dependent Variable Rice Consumed (in M.T.) Rice Lifted (in M.T.)
Primary Upper Primary Primary Upper Primary
Baseline average
(1) (2) (3) (4)
Two years before IVRS 344.1 83.0 -179.3 -221.8*(220.29) (86.22) (174.05) (127.05)
One year before IVRS 31.2 114.9 -868.2*** -317.9***(185.60) (119.76) (169.21) (114.95)
IVRS year 550.9*** 429.6*** 398.1** 264.8**(172.84) (96.69) (177.97) (120.51)
One year after IVRS 1437.0*** 1244.9*** 1294.1*** 908.1***(254.63) (169.73) (258.25) (174.33)
Two years after IVRS 1326.9*** 1172.2*** 1733.0*** 1339.1***(259.03) (169.99) (305.43) (204.74)
Post IVRS - Pre IVRS 2162.29 1226.04 2162.3*** 1226***R Squared 0.721 0.746 0.801 0.754No. of Observations 228 228 228 228

DiD: Rice Consumed & Lifted
Dependent Variable Rice Consumed (in M.T.) Rice Lifted (in M.T.))
Primary Upper Primary Primary Upper Primary
Baseline average
(1) (2) (3) (4)
Bihar × 2010 311.5 -33.6 -130.2 -304.0**(287.17) (105.87) (316.27) (137.37)
Bihar × 2011 129.0 110.0 -789.9** -343.8**(284.66) (163.02) (338.60) (139.61)
Bihar × 2012 461.5* 111.0 407.0 75.5(250.08) (121.51) (290.61) (139.08)
Bihar × 2013 1367.0*** 961.1*** 1332.4*** 686.5***(320.31) (191.33) (348.31) (192.11)
Bihar × 2014 1516.1*** 1090.4*** 1935.2*** 1280.8***(337.18) (185.50) (402.54) (219.17)
Post IVRS - Pre IVRS 2122.36*** 1030.31*** 2122.3*** 1030.3***R Squared 0.876 0.863 0.887 0.852No. of Observations 797 797 831 830

Effects on Enrollment
Grade 1 2 3 4 5
Baseline average 68.02 67.94 69.63 66.16 61.1
Bihar × (t - 2009)[γ1
]-4.19*** -0.91 0.67 3.43*** 4.27***
(1.29) (1.25) (1.32) (1.09) (1.21)
Bihar × (t - 2012) × Post 2012[γ2
]6.17*** 2.57* -0.72 -3.01* -2.60*(1.48) (1.55) (1.82) (1.52) (1.55)
Bihar × Post 2012[γ3
]-6.03** -8.53*** -12.0*** -14.4*** -13.4***(2.56) (2.36) (2.60) (2.63) (2.85)
R Squared 0.414 0.430 0.417 0.418 0.385No. of Observations 18571 18574 18607 18591 18502γ1 + γ2 1.98 1.66 -0.05 0.42 1.68p-value 0.00 0.03 0.96 0.60 0.03

Effects on Attendance
Grade 1 2 3 4 5
Baseline average 38.53 36.39 36.68 34.76 32
Bihar × (t - 2009)[γ1
]-1.79*** -1.45** -2.01*** -1.40*** -1.65***
(0.63) (0.60) (0.54) (0.51) (0.53)
Bihar × (t - 2012) × Post 2012[γ2
]1.39** 1.00 1.06* 0.14 0.49(0.68) (0.63) (0.62) (0.58) (0.62)
Bihar × Post 2012[γ3
]6.65*** 5.02*** 6.06*** 4.75*** 5.42***(1.29) (1.43) (1.30) (1.30) (1.30)
R Squared 0.763 0.715 0.690 0.690 0.686No. of Observations 18571 18574 18607 18591 18502γ1 + γ2 -0.39 -0.45 -0.95 -1.26 -1.16p-value 0.28 0.18 0.01 0.00 0.01

Comparison: IVRS vs QPR
Figure: Distribution of Enrollment
0
5.000e-07
1.000e-06
1.500e-06
2.000e-06
Den
sity
0 500000 1000000 1500000
HM report to IVRS on school enrollmentQPR report on school enrollment

Comparison: IVRS vs QPR
Figure: Distribution of Beneficiaries
0
1.000e-06
2.000e-06
3.000e-06
4.000e-06
Den
sity
0 200000 400000 600000 800000 1000000
HM report to IVRS on number of beneficiariesQPR report on number of beneficiaries

Quantity-Quality Tradeoff?
Dependent Variable Fraction of Schools Observed Serving
Good QualityMeals
Bad QualityMeals
SufficientQuantity Meals
InsufficientQuantity Meals
(1) (2) (3) (4)
Bihar × Post 0.47*** -0.67*** 0.48** -0.60***(0.02) (0.03) (0.11) (0.07)
R Squared 0.339 0.576 0.562 0.610No. of Observations 180 180 180 180
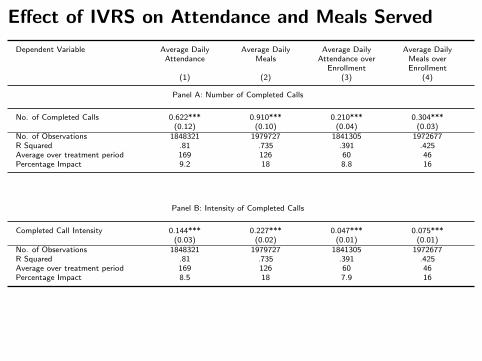
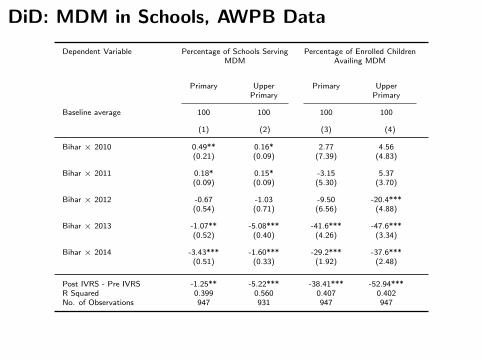
Effect of IVRS on Attendance and Meals Served
Dependent Variable Average DailyAttendance
Average DailyMeals
Average DailyAttendance over
Enrollment
Average DailyMeals overEnrollment
(1) (2) (3) (4)
Panel A: Number of Completed Calls
No. of Completed Calls 0.622*** 0.910*** 0.210*** 0.304***(0.12) (0.10) (0.04) (0.03)
No. of Observations 1848321 1979727 1841305 1972677R Squared .81 .735 .391 .425Average over treatment period 169 126 60 46Percentage Impact 9.2 18 8.8 16
Panel B: Intensity of Completed Calls
Completed Call Intensity 0.144*** 0.227*** 0.047*** 0.075***(0.03) (0.02) (0.01) (0.01)
No. of Observations 1848321 1979727 1841305 1972677R Squared .81 .735 .391 .425Average over treatment period 169 126 60 46Percentage Impact 8.5 18 7.9 16

Effect of IVRS on Probability of MDM Provision
Average 90.542 90.542
(1) (2)
Completed Call Intensity 0.011*(0.01)
No. of Completed Calls 0.056*(0.03)
R Squared 0.791 0.791No. of Observations 256426 256426

Effects of School Characteristics on Completed CallsAverage 14.688 14.688 14.688
(1) (2) (3)
Primary with Upper Primary -0.97***(0.14)
Primary with Upper Primary and Secondary 0.21(0.41)
Upper Primary Only -1.17***(0.23)
Upper Primary with Secondary -0.74**(0.30)
Urban -0.52***(0.17)
Girls 2.85***(0.81)
Co-educational 1.70***(0.45)
Shift school -0.30(0.18)
Distance from District HQ 0.0026(0.00)
School enrollment (DISE) -0.0062*** -0.00017 -0.00026(0.00) (0.00) (0.00)
No. of Teachers 0.070 0.0040 0.042**(0.05) (0.02) (0.02)
No. of Classrooms 0.58*** 0.053*** 0.0087(0.09) (0.01) (0.01)
No. of Common Toilets 0.011 0.034 0.045(0.15) (0.02) (0.05)
No. of Girls Toilets -0.22 -0.018 -0.0032(0.67) (0.04) (0.07)
No. of Boys Toilets 2.62*** 0.074* 0.057(0.55) (0.04) (0.07)
Boundary wall 0.16*** 0.0046 -0.0086(0.02) (0.01) (0.01)
Access to Tap Water -0.29 0.081 0.062(0.27) (0.15) (0.19)
Number of Blackboards -0.057*** 0.015*** -0.029***(0.02) (0.00) (0.01)
School FEs X X
Academic Year FEs X X
School-specific TTs X
R Squared 0.109 0.894 0.954No. of Observations 230515 230366 230366

DiD Estimates on Arithmetic Test: Public Schools
Grade 1 2 3 4 5Baseline average 1.78 2.51 3.14 3.7 4.09
Bihar × (t - 2009)[γ1
]0.17*** 0.13*** 0.21*** 0.23*** 0.25***(0.03) (0.03) (0.04) (0.04) (0.04)
Bihar × (t - 2012) × Post 2012[γ2
]-0.21*** -0.18*** -0.29*** -0.24*** -0.28***
(0.04) (0.04) (0.05) (0.05) (0.05)
Bihar × Post 2012[γ3
]-0.14** -0.086 -0.15 -0.21*** -0.18**(0.06) (0.08) (0.09) (0.08) (0.08)
R Squared 0.152 0.154 0.205 0.232 0.224No. of Observations 59993 55869 56553 52612 58026γ1 + γ2 -0.04 -0.04 -0.08 -0.01 -0.03p-value 0.04 0.08 0.00 0.69 0.34

DiD Estimates on Reading Test: Public Schools
Grade 1 2 3 4 5Baseline average 1.76 2.52 3.17 3.78 4.18
Bihar × (t - 2009)[γ1
]0.18*** 0.14*** 0.24*** 0.22*** 0.23***(0.03) (0.04) (0.04) (0.04) (0.04)
Bihar × (t - 2012) × Post 2012[γ2
]-0.23*** -0.21*** -0.33*** -0.24*** -0.25***
(0.04) (0.04) (0.05) (0.05) (0.05)
Bihar × Post 2012[γ3
]-0.17** -0.15* -0.26** -0.29*** -0.24***(0.07) (0.09) (0.10) (0.09) (0.09)
R Squared 0.160 0.151 0.172 0.174 0.153No. of Observations 60423 56142 56782 52837 58190γ1 + γ2 -0.05 -0.06 -0.09 -0.01 -0.02p-value 0.01 0.02 0.00 0.68 0.53

DiD Estimates on Arithmetic Test: Private Schools
Grade 1 2 3 4 5Baseline average 2.6 3.39 3.93 4.22 4.48
Bihar × (t - 2009)[γ1
]0.12** 0.062 0.27*** 0.25*** 0.18***(0.05) (0.06) (0.08) (0.06) (0.05)
Bihar × (t - 2012) × Post 2012[γ2
]-0.0071 0.092 -0.24** -0.086 -0.11(0.08) (0.08) (0.10) (0.08) (0.09)
Bihar × Post 2012[γ3
]0.022 -0.050 -0.20 -0.35** -0.16(0.12) (0.16) (0.17) (0.17) (0.17)
R Squared 0.242 0.239 0.233 0.212 0.185No. of Observations 10588 9258 7713 6828 6582γ1 + γ2 0.11 0.15 0.03 0.16 0.08p-value 0.06 0.01 0.59 0.01 0.33

DiD Estimates on Reading Test: Private Schools
Grade 1 2 3 4 5Baseline average 2.63 3.45 4.06 4.3 4.54
Bihar × (t - 2009)[γ1
]0.19*** 0.072 0.25*** 0.15** 0.10**(0.06) (0.07) (0.07) (0.07) (0.05)
Bihar × (t - 2012) × Post 2012[γ2
]0.026 0.16* -0.18** 0.12 -0.021(0.09) (0.09) (0.08) (0.10) (0.07)
Bihar × Post 2012[γ3
]-0.12 -0.15 -0.27* -0.39** -0.055(0.14) (0.17) (0.16) (0.17) (0.15)
R Squared 0.235 0.192 0.150 0.132 0.103No. of Observations 10628 9288 7748 6845 6590γ1 + γ2 0.22 0.23 0.07 0.27 0.08p-value 0.00 0.00 0.20 0.00 0.23

ConclusionI Independent Data based assessment indicates that MDM provision
improved post IVRS
I State Official Data based assessment indicates beneficiary take-upreducing and rice consumption and cooking costs increasing
I Central government audit based data reveals that quality andsufficiency of meals improving
I Taken together, IVRS reduced leakage in the system and improvedthe efficacy of delivery provision
I Enrollment in schools decline but attendance increases

Headmasters with Mobile Phonesivrs
District Fraction District Fraction
Araria .99 Madhubani .98Arwal 1 Munger 1Aurangabad .99 Muzaffarpur .9Banka .99 Nalanda .99Begusarai .99 Nawada .99Bhagalpur .99 Pashchim Champaran .9Bhojpur .99 Patna .98Buxar .99 Purnia .99Darbhanga .99 Purvi Champaran .99Gaya .99 Rohtas .99Gopalganj .99 Saharsa .99Jamui .99 Samastipur .99Jehanabad .99 Saran .99Kaimur (Bhabua) .99 Sheikhpura 1Katihar .99 Sheohar .9Khagaria .99 Sitamarhi .99Kishanganj .97 Siwan .99Lakhisarai .99 Supaul 1Madhepura .99 Vaishali .99

Changes in the Number of SchoolsDiD: AWPB
Primary Schools Upper Primary Schools
(1) (2) (3) (4)
Bihar × 2010 -86.0*** -98.2*** -14.0*** -21.5**(20.04) (31.73) (4.70) (10.14)
Bihar × 2011 -129.3*** -183.9*** -18.7** -31.8**(24.30) (39.28) (7.53) (12.70)
Bihar × 2012 -34.0 -99.7*** 17.7 5.56(47.74) (34.55) (16.39) (10.59)
Bihar × 2013 -122.2*** -202.0*** -5.91 -25.8**(43.14) (39.46) (14.18) (10.92)
Post IVRS - Pre IVRS 7.03 -18.11 12.79 5.97School Characteristics No Yes No YesR Squared 0.929 0.932 0.958 0.958No. of Observations 785 785 785 785