No. 10715 IMPROVING MINERAL SPECTRA USING SINGLE ... · No. 10715 OBJECTIVE This paper investigates...
8
No. 10715 OBJECTIVE This paper investigates approaches to further improvement in mineral spectra reproducibility using the FTIR diamond ATR technique. ABSTRACT Previous reports 1-3 have demonstrated the utility of single reflection diamond FTIR-ATR in the analysis of powdered minerals and documented procedures for sample preparation. In one such paper, 1 the advantage and disadvantage of using a larger sampling surface ATR configuration were presented. The advantage is that a larger sampling surface will collect data from a larger set of particles, so that the chances of obtaining very similar spectra, sample to sample, are increased. The disadvantage is that, as the pressure exerted on the sample is decreased due to the force distribution over a larger area, optical contact is also decreased. This latter effect may not be apparent with most minerals that are relatively hard. However, some minerals are, in fact, soft and their results can be degraded by inadequate pressure. In this work, an instrumental change is made to increase sample pressure in an attempt to improve performance with softer samples. Also, sample preparation enhancements are made to study their effect on reproducibility. Previously prepared powdered samples are further segregated into coarse and fine size groups. Ten coarse (106 to 53 µm particle size) and ten fine (less than 53 µm particle size) samples will be analyzed for each of three minerals in order to assure statistical validity. Results from the two groups will be compared to each other and to those previously reported. Finally, some conclusions will be made which are believed applicable to soil and non-mineral samples. EXPERIMENTAL ..... All spectra were taken with a Thermo/Nicolet Nexus ™ 670 FTIR spectrometer equipped with a DTGS detector and a standard KBr mid-IR IMPROVING MINERAL SPECTRA REPRODUCIBILITY USING SINGLE REFLECTION DIAMOND FTIR-ATR SPECTROSCOPY JOSEPH P. LUCANIA HARRICK SCIENTIFIC PRODUCTS, INC., BOX 277, PLEASANTVILLE NY 10570 ALI KOCAK JOHN JAY COLLEGE OF CRIMINAL JUSTICE, 445 WEST 59TH STREET, NEW YORK, NY 10019 POSTER PAPER NO. 930-4P: FTIR, RAMAN, NIR, BIOSPECTROSCOPY – MATERIALS ANALYSIS, PRESENTED AT THE 2011 PITTCON, GEORGIA WORLD CONGRESS CENTER, ATLANTA, GA, MARCH 15, 2011 Figure 1. MVP-Pro™ Star Diamond ATR Accesory.
Transcript of No. 10715 IMPROVING MINERAL SPECTRA USING SINGLE ... · No. 10715 OBJECTIVE This paper investigates...

No. 10715
OBJECTIVE This paper investigates approaches to further improvement in mineral spectra reproducibility using the FTIR diamond ATR technique.
ABSTRACT Previous reports1-3 have demonstrated the utility of single reflection diamond FTIR-ATR in the analysis of powdered minerals and documented procedures for sample preparation. In one such paper,1 the advantage and disadvantage of using a larger sampling surface ATR configuration were presented. The advantage is that a larger sampling surface will collect data from a larger set of particles, so that the chances of obtaining very similar spectra, sample to sample, are increased. The disadvantage is that, as the pressure exerted on the sample is decreased due to the force distribution over a larger area, optical contact is also decreased. This latter effect may not be apparent with most minerals that are relatively hard. However,
some minerals are, in fact, soft and their results can be degraded by inadequate pressure. In this work, an instrumental change is made to increase sample pressure in an attempt to improve performance with softer samples. Also, sample preparation enhancements are made to study their effect on reproducibility. Previously prepared powdered samples are further segregated into coarse and fine size groups. Ten coarse (106 to 53 µm particle size) and ten fine (less than 53 µm particle size) samples will be analyzed for each of three minerals in order to assure statistical validity. Results from the two groups will be compared to each other and to those previously reported. Finally, some conclusions will be made which are believed applicable to soil and non-mineral samples.
EXPERIMENTAL ..... All spectra were taken with a Thermo/Nicolet Nexus™ 670 FTIR spectrometer equipped with a DTGS detector and a standard KBr mid-IR
IMPROVING MINERAL SPECTRA REPRODUCIBILITY USING SINGLE REFLECTION
DIAMOND FTIR-ATR SPECTROSCOPY
JOSEPH P. LUCANIA HARRICK SCIENTIFIC PRODUCTS, INC., BOX 277, PLEASANTVILLE NY 10570
ALI KOCAK JOHN JAY COLLEGE OF CRIMINAL JUSTICE, 445 WEST 59TH STREET, NEW YORK, NY 10019
POSTER PAPER NO. 930-4P: FTIR, RAMAN, NIR, BIOSPECTROSCOPY – MATERIALS ANALYSIS, PRESENTED AT THE 2011 PITTCON, GEORGIA WORLD CONGRESS CENTER, ATLANTA, GA, MARCH 15, 2011
Figure 1. MVP-Pro™ Star Diamond ATR Accesory.

IMPROVING MINERAL SPECTRA REPRODUCIBILITY USING SINGLE REFLECTION DIAMOND FTIR-ATR SPECTROSCOPY
beamsplitter and using Thermo/Nicolet Omnic™ Version 6.1 software. All spectra were run at 4000 to 400 cm-1, using a velocity of 0.6329 cm-1, Happ-Genzel apodization, Mertz phase correction, and no zero filling. The aperture was set to 100 (fully open). The gain was set to 8 and the resolution was set to 4 cm-1. Spectra were derived from 64 co-added scans. A background spectrum was taken prior to each sample spectrum using the ATR accessory without any sample on the ATR element. The purge inputs of the spectrometer and the installed accessory were connected to filtered air (water and carbon dioxide removed) produced by a Parker Balston Model 75-62 FT-IR Purge Gas Generator at 30 SCFH. ..... Spectra were converted to absorbance units using the OmnicTM “Absorb” function. Spectra were baseline corrected using the OmnicTM “Aut Bsln” function. Peak maxima and associated wavelengths were found using the OmnicTM “Analyze Find Peaks” function. ..... The Harrick MVP-Pro StarTM (MVS-NI8) 45o single reflection diamond ATR accessory (Figure 1) was installed in the sample compartment of the FTIR spectrometer for obtaining spectra. The standard diamond ATR element cartridge (MVP2-ATR-0W) was installed in the
accessory. This cartridge uses a triangular prism ATR element with a sampling area of approximately 1.5 mm diameter. Previous work1 indicated that this ATR element produced superior precision when compared to a hemispherical element having a sampling area of only 0.5 mm diameter. The accessory is equipped with a built-in pressure applicator with a slip clutch, assuring that the same amount of pressure is exerted on each sample. The standard internal slip clutch module is rated at 56 oz-in of pressure. Previous evidence1-3 indicates that superior precision is obtained, especially on softer samples, by using greater pressure. For this reason, the standard component was replaced with one having a release rating of 72 oz-in (Item No. RF016-4 T-4.5; Polyclutch Division, A & A Manufacturing Co., Inc.; North Haven, CT; www.gortite.com).
A special powder sample cup is installed above the ATR element. The cup is 4.1 mm in diameter and has a depth of 2.5 mm. The resultant sample volume required is 33 mm3. Less than 0.1 g of sample is required per analysis. The standard pressure applicator tip of the accessory is replaced with a special cylindrical powder cup tip, whose diameter is slightly less than that of the sample cup.
..... Three mineral specimens were obtained from Minerals Unlimited (Ridgecrest, CA; www.mineralsunlimited.com): gypsum (CaSO4
.H2O), malachite (Cu2(OH)2CO3), and sodalite (Na8Cl2Al6Si6O24). Powdered samples were prepared from each of the minerals by first crushing between two 150 mm x 150 mm x 5 mm 316 polished stainless steel plates (Item No. 9759K18; McMaster-Carr; Elmhurst, IL; www.mcmaster.com) in order to reduce the size to 15 mm or less. The samples were then crushed to a particle/powder consistency using a 1.4 kg ball-peen hammer and a steel percussion (Plattner’s) mortar and pestle (Item No. H-17270; Humboldt Manufacturing Co., Shiller Park, IL; www.humboldtmfg.com). The samples were then brought to a fine powder using a standard mortar and pestle.
Figure 2. Ten gypsum (CaSO4·2H2O) spectra of coarse powder granulation.
40060080010001200140016001800
Wavenumber cm-1
0.1
0.2
0.3
0.4
0.5
0.6
Abs
orba
nce
Uni
ts

IMPROVING MINERAL SPECTRA REPRODUCIBILITY USING SINGLE REFLECTION DIAMOND FTIR-ATR SPECTROSCOPY
.....In the final step of sample preparation, all three powdered minerals were filtered using a 75 mm diameter, 140 mesh sieve (Item 1723; W. S. Tyler; Mentor, OH; www.wstyler.com) with a bottom pan (W. S. Tyler Item No. 8408) and top cover (W. S. Tyler Item No. 8411) to produce particles smaller than 106 µm. Samples were further segregated by a subsequent filtration using a 75 mm diameter, 270 mesh (W. S. Tyler Item No. 1727). Particles that fell through, labeled “fine,” were smaller than 53 µm. Particles that were retained, labeled “coarse,” were 106-53 µm.
Ten portions, each approximately 1/2 mL in volume, were apportioned from each of the six samples and stored in 2 mL capacity screw-capped vials (Item No. 9710D12; Thomas Scientific; Swedesboro, NJ; www.thomassci.com) using a Teflon vial funnel (Item No. CG-1761-01; Chemglass; Vineland, NJ; www.chemglass.com). As there was a distribution of particle sizes in the samples, some care was taken to minimize any shaking of the samples or vials. Methyl ethyl ketone (Item No. 4331002; Hubbard-Hall Inc., Waterbury, CT; www.hubbardhall.com) and
cotton-tipped applicators (Item No. 758CH016); Technistat; Worcester, PA; www.technitool.com) were used for cleaning the pressure applicator tip, sample cup, and diamond ATR element as well as the two mortar and pestles. The sieves and their associated top and pan were cleaned with compressed air. RESULTS AND DISCUSSION
General Results for All Minerals
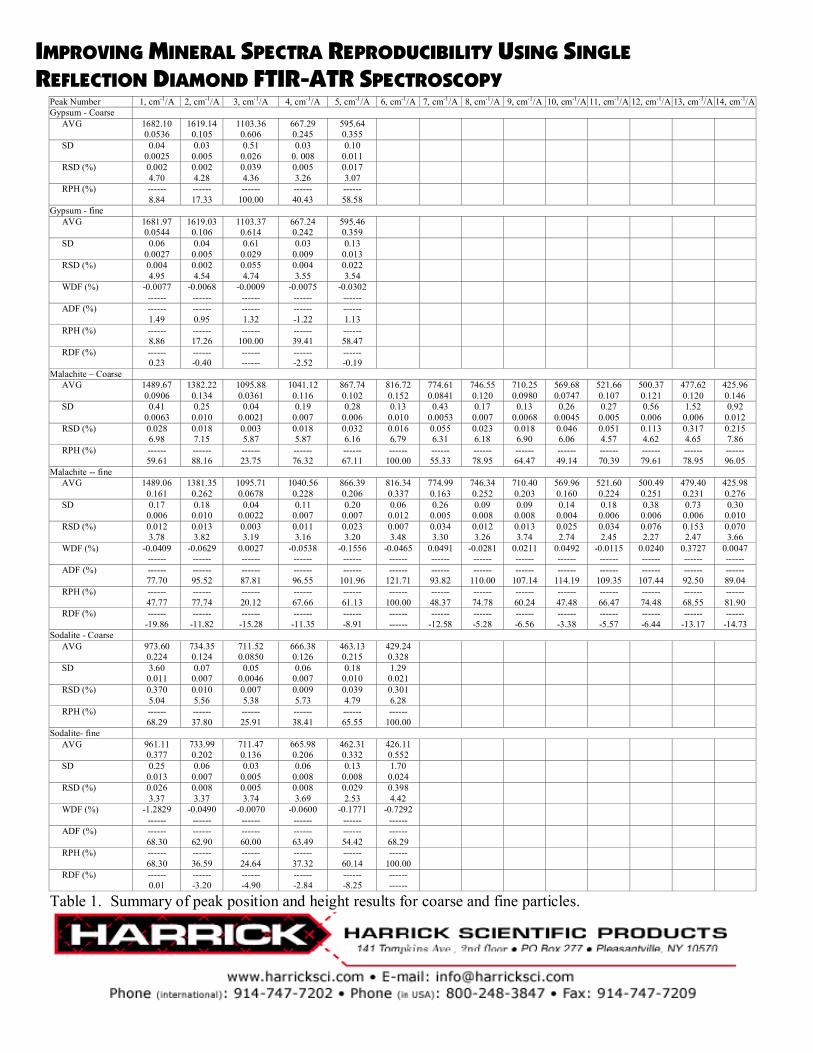
Figures 2 and 3 show the ten spectra obtained for the coarse and fine gypsum samples, respectively. Figures 4 and 5 show the ten spectra obtained for the coarse and fine malachite samples, respectively. Figures 6 and 7 show the ten spectra obtained for the coarse and fine sodalite samples, respectively. Average peak positions and intensities, along with the associated standard deviations and relative standard deviations are presented in Table 1 (see last page). This table also shows the average wavelength and absorbance differences of fine peaks with respect to coarse. Relative peaks heights with respect to the most intense peaks are given. Finally, Table 1 indicates the relative peak height differences of fine peaks with respect to coarse. ..... An overall statistical comparison of the coarse and fine results is given in Table 2. Further analysis4,5 of the relative
Figure 3. Ten gypsum (CaSO4·2H2O) spectra of fine powder granulation.
40060080010001200140016001800
Wavenumber cm-1
0.1
0.2
0.3
0.4
0.5
0.6
Abs
orba
nce
Uni
ts
Figure 4. Ten malachite (Cu2(OH)2CO3) spectra of coarse powder granulation.
400600800100012001400160018002000
Wavenumber cm-1
0.05
0.10
0.15
0.20
0.25
Abs
orba
nce
Uni
ts
Figure 5. Ten malachite (Cu2(OH)2CO3) spectra of fine powder granulation.
400600800100012001400160018002000
Wavenumber cm-1
0.05
0.15
0.25
0.35
Abs
orba
nce
Uni
ts
IMPROVING MINERAL SPECTRA REPRODUCIBILITY USING SINGLE REFLECTION DIAMOND FTIR-ATR SPECTROSCOPY
Peak Number 1, cm-1/A 2, cm-1/A 3, cm-1/A 4, cm-1/A 5, cm-1/A 6, cm-1/A 7, cm-1/A 8, cm-1/A 9, cm-1/A 10, cm-1/A 11, cm-1/A 12, cm-1/A 13, cm-1/A 14, cm-1/A Gypsum - Coarse
AVG 1682.10 0.0536
1619.14 0.105
1103.36 0.606
667.29 0.245
595.64 0.355
SD 0.04 0.0025
0.03 0.005
0.51 0.026
0.03 0. 008
0.10 0.011
RSD (%) 0.002 4.70
0.002 4.28
0.039 4.36
0.005 3.26
0.017 3.07
RPH (%) ------ 8.84
------ 17.33
------ 100.00
------ 40.43
------ 58.58
Gypsum - fine AVG 1681.97
0.0544 1619.03
0.106 1103.37 0.614
667.24 0.242
595.46 0.359
SD 0.06 0.0027
0.04 0.005
0.61 0.029
0.03 0.009
0.13 0.013
RSD (%) 0.004 4.95
0.002 4.54
0.055 4.74
0.004 3.55
0.022 3.54
WDF (%) -0.0077 ------
-0.0068 ------
-0.0009 ------
-0.0075 ------
-0.0302 ------
ADF (%) ------ 1.49
------ 0.95
------ 1.32
------ -1.22
------ 1.13
RPH (%) ------ 8.86
------ 17.26
------ 100.00
------ 39.41
------ 58.47
RDF (%) ------ 0.23
------ -0.40
------ ------
------ -2.52
------ -0.19
Malachite – Coarse AVG 1489.67
0.0906 1382.22
0.134 1095.88 0.0361
1041.12 0.116
867.74 0.102
816.72 0.152
774.61 0.0841
746.55 0.120
710.25 0.0980
569.68 0.0747
521.66 0.107
500.37 0.121
477.62 0.120
425.96 0.146
SD 0.41 0.0063
0.25 0.010
0.04 0.0021
0.19 0.007
0.28 0.006
0.13 0.010
0.43 0.0053
0.17 0.007
0.13 0.0068
0.26 0.0045
0.27 0.005
0.56 0.006
1.52 0.006
0.92 0.012
RSD (%) 0.028 6.98
0.018 7.15
0.003 5.87
0.018 5.87
0.032 6.16
0.016 6.79
0.055 6.31
0.023 6.18
0.018 6.90
0.046 6.06
0.051 4.57
0.113 4.62
0.317 4.65
0.215 7.86
RPH (%) ------ 59.61
------ 88.16
------ 23.75
------ 76.32
------ 67.11
------ 100.00
------ 55.33
------ 78.95
------ 64.47
------ 49.14
------ 70.39
------ 79.61
------ 78.95
------ 96.05
Malachite -- fine AVG 1489.06
0.161 1381.35
0.262 1095.71 0.0678
1040.56 0.228
866.39 0.206
816.34 0.337
774.99 0.163
746.34 0.252
710.40 0.203
569.96 0.160
521.60 0.224
500.49 0.251
479.40 0.231
425.98 0.276
SD 0.17 0.006
0.18 0.010
0.04 0.0022
0.11 0.007
0.20 0.007
0.06 0.012
0.26 0.005
0.09 0.008
0.09 0.008
0.14 0.004
0.18 0.006
0.38 0.006
0.73 0.006
0.30 0.010
RSD (%) 0.012 3.78
0.013 3.82
0.003 3.19
0.011 3.16
0.023 3.20
0.007 3.48
0.034 3.30
0.012 3.26
0.013 3.74
0.025 2.74
0.034 2.45
0.076 2.27
0.153 2.47
0.070 3.66
WDF (%) -0.0409 ------
-0.0629 ------
0.0027 ------
-0.0538 ------
-0.1556 ------
-0.0465 ------
0.0491 ------
-0.0281 ------
0.0211 ------
0.0492 ------
-0.0115 ------
0.0240 ------
0.3727 ------
0.0047 ------
ADF (%) ------ 77.70
------ 95.52
------ 87.81
------ 96.55
------ 101.96
------ 121.71
------ 93.82
------ 110.00
------ 107.14
------ 114.19
------ 109.35
------ 107.44
------ 92.50
------ 89.04
RPH (%) ------ 47.77
------ 77.74
------ 20.12
------ 67.66
------ 61.13
------ 100.00
------ 48.37
------ 74.78
------ 60.24
------ 47.48
------ 66.47
------ 74.48
------ 68.55
------ 81.90
RDF (%) ------ -19.86
------ -11.82
------ -15.28
------ -11.35
------ -8.91
------ ------
------ -12.58
------ -5.28
------ -6.56
------ -3.38
------ -5.57
------ -6.44
------ -13.17
------ -14.73
Sodalite - Coarse AVG 973.60
0.224 734.35 0.124
711.52 0.0850
666.38 0.126
463.13 0.215
429.24 0.328
SD 3.60 0.011
0.07 0.007
0.05 0.0046
0.06 0.007
0.18 0.010
1.29 0.021
RSD (%) 0.370 5.04
0.010 5.56
0.007 5.38
0.009 5.73
0.039 4.79
0.301 6.28
RPH (%) ------ 68.29
------ 37.80
------ 25.91
------ 38.41
------ 65.55
------ 100.00
Sodalite- fine AVG 961.11
0.377 733.99 0.202
711.47 0.136
665.98 0.206
462.31 0.332
426.11 0.552
SD 0.25 0.013
0.06 0.007
0.03 0.005
0.06 0.008
0.13 0.008
1.70 0.024
RSD (%) 0.026 3.37
0.008 3.37
0.005 3.74
0.008 3.69
0.029 2.53
0.398 4.42
WDF (%) -1.2829 ------
-0.0490 ------
-0.0070 ------
-0.0600 ------
-0.1771 ------
-0.7292 ------
ADF (%) ------ 68.30
------ 62.90
------ 60.00
------ 63.49
------ 54.42
------ 68.29
RPH (%) ------ 68.30
------ 36.59
------ 24.64
------ 37.32
------ 60.14
------ 100.00
RDF (%) ------ 0.01
------ -3.20
------ -4.90
------ -2.84
------ -8.25
------ ------
Table 1. Summary of peak position and height results for coarse and fine particles.

IMPROVING MINERAL SPECTRA REPRODUCIBILITY USING SINGLE REFLECTION DIAMOND FTIR-ATR SPECTROSCOPY
standard deviation figures indicates that, with 99% confidence, there is no difference between the precision of peak positions. The same analysis indicates that there is a significant difference in the precision of peak intensities. Fine peak data are more precise. Table 2 shows a significant increase in absorbance values for fine peaks when compared to coarse. There also appears to be a small difference in the relative peak heights between fine and coarse particle results. Individual Results for Specific Minerals
Individual statistics for each mineral are presented in Tables 3, 4, and 5 for gypsum, malachite, and sodalite. With respect to precision in peak positions, the spectra of all three minerals are insensitive to particle size. Both malachite and sodalite also follow the general pattern in that there is a significant increase in the precision and intensities of absorbance values and a significant difference in relative peak heights in the fine particle results. Gypsum results appear relatively insensitive to particle size when absorbance precision, absorbance intensities, and relative peak height differences are examined.
Effect of Applied Pressure in Qualitative Analysis .... There is no significant difference in wavelength relative standard deviation between the previous1 result obtained using 56 oz-in pressure (0.053 +/- 0.095%) and the results obtained using 72 oz-in pressure (0.070 +/- 0.108% for coarse particles and 0.042 +/- 0.081% for fine particles). Using greater pressure will not assist in qualitative analysis. Effect of Particle Size on Qualitative Analysis
The results indicate that wavelength position reproducibility is high enough to allow sample identification for both coarse and fine powders. Although some small differences
Figure 6. Ten Sodalite (Na8Cl2Al6Si6O24) spectra of coarse powder granulation.
400500600700800900100011001200
Wavenumber cm-1
0.05
0.15
0.25
0.35
Abs
orba
nce
Uni
ts
Figure 7. Ten Sodalite (Na8Cl2Al6Si6O24) spectra of fine powder granulation.
400500600700800900100011001200
Wavenumber cm-1
0.1
0.2
0.3
0.4
0.5
0.6
Abs
orba
nce
Uni
ts
Coarse Fine Lowest Wavelength SD (cm-1) 0.03 0.03 Highest Wavelength SD (cm-1) 3.60 1.70 Avg. Wavelength SD (cm-1) 0.46 ± 0.76 0.24 ± 0.35 Lowest Wavelength RSD (%) 0.002 0.002 Highest Wavelength RSD (%) 0.370 0.398 Avg. Wavelength RSD (%) 0.070 ± 0.108 0.042 ± 0.081 Avg. Wavelength Difference (%) ----- -0.089 ± 0.303 Lowest Absorbance SD (A) 0.002 0.002 Highest Absorbance SD (A) 0.026 0.029 Avg. Absorbance SD (A) 0.008 ± 0.005 0.009 ± 0.006 Lowest Absorbance RSD (%) 3.07 2.27 Highest Absorbance RSD (%) 7.86 4.95 Avg. Absorbance RSD (%) 5.54 ± 1.20 3.48 ± 0.69 Avg. Absorbance Difference (%) ----- 71.43 ± 40.38 Avg. Rel. Peak Height Diff. (%) ----- -7.14 ± 5.67
Table 2. Statistical Comparison of Overall Results for Coarse and Fine Particles (25 peaks total).

IMPROVING MINERAL SPECTRA REPRODUCIBILITY USING SINGLE REFLECTION DIAMOND FTIR-ATR SPECTROSCOPY
in relative peak heights were observed between the two particle size categories, these would not be large enough to hinder such identifications. Hence, screening to fine particle sizes is probably unnecessary if only identification is required. Effect of Applied Pressure in Quantitative Analysis
In Table 6, the previous absorbance relative standard deviation results1 obtained on samples of -140 mesh (less than 106 microns) using 56 oz-in pressure are compared with those obtained for this report. Only with gypsum, a very soft mineral, was a definite improvement in precision obtained by using 72 oz-in pressure. The general insensitivity to increased pressure is consistent with results obtained in a previous report.3 Once a sample is packed, most minerals are too hard to be greatly affected by further pressure. Effect of Particle Size in Quantitative Analysis ..... In general, finer particle samples will yield lower absorbance relative standard deviations than coarse samples. This is due predominantly to an increase in absorbance values, as standard deviations remain relatively constant. The smaller
Coarse Fine
Lowest Wavelength SD (cm-1) 0.03 0.03 Highest Wavelength SD (cm-1) 0.51 0.61
Avg. Wavelength SD (cm-1) 0.14 ± 0.21 0.17 ± 0.25 Lowest Wavelength RSD (%) 0.002 0.002 Highest Wavelength RSD (%) 0.039 0.055
Avg. Wavelength RSD (%) 0.013 ± 0.016
0.017 ± 0.023
Avg. Wavelength Difference (%) ----- -0.011 ± 0.011 Lowest Absorbance SD (A) 0.002 0.003 Highest Absorbance SD (A) 0.026 0.029
Avg. Absorbance SD (A) 0.010 ± 0.009
0.012 ± 0.010
Lowest Absorbance RSD (%) 3.07 3.54 Highest Absorbance RSD (%) 4.70 4.95
Avg. Absorbance RSD (%) 3.93 ± 0.72 4.26 ± 0.67 Avg. Absorbance Difference (%) ----- 0.73 ± 1.11 Avg. Rel. Peak Height Diff. (%) ----- -0.72 ± 1.23
Table 3. Statistical comparison of individual mineral peak height results for coarse and fine gypsum particles (5 peaks total).
Coarse Fine Lowest Wavelength SD (cm-1) 0.04 0.04 Highest Wavelength SD (cm-1) 1.52 0.73 Avg. Wavelength SD (cm-1) 0.40 ± 0.39 0.21 ± 0.18 Lowest Wavelength RSD (%) 0.003 0.003 Highest Wavelength RSD (%) 0.317 0.153 Avg. Wavelength RSD (%) 0.068 ± 0.090 0.035 ± 0.041 Avg. Wavelength Difference (%) ----- 0.009 ± 0.118 Lowest Absorbance SD (A) 0.002 0.002 Highest Absorbance SD (A) 0.012 0.012 Avg. Absorbance SD (A) 0.007 ± 0.003 0.007 ± 0.003 Lowest Absorbance RSD (%) 4.57 2.27 Highest Absorbance RSD (%) 7.86 3.82 Avg. Absorbance RSD (%) 6.14 ± 0.99 3.18 ± 0.52 Avg. Absorbance Difference (%) ----- 100.33 ± 11.97 Avg. Rel. Peak Height Diff. (%) ----- -10.38 ± 4.82
Table 4. Statistical comparison of individual mineral peak heights for coarse and fine malachite particles (14 peaks total).

IMPROVING MINERAL SPECTRA REPRODUCIBILITY USING SINGLE REFLECTION DIAMOND FTIR-ATR SPECTROSCOPY
particles are more efficient in
packing that volume which is sampled by the evanescent wave. Higher absorbance values result.
Once again, however, gypsum, a very soft mineral, is an exception. No effect was observed in absorbance values, and hence relative standard deviations, with different apparent particle sizes. This result is probably due to problems in screening this soft and hygroscopic material. Note that only 12% of the gypsum stock material passed through the fine screen compared to 68 and 52% for malachite and sodalite, respectively. With gypsum, it is possible that the bulk of fine particles never passed through the fine screen and was retained and analyzed with the coarse material. Summary of the Procedure
Although some precision improvement might be expected in the secondary fine screening process, the results shown in Table 6 indicate that the small changes involved are probably not worth the extra effort. Then, the abbreviated procedure is summarized as follows:
� Reduce the size of any
sample to 15 mm or less. � Crush the sample to a
particle/powder consistency using a steel percussion (Plattner’s) mortar and pestle.
Coarse Fine Lowest Wavelength SD (cm-1) 0.05 0.03 Highest Wavelength SD (cm-1) 3.60 1.70 Avg. Wavelength SD (cm-1) 0.88 ± 1.42 0.37 ± 0.66 Lowest Wavelength RSD (%) 0.007 0.005 Highest Wavelength RSD (%) 0.370 0.398 Avg. Wavelength RSD (%) 0.123 ± 0.167 0.079 ± 0.157 Avg. Wavelength Difference (%) ----- -0.384 ± 0.516 Lowest Absorbance SD (A) 0.005 0.005 Highest Absorbance SD (A) 0.021 0.024 Avg. Absorbance SD (A) 0.010 ± 0.006 0.011 ± 0.007 Lowest Absorbance RSD (%) 4.79 2.53 Highest Absorbance RSD (%) 6.28 4.42 Avg. Absorbance RSD (%) 5.46 ± 0.53 3.52 ± 0.62 Avg. Absorbance Difference (%) ----- 62.90 ± 5.27 Avg. Rel. Peak Height Diff. (%) ----- -3.84 ± 3.03
Table 5. Statistical comparison of individual mineral peak height results for coarse and fine sodalite particles (6 peaks total).
Absorbance Relative Standard Deviation (%)
Previous1 (56 oz-in)
Coarse (72 oz-in)
Fine (72 oz-in)
Average (N = 25)
4.86 ± 1.62 5.54 ± 1.20 (same)
3.48 ± 0.69 (different)
Gypsum (N = 5)
6.98 ± 1.00 3.93 ± 0.72 (different)
4.26 ± 0.67 (different)
Malachite (N = 14)
5.01 ± 0.81 6.14 ± 0.99 (different)
3.18 ± 0.52 (different)
Sodalite (N = 6)
2.74 ± 0.30 5.46 ± 0.53 (different)
3.52 ± 0.62 (different)
Table 6. Comparison of absorbance relative standard deviations obtained at 56 oz-in and 72 oz-in of pressure.

IMPROVING MINERAL SPECTRA REPRODUCIBILITY USING SINGLE REFLECTION DIAMOND FTIR-ATR SPECTROSCOPY
� Reduce the sample to a fine powder using a standard mortar and pestle.
� Filter the sample through a 140 mesh sieve.
Alternate schemes have been
proposed for the spectroscopic analysis of single particles.6,7 If sample requirements of 0.1 g per run can be tolerated, however, the above procedure and the equipment described in this report are well suited for laboratories with modest budgets and limited time. Adequate peak position and height precision are provided to perform both qualitative and quantitative analyses. REFERENCES
1Lucania, J. P.; Kocak, A. Reproducibility of FTIR Mineral Spectra using Alternate Single Reflection Diamond ATR Configurations. PittCon, FTIR and Raman: Materials Analysis, Paper No. 990-6P, March 1, 2010.
2Lucania, J. P.; Milosevic, M.; Gremlich, H. U.; Schmidt, J. The Identification of Geological Samples Using Single Reflection Diamond ATR FTIR Spectroscopy. PittCon, Infrared and Raman Poster Session 222, Paper No. 2079P, March 20, 2002.
3Lucania, J. P.; Milosevic, M.; Gremlich, H. U. Technique Considerations for the Analysis
of Mineral Specimens by Single Reflection Diamond ATR Spectroscopy. Eastern Analytical Symposium, IR/NIR/Raman Poster Session, Accession Number 242, Paper Number 358, November 20, 2002.
4Blaedel, W. J.; Meloche, V. W. Elementary Quantitative Analysis Theory and Practice, 2nd ed.; Harper & Row: New York, 1963.
5Ferguson, G. A.; Takane, Y. Statistical Analysis in Psychology and Education, 6th ed.; McGraw-Hill: New York, 1989.
6Lucania, J. P.; Kocak, A. A Sensitive FTIR Transflectance Technique for Non-Destructive Identification of Small Particle Mineral Samples. PittCon, New Developments in Analytical Instrumentation and Software, Paper No. 250-11P, March 8, 2009.
7Weinger, B. A.; Reffner, J. A.; De Forest, P. R., J. Forensic Sci. 2009, 54 (4), 851-856.
8Ostrooumov, M., Geoarchaeology 2009, 24 (5), 619-637.
9Webb, P. A.; Orr, C. Analytical Methods in Fine Particle Technology, Micromeritics Instrument Corporation, Norcross, GA, 1997.
10Anthony, J. W.; Bideaux, R. A.; Bladh, K. W.; Nichols, M. C. Handbook of Mineralogy, Volumes I-V, Mineral Data Publishing, Tucson, AZ, 1990-2003.
11Klein, C.; Hurlbut, C. S. Manual of Mineralogy, 20th ed., John Wiley, New York, 1985.