
nmrlog
14
Nuclear Magnetic Resonance Log 1 Objective The development of the nuclear magnetic resonance (NMR) log was fueled by the desire to obtain an estimate of permeability from a continuous measurement. Previous work had relied on empirical correlations with porosity and irreducible water saturation. Unfortunately, these correlations are an order of magnitude in accuracy. Other alternatives such as the Repeat Formation Tester (RFT) tool provide permeability from mini-well tests, but are not continuous but discrete measurements. Therefore the primary objective of the NMR log was to obtain a continuous estimate of permeability and irreducible water saturation. Subsequent work of indicating shale content and estimating of clay bound water has further the applications of this tool. Theory The basic principle of nuclear magnetic resonance logging has been known and documented for many years[Wyllie, (1963), Pirson (1963)]. In fact, the first field application was introduced by Pan Geo Atlas Corp in California in 1960. The delay in widespread development has been due to the inability to construct a tool, which can be operated in the environmental conditions of the wellbore. High tech solutions have negated these factors and therefore have made this tool available for use. Two properties of nuclei identified by the NMR are magnetic moment and nuclear spin. Magnetic moment is the attempt of a nucleus to align itself parallel to an imposed magnetic field. The nuclear spin is the rotation of the nucleus about an axis similar to a gyroscope. Hydrogen exhibit these properties, C, O, Mg, Ca, Si do not. If a strong magnetic field is applied the spinning protons will tend to align in a direction parallel to the applied field, much like small bar magnets or magnetic compass needles. This process is called polarization. If the applied field is on a sufficient time to create order and then abruptly turned off, the tendency is for chaos to occur and the aligned protons to revert to their previous state. The return to chaos is not instantaneous, but a given relaxation time is required. The duration and magnitude of the relaxation time is the basis of NMR logging.
-
Upload
rajat-wadhwani -
Category
Documents
-
view
214 -
download
0
description
basics
Transcript of nmrlog
Nuclear Magnetic Resonance Log
1
Objective
The development of the nuclear magnetic resonance (NMR) log was fueled by the desire
to obtain an estimate of permeability from a continuous measurement. Previous work
had relied on empirical correlations with porosity and irreducible water saturation.
Unfortunately, these correlations are an order of magnitude in accuracy. Other
alternatives such as the Repeat Formation Tester (RFT) tool provide permeability from
mini-well tests, but are not continuous but discrete measurements. Therefore the primary
objective of the NMR log was to obtain a continuous estimate of permeability and
irreducible water saturation. Subsequent work of indicating shale content and estimating
of clay bound water has further the applications of this tool.
Theory
The basic principle of nuclear magnetic resonance logging has been known and
documented for many years[Wyllie, (1963), Pirson (1963)]. In fact, the first field
application was introduced by Pan Geo Atlas Corp in California in 1960. The delay in
widespread development has been due to the inability to construct a tool, which can be
operated in the environmental conditions of the wellbore. High tech solutions have
negated these factors and therefore have made this tool available for use.
Two properties of nuclei identified by the NMR are magnetic moment and nuclear spin.
Magnetic moment is the attempt of a nucleus to align itself parallel to an imposed
magnetic field. The nuclear spin is the rotation of the nucleus about an axis similar to a
gyroscope. Hydrogen exhibit these properties, C, O, Mg, Ca, Si do not. If a strong
magnetic field is applied the spinning protons will tend to align in a direction parallel to
the applied field, much like small bar magnets or magnetic compass needles. This
process is called polarization. If the applied field is on a sufficient time to create order
and then abruptly turned off, the tendency is for chaos to occur and the aligned protons to
revert to their previous state. The return to chaos is not instantaneous, but a given
relaxation time is required. The duration and magnitude of the relaxation time is the
basis of NMR logging.
Nuclear Magnetic Resonance Log
2
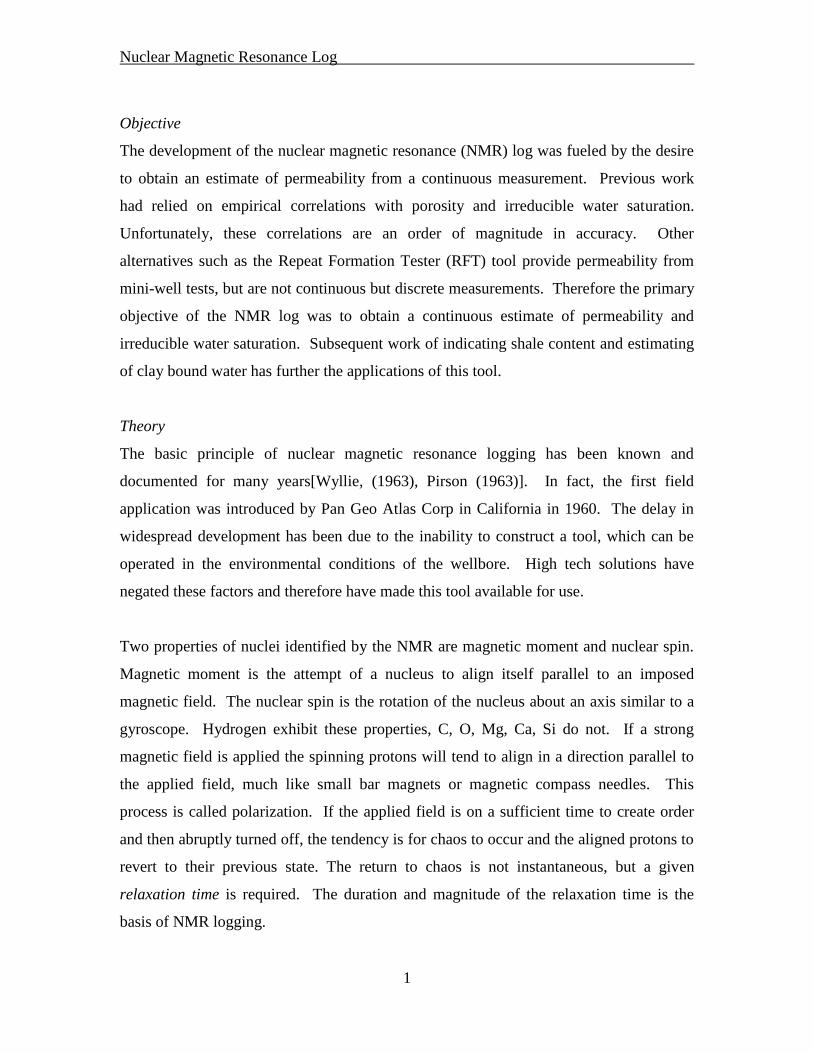
The precessing motion is the turning tendency or torque of a proton when realigning from
the applied field to the earth’s magnetic field. This is analogous to a spinning top
revolving away from the center axis as it loses energy with respect to the gravitational
field (Figure 1). The precessing protons induce an alternating voltage in a coil.
Figure 1. Precessing motion of a hydrogen nuclei about the static magnetic field similar
to a top precessing about the gravitational field. [Oilfield Review, 1997]
This voltage is related to the number of protons influenced and the rate these protons
revert to disorder. The precession frequency, or the resonance frequency, is called the
Larmor frequency, fL, and is proportional to the strength of the polarization field,
fL = * HE (Eq. 1)
where
is the gyromagnetic ratio of the proton (Y = 4.2576 x 10³ Hz/G)
He is the earth’s magnetic field
The Larmor frequency in the earth's field varies roughly from 1300 to 2600 Hz,
depending on location. The precessing protons, still acting like small magnets, sweep out
oscillating magnetic fields just as many radio antennas transmit electromagnetic fields.
The logging tool receives the tiny radio frequency signals (a few microvolts) from the
precessing protons in the formation.
The NML tool measures the free precession of proton nuclear magnetic moments
in the earth's magnetic field as shown in Figure 2. A strong DC polarizing magnetic field,
Hp, is applied to the formation in order to align proton spins approximately perpendicular

Nuclear Magnetic Resonance Log
3
to the earth's field (HE). The characteristic time constant for the exponential buildup of
this spin polarization is called T1, spin-lattice relaxation time. The polarizing field must
be applied for a period roughly five times T1 for full polarization to occur. At the end of
polarization, the field is turned off rapidly.
Figure 2. Nuclei response to an external polarizing field, Hp, and subsequent decay to the
earth’s magnetic field, He. [Schlumberger, 1989]
The amplitude of the recorded signal, fL, will exponentially decay due to variations in the
polarizing field. This means the spin orientation becomes out of phase with others in the
transverse plane - a transverse relaxation process. The time constant for the transverse
relaxation process is called T2, the transverse decay time. Measuring the decay of the
precessing transverse signal is the heart of the NMR pulse-echo measurement. Figure 3
is an illustration of the decay response.

Nuclear Magnetic Resonance Log
4
Figure 3. Pulse echo sequence and refocusing. [Oilfield Review, 1997]
In Figure 3, the spin precession begins with a 90 pulse. To enhance the signal and to
measure the true transverse relaxation rate, subsequent pulses are reversed to 180. The
result is dephasing of the precessing protons to produce what is called a spin echo. By
reversing the spins, the protons continue to precess, in the same transverse plane as
before, but now the slowest one is in first and the fastest one last. If the protons return at
the same rate, they all will arrive at the same time. However, if a perturbation occurs, the
protons will arrive at varying times. This perturbation or dephasing creates the decline in
the amplitude response. The process is repeated hundreds of times, resulting in an
exponentially decaying sine wave with time constant T2* and frequency fL as shown in
Fig. 4.
Nuclear Magnetic Resonance Log
5
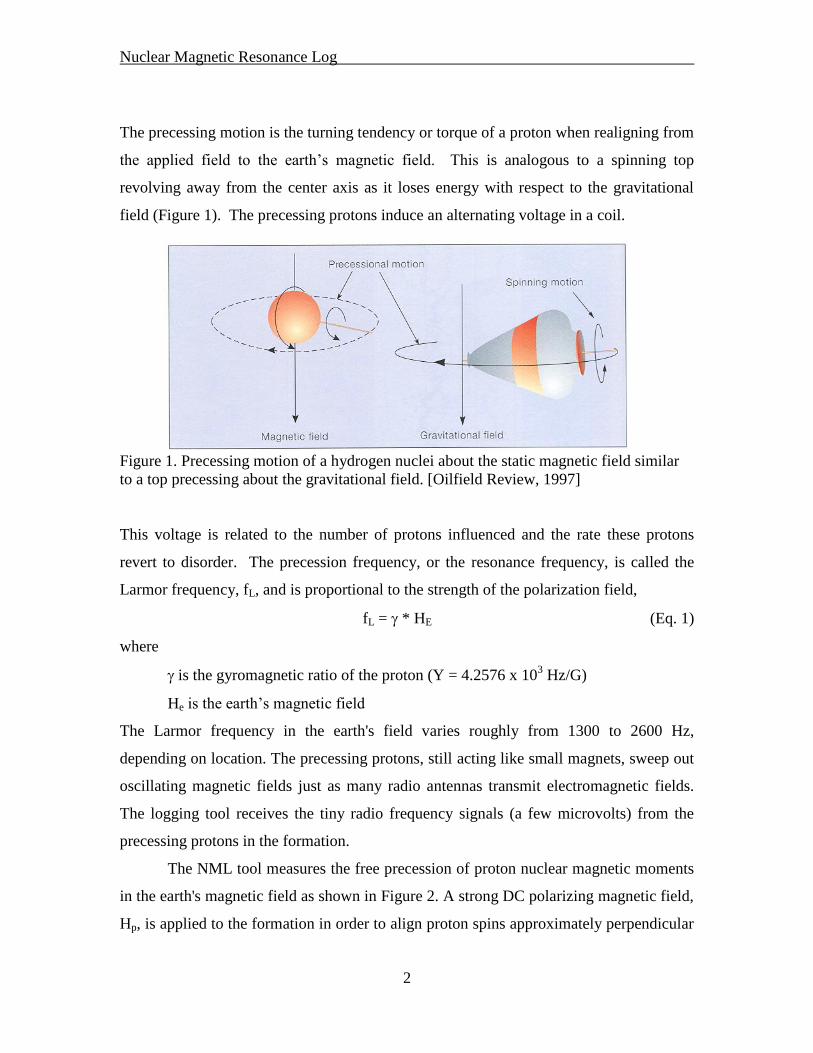
Figure 4. Pulse echo response [Schlumberger, 1989]
Because the large polarizing field cannot be turned off instantaneously, much of the
signal amplitude could be lost. To compensate for this effect, the polarizing field is
allowed to oscillate at the Larmor frequency for a few cycles; this "ringing" field keeps
the proton spins aligned perpendicular to HE.
The time delay ( approximately 25 to 30 ms) after the beginning of the free precession, is
to take advantage of the short relaxation times for hydrogen protons in solids or bound to
surfaces and the longer relaxation times of the bulk fluids in the pore space.
Consequently, the delay in observing the signal records only the bulk or movable fluids
in the pore space. The measurement presented by the log is called the free fluid index
(FFI) or free fluid porosity (f). This quantity is derived from the extrapolated signal
amplitude at the beginning of free precession.
The time constant T2 characterizes the transverse magnetization signal decay. The decay
comes from three sources:
a. intrinsic - the intrinsic bulk relaxation rate in the fluids,
b. surface - the surface relaxation rate, a formation environmental effect
Nuclear Magnetic Resonance Log
6
c. diffusion - the diffusion-in-gradient effect, which is a mix of environmental
and tool effects.
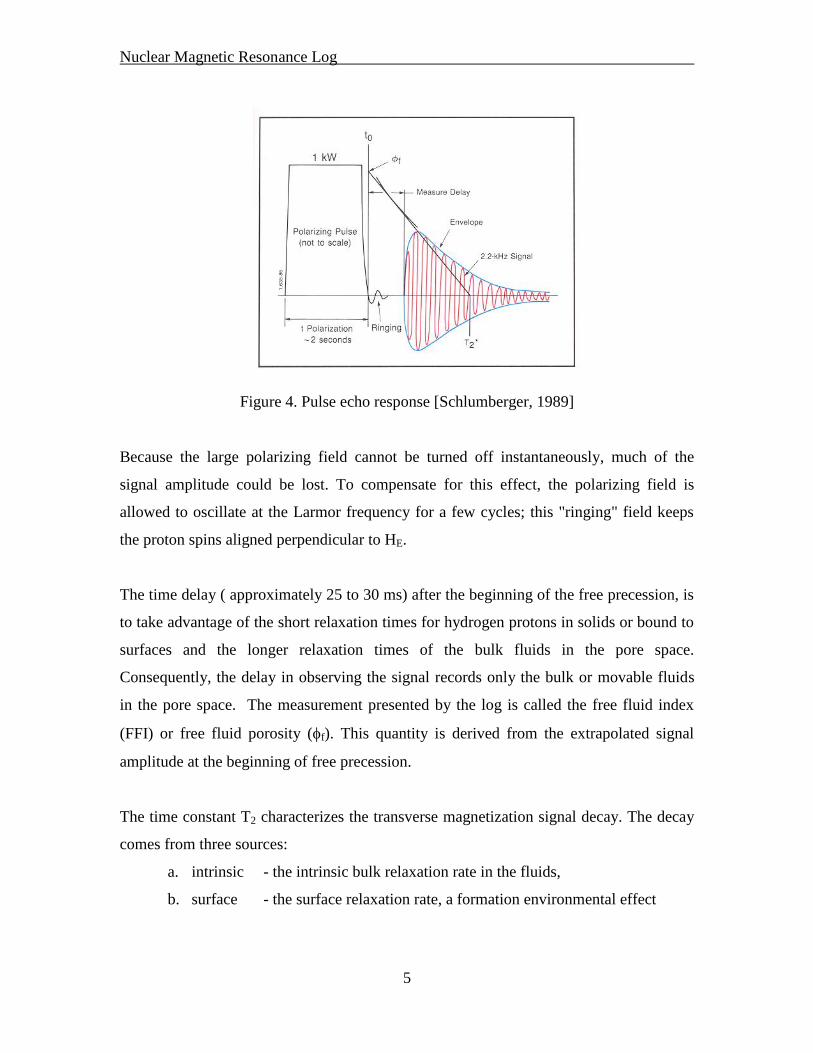
a. Relaxation time is dependent on fluid type and location of the fluid in the pores; i.e.,
the wettability of the rock. Bulk-fluid relaxation is caused primarily by the natural spin-
spin magnetic interactions between neighboring protons. The relative motions of two
spins create a fluctuating magnetic field at one spin due to the motion of the other. These
fluctuating magnetic fields cause relaxation.
Molecular motions in water and light oils are much more rapid, so the relaxation is very
inefficient with long decay times. As the liquids become more viscous, the molecular
motions are slower, and therefore are closer to the Larmor frequency. Thus viscous oils
relax relatively efficiently with short T1 and T2 decay times (Fig. 5).
Figure 5. Bulk relaxation time versus fluid viscosity [Oilfield Review, 1997]
It should be noted that for liquids with low viscosities, the diffusion-in-gradient effects
dominate the T2 rates; subsequently decreasing with reduced viscosity. The diffusion-in-
gradient mechanism does not affect Tl as shown in Figure 5.
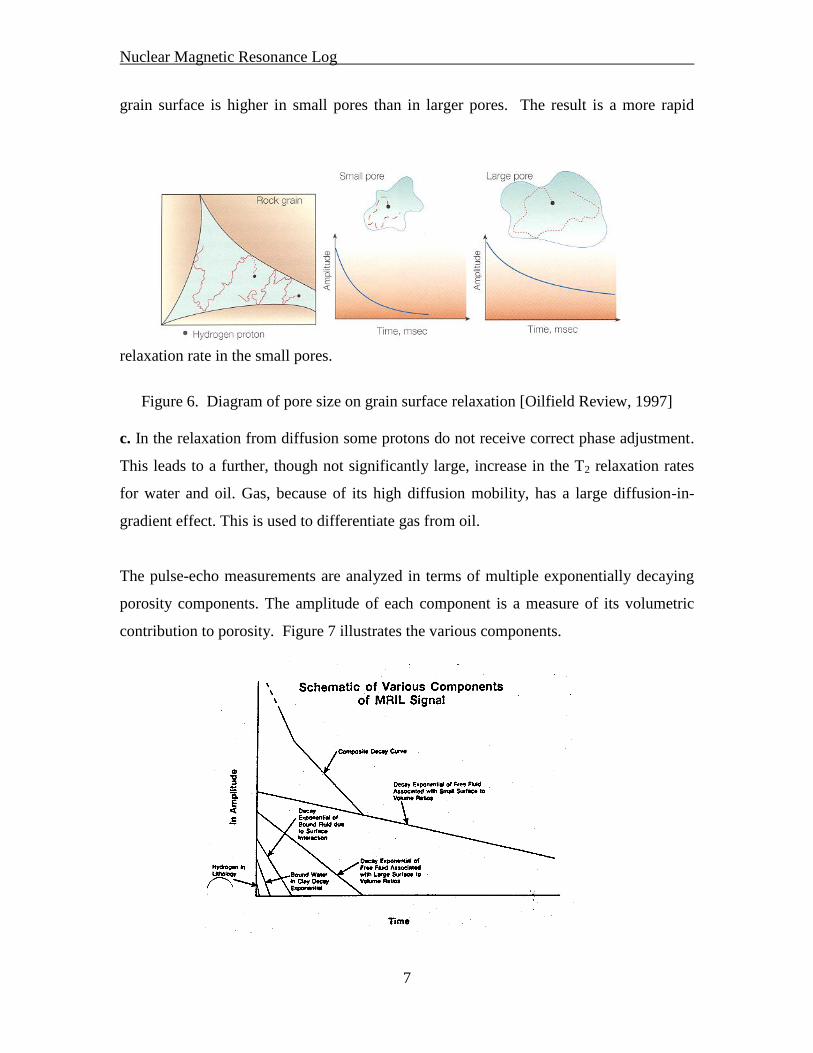
b. Grain surface relaxation is the most important process affecting relaxation times. The
surface relaxation rate depends on the ability of the protons in the fluids to make multiple
interactions with the surface. Brownian motion prevails therefore the path of the
precessing proton is a random diffusion process. The probability of colliding with the
Nuclear Magnetic Resonance Log
7
grain surface is higher in small pores than in larger pores. The result is a more rapid
relaxation rate in the small pores.
Figure 6. Diagram of pore size on grain surface relaxation [Oilfield Review, 1997]
c. In the relaxation from diffusion some protons do not receive correct phase adjustment.
This leads to a further, though not significantly large, increase in the T2 relaxation rates
for water and oil. Gas, because of its high diffusion mobility, has a large diffusion-in-
gradient effect. This is used to differentiate gas from oil.
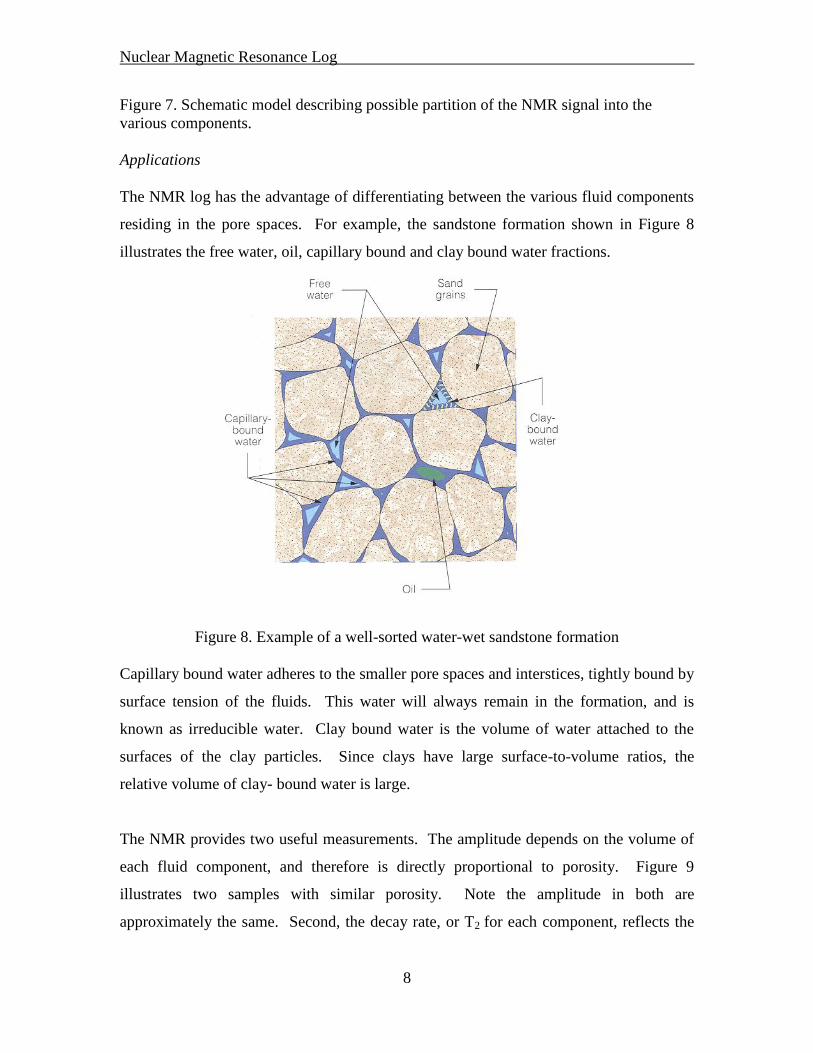
The pulse-echo measurements are analyzed in terms of multiple exponentially decaying
porosity components. The amplitude of each component is a measure of its volumetric
contribution to porosity. Figure 7 illustrates the various components.
Nuclear Magnetic Resonance Log
8
Figure 7. Schematic model describing possible partition of the NMR signal into the
various components.
Applications
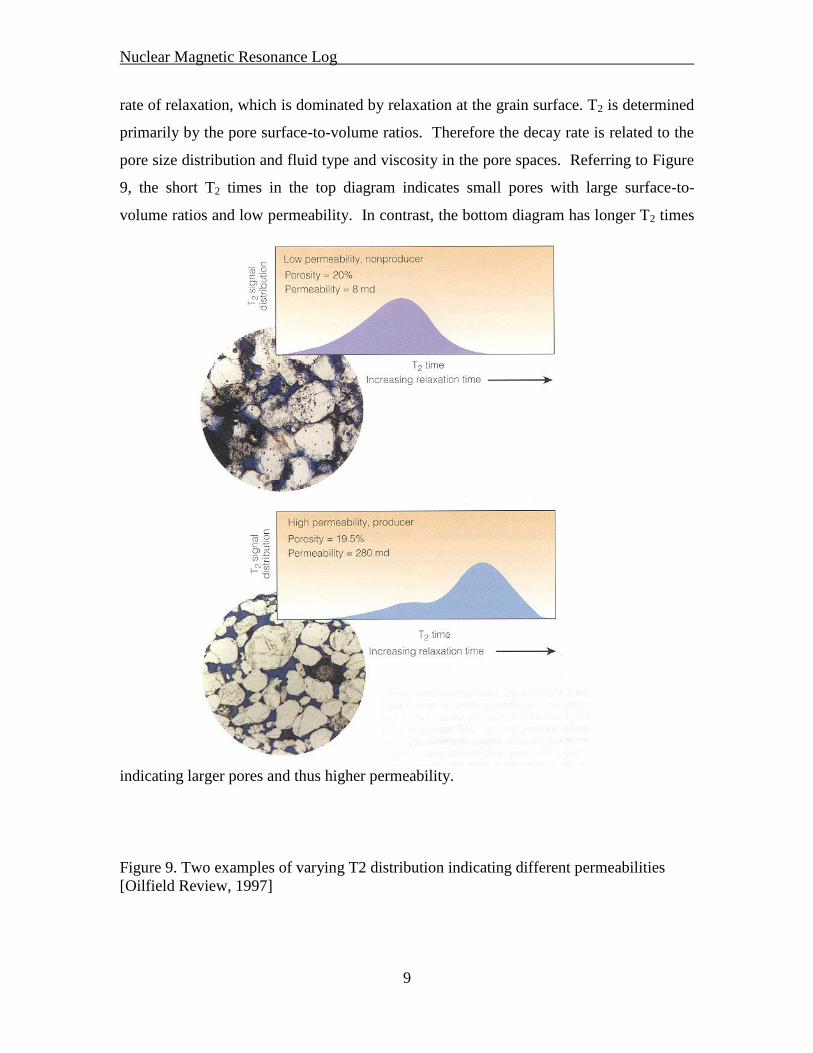
The NMR log has the advantage of differentiating between the various fluid components
residing in the pore spaces. For example, the sandstone formation shown in Figure 8
illustrates the free water, oil, capillary bound and clay bound water fractions.
Figure 8. Example of a well-sorted water-wet sandstone formation
Capillary bound water adheres to the smaller pore spaces and interstices, tightly bound by
surface tension of the fluids. This water will always remain in the formation, and is
known as irreducible water. Clay bound water is the volume of water attached to the
surfaces of the clay particles. Since clays have large surface-to-volume ratios, the
relative volume of clay- bound water is large.
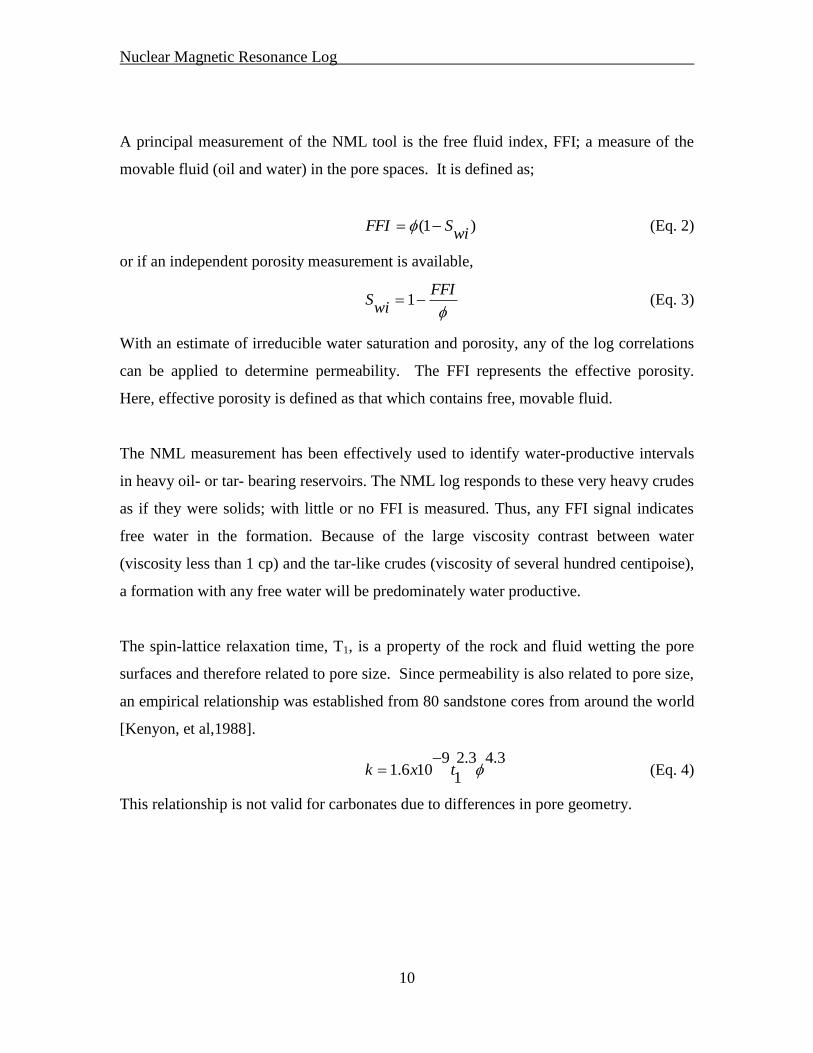
The NMR provides two useful measurements. The amplitude depends on the volume of
each fluid component, and therefore is directly proportional to porosity. Figure 9
illustrates two samples with similar porosity. Note the amplitude in both are
approximately the same. Second, the decay rate, or T2 for each component, reflects the
Nuclear Magnetic Resonance Log
9
rate of relaxation, which is dominated by relaxation at the grain surface. T2 is determined
primarily by the pore surface-to-volume ratios. Therefore the decay rate is related to the
pore size distribution and fluid type and viscosity in the pore spaces. Referring to Figure
9, the short T2 times in the top diagram indicates small pores with large surface-to-
volume ratios and low permeability. In contrast, the bottom diagram has longer T2 times
indicating larger pores and thus higher permeability.
Figure 9. Two examples of varying T2 distribution indicating different permeabilities
[Oilfield Review, 1997]
Nuclear Magnetic Resonance Log
10
A principal measurement of the NML tool is the free fluid index, FFI; a measure of the
movable fluid (oil and water) in the pore spaces. It is defined as;
)1(wi
SFFI (Eq. 2)
or if an independent porosity measurement is available,
FFI
wiS 1 (Eq. 3)
With an estimate of irreducible water saturation and porosity, any of the log correlations
can be applied to determine permeability. The FFI represents the effective porosity.
Here, effective porosity is defined as that which contains free, movable fluid.
The NML measurement has been effectively used to identify water-productive intervals
in heavy oil- or tar- bearing reservoirs. The NML log responds to these very heavy crudes
as if they were solids; with little or no FFI is measured. Thus, any FFI signal indicates
free water in the formation. Because of the large viscosity contrast between water
(viscosity less than 1 cp) and the tar-like crudes (viscosity of several hundred centipoise),
a formation with any free water will be predominately water productive.
The spin-lattice relaxation time, T1, is a property of the rock and fluid wetting the pore
surfaces and therefore related to pore size. Since permeability is also related to pore size,
an empirical relationship was established from 80 sandstone cores from around the world
[Kenyon, et al,1988].
3.43.2
1
9106.1 txk
(Eq. 4)
This relationship is not valid for carbonates due to differences in pore geometry.
Nuclear Magnetic Resonance Log
11
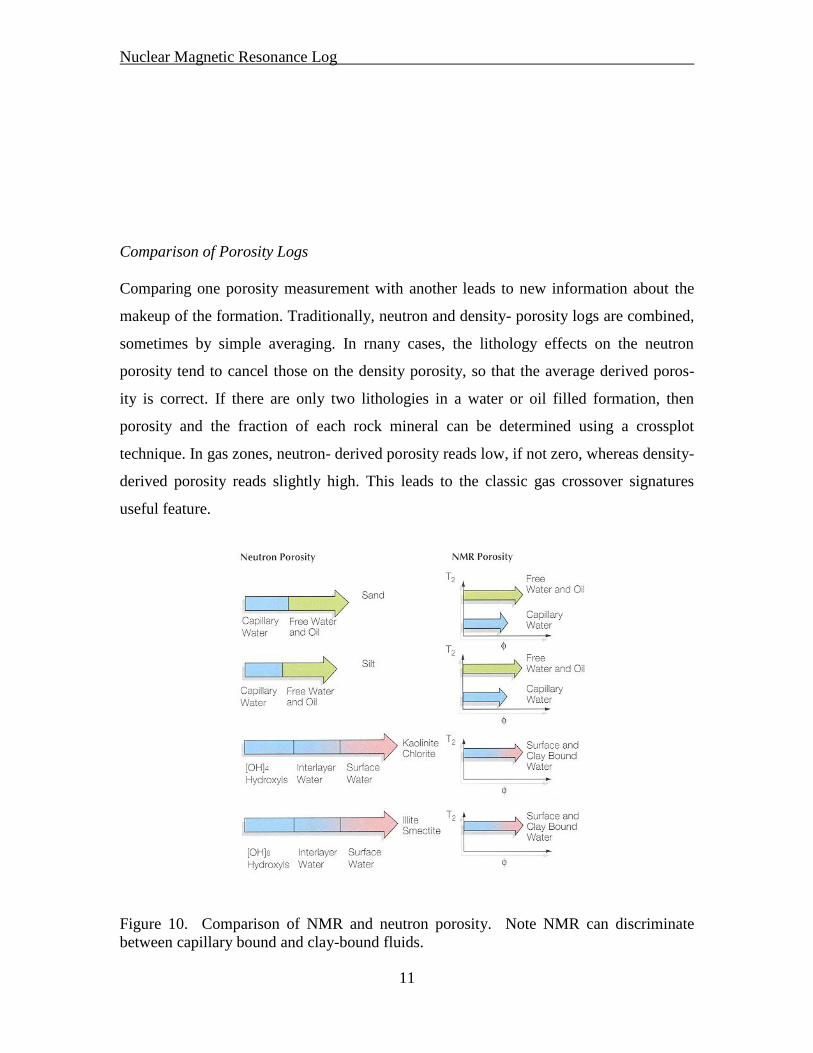
Comparison of Porosity Logs
Comparing one porosity measurement with another leads to new information about the
makeup of the formation. Traditionally, neutron and density- porosity logs are combined,
sometimes by simple averaging. In rnany cases, the lithology effects on the neutron
porosity tend to cancel those on the density porosity, so that the average derived poros-
ity is correct. If there are only two lithologies in a water or oil filled formation, then
porosity and the fraction of each rock mineral can be determined using a crossplot
technique. In gas zones, neutron- derived porosity reads low, if not zero, whereas density-
derived porosity reads slightly high. This leads to the classic gas crossover signatures
useful feature.
Figure 10. Comparison of NMR and neutron porosity. Note NMR can discriminate
between capillary bound and clay-bound fluids.
Nuclear Magnetic Resonance Log
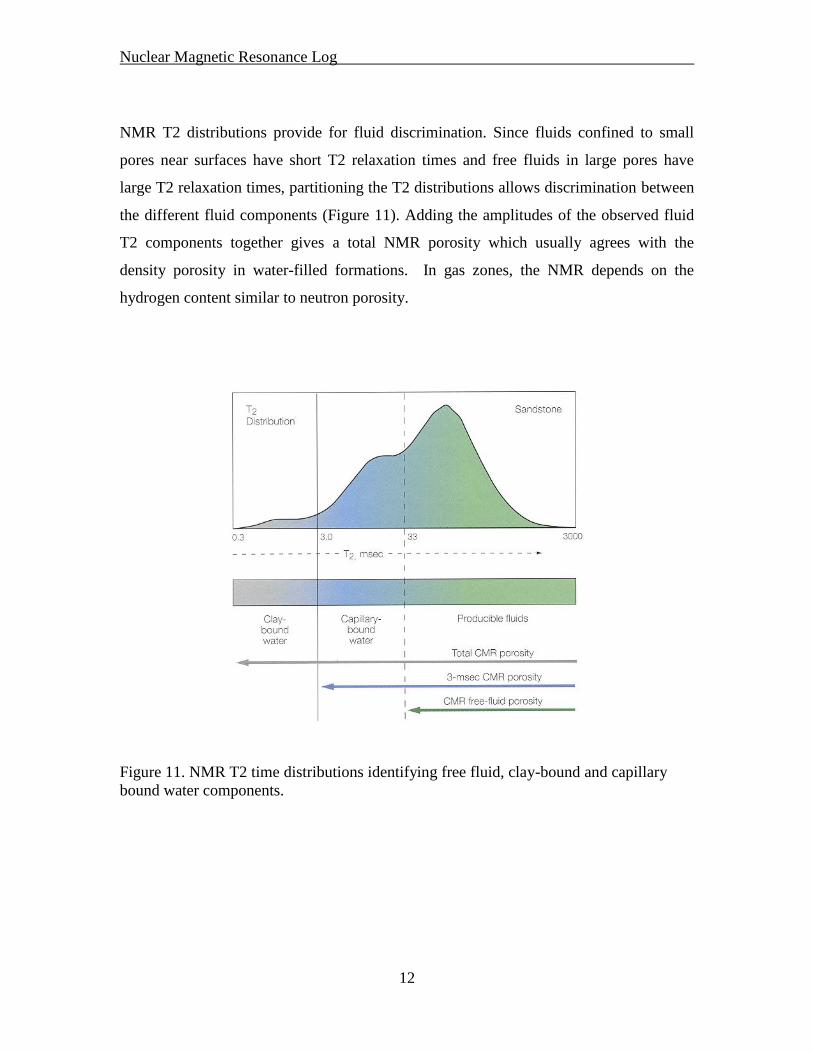
12
NMR T2 distributions provide for fluid discrimination. Since fluids confined to small
pores near surfaces have short T2 relaxation times and free fluids in large pores have
large T2 relaxation times, partitioning the T2 distributions allows discrimination between
the different fluid components (Figure 11). Adding the amplitudes of the observed fluid
T2 components together gives a total NMR porosity which usually agrees with the
density porosity in water-filled formations. In gas zones, the NMR depends on the
hydrogen content similar to neutron porosity.
Figure 11. NMR T2 time distributions identifying free fluid, clay-bound and capillary
bound water components.
Nuclear Magnetic Resonance Log
13
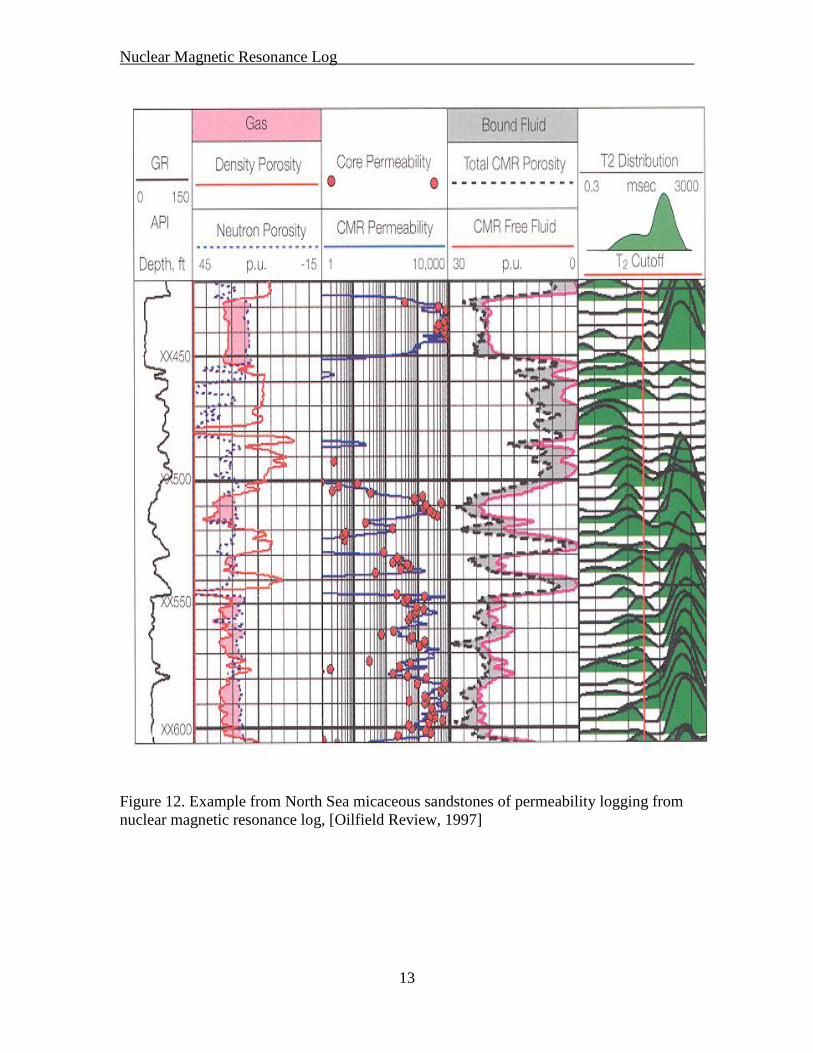
Figure 12. Example from North Sea micaceous sandstones of permeability logging from
nuclear magnetic resonance log, [Oilfield Review, 1997]
Nuclear Magnetic Resonance Log
14
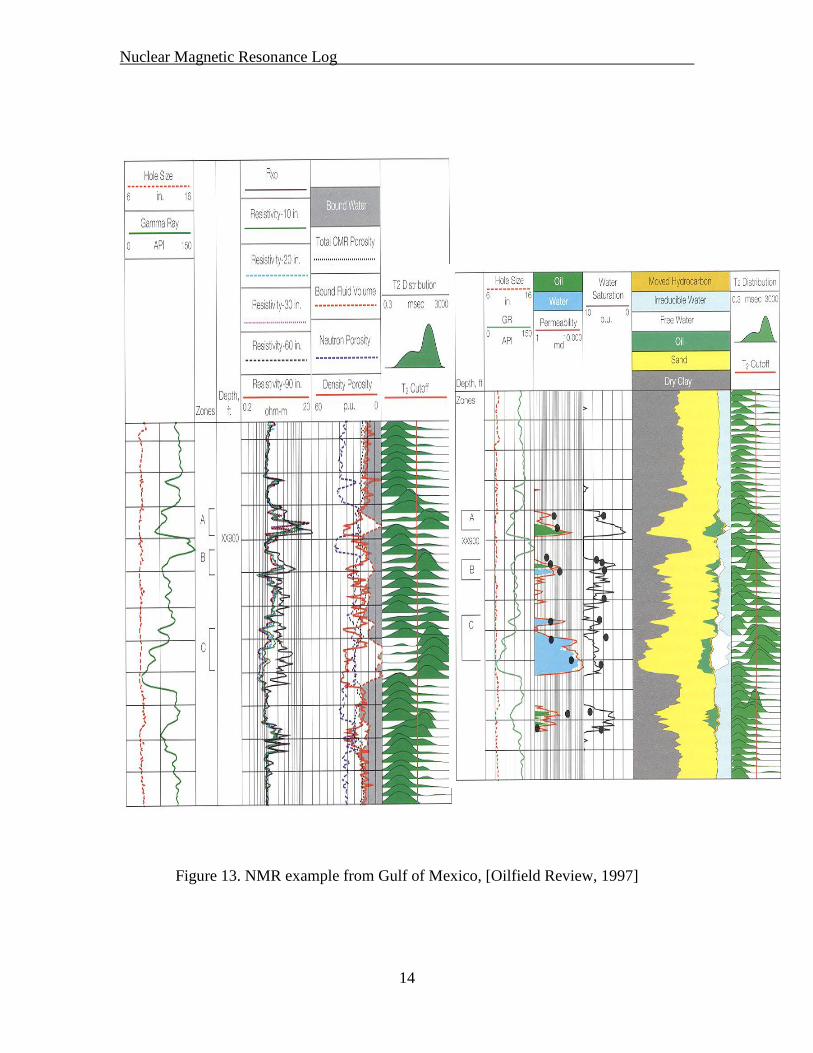
Figure 13. NMR example from Gulf of Mexico, [Oilfield Review, 1997]


