
nmp chapter 41 -...
38
Chapter IV : The System Zn 0.25 Cu x Mn 0.75-x Fe 2 O 4 66 4.1 Introduction Ferrites are mixed metal oxides which contain iron oxide as major component. These ferrites are classified into three types viz. spinel, garnet and hexaferrite [1]. In the spinel structure of general formula AB 2 O 4 there are twice as many octahedral (B) sites as tetrahedral (A) sites. The spinels are further classsified into two types depending upon position of M 2+ ion. If M 2+ occupies only the A sites, the spinel is normal; if it occupies only the B sites, the spinel is inverse. Mixed metal oxides possessing spinel structure and its property have been investigated by number of workers [2-7]. The properties of these materials dependent on the nature of ions and their distribution among tetrahedral and octahedral sites. Ferrospinels have interesting structural, electrical and magnetic properties and are widely used in many important components such as magnetic resonance imaging [8], magnetic drug delivery [9], magnetic recording media, magnetic storage fluids [10], sensors [11], pigments [12] and photocatalysts [13] etc. The method of preparation plays a very important role with regard to the chemical, structural and magnetic property of mixed spinel ferrites .Various methods have been developed for the synthesis of ferrites [14-18]. Wet chemical methods such as, co- precipitation [19-22], sol-gel [23-25], citrate-gel [26], hydrothermal [27- 29], solvothermal [30-31], mechanical alloying [32-33] have been reported for obtaining desired properties of materials. In present investigation, an attempt is made to prepare copper substituted Mn-Zn ferrite by co-precipitation method, which neither requires sophisticated instrument nor high sintering temperature. Their structural, electrical and magnetic properties were characterized by using X-ray diffraction (XRD), EDAX, Thermal analysis (TGA-DTA), Scanning electron microscopy (SEM), IR spectroscopy, Electrical
-
Upload
duongkhuong -
Category
Documents
-
view
217 -
download
1
Transcript of nmp chapter 41 -...

Chapter IV : The System Zn0.25CuxMn0.75-xFe2O4
66
4.1 Introduction
Ferrites are mixed metal oxides which contain iron oxide as
major component. These ferrites are classified into three types viz.
spinel, garnet and hexaferrite [1]. In the spinel structure of general
formula AB2O4 there are twice as many octahedral (B) sites as tetrahedral
(A) sites. The spinels are further classsified into two types depending
upon position of M2+ ion. If M2+ occupies only the A sites, the spinel is
normal; if it occupies only the B sites, the spinel is inverse.
Mixed metal oxides possessing spinel structure and its property
have been investigated by number of workers [2-7]. The properties of
these materials dependent on the nature of ions and their distribution
among tetrahedral and octahedral sites.
Ferrospinels have interesting structural, electrical and magnetic
properties and are widely used in many important components such as
magnetic resonance imaging [8], magnetic drug delivery [9], magnetic
recording media, magnetic storage fluids [10], sensors [11], pigments
[12] and photocatalysts [13] etc. The method of preparation plays a very
important role with regard to the chemical, structural and magnetic
property of mixed spinel ferrites .Various methods have been developed
for the synthesis of ferrites [14-18]. Wet chemical methods such as, co-
precipitation [19-22], sol-gel [23-25], citrate-gel [26], hydrothermal [27-
29], solvothermal [30-31], mechanical alloying [32-33] have been
reported for obtaining desired properties of materials.
In present investigation, an attempt is made to prepare copper
substituted Mn-Zn ferrite by co-precipitation method, which neither
requires sophisticated instrument nor high sintering temperature. Their
structural, electrical and magnetic properties were characterized by using
X-ray diffraction (XRD), EDAX, Thermal analysis (TGA-DTA),
Scanning electron microscopy (SEM), IR spectroscopy, Electrical
Chapter IV : The System Zn0.25CuxMn0.75-xFe2O4
67
conductivity. Magnetic study of synthesized compounds has also been
investigated. Photocatalytic activity of the system was studied with
photodegradation of congored in presence of ultra-violet light. Various
gases were used to check the gas sensing performance of these ferrites at
operating temperature. Different gas sensing parameters were studied in
detail to express the mechanism and activity of these ferrites.
4.2 Materials and Methods
The various compounds of the system Zn0.25CuxMn0.75-xFe2O4 were
prepared by co-precipitation method [34]. To prepare spinel compounds
of high purity, water soluble sulphates such as manganese, copper, zinc
and iron precursor were dissolved separately. Appropriate amount of
these solutions were mixed together in 1000ml beaker with constant
stirring. Then resulting solution was precipitated as hydroxide precursor
using 10% NaOH solution by maintaining pH at 9.5-10.The hydroxides
were then oxidized using 30% H2O2 (100vol.) solution and the obtained
precipitate was digested in water bath for 4 hr. at 90-950C. Then
precipitate was washed thoroughly with distilled water to remove
unreacted sulphates and excess alkali and filtered through the Whatman
filter paper No. 41. The precipitate was dried in oven at 110oC. The dried
powder was then heated at different temperatures to get resulting mixed-
metal oxides. The above powders were heated separately at 900°C for 4
hrs to get the final product.
The spinel powders were then mixed with binder (2% PVA in
acetone) and pressed into pellets of the size 1 cm in diameter and about
0.3 cm thickness under a pressure 10000 psi. The pellets were initially
heated at 400°C for 6 hrs to remove binder. These pellets were then used
for determination of various properties.

Chapter IV : The System Zn0.25CuxMn0.75-xFe2O4
68
The powder X–ray diffraction patterns were recorded on Philips
PW-1710 X-ray diffractometer by using CuKα radiation. The lattice
parameters were calculated using high angle reflection of XRD by using
the following formula,
---------------- 4.1 Crystallite size was calculated by using the Scherrer formula,
-------------- 4.2
The percentage porosity was calculated by using the formula,
-------------------- 4.3 where, the notations have their usual meaning.
The FT-IR spectra were recorded in the range of 400 to 1000
cm-1 on Perkin Elmer – IR spectrophotometer (model E-2829) in KBr
pellets.
The SEM micrograph of the samples was obtained using
scanning electron microscope (JEOL JSM 6360). The grain size of all the
samples was calculated by Cottrell’s method.
Magnetic measurements of all compositions of the system were
made by using a high field hysteresis loop tracer. The measurements were
done at room temperature. Saturation magnetization (Ms), coercive field
(Hc) and remenant magnetization (Mr) of the samples were studied from
the hysteresis loops of respective curves.
Elemental analysis was carried out by using the energy dispersive
X-ray spectroscopy equipped with Scanning electron microscopy on
instrument Phi560 XPS/AES/SIMS UHV system.
Chapter IV : The System Zn0.25CuxMn0.75-xFe2O4
69
Two probe technique was employed to measure the D.C.
resistivity of the samples in the temperature range of room temperature to
500°C and specific resistivity was determined using the relation,
ρ = (πd2 / 4t) R ----------------- 4.4
The activation energy (eV) was calculated from the plots of log ρ
Vs 103/T. Silver paste was applied to both the surfaces of the pellets for
good ohmic contacts.
In presence of various oxidizing and reducing gases, gas
sensing performance of Cu-substituted Mn-Zn ferrite was tested . The
electrical resistance of a sensor in dry air is measured by use of
conventional circuitry in which the sensor is connected to an external
resistor at circuit voltage of 10 V. The gas response (S) is defined as the
ratio of ∆R, i.e. the change in resistance of the sensor in air (Ra) and in
presence of gas (Rg), normalized to the value of sensor resistance in air.
(%) S = Ra – Rg / Ra -------------- 4.5
Photocatalytic performance was studied by using organic dye like
congored. Congored is considered as a model of a series of common azo-
dyes, used in the industry .The photocatalytic activity was studied for
congored dye in presence of Ultra-violet light with different times.
4.3 Results and Discussion
4.3.1 X-ray Diffraction Analysis
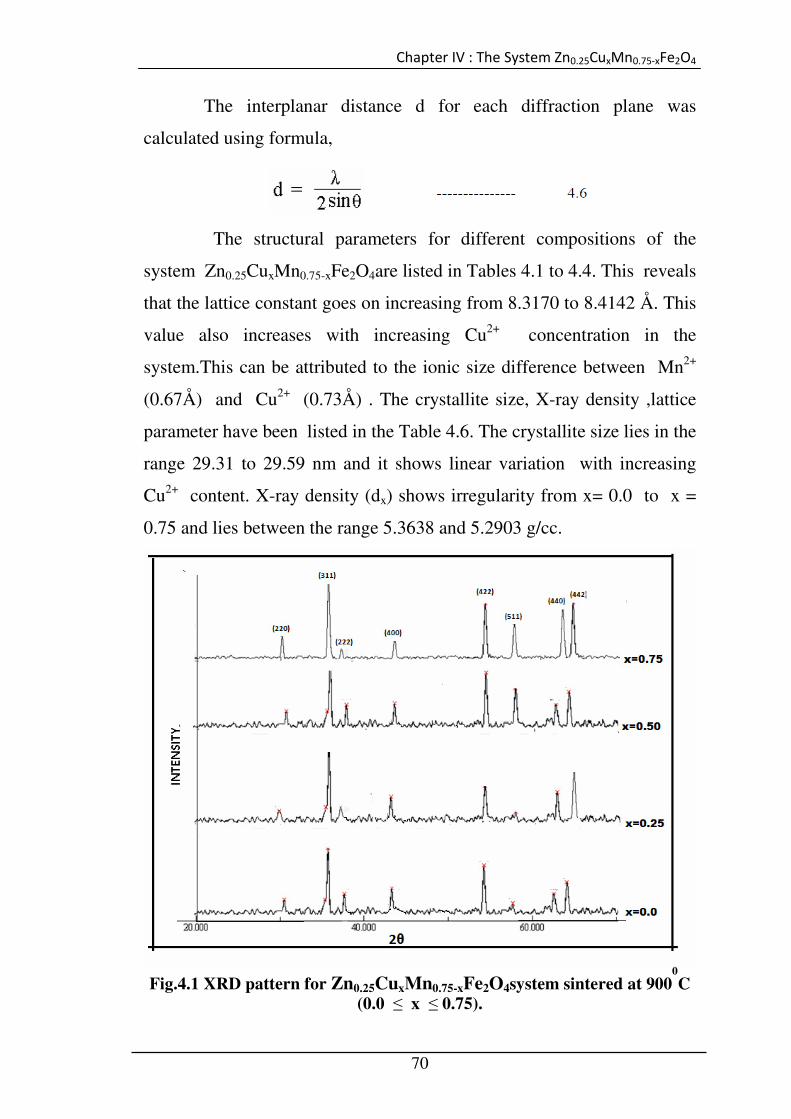
X-ray powder diffraction patterns of all the compositions of
system Zn0.25CuxMno.75-xFe2O
4 sintered at sintering temperature 900oc are
shown in Fig. 4.1. From the X-ray analysis it is observed that all the
compositions of the system have cubic unit cells. Indexed X-ray
diffractometer patterns are listed in Tables 4.1 -4.4. For all spinel ferrites
(311) reflection is the more intense one. The dhkl
and 2θ values were
compared with the values reported in the JCPDS 10-467.
Chapter IV : The System Zn0.25CuxMn0.75-xFe2O4
70
The interplanar distance d for each diffraction plane was
calculated using formula,
The structural parameters for different compositions of the
system Zn0.25CuxMn0.75-xFe2O4are listed in Tables 4.1 to 4.4. This reveals
that the lattice constant goes on increasing from 8.3170 to 8.4142 Å. This
value also increases with increasing Cu2+ concentration in the
system.This can be attributed to the ionic size difference between Mn2+
(0.67Å) and Cu2+ (0.73Å) . The crystallite size, X-ray density ,lattice
parameter have been listed in the Table 4.6. The crystallite size lies in the
range 29.31 to 29.59 nm and it shows linear variation with increasing
Cu2+ content. X-ray density (dx) shows irregularity from x= 0.0 to x =
0.75 and lies between the range 5.3638 and 5.2903 g/cc.
Fig.4.1 XRD pattern for Zn0.25CuxMn0.75-xFe2O4system sintered at 900
0C
(0.0 ≤ x ≤ 0.75).

Chapter IV : The System Zn0.25CuxMn0.75-xFe2O4
71
Table 4.1 Indexed X-ray diffraction pattern of Zn0.25 Mn0.75Fe2O4
Structure: Cubic Lattice constant: a = 8.3170 Å
Table 4.2 Indexed X-ray diffraction pattern of
Zn0.25 Cu0.25 Mn0.5 Fe2O4
.Sr.No. 2 θ d (Å)
(observed) d(Å)
(calculated) hkl a(Å)
1 30.13 2.7440 2.7420 2 2 0 8.2065 2 35.72 2.5250 2.523 3 1 1 8.3296 3 49.58 1.8264 1.8262 4 2 1 8.4183 4 54.20 1.7085 1.7082 4 2 2 8.2833 5 57.71 1.6102 1.6100 5 1 1 8.2934 6 62.06 1.5033 1.5030 5 2 1 8.3193 7 62.75 1.4798 1.4796 4 4 0 8.3687
Structure: Cubic Lattice constant: a = 8.3847 Å
.Sr.No. 2 θ d(Å)
(observed) d(Å)
(calculated) hkl a(Å)
1 30.14 2.9625 2.9700 2 2 0 8.3793
2 35.48 2.5279 2.5280 3 1 1 8.3841
3 37.13 2.4192 2.4249 2 2 2 8.3808
4 43.13 2.0956 2.1001 4 0 0 8.3824
5 53.48 1.7119 1.7147 4 2 2 8.3865
6 56.99 1.6145 1.6160 5 1 1 8.3892
7 62.57 1.4832 1.4849 4 4 0 8.3906
Chapter IV : The System Zn0.25CuxMn0.75-xFe2O4
72
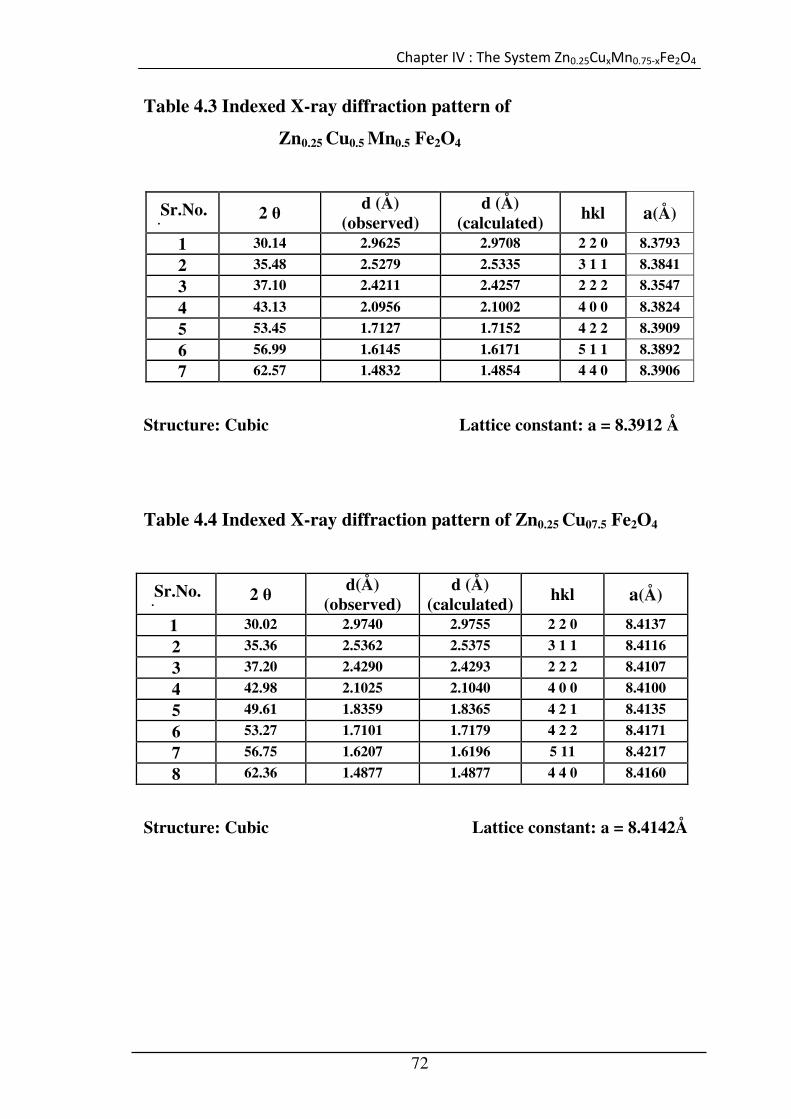
Table 4.3 Indexed X-ray diffraction pattern of
Zn0.25 Cu0.5 Mn0.5 Fe2O4
.Sr.No. 2 θ d (Å)
(observed) d (Å)
(calculated) hkl a(Å)
1 30.14 2.9625 2.9708 2 2 0 8.3793
2 35.48 2.5279 2.5335 3 1 1 8.3841
3 37.10 2.4211 2.4257 2 2 2 8.3547
4 43.13 2.0956 2.1002 4 0 0 8.3824
5 53.45 1.7127 1.7152 4 2 2 8.3909
6 56.99 1.6145 1.6171 5 1 1 8.3892
7 62.57 1.4832 1.4854 4 4 0 8.3906
Structure: Cubic Lattice constant: a = 8.3912 Å
Table 4.4 Indexed X-ray diffraction pattern of Zn0.25 Cu07.5 Fe2O4
.Sr.No. 2 θ d(Å)
(observed) d (Å)
(calculated) hkl a(Å)
1 30.02 2.9740 2.9755 2 2 0 8.4137
2 35.36 2.5362 2.5375 3 1 1 8.4116
3 37.20 2.4290 2.4293 2 2 2 8.4107
4 42.98 2.1025 2.1040 4 0 0 8.4100
5 49.61 1.8359 1.8365 4 2 1 8.4135
6 53.27 1.7101 1.7179 4 2 2 8.4171
7 56.75 1.6207 1.6196 5 11 8.4217
8 62.36 1.4877 1.4877 4 4 0 8.4160
Structure: Cubic Lattice constant: a = 8.4142Å
Chapter IV : The System Zn0.25CuxMn0.75-xFe2O4
73
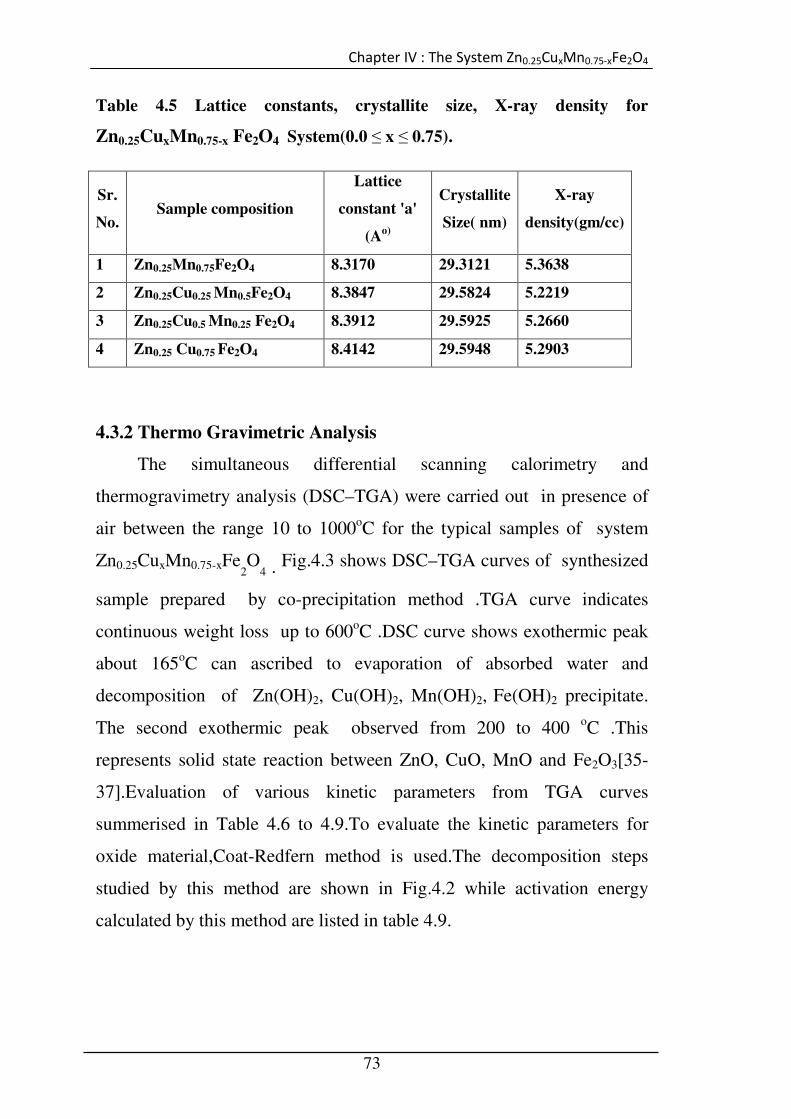
Table 4.5 Lattice constants, crystallite size, X-ray density for
Zn0.25CuxMn0.75-x Fe2O4 System(0.0 ≤ x ≤ 0.75).
4.3.2 Thermo Gravimetric Analysis
The simultaneous differential scanning calorimetry and
thermogravimetry analysis (DSC–TGA) were carried out in presence of
air between the range 10 to 1000oC for the typical samples of system
Zn0.25CuxMn0.75-xFe2O
4 . Fig.4.3 shows DSC–TGA curves of synthesized
sample prepared by co-precipitation method .TGA curve indicates
continuous weight loss up to 600oC .DSC curve shows exothermic peak
about 165oC can ascribed to evaporation of absorbed water and
decomposition of Zn(OH)2, Cu(OH)2, Mn(OH)2, Fe(OH)2 precipitate.
The second exothermic peak observed from 200 to 400 oC .This
represents solid state reaction between ZnO, CuO, MnO and Fe2O3[35-
37].Evaluation of various kinetic parameters from TGA curves
summerised in Table 4.6 to 4.9.To evaluate the kinetic parameters for
oxide material,Coat-Redfern method is used.The decomposition steps
studied by this method are shown in Fig.4.2 while activation energy
calculated by this method are listed in table 4.9.
Sr.
No. Sample composition
Lattice
constant 'a'
(Ao)
Crystallite
Size( nm)
X-ray
density(gm/cc)
1 Zn0.25Mn0.75Fe2O4 8.3170 29.3121 5.3638
2 Zn0.25Cu0.25 Mn0.5Fe2O4 8.3847 29.5824 5.2219
3 Zn0.25Cu0.5 Mn0.25 Fe2O4 8.3912 29.5925 5.2660
4 Zn0.25 Cu0.75 Fe2O4 8.4142 29.5948 5.2903

Chapter IV : The System Zn0.25CuxMn0.75-xFe2O4
74
Table 4.6 Evaluation of Kinetic parameters of Zn0.25Mn0.75Fe2O4.
W0 = 7.0800 mg
Temp oc
residual wt.(mg)
α = Wt - Wf W0 - Wf ln α /T2 gα ln gα /T2 1000/T
50 7.0241 0.9354 -11.6220 1.4918 -11.1553 3.0950
100 6.8751 0.7634 -12.1131 1.0272 -11.8663 2.6800
150 6.7074 0.5698 -12.6572 0.6884 -12.4681 2.3640
200 6.5490 0.3870 -13.2675 0.4342 -13.1524 2.1147
250 6.3814 0.1935 -14.1616 0.2040 -14.1087 1.9120
300 6.2789 0.0752 -15.2893 0.0768 -15.2586 1.7450
350 6.2416 0.0322 -16.3048 0.0326 -16.2925 1.6051
400 6.2323 0.0214 -16.8678 0.0216 -16.8585 1.4850
450 6.223 0.0107 -17.7043 0.0108 -17.6950 1.3831
Table 4.7 Evaluation of Kinetic parameters of Zn0.25 Cu0.5 Mn0.25 Fe2O4.
W0 = 6.8220 mg
Temp
oc residual wt.(mg)
α = Wt - Wf W0 - Wf ln α /T2 gα ln gα /T2 1000/T
50 6.6447 0.7329 -11.1250 0.9664 -10.8485 3.0950
100 6.6083 0.6781 -11.6074 0.8654 -11.3635 2.6800
150 6.5583 0.6028 -12.0614 0.7396 -11.8569 2.3640
200 6.4355 0.4179 -13.1907 0.4742 -13.0643 2.1147
250 6.3536 0.2945 -13.7416 0.3202 -13.6579 1.9120
300 6.2763 0.1781 -14.4271 0.1870 -14.3784 1.7450
350 6.2490 0.1370 -14.8568 0.1422 -14.8196 1.6051
400 6.2308 0.1096 -15.2344 0.1128 -15.2056 1.4850
450 6.2172 0.0891 -15.5848 0.0912 -15.5615 1.3831
500 6.2081 0.0754 -15.8855 0.0770 -15.8645 1.2936
550 6.1899 0.0480 -16.4624 0.0486 -16.4500 1.2150
600 6.1671 0.0137 -17.8342 0.0138 -17.8269 1.1454

Chapter IV : The System Zn0.25CuxMn0.75-xFe2O4
75
Table 4.8 Evaluation of Kinetic parameters of Zn0.25 Cu0.75Fe2O4.
W0 = 8.8370
Temp oc residual wt.(mg)
α = Wt - Wf W0 - Wf ln α /T2 gα ln gα /T2 1000/T
50 8.7347 0.7658 -11.8220 1.0322 -11.5236 3.0950
100 8.6557 0.5854 -12.3786 0.7124 -11.9522 2.6800
150 8.6045 0.4684 -12.8531 0.5418 -12.4026 2.3640
200 8.5719 0.3940 -13.2495 0.4432 -13.1319 2.1147
250 8.5487 0.3400 -13.5950 0.6820 -13.2518 1.9120
300 8.4929 0.2135 -14.2458 0.2264 -14.1872 1.7450
350 8.4510 0.1178 -15.0078 0.1216 -14.9761 1.6051
400 8.4278 0.0648 -15.7599 0.0680 -15.7415 1.4850
450 8.4138 0.03289 -16.5814 0.0324 -16.5964 1.3831
500 8.4020 0.0059 -18.4282 0.0060 -18.4165 1.2936
550 8.4000 0.0013 -20.0188 0.0014 -19.9971 1.2150
Table 4.9 Kinetic Parameters for precursors of
Zn0.25CuxMn0.75-xFe2O4system by TGA/DSC
Composition
(x) Method Step
Activation energy(∆E)
KJ/mol
0.0 Coat-Redfern I 38.29
II 127.57
0.5 Coat-Redfern I 46.12
II 94.70
0.75 Coat-Redfern I 30.30
II 245.27

Chapter IV : The System Zn0.25CuxMn0.75-xFe2O4
76
Fig.4.3. TGA-DSC Spectrum for Zn0.25 Cu0.5 Mn0.25 Fe2O4.
1.2 1.4 1.6 1.8 2.0 2.2 2.4 2.6 2.8 3.0 3.2
-18
-17
-16
-15
-14
-13
-12
-11
Zn0.25
Mn0.75
Fe2O
4
ln g
αα αα/T
2
1000/T
Fig.4.2 Coats and Redfern method.Graph of ln[g(α)/T2] Vs 1000/T for
Zn0.25Mn0.75Fe2O4
Chapter IV : The System Zn0.25CuxMn0.75-xFe2O4
77
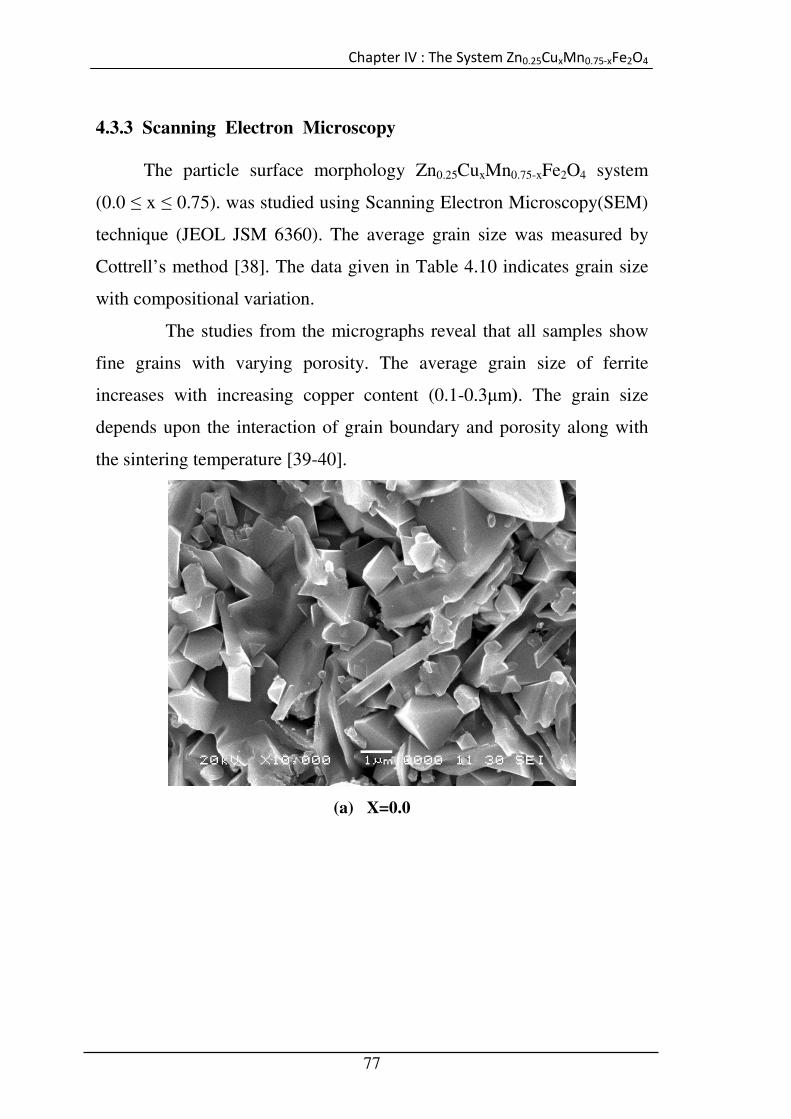
4.3.3 Scanning Electron Microscopy
The particle surface morphology Zn0.25CuxMn0.75-xFe2O4 system
(0.0 ≤ x ≤ 0.75). was studied using Scanning Electron Microscopy(SEM)
technique (JEOL JSM 6360). The average grain size was measured by
Cottrell’s method [38]. The data given in Table 4.10 indicates grain size
with compositional variation.
The studies from the micrographs reveal that all samples show
fine grains with varying porosity. The average grain size of ferrite
increases with increasing copper content (0.1-0.3µm). The grain size
depends upon the interaction of grain boundary and porosity along with
the sintering temperature [39-40].
(a) X=0.0

Chapter IV : The System Zn0.25CuxMn0.75-xFe2O4
78
(b) x=0.25
(c) x =0.5 Fig. 4.4 Scanning electron micrographs Zn0.25CuxMn0.75- xFe2O4System ( 0 ≤ x ≤ 0.75).

Chapter IV : The System Zn0.25CuxMn0.75-xFe2O4
79
Table 4.10 Grain Size from SEM of the Zn0.25CuxMn0.75- xFe2O4 system (0≤ x ≤0.75).
Composition Grain Size (µm)
Zn0.25 Mn0.75Fe2O4 0.1 Zn0.25 Cu0.5 Mn0.25 Fe2O4 0.2
Zn0.25 Cu07.5 Fe2O4 0.3 4.3.4. Fourier transfer Infra-red spectroscopy
The system Zn0.25CuxMn0.75-x Fe2O4 was characterized by the IR
spectra in the region 400 to 1000 cm-1 as shown in the Fig. 4.5. The
spectrum provides a clear indication of the spinel ferrite phase. Two
metal- oxygen bands observed around 600 cm−1
and 400 cm−1
are usually
assigned to vibration of ions in the crystal lattice [41]. All the samples
show two prominent absorption bands. The high frequency band υ1 is in
the range 534-644 cm-1and the lower frequency band υ2 is in the range
396-463 cm-1. The high frequency band is due to the vibration of the
tetrahedral M---O bond and the low frequency band is due to the
vibration of the octahedral M---O bond.

Chapter IV : The System Zn0.25CuxMn0.75-xFe2O4
80
(a) X=0.0
(b) x=0.25

Chapter IV : The System Zn0.25CuxMn0.75-xFe2O4
81
(c) x =0.5
(d) x =07.5
Fig.4.5 Infrared spectra for Zn0.25CuxMn0.75-xFe2O4 System(0 ≤ x ≤ 0.75)
Chapter IV : The System Zn0.25CuxMn0.75-xFe2O4
82
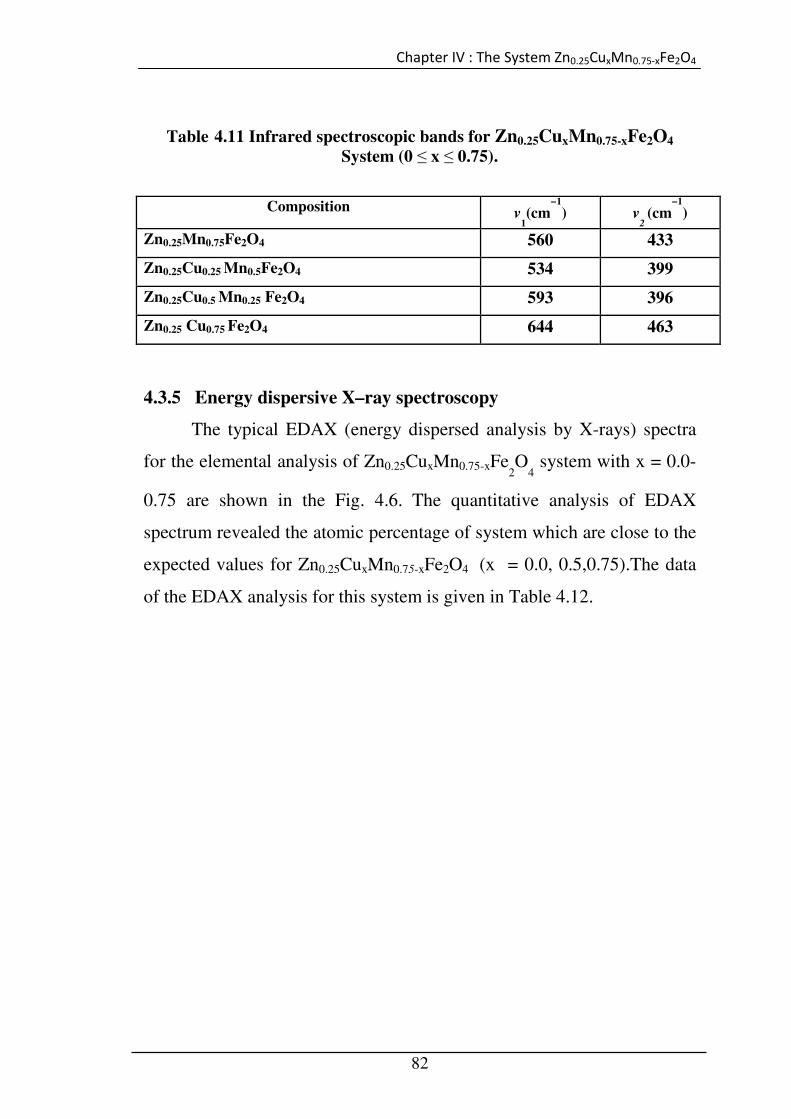
Table 4.11 Infrared spectroscopic bands for Zn0.25CuxMn0.75-xFe2O4 System (0 ≤ x ≤ 0.75).
Composition v
1(cm
−1) v
2 (cm
−1)
Zn0.25Mn0.75Fe2O4 560 433
Zn0.25Cu0.25 Mn0.5Fe2O4 534 399
Zn0.25Cu0.5 Mn0.25 Fe2O4 593 396
Zn0.25 Cu0.75 Fe2O4 644 463
4.3.5 Energy dispersive X–ray spectroscopy
The typical EDAX (energy dispersed analysis by X-rays) spectra
for the elemental analysis of Zn0.25CuxMn0.75-xFe2O
4 system with x = 0.0-
0.75 are shown in the Fig. 4.6. The quantitative analysis of EDAX
spectrum revealed the atomic percentage of system which are close to the
expected values for Zn0.25CuxMn0.75-xFe2O4 (x = 0.0, 0.5,0.75).The data
of the EDAX analysis for this system is given in Table 4.12.

Chapter IV : The System Zn0.25CuxMn0.75-xFe2O4
83
(a) X=0.0
(b) x =0.5

Chapter IV : The System Zn0.25CuxMn0.75-xFe2O4
84
( c ) x = 0.75
Fig. 4.6 Energy Dispersive Spectra of Zn0.25CuxMn0.75-xFe2O4System (0≤ x ≤0.75).
Table 4.12 Atomic percentage value for the Zn0.25CuxMn0.75-x Fe2O4
system by EDAX analysis.
Zn Atomic %
Mn Atomic %
Cu Atomic %
Fe Atomic %
Composition
x Theo. Obs. Theo. Obs . Theo. Obs. Theo. Obs.
0.00 9.56 10.36 24.34 26.18 --- ---- 65.99 63.46
0.50 9.41 8.82 7.91 6.76 18.30 17.33 64.35 64.64
0.75 9.30 9.10 ----- ----- 27.12 25.61 63.57 65.29

Chapter IV : The System Zn0.25CuxMn0.75-xFe2O4
85
4.3.6 Electrical Resistivity
The temperature variation of dc resistivity for all the compositions
of Zn0.25CuxMn0.75-xFe2O
4 system with x = 0.0- 0.75 is shown in Fig.4.7.
The d.c. resistivity of all the samples was measured in the temperature
range 100 to 500 oC which varied between 102–10
8 Ω-cm. The resistivity
of ferrite materials decreases with increase in temperature, indicating
the semi-conducting nature of all samples[42]. The extent of decrease in
resistivity up to the temperature of about 150oC is very slow. The
measurement of resistivity indicates linear relationship with the
temperature. The electrical conductivity has been related to the hopping
of electrons between Fe2+ and Fe3+ [43-44]. The conduction mechanism in
ferrite is quite different from semiconducrors. In ferrites the temperature
dependence of mobility affects the conductivity and carrier concentration
is almost affected by temperature variation.
Electrical properties of ferrites are affected by distribution of
cations in the sites. Also by non-magnetic and magnetic substitutions, by
amount of Fe2+present,sintering conditions, grain size and grain gowth
effect. At higher temperature the oxidation state of the Fe and Mn
ions fluctuates. The electron hopping energy between Mn3+ ↔ Mn2+ is
larger than that between Fe3+↔ Fe2+. During the oxidation of Fe and Mn,
more electrons are released and large electron hopping is expected.
Hence the resistivity decreases with increase in temperature [45-48.]. In
the present case, it is also observed that as the content of Cu
increases, resistivity decreases. This decrease in resistivity is
expected because at higher temperature probability of higher
oxidation state of metal ions and hence increasing the possibility of
electron hopping.
The activation energy of electrical conduction was found to
decrease with increasing Cu ion content which is shown in Table 4.13.

Chapter IV : The System Zn0.25CuxMn0.75-xFe2O4
86
Fig.4.7 .Variation of electrical resistively with temperature for Zn0.25CuxMn0.75-x Fe2O4System( 0 ≤ x ≤ 0.75).
Table 4.13 Activation energy (∆E) , Band gap values for the system
Zn0.25CuxMn0.75-x Fe2O4
Sr.No. Composition
Activation energy
(∆E) eV Band gap eV
1 Zn0.25Mn0.75Fe2O4 0.5484 1.096
2 Zn0.25Cu0.25 Mn0.5Fe2O4 0.6904 1.380
3 Zn0.25Cu0.5 Mn0.25 Fe2O4 0.5052 1.010
4 Zn0.25 Cu0.75 Fe2O4 0.4925 0.985

Chapter IV : The System Zn0.25CuxMn0.75-xFe2O4
87
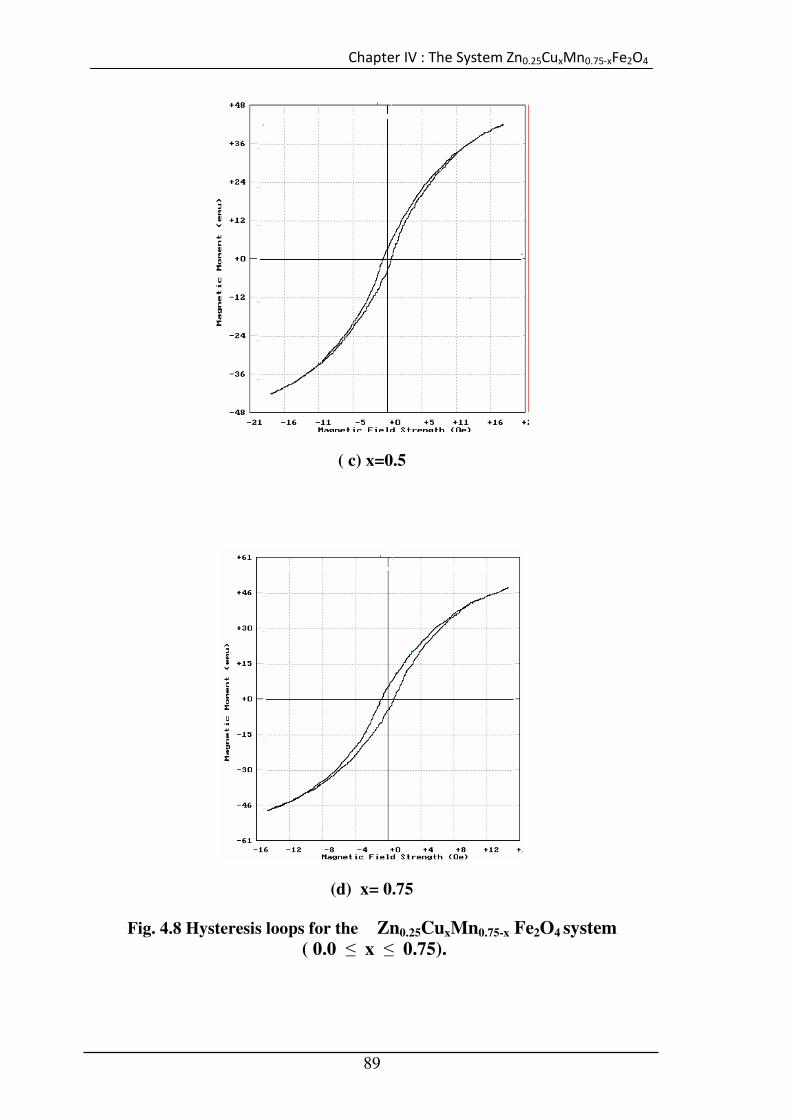
4.3.7 Magnetic Hysteresis
The hysteresis studies of system was carried out using a magenta
B-H loop tracer. The hysteresis loops of Zn0.25CuxMn0.75-x Fe2O4 system
with x = 0.0- 0.75 are shown in Fig.4.8. The variation of magnetic
moment (µB), saturation magnetization (Ms), remanent magnetization
(Mr) and coersive field (Hc) is given in Table 4.14 The variation of the
saturation magnetization (Ms) depends on the cation distribution in a
spinal lattice as well as particle size of the sample. The resultant
magnetization is thus the difference between magnetization of octahedral
lattice (B) and that of the total tetrahedral lattice (A).From the hysteresis
loops, increasing trend in saturation magnetization (Ms) (Fig.4.8) and
increasing values of coercivity (Hc) are observed with substitution of
Cu2+ ions. The increasing trend in saturation magnetization with
decreasing concentration of manganese is due to the A--O--B interactions
in ferrites [49]. The ions such as Zn2+ and Mn2+ occupy A sites while
Cu2+, Fe3+ ions occupy B sites respectively. There is possibility of A-B
interaction between Mn2+ – Fe3+ in which spins of A site and B site
cancel each other. A resultant saturation magnetization due to Cu2+ions of
the B site. Hence, in the present system, as content of Cu increases,
the saturation magnetization increases.
The experimental magnetic moment is calculated by the following
relation [50].
µB = Mw x Ms /5585 --------------------
4.7
Where, Mw = Molecular weight of composition (in grams)
Ms =Saturation magnetization (in Oe) and
5585 = Magnetic factor.

Chapter IV : The System Zn0.25CuxMn0.75-xFe2O4
88
( a) x = 0.0
(b) x = 0.25
Chapter IV : The System Zn0.25CuxMn0.75-xFe2O4
89
( c) x=0.5
(d) x= 0.75
Fig. 4.8 Hysteresis loops for the Zn0.25CuxMn0.75-x Fe2O4 system ( 0.0 ≤ x ≤ 0.75).

Chapter IV : The System Zn0.25CuxMn0.75-xFe2O4
90
Table 4. 14 Magnetic data for the Zn0.25CuxMn0.75-x Fe2O4 system (0 ≤ x ≤ 0.75).
Sample Ms (emu/gm)
Hc (Oe) Mr (emu/gm)
Magnetic Moment
(nB )
Zn0.25Mn0.75Fe2O4 10.27 56.82 4.47 0.4289
Zn0.25Cu0.25 Mn0.5Fe2O4 30.38 68.18 2.10 1.2804
Zn0.25Cu0.5 Mn0.25 Fe2O4 41.88 84.42 3.40 1.7813
Zn0.25 Cu0.75 Fe2O4 47.81 76.30 5.11 2.0519
4.3.8 Gas sensing property
Presently the atmospheric pollution has become a global issue.
Gases from auto and industrial exhausts are polluting the environment.
The sensors are required basically for measurement of physical quantities
and for monitoring working environments. Liquified petroleum gas
(LPG) is used in almost every kitchen all over the world. It is therefore,
referred as a town gas or cooking gas. Along with inevitable domestic
use, it is utilized in large extent for industrial purposes and in laboratories
as fuel. Cooking gas consists chiefly of n- butane , which is a colourless
and odourless gas. It is usually mixed with compounds of sulphur (viz.
methyl mercaptan and ethyl mercaptan) having foul smell, so that its
leakage can be noticed easily. This gas is potentially hazardous because
explosion accidents might be caused when it leaks out by mistake. It has
been reported that, at the concentration up to noticeable leakage, it is very
much more than the lower explosive limit (LEL) of the gas in air.
Explosion accidents destroyed many industries, laboratories, kitchens and
houses, buildings, societies . Therefore, all industries should have an
alarm system detecting and warning for dangerous exhaust gas

Chapter IV : The System Zn0.25CuxMn0.75-xFe2O4
91
concentration levels. Depending on the gas and its concentration in the
atmosphere, the electrical conductivity is different.
Semiconducting oxides are widely used as inexpensive and
robust sensors for toxic, hazardous and combustible gases and vapors in
safety and automotive applications. Few semiconducting oxide materials
used in these applications are ZnO, SnO2, Fe2O3, Cr2O3, etc [51-61]. The
gas sensing is a surface phenomenon of gas–solid interaction, where the
conductivity of semi conducting oxides can be altered by adsorption of
gases from ambient. Different spinel ferrites such as NiFe2O4, CdFe2O4,
ZnFe2O4 and CuFe2O4 have been studied for various gas-sensing
applications.
The relative response of a sensor to a target gas can be defined
as the ratio of the change in conductance of a sample before and after
exposure of target gas to the conductance in air. The gas response can be
defined as:
%S =(Ra/Rg)100 ---------4.8
where Ga = conductance in air and Gg = conductance in a target gas.
Specificity or selectivity of the sensor can be defined as the ability of
a sensor to respond to a certain gas in the presence of different gases.
Response time (RST) is defined as the time required for a sensor to attain
the 90% increase in the maximum conductance after exposure of the
sensor surface to a test gas, while recovery time (RCT) is the time taken
by the sensor to decrease the conductance up to 90% of the maximum
conductance [62] in air.
The gas response (%S) against various gases for the
Zn0.25CuxMn0.75-xFe2O
4System (0≤ x ≤0.75) is shown in Fig. 4.9 a to d.
The graph 4.9 a shows that this material is highly selective towards H2S
as compared with the other test gases like Ammonia, H2,
Ethanol,CO2,Cl2 and LPG. While figure 4.9 b, c, d shows that this
Chapter IV : The System Zn0.25CuxMn0.75-xFe2O4
92
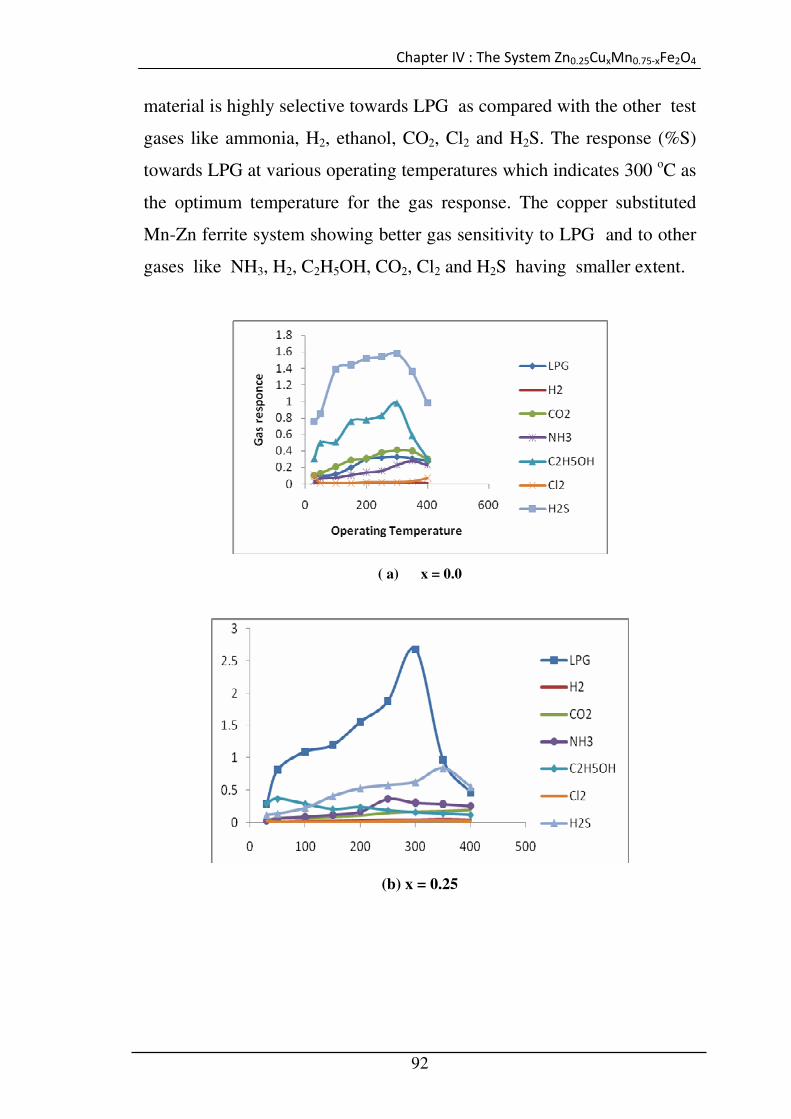
material is highly selective towards LPG as compared with the other test
gases like ammonia, H2, ethanol, CO2, Cl2 and H2S. The response (%S)
towards LPG at various operating temperatures which indicates 300 oC as
the optimum temperature for the gas response. The copper substituted
Mn-Zn ferrite system showing better gas sensitivity to LPG and to other
gases like NH3, H2, C2H5OH, CO2, Cl2 and H2S having smaller extent.
( a) x = 0.0
(b) x = 0.25

Chapter IV : The System Zn0.25CuxMn0.75-xFe2O4
93
( c) x = 0.5
(d) x = 0.75
Fig.4.9 Sensitivity of Zn0.25CuxMn0.75-x Fe2O4System (0.0 ≤ x ≤ 0.75)
4
towards different test gases at different temperature In all type of gas sensing mechanism, oxygen gets adsorbed on the
surface of the sensor at desired operating temperature and electron is
transferred from conduction band to adsorbed oxygen atom resulting in
the formation of ionic species such as O2- or 2O-. The reaction kinetics
may be explained by following reactions,
O2 (gas) O2 (ads) ------------- 4.9
O2 (gas) + e – O2 -(ads) ------------- 4.10
O2 (ads) + e – 2O - (ads) ------------- 4.11

Chapter IV : The System Zn0.25CuxMn0.75-xFe2O4
94
The electron transfer from the conduction band to the chemisorbed
oxygen results in decrease in electron conduction of the sensor. As a
consequence, an increase in resistance of the sensor is observed.
The present system gave maximum sensitivity towards LPG.
During the testing the LPG dissociates very slowly into the reactive
reducing components like CH4, C3H8, C4H10, etc on the surface of the
sensor [63-72]. In these substrates, reducing hydrogen species are bound
to the carbon atom. When the nanosized lithium ferrite is exposed to the
reducing gases like LPG, it reacts with chemisorbed oxygen thereby
releasing an electron back to conduction bands which decreases the
resistance of the sensor. The overall reaction mechanism of LPG can be
explained as follow,
CnH2n+2 + O- (ads) H2O + CnH2n-O + e - ----------- 4.12 where CnH2n+2 represents CH4, C3H8, and C4H10
Sensitivity of the material towards a gas is due to physical
adsorption of the gas on the surface of the sensor. During this study it is
seen that the response of sensor is increased with increase in temperature
and after optimum temperature it decreases randomly. Because
adsorption increases with temperature but saturates at a particular
temperature attaining maximum response towards the gas. But at still
higher temperature, desorption of the gas predominates over the
adsorption and hence adsorption decreases showing decreased sensitivity
of the sensor.
4.3.9 Photocatalysis
Removal of potentially toxic and dangerous compounds from the
environment has generated a great interest in the last decade. The textile
dyes and dye intermediates with high aromaticity and low
biodegradability have emerged as major environmental pollutants and
Chapter IV : The System Zn0.25CuxMn0.75-xFe2O4
95
nearly 10-15% of the dye is lost in the dyeing process and is released in
the wastewater which is an important source of environmental
contamination. Photocatalysis is applied in many areas including the
elimination of contaminants from water and air, odor control, bacterial
inactivation.[73-76]. The photocatalytic degradation of organic molecules
is of great importance in water treatment. In most cases, dyes are studied
as model compounds for large organic molecules. However, ferrites are
also effective in the degradation of many other potential organic
contaminants.
Congored is a well known organic dye and is considered as a
model of a series of common azo-dyes, used in the industry. The
performance of Cu-substituted Mn-Zn ferrite nanoparticles for the
photocatalytic degradation of Congo-red for different hours is presented
in Fig. 4.10.
The catalytic activity of the Zn0.25CuxMn0.75-xFe2O4 system
(0.0 ≤ x ≤ 0.75) was studied by photodegradation rate of congored. The
experiment of photocatalytic reaction was conducted in a 100-ml Pyrex
glass vessel with magnetic stirring and a UV lamp (8 W) with the main
wavelength of 253.7 nm, which was positioned over the glass beaker. The
as-prepared Cu-substituted Mn-Zn ferrite was used as photocatalyst
during the activity. The catalytic activity of the system studied with
respect to time parameter.
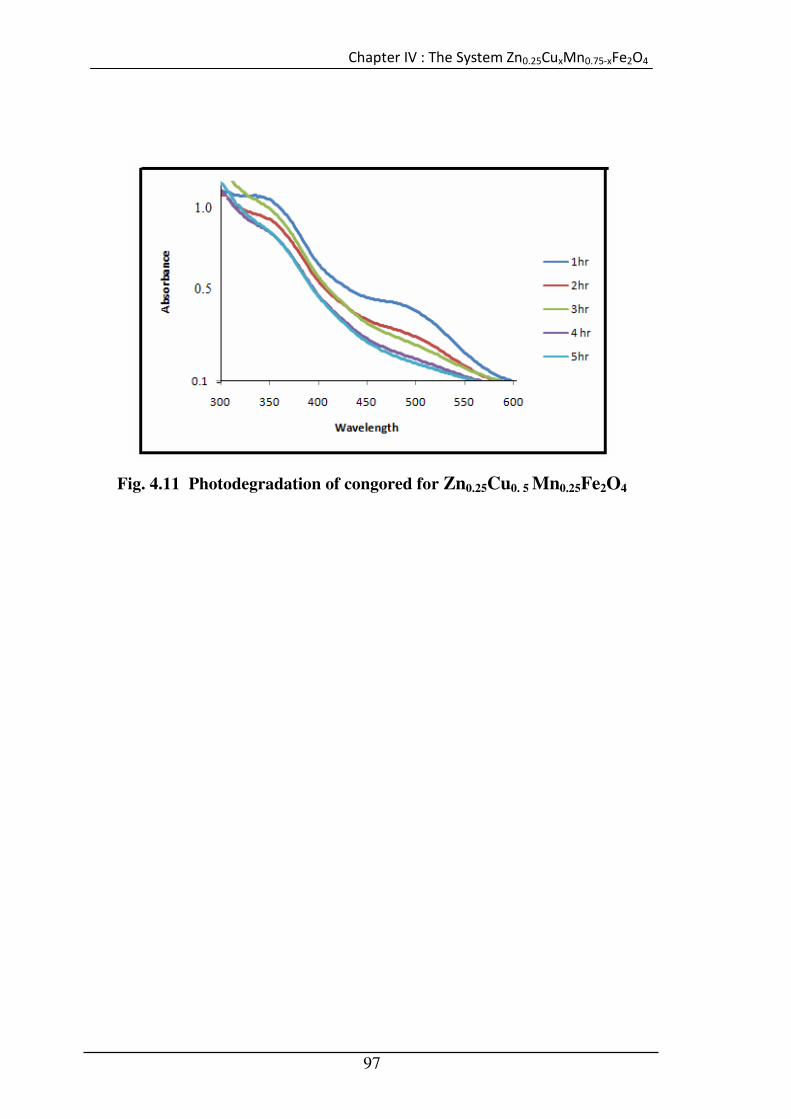
In the present system it is observed that the degradation of dye
starts within first hour in presence of catalyst. Further exposer to U.V
light, increases photodegradation rate of congo-red dye with time period.
The composition Zn0.25Cu0.5Mn0.25Fe2O4 shows better catalytic activity
for the decoposition of congored. After 5 hours exposure of light,
79.22%degradation of congored observed in presence of Zn0.25Cu0.5
Mn0.25Fe2O4 sample. Fig. 4.11 shows photodegradation of dye in presence

Chapter IV : The System Zn0.25CuxMn0.75-xFe2O4
96
of Zn0.25Cu0.5 Mn0.25Fe2O4 sample.Kinetic study of photodegradation of
congored dye reported in Table 4.15.
Table 4.15 Mean rate constant(K min -1), % degradation of
congored dye.
Composition Mean rate constant of 1hr,2hr,3hr,4hr,5hr
K min -1
% degradation of Congored dye after 5
hr. irradiation
Zn0.25Mn0.75Fe2O4 6.3295 × 10⁻³ 66.70%
Zn0.25Cu0.25 Mn0.5Fe2O4 6.1218 × 10⁻³ 67.44%
Zn0.25Cu0.5 Mn0.25 Fe2O4 7.2697 × 10⁻³ 79.22%
Zn0.25 Cu0.75 Fe2O4 5.2972× 10⁻³ 68.08%
Without catalyst 1.3505× 10⁻³ 39.04%
Fig.4.10 Photocatalytic study for Zn0.25CuxMn0.75-x Fe2O4 system
Chapter IV : The System Zn0.25CuxMn0.75-xFe2O4
97
Fig. 4.11 Photodegradation of congored for Zn0.25Cu0. 5 Mn0.25Fe2O4

Chapter IV : The System Zn0.25CuxMn0.75-xFe2O4
98
4.4 Conclusions 1. Copper substituted Mn-Zn ferrites were synthesized by co-
precipitation method. The crystal structure studied by X-ray
diffraction method. The system shows cubic phase.
2. From thermal analysis (TGA-DTA) various thermokinetic
parameters were calculated.
3. Two strong absorption bands for tetrahedral and octahedral
stretching were observed at 600 cm-1 and around 400 cm-1
respectively.
4. Scanning electron micrographs indicated increase in grain size with
increase in Cu content in system.
5. Elemental analysis of system studied by Energy dispersive X–ray
spectroscopy. The quantitative analysis of EDAX spectrum
revealed the atomic percentage of system which are close to the
expected values for Zn0.25CuxMn0.75-xFe2O4 (x = 0.0, 0.5, 0.75).
6. The saturation magnetization and Coercivity showed increasing
trend with increase in Cu content in system.
7. Cu-substituted Mn-Zn ferrite shows semiconducting behaviour.
The DC conductivity increases with increase in temperature for all
the samples.
8. Various gases were tested for gas sensing activity of all the
compositions of Cu-substituted Mn-Zn. All the samples shows
remarkable response towards LPG with good selectivity.
9. The photocatalytic activity of Zn0.25CuxMn0.75-xFe2O4 was studied
in presence of U.V. light. The composition Zn0.25Cu0. 5 Mn0.25Fe2O4
shows better catalytic performance for degradation of congored
dye.

Chapter IV : The System Zn0.25CuxMn0.75-xFe2O4
99
References [1] M. L. S. Teo, L. B. Kong, Z. W. Li, G. Q. Lin, Y. B. Gan, J. Alloys
Comp., 459 (2007) 557.
[2] N. Okasha, J. Mater. Sci., 43 (2008) 4192.
[3] M. Banergee, N. Verma, R. Prasad, J. Mater. Sci., 42 (2007) 1833.
[4] M. R. Barati, J. Sol-Gel Sci. Tech., 52 (2009) 171.
[5] E. Melagiriyappa, H. S. Jayanna, J. Alloys Comp., 482 (2009) 147.
[6] T. Mathew, B. S. Rao, C. S. Gopinath, J. Catalysis, 210 (2002)
405.
[7] M. Han, C. R. Vestal, Z. John Zhang J. Phys. Chem. B ., 108 (2004)
583.
[8] A. J. Fatiadi, Synthesis, 133 (1976).
[9] G. Cainelli, G. Cardillo, Chromium Oxidation in Organic Chem.
Springer Verlag, Berlin (1984).
[10] J. I. Kroschwitz, Forth Ed. Kirk Othmer, Encyclopedia of Tech.,
Vol.4, Wiley Interscience Publications. NewYork (1992).
[11] J. Muzart, Bull. Soc. Chim. Fr., 65(1986).
[12] H. Van Bekkum, In: F. W. Lichtenthaler (Ed.), Carbohydrates as
Org. Raw Mater, VCH. Weinheim (1991).
[13] S. Xu, W. Shangguan, J. Yuan, J. Shi, M. Chen, Science and
Technology of Advanced Materials. 8 (2007) 40.
[14] J. Huo, M. Wei, Mater. Lett., 63 (2009) 1183.
[15] W. Cook, M. Manley, J. Solid State Chem., 183 (2010) 322.
[16] X. N. Jiang, Z. W. Lan, Z. Yu, P. Y. Liu, D. Z. Chen, C. Y. Liu J.
Magn. Magn. Mater., 321 (2009) 52.
[17] V. Berbenni, A. Marini, P. Matteazzi, R. Ricceri, N. J. Welham J.
Acknowledg. Eur. Ceram. Soc., 23 (2002) 527.
[18] S. D. Figueiro, J. C. Goes, R. A. Moreira, A. S. B. Sombra
Carbohydr. Polym., 56 (2004) 313.

Chapter IV : The System Zn0.25CuxMn0.75-xFe2O4
100
[19] P. P. Hankare, V. T. Vader, N. M. Patil, S. D. Jadhav, U. B.
Sankpal, M. R. Kadam, B. K. Chougule, N. S. Gajbhiye, Mater.
Chem. Phys., 113 (2009) 233.
[20] P. P. Hankare, V. T. Vader, L.V. Gavali, R. Sasikala, I. S. Mulla,
Solid State Sci., 11 (2009) 2075.
[21] P.P. Hankare, S. D. Jadhav, U. B. Sankpal, S. S. Chavan, K. J.
Waghmare, B. K. Chougule, J. Alloys Compd., 475 (2009) 926.
[22] P. P. Hankare, P. D. Kamble, M. R. Kadam, K. S. Rane, P. N.
Vasambekar, Mater. Lett., 61 (2007) 2769.
[23] P. P. Hankare, R. P. Patil, U. B. Sankpal, S. D. Jadhav, P. D.
Lokhande, K. M. Jadhav, R. Sasikala, J. Solid State Chem., 182
(2009) 3217.
[24] P. P. Hankare, R. P. Patil, U. B. Sankpal, S. D.Jadhav, I. S. Mulla,
K. M. Jadhav, B. K. Chougule, J. Magn. Magn. Mater., 321 (2009)
3270.
[25] P. P. Hankare, R. P. Patil, U. B. Sankpal, K. M. Garadkar, R.
Sasikala, A. K. Tripathi, J. Magn. Magn. Mater., 322 (2010) 2629.
[26] P. P. Hankare, U. B. Sankpal, R. P. Patil, R. Sasikala, I. S. Mulla,
A. K. Tripathi, K. M. Garadkar, J. Alloys Compd., 496 (2010) 256.
[27] S. Komarneni, Current Science, 85 (2003) 1730.
[28] M. Srivastava, S. Chaubey, A.K. Ojha, Mater. Chem. Phys., 118
(2009) 174.
[29] X. Yan, J. Chen, Y. Qi, J. Cheng, Z. Meng, J. Europ. Ceram. Soc.,
30 (2010) 265.
[30] L. J. Zhao, Q. Jiang, Mater. Lett., 64 (2010) 677.
[31] A. Chaudhuri, S. Mitra, M. Mandal, K. Mandal, J. Alloys Compd.,
491 (2010) 703.

Chapter IV : The System Zn0.25CuxMn0.75-xFe2O4
101
[32] N. H. Vasoya, L. H. Vanpariya, P. N. Sakariya, M. D. Timbadiya,
T. K. Pathak, V. K. Lakhani, K. B. Modi, Ceram. Int., 36 (2010)
947.
[33] C. N. Chinnasamy, A. Narayanasam, N. Ponpandian, K.
Chattopadhyay, H. Guérault, J. M. Greneche, Scripta Materialia, 44
(2001) 1407.
[34] I. Z. Rahman, T. T. Ahmed, J. Magn. Magn. Mater., 290–291
(2005) 1576.
[35] Liufang Yang, Yongan Xie, Heyun Zhao, Xinghui Wu, Yude
Wang, Solid-State Electronics, 49 (2005) 1029.
[36] Jun Xiang, Yanqiu Chu, Xiangqian Shen, Guangzhen Zhou, Yintao
Guo, Journal of Colloid and Interface Science, 376 (2012) 57.
[37] M. A. Gabal, Reda M. El-Shishtawy,Y.M.Al Angari, J. Magn.
Magn. Mater., 324 (2012) 2258.
[38] A. H. Cottrell, “An Introduction to Metallurgy” Edward Arnold
Publishers Ltd. London (1967) 172.
[39] K. K. Patankar, V. L. Mathe, R. N. Patil, B. K. Chougale, Mater.
Chem. Phys., 96 (2006) 197.
[40] S. D. Sartale, G. B. Bagde, C. D. Lokande, M. Giersig, Applied
Surface Science, 182 (2001) 366.
[41] R. D. Waldron, Phy. Rev., 99 (1955) 1727.
[42] B. Vishwanathan, V. R. K. Murthy, Ferrites Materials; Science and
Technology.
[43] H. Bottger, V. V. Bryksin, Hopping Conduction in Solids,
Akademie-Verlag, Berlin, 1985.
[44] R. R. Heikes, W. D. Johnston, J. Chem. Phys., 26 (1957) 582.
[45] A. E. J. W. Verwey, P. B. Brann, E. W. Gorter, F. C. Romeijn, J.
H. Van Santen, Z. Physik. Chem.,198 (1951) 6.

Chapter IV : The System Zn0.25CuxMn0.75-xFe2O4
102
[46] B. T. Kolomiets, I. T. Sheft, V. Kurlina, Soviet. Phys. Tech. Phys.,
(1957) 40.
[47] A. P. B. Sinha, N. R. Sanjana, A. B. Biswas, Acta Cryst.,10 (1957)
439.
[48] S. Baliga, A. I. Jain, Materials Letter, 9 (1990) 180.
[49] Yen-Pei Fu, Chin-Shang Hsu, Solid State Comm., 134 (2005) 201.
[50] Jan Smit, Magnetic Properties of Materials, Intra-University
Electronics series, 13 (1971) 89.
[51] T. Seiyama, A. Kato, K. Fujiishi, M. Nagatani , Anal. Chem., 34,
(1962) 1502.
[52] P. T. Moseley, Sens Actuators B, 6 (1992) 149.
[53] T. Seiyama, F. Era, Zairyo-Kagaku Jpn, 8 (1971) 232.
[54] S. Pizzini, N. Butta, D. Narducci, M. Palladino, J. Electrochem.
Soc., 136 (1989)1945.
[55] M. S. Wagh, G. H. Jain, D. R. Patil, S. A. Patil, L. A. Patil , Sens.
Actuators B, 115 (2006)128.
[56] Y. Shimiza, S. Kusarao, H. Kuwayama, K. Tanaka, M. Egasira J. Amer.
Ceram. Soc., 73 (1990) 818.
[57] D. R. Patil, L. A. Patil,, Sensors and Transducers, 70( 2006) 661.
[58] D. R. Patil, L. A. Patil, G. H. Jain, M. S. Wagh, S. A. Patil, Sensors
and Transducers, 74 (2006) 874.
[59] D. R. Patil, L. A. Patil, IEEE., 7(2007) 434.
[60] D. R. Patil, L. A. Patil, Sens. Actuators B, 120 (2006) 316.
[61] D. R. Patil, L. A. Patil, Sens. Actuators B, 123 (2007) 546.
[62] D. R. Patil, L. A. Patil, Talanta, 77 (2009) 1409.
[63] L. Neel, C. R. Acad. Sci., 230 (1950) 375.
[64] Y. Yafet, C. Kittel, Phys. Rev., 90 (1992) 29.
[65] J. C. Maxwell, Electricity and Magnetism, Vol. 1, Oxford Univ.
Press, 328.

Chapter IV : The System Zn0.25CuxMn0.75-xFe2O4
103
[66] K. W. Wagner, Ann. Phys.(Laipzing) 40 (1913) 817.
[67] C. G. Koops, Phys. Rev. 83 (1951) 127.
[68] P. V. Reddy, Ph.D. Thesis, Osmania Univ., Hyderabad India 1981.
[69] V. R. K. Murthy, T. Sobhanary, Phys. Status Solidi A, 23 (1972)
133.
[70] Y. C. Venudhar, K. Satya Mohan, Mater. Lett., 54 (2002) 135.
[71] A. M. Shaikh, S. S. Bellad, B. K. Chougle, J. Magn. Magn.
Mater.,136 (1999) 384.
[72] K. Iwauchi, Jpn. J. Appl. Phys.,10 (1972)1520.
[73] S. Chen, W. Zhao, W. Liu, H. Zhang, X. Yu, Chem. Eng. J.
(Amsterdam, Neth.) 155 (2009) 466.
[74] S. Chen, W. Zhao, W. Liu, H. Zhang, X. Yu, Y. Chen, J. Hazard.
Mater., 172 (2009) 1415.
[75] M. R. Hoffmann, S. T. Martin, W. Choi, D. W. Bahnemann,.
Chem. Rev., 9525 (1995) 69.
[76] P. K. Dutta, S. O. Pehkonen, V. K. Sharma, A. K. Ray, Environ.
Sci. Technol., 39 (2005) 1827.


![ตัวเร่งปฏิกิริยาออกไซด์ NiCr และ NiAl … · in catalytic liquid-phase oxidations [9]. It was spinel (Cu 0.5 Ni 0.5 Cr 2O4) catalyzed](https://static.fdocuments.net/doc/165x107/5ed29ac7ed9b4164fd5fb12c/aaaaaaaaaaaaaaaaaaaaaaaoe-nicr-aaa.jpg)


![CV -LUCIA PARDOcee.uy/extras/CV-Pardo.pdf · 3\o0224kk02'-]']-\_4'\oyrk4'\ql2\o02r0k'n'-]0'2\3'3\'l\2o4]0o'n'42m0]rl0.r4]\o'0o4.r030o'n-\'.4ql02y\]'\oy0' _ror^]e' #\f\2\].r05'$]me'u.4e'*]32mo'%0k0]\e')\ke'ujab](https://static.fdocuments.net/doc/165x107/5f78e37941ea6718100f2a8b/cv-lucia-3o0224kk02-4oyrk4ql2o02r0kn-0233l2o40on42m0rl0r4o0o4r030on-4ql02yoy0.jpg)

![Coordinate cis-[Cr(C2O4)(pm)(OH2)2]+ Cation as Molecular Biosensor of ...mdpi.org/sensors/papers/s8084487.pdf · ... [Cr(C 2O4)(pm)(OH 2)2] + Cation as Molecular Biosensor of Pyruvate’s](https://static.fdocuments.net/doc/165x107/5acace567f8b9aa1298defa8/coordinate-cis-crc2o4pmoh22-cation-as-molecular-biosensor-of-mdpiorgsensorspapers.jpg)

