NMG Consulting & boobook - Investment Platforms Market Study … · 2020-01-16 · NMG Consulting &...
91
NMG Consulting & boobook - Investment Platforms Market Study Consumer Research Page 1
Transcript of NMG Consulting & boobook - Investment Platforms Market Study … · 2020-01-16 · NMG Consulting &...
NMG Consulting & boobook - Investment Platforms Market Study Consumer Research Page 1
NMG Consulting & boobook - Investment Platforms Market Study Consumer Research Page 2
Authors & Acknowledgements
This document reports the findings of a research project carried out for the Financial Conduct Authority (FCA) between October 2017 – April 2018 by NMG Consulting and boobook.
Lucie Lewis-Green and Leslie Sopp from the FCA managed the project. NMG Consulting in conjunction with boobook authored this report. For more information, please contact:
Jane Craig James Hawes NMG Consulting boobook 18th Floor, Tower 42 Work.Life Bermondsey 25 Old Broad Street 5 Tanner Street London EC2N 1HQ London SE1 3LE 020 7631 3087 020 7342 886 511
www.nmg-group.com www.boobook.world
The research findings represent the views of over 3000 customers of UK investment platforms who took part in the research, and we would like to thank them for their time in providing invaluable insight for this study. The interpretation of the findings and additional observations are NMG’s and boobook’s, based on the research findings and our knowledge of this market. Any errors in the report are the responsibility of NMG Consulting and boobook.
NMG Consulting & boobook - Investment Platforms Market Study Consumer Research Page 3
Contents
1 Glossary and List of Figures ........................................................................................................ 5
2 Executive Summary ................................................................................................................... 8
3 Background ............................................................................................................................. 11
3.1 Regulatory context to the research ........................................................................................... 11
3.2 Business objectives of the research ........................................................................................... 11
3.3 Influences on the research findings ........................................................................................... 11
4 Research Objectives and Methodology ..................................................................................... 13
4.1 Research objectives ................................................................................................................... 13
4.2 Methodology overview .............................................................................................................. 13
4.3 Reporting conventions ............................................................................................................... 17
5 Profile of Platform Users .......................................................................................................... 18
5.1 Demographic and attitudinal characteristics ............................................................................. 18
5.2 Segmentation of the market ...................................................................................................... 20
5.3 Product and platform choices .................................................................................................... 20
5.4 Use of advised versus non-advised platform investing ............................................................. 22
5.5 Motivations and goals of respondents ...................................................................................... 24
5.6 Segment profiles ........................................................................................................................ 24
6 Choosing Platforms .................................................................................................................. 32
6.1 Understanding of platforms ....................................................................................................... 32
6.2 Perceived benefits and limitations of platforms ........................................................................ 33
6.3 Reasons for multi-homing .......................................................................................................... 35
6.4 How respondents choose their platforms ................................................................................. 36
6.5 Research and shopping around ................................................................................................. 38
6.6 Other channels and products considered .................................................................................. 40
6.7 Factors that influence choice of platform .................................................................................. 40
7 Choosing Investment Products on Platforms ............................................................................ 44
7.1 Roles and Responsibilities .......................................................................................................... 44
7.2 Research and shopping around by non-advised respondents ................................................... 45
7.3 Platform versus third party sources of information .................................................................. 46
7.4 Preferred investment solutions ................................................................................................. 47
8 How Consumers Use Platforms ................................................................................................ 52
8.1 Activities undertaken on platforms ........................................................................................... 52
8.2 Ease and frequency of use ......................................................................................................... 55
8.3 The role of platform based tools ............................................................................................... 55
8.4 Contributions and withdrawals .................................................................................................. 56
8.5 Comparison of current experience vs what was important when choosing platform .............. 57
9 Platform Charges ..................................................................................................................... 59
9.1 Awareness and understanding of charges ................................................................................. 59
9.2 Importance of charges when choosing a platform .................................................................... 61
9.3 Importance of charges when using a platform .......................................................................... 62
9.4 Satisfaction with charges ........................................................................................................... 64
9.5 Value for money ......................................................................................................................... 65
10 Switching Behaviour ................................................................................................................ 67

NMG Consulting & boobook - Investment Platforms Market Study Consumer Research Page 4
10.1 Extent and type of switching...................................................................................................... 67
10.2 Reasons for switching ................................................................................................................ 68
10.3 Issues with and barriers to switching ......................................................................................... 70
10.4 Other switching behaviours ....................................................................................................... 72
11 Satisfaction with Investment Platforms .................................................................................... 73
11.1 Satisfaction with platform experience ....................................................................................... 73
11.2 Satisfaction by type of activity ................................................................................................... 76
11.3 What would consumers change? ............................................................................................... 78
Appendix A – Segmentation of the market ...................................................................................... 79
Appendix B – The choice based conjoint (CBC) exercise .................................................................... 84
NMG Consulting & boobook - Investment Platforms Market Study Consumer Research Page 5
1 Glossary and List of Figures
Glossary
Advice Where consumers have received a ‘personal recommendation’. Shorthand for regulated financial advice, whether independent or restricted
Advised respondents
Research participants who stated they received advice from a regulated financial adviser when selecting the platform within the scope of the research
Adviser A qualified, professional financial adviser who provides regulated advice to consumers including both Independent Financial Advisers and Restricted Advisers
Adviser charging / advice fees
The charge for advice services agreed in advance with the client and paid for by the client
Channel The routes of platform distribution to consumers; refers to either advised or non-advised in this study
Consumers The potential audience who use / may use platforms. Used when discussing insights, implications and conclusions that may apply to the broader market
Filtered list of funds The shortlist of funds offered by platforms. Includes lists of ‘most popular’ funds, ‘best buy’ or ‘featured fund’ lists
Investment products
The range of investments (funds, shares, investment trusts…) in which consumers can invest. Also referred to in the report as ‘investments’
Investment charges All charges related to investments, not including advice or platform charges
Model portfolios Ready-made fund portfolios available via platforms in which consumers can invest
Multi-channel Respondents who stated they selected and set up some of their platforms with advice and some without advice
Multi-homing /multi-homer
Where a respondent has investment products via two or more platforms
Non-advised investing
The act of investing without taking regulated financial advice
Non-advised respondents
Research participants who stated they selected their sample platform without receiving advice from a regulated financial adviser
Platform Online investment platform
Platform charges
Any fees charged by a platform for using its services. Includes annual administration fees, trading or dealing fees, and product wrapper charges, if applicable, both one-off and on-going.
Product wrapper A tax efficient vehicle for holding investments, e.g. SIPP, ISA
Respondents The individuals who took part in this research. Used when research findings are being described
NMG Consulting & boobook - Investment Platforms Market Study Consumer Research Page 6
Sample platform
The specific platform which the respondent was primarily asked about in the research. (Note that the sampling process selected customers at random from each platform’s records. For customers selected, the sample platform will not necessarily be their most important or most recent platform)
Switchers
Respondents who have, in the past three years and on a non-advised basis, moved investments from one platform to another, started using an additional platform or withdrawn investments from a platform either to then invest elsewhere off-platform or decide to have an adviser invest elsewhere on their behalf. Note that this relates to switching platform rather than underlying funds or shares
Traditional channels of investing
Non-platform, offline channels of investing such as branch, phone or post
List of Figures
1. Research design overview 2. Sample structure phase 1 qualitative 3. Quantitative sample after weighting for channel and amount held on platform 4. Sample structure phase 3 qualitative 5. Key characteristics of the quantitative sample 6. Attitudinal characteristics (measured on a scale from 0 to 10) 7. Segmentation framework 8. Products held on sample platform 9. Multi-homing 10. Characteristics of multi-homers 11. Use of financial advice for wider investment needs 12. Main reasons for using a platform 13. Reasons for using two or more platforms 14. Research undertaken when choosing the platform 15. Reasons research was not undertaken when choosing the platform 16. Research and comparison information used before choosing platform (those who compared
multiple platforms) 17. Options for investing considered at the time the platform was chosen 18. Actual drivers of selection – stated factors which were important at the time the platform was
chosen 19. Hypothetical drivers of selection – derived via conjoint analysis 20. Importance of brand and charges in hypothetical platform decisions by consumer segment –
derived via conjoint analysis 21. Importance of range of investment options by consumer segment – derived via conjoint analysis 22. Research undertaken when choosing investment products on platform 23. Usage of platform provided information when choosing investment products on platform 24. Choosing investments 25. Characteristics by fund selection approach (non-advised only) 26. Activities undertaken by non-advised respondents at least once a year 27. How non-advised respondents trade on their platforms 28. Activities undertaken by advised respondents in past 12 months 29. Activity frequency for non-advised respondents 30. Usage of platform provided information when monitoring investments/ making investment choices

NMG Consulting & boobook - Investment Platforms Market Study Consumer Research Page 7
31. Non-advised contributions and withdrawals 32. Advised contributions and withdrawals 33. Important factors in platform selection vs importance in current usage of platform 34. Awareness and estimation of charges 35. Charge types believed to apply at the time the platform was chosen 36. Researching charges during platform selection process 37. Important factors based on way platform is currently used 38. How often non-advised respondents are checking the charges they have paid 39. Satisfaction with charges – non-advised respondents 40. Satisfaction with charges – advised respondents 41. Switching activity undertaken without an adviser in the last 3 years 42. Reasons for switching from one platform to another (or adding additional platforms) 43. Potential prompts to switch platform 44. Ease of switching (those who have undertaken any kind of switching activity) 45. Actual barriers to switching experienced 46. Perceived barriers to switching and reasons switching has not been considered 47. Satisfaction with the factors which are important to non-advised respondents 48. Satisfaction with the factors which are important to advised respondents 49. Advocacy and Net Promoter Score 50. Satisfaction with the activities undertaken by non-advised respondents 51. Satisfaction with activities undertaken by advised respondents
NMG Consulting & boobook - Investment Platforms Market Study Consumer Research Page 8
2 Executive Summary
This chapter provides an overview of key findings from the consumer research undertaken for the Investment Platforms Market Study. It is based on the views of over 3000 customers of platforms that represent around 90% of the UK platform market based on assets under administration.1 The research considers both advised2 and non-advised3 respondents’ views of platforms4 and this summary describes key learnings across:
1. The profile of platform respondents and how different groups engage with their platforms 2. The factors that influence how respondents choose their platforms and what is most important in
driving platform choices 3. The usage of and involvement with platforms on an on-going basis 4. Satisfaction with platforms against the features that matter the most to respondents
1. Profile of platform respondents
There are distinct groups of platform users, differentiated by their engagement with and behaviours on platform. There is a spectrum of investment knowledge, confidence and experience that impacts engagement with and usage of platforms. The involvement of a financial adviser also has a marked impact on platform interaction. Non-advised respondents are likely to be more engaged and active, although a sub-group is less experienced and less confident in their choices. The majority of advised respondents prefer to delegate key decisions along the platform journey to their adviser; engagement with the platform both at set-up and ongoing can be very low for this group.
Multiple platform relationships are prevalent. Over a third of respondents have two or more platform arrangements, sometimes but not always used for different needs. 14% of respondents use both advised and non-advised platforms. It is far more common for respondents to invest new money on a new platform than transfer money from one platform to another, driven by numerous factors but in particular perceived risk diversification across platforms (confusion exists around levels of FSCS protection and the custodial role of platforms).
2. Choosing platforms
Many respondents are not actively comparing or choosing between platforms. When choosing their sample platform, fewer than half (44%) of non-advised researched multiple platforms; 18% looked at just one platform and 16% were moved on to their platform by their provider and didn’t actively choose. Less engaged non-advised respondents use shortcuts in their decision making and may not actively compare, relying more on recommendations and platform brand and marketing to make their decisions. Research and shopping around is undertaken mostly by the more engaged non-advised segments who like to use third party sources in preference to platform-based information to make informed decisions and compare choices. Advised respondents delegate the platform choice to advisers they trust, although over half state they had some involvement in the decision.
For those choosing their platform, priorities vary for different sub-groups. Breadth of investments and charges are most commonly stated as factors of importance by non-advised respondents when they chose their platforms (each chosen by 39% of non-advised respondents). Breadth of investments and
1 This has been calculated based on information provided by firms to the FCA as part of the Investment Platform Market Study. 2 Research participants who stated they received advice from a regulated financial adviser when selecting the platform within the scope of the research. 3 Research participants who stated they selected their sample platform without receiving advice from a regulated financial adviser. 4 Respondents were primarily asked about their sample platform, that is, the platform that was identified as being used by
them from the sample data supplied. This may not have been their most important or most recent platform arrangement.
NMG Consulting & boobook - Investment Platforms Market Study Consumer Research Page 9
tools to enable the viewing / managing of their investments are considered most important by advised respondents (where they were involved in choosing their platform) – each chosen by 33%. Analysis suggests brand is a potentially understated factor of influence, particularly for less experienced respondents when choosing their platform, and that charges are a potentially overstated factor of influence, particularly for non-advised respondents. In the conjoint exercise5 to determine relative importance of platform features, both brand and charges each represented approximately one quarter of the selection decision for respondents.
3. Usage of platforms
Access to a wide choice of investments is a key driver when choosing platforms and it remains the most important ongoing factor for non-advised respondents, highlighting this is a key benefit for respondents in using platforms. Activities around choosing investments can be in-depth and extensive. 72% of non-advised respondents are undertaking research and actively choosing their investments and fund picking is prevalent, with 61% stating they create their own portfolio of funds/shares. Advised respondents are rarely choosing their own investments.
Ongoing engagement with platforms is largely centred on checking the value and performance of invested assets; this is the key on-going need for both advised and non-advised respondents. Non-advised respondents can be highly active – 42% check the value and/or performance weekly or more often in order to stay informed and in control of their investments. Advised respondents are less active and reliance on advisers is high.
Self-directed switching rates are low and platform relationships appear hard to disturb. 10% of respondents have switched platforms (transferring most or all of their assets from one platform to another) in the last three years on a self-directed basis i.e. with no adviser involvement. Switching activity without adviser involvement appears low because respondents are largely content with their current arrangements. However, there are some barriers to switching, both actual and perceived, and these centre on the time involved, complexity of process and exit fees. A small proportion (around 7%) of respondents have tried but failed to switch platforms in the past three years. Switching activity is correlated to engagement and it is the most engaged non-advised segments that are most likely to switch or consider it; the key driver for those that have switched is to access lower charges.
Understanding of platform charges is highly variable. One third of respondents overall (33%) say charges were important when choosing their platform, 20% can estimate what they have paid in platform charges in the last year and 19% don’t know if they are paying platform charges. A further 10% don’t believe they are paying platform charges. The qualitative research indicates some issues around visibility of charges for a minority of respondents.
4. Satisfaction with platforms
Satisfaction with platforms is high. Respondents are largely satisfied with the elements of their platform that are most important to them in the ongoing usage of their platform. Non-advised respondents describe numerous benefits to using platforms including greater control, access and convenience compared to investing via traditional channels. Breadth of investment choice receives the highest rating overall, with 91% satisfaction amongst respondents that cited it in their top three most important ongoing factors. Charges, selected in the top three most important ongoing factors by 31% of non-advised respondents, has the lowest satisfaction rating at 59%, although respondents are more likely to feel neutral rather than actively dissatisfied (14% of non-advised that selected this feature are
5 Conjoint is a survey technique in which respondents are asked to evaluate several hypothetical, in this case platform, options and choose their preferred one. This task is repeated several times, with responses indicating which platform features specifically drive choices.

NMG Consulting & boobook - Investment Platforms Market Study Consumer Research Page 10
dissatisfied). Advised respondents cite high levels of satisfaction on key activities for them (for example, being able to view valuations and performance) despite their lower engagement levels.
The majority of respondents are satisfied with the activities that they have experience of undertaking on their platform, although activity levels can be low beyond checking values and performance.
There are other influences on satisfaction levels. The qualitative research indicates that respondent satisfaction is also influenced by the experience of investment returns (which have been positive in recent years) and the quality of adviser relationships experienced. Respondents can find it hard to untangle positive perceptions relating to these experiences from their overall perceptions of investing via platforms. Levels of satisfaction around charges also need to be considered in light of the levels of understanding of charges; higher levels of understanding could impact the results, positively or negatively.
Although still largely satisfied, it is the most active and engaged respondents that are likely to say they are dissatisfied with one or more factor relating to their ongoing platform experience. Overall 12% of the sample said they were dissatisfied with one or more factor or activity on their platform; these are individuals with experience across multiple platforms, with higher wealth levels and who are non-advised.
Most respondents believe they are getting value for money from their platforms. When probed in the qualitative research, respondents state they are happy to pay a price for the services received from their platform; they believe the total cost of investing via platforms is less than or no more than what they would pay via traditional channels, and that the additional benefits associated with platform-based investing (holistic view, greater control and access, reporting, support) contribute to a positive cost / benefit assessment.
NMG Consulting & boobook - Investment Platforms Market Study Consumer Research Page 11
3 Background
3.1 Regulatory context to the research
Online investment platforms have transformed the retail investment landscape in recent years and are often now central to how investments are managed for both financial advisers and consumers. The platform market has grown steadily in recent years, and while intermediated platforms comprise a larger market share, direct-to-consumer platforms are increasing in scale, breadth and importance for consumers.
In July 2017, the FCA launched the Investment Platforms Market Study (IPMS) to assess whether competition between investment platforms is working well for consumers. The FCA commissioned primary consumer research to inform their analysis of one of the six topics within the study – ‘customer preferences and behaviour’.
3.2 Business objectives of the research
The primary purpose of the consumer research is to help the FCA assess whether consumers can make good choices in the platform market and whether there is effective competition between platforms. The FCA wants to understand the extent to which consumers are shopping around and choosing platforms that reflect their preferences and provide value for money. The specific purpose of the consumer research is to learn about:
• The profile of consumers who invest through platforms
• How consumers choose platforms and assess value for money of services, both initially and on an ongoing basis
• The role of platforms in informing consumer investment product choices
To help answer these questions NMG Consulting designed a programme of primary consumer research, working with over 3000 customers of platforms that represent around 90% of the UK platform market based on assets under administration.6
The consumer research is not intended to provide conclusive answers to all issues and will be considered alongside other pieces of analysis, such as desk-based research and analysis of firm data that the FCA is undertaking as part of the study.
3.3 Influences on the research findings
There are some factors to highlight that readers should take in to account when considering the consumer views heard in the research.
1. 2017 was a positive year for many investors. The FTSE 100 grew by 7.6% during the year and ended at 7,687, an all-time high7. Any market research investigating consumer sentiment around investing and satisfaction with choices being made needs to be viewed in light of largely positive investment returns. For example, the favourable perceptions respondents have of their platform choices and ongoing experiences are influenced in part by their positive investment returns.
2. The advisory channel is a significant contributor to assets held on platform. 42% of platform customers selected from the sampling process for this study were flagged as advised. Any study looking at consumer choices made by advised consumers needs to take account of the influence
6 This is based on information provided by firms to the FCA as part of the Investment Platform Market Study. 7 Reuters, 29th December 2017.

NMG Consulting & boobook - Investment Platforms Market Study Consumer Research Page 12
that intermediaries have on decisions made, and the extent that consumers can and want to shape their own choices when they are using an adviser.
3. The profile of the sample is influenced both by a) the profile of the customer bases of the investment platforms in scope of this survey including the larger and most mature platforms; b) the profile of consumers that responded to the invitation to participate. Quotas were applied by platform brand (to ensure no provider was over-represented). Beyond this no further quotas were applied to ensure the target number of responses could be achieved in the time available. It is likely that those most interested in the topic would be those that decided to respond to the survey. Therefore, there may be an over-representation of more engaged customers in the results.
NMG Consulting & boobook - Investment Platforms Market Study Consumer Research Page 13
4 Research Objectives and Methodology
4.1 Research objectives
Element 1: Understanding what type of consumers use investment platforms
The research aims to deliver a detailed description of the different types of consumer that use platforms to ensure the demand side of the market is fully understood in terms of its needs, attitudes, demographics and behaviours. This information is intended to be used for:
• Providing an overall description of users of online investment platforms
• Understanding whether different types of consumers respond to the research questions differently
Element 2: Choosing and using a platform
A central premise of the market study is that for consumers to be able to drive effective competition they need to be provided with or be able to access the key information necessary to allow them to choose between competing platforms. They also need to be able to act on this information, including by switching between platforms where required. The topics below will help the FCA assess whether consumers are able to make effective choices:
• Assessing own needs when choosing and using platforms. Are behavioural biases leading consumers to misjudge their needs?
• Accessing information about the platform and products available on the platform. Is appropriate information about products readily available to consumers, either directly from the platforms, or indirectly through various tools?
• Assessing platform and product information. Are consumers able to compare products and services, and assess their relative value for money?
• Taking action. Are consumers able to take action that is suitable for their needs? Are there specific barriers on the demand side that prevent effective consumer engagement with platforms?
Element 3: Choosing investment products on a platform
The consumer research aims to provide the FCA with insights on:
• Whether/how consumers use the tools and information provided by platforms, including how much weight consumers put on recommendations made by platform vs. other sources of information. How do consumers decide on their investments and what information do they consider?
• Whether platforms’ tools and investment solutions are meeting investors’ expectations in terms of their function and the value they offer.
4.2 Methodology overview
A three-phase, qualitative and quantitative approach was used for this study.
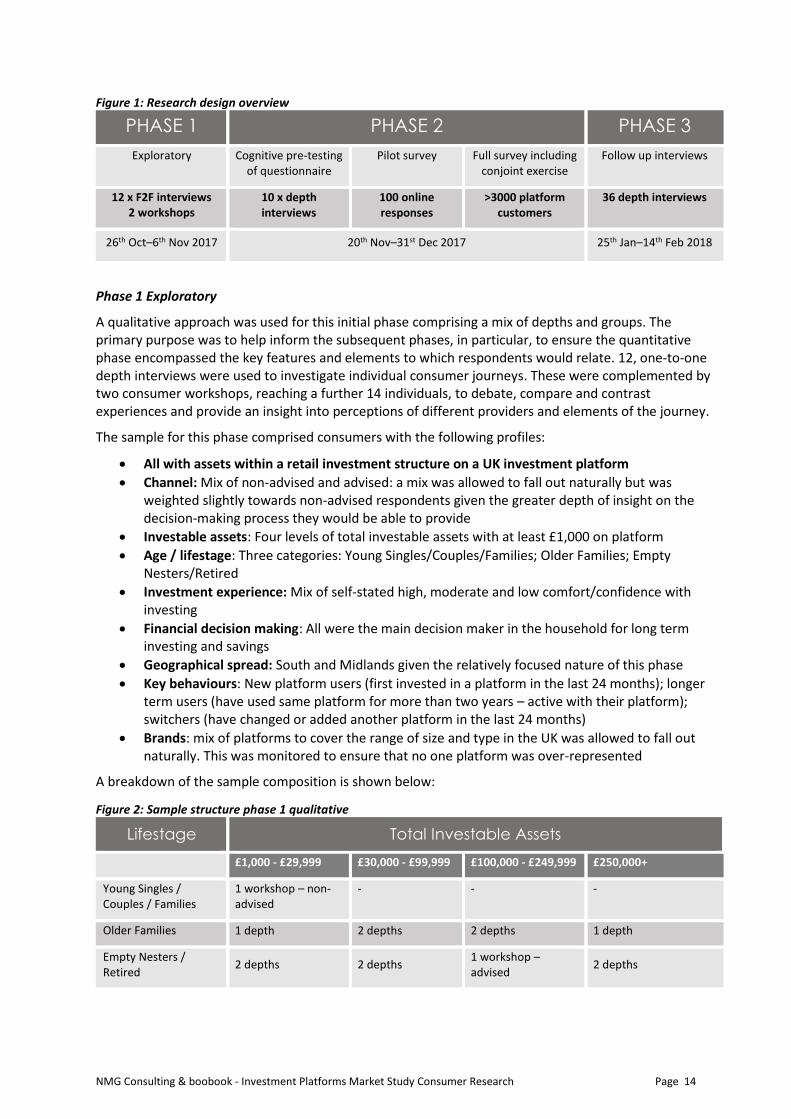
Figure 1 gives a summary overview of the composition of each of the three research phases and further details are shown below. Readers that are interested in further details of the methodology are directed to the supporting Technical Report that accompanies this report.
NMG Consulting & boobook - Investment Platforms Market Study Consumer Research Page 14
Figure 1: Research design overview
PHASE 1 PHASE 2 PHASE 3
Exploratory Cognitive pre-testing of questionnaire
Pilot survey Full survey including conjoint exercise
Follow up interviews
12 x F2F interviews 2 workshops
10 x depth interviews
100 online responses
>3000 platform customers
36 depth interviews
26th Oct–6th Nov 2017 20th Nov–31st Dec 2017 25th Jan–14th Feb 2018
Phase 1 Exploratory
A qualitative approach was used for this initial phase comprising a mix of depths and groups. The primary purpose was to help inform the subsequent phases, in particular, to ensure the quantitative phase encompassed the key features and elements to which respondents would relate. 12, one-to-one depth interviews were used to investigate individual consumer journeys. These were complemented by two consumer workshops, reaching a further 14 individuals, to debate, compare and contrast experiences and provide an insight into perceptions of different providers and elements of the journey.
The sample for this phase comprised consumers with the following profiles:
• All with assets within a retail investment structure on a UK investment platform
• Channel: Mix of non-advised and advised: a mix was allowed to fall out naturally but was weighted slightly towards non-advised respondents given the greater depth of insight on the decision-making process they would be able to provide
• Investable assets: Four levels of total investable assets with at least £1,000 on platform
• Age / lifestage: Three categories: Young Singles/Couples/Families; Older Families; Empty Nesters/Retired
• Investment experience: Mix of self-stated high, moderate and low comfort/confidence with investing
• Financial decision making: All were the main decision maker in the household for long term investing and savings
• Geographical spread: South and Midlands given the relatively focused nature of this phase
• Key behaviours: New platform users (first invested in a platform in the last 24 months); longer term users (have used same platform for more than two years – active with their platform); switchers (have changed or added another platform in the last 24 months)
• Brands: mix of platforms to cover the range of size and type in the UK was allowed to fall out naturally. This was monitored to ensure that no one platform was over-represented
A breakdown of the sample composition is shown below:
Figure 2: Sample structure phase 1 qualitative
Lifestage Total Investable Assets
£1,000 - £29,999 £30,000 - £99,999 £100,000 - £249,999 £250,000+
Young Singles / Couples / Families
1 workshop – non-advised
- - -
Older Families 1 depth 2 depths 2 depths 1 depth
Empty Nesters / Retired
2 depths 2 depths 1 workshop – advised
2 depths
NMG Consulting & boobook - Investment Platforms Market Study Consumer Research Page 15
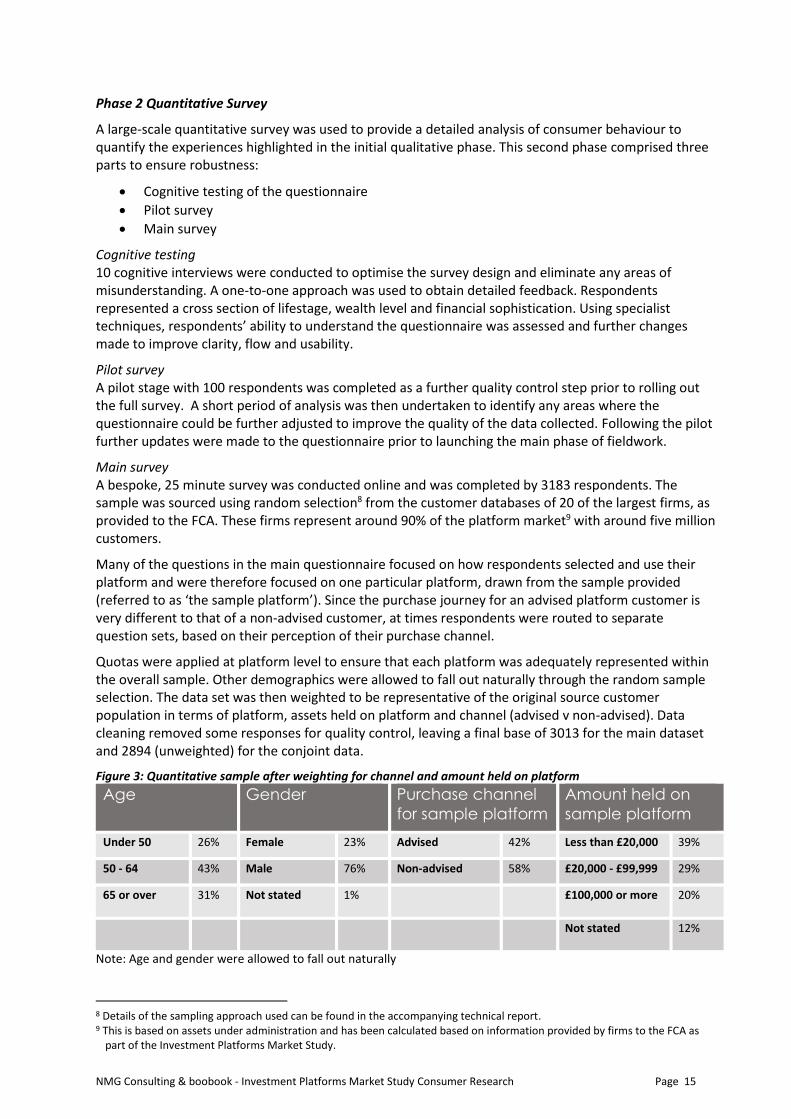
Phase 2 Quantitative Survey
A large-scale quantitative survey was used to provide a detailed analysis of consumer behaviour to quantify the experiences highlighted in the initial qualitative phase. This second phase comprised three parts to ensure robustness:
• Cognitive testing of the questionnaire
• Pilot survey
• Main survey
Cognitive testing 10 cognitive interviews were conducted to optimise the survey design and eliminate any areas of misunderstanding. A one-to-one approach was used to obtain detailed feedback. Respondents represented a cross section of lifestage, wealth level and financial sophistication. Using specialist techniques, respondents’ ability to understand the questionnaire was assessed and further changes made to improve clarity, flow and usability.
Pilot survey A pilot stage with 100 respondents was completed as a further quality control step prior to rolling out the full survey. A short period of analysis was then undertaken to identify any areas where the questionnaire could be further adjusted to improve the quality of the data collected. Following the pilot further updates were made to the questionnaire prior to launching the main phase of fieldwork.
Main survey A bespoke, 25 minute survey was conducted online and was completed by 3183 respondents. The sample was sourced using random selection8 from the customer databases of 20 of the largest firms, as provided to the FCA. These firms represent around 90% of the platform market9 with around five million customers.
Many of the questions in the main questionnaire focused on how respondents selected and use their platform and were therefore focused on one particular platform, drawn from the sample provided (referred to as ‘the sample platform’). Since the purchase journey for an advised platform customer is very different to that of a non-advised customer, at times respondents were routed to separate question sets, based on their perception of their purchase channel.
Quotas were applied at platform level to ensure that each platform was adequately represented within the overall sample. Other demographics were allowed to fall out naturally through the random sample selection. The data set was then weighted to be representative of the original source customer population in terms of platform, assets held on platform and channel (advised v non-advised). Data cleaning removed some responses for quality control, leaving a final base of 3013 for the main dataset and 2894 (unweighted) for the conjoint data.
Figure 3: Quantitative sample after weighting for channel and amount held on platform
Age Gender Purchase channel
for sample platform
Amount held on
sample platform
Under 50 26% Female 23% Advised 42% Less than £20,000 39%
50 - 64 43% Male 76% Non-advised 58% £20,000 - £99,999 29%
65 or over 31% Not stated 1% £100,000 or more 20%
Not stated 12%
Note: Age and gender were allowed to fall out naturally
8 Details of the sampling approach used can be found in the accompanying technical report. 9 This is based on assets under administration and has been calculated based on information provided by firms to the FCA as
part of the Investment Platforms Market Study.
NMG Consulting & boobook - Investment Platforms Market Study Consumer Research Page 16
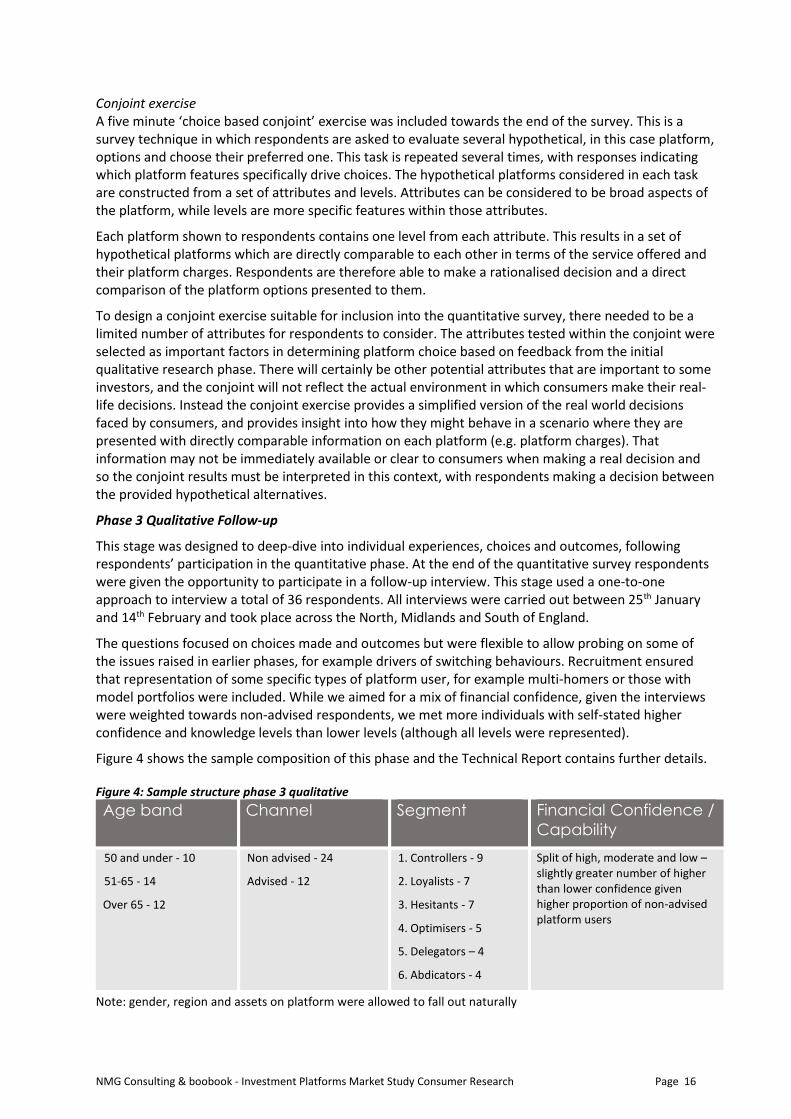
Conjoint exercise A five minute ‘choice based conjoint’ exercise was included towards the end of the survey. This is a survey technique in which respondents are asked to evaluate several hypothetical, in this case platform, options and choose their preferred one. This task is repeated several times, with responses indicating which platform features specifically drive choices. The hypothetical platforms considered in each task are constructed from a set of attributes and levels. Attributes can be considered to be broad aspects of the platform, while levels are more specific features within those attributes.
Each platform shown to respondents contains one level from each attribute. This results in a set of hypothetical platforms which are directly comparable to each other in terms of the service offered and their platform charges. Respondents are therefore able to make a rationalised decision and a direct comparison of the platform options presented to them.
To design a conjoint exercise suitable for inclusion into the quantitative survey, there needed to be a limited number of attributes for respondents to consider. The attributes tested within the conjoint were selected as important factors in determining platform choice based on feedback from the initial qualitative research phase. There will certainly be other potential attributes that are important to some investors, and the conjoint will not reflect the actual environment in which consumers make their real-life decisions. Instead the conjoint exercise provides a simplified version of the real world decisions faced by consumers, and provides insight into how they might behave in a scenario where they are presented with directly comparable information on each platform (e.g. platform charges). That information may not be immediately available or clear to consumers when making a real decision and so the conjoint results must be interpreted in this context, with respondents making a decision between the provided hypothetical alternatives.
Phase 3 Qualitative Follow-up
This stage was designed to deep-dive into individual experiences, choices and outcomes, following respondents’ participation in the quantitative phase. At the end of the quantitative survey respondents were given the opportunity to participate in a follow-up interview. This stage used a one-to-one approach to interview a total of 36 respondents. All interviews were carried out between 25th January and 14th February and took place across the North, Midlands and South of England.
The questions focused on choices made and outcomes but were flexible to allow probing on some of the issues raised in earlier phases, for example drivers of switching behaviours. Recruitment ensured that representation of some specific types of platform user, for example multi-homers or those with model portfolios were included. While we aimed for a mix of financial confidence, given the interviews were weighted towards non-advised respondents, we met more individuals with self-stated higher confidence and knowledge levels than lower levels (although all levels were represented).
Figure 4 shows the sample composition of this phase and the Technical Report contains further details. Figure 4: Sample structure phase 3 qualitative
Age band Channel Segment Financial Confidence /
Capability
50 and under - 10
51-65 - 14
Over 65 - 12
Non advised - 24
Advised - 12
1. Controllers - 9
2. Loyalists - 7
3. Hesitants - 7
4. Optimisers - 5
5. Delegators – 4
6. Abdicators - 4
Split of high, moderate and low – slightly greater number of higher than lower confidence given higher proportion of non-advised platform users
Note: gender, region and assets on platform were allowed to fall out naturally

NMG Consulting & boobook - Investment Platforms Market Study Consumer Research Page 17
4.3 Reporting conventions
Use of qualitative and quantitative data
The report findings are led by the quantitative data, supported by qualitative findings which add further depth and context. Not all quantitative findings were covered within the qualitative work and vice versa. On rare occasions, the qualitative data may challenge the quantitative findings and NMG’s interpretation of the findings is presented in these instances.
Focus on advised and non-advised channels
The majority of findings are presented by advised and non-advised respondents with segment differences highlighted in the commentary where relevant. We have chosen to focus on channel as the primary differentiator given the platform journey is very different between these two groups and at times in the research, different questions were asked of each group.
Quantitative data
All data and base sizes quoted in this report are weighted (unless otherwise stated); low base sizes have been highlighted and results with an unweighted base under 50 have not been included.
Verbatim comments
These are respondent quotations, based on interview recordings with only minor editing. They are labelled by channel and segment. The quotations demonstrate respondents’ own views and may not always be factually correct.
Case studies
More detail has been given about the views and circumstances of some respondents to illustrate the segments with some real-life examples. Names and images of individuals have been changed to preserve their anonymity.
NMG Consulting & boobook - Investment Platforms Market Study Consumer Research Page 18
5 Profile of Platform Users
This chapter seeks to understand the profile of consumers that use the platforms in the scope of this study. Profiling information is provided at overall level and by channel. A segmentation model has been developed to provide a framework to understand the motivations, attitudes and behaviours of different types of platform user.
5.1 Demographic and attitudinal characteristics
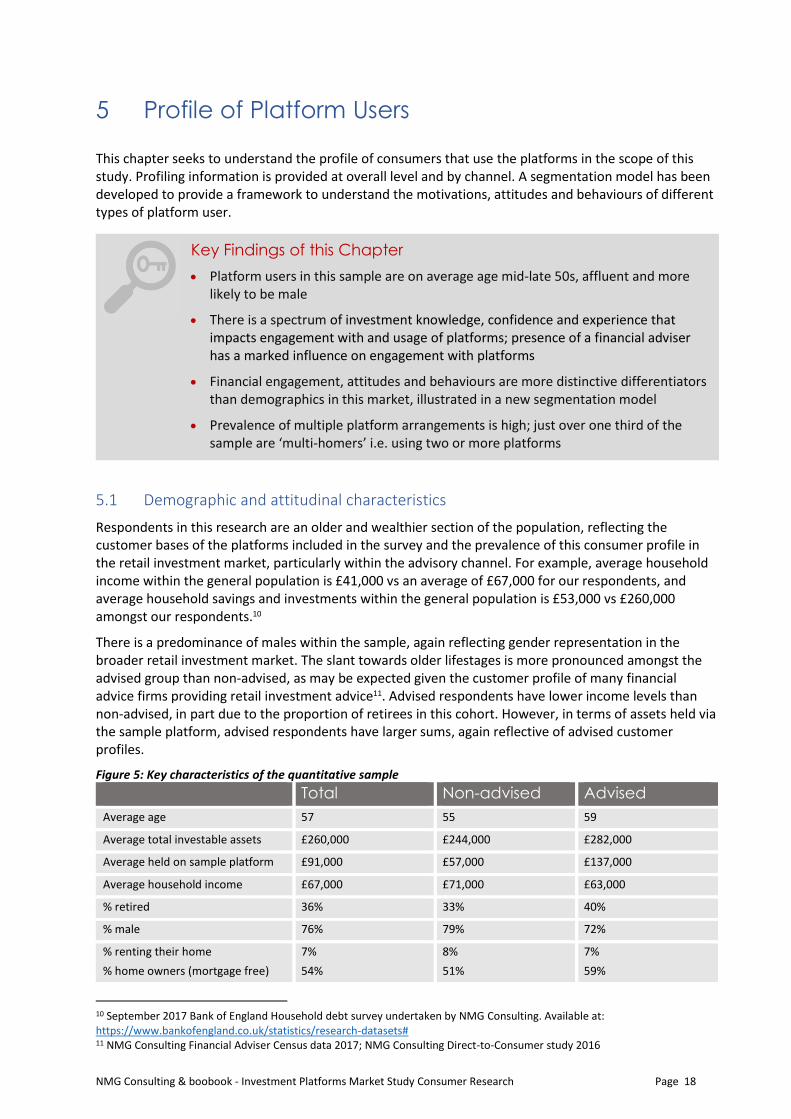
Respondents in this research are an older and wealthier section of the population, reflecting the customer bases of the platforms included in the survey and the prevalence of this consumer profile in the retail investment market, particularly within the advisory channel. For example, average household income within the general population is £41,000 vs an average of £67,000 for our respondents, and average household savings and investments within the general population is £53,000 vs £260,000 amongst our respondents.10
There is a predominance of males within the sample, again reflecting gender representation in the broader retail investment market. The slant towards older lifestages is more pronounced amongst the advised group than non-advised, as may be expected given the customer profile of many financial advice firms providing retail investment advice11. Advised respondents have lower income levels than non-advised, in part due to the proportion of retirees in this cohort. However, in terms of assets held via the sample platform, advised respondents have larger sums, again reflective of advised customer profiles.
Figure 5: Key characteristics of the quantitative sample
Total Non-advised Advised
Average age 57 55 59
Average total investable assets £260,000 £244,000 £282,000
Average held on sample platform £91,000 £57,000 £137,000
Average household income £67,000 £71,000 £63,000
% retired 36% 33% 40%
% male 76% 79% 72%
% renting their home
% home owners (mortgage free)
7%
54%
8%
51%
7%
59%
10 September 2017 Bank of England Household debt survey undertaken by NMG Consulting. Available at: https://www.bankofengland.co.uk/statistics/research-datasets# 11 NMG Consulting Financial Adviser Census data 2017; NMG Consulting Direct-to-Consumer study 2016
Key Findings of this Chapter
• Platform users in this sample are on average age mid-late 50s, affluent and more likely to be male
• There is a spectrum of investment knowledge, confidence and experience that impacts engagement with and usage of platforms; presence of a financial adviser has a marked influence on engagement with platforms
• Financial engagement, attitudes and behaviours are more distinctive differentiators than demographics in this market, illustrated in a new segmentation model
• Prevalence of multiple platform arrangements is high; just over one third of the sample are ‘multi-homers’ i.e. using two or more platforms
NMG Consulting & boobook - Investment Platforms Market Study Consumer Research Page 19
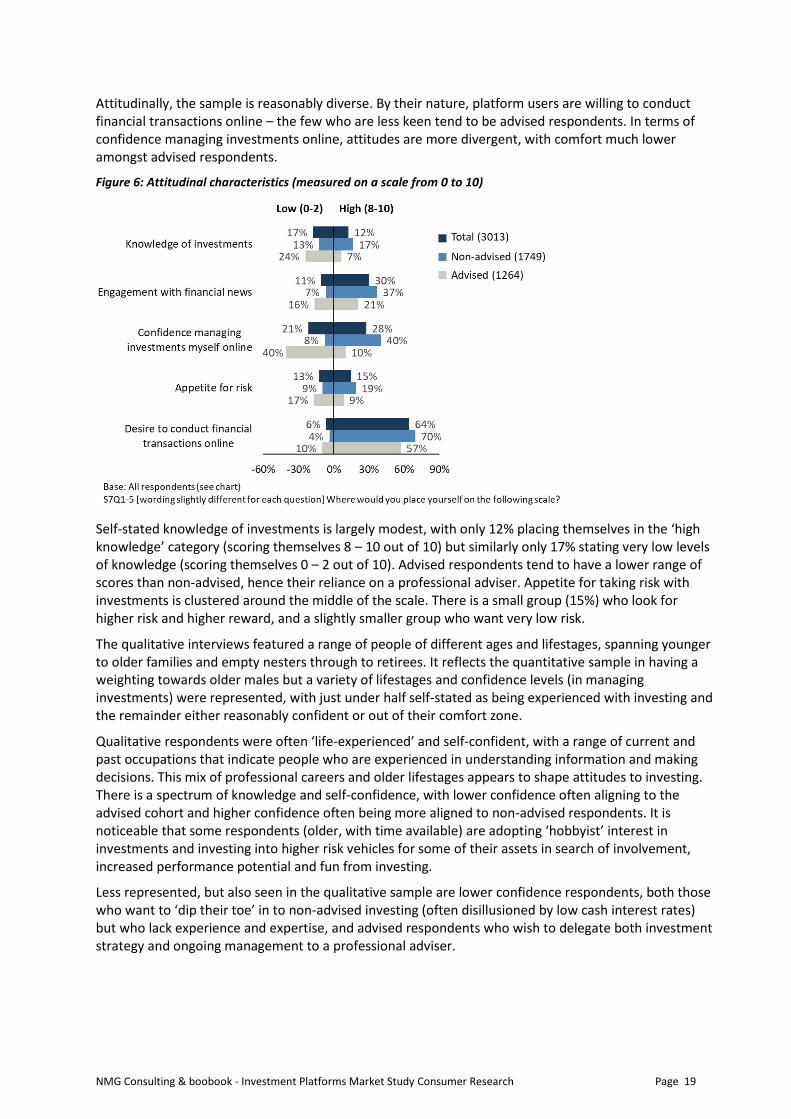
Attitudinally, the sample is reasonably diverse. By their nature, platform users are willing to conduct financial transactions online – the few who are less keen tend to be advised respondents. In terms of confidence managing investments online, attitudes are more divergent, with comfort much lower amongst advised respondents.
Figure 6: Attitudinal characteristics (measured on a scale from 0 to 10)
Self-stated knowledge of investments is largely modest, with only 12% placing themselves in the ‘high knowledge’ category (scoring themselves 8 – 10 out of 10) but similarly only 17% stating very low levels of knowledge (scoring themselves 0 – 2 out of 10). Advised respondents tend to have a lower range of scores than non-advised, hence their reliance on a professional adviser. Appetite for taking risk with investments is clustered around the middle of the scale. There is a small group (15%) who look for higher risk and higher reward, and a slightly smaller group who want very low risk.
The qualitative interviews featured a range of people of different ages and lifestages, spanning younger to older families and empty nesters through to retirees. It reflects the quantitative sample in having a weighting towards older males but a variety of lifestages and confidence levels (in managing investments) were represented, with just under half self-stated as being experienced with investing and the remainder either reasonably confident or out of their comfort zone.
Qualitative respondents were often ‘life-experienced’ and self-confident, with a range of current and past occupations that indicate people who are experienced in understanding information and making decisions. This mix of professional careers and older lifestages appears to shape attitudes to investing. There is a spectrum of knowledge and self-confidence, with lower confidence often aligning to the advised cohort and higher confidence often being more aligned to non-advised respondents. It is noticeable that some respondents (older, with time available) are adopting ‘hobbyist’ interest in investments and investing into higher risk vehicles for some of their assets in search of involvement, increased performance potential and fun from investing.
Less represented, but also seen in the qualitative sample are lower confidence respondents, both those who want to ‘dip their toe’ in to non-advised investing (often disillusioned by low cash interest rates) but who lack experience and expertise, and advised respondents who wish to delegate both investment strategy and ongoing management to a professional adviser.
NMG Consulting & boobook - Investment Platforms Market Study Consumer Research Page 20
A. Financial engagement
B. Financial attitude
C. Investments
D. Switching
E. Reasons for platform use
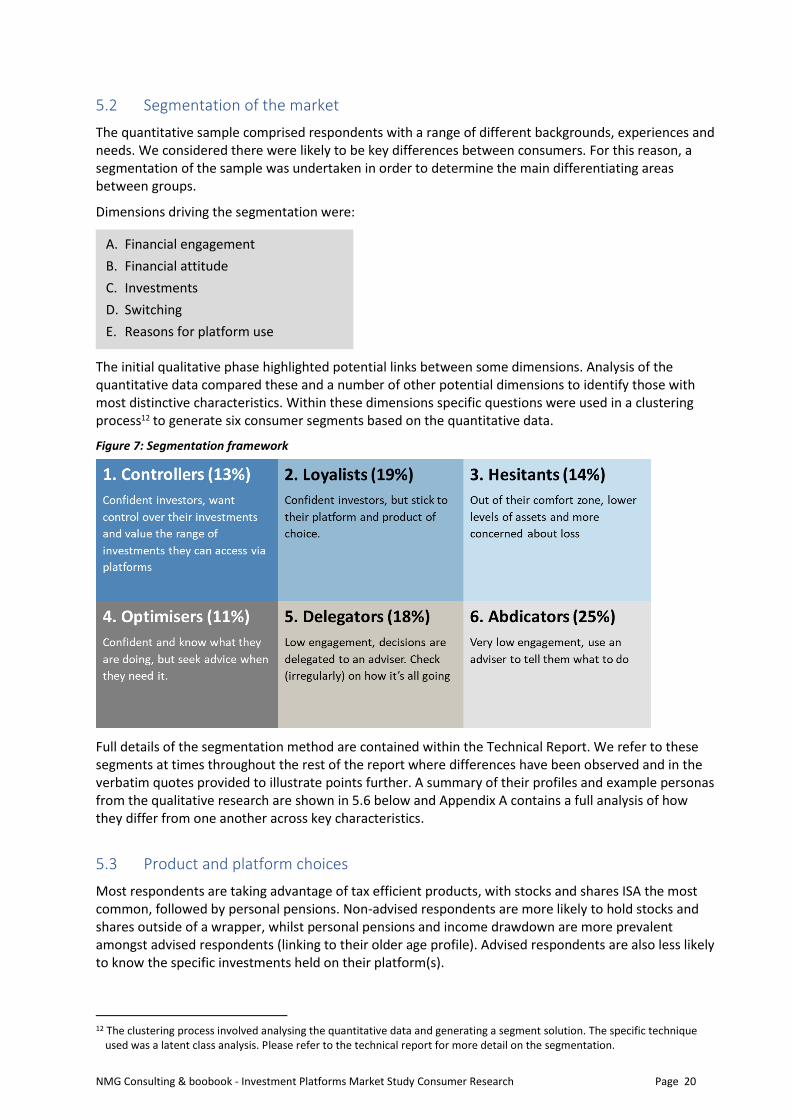
5.2 Segmentation of the market
The quantitative sample comprised respondents with a range of different backgrounds, experiences and needs. We considered there were likely to be key differences between consumers. For this reason, a segmentation of the sample was undertaken in order to determine the main differentiating areas between groups.
Dimensions driving the segmentation were:
The initial qualitative phase highlighted potential links between some dimensions. Analysis of the quantitative data compared these and a number of other potential dimensions to identify those with most distinctive characteristics. Within these dimensions specific questions were used in a clustering process12 to generate six consumer segments based on the quantitative data.
Figure 7: Segmentation framework
Full details of the segmentation method are contained within the Technical Report. We refer to these segments at times throughout the rest of the report where differences have been observed and in the verbatim quotes provided to illustrate points further. A summary of their profiles and example personas from the qualitative research are shown in 5.6 below and Appendix A contains a full analysis of how they differ from one another across key characteristics.
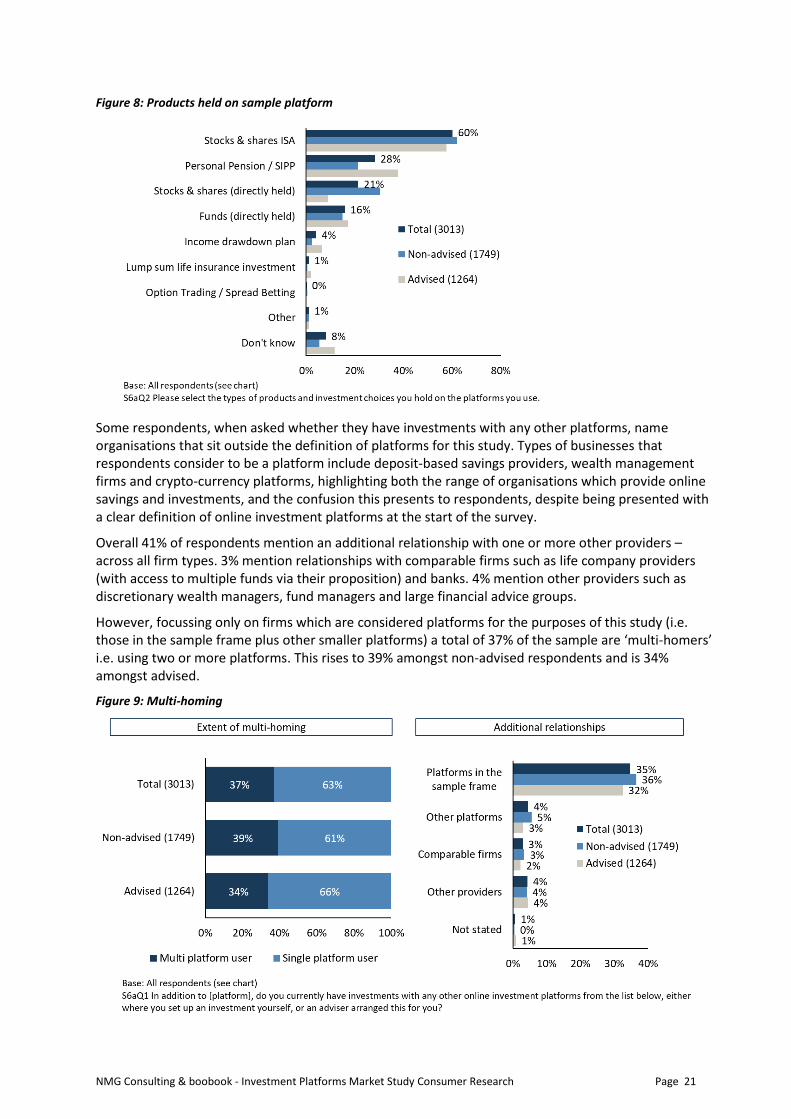
5.3 Product and platform choices
Most respondents are taking advantage of tax efficient products, with stocks and shares ISA the most common, followed by personal pensions. Non-advised respondents are more likely to hold stocks and shares outside of a wrapper, whilst personal pensions and income drawdown are more prevalent amongst advised respondents (linking to their older age profile). Advised respondents are also less likely to know the specific investments held on their platform(s).
12 The clustering process involved analysing the quantitative data and generating a segment solution. The specific technique
used was a latent class analysis. Please refer to the technical report for more detail on the segmentation.
NMG Consulting & boobook - Investment Platforms Market Study Consumer Research Page 21
Figure 8: Products held on sample platform
Some respondents, when asked whether they have investments with any other platforms, name organisations that sit outside the definition of platforms for this study. Types of businesses that respondents consider to be a platform include deposit-based savings providers, wealth management firms and crypto-currency platforms, highlighting both the range of organisations which provide online savings and investments, and the confusion this presents to respondents, despite being presented with a clear definition of online investment platforms at the start of the survey.
Overall 41% of respondents mention an additional relationship with one or more other providers – across all firm types. 3% mention relationships with comparable firms such as life company providers (with access to multiple funds via their proposition) and banks. 4% mention other providers such as discretionary wealth managers, fund managers and large financial advice groups.
However, focussing only on firms which are considered platforms for the purposes of this study (i.e. those in the sample frame plus other smaller platforms) a total of 37% of the sample are ‘multi-homers’ i.e. using two or more platforms. This rises to 39% amongst non-advised respondents and is 34% amongst advised.
Figure 9: Multi-homing
NMG Consulting & boobook - Investment Platforms Market Study Consumer Research Page 22
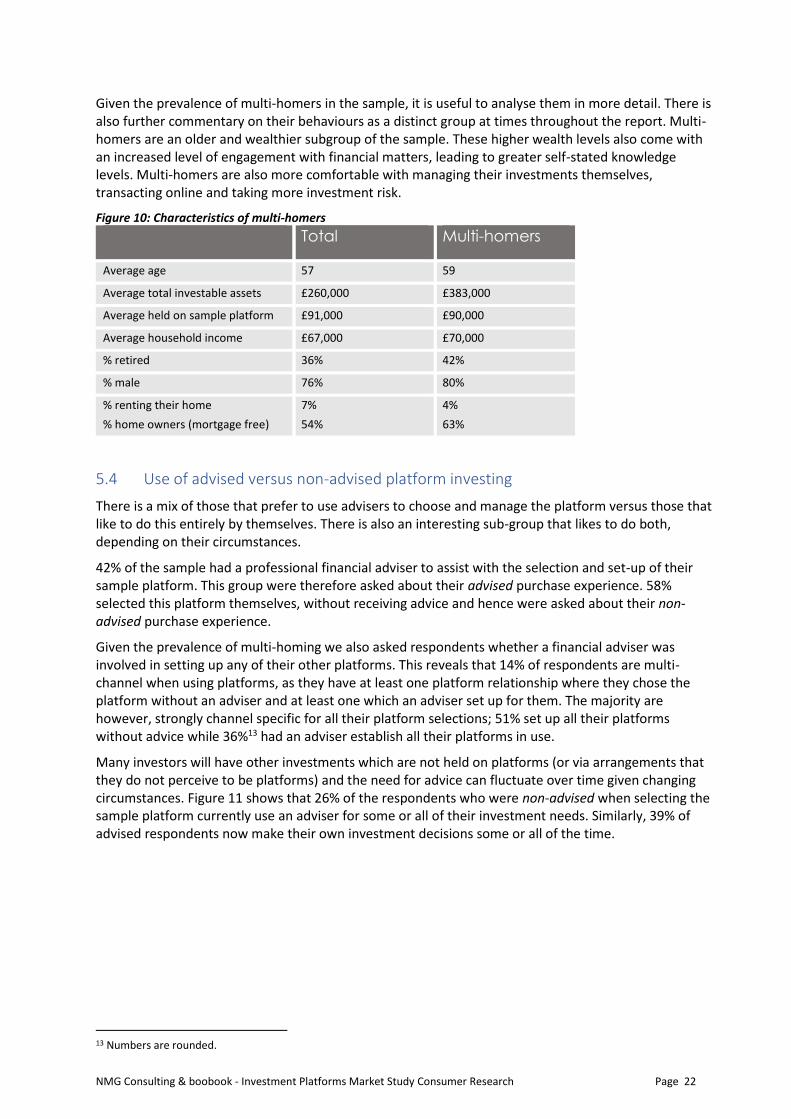
Given the prevalence of multi-homers in the sample, it is useful to analyse them in more detail. There is also further commentary on their behaviours as a distinct group at times throughout the report. Multi-homers are an older and wealthier subgroup of the sample. These higher wealth levels also come with an increased level of engagement with financial matters, leading to greater self-stated knowledge levels. Multi-homers are also more comfortable with managing their investments themselves, transacting online and taking more investment risk.
Figure 10: Characteristics of multi-homers
Total Multi-homers
Average age 57 59
Average total investable assets £260,000 £383,000
Average held on sample platform £91,000 £90,000
Average household income £67,000 £70,000
% retired 36% 42%
% male 76% 80%
% renting their home
% home owners (mortgage free)
7%
54%
4%
63%
5.4 Use of advised versus non-advised platform investing
There is a mix of those that prefer to use advisers to choose and manage the platform versus those that like to do this entirely by themselves. There is also an interesting sub-group that likes to do both, depending on their circumstances.
42% of the sample had a professional financial adviser to assist with the selection and set-up of their sample platform. This group were therefore asked about their advised purchase experience. 58% selected this platform themselves, without receiving advice and hence were asked about their non-advised purchase experience.
Given the prevalence of multi-homing we also asked respondents whether a financial adviser was involved in setting up any of their other platforms. This reveals that 14% of respondents are multi-channel when using platforms, as they have at least one platform relationship where they chose the platform without an adviser and at least one which an adviser set up for them. The majority are however, strongly channel specific for all their platform selections; 51% set up all their platforms without advice while 36%13 had an adviser establish all their platforms in use.
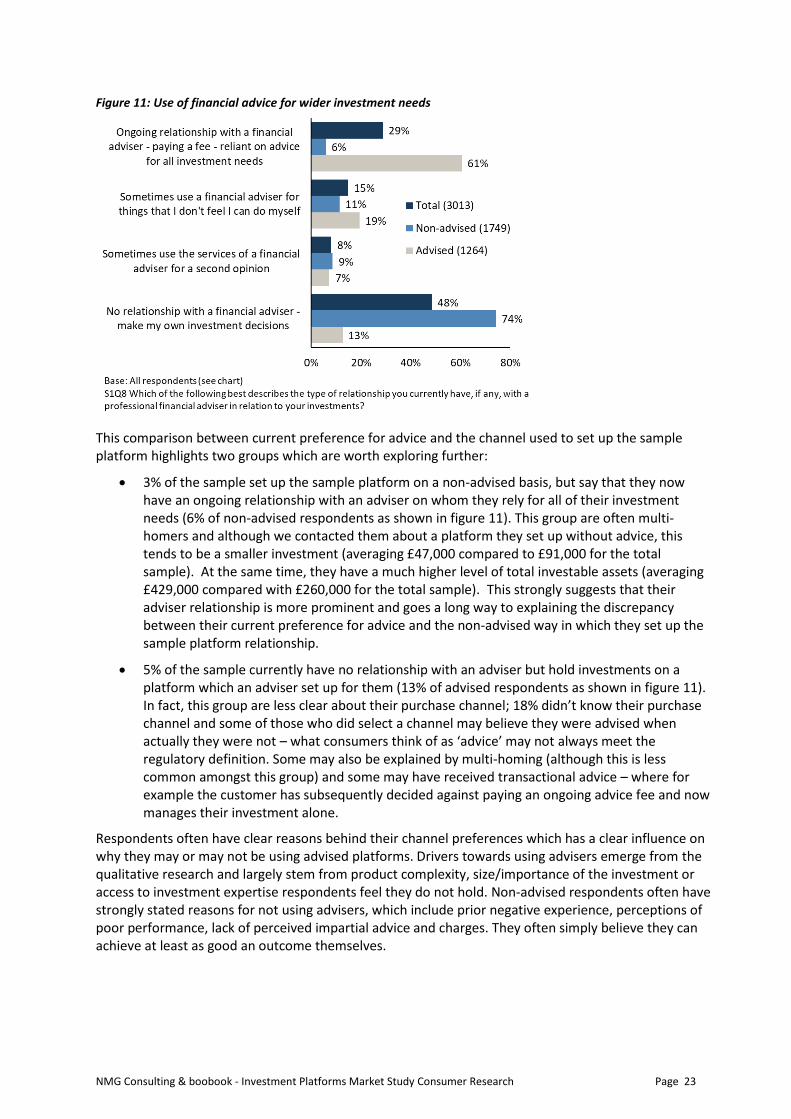
Many investors will have other investments which are not held on platforms (or via arrangements that they do not perceive to be platforms) and the need for advice can fluctuate over time given changing circumstances. Figure 11 shows that 26% of the respondents who were non-advised when selecting the sample platform currently use an adviser for some or all of their investment needs. Similarly, 39% of advised respondents now make their own investment decisions some or all of the time.
13 Numbers are rounded.
NMG Consulting & boobook - Investment Platforms Market Study Consumer Research Page 23
Figure 11: Use of financial advice for wider investment needs
This comparison between current preference for advice and the channel used to set up the sample platform highlights two groups which are worth exploring further:
• 3% of the sample set up the sample platform on a non-advised basis, but say that they now have an ongoing relationship with an adviser on whom they rely for all of their investment needs (6% of non-advised respondents as shown in figure 11). This group are often multi-homers and although we contacted them about a platform they set up without advice, this tends to be a smaller investment (averaging £47,000 compared to £91,000 for the total sample). At the same time, they have a much higher level of total investable assets (averaging £429,000 compared with £260,000 for the total sample). This strongly suggests that their adviser relationship is more prominent and goes a long way to explaining the discrepancy between their current preference for advice and the non-advised way in which they set up the sample platform relationship.
• 5% of the sample currently have no relationship with an adviser but hold investments on a platform which an adviser set up for them (13% of advised respondents as shown in figure 11). In fact, this group are less clear about their purchase channel; 18% didn’t know their purchase channel and some of those who did select a channel may believe they were advised when actually they were not – what consumers think of as ‘advice’ may not always meet the regulatory definition. Some may also be explained by multi-homing (although this is less common amongst this group) and some may have received transactional advice – where for example the customer has subsequently decided against paying an ongoing advice fee and now manages their investment alone.
Respondents often have clear reasons behind their channel preferences which has a clear influence on why they may or may not be using advised platforms. Drivers towards using advisers emerge from the qualitative research and largely stem from product complexity, size/importance of the investment or access to investment expertise respondents feel they do not hold. Non-advised respondents often have strongly stated reasons for not using advisers, which include prior negative experience, perceptions of poor performance, lack of perceived impartial advice and charges. They often simply believe they can achieve at least as good an outcome themselves.
NMG Consulting & boobook - Investment Platforms Market Study Consumer Research Page 24
5.5 Motivations and goals of respondents
Respondents reveal they are investing for a variety of different reasons. In the qualitative interviews, a number of circumstances relating to lifestage were observed:
• Younger lifestage – investing to generate funds for property purchase, business start-up or a general future nest egg. There is a strong focus on accumulation and a desire to optimise their financial position through investing. Investment horizons may be mid-term rather than long term. Retirement provision is absent from the stated reasons for investing by this younger group.
“I am trying to save for a house deposit. I am trying to identify where I can make some money by
investing in the stock market Advised, Hesitant
• Family lifestage – investing for long-term retirement provision and to assist children in early adulthood. Planning is medium to long term and is focused on building assets to support retirement income and lump sum support for children moving into adulthood e.g. property purchase. Performance and capital growth are targeted through a range of products.
• Investing to support retirement – characterised by investing a substantial lump sum for income and ideally capital growth. Lump sums can often come from redundancy payments, sale of businesses and long-term pension savings. Respondents are often investing to improve performance beyond cash savings, provide some security over their core assets, and to generate income for general living and retirement lifestyle.
5.6 Segment profiles
A description of the key segment characteristics and an example persona, driven from the qualitative research, is shown below for each of the six segments.
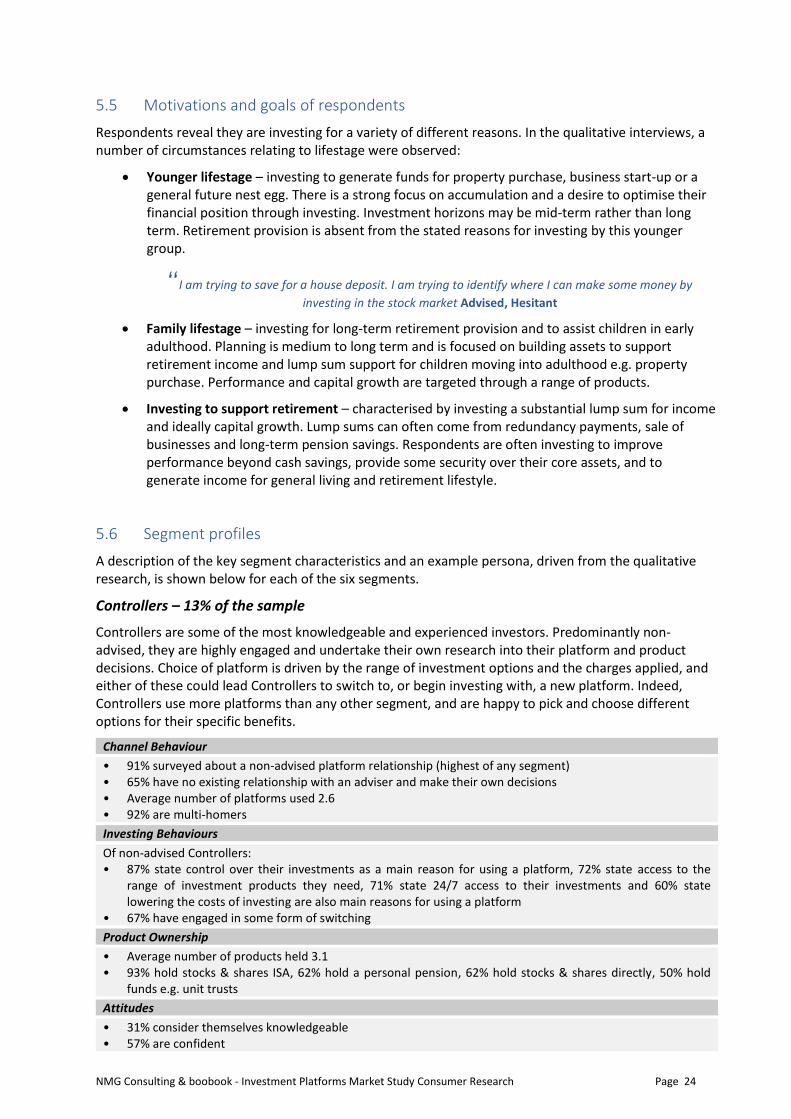
Controllers – 13% of the sample
Controllers are some of the most knowledgeable and experienced investors. Predominantly non-advised, they are highly engaged and undertake their own research into their platform and product decisions. Choice of platform is driven by the range of investment options and the charges applied, and either of these could lead Controllers to switch to, or begin investing with, a new platform. Indeed, Controllers use more platforms than any other segment, and are happy to pick and choose different options for their specific benefits.
Channel Behaviour
• 91% surveyed about a non-advised platform relationship (highest of any segment) • 65% have no existing relationship with an adviser and make their own decisions • Average number of platforms used 2.6 • 92% are multi-homers
Investing Behaviours
Of non-advised Controllers: • 87% state control over their investments as a main reason for using a platform, 72% state access to the
range of investment products they need, 71% state 24/7 access to their investments and 60% state lowering the costs of investing are also main reasons for using a platform
• 67% have engaged in some form of switching
Product Ownership
• Average number of products held 3.1 • 93% hold stocks & shares ISA, 62% hold a personal pension, 62% hold stocks & shares directly, 50% hold
funds e.g. unit trusts
Attitudes
• 31% consider themselves knowledgeable • 57% are confident
NMG Consulting & boobook - Investment Platforms Market Study Consumer Research Page 25
• 25% have an appetite for high risk investments • 79% would like to do all financial transactions online
Demographics
• £485,000 – average total investible assets (highest of any segment) • £80,000 – average household income (highest of any segment) • Average age 57.1 • 86% male, 12% female, 2% prefer not to say • 48% are working (full time / part time / self-employed), 38% are retired
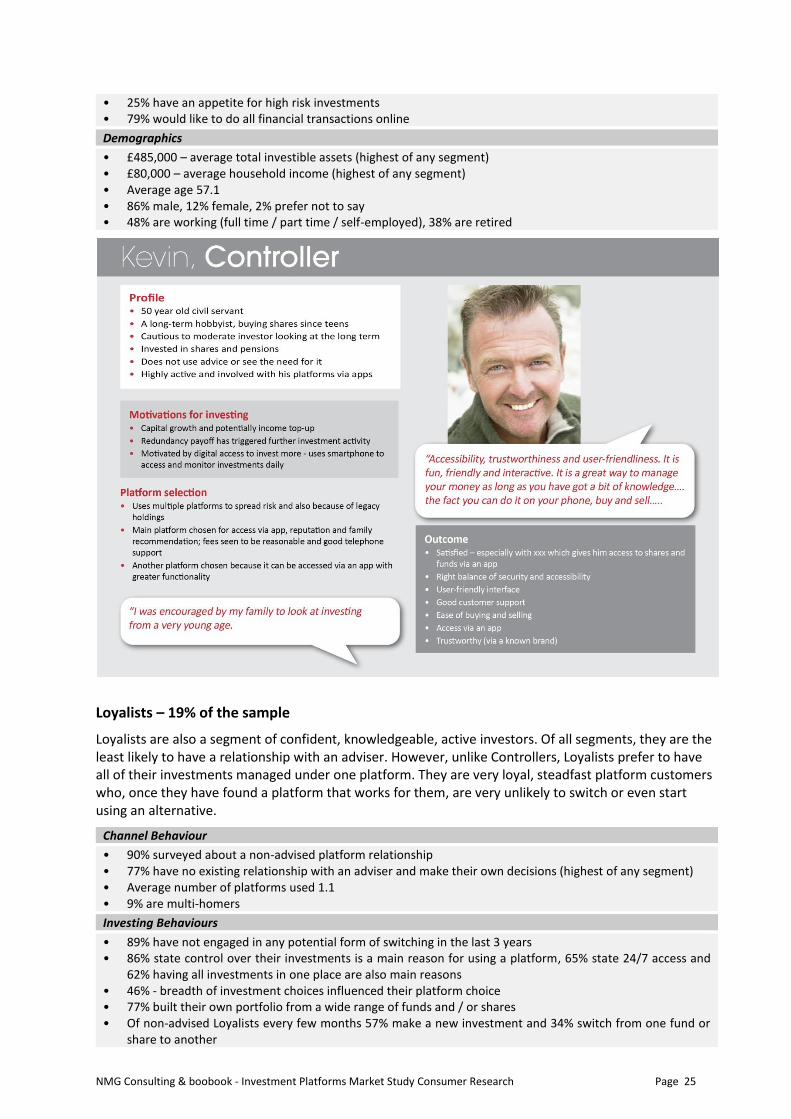
Loyalists – 19% of the sample
Loyalists are also a segment of confident, knowledgeable, active investors. Of all segments, they are the least likely to have a relationship with an adviser. However, unlike Controllers, Loyalists prefer to have all of their investments managed under one platform. They are very loyal, steadfast platform customers who, once they have found a platform that works for them, are very unlikely to switch or even start using an alternative.
Channel Behaviour
• 90% surveyed about a non-advised platform relationship • 77% have no existing relationship with an adviser and make their own decisions (highest of any segment) • Average number of platforms used 1.1 • 9% are multi-homers
Investing Behaviours
• 89% have not engaged in any potential form of switching in the last 3 years • 86% state control over their investments is a main reason for using a platform, 65% state 24/7 access and
62% having all investments in one place are also main reasons • 46% - breadth of investment choices influenced their platform choice • 77% built their own portfolio from a wide range of funds and / or shares • Of non-advised Loyalists every few months 57% make a new investment and 34% switch from one fund or
share to another
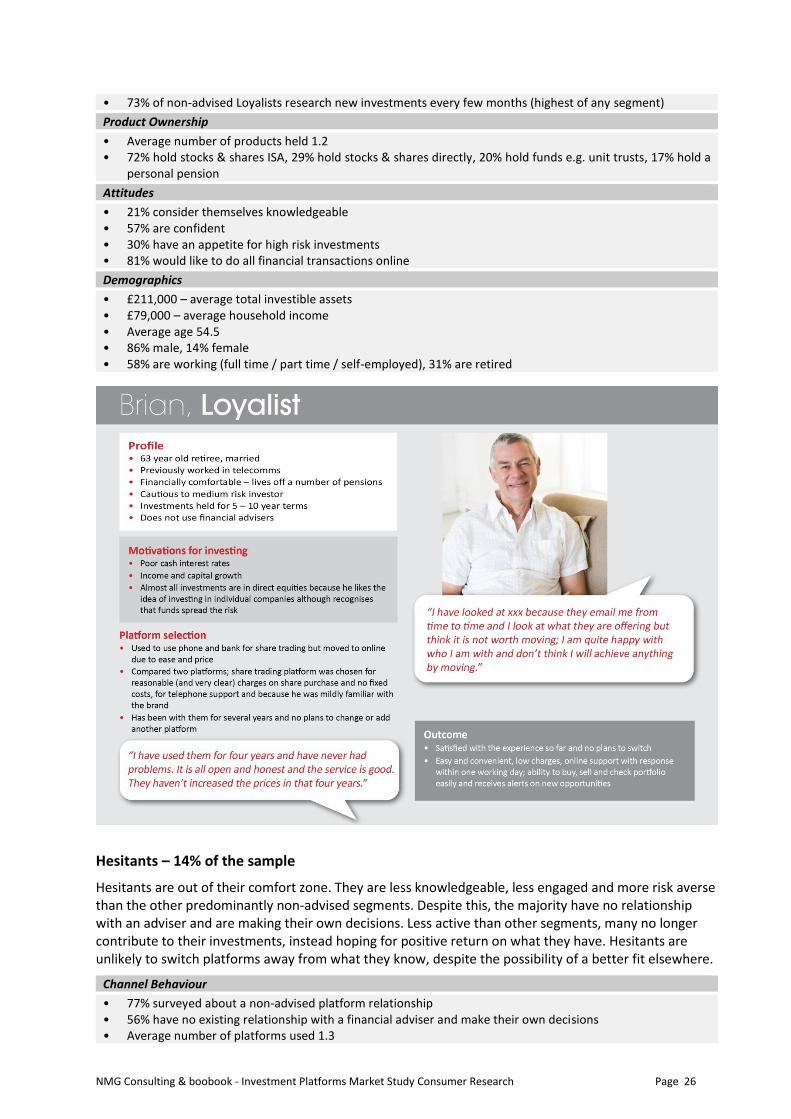
NMG Consulting & boobook - Investment Platforms Market Study Consumer Research Page 26
• 73% of non-advised Loyalists research new investments every few months (highest of any segment)
Product Ownership
• Average number of products held 1.2 • 72% hold stocks & shares ISA, 29% hold stocks & shares directly, 20% hold funds e.g. unit trusts, 17% hold a
personal pension
Attitudes
• 21% consider themselves knowledgeable • 57% are confident • 30% have an appetite for high risk investments • 81% would like to do all financial transactions online
Demographics
• £211,000 – average total investible assets • £79,000 – average household income • Average age 54.5 • 86% male, 14% female • 58% are working (full time / part time / self-employed), 31% are retired
Hesitants – 14% of the sample
Hesitants are out of their comfort zone. They are less knowledgeable, less engaged and more risk averse than the other predominantly non-advised segments. Despite this, the majority have no relationship with an adviser and are making their own decisions. Less active than other segments, many no longer contribute to their investments, instead hoping for positive return on what they have. Hesitants are unlikely to switch platforms away from what they know, despite the possibility of a better fit elsewhere.
Channel Behaviour
• 77% surveyed about a non-advised platform relationship • 56% have no existing relationship with a financial adviser and make their own decisions • Average number of platforms used 1.3

NMG Consulting & boobook - Investment Platforms Market Study Consumer Research Page 27
• 25% are multi-homers
Investing Behaviours
• 62% feel 24/7 access is a main reason for using an online platform • 50% are not currently contributing to their investments • Of non-advised Hesitants, 88% check value of investments and 16% switch from one fund or share to
another every few months • 73% have not engaged in any potential form of switching in the last 3 years • 8% have withdrawn investments or started using a new platform without continuing to contribute to their
existing platform
Product Ownership
• Average number of products held 1.2 • 58% hold stocks & shares ISA, 36% hold stocks & shares directly, 25% hold a personal pension, 13% hold
funds e.g. unit trusts
Attitudes
• 1% consider themselves to be knowledgeable • 11% are confident • 5% have an appetite for high risk investments • 51% would like to do all financial transactions online
Demographics
• £148,000 – average total investible assets • £56,000 – average household income • Average age 56.6 • 66% male, 31% female, 3% prefer not to say • 45% are working (full time / part time / self-employed), 43% are retired

NMG Consulting & boobook - Investment Platforms Market Study Consumer Research Page 28
Optimisers – 11% of the sample
Optimisers are another segment of knowledgeable and engaged investors, though slightly less so than either Controllers or Loyalists. For this reason, they tend to have an adviser who they turn to when needed, likely hoping to optimise their situation by using the right channel for the right need. They are not averse to switching platforms or using multiple platforms, realising different platforms may be more or less suitable for different needs.
Channel Behaviour
• 58% surveyed about an advised platform relationship • 60% have some form of relationship with a financial adviser, 29% an ongoing relationship • Average number of platforms used 2.1 • 65% are multi-homers
Investing Behaviours
• 57% have undertaken some form of switching • 65% feel control over their investments is a main reason for using an online platform • 47% make regular automated contributions to their investments
Product Ownership
• Average number of products held 2.1 • 80% hold a personal pension, 62% hold stocks & shares ISA, 27% hold stocks & shares directly, 13% hold
funds e.g. unit trusts
Attitudes
• 31% consider themselves to be knowledgeable • 41% are confident • 24% have an appetite for high risk investments • 84% would like to do all financial transactions online (highest of any segment)
Demographics
• £388,000 – average total investible assets

NMG Consulting & boobook - Investment Platforms Market Study Consumer Research Page 29
• £80,000 – average household income • Average age 54.2 • 86% male, 13% female, 1% prefer not to say • 70% are working (full time / part time / self-employed), 22% are retired
Delegators – 18% of the sample
Delegators are an older, less knowledgeable and less confident segment of consumers and hence have less appetite for high risk investments. Because of this, they are likely to have an ongoing relationship with a financial adviser who they rely on. They are unlikely to switch or start to use a new platform though this decision would be led by their adviser.
Channel Behaviour
• 63% surveyed about an advised platform relationship • 67% have some form of relationship with a financial adviser, 44% an ongoing relationship • Average number of platforms used 1.7 • 47% are multi-homers
Investing Behaviours
• 78% have not engaged in any potential form of switching in the last 3 years • 55% feel convenience of having their investments in one place is a main reason for using an online platform • 48% are no longer contributing to their investments, 46% make lump sum contributions from time to time
Product Ownership
• Average number of products held 1.9 • 92% hold stocks & shares ISA, 33% hold funds e.g. unit trusts, 30% hold stocks & shares directly, 23% hold a
personal pension
Attitudes
• 4% consider themselves to be knowledgeable • 21% are confident • 5% have an appetite for high risk investments
NMG Consulting & boobook - Investment Platforms Market Study Consumer Research Page 30
• 50% would like to do all financial transactions online
Demographics
• £306,000 – average total investible assets • £60,000 – average household income • Average age 61.2 • 71% male, 27% female, 2% prefer not to say • 37% are working (full time / part time / self-employed), 53% are retired
Abdicators – 25% of the sample
Abdicators are the largest segment, representing a quarter of platform investors. Of all segments, they are least knowledgeable about investments, least engaged and feel most out of their comfort zone when managing their investments online. Most have an ongoing relationship with a financial adviser or deal with one when have something they don’t feel they can do themselves, which given their lack of knowledge and confidence likely represents the majority of their investment choices. Abdicators are the least engaged segment and hence are using their platforms the least, with their advisers taking on this responsibility. The potential value and benefits of platforms are therefore likely to be less obvious to them.
Channel Behaviour
• 71% surveyed about an advised platform relationship (highest of any segment) • 70% have some form of relationship with a financial adviser, 49% an ongoing relationship • Average number of platforms used 1.2 • 15% are multi-homers
• 66% feel their adviser was primarily responsible for choosing their platform
Investing Behaviours
• 92% have not engaged in any potential form of switching in the last 3 years • 46% feel their adviser using a platform is a main reason for using an online platform • 52% are no longer contributing to their investments
Product Ownership
• Average number of products held 1.0 • 42% hold a personal pension, 38% hold stocks & shares ISA, 5% hold stocks & shares directly , 3% hold funds
e.g. unit trusts
Attitudes
• <0.5% consider themselves to be knowledgeable • 4% are confident • 5% have an appetite for high risk investments • 53% would like to do all financial transactions online
Demographics
• £153,000 – average total investible assets • £58,000 – average household income • Average age 55.6 • 66% male, 33% female, 1% prefer not to say • 61% are working (full time / part time / self-employed), 28% are retired

NMG Consulting & boobook - Investment Platforms Market Study Consumer Research Page 31
NMG Consulting & boobook - Investment Platforms Market Study Consumer Research Page 32
6 Choosing Platforms
This chapter looks at the role platforms play for respondents, reviews how they are choosing platforms and examines, through multiple techniques, what is most important to respondents when choosing a platform.
6.1 Understanding of platforms
The qualitative research demonstrates that respondents display a spectrum of understanding about platforms, correlating largely to their overall financial capability (driven by knowledge and confidence) and engagement with their investments. Channel preference – advised vs non-advised – also plays a significant role and is linked to engagement.
Advised Advised respondents can have low engagement with platforms and therefore understanding can be limited. There is often confusion between the products and the platform. Lines easily blur and often respondents default to talking about their products (SIPP, ISA) rather than their platform. This results in the platform’s role being subsumed into elements the respondent cares much more about – the performance of their investments and the adviser relationship.
“It is linked to the website of the financial adviser…. where I go to look up how my investments are doing... It
is xxx, they are the adviser, I go through that website to check. Advised, Delegator
Non-advised More knowledgeable respondents (most often in the Controller, Loyalist and Optimiser segments) commonly understand there is a difference between the platform and the products held on it and that these exist as separate entities which can be changed independent of one another.
In particular, multi-homers appear to have greater awareness of the platform as a discrete component. High awareness of platforms (and different types of platforms with different functionality) apply where higher capability investors have branched into different types of investing for different asset types e.g. where the consumer is managing funds on one platform and shares on another platform (this is covered further in 6.3 below).
Key Findings of this Chapter
• Platforms bring many benefits including control, access, convenience and choice of investments – respondents do not want to go back to the ‘old days’ of investing
• Many are not actively choosing between platforms – advised respondents delegate this to advisers; less engaged non-advised respondents use shortcuts and rules of thumb in their decision making and don’t compare. The platform choice can be viewed as a ‘second-order’ decision compared to product and investment choice
• More engaged non-advised respondents investigate key features and actively compare – investment choices and charges are stated as most important
• Less knowledgeable respondents place more emphasis on trusted, established brands; despite the lower stated importance of brand, it is a fundamental factor that delivers reassurance
• Given issues respondents reveal around awareness and understanding of charges it is probable that the role charges play in the final choice of platform is over-stated by respondents
NMG Consulting & boobook - Investment Platforms Market Study Consumer Research Page 33
‘Platform’ or ‘investment platform’ as terminology is not always understood or used by respondents and not just by lower capability respondents. Some will use ‘fund/share supermarket’ or ‘investing online’ in place of platform and for an emerging minority (younger, non-advised) ‘platform’ is subsumed into ‘app’ in terms of preferred naming and access via smart phone.
Some non-advised respondents have a ‘transactional’ view of a platform. It is simply somewhere to store their assets and can be seen as a commodity. It will not in itself make for good investment performance – the success or otherwise of their investment choices do that.
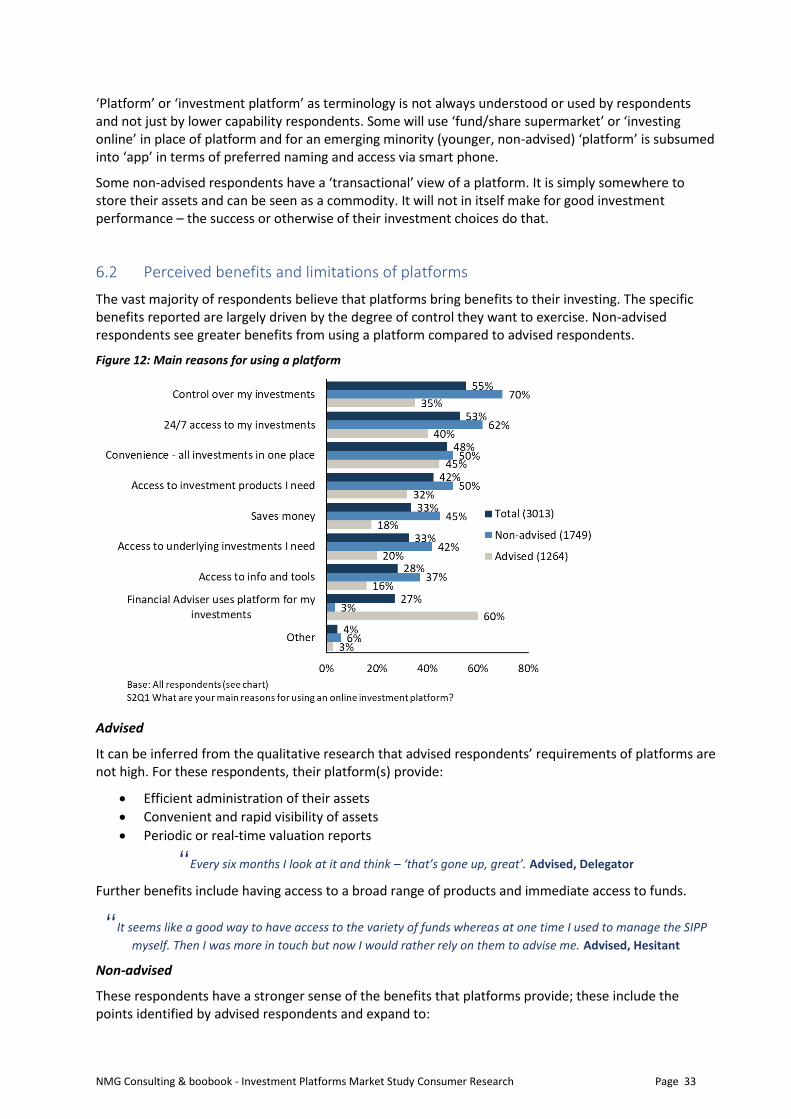
6.2 Perceived benefits and limitations of platforms
The vast majority of respondents believe that platforms bring benefits to their investing. The specific benefits reported are largely driven by the degree of control they want to exercise. Non-advised respondents see greater benefits from using a platform compared to advised respondents.
Figure 12: Main reasons for using a platform
Advised
It can be inferred from the qualitative research that advised respondents’ requirements of platforms are not high. For these respondents, their platform(s) provide:
• Efficient administration of their assets
• Convenient and rapid visibility of assets
• Periodic or real-time valuation reports
“Every six months I look at it and think – ‘that’s gone up, great’. Advised, Delegator
Further benefits include having access to a broad range of products and immediate access to funds.
“It seems like a good way to have access to the variety of funds whereas at one time I used to manage the SIPP
myself. Then I was more in touch but now I would rather rely on them to advise me. Advised, Hesitant
Non-advised
These respondents have a stronger sense of the benefits that platforms provide; these include the points identified by advised respondents and expand to:
NMG Consulting & boobook - Investment Platforms Market Study Consumer Research Page 34
• A strong sense of flexible control over investments – that the platform allows for investments to be actively chosen and managed as much or as little as is desired
“I feel much more in control because when it was hundreds of bits of paper across 50 accounts it was so
widely spread it was impossible to bring it all together. Now if I go on there I will see it moving as the market moves; it is phenomenal. I have got rid of reams of paper and it is really easy to trace. Non-
advised, Controller
• Convenience – that investments can be accessed easily and quickly through the platform; that the investor is not delayed by time or distanced by geography from keeping in touch with their assets and actively managing them whenever and wherever they choose.
“I use my iPhone as the tool to access and monitor various investment types. Whereas before you had to
dig deep, phone up and write and open the paper to see how BT was doing. It is now all so instant that it makes it great fun. Non-advised, Controller
• Access to a breadth of investment choices – seen as offering a great range of assets, sectors and investment vehicles that would not be as easily accessible outside of the platform (and for those familiar with investing via traditional, offline channels historically, the increase in choice is highly attractive)
• High visibility of product and performance – that products and investments can be seen quickly and clearly, ideally with good ability to interrogate underlying allocations and that performance of assets is easy to see and understand
• Speed of trading – quoted particularly by the Controller segment, so that assets such as shares can be traded quickly avoiding adverse market movements; but also by other segments, that when money is being invested, moved or liquidated this happens rapidly and without delay
“The speed of transactions has some importance because once I have decided to invest in something I
don’t want to feel that the price will change before it is executed. Non-advised, Loyalist
• Cost effective investing – this can be an important advantage of using a platform, with all the benefits so far mentioned while reducing investment costs (a few are aware of the removal of initial fund fees and discounts achieved by platforms against fund managers)
“It was the best way to have an ISA and they offered discounts against the initial charge.
Non-advised, Loyalist
Very few limitations regarding platform functionality or features emerge from the qualitative interviews. The most significant concern raised by some respondents relates to financial security, i.e. perceptions of the adequacy of statutory protections against individual platform failure (the level of FSCS protection limits). Respondents can have misconceptions around the custodial role of platforms and the safeguarding of their assets in the event of a platform collapse. This sense of concern is a major impetus for platform diversification/multi-homing – to ‘not have all of one’s eggs in one basket’, explored further in section 6.3 below.
Beyond this point, there is a minority observation of poor user experience, e.g. mobile apps being limited in functionality, adviser-focused platforms having restricted functionality which frustrates a few of the more interested advised respondents, and failed log-ins, which can frustrate respondents who rarely use their platform and are caught out by passwords expiring or being forgotten. For such infrequent users this appears to form a further barrier to engaging with their platform and encourages an attitude of ‘leave it to the adviser’.
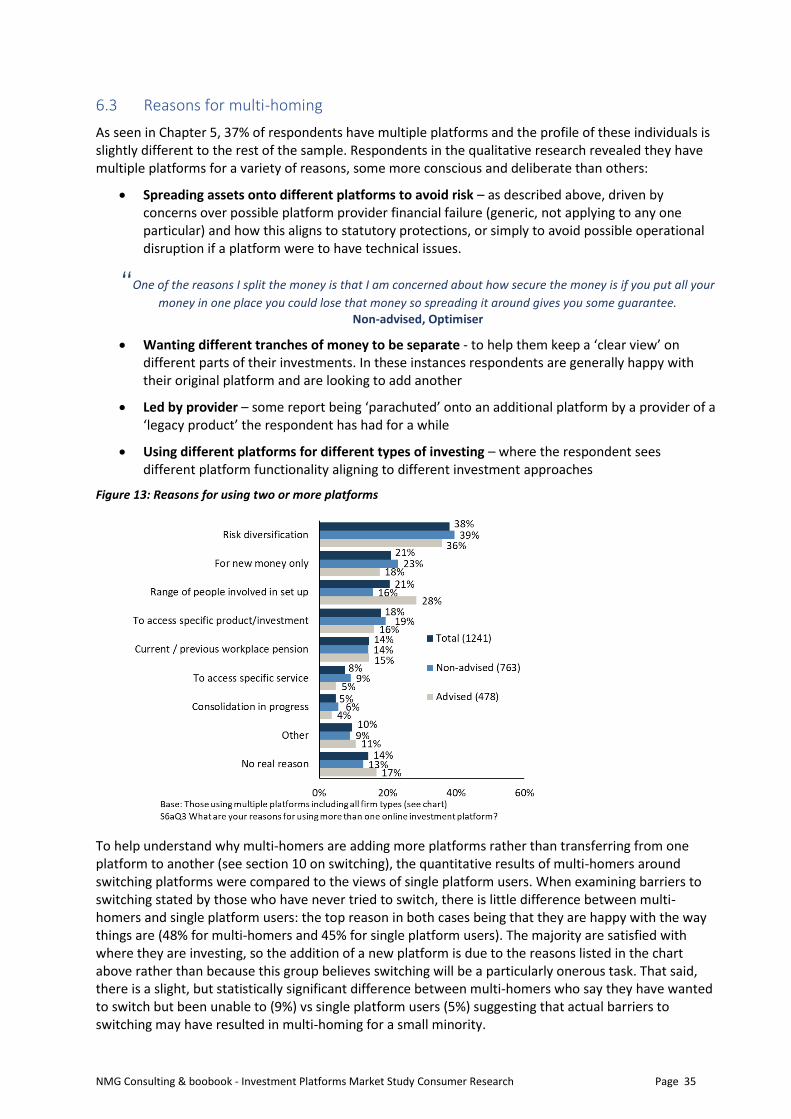
NMG Consulting & boobook - Investment Platforms Market Study Consumer Research Page 35
6.3 Reasons for multi-homing
As seen in Chapter 5, 37% of respondents have multiple platforms and the profile of these individuals is slightly different to the rest of the sample. Respondents in the qualitative research revealed they have multiple platforms for a variety of reasons, some more conscious and deliberate than others:
• Spreading assets onto different platforms to avoid risk – as described above, driven by concerns over possible platform provider financial failure (generic, not applying to any one particular) and how this aligns to statutory protections, or simply to avoid possible operational disruption if a platform were to have technical issues.
“One of the reasons I split the money is that I am concerned about how secure the money is if you put all your
money in one place you could lose that money so spreading it around gives you some guarantee. Non-advised, Optimiser
• Wanting different tranches of money to be separate - to help them keep a ‘clear view’ on different parts of their investments. In these instances respondents are generally happy with their original platform and are looking to add another
• Led by provider – some report being ‘parachuted’ onto an additional platform by a provider of a ‘legacy product’ the respondent has had for a while
• Using different platforms for different types of investing – where the respondent sees different platform functionality aligning to different investment approaches
Figure 13: Reasons for using two or more platforms
To help understand why multi-homers are adding more platforms rather than transferring from one platform to another (see section 10 on switching), the quantitative results of multi-homers around switching platforms were compared to the views of single platform users. When examining barriers to switching stated by those who have never tried to switch, there is little difference between multi-homers and single platform users: the top reason in both cases being that they are happy with the way things are (48% for multi-homers and 45% for single platform users). The majority are satisfied with where they are investing, so the addition of a new platform is due to the reasons listed in the chart above rather than because this group believes switching will be a particularly onerous task. That said, there is a slight, but statistically significant difference between multi-homers who say they have wanted to switch but been unable to (9%) vs single platform users (5%) suggesting that actual barriers to switching may have resulted in multi-homing for a small minority.
NMG Consulting & boobook - Investment Platforms Market Study Consumer Research Page 36
6.4 How respondents choose their platforms
Advised and non-advised respondents choose their platforms in very different ways.
Advised
For advised respondents the evaluation, judgement and recommendation of the platform is very much in the hands of the adviser, although the quantitative research shows that over half cite at least some involvement in the end decision: 42% discussed options with the adviser, but ultimately followed the adviser’s recommendation and 13% believe they made the final choice, from a range of options the adviser presented.
The qualitative research highlights that advised respondents tend to focus on the quality of the advice they are receiving, the product knowledge and expertise they are obtaining and the risk and likely return of the assets they are investing. This investment focus tends to reduce their interest in the platform as something they need to decide upon; it can be something they see as a relatively minor component in the overall arrangement, indeed some are barely aware of it.
“The decision to go with xxx as a platform provider is not a particularly major step, providing they can
provide the admin services which a SIPP requires. Advised, Abdicator
The qualitative research reveals that reliance on and trust in the adviser is extremely high. Advised respondents have faith that their adviser is making good choices on their behalf and don’t see any great need for further validation. Several comment that the reason they choose to pay for advice is so that they don’t have to spend time researching platforms and it would defeat the purpose of using an adviser if they felt the need to ‘check-up’ on them.
“No, I didn’t choose it [the platform]. I don’t think I would have known what to go for.
Advised, Delegator
Some advised respondents report very little consultation by the adviser in the decision. In these instances, advised respondents can have the impression there is no choice available, that the platform is pre-determined. This is variously described as the adviser having a preferred platform or being compelled to use the platform that the firm has chosen – and in these instances the respondent feels they have no option but to go with this. Some advised respondents don’t want to be offered a choice, as this would require work and expertise they think they don’t have.
“I didn’t have a choice but I was happy with his recommendation. It’s an investment platform and in my
opinion as long as it has access to all the biggest range of funds at the lowest cost I am happy. Advised, Optimiser
Others cite a more consultative approach where they are recommended a platform by the adviser with supporting reasons. Platform characteristics that advisers give for their recommendation typically include range of products available and efficiency of charges but may also include factors such as improved servicing and reporting.
“He [Adviser] came back with a couple of options but definitely focusing on xxx because he said it was
easy to monitor. They had a wide variety of investments and you weren’t restricted to a small field under that portfolio. They were keen on price. Advised, Optimiser
Only a few advised respondents report conducting their own research on the platform – amounting to Google searches and high-level credential checking – and where this takes place they may believe they are making the final decision.
“I Googled them and they seemed ok. I place a lot of faith in him. The fees are quite reasonable.
Advised, Abdicator

NMG Consulting & boobook - Investment Platforms Market Study Consumer Research Page 37
Non-advised Non-advised respondents are far more conscious that they are making a deliberate choice when selecting a platform with 84% actively choosing.
The quantitative research shows that researching multiple platforms is prevalent although the average number is low and most typically covers two or three platforms. Controllers are likely to research more platforms than other segments.
Figure 14: Research undertaken when choosing the platform
Respondents who do not carry out any research into platforms before making a decision mostly do so because they are happy to rely on a family/friend’s recommendation. A small proportion feel comfortable enough with the brand behind the platform that they do not feel the need to look at alternatives and a similar proportion were happy with the first platform they found and did not take their search any further. Few say they do not have time to research other platforms.
Figure 15: Reasons research was not undertaken when choosing the platform
However, even amongst non-advised respondents who are actively selecting a platform, the choice of platform can be seen as a ‘second-order’ decision when compared to product and investment choice or overall investment strategy. Some also struggle to untangle the platform, the product (e.g. ISA) and investment (e.g. the fund) seeing this as one decision. Many non-advised respondents also have a
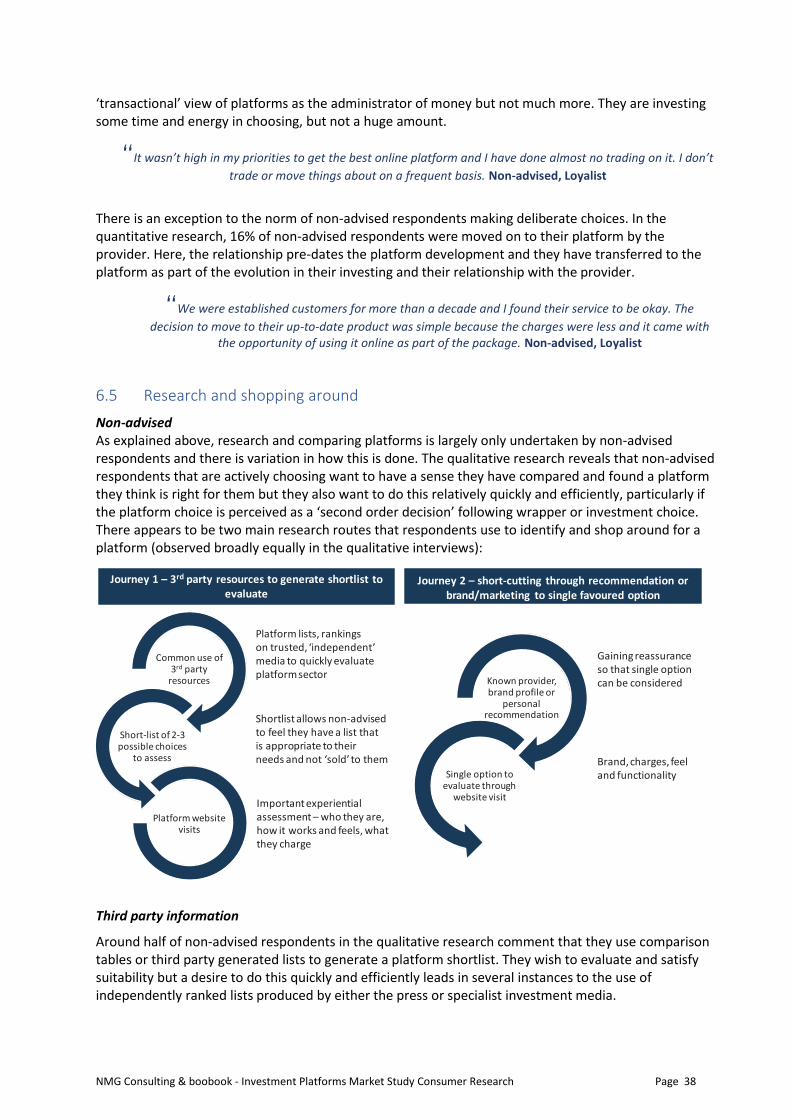
NMG Consulting & boobook - Investment Platforms Market Study Consumer Research Page 38
‘transactional’ view of platforms as the administrator of money but not much more. They are investing some time and energy in choosing, but not a huge amount.
“It wasn’t high in my priorities to get the best online platform and I have done almost no trading on it. I don’t
trade or move things about on a frequent basis. Non-advised, Loyalist
There is an exception to the norm of non-advised respondents making deliberate choices. In the quantitative research, 16% of non-advised respondents were moved on to their platform by the provider. Here, the relationship pre-dates the platform development and they have transferred to the platform as part of the evolution in their investing and their relationship with the provider.
“We were established customers for more than a decade and I found their service to be okay. The
decision to move to their up-to-date product was simple because the charges were less and it came with the opportunity of using it online as part of the package. Non-advised, Loyalist
6.5 Research and shopping around
Non-advised As explained above, research and comparing platforms is largely only undertaken by non-advised respondents and there is variation in how this is done. The qualitative research reveals that non-advised respondents that are actively choosing want to have a sense they have compared and found a platform they think is right for them but they also want to do this relatively quickly and efficiently, particularly if the platform choice is perceived as a ‘second order decision’ following wrapper or investment choice. There appears to be two main research routes that respondents use to identify and shop around for a platform (observed broadly equally in the qualitative interviews):
Third party information
Around half of non-advised respondents in the qualitative research comment that they use comparison tables or third party generated lists to generate a platform shortlist. They wish to evaluate and satisfy suitability but a desire to do this quickly and efficiently leads in several instances to the use of independently ranked lists produced by either the press or specialist investment media.
Common use of 3rd party
resources
Short-list of 2-3 possible choices
to assess
Platform website visits
Platform lists, rankingson trusted, ‘independent’media to quickly evaluateplatform sector
Shortlist allows non-advised to feel they have a list thatis appropriate to their needs and not ‘sold’ to them
Important experiential assessment – who they are, how it works and feels, whatthey charge
Known provider, brand profile or
personal recommendation
Single option to evaluate through
website visit
Gaining reassurance so that single optioncan be considered
Brand, charges, feeland functionality
Journey 1 – 3rd party resources to generate shortlist to evaluate
Journey 2 – short-cutting through recommendation or brand/marketing to single favoured option
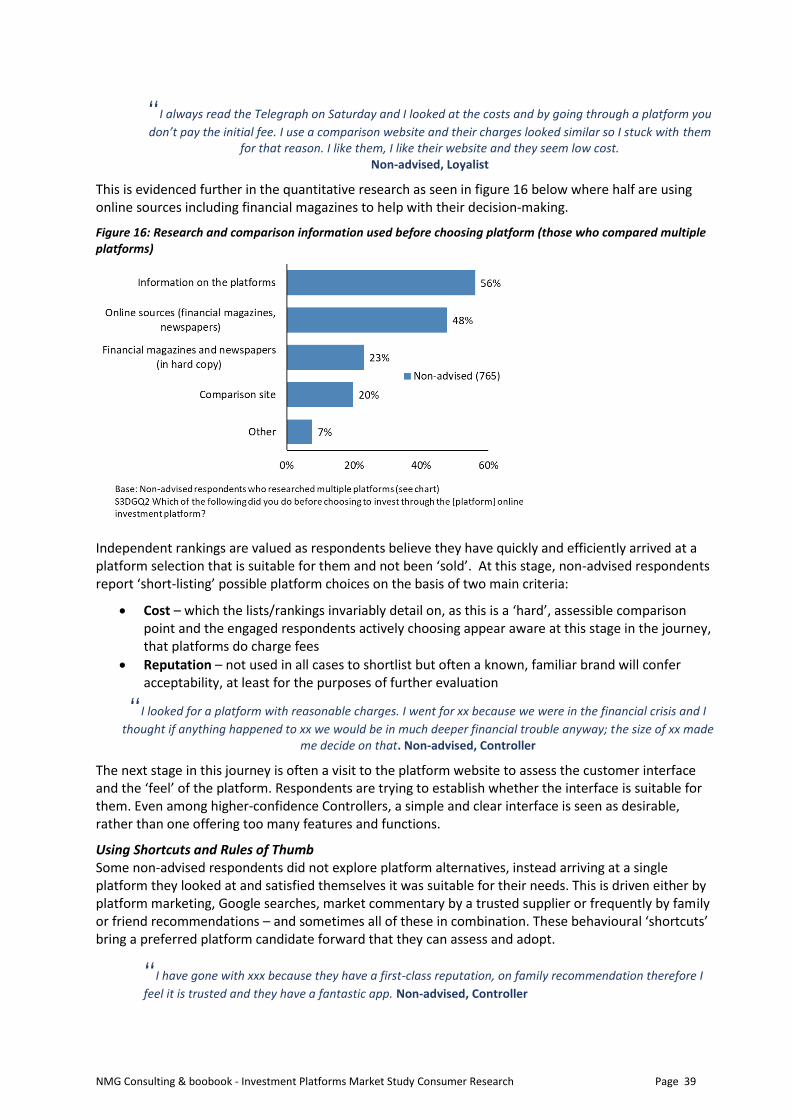
NMG Consulting & boobook - Investment Platforms Market Study Consumer Research Page 39
“I always read the Telegraph on Saturday and I looked at the costs and by going through a platform you
don’t pay the initial fee. I use a comparison website and their charges looked similar so I stuck with them for that reason. I like them, I like their website and they seem low cost.
Non-advised, Loyalist
This is evidenced further in the quantitative research as seen in figure 16 below where half are using online sources including financial magazines to help with their decision-making.
Figure 16: Research and comparison information used before choosing platform (those who compared multiple platforms)
Independent rankings are valued as respondents believe they have quickly and efficiently arrived at a platform selection that is suitable for them and not been ‘sold’. At this stage, non-advised respondents report ‘short-listing’ possible platform choices on the basis of two main criteria:
• Cost – which the lists/rankings invariably detail on, as this is a ‘hard’, assessible comparison point and the engaged respondents actively choosing appear aware at this stage in the journey, that platforms do charge fees
• Reputation – not used in all cases to shortlist but often a known, familiar brand will confer acceptability, at least for the purposes of further evaluation
“I looked for a platform with reasonable charges. I went for xx because we were in the financial crisis and I
thought if anything happened to xx we would be in much deeper financial trouble anyway; the size of xx made me decide on that. Non-advised, Controller
The next stage in this journey is often a visit to the platform website to assess the customer interface and the ‘feel’ of the platform. Respondents are trying to establish whether the interface is suitable for them. Even among higher-confidence Controllers, a simple and clear interface is seen as desirable, rather than one offering too many features and functions.
Using Shortcuts and Rules of Thumb Some non-advised respondents did not explore platform alternatives, instead arriving at a single platform they looked at and satisfied themselves it was suitable for their needs. This is driven either by platform marketing, Google searches, market commentary by a trusted supplier or frequently by family or friend recommendations – and sometimes all of these in combination. These behavioural ‘shortcuts’ bring a preferred platform candidate forward that they can assess and adopt.
“I have gone with xxx because they have a first-class reputation, on family recommendation therefore I
feel it is trusted and they have a fantastic app. Non-advised, Controller
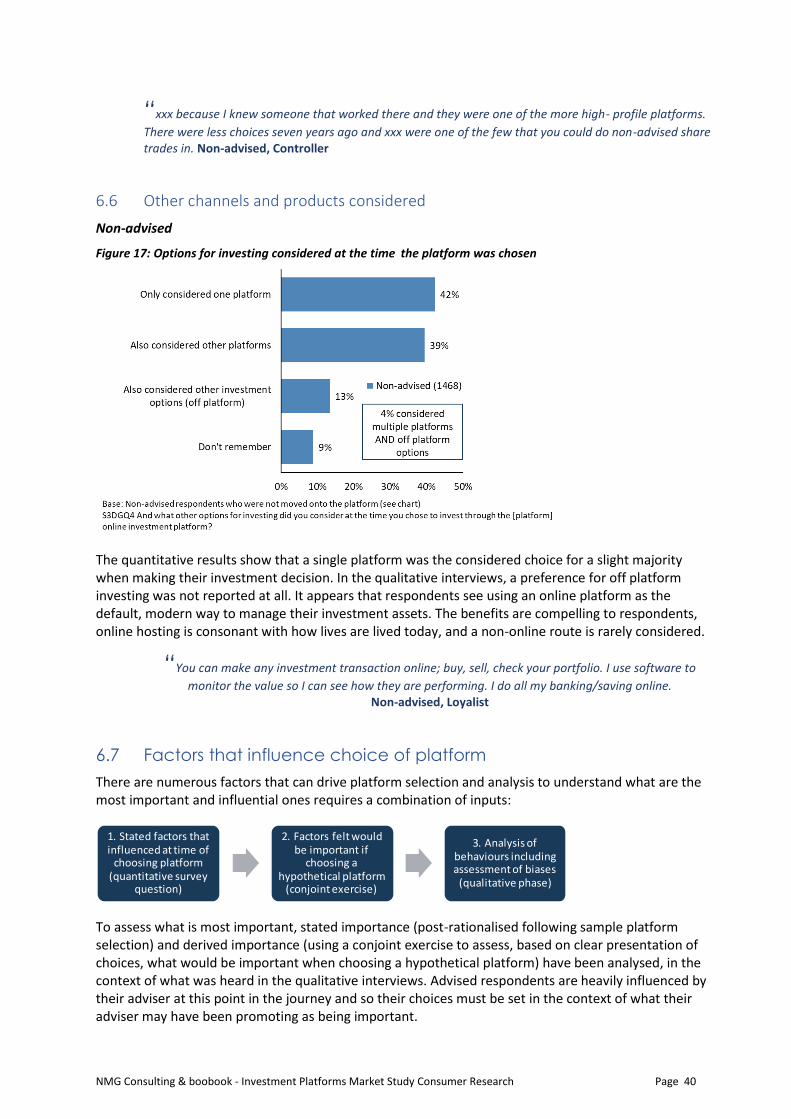
NMG Consulting & boobook - Investment Platforms Market Study Consumer Research Page 40
“xxx because I knew someone that worked there and they were one of the more high- profile platforms.
There were less choices seven years ago and xxx were one of the few that you could do non-advised share trades in. Non-advised, Controller
6.6 Other channels and products considered
Non-advised
Figure 17: Options for investing considered at the time the platform was chosen
The quantitative results show that a single platform was the considered choice for a slight majority when making their investment decision. In the qualitative interviews, a preference for off platform investing was not reported at all. It appears that respondents see using an online platform as the default, modern way to manage their investment assets. The benefits are compelling to respondents, online hosting is consonant with how lives are lived today, and a non-online route is rarely considered.
“You can make any investment transaction online; buy, sell, check your portfolio. I use software to
monitor the value so I can see how they are performing. I do all my banking/saving online. Non-advised, Loyalist
6.7 Factors that influence choice of platform
There are numerous factors that can drive platform selection and analysis to understand what are the most important and influential ones requires a combination of inputs:
To assess what is most important, stated importance (post-rationalised following sample platform selection) and derived importance (using a conjoint exercise to assess, based on clear presentation of choices, what would be important when choosing a hypothetical platform) have been analysed, in the context of what was heard in the qualitative interviews. Advised respondents are heavily influenced by their adviser at this point in the journey and so their choices must be set in the context of what their adviser may have been promoting as being important.
1. Stated factors that influenced at time of
choosing platform (quantitative survey
question)
2. Factors felt would be important if
choosing a hypothetical platform
(conjoint exercise)
3. Analysis of behaviours including assessment of biases
(qualitative phase)
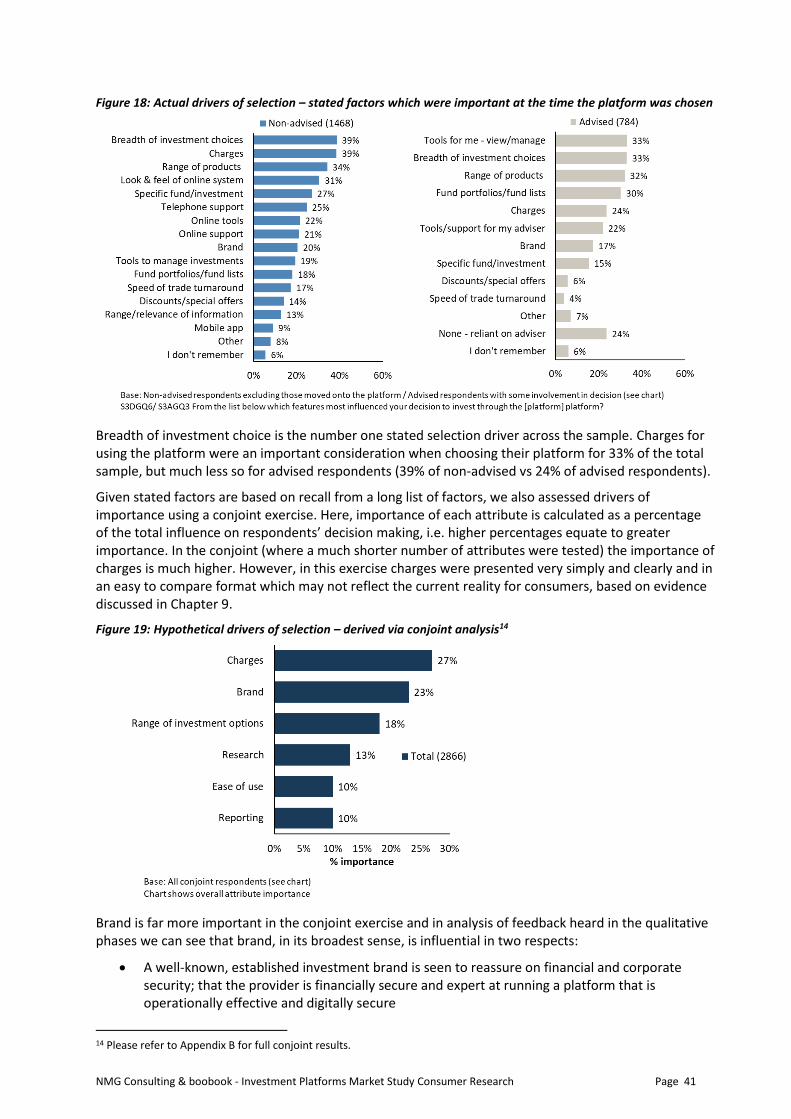
NMG Consulting & boobook - Investment Platforms Market Study Consumer Research Page 41
Figure 18: Actual drivers of selection – stated factors which were important at the time the platform was chosen
Breadth of investment choice is the number one stated selection driver across the sample. Charges for using the platform were an important consideration when choosing their platform for 33% of the total sample, but much less so for advised respondents (39% of non-advised vs 24% of advised respondents).
Given stated factors are based on recall from a long list of factors, we also assessed drivers of importance using a conjoint exercise. Here, importance of each attribute is calculated as a percentage of the total influence on respondents’ decision making, i.e. higher percentages equate to greater importance. In the conjoint (where a much shorter number of attributes were tested) the importance of charges is much higher. However, in this exercise charges were presented very simply and clearly and in an easy to compare format which may not reflect the current reality for consumers, based on evidence discussed in Chapter 9.
Figure 19: Hypothetical drivers of selection – derived via conjoint analysis14
Brand is far more important in the conjoint exercise and in analysis of feedback heard in the qualitative phases we can see that brand, in its broadest sense, is influential in two respects:
• A well-known, established investment brand is seen to reassure on financial and corporate security; that the provider is financially secure and expert at running a platform that is operationally effective and digitally secure
14 Please refer to Appendix B for full conjoint results.
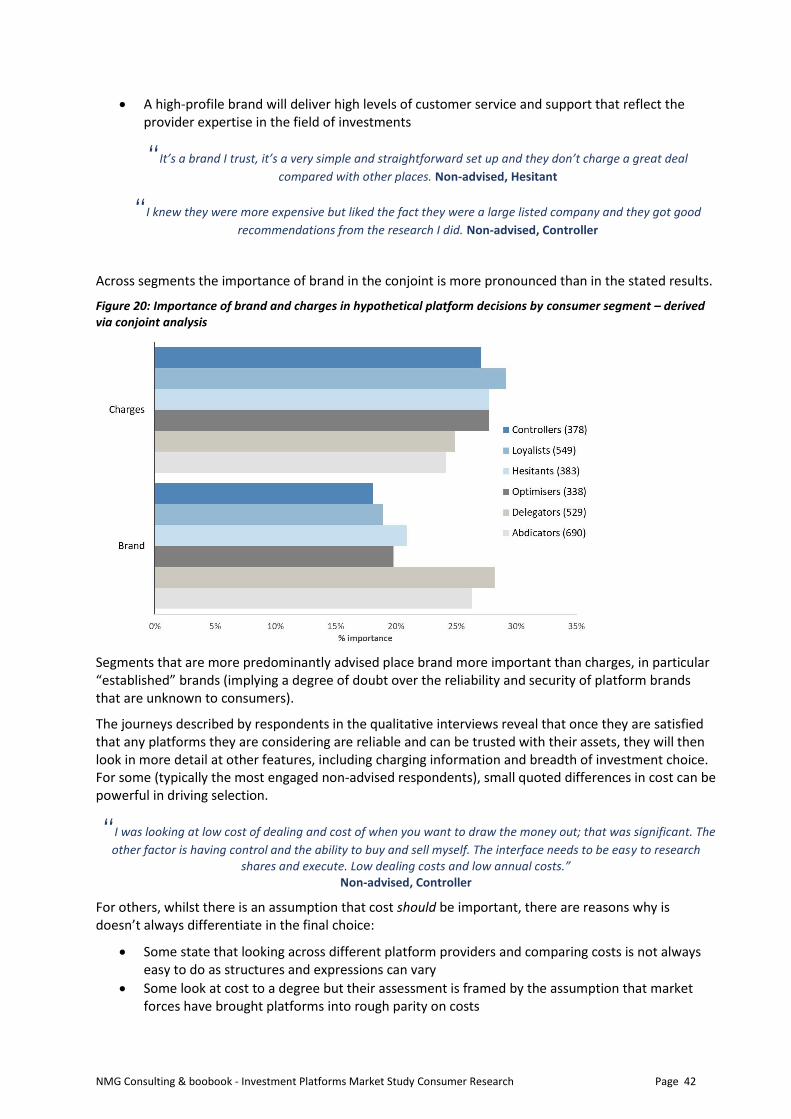
NMG Consulting & boobook - Investment Platforms Market Study Consumer Research Page 42
• A high-profile brand will deliver high levels of customer service and support that reflect the provider expertise in the field of investments
“It’s a brand I trust, it’s a very simple and straightforward set up and they don’t charge a great deal
compared with other places. Non-advised, Hesitant
“I knew they were more expensive but liked the fact they were a large listed company and they got good
recommendations from the research I did. Non-advised, Controller
Across segments the importance of brand in the conjoint is more pronounced than in the stated results.
Figure 20: Importance of brand and charges in hypothetical platform decisions by consumer segment – derived via conjoint analysis
Segments that are more predominantly advised place brand more important than charges, in particular “established” brands (implying a degree of doubt over the reliability and security of platform brands that are unknown to consumers).
The journeys described by respondents in the qualitative interviews reveal that once they are satisfied that any platforms they are considering are reliable and can be trusted with their assets, they will then look in more detail at other features, including charging information and breadth of investment choice. For some (typically the most engaged non-advised respondents), small quoted differences in cost can be powerful in driving selection.
“I was looking at low cost of dealing and cost of when you want to draw the money out; that was significant. The
other factor is having control and the ability to buy and sell myself. The interface needs to be easy to research shares and execute. Low dealing costs and low annual costs.”
Non-advised, Controller
For others, whilst there is an assumption that cost should be important, there are reasons why is doesn’t always differentiate in the final choice:
• Some state that looking across different platform providers and comparing costs is not always easy to do as structures and expressions can vary
• Some look at cost to a degree but their assessment is framed by the assumption that market forces have brought platforms into rough parity on costs
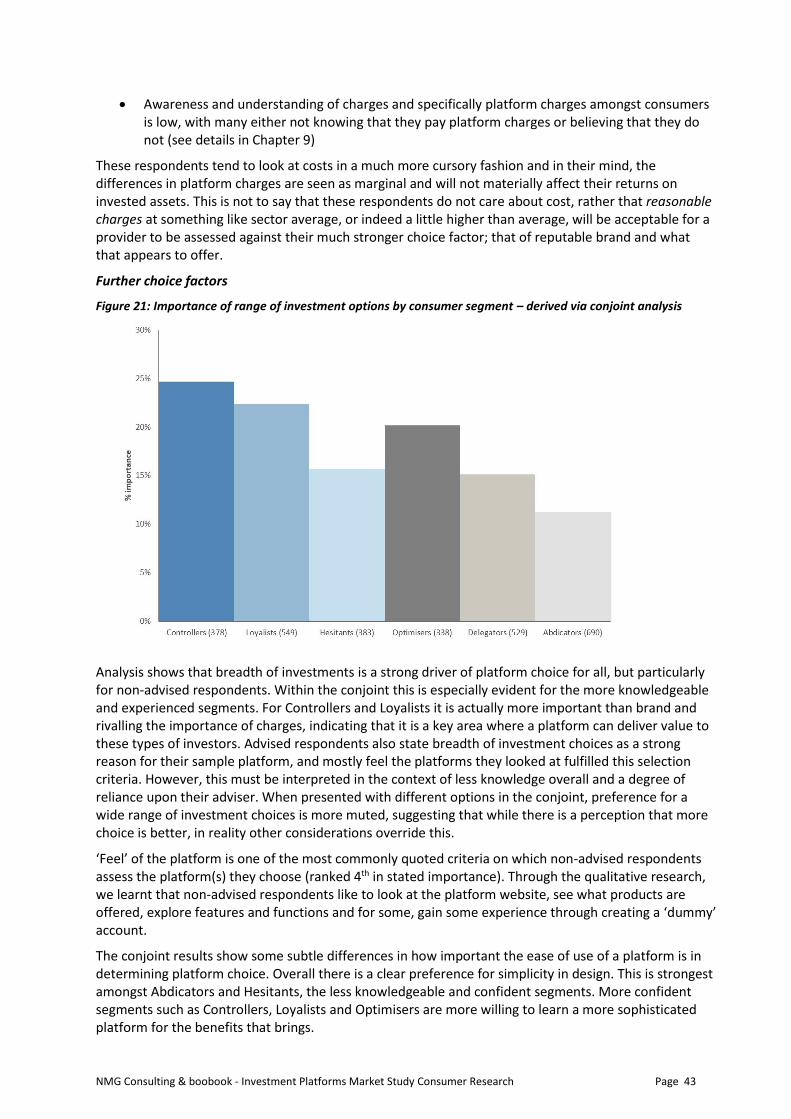
NMG Consulting & boobook - Investment Platforms Market Study Consumer Research Page 43
• Awareness and understanding of charges and specifically platform charges amongst consumers is low, with many either not knowing that they pay platform charges or believing that they do not (see details in Chapter 9)
These respondents tend to look at costs in a much more cursory fashion and in their mind, the differences in platform charges are seen as marginal and will not materially affect their returns on invested assets. This is not to say that these respondents do not care about cost, rather that reasonable charges at something like sector average, or indeed a little higher than average, will be acceptable for a provider to be assessed against their much stronger choice factor; that of reputable brand and what that appears to offer.
Further choice factors
Figure 21: Importance of range of investment options by consumer segment – derived via conjoint analysis
Analysis shows that breadth of investments is a strong driver of platform choice for all, but particularly for non-advised respondents. Within the conjoint this is especially evident for the more knowledgeable and experienced segments. For Controllers and Loyalists it is actually more important than brand and rivalling the importance of charges, indicating that it is a key area where a platform can deliver value to these types of investors. Advised respondents also state breadth of investment choices as a strong reason for their sample platform, and mostly feel the platforms they looked at fulfilled this selection criteria. However, this must be interpreted in the context of less knowledge overall and a degree of reliance upon their adviser. When presented with different options in the conjoint, preference for a wide range of investment choices is more muted, suggesting that while there is a perception that more choice is better, in reality other considerations override this.
‘Feel’ of the platform is one of the most commonly quoted criteria on which non-advised respondents assess the platform(s) they choose (ranked 4th in stated importance). Through the qualitative research, we learnt that non-advised respondents like to look at the platform website, see what products are offered, explore features and functions and for some, gain some experience through creating a ‘dummy’ account.
The conjoint results show some subtle differences in how important the ease of use of a platform is in determining platform choice. Overall there is a clear preference for simplicity in design. This is strongest amongst Abdicators and Hesitants, the less knowledgeable and confident segments. More confident segments such as Controllers, Loyalists and Optimisers are more willing to learn a more sophisticated platform for the benefits that brings.
NMG Consulting & boobook - Investment Platforms Market Study Consumer Research Page 44
7 Choosing Investment Products on Platforms
This chapter explores how respondents choose their investment products on platform and the role and influence that platforms may play in this regard.
7.1 Roles and Responsibilities
There are two fundamental variables that determine extent of involvement in the selection of investment products on platform: relationship with a financial adviser and financial sophistication.
Non-advised
Non-advised respondents recognise they are responsible for their own investment choices and accordingly can be highly active in this process; 72% undertake some type of research (see figure 22 below). However, 22% do not do much research; they are comfortable making the choice without, are acting on a recommendation from family or friends or, for a very small minority, rely on input from an adviser (despite being non-advised in their sample platform selection).
From the qualitative research it is clear that financial confidence and experience impacts the extent of research undertaken.
Advised
Advised respondents rely heavily on their adviser to select their investments on the platform: 78% of advised respondents paid an adviser to choose their investments for them; 6% spoke to an adviser but then decided to arrange the investments themselves; 5% chose their own investments without any input from an adviser and the remaining 12% could not recall.
“I am happy to pay someone that is brighter than me and has done much more research and say I am happy to
take a high risk as I probably won’t ever spend this money so you do it for me as you have access to that data. Advised, Optimiser
In the qualitative research those accessing professional expertise in this area believe investment selection is a key part of the advice service and responsibility lies firmly with the adviser who is trusted to make appropriate decisions based on the individual’s circumstances. Amongst advised respondents, involvement can be minimal and reliance on the adviser to make appropriate choices is very high. This is evident across all predominantly advised segments interviewed although Delegators typically demonstrate some involvement in the fund choice and may complete some independent research on recommended funds or managers.
Key Findings of this Chapter
• The vast majority of advised respondents are not choosing investment products; they rely heavily on their adviser to complete this for them
• Three quarters of non-advised respondents are conducting research and actively choosing their investment products; around two thirds pick funds (rather than rely on platform ‘ready-made’ solutions) and demonstrate a high degree of involvement in this element of the process
• Platform-based content complements the research and decision-making process for actively choosing non-advised respondents but is not relied on as many prefer the independence and depth of third party sources to assist them in their choices
• Around one third of non-advised respondents are using model portfolios or filtered lists of funds – they tend to be the less experienced, younger and less affluent investors and are far more reliant on platform-based content to support them
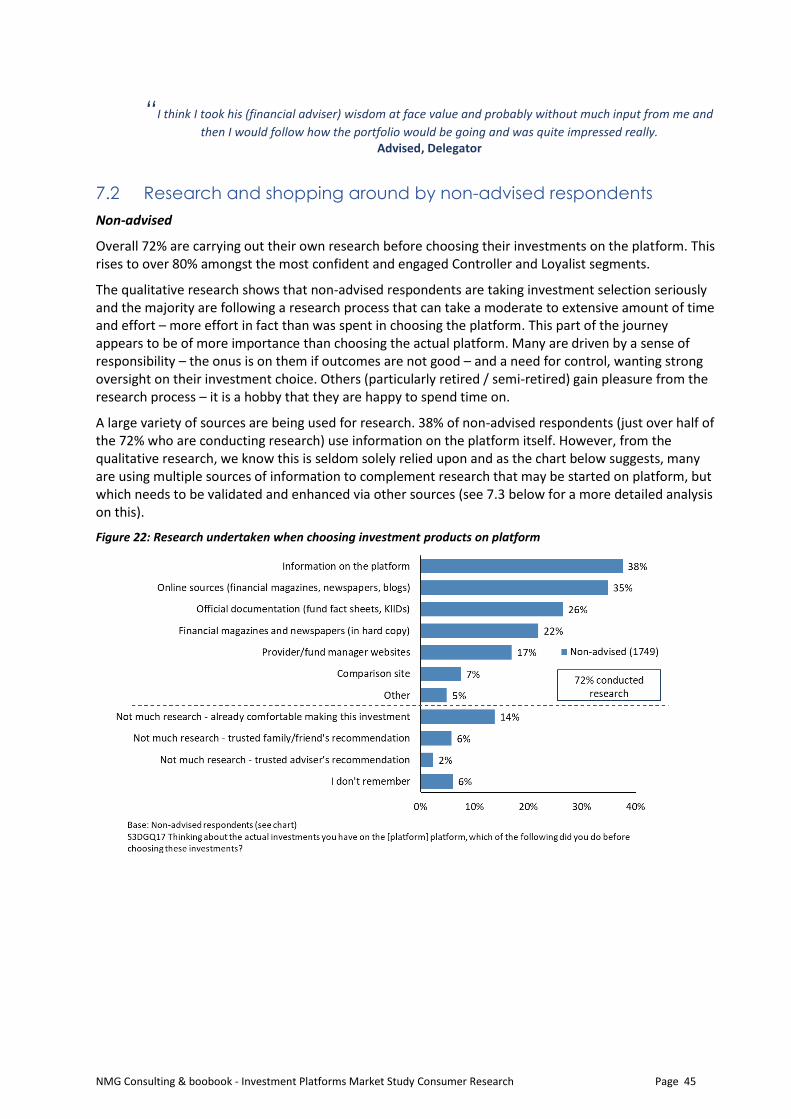
NMG Consulting & boobook - Investment Platforms Market Study Consumer Research Page 45
“I think I took his (financial adviser) wisdom at face value and probably without much input from me and
then I would follow how the portfolio would be going and was quite impressed really. Advised, Delegator
7.2 Research and shopping around by non-advised respondents
Non-advised
Overall 72% are carrying out their own research before choosing their investments on the platform. This rises to over 80% amongst the most confident and engaged Controller and Loyalist segments.
The qualitative research shows that non-advised respondents are taking investment selection seriously and the majority are following a research process that can take a moderate to extensive amount of time and effort – more effort in fact than was spent in choosing the platform. This part of the journey appears to be of more importance than choosing the actual platform. Many are driven by a sense of responsibility – the onus is on them if outcomes are not good – and a need for control, wanting strong oversight on their investment choice. Others (particularly retired / semi-retired) gain pleasure from the research process – it is a hobby that they are happy to spend time on.
A large variety of sources are being used for research. 38% of non-advised respondents (just over half of the 72% who are conducting research) use information on the platform itself. However, from the qualitative research, we know this is seldom solely relied upon and as the chart below suggests, many are using multiple sources of information to complement research that may be started on platform, but which needs to be validated and enhanced via other sources (see 7.3 below for a more detailed analysis on this).
Figure 22: Research undertaken when choosing investment products on platform
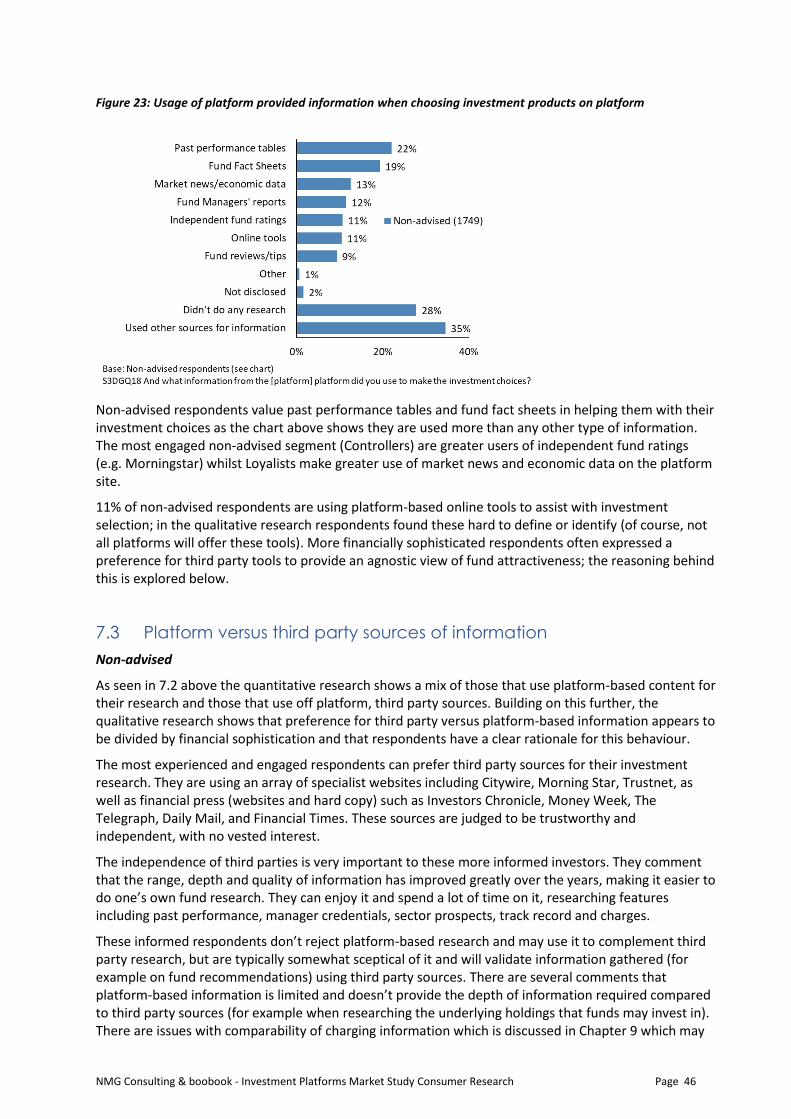
NMG Consulting & boobook - Investment Platforms Market Study Consumer Research Page 46
Figure 23: Usage of platform provided information when choosing investment products on platform
Non-advised respondents value past performance tables and fund fact sheets in helping them with their investment choices as the chart above shows they are used more than any other type of information. The most engaged non-advised segment (Controllers) are greater users of independent fund ratings (e.g. Morningstar) whilst Loyalists make greater use of market news and economic data on the platform site.
11% of non-advised respondents are using platform-based online tools to assist with investment selection; in the qualitative research respondents found these hard to define or identify (of course, not all platforms will offer these tools). More financially sophisticated respondents often expressed a preference for third party tools to provide an agnostic view of fund attractiveness; the reasoning behind this is explored below.
7.3 Platform versus third party sources of information
Non-advised
As seen in 7.2 above the quantitative research shows a mix of those that use platform-based content for their research and those that use off platform, third party sources. Building on this further, the qualitative research shows that preference for third party versus platform-based information appears to be divided by financial sophistication and that respondents have a clear rationale for this behaviour.
The most experienced and engaged respondents can prefer third party sources for their investment research. They are using an array of specialist websites including Citywire, Morning Star, Trustnet, as well as financial press (websites and hard copy) such as Investors Chronicle, Money Week, The Telegraph, Daily Mail, and Financial Times. These sources are judged to be trustworthy and independent, with no vested interest.
The independence of third parties is very important to these more informed investors. They comment that the range, depth and quality of information has improved greatly over the years, making it easier to do one’s own fund research. They can enjoy it and spend a lot of time on it, researching features including past performance, manager credentials, sector prospects, track record and charges.
These informed respondents don’t reject platform-based research and may use it to complement third party research, but are typically somewhat sceptical of it and will validate information gathered (for example on fund recommendations) using third party sources. There are several comments that platform-based information is limited and doesn’t provide the depth of information required compared to third party sources (for example when researching the underlying holdings that funds may invest in). There are issues with comparability of charging information which is discussed in Chapter 9 which may
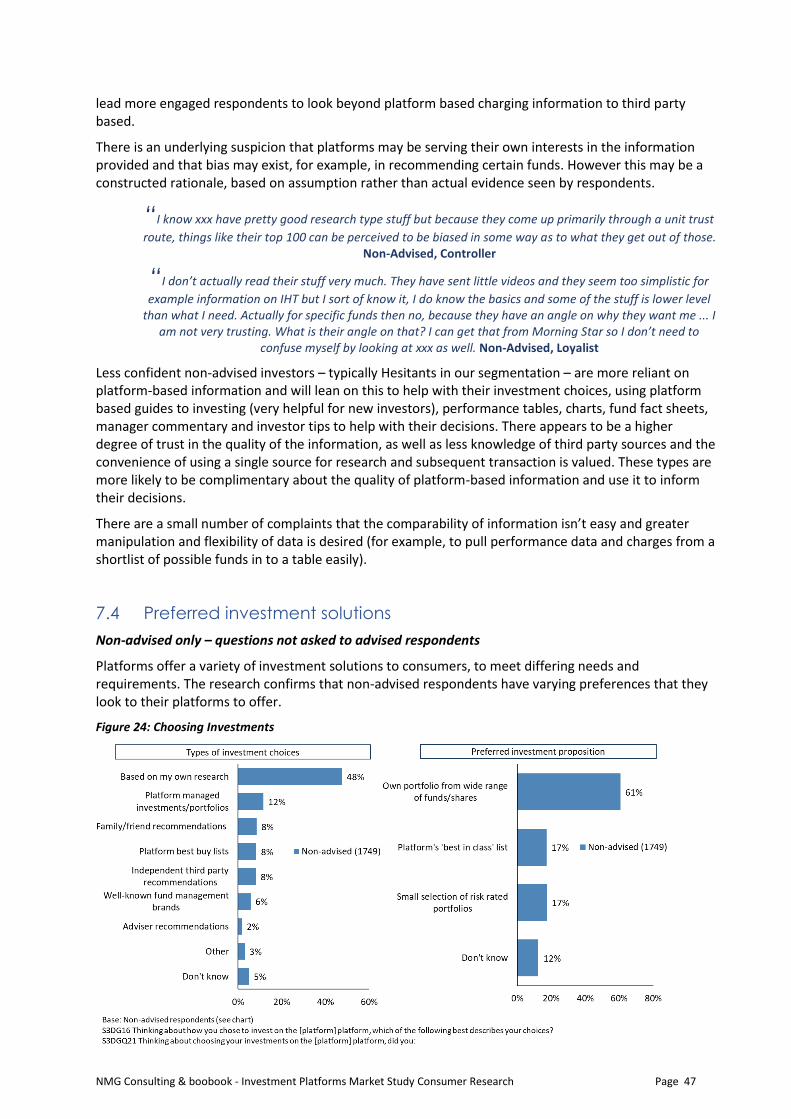
NMG Consulting & boobook - Investment Platforms Market Study Consumer Research Page 47
lead more engaged respondents to look beyond platform based charging information to third party based.
There is an underlying suspicion that platforms may be serving their own interests in the information provided and that bias may exist, for example, in recommending certain funds. However this may be a constructed rationale, based on assumption rather than actual evidence seen by respondents.
“I know xxx have pretty good research type stuff but because they come up primarily through a unit trust
route, things like their top 100 can be perceived to be biased in some way as to what they get out of those. Non-Advised, Controller
“I don’t actually read their stuff very much. They have sent little videos and they seem too simplistic for
example information on IHT but I sort of know it, I do know the basics and some of the stuff is lower level than what I need. Actually for specific funds then no, because they have an angle on why they want me ... I
am not very trusting. What is their angle on that? I can get that from Morning Star so I don’t need to confuse myself by looking at xxx as well. Non-Advised, Loyalist
Less confident non-advised investors – typically Hesitants in our segmentation – are more reliant on platform-based information and will lean on this to help with their investment choices, using platform based guides to investing (very helpful for new investors), performance tables, charts, fund fact sheets, manager commentary and investor tips to help with their decisions. There appears to be a higher degree of trust in the quality of the information, as well as less knowledge of third party sources and the convenience of using a single source for research and subsequent transaction is valued. These types are more likely to be complimentary about the quality of platform-based information and use it to inform their decisions.
There are a small number of complaints that the comparability of information isn’t easy and greater manipulation and flexibility of data is desired (for example, to pull performance data and charges from a shortlist of possible funds in to a table easily).
7.4 Preferred investment solutions
Non-advised only – questions not asked to advised respondents
Platforms offer a variety of investment solutions to consumers, to meet differing needs and requirements. The research confirms that non-advised respondents have varying preferences that they look to their platforms to offer.
Figure 24: Choosing Investments
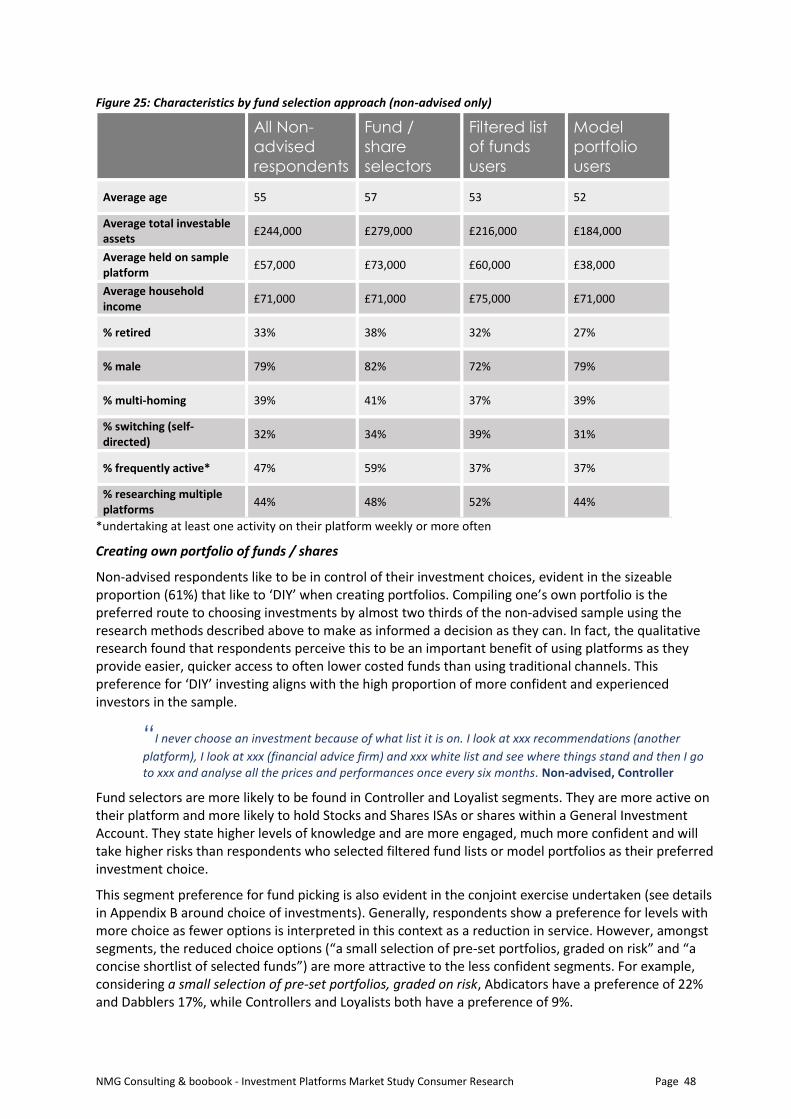
NMG Consulting & boobook - Investment Platforms Market Study Consumer Research Page 48
Figure 25: Characteristics by fund selection approach (non-advised only)
All Non-
advised
respondents
Fund /
share
selectors
Filtered list
of funds
users
Model
portfolio
users
Average age 55 57 53 52
Average total investable assets
£244,000 £279,000 £216,000 £184,000
Average held on sample platform
£57,000 £73,000 £60,000 £38,000
Average household income
£71,000 £71,000 £75,000 £71,000
% retired 33% 38% 32% 27%
% male 79% 82% 72% 79%
% multi-homing 39% 41% 37% 39%
% switching (self-directed)
32% 34% 39% 31%
% frequently active* 47% 59% 37% 37%
% researching multiple platforms
44% 48% 52% 44%
*undertaking at least one activity on their platform weekly or more often
Creating own portfolio of funds / shares
Non-advised respondents like to be in control of their investment choices, evident in the sizeable proportion (61%) that like to ‘DIY’ when creating portfolios. Compiling one’s own portfolio is the preferred route to choosing investments by almost two thirds of the non-advised sample using the research methods described above to make as informed a decision as they can. In fact, the qualitative research found that respondents perceive this to be an important benefit of using platforms as they provide easier, quicker access to often lower costed funds than using traditional channels. This preference for ‘DIY’ investing aligns with the high proportion of more confident and experienced investors in the sample.
“I never choose an investment because of what list it is on. I look at xxx recommendations (another
platform), I look at xxx (financial advice firm) and xxx white list and see where things stand and then I go to xxx and analyse all the prices and performances once every six months. Non-advised, Controller
Fund selectors are more likely to be found in Controller and Loyalist segments. They are more active on their platform and more likely to hold Stocks and Shares ISAs or shares within a General Investment Account. They state higher levels of knowledge and are more engaged, much more confident and will take higher risks than respondents who selected filtered fund lists or model portfolios as their preferred investment choice.
This segment preference for fund picking is also evident in the conjoint exercise undertaken (see details in Appendix B around choice of investments). Generally, respondents show a preference for levels with more choice as fewer options is interpreted in this context as a reduction in service. However, amongst segments, the reduced choice options (“a small selection of pre-set portfolios, graded on risk” and “a concise shortlist of selected funds”) are more attractive to the less confident segments. For example, considering a small selection of pre-set portfolios, graded on risk, Abdicators have a preference of 22% and Dabblers 17%, while Controllers and Loyalists both have a preference of 9%.
NMG Consulting & boobook - Investment Platforms Market Study Consumer Research Page 49
The qualitative research found that individual funds and shares will be chosen based on a number of criteria that focus on past performance, fund charges, sector trends, manager credentials, risk rating and third party ‘star’ ratings. Shares may be picked based on news or commentary in the press.
“The funds I found by picking established funds with good reviews – you go through these ratings – I
found that to be quite successful. Non-advised, Loyalist
Recommendations from friends, family or trusted others and usage of other common shortcuts to fund selection (see below) are less common in this sample – again a reflection of the type of consumers using the non-advised platforms in the survey.
Use of filtered lists of funds
There are highly mixed views on the value of filtered lists of funds and only a small proportion (17%) of respondents state they are using them. These are spread across the non-advised segments but tend to be a little younger than fund pickers (average age 53) and are more likely to be female than the overall non-advised group (26% vs 19%). With lower average amount invested on the platform (£60k) this suggests a slightly less experienced cohort are using these types of fund lists. However this group are more likely to conduct research into several platforms during their platform selection.
The qualitative research confirms the less experienced profile here. It also reveals that non-advised respondents may use filtered fund lists as part of their research process. ‘Best buy’ or ‘top 150’ funds can provide a shortcut to identifying interesting investment opportunities but may not be relied on simply due to being on this list. Respondents using these lists describe them as a useful start point from which they will then conduct their own independent research. For this purpose, and where used, they are perceived to be helpful. They are also used as a performance benchmark against which more sophisticated respondents may compare their own independent investment selection.
A small number refer to the comfort of ‘going with the crowd’ – a good example of ‘herd behaviour’ that can influence investment decisions. Less experienced respondents (as profiled in the quantitative analysis above) may rely on these lists to pick funds, citing that it saves time, and provides reassurance that someone else has done the research, and there is an element of trust that the platform will review and monitor the selection on behalf of the customer.
“They send these newsletters and brochures and my funds to be honest are based on their
recommendations. They have the top 150 so I looked at them. Non-advised, Optimiser
There are however some concerns about how these fund lists are designed. A minority wonder about the relationship between the funds and the platform and suspect that funds are chosen to benefit the platform (although none can evidence this in any way – it is purely speculation). It is however enough to ensure that these lists are not actively used. A few are concerned that following the crowd (e.g. most popular funds) is a poor basis for fund selection.
“Why are they promoting them? I presume there is something in it for them.
Non-advised, Controller
“I am always sceptical of top 150 or equivalent from other platforms because there is always going to be
some bias. I would rather go to someone who is producing independent information”. Non-advised, Controller
There may be some under-representation of usage of these types of lists in the research amongst experienced respondents who may not want to admit to using such shortcuts and amongst less knowledgeable respondents who may not be aware that their platform is promoting a more limited range of funds compared to the wide universe that is available.
Use of model portfolios
Relatively few non-advised respondents in the sample (17%) are using model portfolios on platforms, given the preference for fund picking (although note that not all platforms in the study may offer model

NMG Consulting & boobook - Investment Platforms Market Study Consumer Research Page 50
portfolios). Users of model portfolios are more likely to be found amongst less experienced Hesitants. They are younger than fund pickers, less affluent and unsurprisingly profile at the lower risk, lower confidence end of the spectrum. Whilst model portfolio users are less active than fund pickers, they are equally likely to switch platforms or use multiple platforms. However, they also have lower satisfaction levels with the activities they have carried out on the platform, compared with other non-advised respondents. Knowledge of charges is similar to those using filtered lists of funds, but lower than fund pickers’ knowledge. This group is less likely to conduct research before selecting their platform however this is partly because a larger proportion (19%) were moved on to the platform by their provider and therefore did not actively choose the platform. Model portfolio users are more likely to hold a pension on the platform and less likely to hold shares or funds.
The qualitative research highlights there are some specific objections to using model portfolios which explains the lower incidence in the overall sample:
• Lack of flexibility – no choice of funds or ability to switch funds
• Pigeon-holed – may be put in to a risk profile or asset allocation that doesn’t actually suit your needs
• Lack of enjoyment – given the pleasure derived from fund picking amongst the hobbyists in the sample, model portfolios are seen to remove that element from investing
• Distance from the investment – sense that as an investor you become too distant from the activity, buying a product rather than an experience
• Price – perception that an additional layer of management charge will be applied
• Clarity – not clear enough how underlying funds within the portfolio are chosen, with some suspicion of vested interests of those constructing them
• Lack of need – perception that as an experienced investor, one could do just as well as those in charge of the model portfolios
“They have several packaged funds which I see as an extra layer of admin and charges so no thanks!
Non-advised, Controller
In the qualitative interviews we saw reasonably low levels of understanding of these concepts, which may explain why only 17% of the non-advised sample state they are invested in one.
A few examples arose where model portfolios are being used, typically by less experienced investors or where a different strategy on a second platform is being used to diversify from the main strategy on the main platform. Smaller amounts appear to be invested this way, compared to bespoke portfolios which aligns with the quantitative profiling above.
Perceived advantages of using model portfolios include:
• Quick and efficient way to invest
• Easy access to investment expertise
• Simple way to invest
• Delegate responsibility for investment choice
• Set risk parameters to match attitude to risk
• Low maintenance
“Because I have chosen my funds I might look at them every 6 months. The whole point of having
managed funds is that I don’t have to keep checking them Non-advised, Hesitant
On this basis, model portfolios are seen to be helpful for those less knowledgeable and for those who are time pressured. They are also seen as a good fit for those that want to invest long term with low involvement or engagement in their portfolio (on the assumption that someone else is doing the monitoring of the funds). Only a very small number can remember going through a risk profiling exercise before selecting their model portfolio (this may be a recall issue).

NMG Consulting & boobook - Investment Platforms Market Study Consumer Research Page 51
“There were three different arrangements, high, medium and low risk and I chose the middle one… it was
xxx pre-packaged, easy investment management as not having to make many decisions Non-advised, Hesitant
Referring back to the role that model portfolios and filtered lists of funds play in influencing platform choices, they appear much further down the list of factors for non-advised respondents when choosing their platform. They remain low in the list of things which are important in the way they currently use the platform. It therefore appears logical that usage is relatively low in the sample.
Advised
When advised respondents were asked more in-depth questions about model portfolios in the qualitative research, it is apparent there is lower familiarity and recognition of the concept (compared to non-advised respondents), with the vast majority assuming advisers are picking funds and creating bespoke portfolios. When probed, respondents are not clear whether they are in a model portfolio (created by the platform or advice firm), a packaged fund solution (e.g. a multi manager fund) or a bespoke portfolio created by their adviser. They are outsourcing this to their adviser and have no great need or desire for further clarity on this. They are more focused on the investment return than how the portfolio is designed. As such they have few opinions on the merits or otherwise of model portfolios.
NMG Consulting & boobook - Investment Platforms Market Study Consumer Research Page 52
8 How Consumers Use Platforms
This chapter looks at how respondents are using their platform on an on-going basis and explores key activities undertaken and features used
8.1 Activities undertaken on platforms
Respondents conduct a relatively low number of activities on their platforms on an ongoing basis. Activity level and type varies according to channel and level of engagement but the most common tasks focus on checking information, in particular the value and performance of investments.
There is a sub-group of non-advised respondents who are frequently active (undertaking at least one activity on their platform weekly or more often) and they display particular characteristics in comparison to the rest of the non-advised group:
• More likely to be in the Controller and Loyalist segments
• More likely to be male
• Higher invested amount on the sample platform
• Attitudinally more knowledgeable, engaged, comfortable investing, with a higher risk appetite
• More likely to have switched platforms in the last three years
• More involved in the choice of platform
• Build their own portfolio of funds
• More likely to know they pay charges and can estimate charges paid
Amongst advised respondents, those who are more active (undertaking activities themselves rather than leaving it to their adviser) are more likely to be in the Optimiser segment, are attitudinally more knowledgeable, engaged, comfortable investing, and have a higher risk appetite. This more active advised group are more likely to know they pay charges and can estimate charges paid.
Non-advised
Almost all non-advised respondents check the value and the performance of their investments on the platform at least once a year. 64% are looking at information, blogs or research for ideas on where to invest at least once a year and a similar proportion are making new investments. Making a new investment is the most common transactional activity. Incidence of switching funds or shares is lower with just 32% doing this annually or more often.
Key Findings of this Chapter
• Ongoing engagement with platforms is centred largely on checking the value and performance of invested assets; this is the key ongoing function of the platform for the majority across both advised and non-advised respondents who will do this at least once a year
• A sizeable minority (42%) of non-advised respondents are highly active in terms of checking information, e.g. checking values at least weekly.
• Most advised respondents do not undertake additional functions on the platform, delegating this to advisers
• Tools (beyond those needed for monitoring values and performance) are not used a great deal by any respondents – advised respondents rely on their advisers and the minority of non-advised respondents that use tools tend to prefer to use third parties
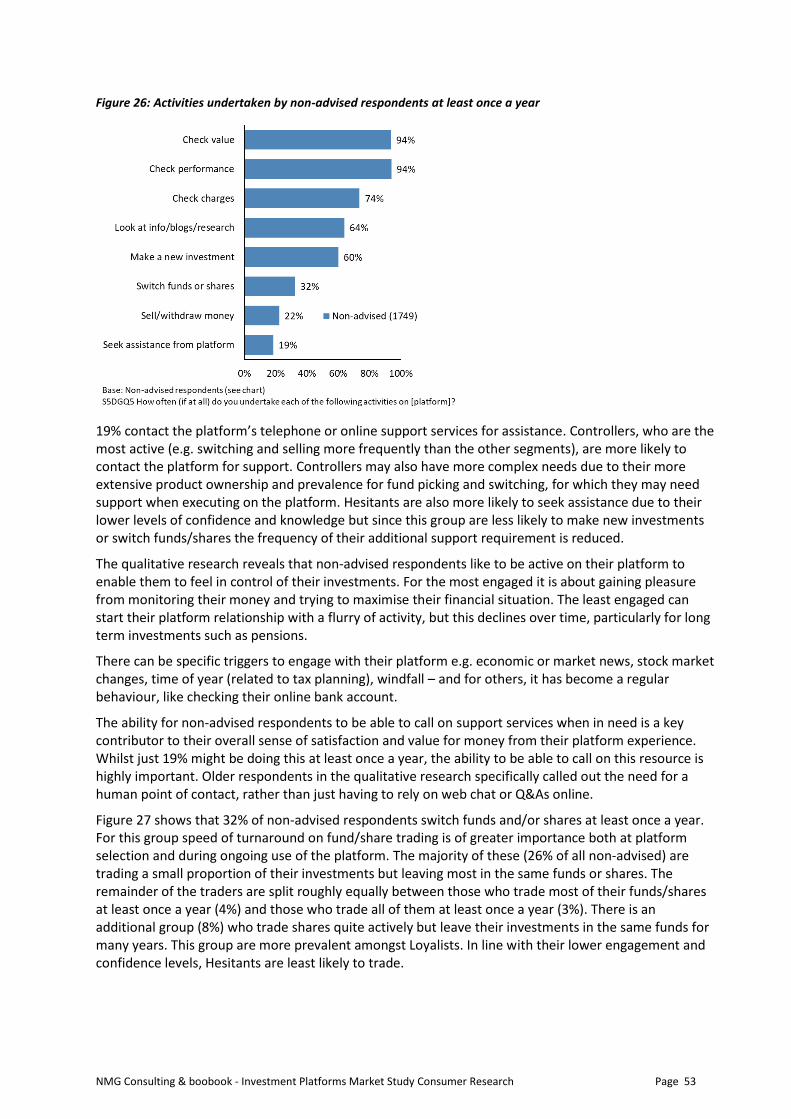
NMG Consulting & boobook - Investment Platforms Market Study Consumer Research Page 53
Figure 26: Activities undertaken by non-advised respondents at least once a year
19% contact the platform’s telephone or online support services for assistance. Controllers, who are the most active (e.g. switching and selling more frequently than the other segments), are more likely to contact the platform for support. Controllers may also have more complex needs due to their more extensive product ownership and prevalence for fund picking and switching, for which they may need support when executing on the platform. Hesitants are also more likely to seek assistance due to their lower levels of confidence and knowledge but since this group are less likely to make new investments or switch funds/shares the frequency of their additional support requirement is reduced.
The qualitative research reveals that non-advised respondents like to be active on their platform to enable them to feel in control of their investments. For the most engaged it is about gaining pleasure from monitoring their money and trying to maximise their financial situation. The least engaged can start their platform relationship with a flurry of activity, but this declines over time, particularly for long term investments such as pensions.
There can be specific triggers to engage with their platform e.g. economic or market news, stock market changes, time of year (related to tax planning), windfall – and for others, it has become a regular behaviour, like checking their online bank account.
The ability for non-advised respondents to be able to call on support services when in need is a key contributor to their overall sense of satisfaction and value for money from their platform experience. Whilst just 19% might be doing this at least once a year, the ability to be able to call on this resource is highly important. Older respondents in the qualitative research specifically called out the need for a human point of contact, rather than just having to rely on web chat or Q&As online.
Figure 27 shows that 32% of non-advised respondents switch funds and/or shares at least once a year. For this group speed of turnaround on fund/share trading is of greater importance both at platform selection and during ongoing use of the platform. The majority of these (26% of all non-advised) are trading a small proportion of their investments but leaving most in the same funds or shares. The remainder of the traders are split roughly equally between those who trade most of their funds/shares at least once a year (4%) and those who trade all of them at least once a year (3%). There is an additional group (8%) who trade shares quite actively but leave their investments in the same funds for many years. This group are more prevalent amongst Loyalists. In line with their lower engagement and confidence levels, Hesitants are least likely to trade.
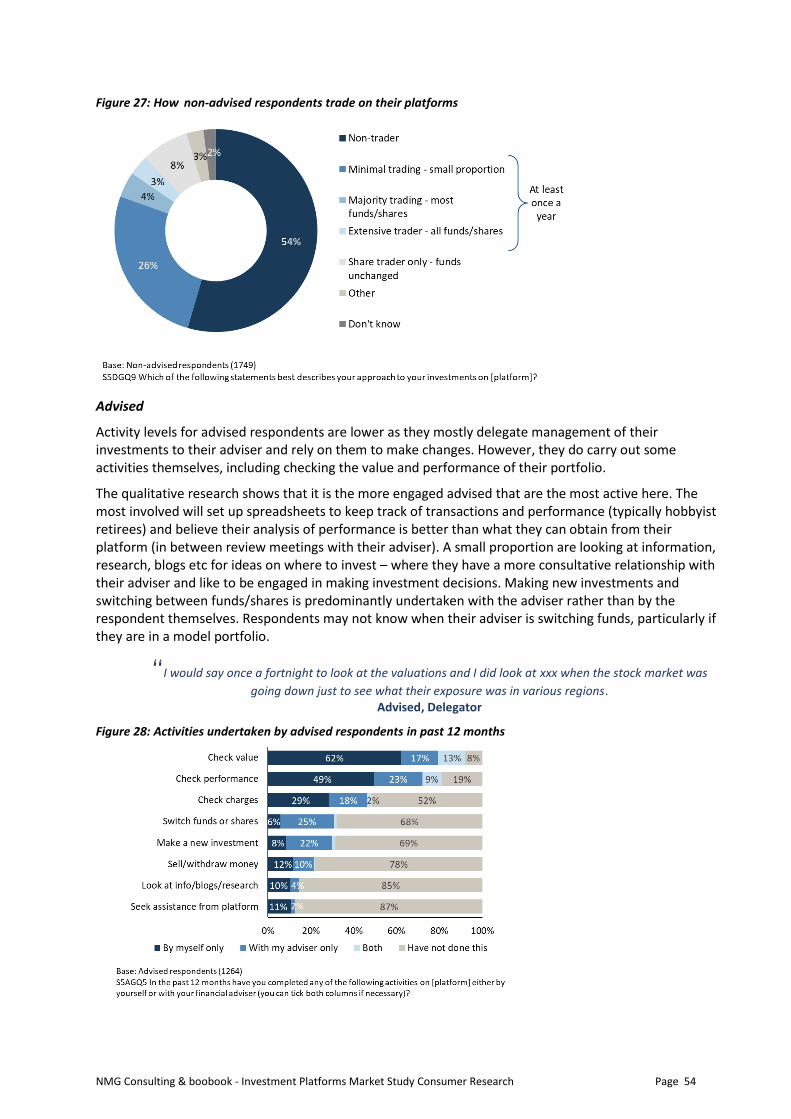
NMG Consulting & boobook - Investment Platforms Market Study Consumer Research Page 54
Figure 27: How non-advised respondents trade on their platforms
Advised
Activity levels for advised respondents are lower as they mostly delegate management of their investments to their adviser and rely on them to make changes. However, they do carry out some activities themselves, including checking the value and performance of their portfolio.
The qualitative research shows that it is the more engaged advised that are the most active here. The most involved will set up spreadsheets to keep track of transactions and performance (typically hobbyist retirees) and believe their analysis of performance is better than what they can obtain from their platform (in between review meetings with their adviser). A small proportion are looking at information, research, blogs etc for ideas on where to invest – where they have a more consultative relationship with their adviser and like to be engaged in making investment decisions. Making new investments and switching between funds/shares is predominantly undertaken with the adviser rather than by the respondent themselves. Respondents may not know when their adviser is switching funds, particularly if they are in a model portfolio.
“I would say once a fortnight to look at the valuations and I did look at xxx when the stock market was
going down just to see what their exposure was in various regions. Advised, Delegator
Figure 28: Activities undertaken by advised respondents in past 12 months
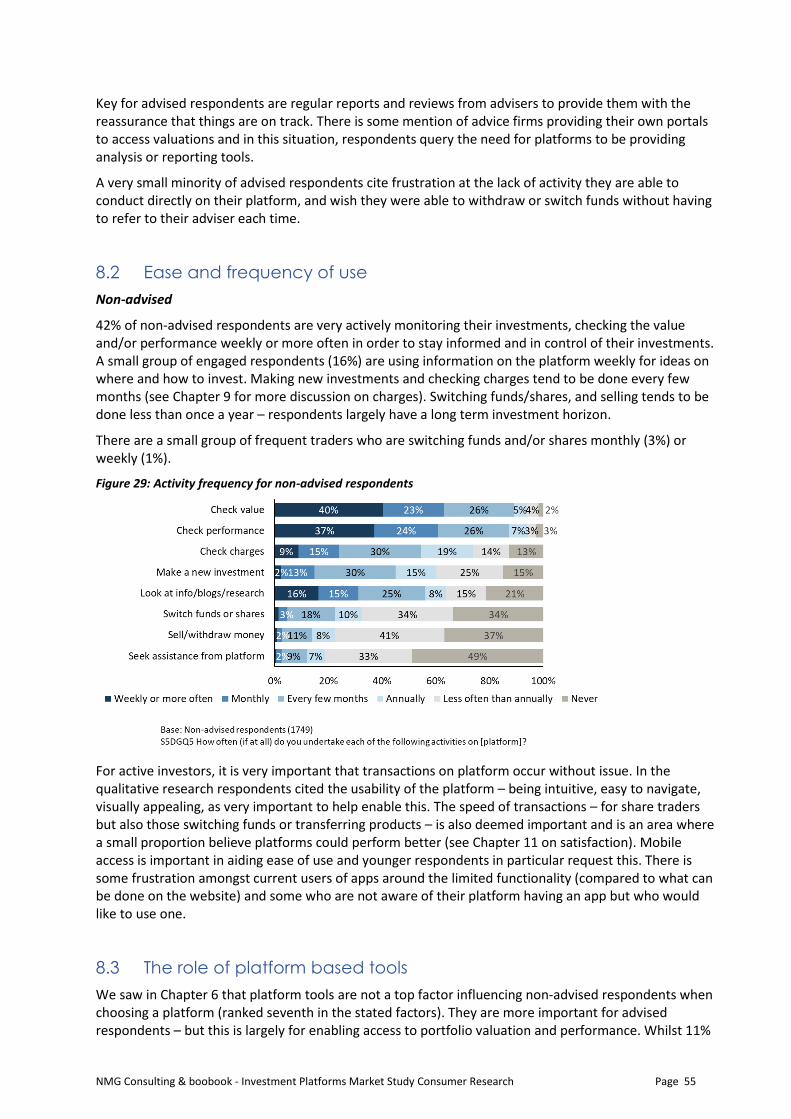
NMG Consulting & boobook - Investment Platforms Market Study Consumer Research Page 55
Key for advised respondents are regular reports and reviews from advisers to provide them with the reassurance that things are on track. There is some mention of advice firms providing their own portals to access valuations and in this situation, respondents query the need for platforms to be providing analysis or reporting tools.
A very small minority of advised respondents cite frustration at the lack of activity they are able to conduct directly on their platform, and wish they were able to withdraw or switch funds without having to refer to their adviser each time.
8.2 Ease and frequency of use
Non-advised
42% of non-advised respondents are very actively monitoring their investments, checking the value and/or performance weekly or more often in order to stay informed and in control of their investments. A small group of engaged respondents (16%) are using information on the platform weekly for ideas on where and how to invest. Making new investments and checking charges tend to be done every few months (see Chapter 9 for more discussion on charges). Switching funds/shares, and selling tends to be done less than once a year – respondents largely have a long term investment horizon.
There are a small group of frequent traders who are switching funds and/or shares monthly (3%) or weekly (1%).
Figure 29: Activity frequency for non-advised respondents
For active investors, it is very important that transactions on platform occur without issue. In the qualitative research respondents cited the usability of the platform – being intuitive, easy to navigate, visually appealing, as very important to help enable this. The speed of transactions – for share traders but also those switching funds or transferring products – is also deemed important and is an area where a small proportion believe platforms could perform better (see Chapter 11 on satisfaction). Mobile access is important in aiding ease of use and younger respondents in particular request this. There is some frustration amongst current users of apps around the limited functionality (compared to what can be done on the website) and some who are not aware of their platform having an app but who would like to use one.
8.3 The role of platform based tools
We saw in Chapter 6 that platform tools are not a top factor influencing non-advised respondents when choosing a platform (ranked seventh in the stated factors). They are more important for advised respondents – but this is largely for enabling access to portfolio valuation and performance. Whilst 11%
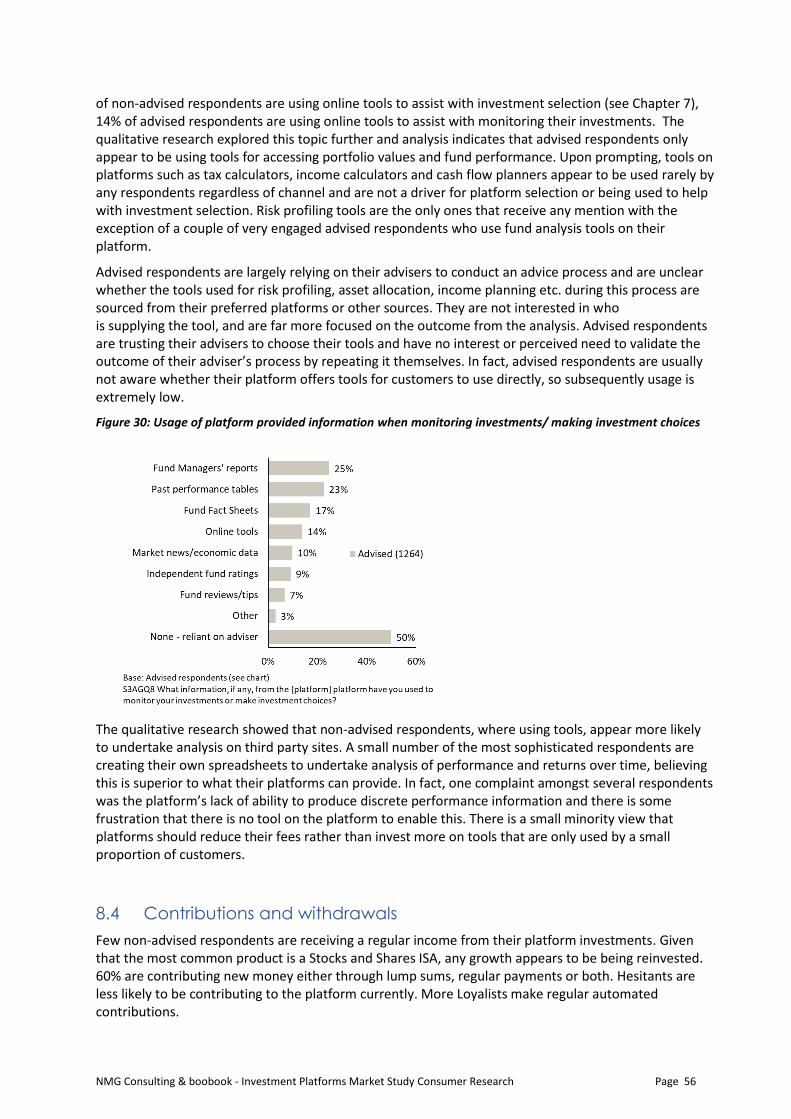
NMG Consulting & boobook - Investment Platforms Market Study Consumer Research Page 56
of non-advised respondents are using online tools to assist with investment selection (see Chapter 7), 14% of advised respondents are using online tools to assist with monitoring their investments. The qualitative research explored this topic further and analysis indicates that advised respondents only appear to be using tools for accessing portfolio values and fund performance. Upon prompting, tools on platforms such as tax calculators, income calculators and cash flow planners appear to be used rarely by any respondents regardless of channel and are not a driver for platform selection or being used to help with investment selection. Risk profiling tools are the only ones that receive any mention with the exception of a couple of very engaged advised respondents who use fund analysis tools on their platform.
Advised respondents are largely relying on their advisers to conduct an advice process and are unclear whether the tools used for risk profiling, asset allocation, income planning etc. during this process are sourced from their preferred platforms or other sources. They are not interested in who is supplying the tool, and are far more focused on the outcome from the analysis. Advised respondents are trusting their advisers to choose their tools and have no interest or perceived need to validate the outcome of their adviser’s process by repeating it themselves. In fact, advised respondents are usually not aware whether their platform offers tools for customers to use directly, so subsequently usage is extremely low.
Figure 30: Usage of platform provided information when monitoring investments/ making investment choices
The qualitative research showed that non-advised respondents, where using tools, appear more likely to undertake analysis on third party sites. A small number of the most sophisticated respondents are creating their own spreadsheets to undertake analysis of performance and returns over time, believing this is superior to what their platforms can provide. In fact, one complaint amongst several respondents was the platform’s lack of ability to produce discrete performance information and there is some frustration that there is no tool on the platform to enable this. There is a small minority view that platforms should reduce their fees rather than invest more on tools that are only used by a small proportion of customers.
8.4 Contributions and withdrawals
Few non-advised respondents are receiving a regular income from their platform investments. Given that the most common product is a Stocks and Shares ISA, any growth appears to be being reinvested. 60% are contributing new money either through lump sums, regular payments or both. Hesitants are less likely to be contributing to the platform currently. More Loyalists make regular automated contributions.
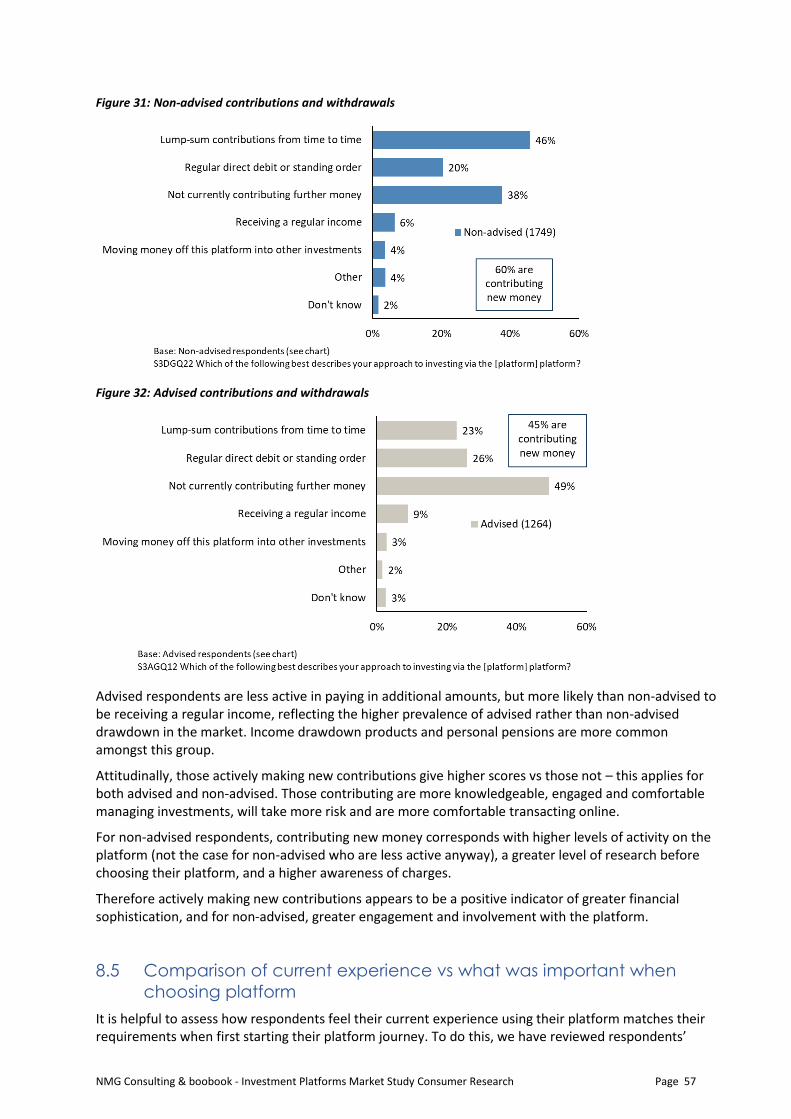
NMG Consulting & boobook - Investment Platforms Market Study Consumer Research Page 57
Figure 31: Non-advised contributions and withdrawals
Figure 32: Advised contributions and withdrawals
Advised respondents are less active in paying in additional amounts, but more likely than non-advised to be receiving a regular income, reflecting the higher prevalence of advised rather than non-advised drawdown in the market. Income drawdown products and personal pensions are more common amongst this group.
Attitudinally, those actively making new contributions give higher scores vs those not – this applies for both advised and non-advised. Those contributing are more knowledgeable, engaged and comfortable managing investments, will take more risk and are more comfortable transacting online.
For non-advised respondents, contributing new money corresponds with higher levels of activity on the platform (not the case for non-advised who are less active anyway), a greater level of research before choosing their platform, and a higher awareness of charges.
Therefore actively making new contributions appears to be a positive indicator of greater financial sophistication, and for non-advised, greater engagement and involvement with the platform.
8.5 Comparison of current experience vs what was important when
choosing platform
It is helpful to assess how respondents feel their current experience using their platform matches their requirements when first starting their platform journey. To do this, we have reviewed respondents’
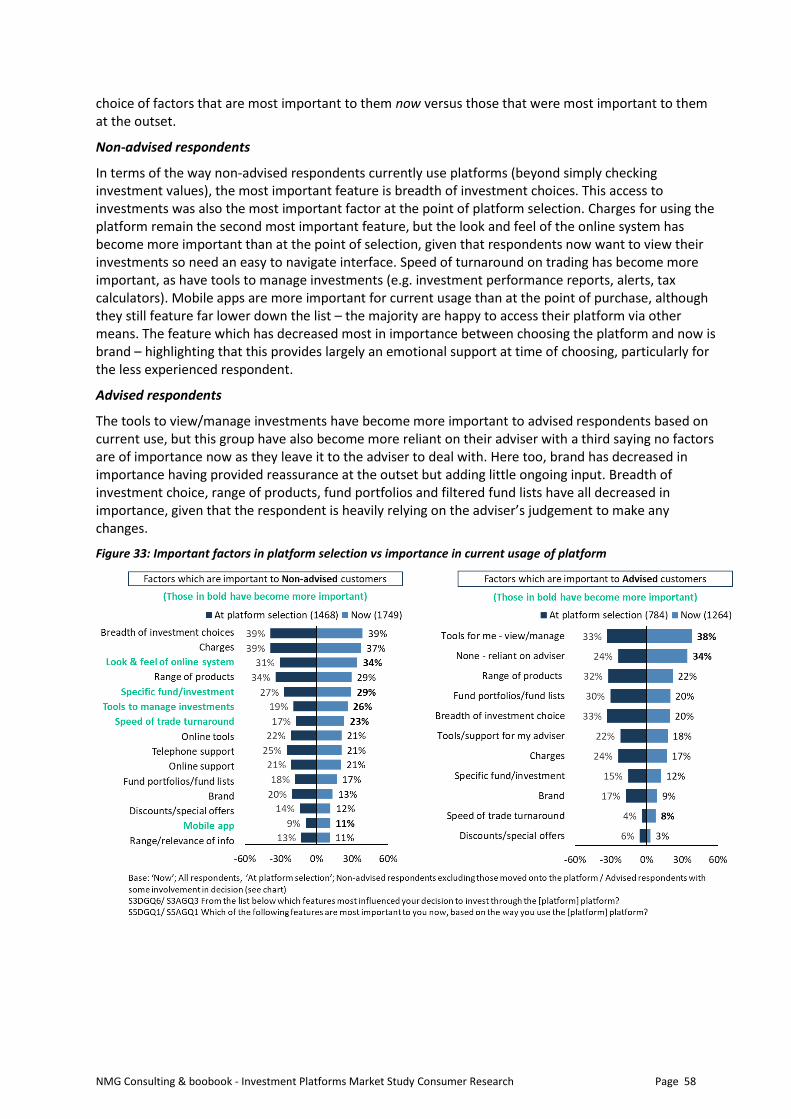
NMG Consulting & boobook - Investment Platforms Market Study Consumer Research Page 58
choice of factors that are most important to them now versus those that were most important to them at the outset.
Non-advised respondents
In terms of the way non-advised respondents currently use platforms (beyond simply checking investment values), the most important feature is breadth of investment choices. This access to investments was also the most important factor at the point of platform selection. Charges for using the platform remain the second most important feature, but the look and feel of the online system has become more important than at the point of selection, given that respondents now want to view their investments so need an easy to navigate interface. Speed of turnaround on trading has become more important, as have tools to manage investments (e.g. investment performance reports, alerts, tax calculators). Mobile apps are more important for current usage than at the point of purchase, although they still feature far lower down the list – the majority are happy to access their platform via other means. The feature which has decreased most in importance between choosing the platform and now is brand – highlighting that this provides largely an emotional support at time of choosing, particularly for the less experienced respondent.
Advised respondents
The tools to view/manage investments have become more important to advised respondents based on current use, but this group have also become more reliant on their adviser with a third saying no factors are of importance now as they leave it to the adviser to deal with. Here too, brand has decreased in importance having provided reassurance at the outset but adding little ongoing input. Breadth of investment choice, range of products, fund portfolios and filtered fund lists have all decreased in importance, given that the respondent is heavily relying on the adviser’s judgement to make any changes.
Figure 33: Important factors in platform selection vs importance in current usage of platform
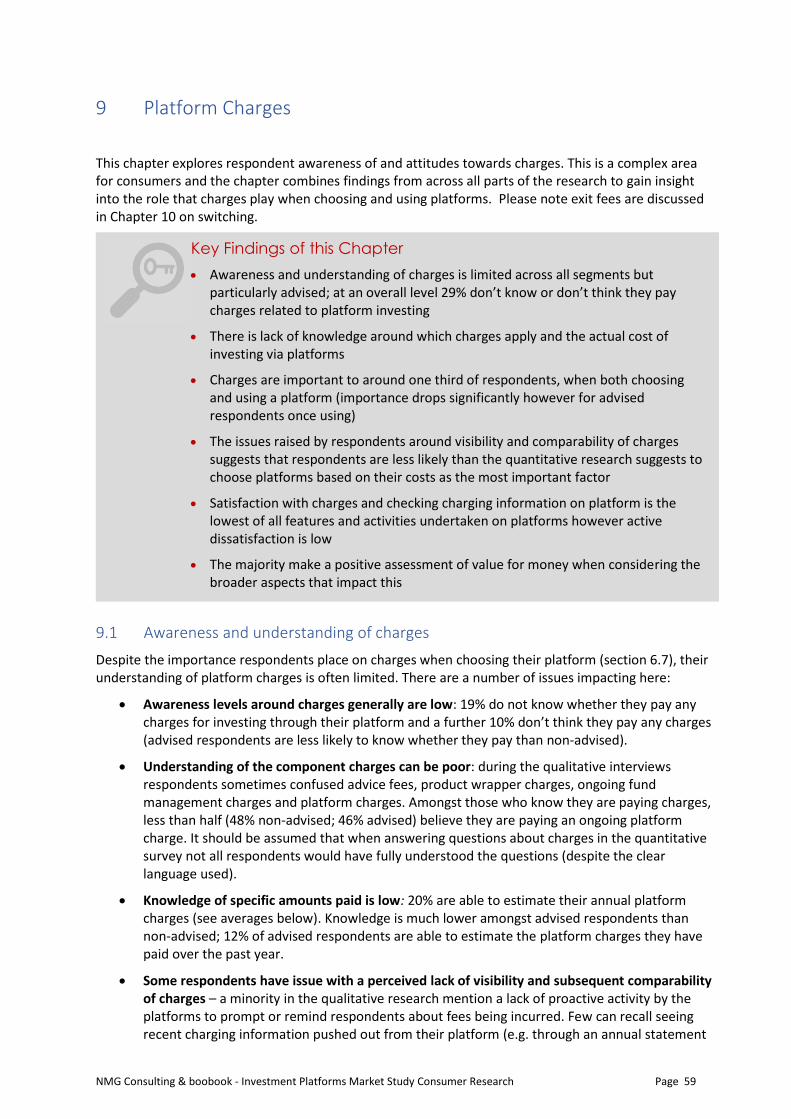
NMG Consulting & boobook - Investment Platforms Market Study Consumer Research Page 59
9 Platform Charges
This chapter explores respondent awareness of and attitudes towards charges. This is a complex area for consumers and the chapter combines findings from across all parts of the research to gain insight into the role that charges play when choosing and using platforms. Please note exit fees are discussed in Chapter 10 on switching.
9.1 Awareness and understanding of charges
Despite the importance respondents place on charges when choosing their platform (section 6.7), their understanding of platform charges is often limited. There are a number of issues impacting here:
• Awareness levels around charges generally are low: 19% do not know whether they pay any charges for investing through their platform and a further 10% don’t think they pay any charges (advised respondents are less likely to know whether they pay than non-advised).
• Understanding of the component charges can be poor: during the qualitative interviews respondents sometimes confused advice fees, product wrapper charges, ongoing fund management charges and platform charges. Amongst those who know they are paying charges, less than half (48% non-advised; 46% advised) believe they are paying an ongoing platform charge. It should be assumed that when answering questions about charges in the quantitative survey not all respondents would have fully understood the questions (despite the clear language used).
• Knowledge of specific amounts paid is low: 20% are able to estimate their annual platform charges (see averages below). Knowledge is much lower amongst advised respondents than non-advised; 12% of advised respondents are able to estimate the platform charges they have paid over the past year.
• Some respondents have issue with a perceived lack of visibility and subsequent comparability of charges – a minority in the qualitative research mention a lack of proactive activity by the platforms to prompt or remind respondents about fees being incurred. Few can recall seeing recent charging information pushed out from their platform (e.g. through an annual statement
Key Findings of this Chapter
• Awareness and understanding of charges is limited across all segments but particularly advised; at an overall level 29% don’t know or don’t think they pay charges related to platform investing
• There is lack of knowledge around which charges apply and the actual cost of investing via platforms
• Charges are important to around one third of respondents, when both choosing and using a platform (importance drops significantly however for advised respondents once using)
• The issues raised by respondents around visibility and comparability of charges suggests that respondents are less likely than the quantitative research suggests to choose platforms based on their costs as the most important factor
• Satisfaction with charges and checking charging information on platform is the lowest of all features and activities undertaken on platforms however active dissatisfaction is low
• The majority make a positive assessment of value for money when considering the broader aspects that impact this
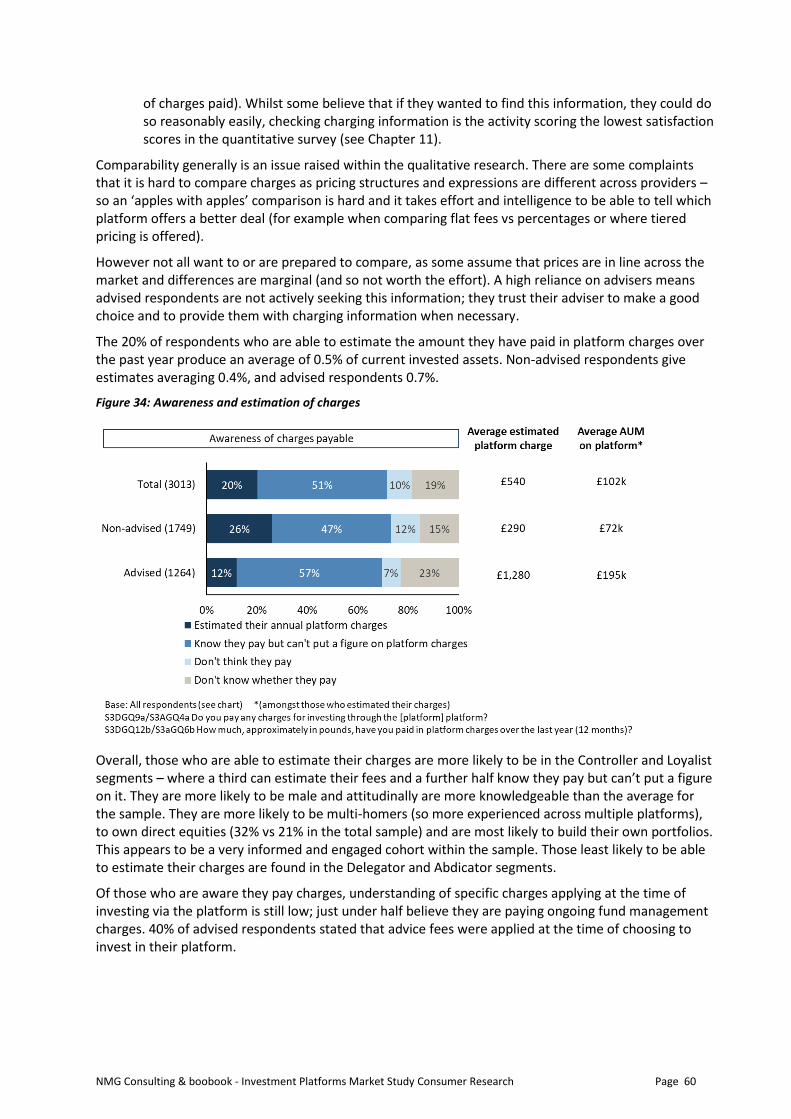
NMG Consulting & boobook - Investment Platforms Market Study Consumer Research Page 60
of charges paid). Whilst some believe that if they wanted to find this information, they could do so reasonably easily, checking charging information is the activity scoring the lowest satisfaction scores in the quantitative survey (see Chapter 11).
Comparability generally is an issue raised within the qualitative research. There are some complaints that it is hard to compare charges as pricing structures and expressions are different across providers – so an ‘apples with apples’ comparison is hard and it takes effort and intelligence to be able to tell which platform offers a better deal (for example when comparing flat fees vs percentages or where tiered pricing is offered).
However not all want to or are prepared to compare, as some assume that prices are in line across the market and differences are marginal (and so not worth the effort). A high reliance on advisers means advised respondents are not actively seeking this information; they trust their adviser to make a good choice and to provide them with charging information when necessary.
The 20% of respondents who are able to estimate the amount they have paid in platform charges over the past year produce an average of 0.5% of current invested assets. Non-advised respondents give estimates averaging 0.4%, and advised respondents 0.7%.
Figure 34: Awareness and estimation of charges
Overall, those who are able to estimate their charges are more likely to be in the Controller and Loyalist segments – where a third can estimate their fees and a further half know they pay but can’t put a figure on it. They are more likely to be male and attitudinally are more knowledgeable than the average for the sample. They are more likely to be multi-homers (so more experienced across multiple platforms), to own direct equities (32% vs 21% in the total sample) and are most likely to build their own portfolios. This appears to be a very informed and engaged cohort within the sample. Those least likely to be able to estimate their charges are found in the Delegator and Abdicator segments.
Of those who are aware they pay charges, understanding of specific charges applying at the time of investing via the platform is still low; just under half believe they are paying ongoing fund management charges. 40% of advised respondents stated that advice fees were applied at the time of choosing to invest in their platform.
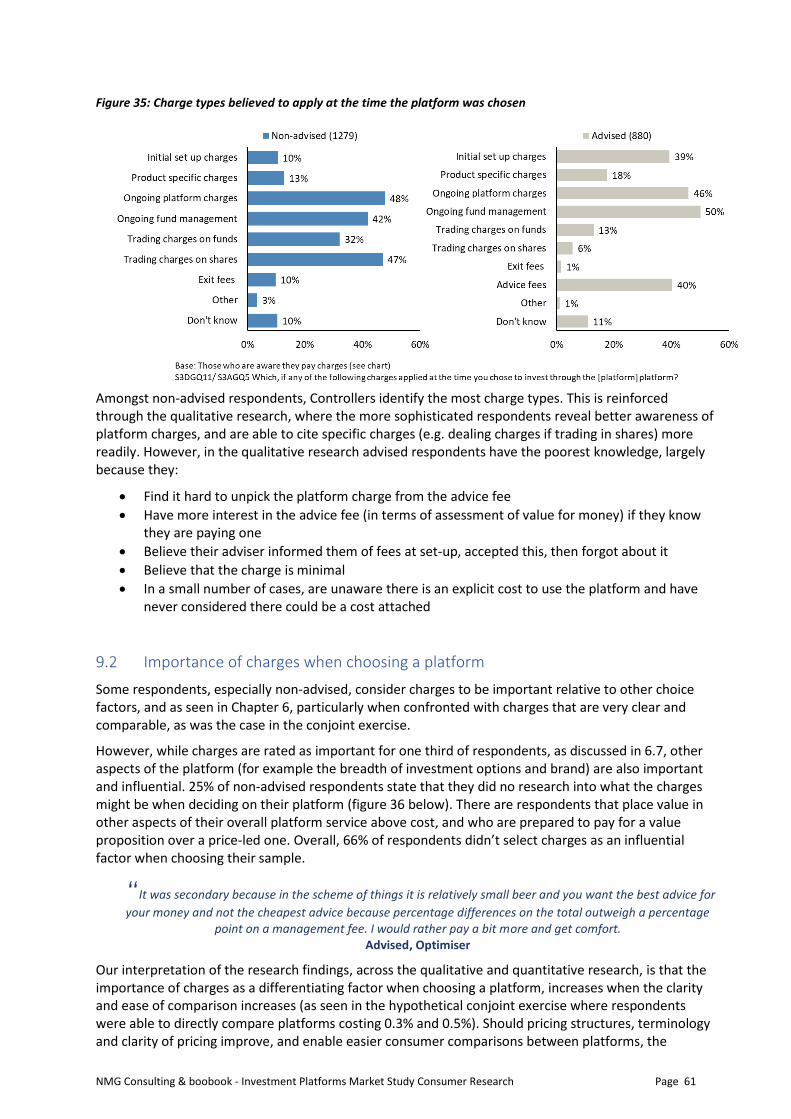
NMG Consulting & boobook - Investment Platforms Market Study Consumer Research Page 61
Figure 35: Charge types believed to apply at the time the platform was chosen
Amongst non-advised respondents, Controllers identify the most charge types. This is reinforced through the qualitative research, where the more sophisticated respondents reveal better awareness of platform charges, and are able to cite specific charges (e.g. dealing charges if trading in shares) more readily. However, in the qualitative research advised respondents have the poorest knowledge, largely because they:
• Find it hard to unpick the platform charge from the advice fee
• Have more interest in the advice fee (in terms of assessment of value for money) if they know they are paying one
• Believe their adviser informed them of fees at set-up, accepted this, then forgot about it
• Believe that the charge is minimal
• In a small number of cases, are unaware there is an explicit cost to use the platform and have never considered there could be a cost attached
9.2 Importance of charges when choosing a platform
Some respondents, especially non-advised, consider charges to be important relative to other choice factors, and as seen in Chapter 6, particularly when confronted with charges that are very clear and comparable, as was the case in the conjoint exercise.
However, while charges are rated as important for one third of respondents, as discussed in 6.7, other aspects of the platform (for example the breadth of investment options and brand) are also important and influential. 25% of non-advised respondents state that they did no research into what the charges might be when deciding on their platform (figure 36 below). There are respondents that place value in other aspects of their overall platform service above cost, and who are prepared to pay for a value proposition over a price-led one. Overall, 66% of respondents didn’t select charges as an influential factor when choosing their sample.
“It was secondary because in the scheme of things it is relatively small beer and you want the best advice for
your money and not the cheapest advice because percentage differences on the total outweigh a percentage point on a management fee. I would rather pay a bit more and get comfort.
Advised, Optimiser
Our interpretation of the research findings, across the qualitative and quantitative research, is that the importance of charges as a differentiating factor when choosing a platform, increases when the clarity and ease of comparison increases (as seen in the hypothetical conjoint exercise where respondents were able to directly compare platforms costing 0.3% and 0.5%). Should pricing structures, terminology and clarity of pricing improve, and enable easier consumer comparisons between platforms, the
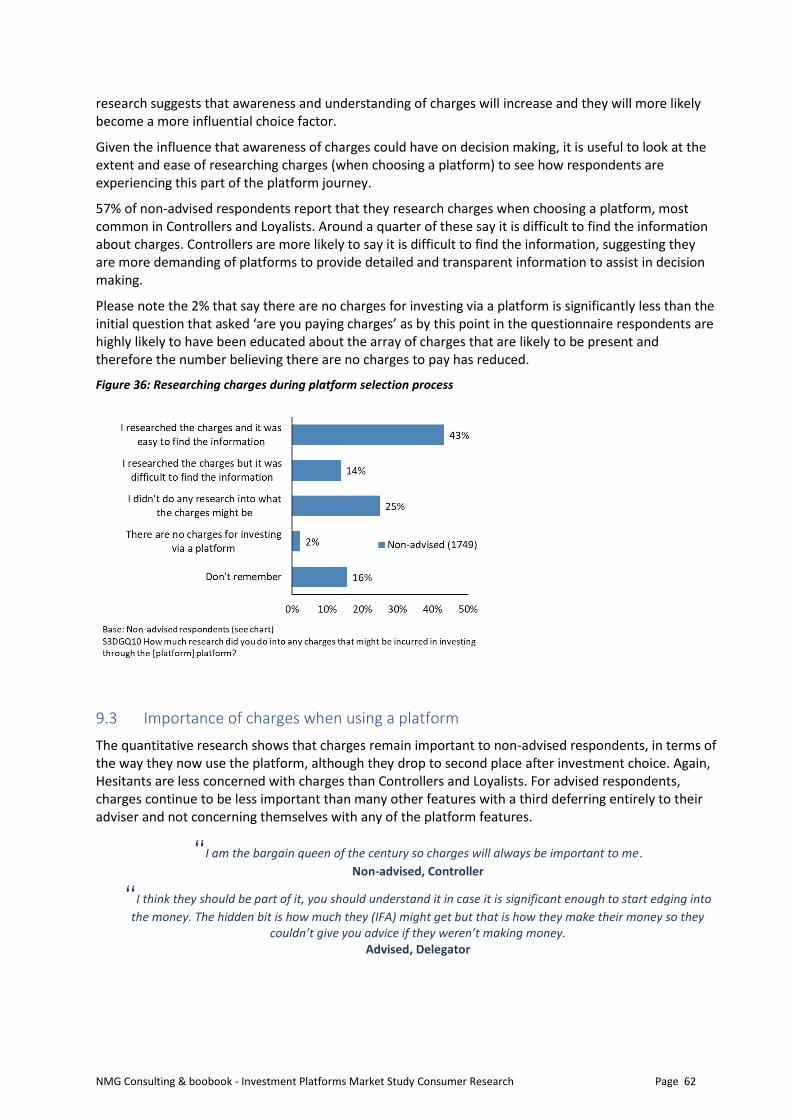
NMG Consulting & boobook - Investment Platforms Market Study Consumer Research Page 62
research suggests that awareness and understanding of charges will increase and they will more likely become a more influential choice factor.
Given the influence that awareness of charges could have on decision making, it is useful to look at the extent and ease of researching charges (when choosing a platform) to see how respondents are experiencing this part of the platform journey.
57% of non-advised respondents report that they research charges when choosing a platform, most common in Controllers and Loyalists. Around a quarter of these say it is difficult to find the information about charges. Controllers are more likely to say it is difficult to find the information, suggesting they are more demanding of platforms to provide detailed and transparent information to assist in decision making.
Please note the 2% that say there are no charges for investing via a platform is significantly less than the initial question that asked ‘are you paying charges’ as by this point in the questionnaire respondents are highly likely to have been educated about the array of charges that are likely to be present and therefore the number believing there are no charges to pay has reduced.
Figure 36: Researching charges during platform selection process
9.3 Importance of charges when using a platform
The quantitative research shows that charges remain important to non-advised respondents, in terms of the way they now use the platform, although they drop to second place after investment choice. Again, Hesitants are less concerned with charges than Controllers and Loyalists. For advised respondents, charges continue to be less important than many other features with a third deferring entirely to their adviser and not concerning themselves with any of the platform features.
“I am the bargain queen of the century so charges will always be important to me.
Non-advised, Controller
“I think they should be part of it, you should understand it in case it is significant enough to start edging into
the money. The hidden bit is how much they (IFA) might get but that is how they make their money so they couldn’t give you advice if they weren’t making money.
Advised, Delegator
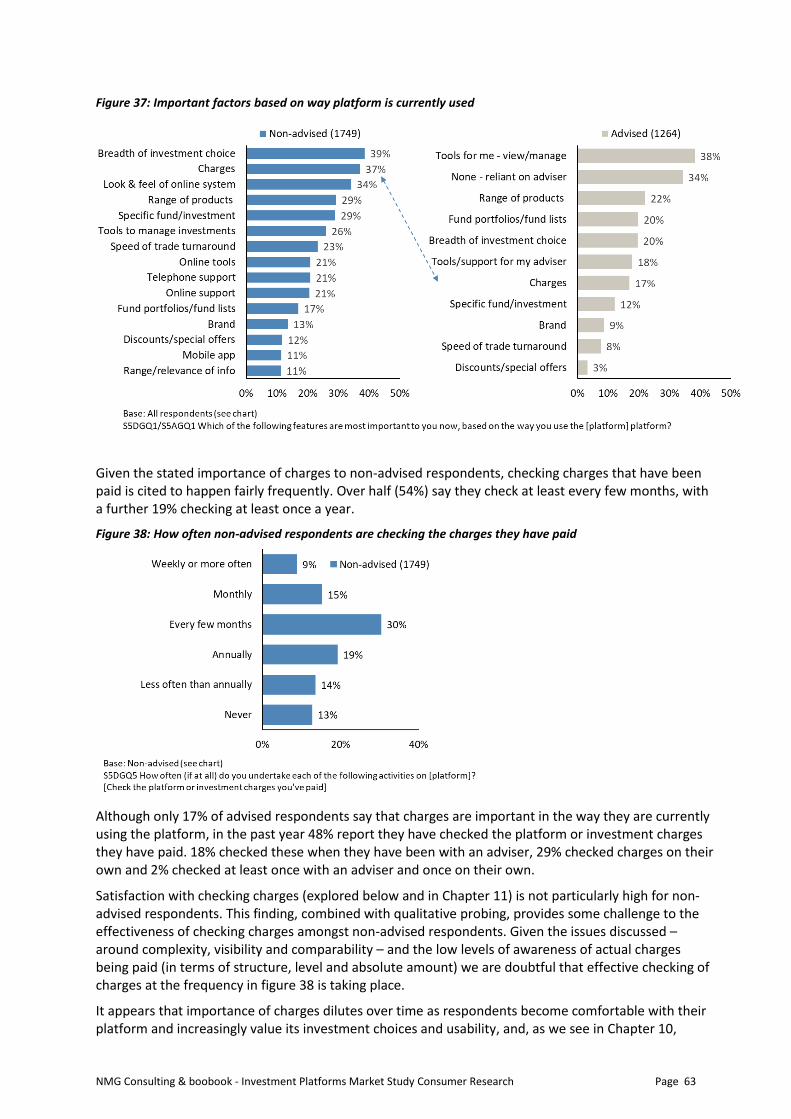
NMG Consulting & boobook - Investment Platforms Market Study Consumer Research Page 63
Figure 37: Important factors based on way platform is currently used
Given the stated importance of charges to non-advised respondents, checking charges that have been paid is cited to happen fairly frequently. Over half (54%) say they check at least every few months, with a further 19% checking at least once a year.
Figure 38: How often non-advised respondents are checking the charges they have paid
Although only 17% of advised respondents say that charges are important in the way they are currently using the platform, in the past year 48% report they have checked the platform or investment charges they have paid. 18% checked these when they have been with an adviser, 29% checked charges on their own and 2% checked at least once with an adviser and once on their own.
Satisfaction with checking charges (explored below and in Chapter 11) is not particularly high for non-advised respondents. This finding, combined with qualitative probing, provides some challenge to the effectiveness of checking charges amongst non-advised respondents. Given the issues discussed – around complexity, visibility and comparability – and the low levels of awareness of actual charges being paid (in terms of structure, level and absolute amount) we are doubtful that effective checking of charges at the frequency in figure 38 is taking place.
It appears that importance of charges dilutes over time as respondents become comfortable with their platform and increasingly value its investment choices and usability, and, as we see in Chapter 10,
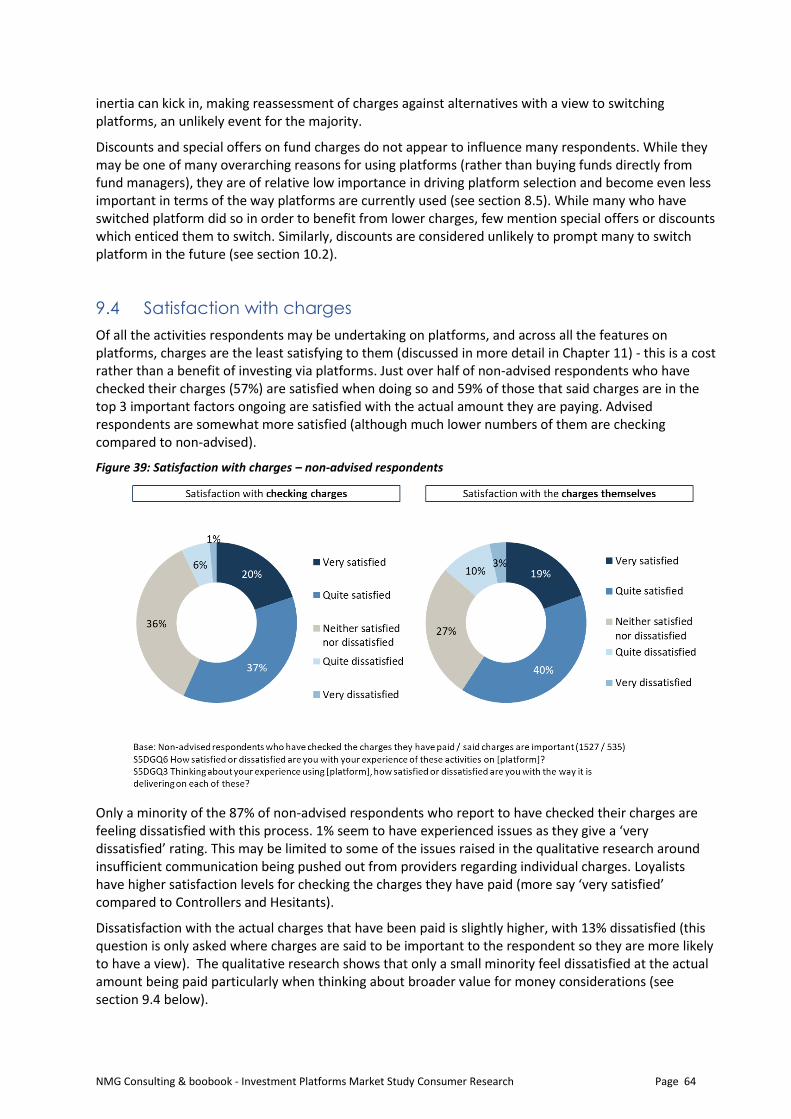
NMG Consulting & boobook - Investment Platforms Market Study Consumer Research Page 64
inertia can kick in, making reassessment of charges against alternatives with a view to switching platforms, an unlikely event for the majority.
Discounts and special offers on fund charges do not appear to influence many respondents. While they may be one of many overarching reasons for using platforms (rather than buying funds directly from fund managers), they are of relative low importance in driving platform selection and become even less important in terms of the way platforms are currently used (see section 8.5). While many who have switched platform did so in order to benefit from lower charges, few mention special offers or discounts which enticed them to switch. Similarly, discounts are considered unlikely to prompt many to switch platform in the future (see section 10.2).
9.4 Satisfaction with charges
Of all the activities respondents may be undertaking on platforms, and across all the features on platforms, charges are the least satisfying to them (discussed in more detail in Chapter 11) - this is a cost rather than a benefit of investing via platforms. Just over half of non-advised respondents who have checked their charges (57%) are satisfied when doing so and 59% of those that said charges are in the top 3 important factors ongoing are satisfied with the actual amount they are paying. Advised respondents are somewhat more satisfied (although much lower numbers of them are checking compared to non-advised).
Figure 39: Satisfaction with charges – non-advised respondents
Only a minority of the 87% of non-advised respondents who report to have checked their charges are feeling dissatisfied with this process. 1% seem to have experienced issues as they give a ‘very dissatisfied’ rating. This may be limited to some of the issues raised in the qualitative research around insufficient communication being pushed out from providers regarding individual charges. Loyalists have higher satisfaction levels for checking the charges they have paid (more say ‘very satisfied’ compared to Controllers and Hesitants).
Dissatisfaction with the actual charges that have been paid is slightly higher, with 13% dissatisfied (this question is only asked where charges are said to be important to the respondent so they are more likely to have a view). The qualitative research shows that only a small minority feel dissatisfied at the actual amount being paid particularly when thinking about broader value for money considerations (see section 9.4 below).
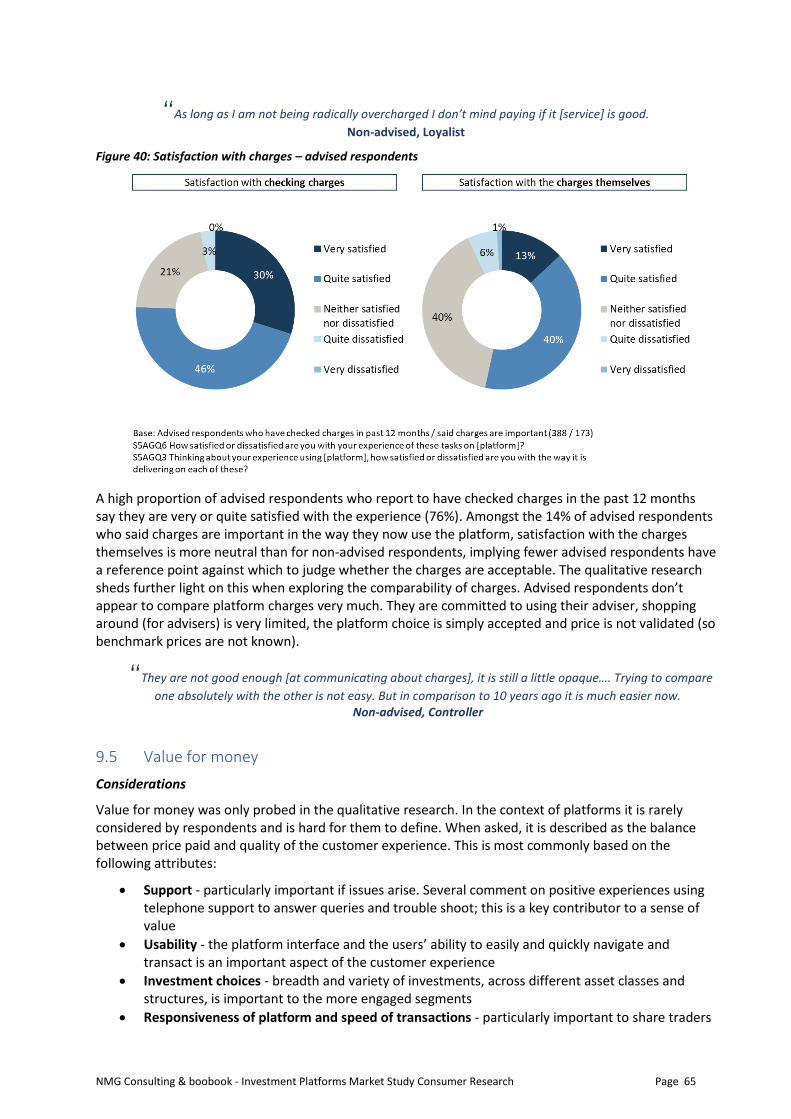
NMG Consulting & boobook - Investment Platforms Market Study Consumer Research Page 65
“As long as I am not being radically overcharged I don’t mind paying if it [service] is good.
Non-advised, Loyalist
Figure 40: Satisfaction with charges – advised respondents
A high proportion of advised respondents who report to have checked charges in the past 12 months say they are very or quite satisfied with the experience (76%). Amongst the 14% of advised respondents who said charges are important in the way they now use the platform, satisfaction with the charges themselves is more neutral than for non-advised respondents, implying fewer advised respondents have a reference point against which to judge whether the charges are acceptable. The qualitative research sheds further light on this when exploring the comparability of charges. Advised respondents don’t appear to compare platform charges very much. They are committed to using their adviser, shopping around (for advisers) is very limited, the platform choice is simply accepted and price is not validated (so benchmark prices are not known).
“They are not good enough [at communicating about charges], it is still a little opaque…. Trying to compare
one absolutely with the other is not easy. But in comparison to 10 years ago it is much easier now. Non-advised, Controller
9.5 Value for money
Considerations
Value for money was only probed in the qualitative research. In the context of platforms it is rarely considered by respondents and is hard for them to define. When asked, it is described as the balance between price paid and quality of the customer experience. This is most commonly based on the following attributes:
• Support - particularly important if issues arise. Several comment on positive experiences using telephone support to answer queries and trouble shoot; this is a key contributor to a sense of value
• Usability - the platform interface and the users’ ability to easily and quickly navigate and transact is an important aspect of the customer experience
• Investment choices - breadth and variety of investments, across different asset classes and structures, is important to the more engaged segments
• Responsiveness of platform and speed of transactions - particularly important to share traders
NMG Consulting & boobook - Investment Platforms Market Study Consumer Research Page 66
• Range of information and educational resources - important to a minority, particularly novice investors
• Security of assets - important for older respondents (often understated as a feature as often taken for granted given stability in the platform market)
Investment performance is intrinsically wrapped up in value for money considerations, despite the lack of influence platforms themselves have on this. Some respondents felt that a positive investment return (as experienced in recent years) had an impact on their overall satisfaction and value for money assessment.
For advised respondents, the adviser relationship and quality of the overall advice experience also impacts on value for money considerations (particularly for those who struggle to unpick the platform charge from their advice fee). A negative advice experience or dissatisfaction with the adviser charge can therefore impact on attitudes towards the platform and vice versa.
Outcome
For most respondents in the qualitative phase, overall value for money assessment is positive. They are happy to pay a price for the service received, they believe the total cost of investing via platforms is less than or no more than what they would pay via traditional channels (helped by discounted fund charges) and are satisfied with the overall experience. More than this, when considering value for money, the broader benefits associated with platform-based investing (holistic view, greater control and access, reporting, support) contribute to a positive cost vs benefit assessment.
“It’s (VFM) customer experience, user experience. I should have the information available any second I want -
doesn’t matter where I am or what I am doing, I should be able to log on, so that is what I am paying for. Non-Advised, Optimiser
For respondents who have low awareness of platform costs, value for money considerations are difficult. On the assumption that prices being paid are low relative to the size of investments, respondents are happy. This is a constructed view however, given the lack of accurate information at hand.
There are cases where value for money is challenged by respondents; these are by a small minority and include:
• Platform access – log-in issues (replatforming by a provider at time of the research) meaning respondent had not been able to use his platform for some time
• Lack of clarity on charges – advised respondents who were frustrated at the lack of transparency on the cost being paid for the functionality available to them – perceived to be too limited
• High price to access – large fee incurred when adviser switched from one SIPP provider to another
• Usefulness of tools / guides – seen as unnecesary bells and whistles by the respondent
NMG Consulting & boobook - Investment Platforms Market Study Consumer Research Page 67
10 Switching Behaviour
There are different ways to switch platforms; this chapter looks at the extent of self-directed switching activity in the last three years, encompassing platform transfers, withdrawals and additions of new platforms, to assess how well respondents are able to undertake such activities and what the barriers to switching may be. It briefly looks at adviser-led switching through a small number of qualitative observations.
10.1 Extent and type of switching
Self-directed platform switching is relatively uncommon amongst respondents. 10% have switched assets from one platform to another, under their own initiative, in the last three years (this number would generate a lower annual switching rate if we had capped the time limit to 12 months). If we broaden the definition of switching to include adding an additional platform rather than continuing to invest via the same, single platform (i.e. multi-homing), and withdrawing money from a platform to reinvest elsewhere, 27% of respondents have switched. Within this, a small proportion have withdrawn money from a platform themselves and then taken this to an adviser to reinvest elsewhere on their behalf.
Key Findings of this Chapter
• Platform switching without the support of an adviser is relatively uncommon amongst respondents. 10% have switched from one platform to another in the past three years without adviser involvement
• Self-directed switching is correlated to engagement as the most engaged segments are those most likely to switch / consider switching; the key driver for switching for those that have switched was to access lower charges
• Negative experience with the current platform is more likely to prompt a future switch than the pull of positive attributes offered by an alternative platform, however issues with the platform need to be significant and sustained to trigger a switch, given the perceived work involved
• 61% of those that have switched found it easy with 11% finding it difficult; 7% have tried and failed to switch without the help of an adviser
• Barriers to switching are both actual and perceived; the time required and perceived complexity of the process are the key barriers
• 69% have not considered switching and this is because they are comfortable with their current arrangement and do not see a need to change
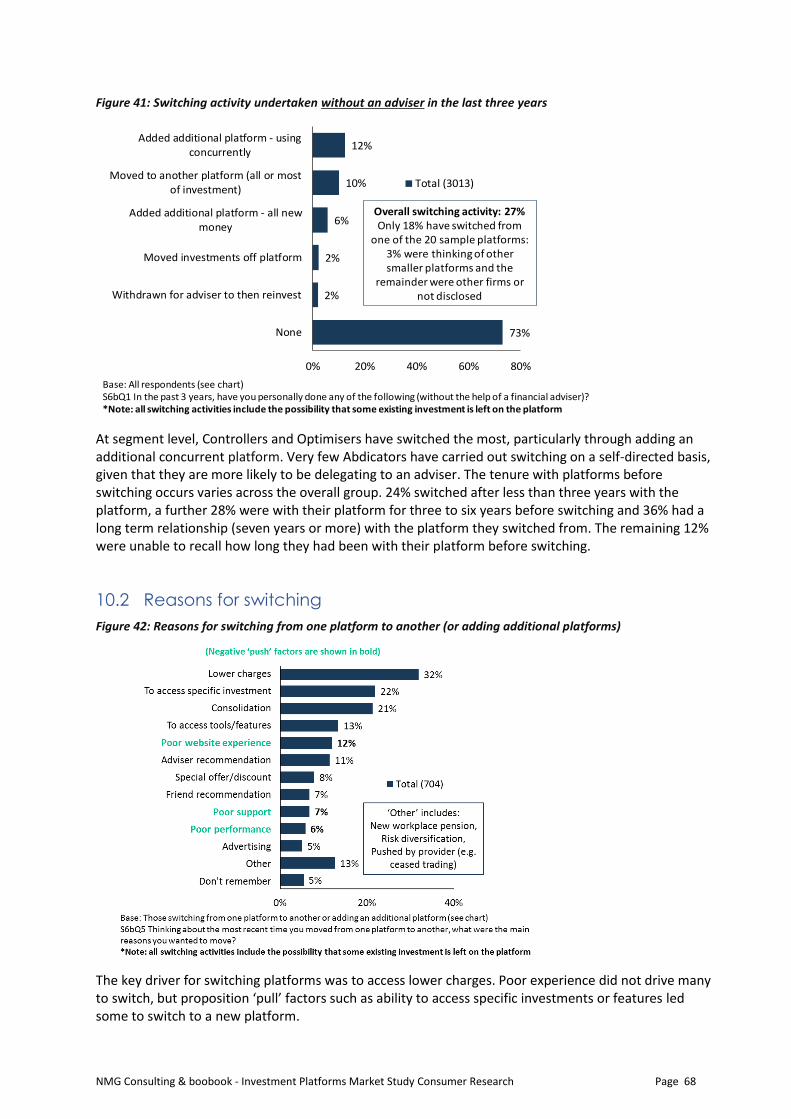
NMG Consulting & boobook - Investment Platforms Market Study Consumer Research Page 68
Figure 41: Switching activity undertaken without an adviser in the last three years
At segment level, Controllers and Optimisers have switched the most, particularly through adding an additional concurrent platform. Very few Abdicators have carried out switching on a self-directed basis, given that they are more likely to be delegating to an adviser. The tenure with platforms before switching occurs varies across the overall group. 24% switched after less than three years with the platform, a further 28% were with their platform for three to six years before switching and 36% had a long term relationship (seven years or more) with the platform they switched from. The remaining 12% were unable to recall how long they had been with their platform before switching.
10.2 Reasons for switching
Figure 42: Reasons for switching from one platform to another (or adding additional platforms)
The key driver for switching platforms was to access lower charges. Poor experience did not drive many to switch, but proposition ‘pull’ factors such as ability to access specific investments or features led some to switch to a new platform.
12%
10%
6%
2%
2%
73%
0% 20% 40% 60% 80%
Added additional platform - usingconcurrently
Moved to another platform (all or mostof investment)
Added additional platform - all newmoney
Moved investments off platform
Withdrawn for adviser to then reinvest
None
Total (3013)
Base: All respondents (see chart)S6bQ1 In the past 3 years, have you personally done any of the following (without the help of a financial adviser)?*Note: all switching activities include the possibility that some existing investment is left on the platform
Overall switching activity: 27% Only 18% have switched from
one of the 20 sample platforms: 3% were thinking of other smaller platforms and the
remainder were other firms or not disclosed
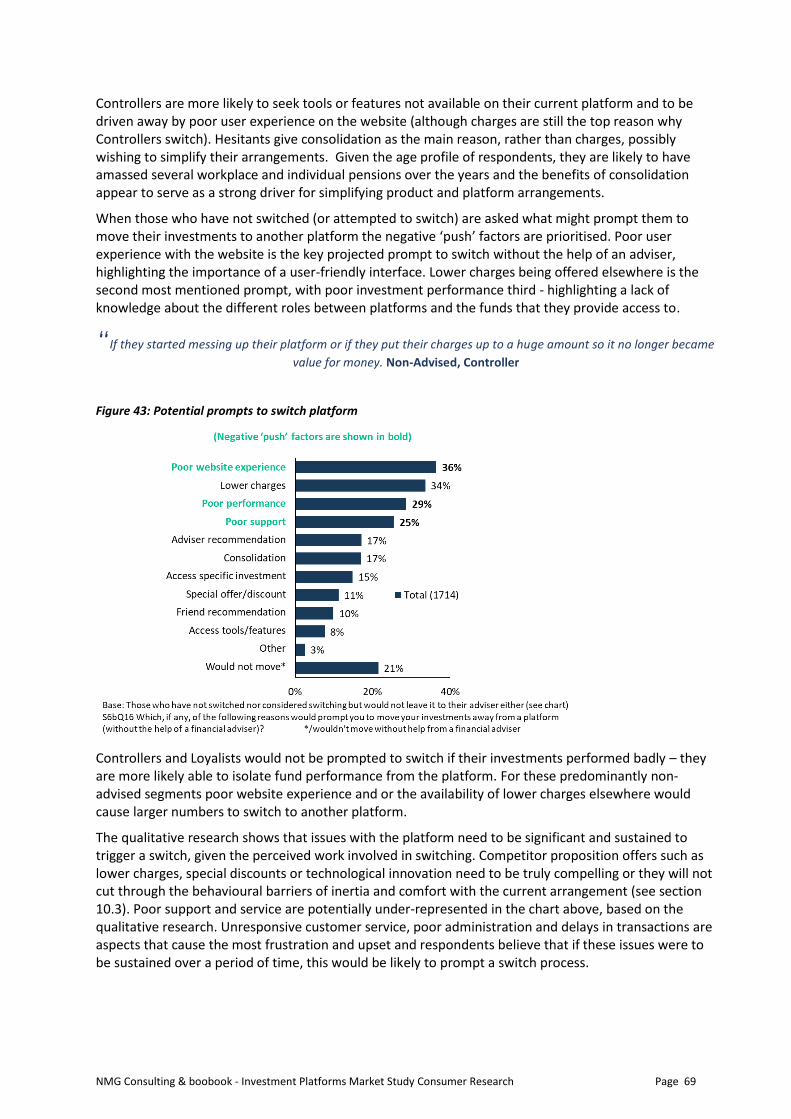
NMG Consulting & boobook - Investment Platforms Market Study Consumer Research Page 69
Controllers are more likely to seek tools or features not available on their current platform and to be driven away by poor user experience on the website (although charges are still the top reason why Controllers switch). Hesitants give consolidation as the main reason, rather than charges, possibly wishing to simplify their arrangements. Given the age profile of respondents, they are likely to have amassed several workplace and individual pensions over the years and the benefits of consolidation appear to serve as a strong driver for simplifying product and platform arrangements.
When those who have not switched (or attempted to switch) are asked what might prompt them to move their investments to another platform the negative ‘push’ factors are prioritised. Poor user experience with the website is the key projected prompt to switch without the help of an adviser, highlighting the importance of a user-friendly interface. Lower charges being offered elsewhere is the second most mentioned prompt, with poor investment performance third - highlighting a lack of knowledge about the different roles between platforms and the funds that they provide access to.
“If they started messing up their platform or if they put their charges up to a huge amount so it no longer became
value for money. Non-Advised, Controller
Figure 43: Potential prompts to switch platform
Controllers and Loyalists would not be prompted to switch if their investments performed badly – they are more likely able to isolate fund performance from the platform. For these predominantly non-advised segments poor website experience and or the availability of lower charges elsewhere would cause larger numbers to switch to another platform.
The qualitative research shows that issues with the platform need to be significant and sustained to trigger a switch, given the perceived work involved in switching. Competitor proposition offers such as lower charges, special discounts or technological innovation need to be truly compelling or they will not cut through the behavioural barriers of inertia and comfort with the current arrangement (see section 10.3). Poor support and service are potentially under-represented in the chart above, based on the qualitative research. Unresponsive customer service, poor administration and delays in transactions are aspects that cause the most frustration and upset and respondents believe that if these issues were to be sustained over a period of time, this would be likely to prompt a switch process.
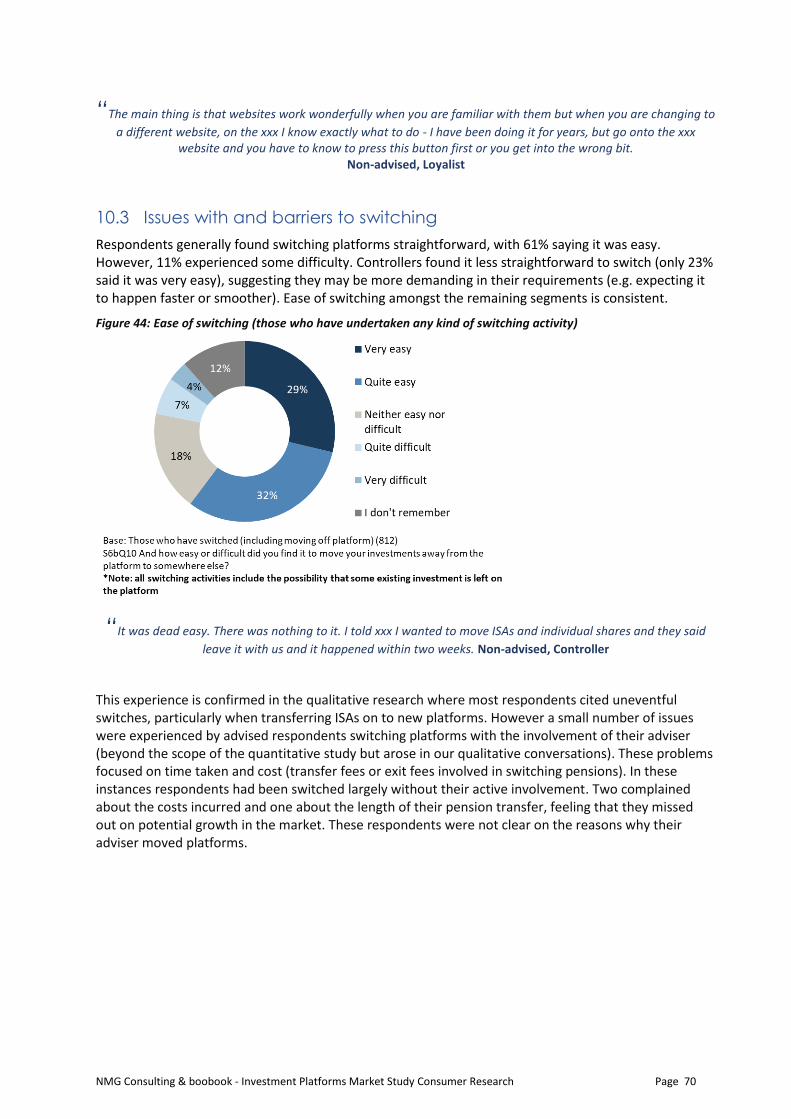
NMG Consulting & boobook - Investment Platforms Market Study Consumer Research Page 70
“The main thing is that websites work wonderfully when you are familiar with them but when you are changing to
a different website, on the xxx I know exactly what to do - I have been doing it for years, but go onto the xxx website and you have to know to press this button first or you get into the wrong bit.
Non-advised, Loyalist
10.3 Issues with and barriers to switching
Respondents generally found switching platforms straightforward, with 61% saying it was easy. However, 11% experienced some difficulty. Controllers found it less straightforward to switch (only 23% said it was very easy), suggesting they may be more demanding in their requirements (e.g. expecting it to happen faster or smoother). Ease of switching amongst the remaining segments is consistent.
Figure 44: Ease of switching (those who have undertaken any kind of switching activity)
“It was dead easy. There was nothing to it. I told xxx I wanted to move ISAs and individual shares and they said
leave it with us and it happened within two weeks. Non-advised, Controller
This experience is confirmed in the qualitative research where most respondents cited uneventful switches, particularly when transferring ISAs on to new platforms. However a small number of issues were experienced by advised respondents switching platforms with the involvement of their adviser (beyond the scope of the quantitative study but arose in our qualitative conversations). These problems focused on time taken and cost (transfer fees or exit fees involved in switching pensions). In these instances respondents had been switched largely without their active involvement. Two complained about the costs incurred and one about the length of their pension transfer, feeling that they missed out on potential growth in the market. These respondents were not clear on the reasons why their adviser moved platforms.
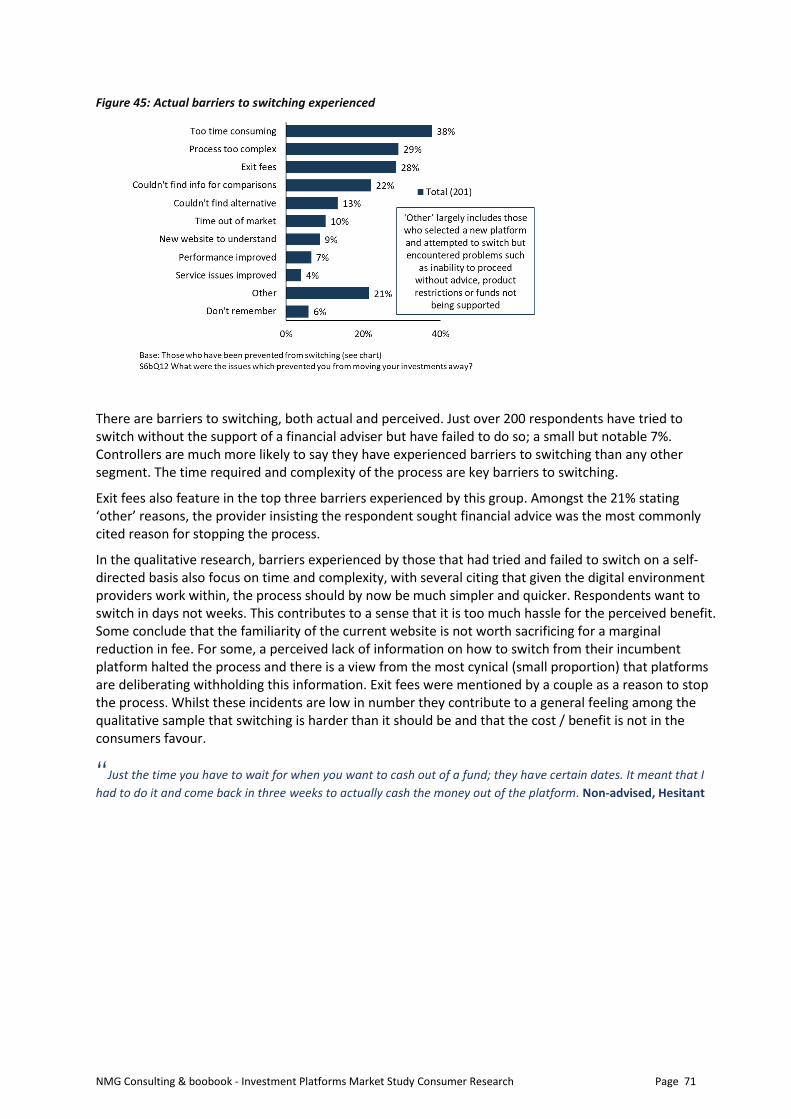
NMG Consulting & boobook - Investment Platforms Market Study Consumer Research Page 71
Figure 45: Actual barriers to switching experienced
There are barriers to switching, both actual and perceived. Just over 200 respondents have tried to switch without the support of a financial adviser but have failed to do so; a small but notable 7%. Controllers are much more likely to say they have experienced barriers to switching than any other segment. The time required and complexity of the process are key barriers to switching.
Exit fees also feature in the top three barriers experienced by this group. Amongst the 21% stating ‘other’ reasons, the provider insisting the respondent sought financial advice was the most commonly cited reason for stopping the process.
In the qualitative research, barriers experienced by those that had tried and failed to switch on a self-directed basis also focus on time and complexity, with several citing that given the digital environment providers work within, the process should by now be much simpler and quicker. Respondents want to switch in days not weeks. This contributes to a sense that it is too much hassle for the perceived benefit. Some conclude that the familiarity of the current website is not worth sacrificing for a marginal reduction in fee. For some, a perceived lack of information on how to switch from their incumbent platform halted the process and there is a view from the most cynical (small proportion) that platforms are deliberating withholding this information. Exit fees were mentioned by a couple as a reason to stop the process. Whilst these incidents are low in number they contribute to a general feeling among the qualitative sample that switching is harder than it should be and that the cost / benefit is not in the consumers favour.
“Just the time you have to wait for when you want to cash out of a fund; they have certain dates. It meant that I
had to do it and come back in three weeks to actually cash the money out of the platform. Non-advised, Hesitant
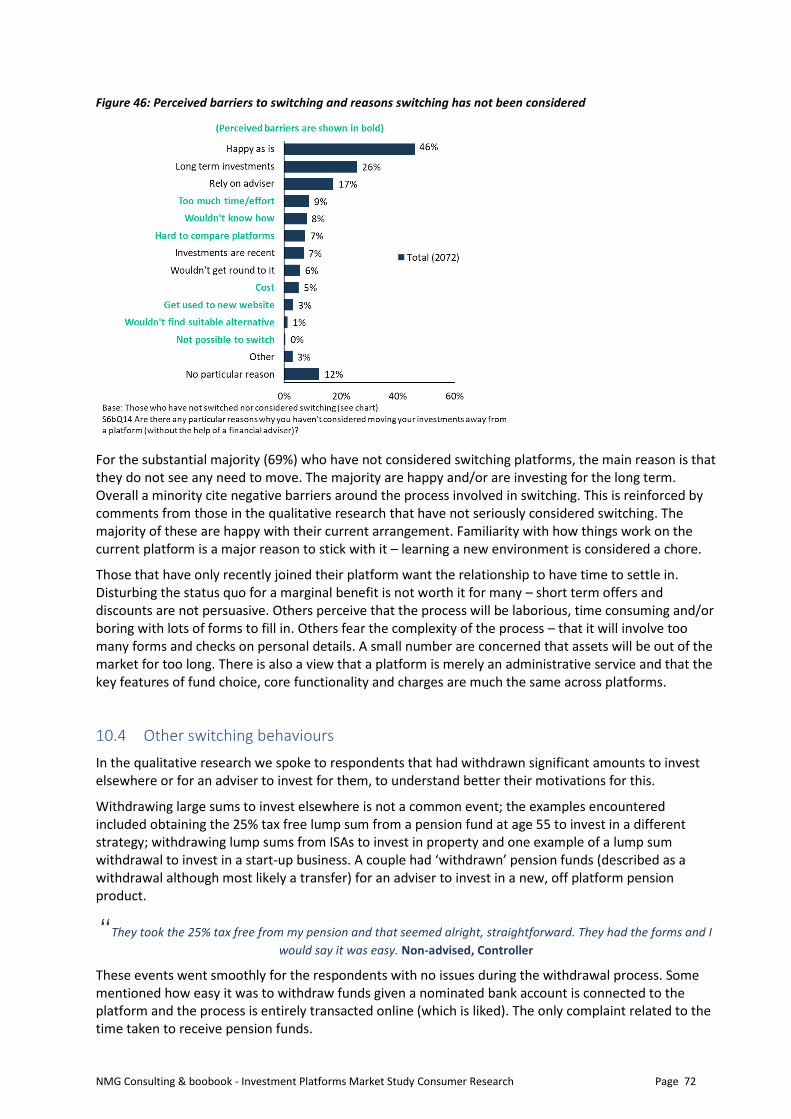
NMG Consulting & boobook - Investment Platforms Market Study Consumer Research Page 72
Figure 46: Perceived barriers to switching and reasons switching has not been considered
For the substantial majority (69%) who have not considered switching platforms, the main reason is that they do not see any need to move. The majority are happy and/or are investing for the long term. Overall a minority cite negative barriers around the process involved in switching. This is reinforced by comments from those in the qualitative research that have not seriously considered switching. The majority of these are happy with their current arrangement. Familiarity with how things work on the current platform is a major reason to stick with it – learning a new environment is considered a chore.
Those that have only recently joined their platform want the relationship to have time to settle in. Disturbing the status quo for a marginal benefit is not worth it for many – short term offers and discounts are not persuasive. Others perceive that the process will be laborious, time consuming and/or boring with lots of forms to fill in. Others fear the complexity of the process – that it will involve too many forms and checks on personal details. A small number are concerned that assets will be out of the market for too long. There is also a view that a platform is merely an administrative service and that the key features of fund choice, core functionality and charges are much the same across platforms.
10.4 Other switching behaviours
In the qualitative research we spoke to respondents that had withdrawn significant amounts to invest elsewhere or for an adviser to invest for them, to understand better their motivations for this.
Withdrawing large sums to invest elsewhere is not a common event; the examples encountered included obtaining the 25% tax free lump sum from a pension fund at age 55 to invest in a different strategy; withdrawing lump sums from ISAs to invest in property and one example of a lump sum withdrawal to invest in a start-up business. A couple had ‘withdrawn’ pension funds (described as a withdrawal although most likely a transfer) for an adviser to invest in a new, off platform pension product.
“They took the 25% tax free from my pension and that seemed alright, straightforward. They had the forms and I
would say it was easy. Non-advised, Controller
These events went smoothly for the respondents with no issues during the withdrawal process. Some mentioned how easy it was to withdraw funds given a nominated bank account is connected to the platform and the process is entirely transacted online (which is liked). The only complaint related to the time taken to receive pension funds.
NMG Consulting & boobook - Investment Platforms Market Study Consumer Research Page 73
11 Satisfaction with Investment Platforms
This chapter reviews the overall experiences that respondents have received using platforms and reflects on how current experiences are meeting expectations.
11.1 Satisfaction with platform experience
The quantitative research shows that respondents are mostly satisfied with delivery of the factors which are important to them (respondents were asked to highlight their top three factors that are most important to them now in the way they use their platform). For both advised and non-advised respondents, the majority are very or quite satisfied with the way the platform performs on the factors which are most important to them. On average 41% of non-advised respondents are ‘very satisfied’ with these factors, and for advised respondents the average is 36%.
The number of very or quite dissatisfied respondents is low across the range of factors. Respondents are more likely to be neutral about their platform experience than dissatisfied. Levels of satisfaction around charges also need to be considered in light of the levels of understanding of charges (see Chapter 9); higher levels of understanding could impact the results, positively or negatively.
“You want the information on a plate for your returns, you want it easily accessible and you want responsiveness
and we have had that from xxx and I am pretty pleased with them”. Non-advised, Controller
Key Findings of this Chapter
• Satisfaction overall with platforms is high; the majority of respondents are satisfied with the elements of their platform experience that are most important to them ongoing; breadth of investment choices rates particularly highly across both advised and non-advised groups
• Charges has the lowest satisfaction rating of all attributes considered important, particularly for non-advised respondents; 31% of non-advised consider charges important to them ongoing and 14% of these are dissatisfied with them. Respondents are more likely to feel neutral than dissatisfied with charges.
• The majority of respondents are satisfied with the activities that they have experience of undertaking on their platform
• There are other influences on satisfaction levels, for example positive investment returns and the quality of adviser relationships experienced
• Overall Net Promoter Score is +5.4% meaning that platforms have slightly more promoters than detractors; the number of loyal enthusiasts (scoring 9 or 10 out of 10) is strong at 31%
• A minority of the most demanding and engaged respondents in the qualitative research would like to change visibility, clarity and comparability of charging information
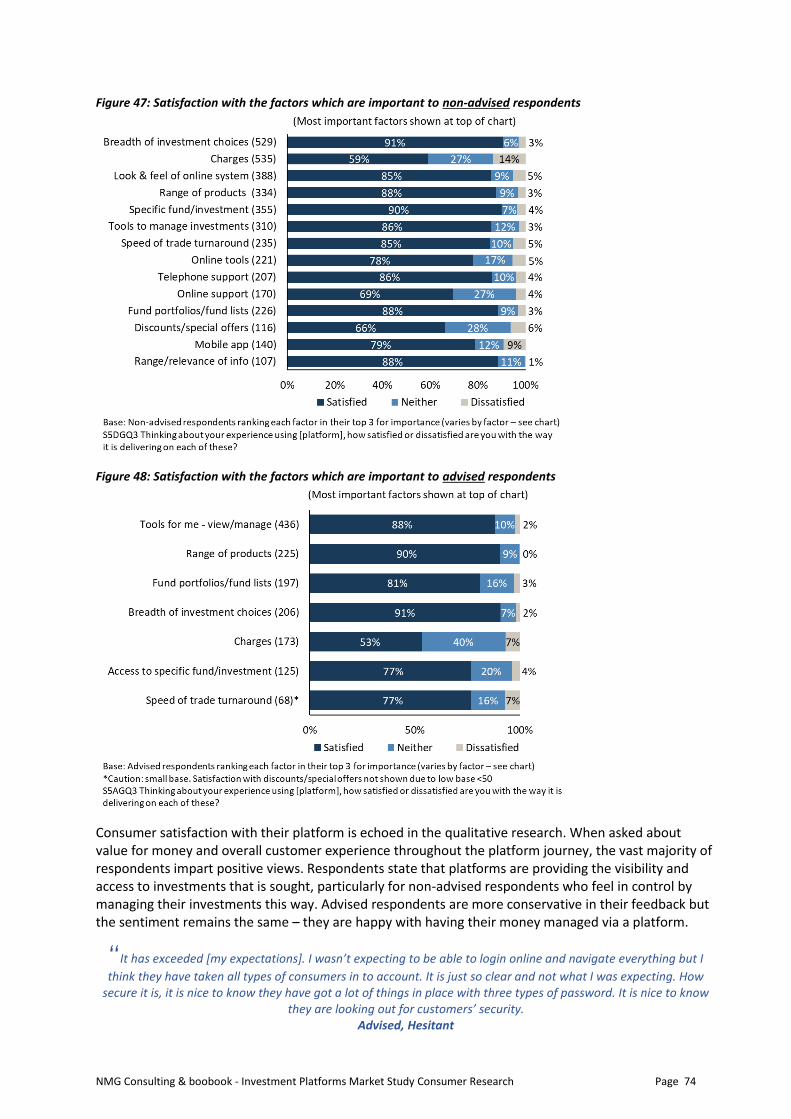
NMG Consulting & boobook - Investment Platforms Market Study Consumer Research Page 74
Figure 47: Satisfaction with the factors which are important to non-advised respondents
Figure 48: Satisfaction with the factors which are important to advised respondents
Consumer satisfaction with their platform is echoed in the qualitative research. When asked about value for money and overall customer experience throughout the platform journey, the vast majority of respondents impart positive views. Respondents state that platforms are providing the visibility and access to investments that is sought, particularly for non-advised respondents who feel in control by managing their investments this way. Advised respondents are more conservative in their feedback but the sentiment remains the same – they are happy with having their money managed via a platform.
“It has exceeded [my expectations]. I wasn’t expecting to be able to login online and navigate everything but I
think they have taken all types of consumers in to account. It is just so clear and not what I was expecting. How secure it is, it is nice to know they have got a lot of things in place with three types of password. It is nice to know
they are looking out for customers’ security. Advised, Hesitant
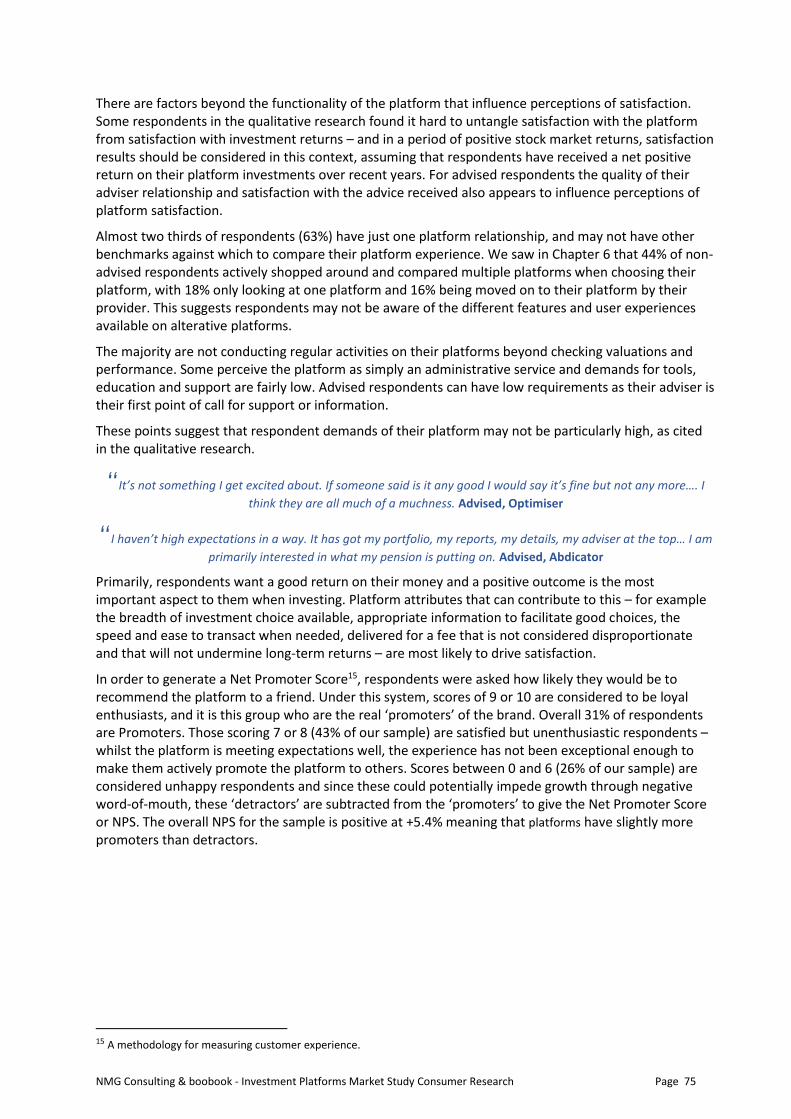
NMG Consulting & boobook - Investment Platforms Market Study Consumer Research Page 75
There are factors beyond the functionality of the platform that influence perceptions of satisfaction. Some respondents in the qualitative research found it hard to untangle satisfaction with the platform from satisfaction with investment returns – and in a period of positive stock market returns, satisfaction results should be considered in this context, assuming that respondents have received a net positive return on their platform investments over recent years. For advised respondents the quality of their adviser relationship and satisfaction with the advice received also appears to influence perceptions of platform satisfaction.
Almost two thirds of respondents (63%) have just one platform relationship, and may not have other benchmarks against which to compare their platform experience. We saw in Chapter 6 that 44% of non-advised respondents actively shopped around and compared multiple platforms when choosing their platform, with 18% only looking at one platform and 16% being moved on to their platform by their provider. This suggests respondents may not be aware of the different features and user experiences available on alterative platforms.
The majority are not conducting regular activities on their platforms beyond checking valuations and performance. Some perceive the platform as simply an administrative service and demands for tools, education and support are fairly low. Advised respondents can have low requirements as their adviser is their first point of call for support or information.
These points suggest that respondent demands of their platform may not be particularly high, as cited in the qualitative research.
“It’s not something I get excited about. If someone said is it any good I would say it’s fine but not any more…. I
think they are all much of a muchness. Advised, Optimiser
“I haven’t high expectations in a way. It has got my portfolio, my reports, my details, my adviser at the top… I am
primarily interested in what my pension is putting on. Advised, Abdicator
Primarily, respondents want a good return on their money and a positive outcome is the most important aspect to them when investing. Platform attributes that can contribute to this – for example the breadth of investment choice available, appropriate information to facilitate good choices, the speed and ease to transact when needed, delivered for a fee that is not considered disproportionate and that will not undermine long-term returns – are most likely to drive satisfaction.
In order to generate a Net Promoter Score15, respondents were asked how likely they would be to recommend the platform to a friend. Under this system, scores of 9 or 10 are considered to be loyal enthusiasts, and it is this group who are the real ‘promoters’ of the brand. Overall 31% of respondents are Promoters. Those scoring 7 or 8 (43% of our sample) are satisfied but unenthusiastic respondents – whilst the platform is meeting expectations well, the experience has not been exceptional enough to make them actively promote the platform to others. Scores between 0 and 6 (26% of our sample) are considered unhappy respondents and since these could potentially impede growth through negative word-of-mouth, these ‘detractors’ are subtracted from the ‘promoters’ to give the Net Promoter Score or NPS. The overall NPS for the sample is positive at +5.4% meaning that platforms have slightly more promoters than detractors.
15 A methodology for measuring customer experience.
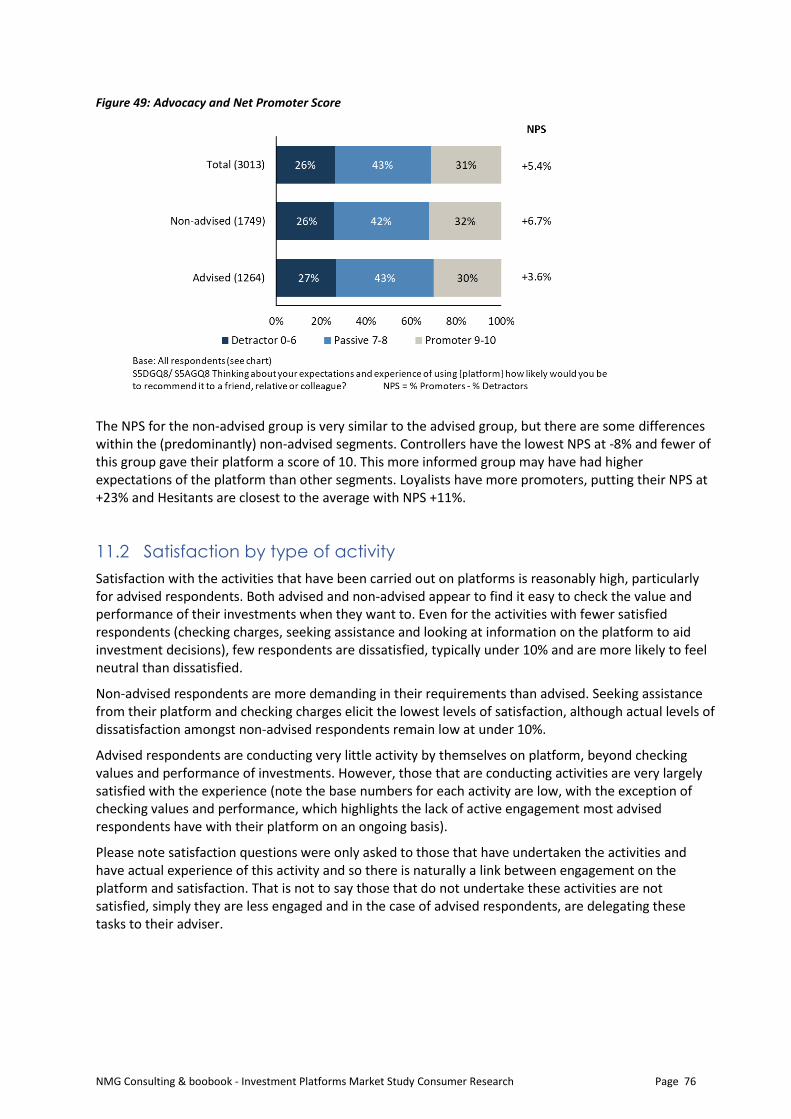
NMG Consulting & boobook - Investment Platforms Market Study Consumer Research Page 76
Figure 49: Advocacy and Net Promoter Score
The NPS for the non-advised group is very similar to the advised group, but there are some differences within the (predominantly) non-advised segments. Controllers have the lowest NPS at -8% and fewer of this group gave their platform a score of 10. This more informed group may have had higher expectations of the platform than other segments. Loyalists have more promoters, putting their NPS at +23% and Hesitants are closest to the average with NPS +11%.
11.2 Satisfaction by type of activity
Satisfaction with the activities that have been carried out on platforms is reasonably high, particularly for advised respondents. Both advised and non-advised appear to find it easy to check the value and performance of their investments when they want to. Even for the activities with fewer satisfied respondents (checking charges, seeking assistance and looking at information on the platform to aid investment decisions), few respondents are dissatisfied, typically under 10% and are more likely to feel neutral than dissatisfied.
Non-advised respondents are more demanding in their requirements than advised. Seeking assistance from their platform and checking charges elicit the lowest levels of satisfaction, although actual levels of dissatisfaction amongst non-advised respondents remain low at under 10%.
Advised respondents are conducting very little activity by themselves on platform, beyond checking values and performance of investments. However, those that are conducting activities are very largely satisfied with the experience (note the base numbers for each activity are low, with the exception of checking values and performance, which highlights the lack of active engagement most advised respondents have with their platform on an ongoing basis).
Please note satisfaction questions were only asked to those that have undertaken the activities and have actual experience of this activity and so there is naturally a link between engagement on the platform and satisfaction. That is not to say those that do not undertake these activities are not satisfied, simply they are less engaged and in the case of advised respondents, are delegating these tasks to their adviser.
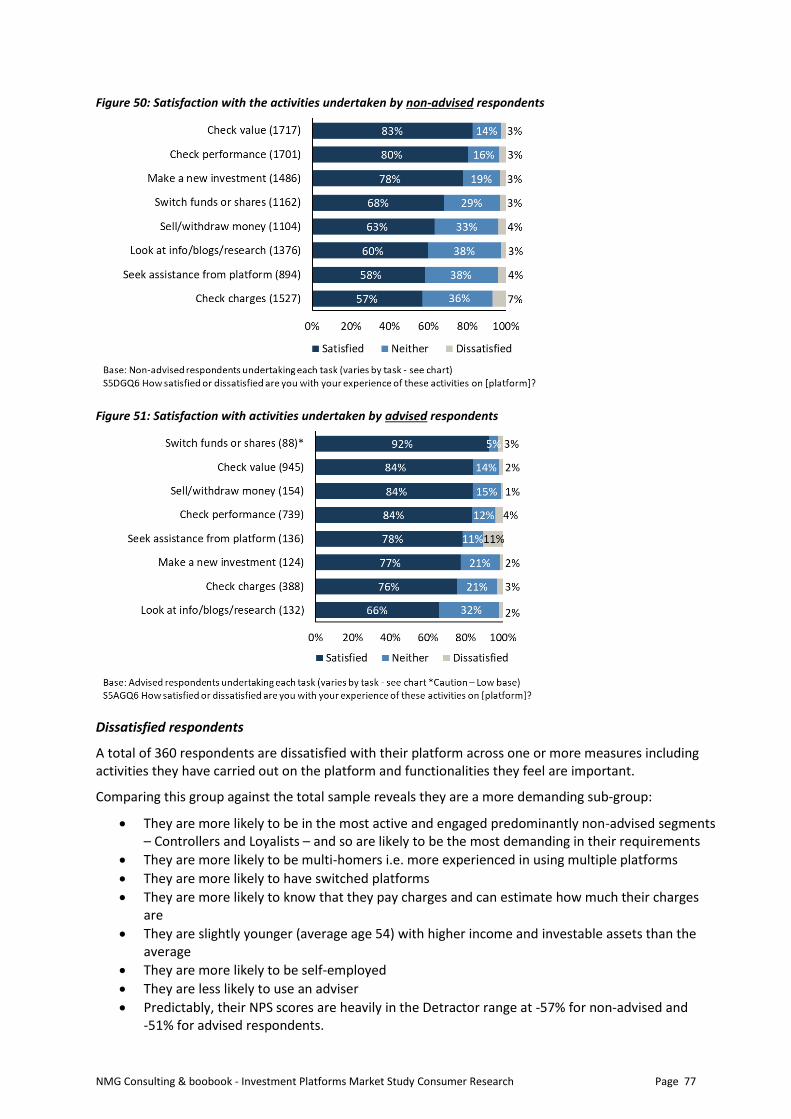
NMG Consulting & boobook - Investment Platforms Market Study Consumer Research Page 77
Figure 50: Satisfaction with the activities undertaken by non-advised respondents
Figure 51: Satisfaction with activities undertaken by advised respondents
Dissatisfied respondents
A total of 360 respondents are dissatisfied with their platform across one or more measures including activities they have carried out on the platform and functionalities they feel are important.
Comparing this group against the total sample reveals they are a more demanding sub-group:
• They are more likely to be in the most active and engaged predominantly non-advised segments – Controllers and Loyalists – and so are likely to be the most demanding in their requirements
• They are more likely to be multi-homers i.e. more experienced in using multiple platforms
• They are more likely to have switched platforms
• They are more likely to know that they pay charges and can estimate how much their charges are
• They are slightly younger (average age 54) with higher income and investable assets than the average
• They are more likely to be self-employed
• They are less likely to use an adviser
• Predictably, their NPS scores are heavily in the Detractor range at -57% for non-advised and -51% for advised respondents.
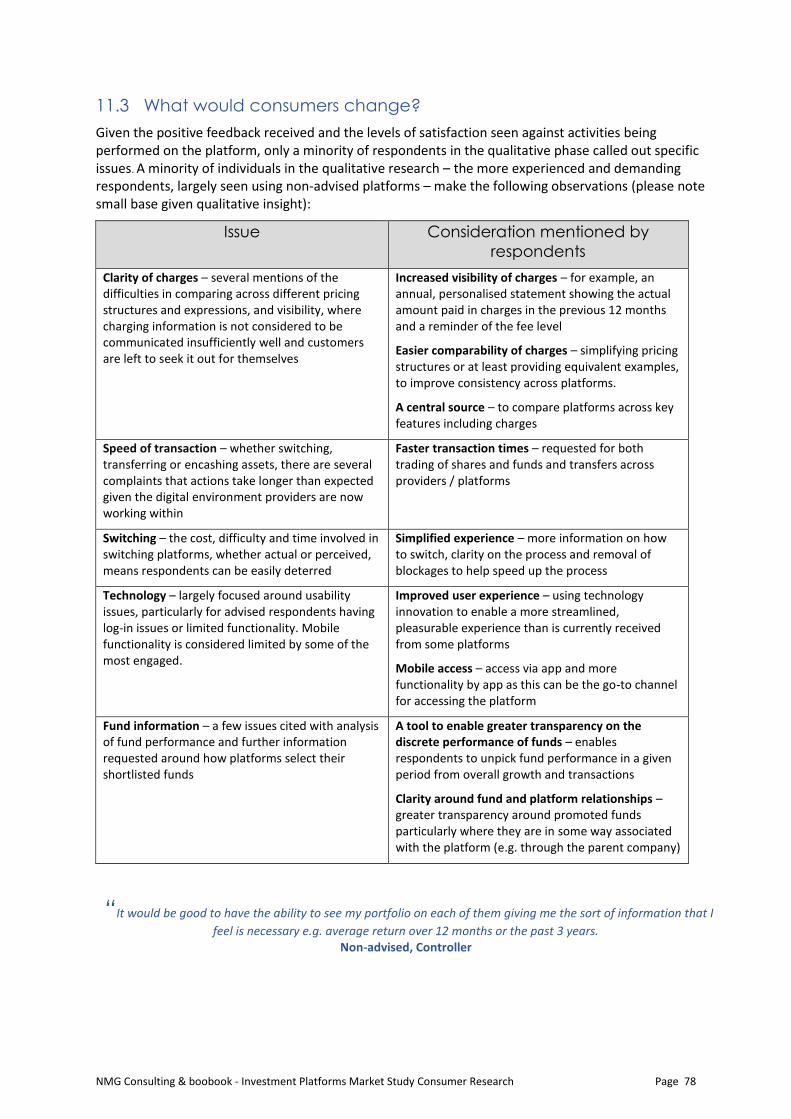
NMG Consulting & boobook - Investment Platforms Market Study Consumer Research Page 78
11.3 What would consumers change?
Given the positive feedback received and the levels of satisfaction seen against activities being performed on the platform, only a minority of respondents in the qualitative phase called out specific issues. A minority of individuals in the qualitative research – the more experienced and demanding respondents, largely seen using non-advised platforms – make the following observations (please note small base given qualitative insight):
Issue Consideration mentioned by
respondents
Clarity of charges – several mentions of the difficulties in comparing across different pricing structures and expressions, and visibility, where charging information is not considered to be communicated insufficiently well and customers are left to seek it out for themselves
Increased visibility of charges – for example, an annual, personalised statement showing the actual amount paid in charges in the previous 12 months and a reminder of the fee level
Easier comparability of charges – simplifying pricing structures or at least providing equivalent examples, to improve consistency across platforms.
A central source – to compare platforms across key features including charges
Speed of transaction – whether switching, transferring or encashing assets, there are several complaints that actions take longer than expected given the digital environment providers are now working within
Faster transaction times – requested for both trading of shares and funds and transfers across providers / platforms
Switching – the cost, difficulty and time involved in switching platforms, whether actual or perceived, means respondents can be easily deterred
Simplified experience – more information on how to switch, clarity on the process and removal of blockages to help speed up the process
Technology – largely focused around usability issues, particularly for advised respondents having log-in issues or limited functionality. Mobile functionality is considered limited by some of the most engaged.
Improved user experience – using technology innovation to enable a more streamlined, pleasurable experience than is currently received from some platforms
Mobile access – access via app and more functionality by app as this can be the go-to channel for accessing the platform
Fund information – a few issues cited with analysis of fund performance and further information requested around how platforms select their shortlisted funds
A tool to enable greater transparency on the discrete performance of funds – enables respondents to unpick fund performance in a given period from overall growth and transactions
Clarity around fund and platform relationships –greater transparency around promoted funds particularly where they are in some way associated with the platform (e.g. through the parent company)
“It would be good to have the ability to see my portfolio on each of them giving me the sort of information that I
feel is necessary e.g. average return over 12 months or the past 3 years. Non-advised, Controller
NMG Consulting & boobook - Investment Platforms Market Study Consumer Research Page 79
Appendix A – Segmentation of the market
1 Segmentation of the market
The sample comprised respondents with a range of different backgrounds, experiences and needs. While there are some overall trends there are key differences between them in their attitudes, behaviours and motivations for using investment platforms. For this reason, a segmentation of the sample was undertaken in order to determine the main differentiating areas between groups.
The aim of the segmentation is to identify segments that have strong similarities between consumers within a segment, but strong differences between consumers in different segments. Dimensions that were focused on were:
A. Financial engagement B. Financial attitude C. Investments D. Switching E. Reasons for platform use These dimensions were selected based on the feedback from the initial qualitative survey which demonstrated links between them and respondents’ different considerations around their platform use. Within these dimensions specific questions were used in a clustering process to generate six consumer segments.
A. Financial engagement Relates to the types of activities consumers are engaging with on their platforms. Those who are proactive are more frequently making changes to and researching their investments, while others simply monitor on a less frequent basis.
B. Financial attitudes Measures respondent knowledge and confidence in managing their investments, how risk averse they are and their interest in keeping up to date with financial news.
C. Investments This concerns the nature of respondent investments, particularly around the number of platforms they are using and the types of products that they hold.
D. Switching This looks at whether respondents have recently moved investments from one platform to another or have placed investments into a new platform instead of their existing ones.
E. Reasons for platform use Finally, reasons for platform use differentiates respondents based on what their perceived need is from their platforms.
Using these five dimensions resulted in a segment solution that included six consumer segments.
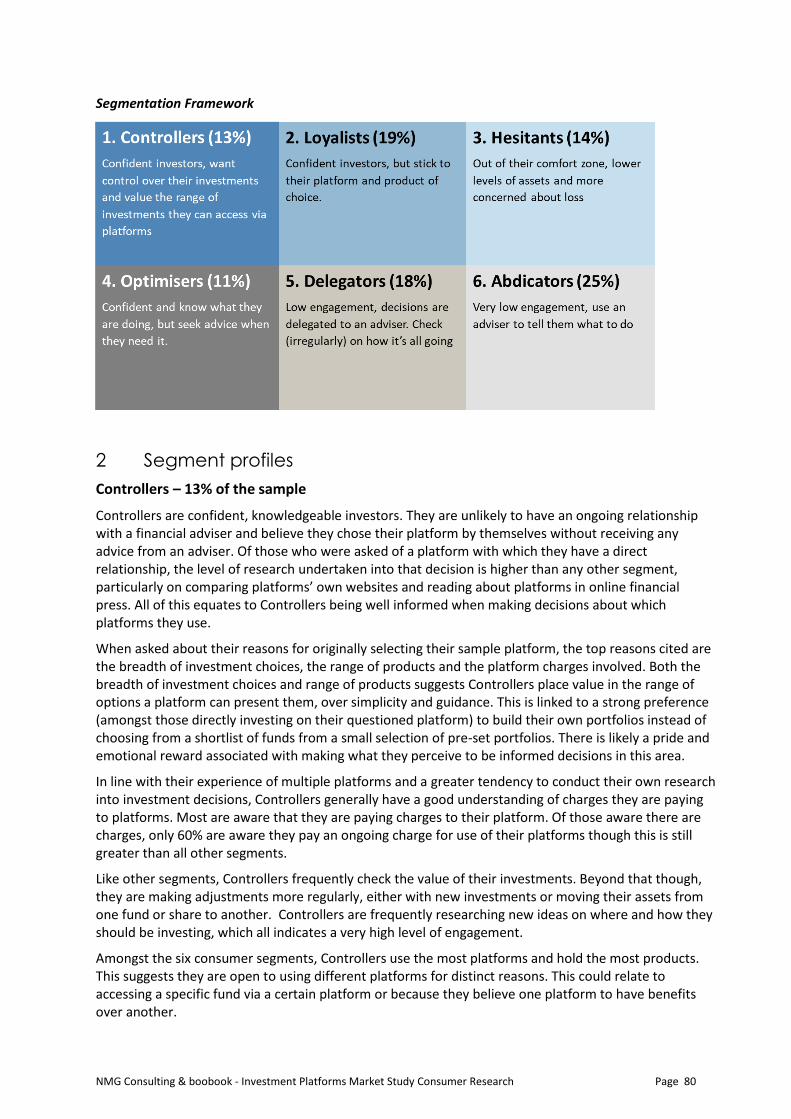
NMG Consulting & boobook - Investment Platforms Market Study Consumer Research Page 80
Segmentation Framework
2 Segment profiles
Controllers – 13% of the sample
Controllers are confident, knowledgeable investors. They are unlikely to have an ongoing relationship with a financial adviser and believe they chose their platform by themselves without receiving any advice from an adviser. Of those who were asked of a platform with which they have a direct relationship, the level of research undertaken into that decision is higher than any other segment, particularly on comparing platforms’ own websites and reading about platforms in online financial press. All of this equates to Controllers being well informed when making decisions about which platforms they use.
When asked about their reasons for originally selecting their sample platform, the top reasons cited are the breadth of investment choices, the range of products and the platform charges involved. Both the breadth of investment choices and range of products suggests Controllers place value in the range of options a platform can present them, over simplicity and guidance. This is linked to a strong preference (amongst those directly investing on their questioned platform) to build their own portfolios instead of choosing from a shortlist of funds from a small selection of pre-set portfolios. There is likely a pride and emotional reward associated with making what they perceive to be informed decisions in this area.
In line with their experience of multiple platforms and a greater tendency to conduct their own research into investment decisions, Controllers generally have a good understanding of charges they are paying to platforms. Most are aware that they are paying charges to their platform. Of those aware there are charges, only 60% are aware they pay an ongoing charge for use of their platforms though this is still greater than all other segments.
Like other segments, Controllers frequently check the value of their investments. Beyond that though, they are making adjustments more regularly, either with new investments or moving their assets from one fund or share to another. Controllers are frequently researching new ideas on where and how they should be investing, which all indicates a very high level of engagement.
Amongst the six consumer segments, Controllers use the most platforms and hold the most products. This suggests they are open to using different platforms for distinct reasons. This could relate to accessing a specific fund via a certain platform or because they believe one platform to have benefits over another.
NMG Consulting & boobook - Investment Platforms Market Study Consumer Research Page 81
With a high degree of awareness and a high degree of engagement, it is no surprise that we see the Controllers displaying the highest propensity to switch platforms amongst our segments. They are the most likely to have either moved investments from one platform to another, or to have stopped using a platform and place future investments into an alternative platform.
Loyalists – 19% of the sample
On average Loyalists’ total investible assets are far lower than Controllers. However, their attitude to risk does not seem to be affected by their lower level of assets, as they are equally comfortable with high risk, high reward assets.
Similar to Controllers, Loyalists most stated reason for using a platform is control over their investments. However, 24/7 access and the convenience of having their investments in one place is more important, an aspect which has a large impact on their use of platforms.
Loyalists use fewer platforms than any other segment, averaging just 1.1 platforms. This suggests perceived value in the ability to see and manage their investments via a single platform as opposed to using several alternatives. This said, one of their main reasons for choosing their questioned platform was the breadth of investment choices it offered. So, while they prefer to use only a single platform, they also require the ability to choose their own portfolio.
Frequency of interaction with platforms is also similar to the Controller segment. Loyalists are as likely as Controllers to be frequently checking their investments, placing new investments or moving assets from one fund to another. They are also making use of platform tools to regularly monitor and inform their investment decisions.
Awareness of charges is high amongst Loyalists, though again awareness of annual platform charges is lower.
Loyalists are highly unlikely to switch their platform provider. In the last three years, only 5% have moved their investments from one platform to another and only 5% have started using another platform. When questioned about why they have not switched platforms, the most common response was simply that they are happy with how things are (58%). This suggests a great deal of inertia present in the minds of Loyalists and possibly a reluctance to further research alternatives that may be more suitable for them.
Hesitants – 14% of the sample
Hesitants are a segment more out of their comfort zone when managing their investments. They do not consider themselves to be knowledgeable, they have less interest in financial news and are more risk averse. Despite this, the majority have no relationship with a financial adviser and are hence still making their own decisions. Most were questioned on a platform that they have a direct relationship with.
Non-advised Hesitants are more likely than any other segment to have heard about their platform from a family member, friend or colleague. Almost half did no research into other platforms, with the most common reason for this that they trusted the recommendation they had received. This referral route into choosing a platform without researching alternatives does expose this segment to potentially being on a platform that does not best suit their personal needs.
Awareness of charges is lower than the other segments apart from Abdicators, the least engaged segment. Similarly, of those aware of charges, only 39% are aware of ongoing annual charges from their platform.
When deciding how to invest on their platforms, 38% of Hesitants with a direct platform relationship are basing this on their own research, much lower than other segments. Instead 18% are trusting recommendations made by family or friends, further embedding the impact of advice that may or may not be suitable to their position.
NMG Consulting & boobook - Investment Platforms Market Study Consumer Research Page 82
Hesitants are less likely to be making regular contributions to their investments and more likely to have stopped contributing to investments on their platform altogether. With the lowest household income of all segments this could indicate that they have made their investments as a one-off, again based on recommendations.
Switching platforms is not a behaviour Hesitants are likely to undertake, most have not engaged in any form of switching behaviour in the last three years. When asked why they have not considered switching the main reason is that they are happy with how things are although there are greater levels of reluctance mentioned too: too much time and effort, it would cost more, hard to compare platforms, have to get used to new website. These are all low, but higher than all other segments.
Optimisers – 11% of the sample
Optimisers consider themselves to be knowledgeable about investments and have an interest in financial news. They are confident making financial decisions by themselves, but less so than either Controllers or Loyalists. This is reflected in a greater likelihood to have a relationship with a financial adviser and a majority having used a financial adviser when choosing their platforms.
Amongst non-advised Optimisers, the main sources for finding their platforms were on the internet or a recommendation from a family member, friend or colleague. Compared to Hesitants (who also have a high proportion of recommendation) however, non-advised Optimisers performed much more research, reading platforms own websites and consulting online financial press. From this perspective, and with their greater reliance on financial advisers, Optimisers are less likely to have selected a platform that does not suit their needs.
Optimisers’ awareness of platform charges is relatively high, with most aware that they are charged for investing through their platforms. However, this is slightly lower than Controllers and Loyalists, which is possibly due to more reliance on financial advisers. Amongst those that are aware they are paying charges, just under half are aware of annual platform charges.
Of the Optimisers who have a direct relationship with their platform, their main preference for choosing investments is to build their own portfolio. However, the proportion who chose to do this is much lower than Controllers and Loyalists, and there is a sizable proportion who chose from a small section of pre-set portfolios graded on risk. This is likely linked to their lower confidence than Controllers and Loyalists in making their own decisions.
In terms of products held, Optimisers are likely to hold stocks and shares ISAs and personal pensions. They are also much more likely to be making regular automated contributions, while other segments are more likely to be making lump sum payments or no longer contributing, reflective of the high proportion in work.
On average, an Optimiser is using two platforms. The main stated reason for using more than one platform is because they do not want all their money in one place, but there is also a higher proportion than other segments who have a platform for a workplace pension.
Optimisers are not averse to switching their platform, with 57% having completed one of the switching activities. Of those that have switched the main stated reason was to reduce overall charges.
Delegators – 18% of the sample
Delegators are less knowledgeable and less confident consumers and hence have less appetite for high risk investments. Because of this, they are likely to have an ongoing relationship with a financial adviser. Being older than other segments (61 on average), Delegators are more likely to own their home outright, have no children living at home and be retired.
Their main stated reason for using a platform is the convenience of having all of their investments in one place, followed by their adviser using the platform to manage their assets, indicating a hands-off approach to managing their investments. Most consider their adviser primarily responsible for choosing their platform.
NMG Consulting & boobook - Investment Platforms Market Study Consumer Research Page 83
Amongst Delegators, awareness that they are paying platform charges is relatively high. However, of those only 47% are aware of ongoing annual charges. This may be due to a lack of understanding of platforms or details provided by their adviser, or it could alternatively indicate a lack of interest from a segment that attitudinally is not highly engaged.
Amongst advised Delegators, many feel they made some contribution to the decision to use that platform, having discussed several options with their adviser. However, when it comes to choosing the specific investments, they were heavily reliant on their advisers. Similarly, of non-advised Delegators, few are switching from one fund or share to another. Only a small proportion are also likely to contact the platform for support, suggesting they are unlikely to reach out for help.
On average, Delegators are using 1.7 platforms. Their most common products held are stocks and shares ISAs, though there are also a reasonable proportion with funds and personal pensions managed on platforms.
Delegators are unlikely to switch with 78% having not undertaken any form of switching.
This combination of lack of engagement and knowledge does leave Delegators and particularly non-advised Delegators at risk of being on a platform that is not the most appropriate for them.
Abdicators – 25% of the sample
Abdicators are the largest segment, representing a quarter of platform investors. Of all segments, they are least knowledgeable about investments, least engaged and feel most out of their comfort zone when managing their investments online. Most have an ongoing relationship with a financial adviser or deal with one when have something they don’t feel they can do themselves, which given their lack of knowledge and confidence likely represents the majority of their investment choices. Abdicators are the least engaged segment and hence are using their platforms the least, with their advisers taking on this responsibility. The value and benefits of platforms are therefore likely to be less obvious to them.
While most Abdicators were questioned about a platform with which they have an advised relationship, a proportion are investing directly with a platform. The most likely way these consumers heard about their platform was either that they were moved to the platform or they were already a customer for something else. Of these non-advised consumers, many did no research or do not remember doing research.
Overall, Abdicators have a low awareness of charges, which could be due to reliance on advisers or lack of interest or engagement.
Advised Abdicators rely on their advisers to choose specific investments, with most paying a fee to an adviser to choose their investment. A significant proportion do not remember how their investments were chosen, again indicating lack of engagement with their investments overall. Of all segments, Abdicators are least likely to monitor their investments (66% leave this to their financial adviser).
The majority of Abdicators are no longer contributing to the investments on their platforms, but some are still making regular automated contributions. This is likely related to their product holding, which is typically stock and shares ISAs or personal pensions.
Abdicators are the segment least likely to switch their platform. Only 8% have undertaken any form of switching.
Abdicators are the least engaged segment and hence are using their platforms the least. The value and benefits of platforms are therefore likely to be more limited to them.
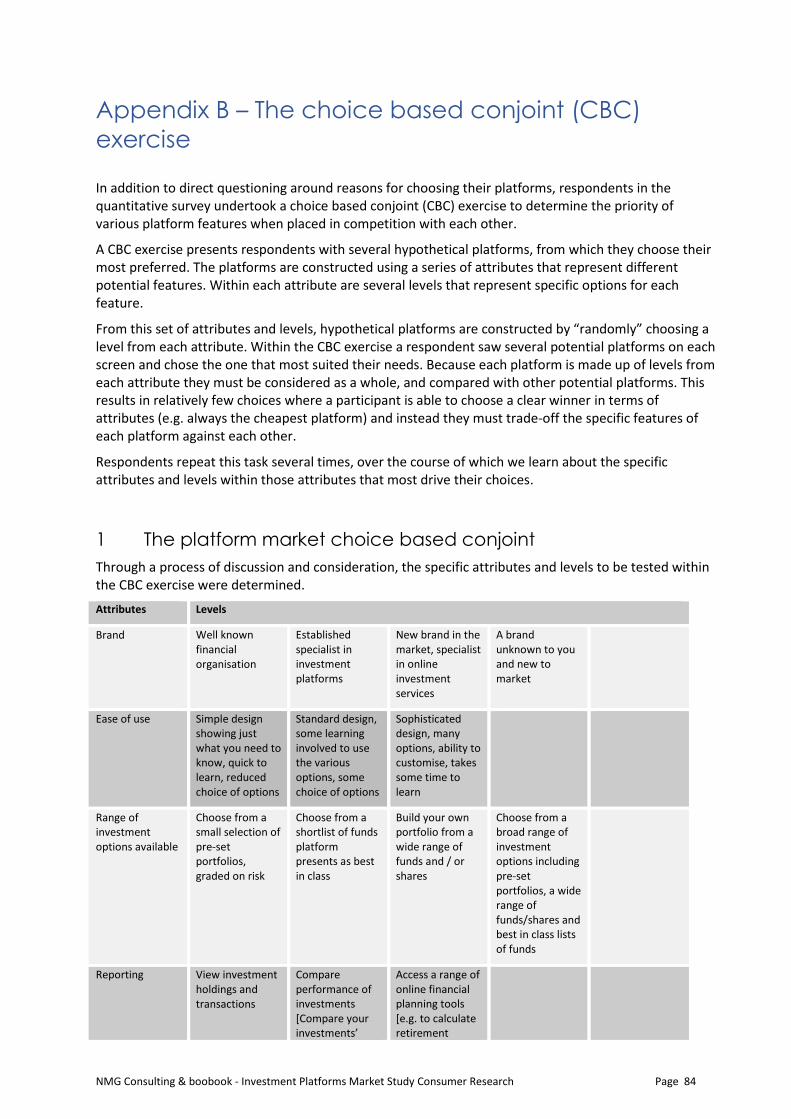
NMG Consulting & boobook - Investment Platforms Market Study Consumer Research Page 84
Appendix B – The choice based conjoint (CBC)
exercise
In addition to direct questioning around reasons for choosing their platforms, respondents in the quantitative survey undertook a choice based conjoint (CBC) exercise to determine the priority of various platform features when placed in competition with each other.
A CBC exercise presents respondents with several hypothetical platforms, from which they choose their most preferred. The platforms are constructed using a series of attributes that represent different potential features. Within each attribute are several levels that represent specific options for each feature.
From this set of attributes and levels, hypothetical platforms are constructed by “randomly” choosing a level from each attribute. Within the CBC exercise a respondent saw several potential platforms on each screen and chose the one that most suited their needs. Because each platform is made up of levels from each attribute they must be considered as a whole, and compared with other potential platforms. This results in relatively few choices where a participant is able to choose a clear winner in terms of attributes (e.g. always the cheapest platform) and instead they must trade-off the specific features of each platform against each other.
Respondents repeat this task several times, over the course of which we learn about the specific attributes and levels within those attributes that most drive their choices.
1 The platform market choice based conjoint
Through a process of discussion and consideration, the specific attributes and levels to be tested within the CBC exercise were determined.
Attributes Levels
Brand Well known financial organisation
Established specialist in investment platforms
New brand in the market, specialist in online investment services
A brand unknown to you and new to market
Ease of use Simple design showing just what you need to know, quick to learn, reduced choice of options
Standard design, some learning involved to use the various options, some choice of options
Sophisticated design, many options, ability to customise, takes some time to learn
Range of investment options available
Choose from a small selection of pre-set portfolios, graded on risk
Choose from a shortlist of funds platform presents as best in class
Build your own portfolio from a wide range of funds and / or shares
Choose from a broad range of investment options including pre-set portfolios, a wide range of funds/shares and best in class lists of funds
Reporting View investment holdings and transactions
Compare performance of investments [Compare your investments’
Access a range of online financial planning tools [e.g. to calculate retirement
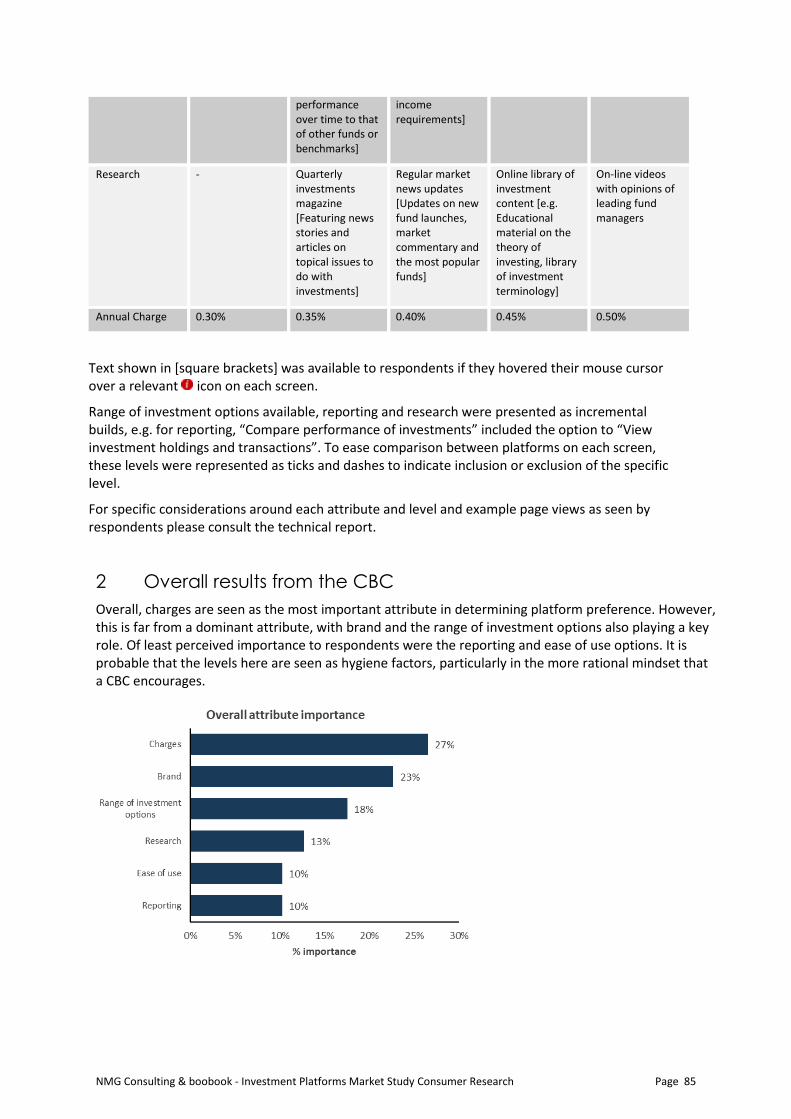
NMG Consulting & boobook - Investment Platforms Market Study Consumer Research Page 85
performance over time to that of other funds or benchmarks]
income requirements]
Research - Quarterly investments magazine [Featuring news stories and articles on topical issues to do with investments]
Regular market news updates [Updates on new fund launches, market commentary and the most popular funds]
Online library of investment content [e.g. Educational material on the theory of investing, library of investment terminology]
On-line videos with opinions of leading fund managers
Annual Charge 0.30% 0.35% 0.40% 0.45% 0.50%
Text shown in [square brackets] was available to respondents if they hovered their mouse cursor over a relevant icon on each screen.
Range of investment options available, reporting and research were presented as incremental builds, e.g. for reporting, “Compare performance of investments” included the option to “View investment holdings and transactions”. To ease comparison between platforms on each screen, these levels were represented as ticks and dashes to indicate inclusion or exclusion of the specific level.
For specific considerations around each attribute and level and example page views as seen by respondents please consult the technical report.
2 Overall results from the CBC
Overall, charges are seen as the most important attribute in determining platform preference. However, this is far from a dominant attribute, with brand and the range of investment options also playing a key role. Of least perceived importance to respondents were the reporting and ease of use options. It is probable that the levels here are seen as hygiene factors, particularly in the more rational mindset that a CBC encourages.
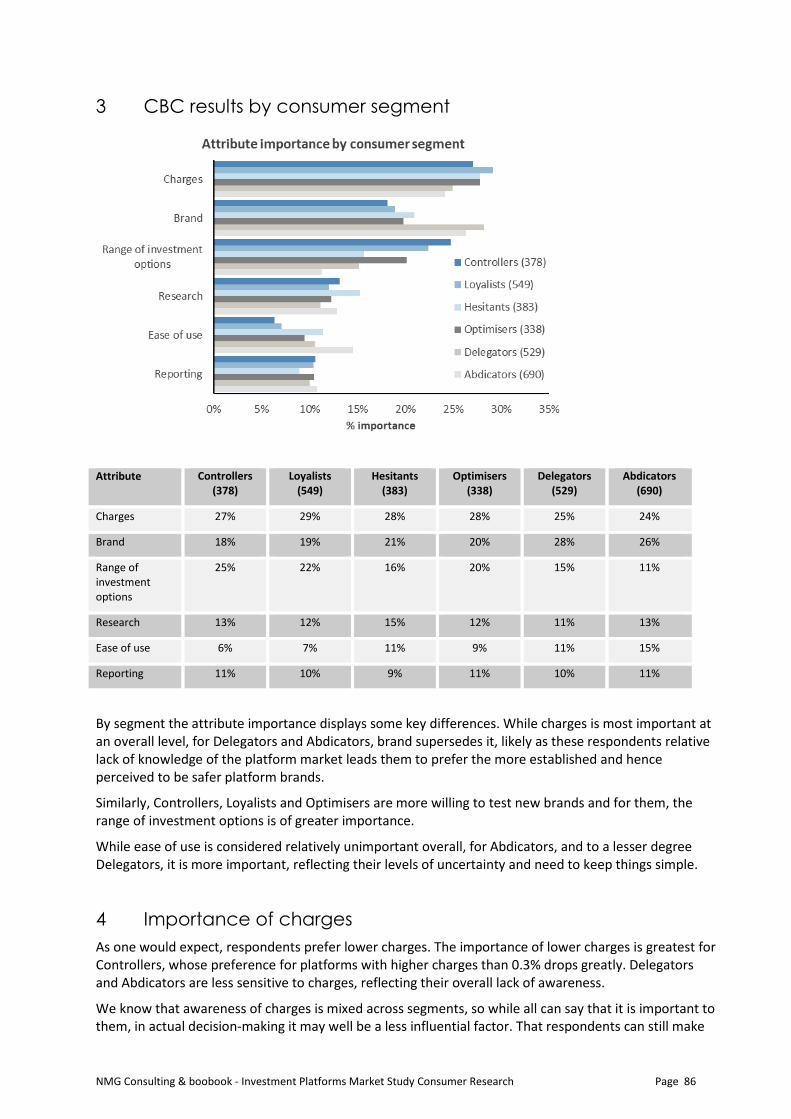
NMG Consulting & boobook - Investment Platforms Market Study Consumer Research Page 86
3 CBC results by consumer segment
Attribute Controllers (378)
Loyalists (549)
Hesitants (383)
Optimisers (338)
Delegators (529)
Abdicators (690)
Charges 27% 29% 28% 28% 25% 24%
Brand 18% 19% 21% 20% 28% 26%
Range of investment options
25% 22% 16% 20% 15% 11%
Research 13% 12% 15% 12% 11% 13%
Ease of use 6% 7% 11% 9% 11% 15%
Reporting 11% 10% 9% 11% 10% 11%
By segment the attribute importance displays some key differences. While charges is most important at an overall level, for Delegators and Abdicators, brand supersedes it, likely as these respondents relative lack of knowledge of the platform market leads them to prefer the more established and hence perceived to be safer platform brands.
Similarly, Controllers, Loyalists and Optimisers are more willing to test new brands and for them, the range of investment options is of greater importance.
While ease of use is considered relatively unimportant overall, for Abdicators, and to a lesser degree Delegators, it is more important, reflecting their levels of uncertainty and need to keep things simple.
4 Importance of charges
As one would expect, respondents prefer lower charges. The importance of lower charges is greatest for Controllers, whose preference for platforms with higher charges than 0.3% drops greatly. Delegators and Abdicators are less sensitive to charges, reflecting their overall lack of awareness.
We know that awareness of charges is mixed across segments, so while all can say that it is important to them, in actual decision-making it may well be a less influential factor. That respondents can still make
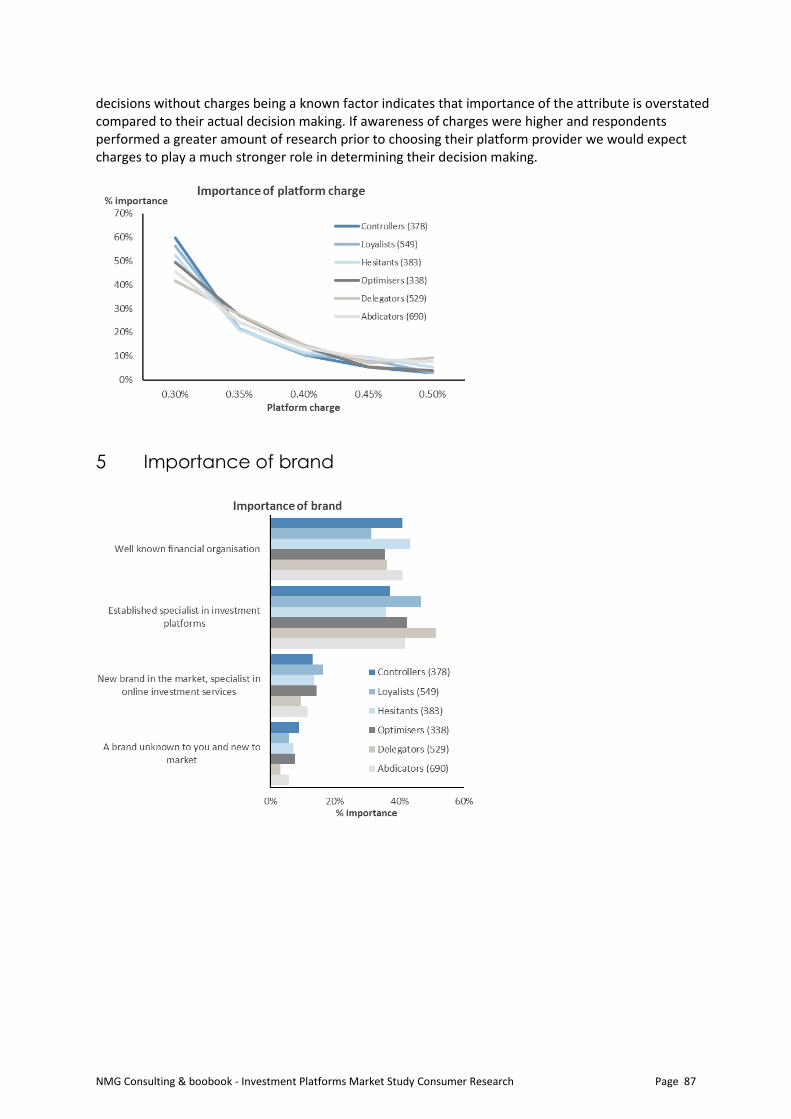
NMG Consulting & boobook - Investment Platforms Market Study Consumer Research Page 87
decisions without charges being a known factor indicates that importance of the attribute is overstated compared to their actual decision making. If awareness of charges were higher and respondents performed a greater amount of research prior to choosing their platform provider we would expect charges to play a much stronger role in determining their decision making.
5 Importance of brand
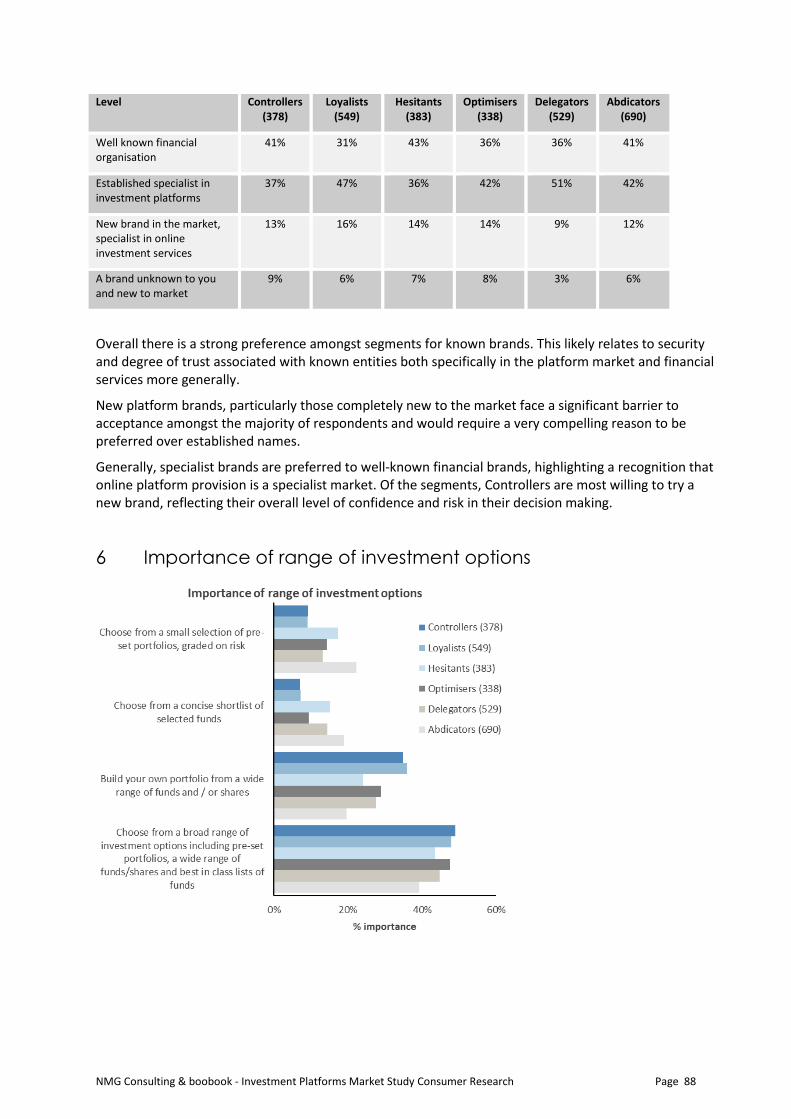
NMG Consulting & boobook - Investment Platforms Market Study Consumer Research Page 88
Level Controllers (378)
Loyalists (549)
Hesitants (383)
Optimisers (338)
Delegators (529)
Abdicators (690)
Well known financial organisation
41% 31% 43% 36% 36% 41%
Established specialist in investment platforms
37% 47% 36% 42% 51% 42%
New brand in the market, specialist in online investment services
13% 16% 14% 14% 9% 12%
A brand unknown to you and new to market
9% 6% 7% 8% 3% 6%
Overall there is a strong preference amongst segments for known brands. This likely relates to security and degree of trust associated with known entities both specifically in the platform market and financial services more generally.
New platform brands, particularly those completely new to the market face a significant barrier to acceptance amongst the majority of respondents and would require a very compelling reason to be preferred over established names.
Generally, specialist brands are preferred to well-known financial brands, highlighting a recognition that online platform provision is a specialist market. Of the segments, Controllers are most willing to try a new brand, reflecting their overall level of confidence and risk in their decision making.
6 Importance of range of investment options
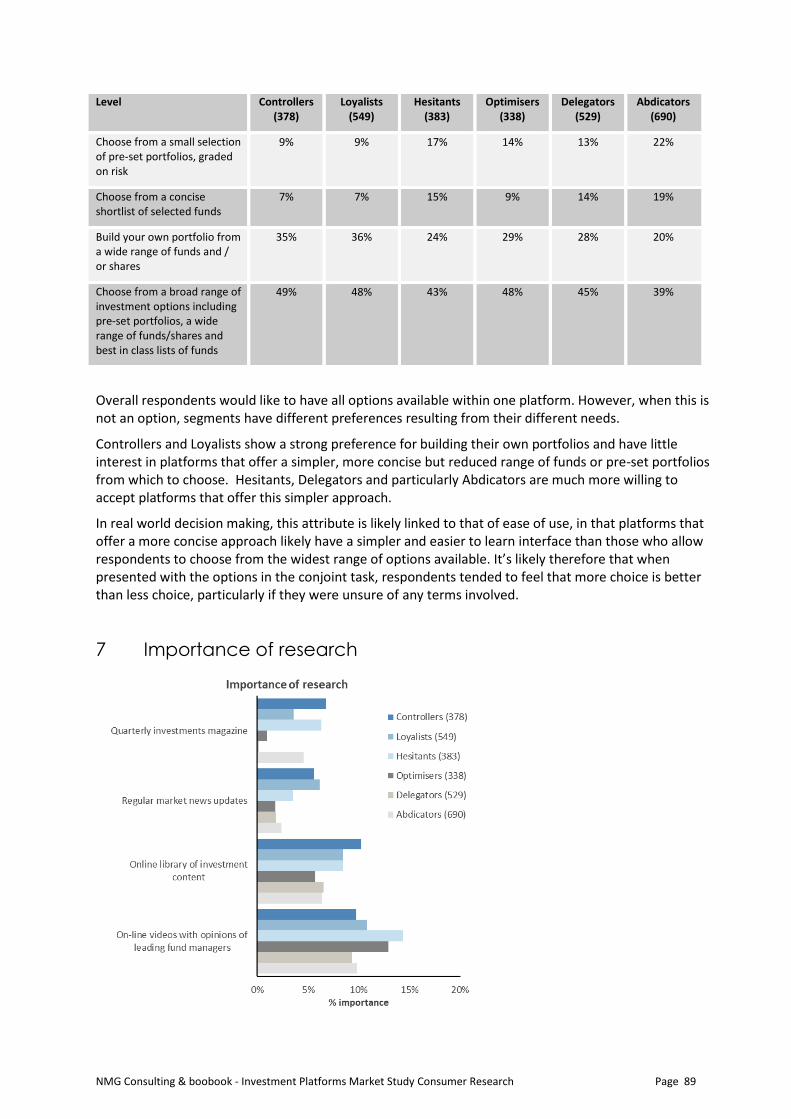
NMG Consulting & boobook - Investment Platforms Market Study Consumer Research Page 89
Level Controllers (378)
Loyalists (549)
Hesitants (383)
Optimisers (338)
Delegators (529)
Abdicators (690)
Choose from a small selection of pre-set portfolios, graded on risk
9% 9% 17% 14% 13% 22%
Choose from a concise shortlist of selected funds
7% 7% 15% 9% 14% 19%
Build your own portfolio from a wide range of funds and / or shares
35% 36% 24% 29% 28% 20%
Choose from a broad range of investment options including pre-set portfolios, a wide range of funds/shares and best in class lists of funds
49% 48% 43% 48% 45% 39%
Overall respondents would like to have all options available within one platform. However, when this is not an option, segments have different preferences resulting from their different needs.
Controllers and Loyalists show a strong preference for building their own portfolios and have little interest in platforms that offer a simpler, more concise but reduced range of funds or pre-set portfolios from which to choose. Hesitants, Delegators and particularly Abdicators are much more willing to accept platforms that offer this simpler approach.
In real world decision making, this attribute is likely linked to that of ease of use, in that platforms that offer a more concise approach likely have a simpler and easier to learn interface than those who allow respondents to choose from the widest range of options available. It’s likely therefore that when presented with the options in the conjoint task, respondents tended to feel that more choice is better than less choice, particularly if they were unsure of any terms involved.
7 Importance of research
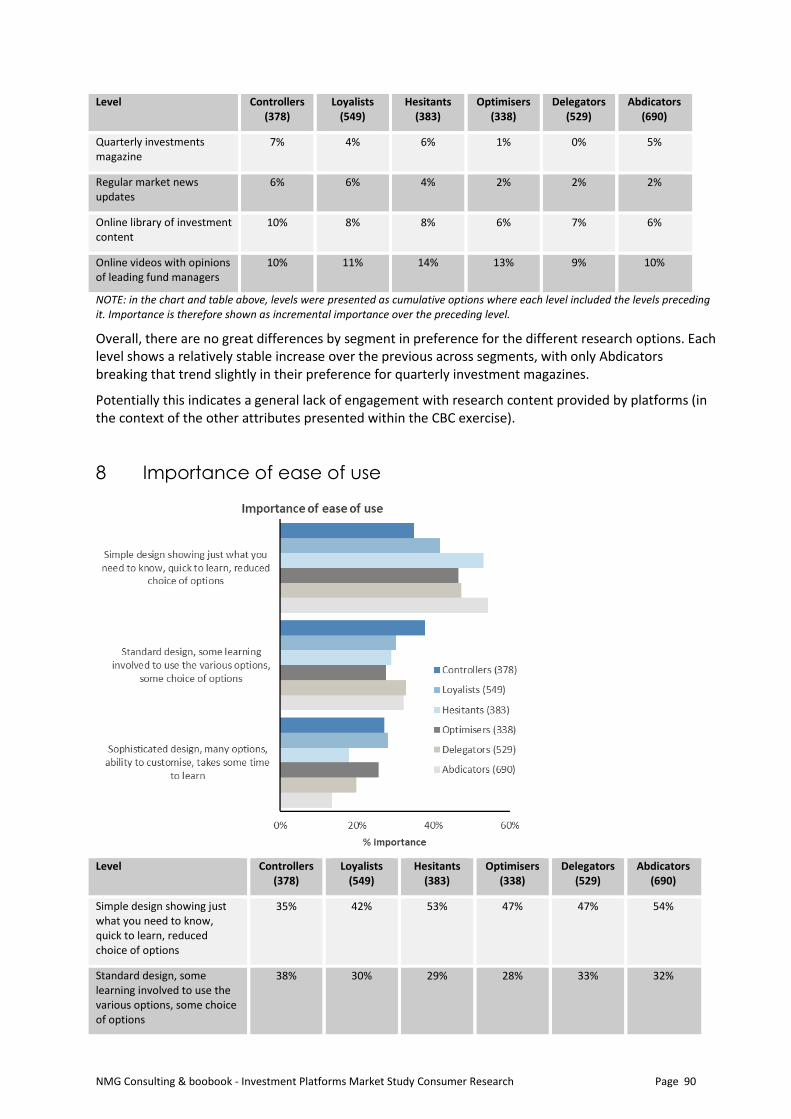
NMG Consulting & boobook - Investment Platforms Market Study Consumer Research Page 90
Level Controllers (378)
Loyalists (549)
Hesitants (383)
Optimisers (338)
Delegators (529)
Abdicators (690)
Quarterly investments magazine
7% 4% 6% 1% 0% 5%
Regular market news updates
6% 6% 4% 2% 2% 2%
Online library of investment content
10% 8% 8% 6% 7% 6%
Online videos with opinions of leading fund managers
10% 11% 14% 13% 9% 10%
NOTE: in the chart and table above, levels were presented as cumulative options where each level included the levels preceding it. Importance is therefore shown as incremental importance over the preceding level.
Overall, there are no great differences by segment in preference for the different research options. Each level shows a relatively stable increase over the previous across segments, with only Abdicators breaking that trend slightly in their preference for quarterly investment magazines.
Potentially this indicates a general lack of engagement with research content provided by platforms (in the context of the other attributes presented within the CBC exercise).
8 Importance of ease of use
Level Controllers (378)
Loyalists (549)
Hesitants (383)
Optimisers (338)
Delegators (529)
Abdicators (690)
Simple design showing just what you need to know, quick to learn, reduced choice of options
35% 42% 53% 47% 47% 54%
Standard design, some learning involved to use the various options, some choice of options
38% 30% 29% 28% 33% 32%
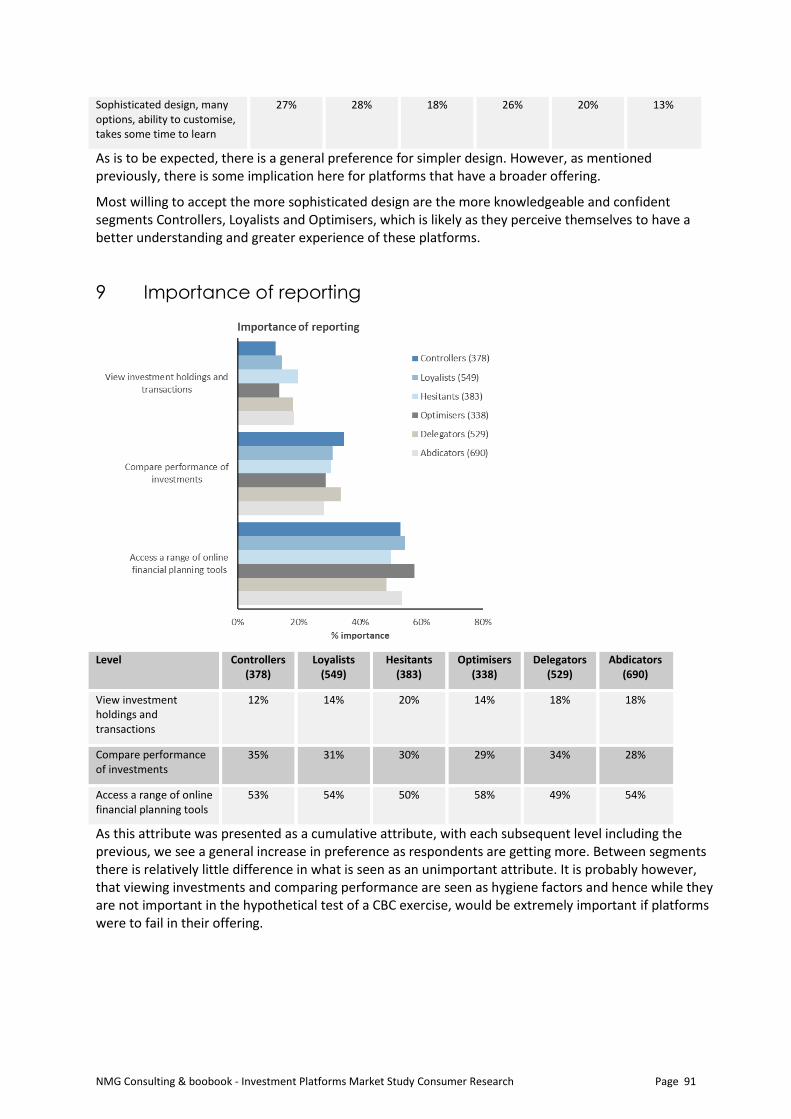
NMG Consulting & boobook - Investment Platforms Market Study Consumer Research Page 91
Sophisticated design, many options, ability to customise, takes some time to learn
27% 28% 18% 26% 20% 13%
As is to be expected, there is a general preference for simpler design. However, as mentioned previously, there is some implication here for platforms that have a broader offering.
Most willing to accept the more sophisticated design are the more knowledgeable and confident segments Controllers, Loyalists and Optimisers, which is likely as they perceive themselves to have a better understanding and greater experience of these platforms.
9 Importance of reporting
Level Controllers (378)
Loyalists (549)
Hesitants (383)
Optimisers (338)
Delegators (529)
Abdicators (690)
View investment holdings and transactions
12% 14% 20% 14% 18% 18%
Compare performance of investments
35% 31% 30% 29% 34% 28%
Access a range of online financial planning tools
53% 54% 50% 58% 49% 54%
As this attribute was presented as a cumulative attribute, with each subsequent level including the previous, we see a general increase in preference as respondents are getting more. Between segments there is relatively little difference in what is seen as an unimportant attribute. It is probably however, that viewing investments and comparing performance are seen as hygiene factors and hence while they are not important in the hypothetical test of a CBC exercise, would be extremely important if platforms were to fail in their offering.