
NLH 2013 Amended General Rate Application Undertaking - Pr · PDF file ·...
79
NLH 2013 Amended General Rate Application Undertaking - Pr- 7 Filed: •1109 lui Min - Board Secretary: ,(,P< Undertaking 78 Re: Investigation and Hearing into Supply Issues and Power Outages on the Island Interconnected System Undertake to provide the opinion from the OEM (from the Root Cause Failure Analysis Report) on the transformer at the time of the failure. Please see Undertaking 78, Attachment 1 for the opinion from the Original Equipment Manufacturer, ABB, into the Sunnyside Transformer T1 Fire which occurred on January 4, 2015. This was originally filed on March 24, 2015, as Appendix 7 of Hydro's Root Cause Investigation of System Disturbances On January 4 and 5, 2014.
Transcript of NLH 2013 Amended General Rate Application Undertaking - Pr · PDF file ·...

NLH 2013 Amended General Rate ApplicationUndertaking - Pr- 7Filed: •1109
lui Min- Board Secretary: ,(,P<
Undertaking 78
Re: Investigation and Hearing into Supply Issues and Power Outages on the Island Interconnected
System
Undertake to provide the opinion from the OEM (from the Root Cause Failure Analysis Report) onthe transformer at the time of the failure.
Please see Undertaking 78, Attachment 1 for the opinion from the Original EquipmentManufacturer, ABB, into the Sunnyside Transformer T1 Fire which occurred on January 4,2015. This was originally filed on March 24, 2015, as Appendix 7 of Hydro's Root Cause Investigationof System Disturbances On January 4 and 5, 2014.

Xxxxxx – NALCOR Design Study & Failure Investigation Draft Page 1
DESIGN STUDY AND FAILURE INVESTIGATION FOR AUTO
TRANSFORMER
NALCOR
SERIAL # 289147
CANADIAN GENERAL ELECTRIC
PREPARED BY
ABB Inc. Transformer Remanufacturing &
Engineering Services (TRES) Brampton, ON Canada
ABB Project Number: xxxxxx
Prepared by: Myra Mikhail, P.Eng Senior Transformer Design Engineer
James Li, P.Eng Senior Transformer Design Engineer
Reviewed by: Mustafa Lahloub P.Eng Engineering Manager, TRES Brampton
Approved by: Ed G. teNyenhuis, M.Eng, P.Eng. Technical Manager, TRES Canada
February 03, 2014; Draft
Draft
Undertaking 78, Attachment 1Page 1 of 78

Xxxxxx – NALCOR Design Study & Failure Investigation Draft Page 2
Table of Contents
1. INTRODUCTION................................................................................................................ 4
2. SHORT CIRCUIT STUDY .................................................................................................. 6
2.1. Procedure .................................................................................................................................................................... 6
2.2. Windings Short Circuit Capability: .......................................................................................................................... 6
3. DIELECTRIC STUDY ........................................................................................................ 1
3.1. Procedure .................................................................................................................................................................... 1
3.2. Major Winding insulation .......................................................................................................................................... 1
4. DISSOLVED GAS IN OIL ANALYSIS (DGA) .................................................................... 1
4.1. SSD T1 - (CGE 289147) .............................................................................................................................................. 1
4.2. SSD T4 – (CGE 288838) ............................................................................................................................................. 5
4.3. STB T1 – (CGE 288894) ............................................................................................................................................. 8
4.4. STB T2 – (CGE 288839) ........................................................................................................................................... 11
5. GENERAL OIL QUALITY ................................................................................................ 14
5.1. SSD T1 – (CGE 289147) ........................................................................................................................................... 14
2.1.1 Main Tank ................................................................................................................................................................. 14
2.1.2 LTC Tank .................................................................................................................................................................. 15
5.2. SSD T4 – (CGE 288838) ........................................................................................................................................... 16
2.2.1 Main Tank ................................................................................................................................................................. 16
2.2.2 LTC Tank .................................................................................................................................................................. 17
5.3. STB T1 – (CGE 288894) ........................................................................................................................................... 18
2.3.1 Main Tank ................................................................................................................................................................. 18
2.3.2 LTC Tank .................................................................................................................................................................. 19
5.4. STB T2 – (CGE 288839) ........................................................................................................................................... 20
2.4.1 Main Tank ................................................................................................................................................................. 20
2.4.2 LTC Tank .................................................................................................................................................................. 21
Undertaking 78, Attachment 1Page 2 of 78

Xxxxxx – NALCOR Design Study & Failure Investigation Draft Page 3
6. TRANSFORMER POWER FACTOR MEASUREMENT .................................................. 22
6.1. SSD T1 – (CGE 288147) ........................................................................................................................................... 22
6.2. SSD T4 – (CGE 288838) ........................................................................................................................................... 24
6.3. STB T1 – (CGE 288894) ........................................................................................................................................... 26
6.4. STB T2 – (CGE 288839) ........................................................................................................................................... 28
7. MAINTENANCE HISTORY .............................................................................................. 30
7.1. SSD T1 – (CGE 289147) ........................................................................................................................................... 30
7.2. SSD T4 – (CGE 288838) ........................................................................................................................................... 32
7.3. STB T1 – (CGE 288894) ........................................................................................................................................... 33
7.4. STB T2 – (CGE 288839) ........................................................................................................................................... 34
8. INSPECTION ................................................................................................................... 35
8.1. Findings and Observations ...................................................................................................................................... 35
9. CONCLUSION ................................................................................................................. 43
10. RECOMMENDATIONS ................................................................................................ 47
Undertaking 78, Attachment 1 Page 3 of 78

Xxxxxx – NALCOR Design Study & Failure Investigation Draft Page 4
1. IntroductionThis transformer, sn 289147, failed and caught fire on January 4, 2014. The information available shows that the fault took more cycles than normal to be cleared. The transformer was on fire for about 66 hours. The transformer sustained major damage due to the failure and the fire. The customer requested that ABB inspect the transformer to try and identify the cause of the failure.
Also a comprehensive short circuit and dielectric study of the design is performed. There are four transformers manufactured to the same design. These transformers are built by Canadian General Electric under the Serial Numbers 288838, 288839 & 288894 in 1976 and 289147 in 1978.
Table 1 – Auto Transformer
Identification Canadian General Electric
Rating 75/100/125 MVA, ONAN/ONAF/ONAF, 65°C Rise, 3Ph, 60Hz
Voltage HV: 230 kV Grd Y, +5, -15 % ON Load taps
LV: 138 KV Grd Y.
TV: 6.9 KV Delta.
Lightning Insulation Levels
HV: 900 kV BIL
LV: 550 kV BIL
HV Neut: 110 kV Bil
TV: 95 kV BIL
Core 3 phase unit, 3 legged design.
Windings On each leg from the core outward:
TV: Single layer, copper, MTC conductors.
Shield
LV : 5 Layers, copper, MTC conductors.
Shield
RV: 2 layers. Each with 4 multi starts, copper, MTC conductors.
HV : 5 Layers, copper, MTC conductors.
Shield.
Cooling Equipment 5 Radiators (156 tubes each)
9 Fans 28 In Diam
Manufacturing Date First 3 units built in 197, the last unit buit in 1978, in Guelph, Ontario.
Undertaking 78, Attachment 1Page 4 of 78

Xxxxxx – NALCOR Design Study & Failure Investigation Draft Page 5
Figure 1 - Schematic Diagram of the Windings
X1 H1Y
Y1
C1
C2
C3
C4
C5
LT
C1
LT
C2
S1
S2
S3
S4
S5
Undertaking 78, Attachment 1 Page 5 of 78

Xxxxxx – NALCOR Design Study & Failure Investigation Draft Page 6
2. Short Circuit Study A 3D FEM leakage flux program was used to model this design. This program calculates the flux pattern in the windings as well as the short circuit currents in each winding and the associated forces.
2.1. Procedure
System Impedance: From the original design, the system available MV is 3000 MVA on 230 KV side and 2000 MVA on the 138 kV side. This will translate in a 4.167% Impedance on the 230 kV side and 6.25% impedance on the 138 kV side on the 125 MVA base. These values are used in the analyses.
Short Circuit Calculation: The transformer short circuit forces were analyzed with the on load tap changer on Rated, maximum and minimum tap positions.
The transformer core and windings were modeled on a computer program to enable the magnetic field and force calculations to be calculated. Program calculates the winding impedances between pairs of winding and uses the system impedances to calculate the short circuit currents in the transformer windings at the different tap positions. The program then calculates the axial and radial forces on each winding. In this case the forces are calculated on each layer of each winding with more than one layer.
These forces are than used in the design program. From the characteristics of the windings and the type of conductors used, the effect of the forces is derived and the allowable limits are calculated.
2.2. Windings Short Circuit Capability:
From the program results, the forces were calculated and compared with the allowed limits.
Table 2 - Short Circuit Calculations for the TV Winding (single Layer)
TV Winding ( Single Layer) Calculated Allowed
Average radial inward stress Psi 19 278 39 347
Dynamic conductor tilting stress Psi 11249 12000
Axial pressure on end rings Psi 10500 6000
Note:
This winding is failing on axial forces. The winding pressboard end rings are not strong enough to sustain the axial force. The calculated force is higher than the strength of the end ring material. The other stresses on this winding are within the limits of the design.
Undertaking 78, Attachment 1 Page 6 of 78

Xxxxxx – NALCOR Design Study & Failure Investigation Draft Page 1
Table 3 - Short Circuit Calculations for the Common Winding (Five Layers)
Common Winding ( Five Layers) Calculated Allowed
Average radial inward stress Psi 2899 24183
Dynamic conductor tilting stress Psi 3779 12000
Axial pressure on end rings Psi 5750 6000
Note:
This winding is adequately designed for the short forces for all the criteria that needed to be checked.
Table 4 - Short Circuit Calculations for the Tap Winding
Tap Winding ( Two Layers) Calculated Allowed
Average radial inward stress Psi 5805 22489
Dynamic conductor tilting stress Psi 1432 12000
Axial pressure on end rings Psi 3000 6000
Note:
This winding is adequately designed for the short forces for all the criteria that needed to be checked.
Table 5 - Short Circuit Calculations for the Series Winding (Five Layers)
Series Winding ( Five Layers) Calculated Allowed
Average radial outward stress Psi 11327 40000
Dynamic conductor tilting stress Psi 1763 2484
Axial pressure on end rings Psi 4000 6 000
Note:
This winding is adequately designed for the short forces for all the criteria that needed to be checked.
Undertaking 78, Attachment 1 Page 7 of 78

Xxxxxx – NALCOR Design Study & Failure Investigation Draft Page 1
3. Dielectric Study The following is an insulation study of the transformer using ABB designs tools and standards.
3.1. Procedure
The design information was obtained from the archives and the transformer insulation clearances were checked against ABB standards.
For the purpose of the study, it was assumed that the quality of the transformer oil and insulation was acceptable for doing full level insulation testing as if the transformer was new.
3.2. Major Winding insulation
Below in
Table to Error! Reference source not found.3 are shown actual and allowed calculated electrical clearance values for the major winding insulation. The calculation shows that the insulation arrangement is satisfactory.
Table 6 – Radial Clearances
Actual Minimum
Core Leg - TV Winding mm 9 9
TV Winding - Ground Shield mm 11 8
Ground Shield - Common Winding mm 10 10
Common Winding - Tap Winding mm 11 11
Tap Winding – Series Winding mm 28 17
Phase – Phase mm 189 88
Table 7 – Axial Clearances
Actual Minimum
TV Winding – Core Yokes mm 157 33
Common Winding - Core Yokes mm 152 121
Tap Winding – Core Yokes mm 152 121
Series Winding – Core Yokes mm 233 204
All Winding leads, including tap leads, clearances to each other and to ground are within the design allowed rules.
Undertaking 78, Attachment 1 Page 8 of 78

Xxxxxx – NALCOR Design Study & Failure Investigation Draft Page 1
4. Dissolved Gas in Oil Analysis (DGA)
4.1. SSD T1 - (CGE 289147)
Below is the report of the DGA data for the period of 1991 to 2013. The gas signatures for this transformer are shown in Figure to Figure
The following is noted for the transformer DGA:
The concentration of Hydrogen (H2) has been well below IEEE C57.104-2008 guide condition level 1 since 1991, the highest level was 49 ppm.
The concentration of Methane (CH4) and Ethane (C2H6) have been steadily low for the period of the data provided. The Ethylene (C2H4) level is slightly above condition level one of the IEEE C57.104-2008 guide since 1991.
The concentration of Acetylene (C2H2) has been above IEEE C57.104-2008 guide condition level 2 since 1991. The level went up and down since then but was almost stable around the 10ppm. This could be oil leaking from LTC diverter compartment.
The carbon dioxide level has been below the IEEE C57.104-2008 guide condition level 2 for the time period provided. The carbon monoxide level is slightly above the IEEE C57.104-2008 guide condition level 1 since 1991. However the ratio of CO2/CO is between 4 and 9. The normal CO2/CO ratios are typically in the range of 5-9. The ratio of the carbon oxides suggests that the concentrations are due to the normal aging process of the transformer.
Shown below in Figure 5 is a distribution plot of carbon oxide gas levels taken from a survey by the IEEE Transformer Committee using > 520,000 data records of units in service. This very large quantity of data is being used to revise the gas level limits in C57.104 (the famous Table 1 with condition 1 – 4 levels) – note that the levels will be increased. As can be seen, the 90th percentile levels are 700 ppm and 7500 for CO and CO2 respectively. Figure 6 shows the CO distribution by age categories and for 30 – 40 years category, the 90th percentile is about 700 ppm. The history gassing on this transformer was around 500 ppm and 3600 ppm for CO and CO2 respectively. Thus these levels are well below the 90th percentile of the IEEE data for the age of this unit.
The presence of large concentrations of oxygen in the oil can promote the formation of acids in the oil and cellulose and accelerate the aging rate of the cellulose insulation. It is recommended that the concentration of oxygen in the transformer be less than 2000 ppm (Refer to CIGRE report 323 – Aging of Cellulose in Mineral-Oil Insulated Transformers). The transformer maintenance record (09/21/2007) provided by the customer does not mention if the oil had ever been vacuum processed since 1991. The oil samples from this transformer have consistently shown very high oxygen concentrations (>20,000 ppm). The source of this high oxygen is the free-breathing oil conservator. To reduce the oxygen in the transformer oil and eliminate the uncertainty concerning the gas generation.
Undertaking 78, Attachment 1 Page 9 of 78

Xxxxxx – NALCOR Design Study & Failure Investigation Draft Page 2
Figure 2 - Hydrocarbon Gas Concentrations
Figure 3 - Carbon Oxides Gas Concentrations
0
10
20
30
40
50
60C
on
cen
trat
ion
[P
PM
]Hydrocarbon Gases (SSD T1)
H2
CH4
C2H6
C2H4
C2H2
0
100
200
300
400
500
600
0
500
1000
1500
2000
2500
3000
3500
4000
CO
Co
nc.
(P
PM
)
CO
2 C
on
c. (
PP
M)
Carbon Oxides (SSD T1)CO2
CO
Undertaking 78, Attachment 1 Page 10 of 78

Xxxxxx – NALCOR Design Study & Failure Investigation Draft Page 3
Figure 4 – Atmospheric Gases Concentrations
Figure 5 – IEEE Transformer Committee Carbon Oxide Survey Results
0
10000
20000
30000
40000
50000
60000
70000
80000
90000
100000C
on
cen
trat
ion
(P
PM
)
Atmospheric Gases (SSD T1)O2
N2
Undertaking 78, Attachment 1 Page 11 of 78

Xxxxxx – NALCOR Design Study & Failure Investigation Draft Page 4
Figure 6 - IEEE Transformer Committee Carbon Oxide Survey Results (CO vs age)
Undertaking 78, Attachment 1 Page 12 of 78

Xxxxxx – NALCOR Design Study & Failure Investigation Draft Page 5
4.2. SSD T4 – (CGE 288838)
Below is the report of the DGA data for the period of 1991 to 2013. The gas signatures for this transformer are shown in Figure to Figure .
The following is noted for the transformer DGA:
The concentration of Hydrogen (H2) has been well below IEEE C57.104-2008 guide condition level 1 since 1991, the highest level is 30 ppm.
The concentration of Methane (CH4) and Ethane (C2H6) have been steadily low for the period of the data provided. The Ethylene (C2H4) level is slightly above condition level one of the IEEE C57.104-2008 guide since 1991.
The concentration of Acetylene (C2H2) has been above IEEE C57.104-2008 guide condition level 1 since 1991. The level went up and down since then but was almost stable around the 5ppm. This could be oil leaking from LTC diverter compartment.
The carbon dioxide level has been below the IEEE C57.104-2008 guide condition level 1 for the time period provided. The carbon monoxide level is slightly above the IEEE C57.104-2008 guide condition level 1 between 1996 and 2004, however the level became normal after 2004. The ratio of CO2/CO is between 5 and 10. The normal CO2/CO ratios are typically in the range of 5-9. The ratio of the carbon oxides suggests that the concentrations are due to the normal aging process of the transformer.
As can be seen from Figure 5 & 6, the 90th percentile levels are 700 ppm and 7500 for CO and CO2 respectively. The 90th percentile is about 700 ppm for the CO distribution by age categories and for 30 – 40 years category. The history gassing on this transformer was around 450 ppm and 3000 ppm for CO and CO2 respectively. Thus these levels are below the 90th percentile of the IEEE data for the age of this unit.
The presence of large concentrations of oxygen in the oil can promote the formation of acids in the oil and cellulose and accelerate the aging rate of the cellulose insulation. It is recommended that the concentration of oxygen in the transformer be less than 2000 ppm (Refer to CIGRE report 323 – Aging of Cellulose in Mineral-Oil Insulated Transformers). The transformer maintenance record (09/06/2012) provided by the customer does not mention if the oil had ever been vacuum processed since 1991. The oil samples from this transformer have consistently shown very high oxygen concentrations (>20,000 ppm) of oxygen. The source of this high oxygen is the free-breathing oil conservator. To reduce the oxygen in the transformer oil and eliminate the uncertainty concerning the gas generation, it is recommended to add a conservator diaphragm. The diaphragm prevents oil from coming in contact with the air. This will prevent moisture, excessive atmospheric gases from dissolving into the oil and it also helps to keep all gases generated by the transformer in oil for more accurate diagnostics.
Undertaking 78, Attachment 1 Page 13 of 78

Xxxxxx – NALCOR Design Study & Failure Investigation Draft Page 6
Figure 7 - Hydrocarbon Gas Concentrations
Figure 8 - Carbon Oxides Gas Concentrations
0
5
10
15
20
25
30
35
40
45C
on
cen
trat
ion
[P
PM
]Hydrocarbon Gases (SSD T4)
H2
CH4
C2H6
C2H4
C2H2
0
50
100
150
200
250
300
350
400
450
500
0
500
1000
1500
2000
2500
3000
3500
CO
Co
nc.
(P
PM
)
CO
2 C
on
c. (
PP
M)
Carbon Oxides (SSD T4)CO2
CO
Undertaking 78, Attachment 1 Page 14 of 78

Xxxxxx – NALCOR Design Study & Failure Investigation Draft Page 7
Figure 9 – Atmospheric Gases Concentrations
0
10000
20000
30000
40000
50000
60000
70000
80000
90000
100000C
on
cen
trat
ion
(P
PM
)
Atmospheric Gases (SSD T4)O2
N2
Undertaking 78, Attachment 1 Page 15 of 78

Xxxxxx – NALCOR Design Study & Failure Investigation Draft Page 8
4.3. STB T1 – (CGE 288894)
Below is the report of the DGA data for the period of 1977 to 2013. The gas signatures for this transformer are shown in Figure 10 to Figure 12.
The following is noted for the transformer DGA:
The concentration of Hydrogen (H2) has been well below IEEE C57.104-2008 guide condition level 1 since 1977, the highest level is 75 ppm in 1979.
The concentration of Methane (CH4) and Ethane (C2H6) have been steadily low for the period of the data provided. The Ethylene (C2H4) level has been below condition level 1 of the IEEE C57.104-2008 guide since 1977, except one sample (67 ppm) in 2009.
The concentration of Acetylene (C2H2) has been below IEEE C57.104-2008 guide condition level 1 since 2009. However the DGA sample for the year 1979 shows high level of C2H2. This could be a bad oil sample.
The carbon dioxide level has been above the IEEE C57.104-2008 guide condition level 1 for the most of time period provided. The carbon monoxide level is above the IEEE C57.104-2008 guide condition level 1 for most of time as well. However the ratio of CO2/CO is between 4 and 9. The normal CO2/CO ratios are typically in the range of 5-9. The ratio of the carbon oxides suggests that the concentrations are due to the normal aging process of the transformer.
As can be seen from Figure 5 & 6, the 90th percentile levels are 700 ppm and 7500 for CO and CO2 respectively. The 90th percentile is about 700 ppm for the CO distribution by age categories and for 30 – 40 years category. The history gassing on this transformer was around 590 ppm and 4400 ppm for CO and CO2 respectively. Thus these levels are below the 90th percentile of the IEEE data for the age of this unit.
The presence of large concentrations of oxygen in the oil can promote the formation of acids in the oil and cellulose and accelerate the aging rate of the cellulose insulation. It is recommended that the concentration of oxygen in the transformer be less than 2000 ppm (Refer to CIGRE report 323 – Aging of Cellulose in Mineral-Oil Insulated Transformers). The transformer maintenance record (09/22/2011) provided by the customer does not mention if the oil had ever been vacuum processed since 1991. The oil samples from this transformer have consistently shown very high oxygen concentrations (>20,000 ppm) of oxygen. The source of this high oxygen is the free-breathing oil conservator. To reduce the oxygen in the transformer oil and eliminate the uncertainty concerning the gas generation, it is recommended to add a conservator diaphragm. The diaphragm prevents oil from coming in contact with the air. This will prevent moisture, excessive atmospheric gases from dissolving into the oil and it also helps to keep all gases generated by the transformer in oil for more accurate diagnostics
Undertaking 78, Attachment 1 Page 16 of 78

Xxxxxx – NALCOR Design Study & Failure Investigation Draft Page 9
Figure 10 - Hydrocarbon Gas Concentrations
Figure 11 - Carbon Oxides Gas Concentrations
0
10
20
30
40
50
60
70
80C
on
cen
trat
ion
[P
PM
]Hydrocarbon Gases (STB T1)
H2
CH4
C2H6
C2H4
C2H2
0
100
200
300
400
500
600
700
0
500
1000
1500
2000
2500
3000
3500
4000
4500
5000
CO
Co
nc.
(P
PM
)
CO
2 C
on
c. (
PP
M)
Carbon Oxides (STB T1)
CO2
CO
Undertaking 78, Attachment 1 Page 17 of 78

Xxxxxx – NALCOR Design Study & Failure Investigation Draft Page 10
Figure 12 – Atmospheric Gases Concentrations
0
10000
20000
30000
40000
50000
60000
70000
80000
90000C
on
cen
trat
ion
(P
PM
)
Atmospheric Gases (STB T1)O2
N2
Undertaking 78, Attachment 1 Page 18 of 78

Xxxxxx – NALCOR Design Study & Failure Investigation Draft Page 11
4.4. STB T2 – (CGE 288839)
Below is the report of the DGA data for the period of 1977 to 2013. The gas signatures for this transformer are shown in Figure 13 to Figure 15.
The following is noted for the transformer DGA:
The concentration of Hydrogen (H2) has been well below IEEE C57.104-2008 guide condition level 1 since 1977, the highest level is 50 ppm in 1987.
The concentration of Methane (CH4) and Ethane (C2H6) have been steadily low for the period of the data provided. The Ethylene (C2H4) level has been in condition level 2 of the IEEE C57.104-2008 guide (50 ppm) since 2000.
The transformer has consistently shown high concentrations (>20 ppm) of Acetylene (C2H2) since 1986, which is far above the IEEE C57.104-2008 guide condition level 2. The high concentration of C2H2 indicates that possible high energy arcing occurred somewhere inside the transformer. The other reason could be oil leaking from LTC diverter compartment. The Acetylene levels are about 10ppm foe few years now. This needs to be monitored closely. Any sudden increase of Acetylene needs to be investigated.
The carbon dioxide level has been above the IEEE C57.104-2008 guide condition level 1 for the most of time period provided. The carbon monoxide level is above the IEEE C57.104-2008 guide condition level 1 for most of time as well. However the ratio of CO2/CO is between 5 and 10. The normal CO2/CO ratios are typically in the range of 5-9. The ratio of the carbon oxides suggests that the concentrations are due to the normal aging process of the transformer.
As can be seen from Figure 5 & 6, the 90th percentile levels are 700 ppm and 7500 for CO and CO2 respectively. The 90th percentile is about 700 ppm for the CO distribution by age categories and for 30 – 40 years category. The history gassing on this transformer was around 560 ppm and 5500 ppm for CO and CO2 respectively. Thus these levels are below the 90th percentile of the IEEE data for the age of this unit.
The presence of large concentrations of oxygen in the oil can promote the formation of acids in the oil and cellulose and accelerate the aging rate of the cellulose insulation. It is recommended that the concentration of oxygen in the transformer be less than 2000 ppm (Refer to CIGRE report 323 – Aging of Cellulose in Mineral-Oil Insulated Transformers). It is unknown if the oil had ever been vacuum processed since 1977. The oil samples from this transformer have consistently shown very high oxygen concentrations (>20,000 ppm) of oxygen. The source of this high oxygen is the free-breathing oil conservator. To reduce the oxygen in the transformer oil and eliminate the uncertainty concerning the gas generation, it is recommended to add a conservator diaphragm. The diaphragm prevents oil from coming in contact with the air. This will prevent moisture, excessive atmospheric gases from dissolving into the oil and it also helps to keep all gases generated by the transformer in oil for more accurate diagnostics
Undertaking 78, Attachment 1 Page 19 of 78

Xxxxxx – NALCOR Design Study & Failure Investigation Draft Page 12
Figure 13 - Hydrocarbon Gas Concentrations
Figure 14 - Carbon Oxides Gas Concentrations
0
10
20
30
40
50
60
70
80
90C
on
cen
trat
ion
[P
PM
]Hydrocarbon Gases (STB T2)
H2
CH4
C2H6
C2H4
C2H2
0
100
200
300
400
500
600
0
1000
2000
3000
4000
5000
6000
CO
Co
nc.
(P
PM
)
CO
2 C
on
c. (
PP
M)
Carbon Oxides (STB T2
CO2
CO
Undertaking 78, Attachment 1 Page 20 of 78

Xxxxxx – NALCOR Design Study & Failure Investigation Draft Page 13
Figure 15 – Atmospheric Gases Concentrations
0
10000
20000
30000
40000
50000
60000
70000
80000
90000
100000C
on
cen
trat
ion
(P
PM
)
Atmospheric Gases (STB T2)O2
N2
Undertaking 78, Attachment 1 Page 21 of 78

Xxxxxx – NALCOR Design Study & Failure Investigation Draft Page 14
5. General Oil Quality
5.1. SSD T1 – (CGE 289147)
2.1.1 Main Tank
Below is the report of the oil quality data results from 2009 to 2013. The history of the oil quality data measured for this transformer is shown in Table .
The following can be observed:
The latest measured breakdown voltage (52.0 kV/mm on 09/11/2013) is above the minimum requirement (30kV/mm) as outlined by Doble Engineering for ≥ 230kV transformers with service aged insulating oil based on D877 method. However ASTM D1816-97 is recommended for testing fluid that is being processed into transformers and load tap changers. The gap distance standard settings are 1 mm and 2 mm.
The interfacial tension values are around 28.0 dynes/cm2 which are below the 32 dynes/cm2
limit recommended by IEEE C57.106-2002 for ≥ 230kV transformers. Lower values may indicate oil soluble contaminants and oxidation products in oil.
The oxidation inhibitor values were not measured since 2009. The acceptable range is between 0.08 and 0.30%. Oxygen inhibitors are helpful to minimize the effects of oxidation of oil. The first choice of attack by oxygen in the oil is the inhibitor molecules. This keeps the oil free from oxidation and its harmful by-products. As transformer ages, the oxidation inhibitor is used up and need to be replaced.
The measured Acid Numbers for the oil samples in the past years are all below the recommended limits (0.10 mg KOH/g) by IEEE C57.106-2002 for ≥ 230kV transformers.
The measured power factor values at 25/100°C are all below the suggested limits as outlined in IEEE C57.106-2002 for continue use of service-aged insulating oil.
IEEE C57.106-2002 Table 5 recommends that the maximum limit of water content in oil for
230kV transformers is not to exceed 10 ppm or 5% saturation at 50ºC. The oil samples taken from the main tank show moisture content of less than 10 ppm.
Table 8 - Oil Quality Data (Main Tank)
Sample Date Fluid Temp
(oC)
Dielectric Breakdown
D877
(kV)
Acid Number D974
(mg KOH/g)
Interfacial Tension
D971
(dynes/cm)
Visual Condition
D1524
Power Factor
D924 (%)
25°C / 100 C
Water
(ppm)
%
Satur.
Inhibitor
(%)
05/05/2009 30 55 0.03 28.6 Clear 0.062 1.38 2 2 -
03/22/2010 25 45 0.03 27.8 Clear 0.035 1.28 5 7 -
02/24/2012 20 59 0.03 26.9 Clear 0.123 2.62 2 4 -
03/13/2012 20 49 0.03 27.5 Clear 0.115 3.28 2 4 -
09/11/2013 35 52 0.03 28.1 Clear 0.166 2.94 3 3 -
Undertaking 78, Attachment 1 Page 22 of 78
Xxxxxx – NALCOR Design Study & Failure Investigation Draft Page 15
2.1.2 LTC Tank
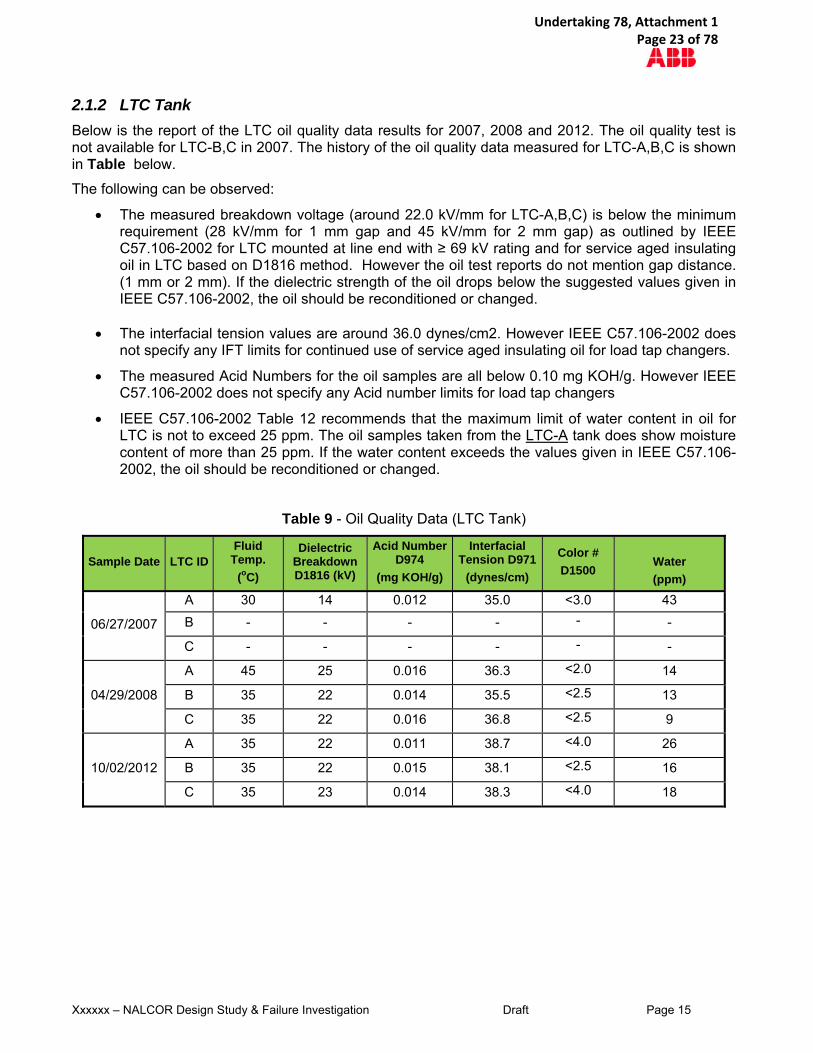
Below is the report of the LTC oil quality data results for 2007, 2008 and 2012. The oil quality test is not available for LTC-B,C in 2007. The history of the oil quality data measured for LTC-A,B,C is shown in Table below.
The following can be observed:
The measured breakdown voltage (around 22.0 kV/mm for LTC-A,B,C) is below the minimum requirement (28 kV/mm for 1 mm gap and 45 kV/mm for 2 mm gap) as outlined by IEEE C57.106-2002 for LTC mounted at line end with ≥ 69 kV rating and for service aged insulating oil in LTC based on D1816 method. However the oil test reports do not mention gap distance. (1 mm or 2 mm). If the dielectric strength of the oil drops below the suggested values given in IEEE C57.106-2002, the oil should be reconditioned or changed.
The interfacial tension values are around 36.0 dynes/cm2. However IEEE C57.106-2002 does not specify any IFT limits for continued use of service aged insulating oil for load tap changers.
The measured Acid Numbers for the oil samples are all below 0.10 mg KOH/g. However IEEE C57.106-2002 does not specify any Acid number limits for load tap changers
IEEE C57.106-2002 Table 12 recommends that the maximum limit of water content in oil for LTC is not to exceed 25 ppm. The oil samples taken from the LTC-A tank does show moisture content of more than 25 ppm. If the water content exceeds the values given in IEEE C57.106-2002, the oil should be reconditioned or changed.
Table 9 - Oil Quality Data (LTC Tank)
Sample Date LTC ID Fluid Temp.
(oC)
Dielectric Breakdown D1816 (kV)
Acid Number D974
(mg KOH/g)
Interfacial Tension D971
(dynes/cm)
Color #
D1500 Water
(ppm)
06/27/2007
A 30 14 0.012 35.0 <3.0 43
B - - - - - -
C - - - - - -
04/29/2008
A 45 25 0.016 36.3 <2.0 14
B 35 22 0.014 35.5 <2.5 13
C 35 22 0.016 36.8 <2.5 9
10/02/2012
A 35 22 0.011 38.7 <4.0 26
B 35 22 0.015 38.1 <2.5 16
C 35 23 0.014 38.3 <4.0 18
Undertaking 78, Attachment 1 Page 23 of 78

Xxxxxx – NALCOR Design Study & Failure Investigation Draft Page 16
5.2. SSD T4 – (CGE 288838)
2.2.1 Main Tank
Below is the report of the oil quality data results from 2009 to 2013. The history of the oil quality data measured for this transformer is shown in Table .
The following can be observed:
The latest measured breakdown voltage (52.0 kV/mm on 09/11/2013) is above the minimum requirement (30kV/mm) as outlined by Doble Engineering for 230kV transformers with service aged insulating oil based on D877 method. However ASTM D1816-97 is recommended for testing fluid that is being processed into transformers and load tap changers. The gap distance standard settings are 1 mm and 2 mm.
The interfacial tension values are around 33.6 dynes/cm2 which is slightly above the 32
dynes/cm2 limit recommended by IEEE C57.106-2002 for 230kV transformers. Lower values may indicate oil soluble contaminants and oxidation products in oil.
The oxidation inhibitor values were not measured since 2009. The acceptable range is between 0.08 and 0.30%. Oxygen inhibitors are helpful to minimize the effects of oxidation of oil. The first choice of attack by oxygen in the oil is the inhibitor molecules. This keeps the oil free from oxidation and its harmful by-products. As transformer ages, the oxidation inhibitor is used up and need to be replaced. It is highly recommended to add oxidation inhibitor in the oil.
The measured Acid Numbers for the oil samples in the past years are all below the recommended limits (0.10 mg KOH/g) by IEEE C57.106-2002 for 230kV transformers.
The measured power factor values at 25/100°C are all below the suggested limits as outlined in IEEE C57.106-2002 for continue use of service-aged insulating oil.
IEEE C57.106-2002 Table 5 recommends that the maximum limit of water content in oil for
230kV transformers is not to exceed 10 ppm or 5% saturation at 50ºC. The oil samples taken from the main tank show moisture content of less than 10 ppm.
Table 10 - Oil Quality Data (Main Tank)
Sample Date Fluid Temp
(oC)
Dielectric Breakdown
D877
(kV)
Acid Number D974
(mg KOH/g)
Interfacial Tension
D971
(dynes/cm)
Visual Condition
D1524
Power Factor
D924 (%)
25°C / 100 C
Water
(ppm)
%
Satur.
Inhibitor
(%)
05/05/2009 34 56 0.01 33.6 Clear 0.066 1.04 2 2 -
03/22/2010 30 36 0.01 31.7 Clear 0.015 0.63 7 8 -
02/24/2012 25 33 0.02 32.0 Clear 0.042 1.24 2 3 -
03/13/2012 25 57 0.02 33.1 Clear 0.054 1.17 2 3 -
09/11/2013 42 52 0.02 33.6 Clear 0.054 1.91 4 3 -
Undertaking 78, Attachment 1 Page 24 of 78

Xxxxxx – NALCOR Design Study & Failure Investigation Draft Page 17
2.2.2 LTC Tank
Below is the report of the LTC oil quality data results for 2008 and 2012. The history of the oil quality data measured for LTC-A,B,C is shown in Table below.
The following can be observed:
The measured breakdown voltage (between 22.0 kV/mm and 29.0 kV/mm for LTC-A,B,C) is below the minimum requirement (28 kV/mm for 1 mm gap and 45 kV/mm for 2 mm gap) as outlined by IEEE C57.106-2002 for LTC mounted at line end with ≥ 69 kV rating and for service- aged insulating oil in LTC based on D1816 method. However the oil test reports do not mention gap distance. (1 mm or 2 mm?). If the dielectric strength of the oil drops below the suggested values given in IEEE C57.106-2002, the oil should be reconditioned or changed.
The interfacial tension values are around 39.0 dynes/cm2. However IEEE C57.106-2002 does not specify any IFT limits for continued use of service aged insulating oil for load tap changers.
The measured Acid Numbers for the oil samples are all below 0.10 mg KOH/g. However IEEE C57.106-2002 does not specify any Acid number limits for load tap changers
IEEE C57.106-2002 Table 12 recommends that the maximum limit of water content in oil for LTC is not to exceed 25 ppm. The oil samples taken from the LTC tank show moisture content of less than 25 ppm. If the water content exceeds the values given in IEEE C57.106-2002, the oil should be reconditioned or changed.
Table 11 - Oil Quality Data (LTC Tank)
Sample Date LTC ID Fluid Temp.
(oC)
Dielectric Breakdown D1816 (kV)
Acid Number D974
(mg KOH/g)
Interfacial Tension D971
(dynes/cm)
Color #
D1500 Water
(ppm)
04/29/2008
A 33 - - - - 21
B 33 21 0.014 37.3 <4.5 18
C 33 22 0.013 37.9 <4.5 14
08/28/2012
A 45 18 0.011 39.1 <4.0 18
B - - - - - -
C - - - - - -
10/02/2012
A 40 22 0.012 39.7 <4.0 11
B 40 25 0.011 39.4 <4.0 12
C 40 29 0.014 39.4 <2.5 24
Undertaking 78, Attachment 1 Page 25 of 78

Xxxxxx – NALCOR Design Study & Failure Investigation Draft Page 18
5.3. STB T1 – (CGE 288894)
2.3.1 Main Tank
Below is the report of the oil quality data results from 2009 to 2013. The history of the oil quality data measured for this transformer is shown in Table .
The following can be observed:
The latest measured breakdown voltage (62.0 kV/mm on 03/14/2013) is above the minimum requirement (50kV/mm) as outlined in IEEE C57.106-2002 for 230kV transformers with service aged insulating oil based on D1816-2mm method.
The interfacial tension values are around 30.4 dynes/cm2 which is below the suggested limits (32 dynes/cm2) recommended by IEEE C57.106-2002 for 230kV transformers. Lower values may indicate oil soluble contaminants and oxidation products in oil.
The oxidation inhibitor values were not measured since 2009. The acceptable range is between 0.08 and 0.30%. Oxygen inhibitors are helpful to minimize the effects of oxidation of oil. The first choice of attack by oxygen in the oil is the inhibitor molecules. This keeps the oil free from oxidation and its harmful by-products. As transformer ages, the oxidation inhibitor is used up and need to be replaced. It is highly recommended to add oxidation inhibitor in the oil.
The measured Acid Numbers for the oil samples in the past years are all below the recommended limits (0.10 mg KOH/g) by IEEE C57.106-2002 for 230kV transformers.
The measured power factor values at 25/100°C are all below the suggested limits as outlined in IEEE C57.106-2002 for continue use of service-aged insulating oil.
IEEE C57.106-2002 Table 5 recommends that the maximum limit of water content in oil for
230kV transformers is not to exceed 10 ppm or 5% saturation at 50ºC. The oil samples taken from the main tank show moisture content of less than 10 ppm.
The BDV measurement on 03/14/2012 (in RED) was based on D1816-2mm method.
Table 12 - Oil Quality Data (Main Tank)
Sample Date Fluid Temp
(oC)
Dielectric Breakdown
D877
(kV)
Acid Number D974
(mg KOH/g)
Interfacial Tension
D971
(dynes/cm)
Visual Condition
D1524
Power Factor
D924 (%)
25°C / 100 C
Water
(ppm)
%
Satur.
Inhibitor
(%)
03/09/2009 35 53 0.02 32.6 Clear 0.043 0.98 2 2 -
03/15/2010 40 54 0.02 32.0 Clear 0.035 0.98 2 2 -
04/05/2011 40 45 0.02 31.0 Clear 0.065 1.49 4 3 -
02/13/2012 35 52 0.02 30.2 Clear 0.053 2.24 2 2 -
03/14/2013 40 62 0.02 30.4 Clear 0.058 1.39 3 2 -
Undertaking 78, Attachment 1 Page 26 of 78

Xxxxxx – NALCOR Design Study & Failure Investigation Draft Page 19
2.3.2 LTC Tank
Below is the report of the LTC oil quality data results from 2007 to 2010. The history of the oil quality data measured for LTC-A,B,C is shown in Table below.
The following can be observed:
The latest measured breakdown voltage is 30, 31 and 33 kV/mm for LTC-A,B,C. the suggested limits is 28 kV/mm for 1 mm gap and 45 kV/mm for 2 mm gap as outlined by IEEE C57.106-2002 for LTC mounted at line end with ≥ 69 kV rating and for service- aged insulating oil in LTC based on D1816 method. However the oil test reports do not mention gap distance. (1 mm or 2 mm?). If the dielectric strength of the oil drops below the suggested values given in IEEE C57.106-2002, the oil should be reconditioned or changed.
The interfacial tension values are around 35.0 dynes/cm2. However IEEE C57.106-2002 does not specify any IFT limits for continued use of service aged insulating oil for load tap changers.
The measured Acid Numbers for the oil samples are all below 0.10 mg KOH/g. However IEEE C57.106-2002 does not specify any Acid number limits for load tap changers
IEEE C57.106-2002 Table 12 recommends that the maximum limit of water content in oil for LTC is not to exceed 25 ppm. The latest oil samples taken from the LTC tank show moisture content of less than 25 ppm. If the water content exceeds the values given in IEEE C57.106-2002, the oil should be reconditioned or changed.
Note: The recorded temperature 22°C is much lower than the other phases.
Table 13 - Oil Quality Data (LTC Tank)
Sample Date LTC ID Fluid Temp.
(oC)
Dielectric Breakdown D1816 (kV)
Acid Number D974
(mg KOH/g)
Interfacial Tension D971
(dynes/cm)
Color #
D1500 Water
(ppm)
08/06/2007
Left 45 22 0.027 35.6 <3.5 28
Center 45 18 0.026 35.0 <3.5 29
Right 45 24 0.026 33.9 <3.5 12
07/18/2008
Left 22 14 0.016 35.1 <2.0 42
Center 72 14 0.016 34.4 <3.0 40
Right 72 14 0.015 35.0 <2.5 41
05/27/2010
Left - 31 0.016 35.5 <3.0 22
Center - 30 0.016 35.4 <3.5 15
Right - 33 0.016 35.7 <3.0 24
Undertaking 78, Attachment 1 Page 27 of 78

Xxxxxx – NALCOR Design Study & Failure Investigation Draft Page 20
5.4. STB T2 – (CGE 288839)
2.4.1 Main Tank
Below is the report of the oil quality data results from 05/2009 to 09/2013. The history of the oil quality data measured for this transformer is shown in Table .
The following can be observed:
The latest measured breakdown voltage (68.0 kV/mm on 03/14/2013) is above the minimum requirement (50kV/mm) as outlined in IEEE C57.106-2002 for 230kV transformers with service aged insulating oil based on D1816-2mm method.
The interfacial tension values are around 28.7 dynes/cm2 which is below the suggested limits (32 dynes/cm2) recommended by IEEE C57.106-2002 for 230kV transformers. Lower values may indicate oil soluble contaminants and oxidation products in oil.
The oxidation inhibitor values were not measured since 2009. The acceptable range is between 0.08 and 0.30%. Oxygen inhibitors are helpful to minimize the effects of oxidation of oil. The first choice of attack by oxygen in the oil is the inhibitor molecules. This keeps the oil free from oxidation and its harmful by-products. As transformer ages, the oxidation inhibitor is used up and need to be replaced. It is highly recommended to add oxidation inhibitor in the oil.
The measured Acid Numbers for the oil samples in the past years are all below the recommended limits (0.10 mg KOH/g) by IEEE C57.106-2002 for 230kV transformers.
The measured power factor values at 25/100°C are all below the suggested limits as outlined in IEEE C57.106-2002 for continue use of service-aged insulating oil.
IEEE C57.106-2002 Table 5 recommends that the maximum limit of water content in oil for
230kV transformers is not to exceed 10 ppm or 5% saturation at 50ºC. The oil samples taken from the main tank show moisture content of less than 10 ppm.
The BDV measurement on 03/14/2012 (in RED) was based on D1816 method
Table 14 - Oil Quality Data (Main Tank)
Sample Date Fluid Temp
(oC)
Dielectric Breakdown
D877
(kV)
Acid Number D974
(mg KOH/g)
Interfacial Tension
D971
(dynes/cm)
Visual Condition
D1524
Power Factor
D924 (%)
25°C / 100 C
Water
(ppm)
%
Satur.
Inhibitor
(%)
03/09/2009 40 56 0.02 29.4 Clear 0.074 1.53 3 2 -
03/15/2010 49 56 0.02 29.4 Clear 0.059 1.59 2 1 -
04/05/2011 48 44 0.02 28.4 Clear 0.132 2.60 6 4 -
02/13/2012 43 45 0.03 27.1 Clear 0.098 2.98 3 2 -
03/14/2013 49 68 0.03 28.7 Clear 0.090 1.86 2 1 -
Undertaking 78, Attachment 1 Page 28 of 78

Xxxxxx – NALCOR Design Study & Failure Investigation Draft Page 21
2.4.2 LTC Tank
Below is the report of the LTC oil quality data results from 2007 to 2011. The history of the oil quality data measured for LTC-A,B,C is shown in Table below.
The following can be observed:
The latest measured breakdown voltage is 17, 21 and 23 kV/mm for LTC-A,B,C. the suggested minimum limits is 28 kV/mm for 1 mm gap and 45 kV/mm for 2 mm gap as outlined by IEEE C57.106-2002 for LTC mounted at line end with ≥ 69 kV rating and for service- aged insulating oil in LTC based on D1816 method. However the oil test reports do not mention gap distance. (1 mm or 2 mm?). If the dielectric strength of the oil drops below the suggested values given in IEEE C57.106-2002, the oil should be reconditioned or changed.
The interfacial tension values are around 34.0 dynes/cm2. However IEEE C57.106-2002 does not specify any IFT limits for continued use of service aged insulating oil for load tap changers.
The measured Acid Numbers for the oil samples are all below 0.10 mg KOH/g. However IEEE C57.106-2002 does not specify any Acid number limits for load tap changers
IEEE C57.106-2002 Table 12 recommends that the maximum limit of water content in oil for LTC is not to exceed 25 ppm. The latest oil samples taken from the LTC tank show moisture content of more than 25 ppm for all three LTCs. If the water content exceeds the values given in IEEE C57.106-2002, the oil should be reconditioned or changed.
Table 15 - Oil Quality Data (LTC Tank)
Sample Date LTC ID Fluid Temp.
(oC)
Dielectric Breakdown D1816 (kV)
Acid Number D974
(mg KOH/g)
Interfacial Tension D971
(dynes/cm)
Color #
D1500 Water
(ppm)
08/07/2007
Left 52 25 0.022 34.4 <3.5 16
Center 52 20 0.024 33.8 <3.5 12
Right 52 23 0.022 35.0 <3.5 19
07/16/2008
Left 42 17 0.015 35.5 <2.5 44
Center 42 22 0.015 34.5 <2.5 35
Right 42 25 0.018 32.6 <2.5 33
08/18/2011
Left 52 23 0.015 33.8 <2.5 34
Center 52 17 0.016 33.8 <2.5 32
Right 52 21 0.018 34.1 5.0 42
Undertaking 78, Attachment 1 Page 29 of 78

Xxxxxx – NALCOR Design Study & Failure Investigation Draft Page 22
6. Transformer Power Factor Measurement
6.1. SSD T1 – (CGE 288147)
Doble test was available only for 2007. The overall test and bushings test results for this transformer are shown in Tables 16 below.
The following is observed:
The winding power factor values (CH & CT) are below 0.5%. The negative P.F for CHT is most likely because of the ground shield between the LV winding and the TV winding. Table 16-1
The C1 power factor and capacitance values for HV & LV bushings are all acceptable. IEEE Std C57.19.01-2000 specifies a limit of 0.5% for C1 power factor for oil impregnated paper insulated bushings. ABB recommends that the bushings be replaced whenever the power factor is double the nameplate value. Table 16-2
The measured C2 capacitance for HV & LV bushings is higher than the nameplate values by more than 10%. This needs to be compared to initial benchmark test results. Table 16-3
The hot collar tests for TV bushings and neutral bushing are below recommended limit (0.1 W at 10 kV). Table 16-4
The Doble exciting current test are normal. Table 16-5
Table 16-1 – Doble Overall Test Results (2007)
Table 16-2 – Doble Bushing Test Results (2007)
Bushing C1
Undertaking 78, Attachment 1 Page 30 of 78

Xxxxxx – NALCOR Design Study & Failure Investigation Draft Page 23
Table 16-3 – Doble Bushing Test Results (2007)
Bushing C2
Table 16-4 – Bushing Test Results (2007)
Hot Collar Test
Table 16-5 – Exciting Current Test Results (2007)
Doble Exciting Current Test
Undertaking 78, Attachment 1 Page 31 of 78

Xxxxxx – NALCOR Design Study & Failure Investigation Draft Page 24
6.2. SSD T4 – (CGE 288838)
Doble test was available only for 2012. The overall test and bushings test results for this transformer are shown in Tables 17 below.
The following is observed:
The winding power factor value CH is below the allowed limit, but CT is above 0.5%. Please compare to previous results. The negative P.F for CHT is most likely because of the ground shield between the LV winding and the TV winding. Table 17-1
The C1 power factor and capacitance values for HV & LV bushings are all acceptable. IEEE Std C57.19.01-2000 specifies a limit of 0.5% for C1 power factor for oil impregnated paper insulated bushings. ABB recommends that the bushings be replaced whenever the power factor is double the nameplate value. Table 17-2
The measured C2 capacitance for HV & LV bushings is higher than the nameplate values. This needs to be compared to initial benchmark test results. Table 17-3
The hot collar tests for TV bushings and neutral bushing are below recommended limit (0.1 W at 10 kV). Table 17-4
The Doble exciting current test are normal. Table 17-5
Table 17-1 – Doble Overall Test Results (2012)
Table 17-2 – Doble Bushing Test Results (2012)
Bushing C1
Undertaking 78, Attachment 1 Page 32 of 78

Xxxxxx – NALCOR Design Study & Failure Investigation Draft Page 25
Table 17-3 – Doble Bushing Test Results (2012)
Bushing C2
Table 17-4 – Bushing Test Results (2012)
Hot Collar Test
Table 17-5 – Exciting Current Test Results (2012)
Doble Exciting Current Test
Undertaking 78, Attachment 1 Page 33 of 78

Xxxxxx – NALCOR Design Study & Failure Investigation Draft Page 26
6.3. STB T1 – (CGE 288894)
Doble test was available only for 2011. The overall test and bushings test results for this transformer are shown in Tables 18 below.
The following is observed:
The winding power factor value CH & CT are below the allowed limit. The negative P.F for CHT is most likely because of the ground shield between the LV winding and the TV winding. Table 18-1
The C1 power factor and capacitance values for HV & LV bushings are all acceptable. IEEE Std C57.19.01-2000 specifies a limit of 0.5% for C1 power factor for oil impregnated paper insulated bushings. ABB recommends that the bushings be replaced whenever the power factor is double the nameplate value. Table 18-2
The measured C2 capacitance for HV & LV bushings is higher than the nameplate values. This needs to be compared to initial benchmark test results. Table 18-3
The hot collar tests for TV bushings and neutral bushing are below recommended limit (0.1 W at 10 kV). Table 18-4
The Doble exciting current test are normal. Table 18-5
Table 18-1 – Doble Overall Test Results (2011)
Table 18-2 – Doble Bushing Test Results (2011)
Bushing C1
Undertaking 78, Attachment 1 Page 34 of 78

Xxxxxx – NALCOR Design Study & Failure Investigation Draft Page 27
Table 18-3 – Doble Bushing Test Results (2011)
Bushing C2
Table 18-4 – Bushing Test Results (2011)
Hot Collar Test
Table 18-5 – Exciting Current Test Results (2011)
Doble Exciting Current Test
Undertaking 78, Attachment 1 Page 35 of 78

Xxxxxx – NALCOR Design Study & Failure Investigation Draft Page 28
6.4. STB T2 – (CGE 288839)
Doble test was available only for 2008. The overall test and bushings test results for this transformer are shown in Tables 19 below.
The following is observed:
The winding power factor value CH & CT are below the allowed limit. The negative P.F for CHT is most likely because of the ground shield between the LV winding and the TV winding. Table 19-1
The C1 power factor and capacitance values for HV & LV bushings are all acceptable. IEEE Std C57.19.01-2000 specifies a limit of 0.5% for C1 power factor for oil impregnated paper insulated bushings. ABB recommends that the bushings be replaced whenever the power factor is double the nameplate value. Table 19-2
The measured C2 capacitance for HV bushings is higher than the nameplate values by more than 10%. This needs to be compared to initial benchmark test results and investigated. The measured C2 capacitance for LV bushings is higher than the nameplate values but within 10%. Table 19-3
The hot collar tests for TV bushings and neutral bushing are below recommended limit (0.1 W at 10 kV). Table 19-4
The Doble exciting current test are normal. Table 19-5
Table 19-1 – Doble Overall Test Results (2008)
Table 19-2 – Doble Bushing Test Results (2008)
Bushing C1
Undertaking 78, Attachment 1 Page 36 of 78

Xxxxxx – NALCOR Design Study & Failure Investigation Draft Page 29
Table 19-3 – Doble Bushing Test Results (2008)
Bushing C2
Table 19-4 – Bushing Test Results (2008)
Hot Collar Test
Table 19-5 – Exciting Current Test Results (2008)
Doble Exciting Current Test
Undertaking 78, Attachment 1 Page 37 of 78

Xxxxxx – NALCOR Design Study & Failure Investigation Draft Page 30
7. Maintenance History
7.1. SSD T1 – (CGE 289147)
Electrical testing was performed in this transformer on 2007. The tests included winding resistance, insulation resistance and polarization index test. The test results are shown in Error! Reference source not found.20 below.
The winding resistance test for HV winding is consistent between phases, however the measured resistance is much lower than the other results for the sister units.
The winding resistance tests for LV & TV windings are consistent between phases, and also very close to the other sister units.
The ratio test and core Megger test was not performed.
The insulation resistance test was performed and results look normal in G-ohms, however the polarization index is lower than the ABB suggested value of 2.0 for HV/LV to ground.
Undertaking 78, Attachment 1 Page 38 of 78

Xxxxxx – NALCOR Design Study & Failure Investigation Draft Page 31
Table 20-1 – Insulation Resistance and Polarization Index Test Results
Table 20-2 – Winding Resistance Test Results
Undertaking 78, Attachment 1 Page 39 of 78

Xxxxxx – NALCOR Design Study & Failure Investigation Draft Page 32
7.2. SSD T4 – (CGE 288838)
Electrical testing was performed in 2012 including winding resistance, insulation resistance and polarization index test. The test results are shown in Error! Reference source not found. below.
The winding resistance test for HV & LV & TV windings is consistent between phases.
The ratio test was not performed.
The core Megger test was performed and result looks normal.
The insulation resistance test was performed and results look normal in G-ohms however the polarization index is lower than the ABB suggested value of 2.0.
Table 21-1 – Insulation Resistance and Polarization Index Test Results
Table 21-2 – Winding Resistance Test Results
Undertaking 78, Attachment 1 Page 40 of 78

Xxxxxx – NALCOR Design Study & Failure Investigation Draft Page 33
7.3. STB T1 – (CGE 288894)
Electrical testing was performed in 2011 including winding resistance, insulation resistance and polarization index test. The test results are shown in Error! Reference source not found. below.
The winding resistance test for HV & LV windings is consistent between phases.
The deviation of the TV winding resistance between phases is 20%. It is recommended to repeat the TV windings resistance test and compare to the sister units.
The ratio test was not performed.
The core Megger test was performed and result looks normal.
The insulation resistance test was performed and results look normal in G-ohms however the polarization index is lower than the ABB suggested value of 2.0 for HV to ground.
The tap changer inspection was performed on September 23rd, 2011 by GE, the following are found: Both two defects were corrected.
One end of a resistor was misplaced and came into contact with another resistor. A loss bolt was found on resistor.
Other findings:
One bearing in one of second stage fan motors was found to be broken.
Table 22-1 – Insulation Resistance and Polarization Index Test Results
Undertaking 78, Attachment 1 Page 41 of 78

Xxxxxx – NALCOR Design Study & Failure Investigation Draft Page 34
Table 22-2 – Winding Resistance Test Results
7.4. STB T2 – (CGE 288839)
The maintenance test history is not available for this unit.
Undertaking 78, Attachment 1 Page 42 of 78

Xxxxxx – NALCOR Design Study & Failure Investigation Draft Page 35
8. Inspection
The unit was inspected on January 21, 2014. Entry to the unit was made from the manhole located on the top cover between H2 and H3 bushings. Most of the other man holes and hand holes in the unit were opened also for inspection. It was possible to see and inspect all the active part components.
8.1. Findings and Observations
Because of risk of broken bushing porcelain falling; H3 and L2 bushing were removed before the inspection. L1 bushing was removed during the inspection.
Transformer cover was ripped open at the LV side. All the bolts on the LV side and some on the short sides were broken. See Photos 1&2&3&4
All transformer bushings are damaged. The most damaged are the H1, L2 and TV bushings. See Photos 5&6&7&8
The tap changer diverter cylinders of Phases 1 and 3 were separated from their aluminum flanges at the cover. This caused the tap changer assemblies, diverter and selector, to fall. The assemblies were found sitting at the bottom of the tap changer’s pocket. No signs of flashover were seen at the selector switches or tap cables. See Photos 9&10&11&12
The fire left indications of burning on the tank wall to a level about a foot above the windings. See Photo 13
No signs of flash over were seen in the cleats and leads including tap leads. All windings looked good with no signs of failure within the windings. See Photos 14&15 The L1 & L3 bushing’s porcelain inside the transformer were shattered. Also marks of
flashover were seen on core clamp just opposite to Phase 1 LV bushing. See Photos 16&17&18
Each of the LV bushings in this transformer has two leads connected to them. One lead is connected to the winding and the other to the tap changer. See Sketch 1
For Phases 1 and 2 the leads connecting the LV bushings to the windings are disconnected. It seems the two leads were mechanically pulled and cur at the crimp during the fault when the cover opened up. The insulation of the leads looks intact with no signs of failure. See Photos 19&20&21&22
Spitting and melting cooper were seen on the LV windings conductor copper strands of phase one. See Photo 23
Undertaking 78, Attachment 1 Page 43 of 78

Xxxxxx – NALCOR Design Study & Failure Investigation Draft Page 36
Photo 1 – Cover Open & Broken Bolts Photo 2 – Cover Open & Broken Bolts
Photo 3 – Cover Open & Broken Bolts Photo 4 – Cover Open & Broken Bolts
Undertaking 78, Attachment 1 Page 44 of 78

Xxxxxx – NALCOR Design Study & Failure Investigation Draft Page 37
Photo 5 – LV2 Bushing Photo 6 – LV2 Bushing
Photo 7 – LV2 Bushing Porcelain Photo 8 – HV1 Bushing Porcelain
Undertaking 78, Attachment 1 Page 45 of 78

Xxxxxx – NALCOR Design Study & Failure Investigation Draft Page 38
Photo 9 – LTC Compartment (Phases 2 & 3) Photo 10 – LTC Compartment (Phases 2 & 3)
Undertaking 78, Attachment 1 Page 46 of 78

Xxxxxx – NALCOR Design Study & Failure Investigation Draft Page 39
Photo 11 – LTC Compartment (Phase 3) Photo 12 – LTC Compartment (Phases 2 & 1)
Photo 13 – Fire Line on Tank Wall & Core Clamp Photo 14 – Windings
Undertaking 78, Attachment 1 Page 47 of 78

Xxxxxx – NALCOR Design Study & Failure Investigation Draft Page 40
Photo 15 – Windings Photo 16 – LV1 Bushing & Flashover marks
Photo 17 – LV1 Bushing Photo 18 – LV3 Bushing
Undertaking 78, Attachment 1 Page 48 of 78

Xxxxxx – NALCOR Design Study & Failure Investigation Draft Page 41
Sketch 1: LV bushings Connected to the Windings & Tap Changers
Photo 19 – LV2 Winding Lead Broken Photo 20 – LV2 Bushing Lead Broken at the Crimp
Photo 21 – LV1 Winding Lead Broken Photo 22 – LV1 Bushing Lead Broken at the Crimp
Undertaking 78, Attachment 1 Page 49 of 78

Xxxxxx – NALCOR Design Study & Failure Investigation Draft Page 42
Photo 23 – LV1 Winding Conductor Strand Copper Spitting
Undertaking 78, Attachment 1 Page 50 of 78

Xxxxxx – NALCOR Design Study & Failure Investigation Draft Page 43
9. Conclusion
Comprehensive short circuit and dielectric study of the design is performed for transformer sn 289147 built in 1978 and failed in 2013. Review of maintenance data and DGA history was completed. Also failure investigation and inspection was performed.
The short circuit design study showed that HV and LV windings are able to withstand short circuit forces while TV winding end rings are not strong enough to withstand the short circuit forces.
The Dielectric study showed that all windings and cable clearances are within the acceptable design levels for the voltage stresses in this transformer.
The DGA, oil quality, transformer power factor and maintenance history of the four transformers were reviewed.
For SSD T1 – CGE 288147
The DGA results showed that: The concentration of Acetylene (C2H2) has been above IEEE C57.104-2008 guide condition
level 1 (2 ppm) since 1991, The level went up and down since then but was almost stable around the 10ppm. This could be oil leaking from LTC diverter compartment.
The oil samples from this transformer have consistently shown high oxygen concentrations. The oil physical results showed that: (Main tank)
The interfacial tension values are around 28.0 dynes/cm2 which are below the 32 dynes/cm2 limit recommended by IEEE C57.106-2002 for ≥ 230kV transformers.
The oil physical results showed that: (LTC tank)
The measured breakdown voltage (around 22.0 kV/mm for LTC-A,B,C) is below the minimum requirement (28 kV/mm for 1 mm gap and 45 kV/mm for 2 mm gap) as outlined by IEEE C57.106-2002.
The oil samples taken from the LTC-A tank does show moisture content of more than 25 ppm. The power factor measurements showed that:
The winding power factor values (CH & CT) are below 0.5%. The C1 power factor and capacitance values for HV & LV bushings are all acceptable. The measured C2 capacitance for HV & LV bushings is higher than the nameplate values by
more than 10%. The hot collar tests for TV bushings and neutral bushing are below recommended limit. The Doble exciting current test are normal.
The maintenance history showed that:
The winding resistance test for HV winding is consistent between phases, however the measured resistance is much lower than the other two sister units.
The winding resistance tests for LV & TV windings are consistent between phases, and also very close to the other two sister units.
Undertaking 78, Attachment 1 Page 51 of 78

Xxxxxx – NALCOR Design Study & Failure Investigation Draft Page 44
The insulation resistance test was performed and results look normal in G-ohms, however the polarization index is lower than the ABB suggested value of 2.0 for HV/LV to ground.
For SSD T4 – CGE 288838
The DGA results showed that: The concentration of Acetylene (C2H2) has been above IEEE C57.104-2008 guide condition
level 1 (2 ppm) since 1991, The level went up and down since then but was almost stable around the 5ppm. This could be oil leaking from LTC diverter compartment.
The oil samples from this transformer have consistently shown high oxygen concentrations.
The oil physical results showed that: (Main tank) The latest measured breakdown voltage (52.0kV/mm) is above the minimum requirement
(30kV/mm) as outlined by Doble Engineering for 230kV transformers. The interfacial tension values are around 33.6 dynes/cm2 which is slightly above the 32
dynes/cm2 limit recommended by IEEE C57.106-2002 for 230kV transformers. Lower values may indicate oil soluble contaminants and oxidation products in oil.
The measured Acid Numbers for the oil samples are all below the recommended limits. The measured power factor values at 25/100°C are all below the suggested limits. The moisture in oil is within the acceptable limits.
The oil physical results showed that: (LTC tank)
The measured breakdown voltage (between 22.0 kV/mm and 29.0 kV/mm for LTC-A,B,C) is below the minimum requirement (28 kV/mm for 1 mm gap and 45 kV/mm for 2 mm gap).
IEEE C57.106-2002 Table 12 recommends that the maximum limit of water content in oil for LTC is not to exceed 25 ppm. The oil samples taken from the LTC tank show moisture content of less than 25 ppm.
The power factor measurements showed that:
The winding power factor value CH is below the allowed limit, but CT is above 0.5%. The C1 power factor and capacitance values for HV & LV bushings are all acceptable. The measured C2 capacitance for HV & LV bushings is higher than the nameplate values. This
needs to be compared to initial benchmark test results. The hot collar tests for TV bushings and neutral bushing are below recommended limit. The Doble exciting current test are normal.
The maintenance history showed that:
The winding resistance test for HV & LV & TV windings is consistent between phases. The ratio test was not performed. The core Megger test was performed and result looks normal. The insulation resistance test was performed and results look normal in G-ohms however the
polarization index is lower than the ABB suggested value of 2.0.
For STB T1 – CGE 288894
The DGA results showed that: The concentration of Acetylene (C2H2) has been below IEEE C57.104-2008 guide condition
level 1 (2 ppm) since 2009. However the DGA sample for the year 1979 shows high level of C2H2. This could be a bad oil sample.
The oil samples from this transformer have consistently shown high oxygen concentrations.
Undertaking 78, Attachment 1 Page 52 of 78

Xxxxxx – NALCOR Design Study & Failure Investigation Draft Page 45
The oil physical results showed that: (Main tank)
The latest measured breakdown voltage (62.0kV/mm) is above the minimum requirement (50kV/mm) as outlined in IEEE C57.106-2002 for 230kV transformers with service aged insulating oil based on D1816-2mm method.
The interfacial tension values are around 30.4 dynes/cm2 which is below the suggested limits (32 dynes/cm2) recommended by IEEE C57.106-2002 for 230kV transformers. Lower values may indicate oil soluble contaminants and oxidation products in oil.
The measured Acid Numbers for the oil samples are all below the recommended limits. The measured power factor values at 25/100°C are all below the suggested limits. The moisture in oil is within the acceptable limits.
The oil physical results showed that: (LTC tank)
The latest measured breakdown voltage is 30, 31 and 33 kV/mm for LTC-A,B,C. the suggested limits is 28 kV/mm for 1 mm gap and 45 kV/mm for 2 mm gap as outlined by IEEE C57.106-2002.
IEEE C57.106-2002 Table 12 recommends that the maximum limit of water content in oil for LTC is not to exceed 25 ppm. The latest oil samples taken from the LTC tank show moisture content of less than 25 ppm.
The power factor measurements showed that:
The winding power factor value CH & CT are below the allowed limit. The C1 power factor and capacitance values for HV & LV bushings are all acceptable. The measured C2 capacitance for HV & LV bushings is higher than the nameplate values. This
needs to be compared to initial benchmark test results. The hot collar tests for TV bushings and neutral bushing are below recommended limit The Doble exciting current test are normal.
The maintenance history showed that:
The winding resistance test for HV & LV windings is consistent between phases. The deviation of the TV winding resistance between phases is 20%. The ratio test was not performed. The core Megger test was performed and result looks normal. The insulation resistance test was performed and results look normal in G-ohms however the
polarization index is lower than the ABB suggested value of 2.0 for HV to ground.
For STB T2 – CGE 288839
The DGA results showed that: The transformer has consistently shown very high concentrations (>20 ppm) of Acetylene
(C2H2) since 1986, which is far above the IEEE C57.104-2008 guide condition level 1 (2 ppm). The high concentration of C2H2 indicates that possible high energy arcing occurred somewhere inside the transformer. The other reason could be oil leaking from LTC diverter compartment. The Acetylene levels are about 10ppm foe few years now. This needs to be monitored closely. Any sudden increase of Acetylene needs to be investigated.
The oil samples from this transformer have consistently shown high oxygen concentrations The oil physical results showed that: (Main tank)
Undertaking 78, Attachment 1 Page 53 of 78

Xxxxxx – NALCOR Design Study & Failure Investigation Draft Page 46
The latest measured breakdown voltage (68.0kV/mm) is above the minimum requirement (50kV/mm) as outlined in IEEE C57.106-2002 for 230kV transformers with service aged insulating oil based on D1816-2mm method.
The interfacial tension values are around 28.7 dynes/cm2 which is below the suggested limits (32 dynes/cm2) recommended by IEEE C57.106-2002 for 230kV transformers.
The measured Acid Numbers for the oil samples are all below the recommended. The measured power factor values at 25/100°C are all below the suggested limits. The moisture in oil is within the acceptable limit.
The oil physical results showed that: (LTC tank) The latest measured breakdown voltage is 17, 21 and 23 kV/mm for LTC-A,B,C, which is below
the suggested minimum limits (28 kV/mm for 1 mm gap and 45 kV/mm for 2 mm gap). IEEE C57.106-2002 Table 12 recommends that the maximum limit of water content in oil for
LTC is not to exceed 25 ppm. The latest oil samples taken from the LTC tank show moisture content of more than 25 ppm for all three LTCs.
The power factor measurements showed that:
The winding power factor value CH & CT are below the allowed limit. The C1 power factor and capacitance values for HV & LV bushings are all acceptable. The measured C2 capacitance for HV bushings is higher than the nameplate values by more
than 10%. This needs to be compared to initial benchmark test results and investigated. The measured C2 capacitance for LV bushings is higher than the nameplate values but within 10%.
The hot collar tests for TV bushings and neutral bushing are below recommended limit. The Doble exciting current test are normal.
The failure inspection showed the following:
All transformer bushings are damaged. The tap changer diverter cylinders of Phases 1 and 3 were separated from their
aluminum flanges at the cover. No signs of flash over were seen in the cleats and leads including tap leads. All windings looked good with no signs of failure within the windings. It is not possible
to see the internal windings. The L1 & L3 bushing’s porcelain inside the transformer were shattered. Also marks of
flashover were seen on core clamp just opposite to Phase 1 LV bushing. For Phases 1 and 2 the leads connecting the LV bushings to the windings are
disconnected. It seems the two leads were mechanically pulled and cur at the crimp during the fault when the cover opened up. The insulation of the leads looks intact with no signs of failure.
Spitting and melting cooper were seen on the LV windings conductor copper strands of phase one.
We still need to review the fault current, voltage and sequence of events but it seems LV1 or LV2 bushing failed first and caused the fire.
Undertaking 78, Attachment 1 Page 54 of 78

Xxxxxx – NALCOR Design Study & Failure Investigation Draft Page 47
10. Recommendations
The following is recommended for all three transformers:
Comprehensive DGA, oil quality tests and transformer testing is to be planned.
Consider replacing transformer bushings.
Add a conservator diaphragm.
Consider adding oxidation inhibitor to oil.
Monitor Acetylene (C2H2) closely especially for (STB T2).
Consider adding online monitor.
Measure the oil break down voltage per ASTM D1816 (1mm or 2mm) method.
Repeat the TV windings resistance test (on unit STB T1) and compare to the sister units.
Repeat the HV resistance test (on unit SSD T1) and compare to the sister unit.
Perform core Megger test on unit SSD T1.
Any bushings with higher C2 capacitance need to be compared to initial benchmark test results.
It is recommended to re-condition of oil in LTC tank or replace with new oil.
Perform on site drying out on unit SSD T4.
Undertaking 78, Attachment 1 Page 55 of 78

Nalcor order: 20649-000-OB ABB job number: 557775-10
Breaker ID and Location: B1L03 at Sunnyside Terminal Station
Investigation Location: Nalcor Regional Facility – Bishop’s Falls Breaker type: DCVF245 mc6 Serial number: B142698 Mechanism type: Air Blast Purpose for visit: Investigate B1L03 Breaker Failed to Trip On site dates: 2014-02-03 to 2014-02-06 Report presented to: Mr. Hughie Ireland ........................................................... Date: February 10, 2014 Scott Morris
SCOTT MORRIS
Undertaking 78, Attachment 1 Page 56 of 78

B1L03 Breaker Data
Type: DCVF 245mc6 Serial Number B142698
Maintenance History
Below is a summary of maintenance history relevant to the investigation extracted from the maintenance history provided. Work Order Date Comp. Work Done Investigation Comments
838346 4/8/2011 Function tests done after questionable operations during a fault.
All checked okay.
576789 3/6/2007 Breaker would not operate. Operated locally and ECC. Stayed in service
No cause found.
389723 6/1/2007 Re-lubrication of all interrupters and sub-assemblies
Last time breaker overhauled prior to event
263859 1/29/2003 Breaker overhaul of all interrupters and sub-assemblies
2nd last time breaker overhauled prior to event
Background
On Saturday January, 4 2014 the T1 transformer at Sunnyside Terminal Station faulted. The protections operated to clear the fault. Five breakers were sent trip signals. Three of these were 138 KV ABB DCF 170mc4 air blast breakers. The nomenclatures for these breakers are L109T4, B3T4 and B2T1. The other two breakers were 245 KV ABB DCVF 245mc6 air blast breakers. The nomenclatures for these breakers are B1L02 and B1L03. All indications are that four of the five breakers tripped okay except for the B1L03. With the B1L03 breaker failing to interrupt the next level of protections operated to clear the line. A portion of the station operating diagram showing the affected breakers is below.
Undertaking 78, Attachment 1 Page 57 of 78

The fault on the T1 transformer resulted in a fire which damaged the transformer. Some field testing was done on the B1L03 breaker after the event. Some odd findings were noted. The breaker would not operate pneumatically. The breaker timing results were not normal or as expected. There was an un-commanded operation of the breaker. These will be discussed further in the investigation. To ensure the reliability of the B1L03 breaker major work was done. This included the following:
• Removing all the nine interrupters and replacing them with overhauled spares • Replacing all three servos with three overhauled spares • Replacing “B” and “C” pole control boxes with rebuilt spares. “A” phase was to be replaced but
issues with the overhauled pole box for the “A” phase prevented this. The original “A” phase pole control box was field overhauled at site.
• The main valves on the breaker were field overhauled at site. • The air receivers were inspected and found to be okay • The breaker was timed and function tested before being returned to service • The removed sub-assemblies and interrupters were taken to the Bishop’s Falls Regional
Facility The weather data from Environment Canada for Gander Airport was downloaded to get the daily high and low recorded temperatures for six days prior and the day of the event. These are in the table below.
Date Maximum High Temperature Minimum Low Temperature December 29, 2013 -6.6 -15.7 December 30, 2013 -4.1 -15.6 December 31, 2013 -6.6 -16.5
January 1, 2014 -14.4 -19.2 January 2, 2014 -17.0 -22.5 January 3, 2014 -13.4 -22.2 January 4, 2014 -13.6 -18.9
Further detailed investigation on the B1L03 breaker was required to try and determine a cause for not tripping. ABB was contacted to provide support for the investigation. The investigation would take place at the Bishop’s Falls Regional Facility.
Chronological Summary of Investigation Monday February 3, 2014
• 08:30 we had a meeting to discuss the breaker failure to trip, sequence of events, general discussion and next steps.
• We felt we had two options. Nalcor has the capability to function test the servos; pole control boxes and interrupters on their air receiver in the shop. We could try and replicate the failure mode by testing in the shop. The other alternative was to take apart the interrupters and sub-assemblies to look for the problem. It was decided to take the interrupters and sub-assemblies apart for inspection. I felt it may be very difficult to replicate the failure in the shop with so many variables changed from the event.
Undertaking 78, Attachment 1 Page 58 of 78

• Three sets of double interrupter contacts were taken apart and inspected. A micro-ohm reading @ 100 amps was taken on each interrupter prior to dis-assembling. The chart below shows the micro-ohm readings. Some pictures are also inserted below.
Phase Contacts Micro-Ohm’s
“B” 5 & 6 60.0 “B” 1 & 2 90.8 “C’ 3 & 4 63.6
Observations: 1. Interrupter contacts showing no abnormal wear 2. Moving interrupter contacts were moving freely. 3. Micro-ohm readings acceptable. 4. The O-rings and seals showing no abnormal wear. 5. It was noted that some consumable parts and lubricants were not OEM. 6. The main and stationary contacts were lubricated with a thin film of graphite. 7. Renolit HLT2 lubricant was used on dissimilar metals. 8. Dow Corning 55 lubricant was used on static O-rings.
Stationary Contact
Undertaking 78, Attachment 1 Page 59 of 78

Moving Contact Gasket
Moving Contact Transfer Contact
Tuesday February 4, 2014 • Since nothing wrong was found on the three interrupters we decided to inspect the three
servos from the breaker. Some pictures are below. Observations
1. None of the three servos indicated any problems. 2. The parts were showing normal wear and nothing was binding. 3. Non OEM parts were found on the servos.
Undertaking 78, Attachment 1 Page 60 of 78

Servo Gasket
Servo Gasket
• The pole control boxes were the next focus for the investigation. “B” and “C” phase pole control boxes from the B1L03 were at the Bishop’s Falls facility. As previously mentioned “A” phase pole control box on the B1L03 breaker was field rebuilt at Sunnyside and is installed on the breaker. “B” and “C” phase pole control boxes were dis-assembled. Prior to starting dis-assembly the trip, close and heater resistor values were recorded.
Undertaking 78, Attachment 1 Page 61 of 78

“B” phase pole control box was dis-assembled first. The table below shows the measured resistance values.
Close coil – terminals 1-2 74.1 ohms Trip coil – terminals 3-4 11.8 ohms
Heater resistor – terminals 5-6 262 ohms
Observations 1. Lubrication with Dow Corning 55 2. The trip black piston showed signs of corrosion an indication of moisture being present
at one time. 3. The housing the black trip piston fit into also showed signs of moisture being present
at one time. 4. The linkages and latches for the mechanism were dirty. They did operate freely in the
shop environment. In my opinion I felt the latches looked worn and I did not check the mechanism to see if it was properly adjusted. I was not aware of any field checks for the setup of the mechanism being done.
5. Some minor corrosion on parts of the control assembly possibly caused from the salt environment or sulphur from the nearby oil refinery.
Black Trip Piston
Undertaking 78, Attachment 1 Page 62 of 78

Housing for Black Trip Piston
Linkages and Latches
Linkages and Latches
Undertaking 78, Attachment 1 Page 63 of 78

“C” phase pole control box was dis-assembled next. The table below shows the measured resistance values.
Close coil – terminals 1-2 75.2 ohms Trip coil – terminals 3-4 11.86 ohms
Heater resistor – terminals 5-6 was not measured
Heater was removed for use on other pole control box
Observations
1. This pole control box was in the same condition as the “B” pole control box with one noticeable difference. There was a wet stain spot on the control box that could not be explained or identified. It had no noticeable smell or taste. It seemed to be some type of solvent or chemical and I found it strange it was still wet. I am not sure if this is of any significance. A picture is below. The right side, a bit darker grey, is wet.
Wet Pole Control Box
• After lunch we had a meeting to discuss the findings to date and next steps. A high level summary of the notes are below. In parallel with this, the crew continued to dismantle the remaining six interrupters and documented the findings. Meeting Notes
1. The as found timing results on the original B1L03 breaker were very interesting. These readings were done after the event with the TR3100 Doble Timer. The readings were not recorded and are based on memory from the crew.
Close Times “A” phase – 137 ms, “B” phase – 162 ms, “C” phase – 187 ms These close times are too long and too much delta between phases. A test from 1980 was 116.2 ms Trip Times “A”, “B” & “C” phases all about 50 ms
Undertaking 78, Attachment 1 Page 64 of 78

The trips times are a bit too long compared a test from 1980 of 41.5 ms but with good deltas. The disagreement times were inconsistent. “A” phase was normal and cleared at 1599 ms (probably longer since the timer cuts off at 1600 ms) “B” phase some of the contacts went at 800 ms, 300 ms and the other contact times could not be determined because of lead issues. The comments for the “C” phase was “not good” 2. It was discussed if P&C could confirm the breaker trip coils did receive the trip
command and if so for what duration. The trip coils were all found with good resistance readings. If the trip coils received a command for a long duration the coils would burn out. This was followed up at the meeting with P&C the next day.
3. In parallel with the trip coils not receiving a trip command, the “block trip” circuit was discussed. During the testing of the replacement breaker the block trip pressure switch hung up once. It never acted up again. The block trip relay is energized under normal conditions making it failsafe. If the relay was dropped out it would have alarmed. The relay and circuit was function tested prior the breaker returning to service. Prior to the event there were no alarms at Sunnyside.
4. Another meeting was held the next day to include P&C and maintenance staff to discuss the findings to date.
• The remaining six of double interrupter contacts were taken apart and inspected. A micro-ohm
reading @ 100 amps was taken on each interrupter prior to dis-assembling. The chart below shows the micro-ohm readings. The condition of these contacts was found to be the same as the first three inspected.
Phase Contacts Micro-Ohm’s
“A” 1 & 2 72.9 “A” 3 & 4 79.8 “A’ 5 & 6 82.8 “B” 3 & 4 70.3 “C” 1 & 2 69.4 “C” 5 & 6 79.8
Wednesday February 5, 2014 • A meeting with maintenance and P&C was held to review all the details. P&C provided elementary drawings for the breaker and protections. Discussion was recorded into three categories “Confident”, “Uncomfortable” and “Follow Up”.
Meeting Notes
Confident • Interrupters removed from B1L03 breaker are not a problem • The replacement parts of the B1L03 breaker are functioning properly • Function testing confirmed protection okay • Protection operated correctly during the event but the B1L03 breaker did not respond • Air pressure at the B1L03 breaker was normal at the time of T1 failure
Undertaking 78, Attachment 1 Page 65 of 78

• Trip circuit – coils, 52a contacts, resistor, capacitor, control switches, blocked trip relay and “T” relay okay
• No breaker / air system anomaly alarm • Drained valves to check for moisture • Dewpoint @ -34 before filling breaker
Uncomfortable • Is moisture, cold, pollution, lubrication an issue in colder weather for the mechanisms? • Air system leaks at Sunnyside. • B1L03 operating times from sequence of events (SOE) seem to show slow operating
times. There was a very slow open on January 4, 2014 for the B1L03. This was an un-commanded event.
• Field staff indicated that the breaker would not operate pneumatically from the control cabinet after the event
Follow-up • Overhaul / re-lube criteria moving forward • Should the block trip pressure switch be checked or replaced since it was sticky but
operated fine during function testing. • Determine if the historical B1L03 breaker operating times match those for the in service
timing to determine if the breaker was slow previous to the event. • Function test breaker latches in cold weather to see how they perform. • Are the breakers exercised enough? • Follow up on the maintenance history for the other breakers that tripped okay for the
event.
The forecast for that night was a low of -15 C. I decided to place four pole control boxes outside overnight and test them in the morning. Two pole control boxes were from the “B” and “C” phases of the B1L03 breaker and two were spare boxes from the shop. They had their mechanisms latched.
Thursday February 6, 2014
• The four breaker pole control boxes were tested first thing in the morning. The
temperature was -16 C. The test voltage was 90 and 125 volts. P&C’s D.C power supply with the current limit at maximum was used. The results were as follows.
1. Both old pole control boxes operated @ 90 volts with no problems 2. “C” phase pole control box did not unlatch @ 90 or 125 volts. The coil was picking
up. 3. “B” phase pole control box did not operate the first time @ 90 volts but did unlatch
on the second attempt. The mechanism did appear slow to release.
Conclusions: • The results from the old pole control boxes were not used. It was discovered after they
had close coils in the trip coil housing. It was good to see they operated okay. • “B” phase pole control box did show indications that the mechanism could be affected
by cooler temperatures.
Undertaking 78, Attachment 1 Page 66 of 78

• It was discovered after the test that “C” phase pole control box was not latched. This test was not used.
• It was decided to try these tests on the two B1L03 boxes later that day again since it was going to be cold all day.
• The next test on the two pole control boxes was done later that day. The temperature was
-14 C. Both pole control boxes tripped @ 90 volts on the first attempt. The mechanisms did not appear slow as the “B” phase the first time.
Conclusions: • The testing showed indications that the mechanisms could be affected by colder temperatures in the condition they were found. How much is difficult to determine. The exact field conditions of the pole boxes during the event could not be replicated.
• It should be noted that an inspection of the control cabinet of the B1L03 breaker was not
done by me for this investigation.
Summary of Findings from the Investigation
Here is the summary of the findings for what I believe happened for this event. This is based on physical evidence from the investigation, discussion with field staff and knowledge of the circuit breaker. There are some things that happened that I can’t explain but have offered my opinion and rational. Any of my assumptions are open for discussion any time. 1. I find it interesting that the maintenance records show two previous events that the breaker had operating issues.
Work Order Date Comp. Work Done Investigation Comments
838346 4/8/2011 Function tests done after questionable operations during a fault.
All checked okay.
576789 3/6/2007 Breaker would not operate. Operated locally and ECC. Stayed in service
No cause found.
The temperatures during these events were not cold as the January 4, 2014 event. 2. After dis-assembling the B1L03 breaker and knowing what work was completed at site on the breaker I came to the following conclusions.
1. In my opinion all nine breaker interrupters would have tripped if initiated by the main valves. It should be noted that ABB has never used Renolit as a lubricant on the DCVF breaker and has stopped using this lubricant on other equipment.
2. The main valves on the breaker were field rebuilt at Sunnyside. Indications were that there were no issues found with the original valves. No water or ice was found. I believe that the six main valves would have operated if initiated by the servos. I also believe that if one or up to five of the six main valves did not operate a disagreement would have occurred on the breaker. No disagreement occurred. If no main valves operated a disagreement would not occur.
3. The condition of all three servo valves indicates they would have operated if initiated by their respective pole control boxes. If one or two of the servos did not operate a
Undertaking 78, Attachment 1 Page 67 of 78

disagreement would have occurred. No disagreement occurred. If none of the servos worked a disagreement would not occur.
4. “B” and “C” phase pole control boxes were last maintained in 2007. Both had dirty latches and linkages. They were lubricated with Dow Corning 55 not graphite and showed minor signs of corrosion. “B” trip piston and housing showed signs of moisture and corrosion. “C” phase pole control box had an unexplained wet stain. The cold weather trip testing indicated colder temperatures could have some affect the operation. How much of an effect cannot be determined. In my opinion I believe the pole control boxes in their as found condition should have at least unlatched when called on to trip. The performance of the pole control boxes could be improved with the proper lubrication and confirmation they are properly adjusted. The condition of the pole boxes could possibly cause slow operations. If all three pole control boxes were unlatched when initiated by the trip coils the breaker would have attempted a trip. I do not believe the moisture presence found in the “B” phase would prevent an attempt to trip from that pole if the linkage was unlatched. If one or two of the pole control boxes were unlatched a disagreement would have occurred. No disagreement occurred. If none of the pole control boxes unlatched no disagreement would have occurred. I am of the opinion that none of the pole control boxes were unlatched when the trip command was sent. Why this occurred I cannot be sure. I am having a difficult time believing that all three pole control boxes would not operate when called upon. This can be caused by an electrical and or mechanical issue. A mechanical issue can be caused by many factors such a cold ambient temperatures, lubrication, out of adjustment, dirty latches and linkages, mechanism exercising or moisture in the air system. All these conditions could contribute to the linkage not unlatching or being slow. The condition of the pole control boxes was not determined at the time of the event. It is possible that some of the odd timing results done on the breaker after the event were caused by slow pole control boxes. I am of the opinion that all three pole control boxes would fail not mechanically to not unlatch at least one of the linkages. This would have given a disagreement alarm which we did not receive. The question could be asked why none of the other four breakers experienced any issues. It appears to be something common with the B1L03 breaker. The function testing of the rebuilt breaker indicates that no electrical issues existed after the event. There is a possibility that an intermittent electrical issue could have been present prior to the event. Since maintenance records from the two previous events indicate that nothing was found this is remote possibility and a very difficult thing to find.
2. These are the other issues that were discovered during the investigation I would like to discuss.
1. Field staff indicated that the breaker could not be operated pneumatically from the control cabinet. I can provide some reasons why this may have happened. The pneumatic trip and close on the breakers require really firm operation to get the breaker to operate. If this was not done the breaker may not operate. The other possibility is that the pneumatic control was defective. I have never seen one of these defective before. I believe the condition of the pole control boxes should have allowed the breaker to be operated pneumatically.
2. Historical trip operating times from the SOE for the B1L03 appeared to indicate slow operating times. This required further analysis which was not completed when I left site. If there was no noticeable difference in operating times then this is not significant. If this
Undertaking 78, Attachment 1 Page 68 of 78

does show longer operating times it is an indication the mechanism slowing the breaker down.
3. In conjunction with the slow operating times there was an un-commanded event on January 4th after the event when staff was on site. The timing shows it looks like it went into disagreement on a trip. I can’t explain this. It appears the disagreement feature on the breaker was working shortly after the event.
4. The design of the “block trip” circuit is failsafe. If the block trip relay had open circuited or not energized by the breaker pressure switch, an alarm should have been received. There were no alarms at Sunnyside prior to event.
Conclusion I believe that the three pole control boxes on the B1L03 breakers did not unlatch when the trip command was sent during the event. I believe that the cold temperatures that the breaker was experiencing for days up to the event and the condition of the pole control boxes are factors affecting the breaker operation. The pole control boxes should have operated under these conditions but may be slow. With all the symptoms I am seeing here I would speculate that there is an intermittent voltage issue in the common part of the trip circuit probably in the form a high resistance connection. This may explain some of the things we have seen. It could explain the two previous issues in the maintenance history. It could explain the odd timing results we saw after the event. It may also explain why the pole control boxes did not unlatch during the event. The trip coils are 11.8 ohms each all in parallel. During the event we would have had fifteen of these coils being energized. This would put a large temporary load on the station battery. If there was a high resistance connection in the trip circuit to the B1L03 breaker there would be less current available for the trip coils with the reduced voltage. The problem is probably intermittent and I also believe temperature related. This would explain why things worked okay after with no problems. Recommendations I cannot say I have found the root cause for this event. I am very suspicious of the possible voltage issue with the trip circuit on the B1L03 breaker. I would recommend some follow up testing on the B1L03 breaker to see if this possible problem can be found or replicated again. It would be easier to find when it is colder. I believe it is a terminal connection from the relay to the breaker or it could the D.C. knife switch for the trip close circuits in the breaker control cabinet. I have found the hinge point of similar eight pole switches with high resistance. This was very difficult to find. In my opinion there could be some improvements made in the lubrication used on certain subassemblies and adjustment checks verified on the pole control boxes.
Undertaking 78, Attachment 1 Page 69 of 78

Nalcor order: 20582-00 OB ABB job number: 555605-10
Breaker ID: B1L17
Site Location: Holyrood Terminal Station Breaker type: DLF245 nc2 Serial number: 170-73-3/1973 Mechanism type: Air Blast Purpose for visit: Investigate “A” Phase Flashover to Ground On site dates: 2014-01-16 to 2014-01-21 Report presented to: Mr. Hughie Ireland ........................................................... Date: January 25, 2014 Scott Morris
SCOTT MORRIS
Undertaking 78, Attachment 1 Page 70 of 78

B1L17 Breaker Data
Type: DLF245 nc2 Serial Number 170-73-3/1973 Continuous Current 2000 amps Maximum Voltage 245 KV Maximum Voltage Full Wave 1050 KV Short Circuit Current 12.8 KA symm. Interrupting Time 2 cycles Frequency 60 Hz Operating Pressure: Normal 426 psi Lockout Pressure: Close 382 psi Lockout Pressure: Open 370 psi Lockout Pressure: Reclosing 400 psi Control Voltage 125 VDC Customer Purchase Order 15463 As Found Breaker Counter 1885 operations
Background
On January 5, 2014 an “A” phase to ground fault occurred at the Holyrood Terminal Station. The event occurred when the air break switch was being closed on the B1L17 breaker. The sequence of events information indicated the problem to be in the B1L17 breaker zone at Holyrood. It was suspected the “A” phase of the B1L17 breaker was closed when air breaker switch was closed or the breaker flashed. The B1L17 breaker did have open indication when the air breaker switch was closed. Site inspections by field staff could not find any signs of a flash on the breaker and other equipment in the B1L17 breaker zone. A few days after the event field staff were going establish a work permit on the breaker in the test condition. The intention was to determine if the “A” phase of the breaker was closed. Shortly after starting adding air the breaker the “A” phase interrupter developed a massive air leak. The leak was so loud it startled the worker and they rightfully, briefly exited the area. The worker made an assessment of the situation and returned to the breaker to close of the air supply to the breaker. Eventually all the air drained off the breaker and the all the poles went closed. It was never determined at this time if the “A” phase was actually closed. Further detailed investigation on the B1L17 breaker was required. ABB was contacted to provide support for the investigation.
Undertaking 78, Attachment 1 Page 71 of 78

Chronological Summary of Investigation
Thursday January 16, 2014
• 09:30 site meeting to discuss breaker failure, sequence of events, general discussion and next steps
• The cover was removed on the “A” phase interrupter to inspect the top of the breaker control rod. The control rod was not under tension as I should be. The control rod adjustment locking tab was in place and one side was bent over the flat on the bolt. The other side of the locking tab was not bent over the hex flat of the control rod. The preferred method is to have both ends of the locking tab secured. Observed that the top nut of the control rod was corroded as shown in the picture below. It is not normal to see corrosion on an air blast breaker using dry air. At this point it was assumed the control rod was broken.
• The inspection cover on the top of the “A” phase air receiver was removed to inspect the breaker control rod drive. The control rod drive bolts were corroded. A picture is below. The control rod drive was not in the position to be expected considering the breaker was suspected of being closed and drained of air. The control rod drive was binding and not able to be moved freely. The bottom of the control rod could not be seen because of the air screen. Not much more could be learned in the tight working space. The control rod and control rod drive needed to be removed for closer inspection.
Undertaking 78, Attachment 1 Page 72 of 78

Friday January 17, 2014 • To remove the control rod the breaker drops were disconnected and the breaker gradient
capacitors removed. The interrupters were rigged for lifting and removed. The control rod was disconnected from the control valve and the interrupters removed. After the interrupters were removed we learned that the control rod was not broken.
• The control rod drive was disconnected from the control rod. The control rod and control rod were removed from the breaker.
• Inspection of the control rod confirmed it was not broken. The control rod had signs of tracking near the top of the rod. It was observed that the surface of the control rod had an excessive amount of surface moisture on it considering that the control rod was just removed from a sealed breaker. There were some mechanical marks on the rod probably caused by touching parts of the insulator columns during removal and installation.
• The control rod drive was found seized to the point that it could not be moved at all. See picture below. When the control rod drive was inverted free water came out. The corrosion of the control rod drive was excessive. The screen was in bad shape. This corrosion would not be visible looking in from the bottom inspection cover of the air receiver when the control rod drive was installed.
• There is no indication at this time of a power arc occurring in the “A” phase. • Suspicious of excessive moisture being present in the air receiver the lower air receiver
inspection cover on the “A” phase air receiver was removed. An excessive amount of water was found in the bottom of the air receiver. A picture is below.
Undertaking 78, Attachment 1 Page 73 of 78

• There was discussion on how the water could have entered the breaker. Four breakers in the yard including the B1L17 had silicone put on the columns and interrupters. Two breakers were done consecutively one a time and the other two consecutively one a time too. There was a notable time difference between when the two sets of breakers were done. When this work was performed the breaker control rods were disconnected from the interrupters and left connected at the control rod drive. The control rods were supported on the unused overhead bus, covered up and sealed. It was suspected that water may have entered the B1L17 breaker at this time.
• The other two phases of the B1L17 breaker air receivers were inspected by removing the lower air receiver inspection cover. The “B” phase showed a very small amount of free water. The “C” phase had a moderate amount of water in it. A picture of the “C” phase air receiver is below.
• The next step was discussed. It was decided to check the three air receivers for moisture and one control rod drive for corrosion of another DLF breaker in the yard. The breaker selected was purposely not one of the three breakers that recently had silicone applied. We were trying to determine if the problem could be in all of the breakers. • The B2L42 breaker was inspected by removing the bottom drain plug on the air receivers. The plugs could be easily resealed. There were no signs of moisture in the air receivers of the B2L42 breaker. The “B” phase control rod drive was inspected for signs of corrosion and showed no signs of corrosion. • The drain plugs were removed from the B1L17 breakers allowing any water to drain out since colder temperatures were in the forecast. • There was discussion at the end of the day what was learned so far the next steps.
Saturday January 18, 2014 • The “B” and “C” phases of the B1L17 were disassembled for inspection. • The control rods of the “B” and “C” phases were found to be in the same condition. There were some marks on the rods that appear to be from scraping or wear. The nuts on the top of the control rod showed signs of corrosion. “C” phase showed the more corrosion compared to “B” phase which is supported by the amount of water in the poles. Pictures of each are below.
Undertaking 78, Attachment 1 Page 74 of 78

• The control rod drive on the “B” phase was tighter than normal to operate by hand. It was operable and not seized like the “A” phase.
• The control rod drive on the “C” phase was quite a bit tighter to operate than the “B” phase but again not seized like the “A” phase.
• In parallel with the B1L17 inspection two more DLF breakers were inspected for moisture in the air receivers. The breakers inspected were the B3B13 and B3L18. The two breakers had silicone installed on them about the same time. Both breakers showed no signs of free water in the air receivers. The control rod drive of the “B” phase on both breakers were inspected and showed no signs of corrosion.
• The control rod drive from the “A” phase was taken apart for inspection. The valve was very badly corroded and completely seized. It was very difficult to get apart. A couple is below.
• The “B” and “C” phase control rod drives were also taken apart. Both valves came apart easily and were not seized. The “B” phase valve had some corrosion on the inside but not as bad as the “C” phase. The “C” phase was corroded worse than the “B” phase but not as bad as the “A” phase. The flange bolts on the “C” phase were starting to corrode. This supports the as found condition of the valves being worse when exposed to more water.
Saturday January 18, 2014
• The B2B12 breaker air receivers and the “C” phase control rod drive inspected. There were no signs of moisture in the air receivers and the “C” phase control rod drive showed no signs of corrosion. • A closer inspection of the “A” phase interrupters and control valve was done. • The control valve of “A” phase interrupter had signs of water and moisture was present. The percussion gasket showed normal signs of wear and was in good condition. The valve was overhauled about one year ago. In my opinion the control valve would operate properly if properly initiated to do so. A picture is below.
Undertaking 78, Attachment 1 Page 75 of 78

• The blast valve from the “A” phase interrupter was not inspected. • The two moving interrupter contacts from the “A” phase were removed for inspection. • Both the main and stationary contacts for both interrupters showed what would be considered to be normal wear. The breaker has 1885 operations. A picture of a moving contact is below.
The tube on each of the moving contacts each showed some signs of heating. I do not believe these were from the recent event. These were not fresh and could not be removed. A picture of a moving contact showing the heating is below.
The stationary contacts looked fine. The inside barrels of the porcelains were cleans and had surface moisture on them. • I did not see any indications of fault current flowing across an open set of contacts. • P&C Doble tested the B1L17 oil filled current transformers. •
Undertaking 78, Attachment 1 Page 76 of 78

• The pole control boxes were inspected. Externally they looked fine. It should be noted that all the linkages in all three pole control boxes were tripped. This is an indication that the air was drained off the breaker while the breaker was open. The inside components of the pole control boxes were not inspected. Considering the age of the breaker they could be overhauled.
Summary of Findings from the Investigation
Here is the summary of the findings for what I believe happened for this event. This is based on the physical evidence from the investigation, discussion with field staff and knowledge of the circuit breaker. There are some parts of the event that I have made some assumptions and I have acknowledged these. Any of my assumptions are open for discussion any time. 1. I believe the “A” phase of the breaker was closed prior to the event happening on January 5, 2014. This begs many questions such as how this can happen and go undetected.
1. The failure mode of the control rod drive being seized at the time would not allow the “A”
pole to operate. The pole control box was operating fine and would have sent a signal to the control drive but the control rod drive would not change state. Since the control box sent its signal to the “A” phase and the other two phases opened, the phase discrepancy feature (disagreement) would be satisfied and no alarm would be received. This failure mode is not sensed by the phase discrepancy.
2. The other reason I believe the “A” pole did not open is the control rod drive was seized so bad that it would have never been able to complete its operation and the control valve would have developed a major air leak which would have not gone undetected. The “A” phase does develop a major lead post event which will be discussed later.
3. To support the “A” phase of the B1L17 being closed after it was tripped last I have to assume that the other breakers in the zone had tripped okay. If any of the other breakers were closed the generator would have seen reverse power protections operate from the closed “A” phase on the B1L17. After the zone trip the air break switch to the generator would have been opened. The closed “A” phase on the B1L17 would go undetected until the breaker was energized again by the air break switch. I have not obtained the information if the last trip for the B1L17 was a zone trip.
4. I believe another factor contributing to the control rod drive not operating was it was frozen in addition to being corroded. The weather historical date from Environment Canada for the St John’s airport shows very cold daytime temperatures for the first five days of January.
2. On January 5, 2014 there was an “A” phase to ground fault in the B1L17 breaker zone.
1. There was no evidence found to locate an “A” phase to ground fault internal to breaker,
external to the breaker or in the zone. 2. Free water was discovered in all three air receivers with the most being in the “A” phase. 3. The as found condition of the control rod drive on the “A” phase did not make sense to me.
If the control rod was in that position a massive air leak would have occurred at the control valve on the interrupter. What happened approximately two days after the event I believe explains the position of the control rod drive.
Undertaking 78, Attachment 1 Page 77 of 78

3. Approximately two days after the event when a trades administered work permit in test was being established a massive air leak developed on the “A” phase interrupter when the air pressure was being increased.
1. I believe that the increase in air pressure caused the control rod to move on the ‘A” phase
because the control rod drive had thawed enough for it to move. The weather data as mentioned above shows a high temperature of 9.6 degrees for January 7, 2014.
2. This would explain why the control rod drive on the “A” phase was found in the position it was in.
3. The massive air leak caused explains why all the pole control box mechanisms were found tripped. This situation occurs when the air is lost on the breaker with the breaker open. As previously mentioned the pole control box on the “A” phase would still think the breaker was open.
Conclusion Although no “A” phase to ground path could be found it was quite clear the moisture in “A” phase air receiver was a factor causing the rod control drive to not function properly.
Undertaking 78, Attachment 1 Page 78 of 78


![[WhollyownedGovernmentofKarnataka undertaking]](https://static.fdocuments.net/doc/165x107/62550b4df19b3f0bb838b927/whollyownedgovernmentofkarnataka-undertaking.jpg)
