NKS-226, Probabilistic Safety Goals for Nuclear Power ... · Obviously, there will also be...
109
Nordisk kernesikkerhedsforskning Norrænar kjarnöryggisrannsóknir Pohjoismainen ydinturvallisuustutkimus Nordisk kjernesikkerhetsforskning Nordisk kärnsäkerhetsforskning Nordic nuclear safety research NKS-226 ISBN 978-87-7893-296-9 Probabilistic Safety Goals for Nuclear Power Plants; Phases 2-4 / Final Report Lisa Bengtsson 1, Jan-Erik Holmberg 2, Jukka Rossi 2, Michael Knochenhauer 1 1 Scandpower AB, Sweden 2 VTT, Finland May 2011
Transcript of NKS-226, Probabilistic Safety Goals for Nuclear Power ... · Obviously, there will also be...

Nordisk kernesikkerhedsforskningNorrænar kjarnöryggisrannsóknir
Pohjoismainen ydinturvallisuustutkimusNordisk kjernesikkerhetsforskning
Nordisk kärnsäkerhetsforskningNordic nuclear safety research
NKS-226 ISBN 978-87-7893-296-9
Probabilistic Safety Goals for Nuclear Power Plants;
Phases 2-4 / Final Report
Lisa Bengtsson 1, Jan-Erik Holmberg 2, Jukka Rossi 2, Michael Knochenhauer 1
1 Scandpower AB, Sweden 2 VTT, Finland
May 2011

Abstract Safety goals are defined in different ways in different countries and also used differently. Many countries are presently developing them in connection to the transfer to risk-informed regulation of both operating nuclear power plants (NPP) and new designs. However, it is far from self-evident how probabilistic safety criteria should be defined and used. On one hand, experience indicates that safety goals are valuable tools for the interpretation of results from a probabilistic safety assessment (PSA), and they tend to enhance the realism of a risk assessment. On the other hand, strict use of probabilistic criteria is usually avoided. A major problem is the large number of different uncertainties in a PSA model, which makes it difficult to demonstrate the compliance with a probabilistic criterion. Further, it has been seen that PSA results can change a lot over time due to scope extensions, revised operating experience data, method development, changes in system requirements, or increases of level of detail, mostly leading to an increase of the frequency of the calculated risk. This can cause a problem of consistency in the judgments.
This report presents the results from the second, third and fourth phases of the project (2007–2009), which have dealt with providing guidance related to the resolution of some specific problems, such as the problem of consistency in judgement, comparability of safety goals used in different industries, the relationship between criteria on different levels, and relations between criteria for level 2 and 3 PSA. In parallel, additional context information has been provided. This was achieved by extending the international overview by contributing to and benefiting from a survey on PSA safety criteria which was initiated in 2006 within the OECD/NEA Working Group Risk.
The results from the project can be used as a platform for discussions at the utilities on how to define and use quantitative safety goals. The results can also be used by safety authorities as a reference for risk-informed regulation. The outcome can have an impact on the requirements on PSA, e.g., regarding quality, scope, level of detail, and documen¬tation. Finally, the results can be expected to support on-going activities concerning risk-informed applications.
The project provides a comprehensive state-of-the-art description and has contributed to clarifying the history of safety goals both nationally and internationally, the concepts involved in defining and applying probabilistic safety criteria, and the international status and trends in general. It has identified critical issues and the main problem areas. Finally, the project provides useful recommendations and guidance on the definition and application of criteria.
Furthermore, the project makes it possible to define criteria stringently, improving the possibilities of argumentation on safety. Generally, this supports efficient use of criteria, yielding more useful PSA results. In this connection, the introduction of ALARP type criteria is judged to provide a very useful way of balancing stringency with the necessary flexibility. There is a possibility of making more active use of lower level criteria. This makes the connection to defence in depth more evident, and opens the perspective of increased control of defence in depth by use of probabilistic methods, including the use as design tools. There is an opportunity for comparison of risk of different NPPs, as well as of comparison of NPP risk with other risks in society. This is judged to provide an opportunity for improved communication on risks with non-PSA experts and with the public in general. However, a necessary condition for meaningful comparisons is to agree on the scope of PSA and methods applied.

Obviously, there will also be challenges in the future definition and application of probabilistic safety criteria. These include very general aspects, such as the interpretation of the probability, quality aspects of PSA, and the definition of meaningful and consistent risk criteria for different usages. The need and usefulness of subsidiary criteria has been stressed in the project, but there is obviously also a challenge in defining a relevant set of criteria on different levels. Defining criteria for L(E)RF is complex, especially if release criteria are defined as subsidiary for societal and individual risk. Finally, it will be a challenge to develop coherent application procedures relative to the criteria defined. Key words Safety Goals, PSA, Safety Targets, ALARP, Decision criteria, Risk informed decision making NKS-226 ISBN 978-87-7893-296-9 Electronic report, May 2011 NKS Secretariat P.O. Box 49 DK - 4000 Roskilde, Denmark Phone +45 4677 4045 Fax +45 4677 4046 www.nks.org e-mail [email protected]

Probabilistic Safety Goals for Nuclear Power Plants; Phas-es 2-4 / Final Report Rapportnummer: NKS-226 Författare: Lisa Bengtsson 1, Jan-Erik Holmberg 2, Jukka Rossi 2 och Michael Knochenhauer 11Scandpower AB, SE-172 25 Sundbyberg, Sweden 2VTT, P.O.Box 1000, FI-02044 VTT, Finland Datum: 2011-04-30

Table of contents 1. Introduction .................................................................................... 10 1.1 Project overview............................................................................ 10 1.2 Document overview ...................................................................... 12 2. Probabilistic safety criteria for NPP:s – an introduction ............ 14 3. Short summary of status and experiences in Sweden and Finland 17 3.1 Scope ............................................................................................. 17 3.2 Conclusions................................................................................... 17 4. International overview.................................................................... 20 4.1 Probabilistic safety criteria for nuclear power plants ................ 20
4.1.1 Background ............................................................................. 20 4.1.2 Status of probabilistic criteria................................................... 20 4.1.3 Comparison of criteria for new and operating plants ............... 21 4.1.4 What probabilistic risk criteria exist?........................................ 22 4.1.5 Consideration of uncertainty.................................................... 23 4.1.6 When and how do probabilistic risk criteria apply? .................. 23 4.1.7 Experience on implementation of probabilistic risk criteria ...... 24 4.1.8 Experience on communication of probabilistic risk criteria ...... 25 4.1.9 Core Damage Frequency criteria............................................. 26 4.1.10 Frequency of Releases Criterion ........................................... 27
4.2 Overview of probabilistic safety criteria related to other man-made risks in society .......................................................................... 29
4.2.1 International overview.............................................................. 29 4.2.2 The Netherlands ...................................................................... 30 4.2.3 United Kingdom....................................................................... 31 4.2.4 Czech Republic ....................................................................... 32 4.2.5 Switzerland.............................................................................. 32 4.2.6 Germany.................................................................................. 33 4.2.7 Denmark.................................................................................. 33 4.2.8 Some other criteria .................................................................. 33 4.2.9 Summary of national criteria.................................................... 34
4.3 Safety goals in the European off-shore oil and gas industry.... 36 4.3.1 Introduction.............................................................................. 36 4.3.2 Risk acceptance criteria in the Norwegian oil and gas industry37 4.3.3 Risk acceptance criteria in UK regulations .............................. 39 4.3.4 Discussions ............................................................................. 41 4.3.5 Conclusions............................................................................. 41
4.4 Safety goals in the European railway industry........................... 42 4.4.1 Introduction.............................................................................. 42 4.4.2 General.................................................................................... 43 4.4.3 Background to risk acceptance criteria.................................... 44 4.4.4 Hazard definition...................................................................... 45 4.4.5 Responsibilities........................................................................ 46 4.4.6 CSM and CST - Emerging common safety methods and common safety targets within the EU ............................................... 47 4.4.7 Conclusions............................................................................. 49
5. Consistency in the usage of probabilistic safety criteria ........... 50
2

5.1 Background ................................................................................... 50 5.2 Scope ............................................................................................. 51 5.3 Comparison of the quantitative PSA results............................... 52 5.4 Analysis of Model Changes.......................................................... 53
5.4.1 Plant Changes......................................................................... 53 5.4.2 Success Criteria ...................................................................... 55 5.4.3 Data......................................................................................... 57 5.4.4 Minimal cut-set cut-off ............................................................. 59 5.4.5 PSA scope and method........................................................... 59
5.5 Discussion ..................................................................................... 59 5.6 Consistency between plants ........................................................ 60 6. Risk criteria for PSA level 2.......................................................... 62 6.1 Background ................................................................................... 62 6.2 Level 2 vs. level 3 criteria ............................................................. 63
6.2.1 Basis for comparison ............................................................... 63 6.2.2 Test application to Finnish site ................................................ 65 6.2.3 Results from the test application.............................................. 66 6.2.4 Comparison to the safety goal ................................................. 69
7. Subsidiary risk criteria................................................................... 71 7.1 Background ................................................................................... 71 7.2 Justification with respect to the primary safety goals for a nuclear power plant ............................................................................ 74 7.3 Justification with cost-benefit analysis....................................... 79 7.4 Justification with respect to experience from PSA.................... 82 7.5 Summary........................................................................................ 83 8. Subsidiary risk criteria................................................................... 85 8.1 Main conclusions from the project .............................................. 85 8.2 Specific conclusions..................................................................... 86 9. REFERENCES................................................................................. 92 Attachment 1. Safety goals and PSA risk criteria defined by nuclear safety authorities................................................................... 98
3

List of tables Table 1. Comparison of criteria of individual risk ...........................34 Table 2. Comparison of criteria for societal risk .............................35 Table 3. Comparison of criteria of individual risk ...........................36 Table 4. Accident categories and main safety functions for an offshore drilling rig..................................................................................39 Table 5. First set of common safety targets (CST) applicable to rail traffic within the EU..........................................................................48 Table 6. CDF [1/year] presented in the PSA-models. Cells with values above 10-6/year are shaded.....................................................53 Table 7. Contamination areas based on long-term exposure from cow’s milk and from groundshine following the reference release. .......................................................................................................68 Table 8. Risk criteria with respect to INES classes 2 to 7 proposed in [RESS_80(2003)143]. .......................................................78 Table 9. Justification principles for subsidiary risk criteria.........84 List of figures Figure 1 Overview of the 4-year NPSAG/NKS project “The Validity of Safety Goals” (2006–2009) ................................................11 Figure 2 Some concepts involved when defining a probabilistic safety criterion..........................................................................................16 Figure 3 Numerical criteria defined for Core Damage. ..................27 Figure 4 Numerical criteria defined for large release. Definition and timing of “large release” varies ...................................................29 Figure 5 Advisory societal risk limits in the Netherlands [Ale_2002] ..................................................................................................31 Figure 6 Switzerland – scale of damage indicators (assignment of disaster values) ...................................................................................32 Figure 7 Risk Acceptance Criteria for 3rd party Societal Risk – Example from Oil and Gas operations on the Norwegian continental shelf. .....................................................................................39 Figure 8 Main parts of the ETCS system. ..........................................43 Figure 9 Risk analysis responsibilities from EN 50129. ................47 Figure 10 Scope of the Forsmark 1 PSA versions 1994, 2000 and 2006. ............................................................................................................52 Figure 11 Backtracking of two specific plant changes..................55 Figure 12 CDF with success criteria for PSA-2000 applied to PSA-1994 ....................................................................................................56 Figure 13 CDF with success criteria for PSA-2006 applied to PSA-2000 ....................................................................................................56 Figure 14 Core Damage Frequency with success criteria according to PSA-2006 ...........................................................................57 Figure 15 Individual risk of early fatality as a function of distance. .....................................................................................................64
4

Figure 16 Examples of complementary cumulative distribution functions for early and late health effects from NUREG-1150 [USNRC 1990]. ..........................................................................................65 Figure 17 Individual dose caused by the reference release (100 TBq Cs-137 and 148 TBq Cs-134) at the Olkiluoto site..................67 Figure 18 Individual ingestion dose caused by the reference release at the Olkiluoto site. .................................................................68 Figure 19. Complementary cumulative distribution functions (CCDF) of the collective doses caused by the reference release in Olkiluoto. ...............................................................................................70 Figure 20. A safety goal compared to the estimated individual fatal cancer risk at the Olkiluoto site..................................................70 Figure 21 Overview of the INES scale [IAEA_INES]. ......................72 Figure 22. Levels of PSA and defence-in-depth (DID)....................73 Figure 23 Example group mortality risk criteria. .............................77 Figure 24 Comparison of YVL-2.8 risk criteria and INES-scale based criteria proposed by Saji [RESS_80(2003)143]....................79 Figure 25 A simplified nuclear power plant lottery.........................80 Figure 26 Core damage probability (p1) and conditional large release probability (p2) making the expected value of an NPP equal to 0....................................................................................................81
5

Acronyms and Abbreviations ALARA As Low As Reasonably Achievable ALARP As Low As Reasonably Practicable BWR Boiling water reactor CDF Core damage frequency CET Containment event tree CFF Containment failure frequency CLI Criteria for limiting impact (in EUR) CSNC Canadian Nuclear Safety Commission DBA Design Basis Accident DID Defence-in-depth DSA Deterministic Safety Analysis EOP Emergency operating procedures EPR European Pressurized Reactor ET Event tree EU Expected utility EUR European Utility Requirements EV Expected value FKA Forsmarks Kraftgrupp AB FT Fault Tree HRA Human reliability analysis HSE Health and Safety Executive (UK) IAEA International Atomic Energy Agency ICRP International Commission on Radiological Protection IE Initiating event INES International Nuclear Event Scale (IAEA) JAEA Japan Atomic Energy Agency LERF Large early release frequency LOCA Loss of coolant accident LRF Large release frequency LWR Light water reactor NEA Nuclear Energy Agency of OECD NII Nuclear Installations Inspectorate NKS Nordic nuclear safety research NPP Nuclear power plant NPSAG Nordic PSA Group OECD Organisation for Economic Co-operation and Development PSA Probabilistic safety assessment PWR Pressurised water reactor RC Release category RPS Reactor protection system SAP Safety assessment principle (UK HSE) SAR Safety Analysis Report SG Safety goal
6

SKI Swedish Power Nuclear Inspectorate (Statens kärnkraftinspek-tion); (until 2008 – now part of SSM)
SSC Systems, structures and components (of a nuclear power plant)
SSI The Swedish Radiation Protection Authority (Statens strål-skyddsinstitut); (until 2008 – now part of SSM)
SSM Swedish Radiation Protection Authority (Strålsäkerhetsmyn-digheten)
STUK Radiation and Nuclear Safety Authority of Finland (Säteily-turvakeskus)
TVO Teollisuuden Voima Oy U.S.NRC United States Nuclear Regulatory Commission VTT Technical Research Centre of Finland WG Working Group (of OECD/NEA)
7

SUMMARY The outcome of a probabilistic safety assessment (PSA) for a nuclear power plant is a combination of qualitative and quantitative results. Quantitative results are typically presented as the Core Damage Frequency (CDF) and as the frequency of an unacceptable radioactive release. In order to judge the acceptability of PSA results, criteria for the interpretation of results and the assessment of their acceptability need to be defined. Safety goals are defined in different ways in different countries and also used differently. Many countries are presently developing them in connec-tion to the transfer to risk-informed regulation of both operating nuclear power plants (NPP) and new designs. However, it is far from self-evident how probabilistic safety criteria should be defined and used. On one hand, experience indicates that safety goals are valuable tools for the interpretation of results from a probabilistic safety assessment (PSA), and they tend to enhance the realism of a risk assessment. On the other hand, strict use of probabilistic criteria is usually avoided. A major problem is the large number of different uncertainties in a PSA model, which makes it difficult to demon-strate the compliance with a probabilistic criterion. Further, it has been seen that PSA results can change a lot over time due to scope extensions, revised operating experience data, method development, changes in system require-ments, or increases of level of detail, mostly leading to an increase of the frequency of the calculated risk. This can cause a problem of consistency in the judgments. The first phase of the project (2006) provided a general description of the issue of probabilistic safety goals for nuclear power plants, of important concepts related to the definition and application of safety goals, and of ex-periences in Finland and Sweden. The second, third and fourth phases (2007–2009) have been concerned with providing guidance related to the resolution of some of the problems identified, such as the problem of consis-tency in judgement, comparability of safety goals used in different indus-tries, the relationship between criteria on different levels, and relations be-tween criteria for level 2 and 3 PSA. In parallel, additional context informa-tion has been provided. This was achieved by extending the international overview by contributing to and benefiting from a survey on PSA safety criteria which was initiated in 2006 within the OECD/NEA Working Group Risk. Finally, a separate report has been issued providing general guidance concerning the formulation, application and interpretation of probabilistic criteria. The results from the project can be used as a platform for discussions at the utilities on how to define and use quantitative safety goals. The results can also be used by safety authorities as a reference for risk-informed regulation. The outcome can have an impact on the requirements on PSA, e.g., regard-ing quality, scope, level of detail, and documentation. Finally, the results can
8

be expected to support on-going activities concerning risk-informed applica-tions. Acknowledgements The work has been financed by NKS (Nordic nuclear safety research) and the members of NPSAG (Nordic PSA Group) and SAFIR2010 (The Finnish Research Programme on Nuclear Power Plant Safety 2007–2010).
9

1. Introduction
1.1 Project overview The project “The Validity of Safety Goals” has been financed jointly by NKS (Nordic Nuclear Safety Research), SSM (Swedish Radiation Safety Authority) and the Swedish and Finnish nuclear utilities. The national fi-nancing went through NPSAG, the Nordic PSA Group (Swedish contribu-tions) and SAFIR2010, the Finnish research programme on NPP safety (Fin-nish contributions). The project has been performed in four phases during 2006–2010. An over-view of the entire project is given in Figure 1.
10

Figure 1 Overview of the 4-year NPSAG/NKS project “The Validity of Safety Goals” (2006–2009) The first phase of the project (“BASIS”) was carried out with the aim to discuss and document current views, mainly in Finland and Sweden, on the use of safety goals, including both benefits and problems. The work has clarified the basis for the evolvement of safety goals for nuclear power plants in Sweden and Finland and of experiences gained. This was achieved by performing a rather extensive series of detailed interviews with persons who are or have been involved in the formulation and application of the safety goals. Results of phase 1 have been published in two parallel reports issued by NKS [NKS-153], and SSM [SKI_2007:06]. The report presents the project context and a background to safety goals, as well as a historical review describing reasons for defining safety goals, context of goals and experiences. A number of specific issues related to the definition, interpreta-tion and use of probabilistic safety goals were also identified and discussed. Towards the end of project phase 1, the OECD/NEA Working Group RISK started preparations for carrying out a task aimed at mapping probabilistic safety criteria in use in the member countries, and at collecting experiences from application of probabilistic criteria. The OECD/NEA task was defined and carried out in co-operation with the NKS project. The second, third and fourth project phases (“ELABORATION”) increased the scope and level of detail of the project by addressing a number of spe-cific issues related to the application and use of safety goals, i.e.: consistency in the usage of safety goals, usage of probabilistic analyses in support of deterministic safety analysis, criteria for assessment of results from PSA level 2 (criteria for off-site consequences), and the use of subsidiary criteria and relations between these. These phases also included the addition of a more systematic overview of international safety goals and experiences from their use, including participation in the OECD/NEA WGRISK Task 2006:2 “Probabilistic safety criteria” [NEA/CSNI/R(2009)16], and a concise review of safety goals related to other man-made risks in society, with focus on the railway and oil and gas industries. Separate reports were issued for project phases 3 and 4 [NKS-172 and NLS-195]; the present report covers project phases 2-4, i.e., it includes relevant part of these reports as well as project results from phase 4. The fourth and final project phase has also resulted in a “Guidance for the formulation, application and interpretation of probabilistic safety criteria”, which is issued as a separate report by NKS and SSM, [NKS-227 / SSM 2010:36]. Thus, the outcome of the project is covered by the following three project reports:
11

BASIS: Probabilistic Safety Goals. Phase 1 – Status and Experiences in Sweden and Finland [NKS-153 / SKI 2007:06].
ELABORATION: Probabilistic Safety Goals for Nuclear Power Plants. Phase 2-4 – Final Report [NKS-226 / SSM 2010:35].
GUIDANCE: Guidance for the formulation, application and interpretation of probabilistic safety criteria [NKS-227 / SSM 2010:36].
1.2 Document overview This document includes the following parts: Chapter 1. INTRODUCTION
An overview of the project and of the present document.
Chapter 2. PROBABILISTIC SAFETY CRITERIA FOR NPP:S – AN INTRODUCTIOION An introduction to the status regarding Safety Goals and to the project.
Chapter 3. SHORT SUMMARY OF STATUS AND EXPERIENCES IN SWEDEN AND FINLAND Summary of scope and conclusions from the first project phase, which is documented in a separate analysis document.
Chapter 4. INTERNATIONAL OVERVIEW The overview includes a summary of the results from the OECD/NEA Working Group Risk task on Probabilistic Safety Criteria as well as an overview of safety criteria related to other man-made risks in society, specifically within the off-shore oil and gas industry and in railway transportation.
Chapter 5. CONSISTENCY IN THE USAGE OF PROBABILISTIC SAFETY CRITERIA The chapter describes how PSA models and results change over time as a result of changes in analysis scope, plant changes, changes in success criteria, and changes in data.
Chapter 6. RISK CRITERIA FOR PSA LEVEL 2 A separate analysis has been performed exploring the relations between existing level 2 criteria in Finland and actual off-site consequences, corresponding to what would be analysed with a level 3 PSA.
Chapter 7. SUBSIDIARY RISK CRITERIA The chapter deals with subsidiary criteria, defined on techni-cal levels below the primary risk.
12

Chapter 8. CONCLUSIONS Conclusions are presented for the project as such as well as for the main sub-projects performed.
Chapter 9. REFERENCES
13

2. Probabilistic safety crite-ria for NPP:s – an intro-duction
The outcome of a probabilistic safety assessment (PSA) for a nuclear power plant is a combination of qualitative and quantitative results. Quantitative results are typically presented as the Core Damage Frequency (CDF) and as the frequency of an unacceptable radioactive release, sometimes referred to as Large Release Frequency (LRF) or Large Early Release Frequency (LERF). In order to judge the acceptability of PSA results, criteria for the interpretation of results and the assessment of their acceptability need to be defined. Target values for PSA results, both for CDF and for radioactive releases, are in use in most countries having nuclear power plants. In some countries, the safety authorities define these target values or higher level safety goals. In other countries, they have been set only by the nuclear utilities. Ultimately, the goals are intended to define an acceptable level of risk from the operation of a nuclear facility. There are usually also important secondary objectives, such as providing a tool for identifying and ranking issues with safety im-pact, which includes both procedural and design related issues. Thus, safety goals usually have a dual function, i.e., they define an acceptable safety level, but they also have a wider and more general use as decision criteria. Safety goals range from high level qualitative statements (e.g., “The use of nuclear energy must be safe”) to technical criteria (e.g., fuel cladding tem-perature must not be higher than 1204 °C) and probabilistic risk criteria (e.g., core damage frequency should be less than 10-5 per year). They have been published in different ways, from legal documents to internal guides. They can be applied as legal limits (not meeting them is an offence) down to “orientation values”. Safety goals are defined in different ways in different countries and also used differently. Many countries are presently developing them in connec-tion to the transfer to risk-informed regulation of both operating nuclear power plants (NPP) and new designs. The exact levels of the safety goals differ between organisations and between different countries. There are also differences in the definition of the safety goal, and in the formal status of the goals, i.e., whether they are mandatory or not. In addition to the national safety goals, international organisations have de-fined safety goals. The International Atomic Energy Agency (IAEA) defined safety goals already in the 1980s [IAEA_INSAG-3]. The report was updated
14

in 1999 [IAEA_INSAG-12]. The European Utility Requirements for LWR nuclear power plants (EUR) include also definitions for probabilistic design targets [EUR_2002]. In most countries, safety goals started to be discussed and defined in the late 1980s [NUREG-0880, IAEA_INSAG-3]. At that time, PSA models were rather limited in scope, often consisting mainly of internal process events (transients and LOCA) during power operation. For various reasons, includ-ing limitations in analysis scope and capacity problems with the computer codes used for the analyses, the level of detail of the PSA models was also rather limited. In addition, the focus was on level 1 PSA, i.e., on calculation of CDF. Furthermore, the actual use of early PSA:s was generally rather limited, even if the issue of Living PSA (LPSA) received considerable atten-tion during the 1980s. During the 1990s, PSA models expanded considera-bly, both regarding operating states and classes of initiating events. The level of detail of the analyses also increased, especially regarding initiating events (definition of common cause initiator events, CCI), inclusion of functional dependencies (signals, power supply, control logics), and modelling of non-safety systems. In parallel, PSA:s were expanded to level 2, making it possi-ble to calculate the frequency of radioactive releases. Thus, the scope, level of detail and areas of use of PSA have changed con-siderably since the time the safety goals were originally defined. This is a change both in quality and in maturity of the PSA technique. At the same time, PSA applications are becoming more and more important. This has lead to an increased interest and need to make active use of PSA results, and thus to make judgments concerning the acceptability of risk contributions calculated with PSA. Defining and applying quantitative criteria for reactor safety may have a large impact on both the scope and contents of the analyses required and on requirements for safety improvements at nuclear power plants. It is therefore of great importance that safety goals are soundly based, that they can be effectively and unambiguously applied, and that they can be accepted and understood by all parties concerned (authorities, nuclear utilities, decision makers, analysts, etc.). It is far from self-evident how probabilistic safety criteria should be defined and used. On one hand, experience indicates that safety goals are valuable tools for the interpretation of results from a probabilistic safety assessment (PSA), and that they tend to enhance the realism of the risk assessment. On the other hand, strict use of probabilistic criteria is usually avoided. A major problem is the large number of different uncertainties in the PSA model, which complicate demonstration of compliance with a probabilistic criterion. Furthermore, PSA results have so far tended to change a lot over time due to scope extensions, revised operating experience data, method development,
15

and increases of level of detail. This can cause a problem of consistency in the judgments. Figure 2 gives an overview of some (but not all) of the concepts that are involved when defining and applying probabilistic safety criteria, using cri-teria for core damage and unacceptable release as an example.
Figure 2 Some concepts involved when defining a probabilistic safety criterion
16
3. Short summary of status and experiences in Swe-den and Finland
3.1 Scope Phase 1 of the project dealt mainly with the status in Sweden and Finland. As the results from this work are presented in detail in a separate project report [NKS-153 / SKI 2007:06], only a short summary will be given below. The overall aim in this phase was to discuss and document current views, mainly in Finland and Sweden, on the use of safety goals, including both benefits and problems. Another important aim was to provide a clear de-scription of the issue of probabilistic safety goals for nuclear power plants, to define and describe important concepts related to the definition and applica-tion of safety goals, and to describe experiences in Finland and Sweden. Based on a series of interviews and on literature reviews as well as on a lim-ited international overview, project phase 1 described the history and current status of safety goals in Sweden and Finland, and elaborated on a number of issues, including the following:
The status of the safety goals in view of the fact that they have been ex-ceeded for much of the time they have been in use, as well as the possible implications of these exceedances.
Safety goals as informal or mandatory limits.
Strategies for handling violations of safety goals, including various graded approaches, such as ALARP (As Low As Reasonably Practicable).
Relation between safety goals defined on different levels, e.g., for core damage and for unacceptable release.
A number of important issues were identified for continued studies in later project phase.
3.2 Conclusions In Sweden and Finland there are around 30 years of experience of perform-ing PSA, which includes several revisions of the studies, a gradual increase in scope and level of detail, as well as steadily increasing use of PSA for decision making. In spite of the many safety improvements made through
17

the years based on PSA results, a current view is that the safety goals out-lined in the 1980s, i.e., 10-5 per year for CDF and 10-7 per year for unaccept-able release, are hard to achieve for operating NPP:s. This experience arouses confusion that should be resolved in order to further strengthen the confidence in the PSA methodology. Questions aroused include what safety goals should be applied for operating plants, whether the risk level of the plants is too high, whether PSA:s are too conservative, and if safety goals are being applied in an incorrect way? The situation is somewhat different for a new plant, for which risk insights have been utilised already from the design phase. The use of safety goals is mostly understood to have had a positive impact from a PSA quality point of view. In order to meet safety goals, unnecessary conservatism needs to be avoided in the modelling, i.e., the basic aim should be to have realistic PSA models. It seems that informal use of safety goals and cost-benefit evaluations is preferred by most to a situation with strictly enforced safety acceptance criteria. One perceived reason to avoid strict use of safety goals, is that this might switch the attention from an open-minded assessment of plant safety to the mere fulfilment of safety goals. The use of safety goals implies a need for rules to handle violations. In Swe-den, formal PSA safety goals are defined by the utilities, but have not been strictly enforced. This is probably due to the fact that PSA results have ex-ceeded the safety goals during most of the time since they were defined. In consequence, a graded approach similar to ALARP has been implicitly ap-plied, i.e., the IAEA safety goal for existing plants, i.e., CDF = 10-4 per year has been seen as a limit, while the internal utility safety goal of CDF = 10-5 per year has been the target. In Finland, the internal safety goals for operat-ing plants are informal and can also be interpreted as targets rather than lim-its. From the regulatory perspective, quantitative safety goals are not strictly applied for operating plants. Utilities may define safety goals and the way they are applied. In the regulatory decision making, i.e., in risk-informed applications and plant modifications, decisions are made case by case. There is, however, a general regulatory requirement on continuous improvement of safety. Since the 1990s, much focus has been on the development of various risk-informed applications, e.g., optimisation of allowed outage times, test inter-vals, and in-service-inspection programmes. The risk criteria used in these applications have to date typically been based on risk importance measures and are application specific. Goals related to CDF and unacceptable release are surrogates to societal risk level criteria. To fully validate these goals, calculations of environmental
18

consequences of release sequences would need to be made. In a few coun-tries, the performance of level 3 PSA:s is required, which includes this as-pect. Although the issue has been discussed, and a pilot analysis has been performed for one of the Ringhals plants, there are not yet plans to perform level 3 PSA:s in Finland and Sweden. However, the project identified a need to discuss and define more precisely the safety goals related to radioactive release, as this is understood differently in different organisations. Integration of deterministic and probabilistic criteria is still a problematic issue. These concepts seem difficult to integrate in practice and people often seem to be tuned to either the one or the other. Finding a correct balance between deterministic and probabilistic safety thinking has to do with the fundamental question of “how safe is safe enough?” and how to prove this safety level. The project recommended discussion of the relationships be-tween deterministic and probabilistic criteria and their interpretation. Fulfil-ment of defence-in-depth principle as well as criteria regarding redundancy, diversity and separation for various initiating event categories are examples of fundamental questions. The final underlying obstacle in the use of safety goals are the uncertainties of PSA. Differences in the scope of PSA and different methods used in dif-ferent parts of PSA makes it difficult to make consistent comparisons of risks. The only way to resolve the problem of uncertainties is to put empha-sis on justification of the results and conclusions. This implies explicit pres-entation of claims, arguments and the underlying evidence, in order to con-vince the reviewer of the conclusions that the plant is safe enough. This is the so called safety case approach. How this approach is carried out with a full-scope PSA in relation to safety goals is a huge systems engineering ex-ercise.
19

4. International overview
4.1 Probabilistic safety criteria for nuclear power plants
4.1.1 Background During the first project phase a limited international review was made of probabilistic safety criteria in use. During phases 2-4, a considerable exten-sion of this initial overview was made in parallel with a task performed within the OECD/NEA Working group RISK (WGRISK). The WGRISK task on probabilistic safety criteria was initiated in 2006 and finalised in 2009, and had as its objective to review the rationales for definition, the cur-rent status, and actual experiences regarding the use of probabilistic safety goals and other PSA related numerical risk criteria in the member states. The scope included the whole range of safety goals, i.e., societal risk, off-site release, core damage, and lower level goals. The focus was on experiences from actual use of the safety goals for existing installations, including proce-dures used, problems related to the technical application of the criteria, and consequences for the status and use of PSA. Both regulatory criteria and criteria defined and used by utilities were covered. A questionnaire was prepared and sent to the member countries. In total 19 responses have been received from 13 nuclear safety organizations (Canada, Belgium, Chinese Taipei, Finland, France, Hungary, Japan, Korea, Slovakia, Sweden, Switzerland, UK and USA) and 6 utilities (Hydro-Québec, Fortum, OKG, Ontario-Power-Generation, Ringhals and TVO). The responses were analysed and results were reported to OECD/NEA [NEA/CSNI/R(2009)16].
4.1.2 Status of probabilistic criteria There are considerable differences in the status of the numerical risk criteria that have been defined in different countries. Some have been defined in law or regulations and are mandatory, some have been defined by the regulatory authority (which is the case in the majority of countries where numerical risk criteria have been defined), some have been defined by an authoritative body and some have been defined by plant operators or designers. Hence there is a difference in the status of the numerical risk criteria which range from man-datory requirements that need to be addressed in law to informal criteria that have been proposed by plant operators or designers for guidance only. The following categories of statuses of the criteria can be seen:
20

A legally strict value to be fulfilled. Design must be changed, if the crite-rion is not met. In some countries probabilistic safety criteria are applied in this manner for new NPPs.
A strict value but not legally bounding. The value should not normally be exceeded. Some utilities define this kind of status for their NPPs.
Target value, orientation value, expectation, or safety indicator. If the tar-get is not met, design improvements should be considered taking into ac-count cost-benefit considerations or the ALARP1 principle. Targets denote a boundary that, if surpassed, will often lead to increased regulatory over-sight, but is used as one piece of information (out of several) in the regula-tory process (risk-informed not risk-based).
In most countries, probabilistic risk criteria are defined and applied as target values, orientation values or safety indicators. Strict criteria are applied for new NPPs in some countries, e.g., Finland, the Netherlands and Switzerland.
4.1.3 Comparison of criteria for new and operating plants In several countries, different criteria apply to existing plants and new plants, or the criteria have different status. For modernization and life extension, generally the same criteria are applied as for operating plants. The following categories of statuses can be seen:
Probabilistic risk criteria are the same for existing and future plants, e.g., Switzerland.
Probabilistic risk criteria are defined similarly for existing and future plants, but the numerical values for the frequencies are a factor (typically 10) lower for future plants, e.g., Canada, Czech Republic, Hungary, Korea, and Slovakia.
Probabilistic risk criteria involve the same numerical values for the fre-quencies, but are considered as limits for future plants and targets for exist-ing plants, e.g., Finland.
Probabilistic risk criteria are defined only for existing plants, since new plants are at the time not considered, e.g., Sweden.
No numerical risk criteria have been defined for new plants. However, there is a general requirement that the level of risk should be comparable to (or lower than) the risk from existing plants, e.g., Japan.
1 In the context of this report, the concepts ALARP and ALARA are considered to have the same meaning.
21

Band criteria (limit and objective) are explicitly used only by few organisa-tions, e.g. HSE in the UK. Band criteria have also been supported by PSA users in Nordic countries. The reasoning is that it can be useful to define several levels of criteria, and a limit and an objective have different usage. Objectives can be set at a more demanding level, e.g., to support design. However, strict limits may be easier to communicate with the public.
4.1.4 What probabilistic risk criteria exist? The questionnaire defined three levels of probabilistic risk criteria, as done by e.g. U.S.NRC:
at society level (such criteria are mainly qualitative),
at an intermediate level (such criteria can be quantitative and/or qualita-tive)
at a technical level (quantitative)
The separation between society level and intermediate level is not always clear. Of the 13 responding regulatory bodies, 8 have defined society level criteria. These criteria are generally set in the mandate of the regulatory body. One out of the six responding utilities has declared having a society level crite-rion. Of the 13 responding regulatory bodies, 8 have defined intermediate level criteria. One out of the six responding utilities has declared having an inter-mediate level criterion. The criteria generally indicate that “The risk from use of Nuclear Energy shall/should be low compared to other risks to which the public is normally exposed”. On the Technical level, a rather large number of different probabilistic risk criteria are indicated in the responses:
Core damage criteria
- Core Damage frequency
Release criteria
- Large Release frequency
- Small Release frequency
Health risk criteria
- Individual risk of fatalities
- Frequency of doses
22

- Societal risk
Containment criteria
- Containment Failure Frequency
- Conditional containment failure probability
Out of scope for the WG RISK task
- Systems reliability targets
- Instantaneous risk
4.1.5 Consideration of uncertainty The responses to the questionnaire show a large consensus, all respondents stating that the comparison with probabilistic safety criteria should use the “best estimate” of the PSA results. Several respondents note that setting the criteria with uncertainty would be equivalent to setting a goal at a different level, without any added value.
4.1.6 When and how do probabilistic risk criteria ap-ply? A main use of risk criteria for operating plants is when the study is updated:
For six respondents, the PSA supporting evaluation of the risk criteria shall be updated within the framework of the periodic safety review (generally 10 years).
One country (and its utilities) requires the PSA supporting evaluation of the risk criteria to be updated every 3 years, or after significant modifica-tions to the plant.
One country (and its utilities) requires the PSA supporting evaluation of the risk criteria to be kept up to date (on design modifications).
One utility updates the PSA every year and on plant modifications.
Four regulatory bodies and five licensees use the risk criteria to assess the impact on risk of design modifications in the plant. Four of them indicate they use the risk criteria for assessing the impact on risk (and the appropriate response) from incidents and/or on discovery of new information. The received response show considerable differences between the different countries regulatory regimes. As the risk criteria are generally considered as indicators or orientation values, no regulatory actions are expected on non-compliance with a probabilistic safety criterion.
23

Practically, there is a consensus on finding the reasons for the non-compliance and identification on the way to overcome it. However, when indicated, there is also a consensus for new builds, where not meeting the probabilistic risk criteria would prevent the regulatory body from granting an operating license.
4.1.7 Experience on implementation of probabilistic risk criteria The information obtained from the application of probabilistic risk criteria is often used for:
general safety improvements
plant modifications (including procedures)
system upgrades
decision making
temporary configurations
identification of functional dependencies
The general experience from the implementation of risk criteria is positive. Respondents who have implemented criteria have experienced various bene-fits. In a number of cases, design weaknesses or procedural weaknesses in NPPs have been identified using PSA and PSA criteria, resulting in the in-troduction of safety improvements. More than half of the respondents de-scribe how the implementation of risk criteria and safety goals have lead to plant modifications in order to meet the probabilistic risk criteria. One of the respondents also described how, using PSA, changes suggested on a deter-ministic basis have been avoided. Furthermore, the implementation of safety goals often emphasizes the need for more detailed and realistic PSA models, since conservative assumptions in the PSA often make the calculated risk unnecessarily high. It appears that the use of safety goals has increased the focus on the correctness and quality of PSA models. One problem that may be highlighted, is the scope of the PSAs, i.e., results from limited scope PSAs may be harder to assess and dif-ficult to compare to probabilistic safety criteria. Some respondents emphasize the importance of using PSA as an integrated part of the total safety analysis concept, i.e. as a complement to other rele-vant information such as deterministic analyses, human reliability analysis and operating experience.
24

Some respondents pointed out a general concern about using probabilistic risk criteria and defined safety goals as absolute limits, as this might indi-rectly have an impact on the quality and relevance of the PSA models. Ac-cording to these respondents, the defined goals should rather be used as trig-gers for identifying potential deficiencies, and as indicators showing that changes made have a positive effect. A number of the respondents express scepticism towards a strict application of quantified safety criteria, and the use of criteria does not appear to be prioritized within the over-all PSA activities of these respondents. When it comes to the interpretation of the criteria, several of the respondents agree that more work is needed in the definition of the various criteria. Thus, there seems to be a need for a common definition as to what constitutes se-vere core damage and large release. A strict and common definition would facilitate comparison of risks and results between different plants.
4.1.8 Experience on communication of probabilistic risk criteria Only few respondents report experiences from the communication to the public of probabilistic risk criteria and the responses varies widely between the respondents. Some respondents focus on the need for (and difficulty of) communicating very complex information, both regarding the analysis proc-ess and the definition of the risk criteria. In those cases where safety goals are met, some respondents have found the results useful when communicating the level of safety to the public. In case the PSA results exceed the safety goals, communication would be more complex. One experience is that public risk perception is more concerned with the consequence part of a criterion than with the frequency part, e.g., a “radioac-tive release” is perceived to be more easily understandable than a frequency of “10-7 per year.” Another concern is with the complexity of the risk as-sessment process itself, and the ability of the general public to interpret re-sults correctly. If the results of PSA and safety goals should be made easier to understand to the public, it is important that it can be clearly demonstrated that PSA results and safety goals have lead to safety improvements in plants. However, the format in which PSA results and risk or safety criteria are presented needs to be carefully considered, in order to minimize the risk for misinterpretation or misunderstanding. The U.S.NRC has developed guidelines for communicating risk information and risk decisions to the public. NUREG/BR-0308, “Effective Risk Com-
25

munication, The Nuclear Regulatory Commission's Guideline for External Risk Communication” contains a comparative analysis of NRC’s risk com-munication needs and state-of-the-art risk communication practices.
4.1.9 Core Damage Frequency criteria The criterion core damage frequency is used by most respondents. However, the definition of the criterion differs considerably with the reactors technol-ogy. For instance, for reactors of CANDU type, the core damage is defined as loss of structural integrity of more than one fuel channel. Some countries have very precise technical definitions of CDF, e.g. defining core damage as local fuel temperature above 1204 ºC, i.e., the limit defined in section 1b of 10 CFR 50.46 (Acceptance criteria for emergency core cool-ing systems for light-water nuclear power reactors). Other countries have more general definitions referring, for instance to prolonged core uncover or long-term cooling. The frequency limits regarding core damage vary between 10-4 and 10-6 per year. Requirements for new plants are typically stricter (in terms of frequency) than for existing ones, and are mandatory as opposed to indicative. For in-stance, in Switzerland and Finland it is required by regulation that the appli-cant for a permit to build a new nuclear power plant shall demonstrate that the core damage frequency is below 10-5 per year. Figure 3 summarises numerical criteria defined for core damage.
26

Figure 3 Numerical criteria defined for Core Damage.
4.1.10 Frequency of Releases Criterion In contrast to the relatively moderate differences in the CDF criteria, there is both a considerably larger variation in the frequency limits, and very differ-ent answers to the question of what constitutes an unacceptable release. As with the CDF, the magnitudes are sometimes based on IAEA safety goals suggested for existing plants, i.e., on the level of 10-5 per year (IAEA-INSAG-12). However, most countries seem to define much stricter limits, between 10-6 per year and 10-7 per year. The definition of what constitutes an unacceptable release differs a lot, and there are many parameters involved in the definition, the most important ones being the time, the amount and the composition of the release. Addi-tionally, other aspects may be of interest, such as the height above ground of the point of release. The underlying reason for the complexity of the release definition, is largely the fact that it constitutes the link between the PSA level 2 results and an indirect attempt to assess health effects from the re-lease. However, such consequence issues are basically addressed in PSA level 3, and can only be fully covered in such an analysis. The release for which a numerical criterion is given is also defined in several different ways:
27

Large release. This is defined either as absolute magnitude of activity and isotope released, e.g., 100 TBq of Cs-137 or as relative magnitude, e.g., 1 % of the core inventory of Cs-137 from an 1800 MWt BWR.
Large early release. These definitions are more qualitative, e.g., “Large off-site releases requiring short term off-site response,” “Significant, or large release of Cs -137, fission products before applying the offside pro-tective measures,” “Rapid, unmitigated large release of airborne fission products from the containment to the environment, resulting in the early death of more than 1 person or causing the severe social effect.”
Small release. CNSC from Canada has proposed a criterion both for large and small release. A small release is defined as a release of 1000 TBq of I-131.
Unacceptable consequence. This is a French definition which is fully open. It should be noted that the performance of level 2 PSA is not required in France by the safety authority.
Containment failure. The Japanese Nuclear Safety Commission proposes a criterion for containment failure frequency. The first version of the Guide YVL-2.8 also defined a probabilistic criterion for containment isolation failure (conditional failure probability). This is a requirement that aims at assuring the robustness of the defence in depth.
Figure 4 summarises numerical criteria defined for large release. As ex-plained above, the definitions for “large release” is not the same for all or-ganisations. However, it can be seen that objectives vary from 10-7/year to 10-5/year, which is a considerably larger spread than for core damage fre-quency, where objectives vary between 10-5/year and 10-4/year.
28

Figure 4 Numerical criteria defined for large release. Definition and timing of “large release” varies
4.2 Overview of probabilistic safety criteria related to other man-made risks in society In order to provide perspective on the project’s detailed treatment of prob-abilistic safety goals for nuclear power plants, some information from other areas is provided in this chapter. The aim is two-fold:
To provide a general overview of the basic rationale for defining safety goals in some countries (section 0)
To provide more detailed information about the safety goals within a two specific industries, railway and offshore oil and gas (sections 0 and 0).
The information will make it possible to relate safety goals for NPP:s to safety goals defined and applied for other industries.
4.2.1 International overview Many societal activities involve risks of fatal accidents. Therefore some sort of regulation is required to ascertain that the risks are not unfairly distrib-uted. Typically the probabilistic safety criteria used consider loss of life and economic damage as a consequence. Different probabilistic safety goals are categorised according to the consequences they consider [Jonkman_2003]
29

Fatalities
- individual risk
- societal risk
Economic damage
Environmental damage
Integrated safety goals
Potential damage
This section considers some country-specific safety goals mainly related to risks to which individuals or a specific group are exposed. The focus is on hazardous installations, such as installations of chemical industry. Another larger entity discussed is safety goals related to transportation. Also some other application areas are mentioned.
4.2.2 The Netherlands The Netherlands have an officially approved policy for safety goals which distinguishes between individual risk and societal risk. It also distinguishes between risks from existing and new activities [Bäckman_2002]. The level of unacceptable risk for an individual from existing activities or industries is chosen from the frequency of death from natural causes. This frequency is lowest for 14-year old girls and is 10-5 per year. The policy states that new industrial activities are not allowed if the total individual risk increases by more than 10 %. Thus, the level for unacceptable individual risk is 10-6 per year. The societal risk for existing activities is expressed in an FN-diagram2. The criterion for existing and new activities is 10-3/N2. The Rijnmond and Schiphol areas are excluded from the new criteria [Trbojevic_2005]. In Netherland the concept of negligible level of risk is no longer used. (Previ-ously for individual 10-8 and societal 10-5/N2 [Davidson_1997]). In addition to criteria for individual and societal fatalities, there exist safety goals for, e.g., injuries at the work place, noise pollution and odour nuisance [Beroggi_1997]. The Netherlands have also set safety goals for risks related to transportation of dangerous goods. The safety limit for individual risk is 10-6, which is the same as for stationary installations. The societal risk criteria for transporta-tion of dangerous goods are 10-2/N2 per year per kilometre of transport route [Ale_2002, Bottleberghs_2000]. Figure 5 illustrates the unacceptable societal risk limits for installations and transportation. Risk acceptance criteria have also been formulated specifi-
2 FN = Frequency/Number of fatalities
30

cally for rail safety. For passengers, individual risk shall be less than 1.5 fatalities per 1010 passenger kilometres. For employees the individual risk should be less than 1 fatality per 10 000 employees per year [Ter_Bekke_2006]. Thus far, the only safety limit in the area of air transportation is for individ-ual risks. In principle, the limit for the probability of death for air transporta-tion is also 10-6 per year. Installations with values up to 5·10-5 per year are permitted to continue operating, but they may not be replaced. Installations with larger risk values must cease operating. [Beroggi_1997]
Figure 5 Advisory societal risk limits in the Netherlands [Ale_2002]
4.2.3 United Kingdom The UK was possibly the first country to use probabilistic regulations. In 1939 England required 99,999 % reliability for 1 hour of flying time for commercial aircraft (10-5/h). This type of regulation required that the whole aircraft system is examined, along with the influence of its components to reliability [Rechard_1999]. The Health and Safety Executive (HSE) issues statement defining the risk levels it considers as intolerable or tolerable under certain circumstances. These risk levels cover all industrial activities in the UK. The primary in-strument for risk control is ALARP dynamics [Trbojevic_2005]. The level for unacceptable risk for workers is 10-3 per year. The corresponding level for the public is 10-4 per year. Risk above these levels is not accepted, i.e., the risk must be reduced or the activity must be stopped. The HSE also uses a limit for broadly acceptable risk, which is set to 10-6 per year. Between these limits the ALARP principle applies. HSE also defines risk levels for land use planning, and advises against granting planning permission for any significant development where individual risk of death for the hypothetical
31

person is above 10-5 per year, and does not advise against granting planning permission on safety grounds for developments where such an individual risk is less than 10-6 per year. [R2P2]. For societal risks the HSE suggests that the risk of an accident causing 50 deaths or more in an accident should be regarded as intolerable if the fre-quency is estimated to be more than one in 5000 years; the associated FN-curve has a slope of -1. The interval between the broadly acceptable region and the tolerable region is set to two orders of magnitude [HSE_2004].
4.2.4 Czech Republic In the Czech Republic, the Ministry of Environment enacts the principles for the evaluation of risk of major accidents. As in the Netherlands, the Czech Republic has different criteria for existing and new installations. For existing installations the individual risk criterion is 10-5 per year and the societal risk criterion is 10-3/N2. For new installations, the requirement is 10-6 per year and 10-4/N2, respectively [Trbojevic_2005].
4.2.5 Switzerland In addition to fatalities, the societal risk criteria established in Switzerland also cover number of people injured, damage to property, and contamination of surface water, groundwater, and soil. [Ter_Bekke_2006] The risk criteria selection depends on the risk dimensions of the material, the product or the waste under consideration. The importance of the conse-quences is assessed by determination of the separate risk indicators. Figure 6 shows the mapping of damage indicators into three classes. If a disaster value of 0,3 is reached or exceeded for any of the relevant damage indica-tors, the authority requires the owner to perform and submit a risk study. The criteria also apply to transportation routes used for the shipping of dangerous goods (railway lines, roads, and the river Rhine). [Gmünder]
Figure 6 Switzerland – scale of damage indicators (assignment of dis-aster values)
32

4.2.6 Germany In Germany deterministic approaches for risk assessment are extensively used in hazardous plants [Kirchsteiger_1999]. Quantitative methods have not proved suitable or have been unable to establish themselves in the industry. It seems that in Germany two types of criteria are in use [Trbojevic_2004]. Based on the LUP (Land Use Planning) criterion, no risk should be imposed to man or the environment outside the installation. The concept of Minimum Endogenous Mortality (MEM) requires that the total risk from all technical systems affecting an individual must not exceed minimum human mortality (2·10-4 deaths per person per year). Based on the MEM principle the follow-ing rule is applied to transportation; “Hazards due to a new system of trans-port must not significantly augment the Endogenous Mortality Rate”. In practice this translates into the following criteria:
Fatality rate < 10-5 per person-year
Serious injury rate < 10-4 per person-year
Light injury rate < 10-3 per person-year
4.2.7 Denmark In Denmark no guidance is available on how safety distances should be de-termined using the available qualitative risk analysis methods, nor is a method to assess environmental damage available (Duijm_2009). An earlier Danish study “Environment Project 112” recommended the following crite-ria for the technical assessment of a plant:
A location-based (individual) risk of death for the most at-risk neighbour of 10-6 per year.
Societal risk formulated as F/N2, starting at a risk of death of 10-4 per year for an accident involving one fatality. Where societal risk falls within the shaded grey region above the minimum curve, the risk should be “As Low As Reasonably Achievable” (ALARA).
These criteria should be supplemented with a requirement that risks be reduced as far as reasonably possible (the ALARA principle), and that consideration be given to serious or permanent damage, and damage with delayed onset.
4.2.8 Some other criteria Some other safety goals used for various technologies: (adopted from [Kafka_1999] and [Pfitzer_2004])
Marine structures: Failure probability for different accident classes 10-6–10-3
Aviation, air planes: Catastrophic failure per flight hour, less than 10-9
33

Space vehicles: Catastrophic consequence for Crew Transfer Vehicle (CTV) less than 1 in 500 CTV missions.
Missile range criteria for falling debris: For example, max. acceptable probability for individual fatality (general public) during one mission 10-7 and during one year 10-6.
The concept of Safety Integrity Levels (SIL) is introduced in the increasingly important standard IEC 61508, which deals with the functional safety of electrical, electronic and programmable electronic safety-related systems [IEC_61508]. The standard applies quantitative requirements to systems operating on demand and to system operating continuously in order to main-tain a safe state. Table 1 illustrates the relationship between the SIL number and the required failure probabilities. Table 1. Comparison of criteria of individual risk
SIL Demand Mode of Operation (average probability to perform
design function on demand)
Continuous Mode of Operation (probability of dangerous failure
per hour) 1 12 1010 −− <≥ to
56 1010 −− <≥ to 2 23 1010 −− <≥ to
67 1010 −− <≥ to 3 34 1010 −− <≥ to
78 1010 −− <≥ to 4 45 1010 −− <≥ to
89 1010 −− <≥ to
4.2.9 Summary of national criteria The national criteria for individual and societal (group) risk previously dis-cussed and a few more are summarised in Table 1 and Table 2 below.
34

Table 2. Comparison of criteria for societal risk Country Application Maximum
tolerable risk
Negligible level of risk
Comment
Established plants or combined plants
10-5 Not applied ALARP principle applies
The Nether-lands
New plants 10-6 Not applied ALARP principle applies
Existing haz-ardous indus-tries
10-4 Broadly accepted limit 10-6 Negligible limit 10-7
ALARP principle applies
Existing dan-gerous goods transportation
10-4 10-6
UK
New housing areas near existing plants
10-5 10-6
Existing in-stallations
10-5 Risk reduc-tion must be carried out
Czech Re-public
New installa-tions
10-6
Hungary Hazardous facilities
10-5 Upper limit
3·10-6-10-6
Lower limit
New plants 10-5 Not used Hong Kong New plants and housing
10-5 Not used Australia (New South Wales)
Existing in-stallations
10-5 Acceptable limit 10-7
Australia (Victoria)
New plants 10-5 10-6 USA, Cali-fornia
Transportation 10-5 Germany Denmark Proposal for
hazardous installations
10-4 10-6 ALARA
35
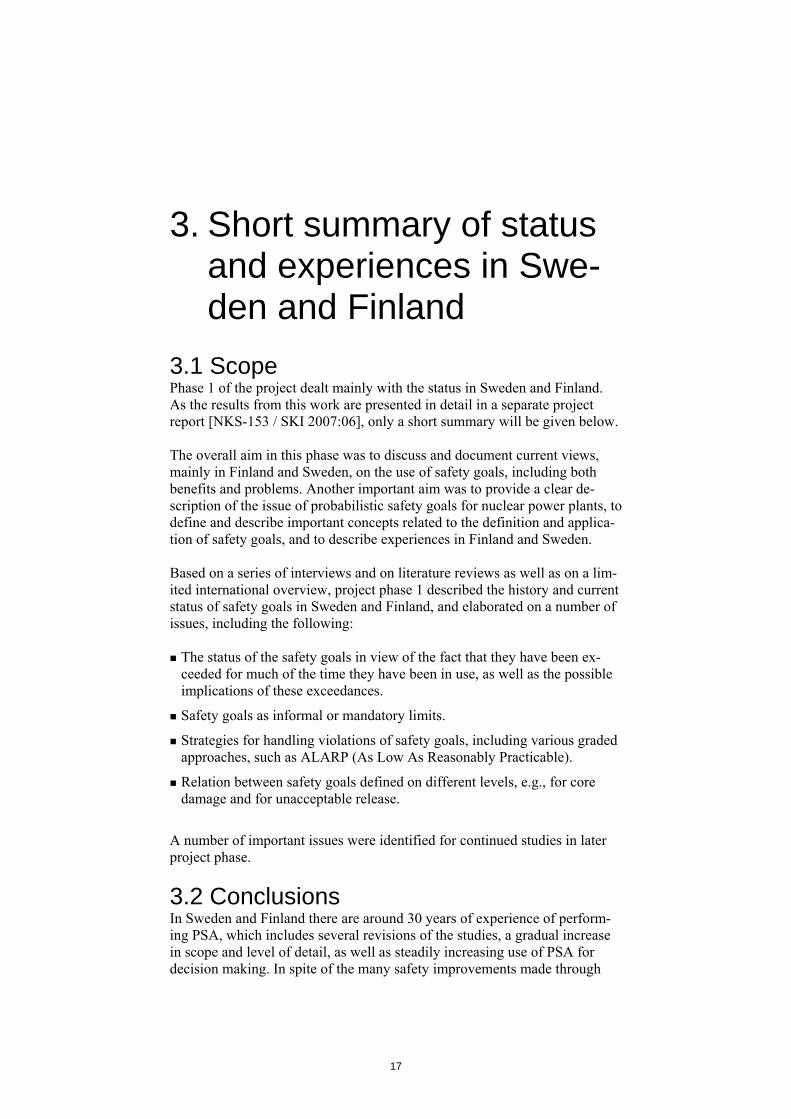
Table 3. Comparison of criteria of individual risk
Application Maximum tol-erable risk
Negligible level of risk
Comment Country
The Neth-erlands
Established and new plants
10-3/N2 Not applied
Hazardous installations
10-2/N UK
Existing harbours
10-1/N 10-4/N
Hong Kong Hazardous installations
10-3/N 10-5/N
Limit for maximum N=1000
On-site risk 10-1/N2 10-3/N2 USA, Cali-fornia Off-site risk 10-3/N2 10-5/N2 Australia (Victoria)
Hazardous industries
10-2/N2 10-4/N2
Switzerland 10-5/N2
(for N>10) 10-7/N2 (for N>10)
Limit for maximum N=1000. N<10 domain of no serious damage
Hazardous installations
Denmark Proposal for hazardous installations
10-2/N2 10-4/N2
4.3 Safety goals in the European off-shore oil and gas industry
4.3.1 Introduction In the Oil and Gas industry, risk acceptance criteria (RAC) are used to ex-press a risk level with respect to a defined period of time or a phase of the activity. RAC may be qualitative or quantitative. RAC are also known vari-ously in the Oil and Gas industry as “risk criteria”, “decision criteria”, “screening criteria”, “tolerability criteria”, etc. A survey has been made of the regulatory and industry requirements in the Oil and Gas industry for defining Risk Acceptance Criteria [He_2007]. The
36

focus has been on Norwegian and UK offshore oil industry, where quantita-tive RAC are mostly used.
4.3.2 Risk acceptance criteria in the Norwegian oil and gas industry Norwegian Petroleum Directorate (NPD) requirements NPD’s requirements regarding acceptance criteria and their use are presented explicitly in the regulations. Section 6 “Acceptance criteria for major acci-dent risk and environmental risk” of the NPD’s management regulations [NPD_Manreg_2002], requires that the operator shall set acceptance criteria for major accident risk and environmental risk. RAC shall be set for personal risk to workers and to third party, loss of main safety functions, and pollu-tion from the facility. NORSOK requirements NORSOK standard3 , Z-013 [NORSOK-Z-013], presents some general re-quirements regarding the formulation of RAC. It is noted that the NORSOK standard does not provide any guidelines on what actual values to choose for RAC. This is principally in line with the requirements stipulated by the Norwegian authority, i.e. NPD, which require that the operators should for-mulate their own risk acceptance criteria. In order for the RAC to be adequate as support for Health, Environment and Safety (HES) management decisions, Standard Z-013 also requires that the used RAC should represent a compromise where the following qualities are satisfied as far as possible:
Be suitable for decisions regarding risk reducing measures.
Be suitable for communication.
Be unambiguous in their formulation (such that they do not require exten-sive interpretation or adaptation for a specific application).
Not favour any particular concept solution explicitly nor implicitly through the way in which risk is expressed.
Risk acceptance criteria examples The following are some examples of risk criteria that have been used by operators on the Norwegian continental shelf. Individual Risk Criteria for Workers
3 The NORSOK standards are developed by the Norwegian petroleum industry as a part of the NORSOK initiative and are issued jointly by OLF (the Norwegian Oil Industry Association) and TBL (Federation of Norwegian Engineering Industries). The NORSOK standards are administered by NTS (Norwegian Technol-ogy Standards Institution).
37

The average individual risk, expressed by the fatal accident rate (FAR)4 must meet the criterion FAR < 10.
For specially exposed groups, the average group individual risk, expressed by the fatal accident rate (FAR) must meet the criterion FAR < 25.
Individual Risk Criteria for 3rd Party The fatality risk for the most exposed person shall not exceed 1·10-5 per year (limit). An ALARP objective is defined at 1·10-7 per year. Group Risk Criteria for 3rd Party The criterion for 3rd party societal risk is:
,10)(2
NNF
−
= (1)
where F(N) is the accumulated frequency for N or more fatalities. The ALARP objective is defined as:
.10)(4
NNF
−
= (2)
This is illustrated graphically in Figure 7.
4 FAR = Fatal Accident Rate; number of fatalities during 100 million exposure hours, i.e., FAR = 10 corre-sponds to a frequency of 10-9/hour.
38

3rd Party Societal Risk
1.00E-09
1.00E-08
1.00E-07
1.00E-06
1.00E-05
1.00E-04
1.00E-03
1.00E-02
1 10 100 1000 10000
Number of Fatalities (N)
Acc
umul
ated
Fre
quen
cy (p
er y
ear)
UnacceptableALARP
Figure 7 Risk Acceptance Criteria for 3rd party Societal Risk – Example from Oil and Gas operations on the Norwegian continental shelf. Loss of Main Safety Functions: Example For an offshore drilling rig, it is required that the frequency of loss of de-fined main safety functions on the rig shall be lower than 1·10-4 per year per safety function and per accident category. Accident categories to be consid-ered and the defined main safety functions are presented in Table 4. Table 4. Accident categories and main safety functions for an offshore drilling rig Accident categories Main safety functions
- Hydrocarbon leak, fire and ex-plosion
- Blow-out - Helicopter crash on installation - Collisions - Falling loads - Occupational (work) accidents - Loss buoyancy or stability - Other accidental events (AEs)
- Escape routes from areas outside the area of the initial event
- Evacuation means (lifeboats) - Safe haven/Living Quarter (LQ) - Prevention of spreading - Main load bearing structure and
stability - Fire water system - Central Control Room
4.3.3 Risk acceptance criteria in UK regulations UK Health and Safety Executive requirements
39

The risk acceptance criteria used by the UK petroleum industry are mainly those that have been formulated by the UK Health and Safety Executive (HSE) and are embodied in statutory legislation. The Offshore Installations (Safety Case) Regulations 2005 (SCR05), [HSE_SCR_3117], requires the duty holder (i.e. the owner or operator) for each fixed and mobile installation to prepare a safety case, which must be accepted by the HSE before the in-stallation can be operated on the UK continental shelf. It requires, among other matters, a demonstration that:
All hazards with the potential to cause a major accident have been identi-fied;
All major accident risks have been evaluated; and,
Measures have been taken, or will be taken, to control the major accident risks to ensure compliance with the relevant statutory provisions (i.e. a compliance demonstration).
The ALARP (As low as Reasonably Practicable) principle is the basis of the UK Safety Case Regulations , and requires “every employer to adopt safety measures unless the cost is grossly disproportionate to the risk reduction”. Individual Risk Criteria HSE’s risk criteria for individual risk criteria are [HSE_R2P2]:
Maximum tolerable risk for workers : 1·10-3 per person-year
Maximum tolerable risk for the public : 1·10-4 per person-year
Broadly acceptable risk: 1·10-6 per person-year
It is noted that the above criteria are not official HSE criteria for offshore installations. In the assessment principles for offshore safety cases [HSE_APOSC], HSE also states that:
An individual risk of death of 10-3 per year has typically been used within the offshore industry as the maximum tolerable risk.
Temporary Refuge Impairment Criteria Although there is no specific requirement to estimate group risk, SCR05 indicates a need for a safety case to demonstrate temporary refuge integrity (TRI) – this could be considered as a measure of society risk. The assessment principles for offshore safety cases [HSE_APOSC] requires that criteria should exist that describe the TRI and the time over which TRI needs to be maintained against all hazards identified in the risk assessment. The safety case should demonstrate that these criteria are met i.e. that TRI would be maintained for the necessary time.
40

The typical TRI criterion proposed by HSE [HSE_SCReq_2/2006], is repre-sented as a frequency per year, with an upper bound of no higher than 10-3. In other words no more than once in every 1000 years would there be an event that would prevent the TR from functioning as described in the safety case. The ALARP principle should be applied below the upper level, i.e. loss of TRI frequency should be reduced to a lower level wherever reasonably practicable.
4.3.4 Discussions Risk acceptance criteria have been used in the Oil & Gas industry especially in offshore risk analysis for many years. A common thinking has been that risk analyses and assessments cannot be conducted in a meaningful way without the use of such criteria. The strengths of RAC as a decision support tool are:
They make interpretation of the results of a risk assessment explicit and traceable.
They are widely used and discussed in different fields.
In Oil & Gas industry there had been some discussions about the suitability of risk acceptance criteria to assess and control risks [Aven_RESS_90(2005)], such as: the introduction of pre-determined criteria may give the wrong focus—meeting these criteria rather than obtaining overall good and cost-effective solutions and measures. Another issue about RAC is the influence of uncertainty. The results of risk assessments will always be associated with some uncertainties, which may be linked to the relevance of the data basis, the models used in the estima-tion, the assumptions, simplifications or expert judgements that are made. This uncertainty will be reduced as the development work progresses. NOR-SOK Z-013 Standard states that the comparison to RAC should usually be made in relation to ‘best estimate’ from the risk analysis rather than to an optimistic or pessimistic result of the studies. In general in the Oil & Gas industry, the use of criteria is widely required and recommended in order to obtain meaningful results and implementation of relevant measures. Experience is viewed as a key factor in this respect both for the personnel performing the study and for the people reviewing the results.
4.3.5 Conclusions The following are some general conclusions regarding safety goals in the offshore oil and gas industry:
41

Compared to the nuclear industry, both the number of precursor events requiring handling and of accidents requiring mitigation is higher, result-ing in a relatively high focus in the criteria on consequence mitigation.
The criteria have a large scope, i.e. they apply to a wide range of accident events and consider a wide range of safety functions.
The ALARP principle is often applied, involving a safety goal with a limit and an objective.
Defence in depth aspects are considered in the criteria by stating require-ments for different safety functions.
Criteria are regarded as necessary, but a number of problems are acknowl-edged.
4.4 Safety goals in the European railway industry
4.4.1 Introduction An overview has been made of the background and status of safety goals in the European railway industry [Persson_2007]. A railway system can be defined very widely. In this section the system looked upon is the European Train Control System (ETCS), as explained and defined below. Figure 8 shows the main parts of the ETCS system. ETCS is the control-command system and GSM-R is the radio system for voice and data communication. Together, they form The European Rail Traf-fic Management System (ERTMS). ERTMS/ETCS is a standardized system that allows trains to cross national borders without the need to change loco-motive or driver. The system forms the cornerstone of a common system for train control and traffic management within Europe. It has been developed by Europe's railway and signalling industries (UNISIG) in response to the need for cross-border traffic identified in an EU initiative.
42

Figure 8 Main parts of the ETCS system.
4.4.2 General There are a number of recognized principles for managing risks and achieve target values for tolerable risks of accidents with injuries or casualties within the railway industry. The principles are somewhat geographically oriented, i.e. different countries have recognized different principles. MEM is mainly practiced in Germany, GAMAB/GAME in France and ALARP in the UK. The general descriptions below are based on the railway RAMS standard [IEC 62278]. MEM – Minimum Endogenous Mortality The main point of the MEM principle is the endogenous mortality caused by natural reasons e.g. illness or natural defects. This value naturally depends on the age of the considered person and on living conditions. In well-developed countries the mortality is at its lowest for the age group 5 years to 15 years resulting in a MEM of:
yearpersondeath102 4
total,m ⋅⋅= −R (3)
The MEM principle argues that a human life is exposed to 20 technical sys-tems at the same time, and that a technical system appears acceptable for a society when its contribution is less or equal to 5 % of the total risk. Rail-ways are one of these technical systems, so the acceptable risk for railway
43
systems would become 1·10-5 yearperson
death⋅
which translates to 1,14·10-9
hourpersondeath
⋅.
ALARP – As Low As Reasonable Practicable In [IEC 62278] no quantitative targets are presented for the ALARP princi-ple but in draft documents [UNISIG_Class1] for the UNISIG work one can see that the ALARP principle defines target values (objective) around the
level of 1.1·10-9 hourperson
death⋅
as an upper limit, which is similar to the
frequency defined with the MEM principle. GAMAB/GAME – Globalement Au Moins Aussi Bon/Globalement Au Moins Equivalent The GAMAB/GAME principle is based on comparison with existing sys-tems. The complete formulation of this principle is as follows:
"All new guided transport systems must offer a level of risk globally at least as good as the one offered by any equivalent existing system".
This formulation takes into account what has been previously done and re-quires implicitly a progress to be made in the projected system, by the re-quirement "at least". It does not consider a particular risk, by the requirement "globally". The transport system supplier is free to allocate between the dif-ferent risks inherent to the system and to apply the relevant approach, i.e. qualitative or quantitative.
4.4.3 Background to risk acceptance criteria With the introduction of the CENELEC railway standards and the ERTMS/ETCS system, a probabilistic approach was taken to safety analyses within the field of railway safety as it is depicted by those standards and specifications. This makes the approach for safety analyses within railway technology in line with other technology areas such as aviation and nuclear power generation. Previous attempts for the definition of these safety targets were questioned by different national railways and authorities. In consequence, a decision was taken within the ERTMS Safety Requirements and Objectives Group (ESROG) to request safety experts from the German and French national rail operators DB AG and SNCF to set up an § study to define the safety targets, represented by a rate for hazards which can be tolerated by railways and national authorities.
44

The general approach taken to reach these targets were the GAMAB/GAME principle, and by that taking into account the performance of existing rail-way systems and the operating experience and accident statistics. The hazardous events considered by SNCF and DB were derailment and collision with other railway vehicle. These efforts resulted in the following definitions for safety targets:
TIRF = tolerable individual risk of a individual person to suffer an accident with fatal consequences while travelling in a train
and restricted to ETCS
TIRFETCS = tolerable individual risk of an individual person to suffer an accident with fatal consequences while travelling in a train due to a hazardous condition of ETCS
The calculations also considered the contribution of the ETCS system to the overall risk. It was concluded that 2.5 % of the total risk could be related to the ETCS system. Several reports by DB AG and SNCF were worked on and evaluated by an Independent Assessment Committee. The result of the assessment showed that there were quite large differences between the results of the work per-formed by DB AG and SNCF. These differences were analysed by the Inde-pendent Assessment Committee and a number of differences in the approach taken for the calculations were identified. At an ESROG meeting it was agreed that a value of 2·10-9 Hazards/hour would be acceptable to both SNCF and DB. This is more conservative than the value calculated by DB, but it corresponds well to the SIL-4 requirement in the CENELEC standards. This is likely the background for the value now established in the TSI for Control-Command and signalling and as such the safety target for all suppliers. It can be noted that the figure was arrived at by negotiation rather than by adherence to criteria such as GAMAB/GAME, although the underlying calculations were made according to that principle.
4.4.4 Hazard definition During the work with specifying the ETCS, the approach was taken of first trying to quantify the risk of individual fatalities during a train ride. The definition used for that work was the TIRF value as defined in the previous section. Today, suppliers of ETCS equipment do not use TIRF but instead the term Tolerable Hazard Rate (THR), where THR represents the acceptance of risk,
45

i.e. the tolerable rate of hazardous failures. To calculate a relevant THR from the TIRF, additional parameters must be added, e.g. number of passengers on a train, speed, traffic density etc. When going from TIRF to THR the definition is transferred to be more at-tached to the technical solution and related to the risk level for a specific function. It has been agreed within UNISIG for ETCS systems that the undesirable event (UE) or Hazard is defined as:
Exceedance of safe speed / distance limits as advised to ETCS According to the previous discussions it follows that the quantitative target for the top hazard (UE) is set to 2.0·10-9/ hour / train. This safety target is defined in the TSI for Control-Command and signalling, [2006/860/EC] and is as such a legal requirement.
4.4.5 Responsibilities The responsibility for establishing safety targets for railway systems is de-scribed in [EN_50129] and is divided between each railway authority (such as Banverket, DB, SNCF, etc) and each supplier (Bombardier, Ansaldo, Siemens, etc.). The principle is that a THR is allocated by the railway au-thority to the supplier for a specific defined hazard. Each hazard and THR is then by the supplier apportioned within their system to each relevant subsys-tem. This means that the overall risk analysis is mainly the responsibility of the railway authority, and that the supplier is responsible for hazard control and to verify their results against the safety target or THR set by the railway authority. The division of responsibilities is illustrated in Figure 9. The verification against the THRETCS is done by the manufacturer of the sys-tem at different levels. Usually it is analysed using fault tree analysis. There is a conceptual fault tree specified by UNISIG in [ETCS_subset-088] that qualitatively analyses the top hazard. The fault tree will be adapted to the specific system being analysed and to the mode of operation. The verifica-tion of the safety target will be by comparing the result of the FTA to the THR. If satisfactory results are not achieved, then a re-design would be con-sidered. Verification of safety target is also re-evaluated in case of upgrades and redesign.
46

Figure 9 Risk analysis responsibilities from EN 50129.
4.4.6 CSM and CST - Emerging common safety meth-ods and common safety targets within the EU To facilitate this cross-acceptance of railway systems/sub-systems between Member States, the methods used for the identification and the management of system hazards and risks have been harmonised inside all the organisa-tions involved in the development and the operation of the railway systems within the European Union. Therefore, in order to promote and improve the compatibility and competitiveness of railways in the Member States, the European Union set up the European Railway Agency (ERA), with defined tasks for interoperability and safety. The Railway Safety Directive [2004/49/EC] establishes a framework for railway safety, but leaves certain measures to be gradually developed. ERA will be the driving force to develop these measures. Common Safety Targets (CST) are presented as the safety levels that must at least be achieved by different parts of the railway system in relation to different groups of indi-viduals that are using the railways or being exposed to risks arising from railway traffic indirectly. The Common Safety Targets must ensure that the safety performance are not decreased in any of the Member States, meaning
47

that both the national performances needs to be considered, through the use of National Reference Values (NRV), as well as that of the EU as a whole through the CST. The Safety Assessment team within the ERA has made recommendation on the methodology (CSM) to calculate and assess the achievement of the NRV and CST, which has then been turned into an EC decision by the Commis-sion. The CSM was used by the ERA for a first time in 2009 in order to cal-culate the CST and NRV [ERA_2009], and will now be assessed annually and reported the results to the Commission. The first set of CST:s is pre-sented in Table 5, expressed in terms of Fatalities and Weighted Injuries (FWSI). NRV values are presented for the same risk categories, and differ largely between the member states. As an example, the NRV value for passenger risk (corresponding to CST 1.2) varies by almost by a factor of 100 between 5·10-9 and 2.5·10-7. Table 5. First set of common safety targets (CST) applicable to rail traf-fic within the EU. Risk Category CST Value (x10-6) Measurement units
CST 1.1
0,25 Number of passenger FWSIs per year arising from significant accidents / Number of passenger train-km per year
Risk to passen-gers
CST 1.2
0,00201 Number of passenger FWSIs per year arising from significant accidents / Number of passen-ger-km per year
Risk to employ-ees
CST 2 0,0779 Number of employee FWSIs per year arising from significant accidents / Number of train-km per year
CST 3.1
0,743 Number of level-crossing user FWSIs per year arising from significant accidents / Number of train-km per year
Risk to level crossing users
CST 3.2
n.a. (*) Number of level-crossing user FWSIs per year arising from significant accidents / [(Number of train-km per year - Number of level cross-ings)/track-km]
Risk to others CST 4 0,0185 Yearly number of FWSIs to persons belonging to the category others arising from significant acci-dents / Number of train-km per year
48

Risk Category CST Value (x10-6) Measurement units
Risk to unau-thorised persons on railway premises
CST 5 2,03 Number of FWSIs to unauthorised persons on railway premises per year arising from significant accidents / Number of train-km per year
Risk to the whole society
CST6 2,51 Total number of FWSIs per year arising from significant accidents / Number of train-km per year
4.4.7 Conclusions The following are some general conclusions regarding safety goals for Euro-pean rail systems:
A standardisation of safety goals has been prompted by the expressed aim of making it possible for trains and personnel to cross national borders.
Safety goals proposed by an industry working group, and accepted by au-thorities.
Consensus requirements based on an amalgamation of national practices, mainly from Germany and France.
Systematic procedure in place for creating subsidiary goals, this is done by defining a tolerable hazard rate (THR) for each subsystem forming part of the overall system.
Basic principles are based on comparison to general health risk (MEM principle) and a requirement for continuous improvement of safety (GA-MAB).
A framework for cross-acceptance has been developed, i.e., development of an agreed common approach for demonstrating the safety levels of the rail-way system through common safety methods (CSM). To achieve this, the methods used for the identification and the management of system hazards and risks have been harmonised.
49

5. Consistency in the usage of probabilistic safety cri-teria
5.1 Background An important issue when dealing with safety criteria is the problem of con-sistency of judgement in a situation when safety goals are applied to Prob-abilistic Safety Assessment (PSA) results which change over time, or which are made up of contributors with major differences in uncertainties. In an ideal situation, the PSA results for a nuclear power plant, e.g., ex-pressed as the core damage frequency (CDF), would exactly mirror the ac-tual safety level of the plant. If the safety is improved, the CDF would de-crease, and if the plant safety deteriorates, the CDF increases. In such a situation, the comparison to a safety goal would also be rather uncompli-cated. In practice, it has turned out that there are a lot of challenges involved when attempting to define and make practical use of probabilistic safety criteria. Thus, in many cases changes in PSA results over time are due to scope ex-tensions or increases of level of detail, which will lead to an increase of the frequency of the calculated risk measures (CDF or off-site release). Changes in success criteria, in plant specific data, and in analysis methods will also cause changes over time. This gradual extension and development of plant PSA models may lead to situations where safety goals are violated. The im-plications of such violations have been under discussion. The problem of consistency in judgement when applying safety goals can appear in two shapes:
Consistency over time This is a situation where the same set of safety goals is applied to a spe-cific plant at different points in time, and where the plant PSA has changed over time.
Consistency between plants This is a situation where the same set of safety goals is applied to different plants. The problem is general, but becomes especially apparent for reac-tors of similar design.
Consistency in judgement over time has been perceived to be one of the main problems in the usage of safety goals by some Swedish utilities. Safety
50

goals defined in the 80ies were met in the beginning with PSA:s performed to the standards of that time, i.e., by PSA:s that were quite limited in scope and level of detail compared to today’s state of the art. The gradual exten-sion of the PSA and the inclusion of new initiating event (IE) categories and operating modes has lead to a situation where safety goals are frequently violated. [SKI_2007:06]
5.2 Scope The quantitative results of a PSA may vary due to various causes. Important examples of changes that may lead to changes in the numerical results of the PSA over time are:
Implemented plant changes, i.e., actual changes in the plant
Changes in success criteria for safety systems due to the performance of refined calculations
- May also be due to reduced/increased margins after implemented plant changes
Changes in input data
- Initiating event frequencies
- Component reliability data, e.g., implementation of a new version of the T-book
- Common cause failure (CCF) data
- Human reliability (HRA) data
Changes in quantification parameters, e.g., different use of minimum cut-set cut-off value
Changes in the PSA methodology
- PSA scope, fault tree structures etc.
In order to investigate this issue more in detail, a comparative review of three generations of the same PSA is performed. The PSA for Forsmark 1 is selected, i.e., a BWR of ASEA-Atom design commissioned in 1980. The PSA versions chosen are from the years 1994, 2000 and 2006 (hereafter designated PSA-1994, PSA-2000 and PSA-2006). Over this period of time, the PSA has increased considerably in scope and level of detail. For this reason, the comparison is restricted to a scope (in terms of initiating events) corresponding to PSA-1994. This chapter includes a summary of how the quantitative results of the PSA for Forsmark 1 varies over time as well as an analysis of the reasons for the variation. The full report is presented in [Bengtsson_2010].
51

To be able to compare the generations of the PSA, this report will cover the scope that was included in PSA-1994 , i.e., a full power PSA level 1 cover-ing internal events. Area events and external events are therefore not in-cluded. Note that loss of offsite power is included in the initiating event category CCI (common cause initiators) and is therefore included. Figure 10 gives an impression of the development of the PSA over these years by presenting the total number of initiating events, fault trees and basic events in the PSA versions.
13 43 134
502
2093
3062
968
3559
4520
0
500
1000
1500
2000
2500
3000
3500
4000
4500
5000
1994 2000 2006
Initiating events
Fault trees
Basic events
Figure 10 Scope of the Forsmark 1 PSA versions 1994, 2000 and 2006.
5.3 Comparison of the quantitative PSA results The CDF for internal events according to the PSA models for the three gen-eration of the PSA are presented in Table 6. The table presents the results for different event group categories as well as the total CDF for level 1, internal events. Cells with values above 10-6/year are shaded. The CDF for the limited scope included in this analysis is below the safety goal of 10-5/year5 in PSA-1994 and PSA-2006, but the safety goal is violated in the PSA-2000.
5 The safety goal applies to a full scope PSA.
52

Table 6. CDF [1/year] presented in the PSA-models. Cells with values above 10-6/year are shaded. Event group PSA-
1994 PSA-2000 PSA-
2006 Transients TF Loss of feed water 2,5E-06 1,3E-05 8,6E-07 TT Loss of main heat sink 8,1E-07 6,9E-07 7,3E-07 TS Other scrams 1,3E-06 7,7E-07 6,9E-07 LOCA:s A Large pipe break (LOCA) 5,4E-08 1,0E-07 1,5E-07 S1 Medium large pipe break (LOCA) 2,0E-07 1,1E-07 1,0E-07 S2 Small pipe break (LOCA) 1,7E-07 7,0E-07 9,2E-08 Y-LOCA External pipe break 1,1E-06 3,7E-08 1,1E-08 I Interfacing LOCA - - 1,3E-09 CCI:s CCI Common cause initiators - 2,4E-06 4,7E-07 TE Loss of offsite power 2,1E-06 6,5E-06 4,7E-06 Total 8,2E-06 2,4E-05 7,8E-06
5.4 Analysis of Model Changes 5.4.1 Plant Changes All plant changes in Forsmark 1 during the period from 1994 to 2006 have been identified and analysed. This means that a total of 223 plant changes have been evaluated. The analysis includes judging which plant changes that impact PSA results and which year they were implemented in the PSA model. Some plant changes implemented in PSA-2000 have a considerable influ-ence on the CDF:
Installation of diversified safety and relief valves (system 314). The CDF would increase by a factor of 1,7 if the diversified 314 system was un-available.
Removal of stop on higher water level H2 for the emergency core cooling system pumps (323). If system 323 is modelled with the previous on-off control, the CDF increases by a factor of 1,08.
The numerical influence on the CDF from different implemented plant changes can only be added if they are independent. Assuming there are no
53

dependencies between the plant changes, the total CDF would increase by a factor of 1,78 if the plant changes had not been implemented. Most plant changes implemented in PSA-2006 have very limited influence on the total CDF. There is however one plant change of high importance for the PSA results for external events: automatic stop of ventilation system 742 at low temperatures is introduced to avoid freezing in measurement pipes in case of loss of room heating during wintertime. If no action to avoid freezing is performed, the CDF increases to around 10-3 per year (based on conserva-tive assumptions). External events are outside the scope of this analysis which means that the influence of this plant change cannot be seen in this report. Some plant changes have been implemented due to the discovery of a previ-ous erroneous function, meaning previous PSA:s have included an optimistic modelling. For these plant changes, no change in the PSA was made since the components were assumed to function both before and after the plant change. Plant changes of this type are listed below. In this analysis, the im-pact of this type of plant change is studied by back-tracking, i.e., by chang-ing previous generations of the PSA to include the erroneous function.
Cooling of level measurement pipes connected to the reactor tank was installed in 1997. Before the installation, there was a risk of large meas-urement errors after large or medium LOCA due to boiling in the meas-urement pipes.
- Backtracking shows that the installation of cooling of level measurement pipes has a large impact on the results. The CDF in PSA-1994 increases to 4,1·10-4 per year if the level measurement is assumed to fail at large and medium LOCA. Note that the assumption that all large and medium LOCA:s lead to core damage if the cooling of level measurement fails is conservative.
In 2002, valves V3 and V4 in system 321 (residual heat removal system) were changed from pneumatic to self pressure operated valves. The valves were previously not able to close fully; the closure rate was 80-85%. This plant change was not implemented in the PSA since it is previously as-sumed (erroneously) that the valves are able to close fully.
- When backtracking is performed in PSA-2000, with the assumption that valves V3 and V4 in system 321 always fail to close, the CDF increases to approximately 3·10-6 per year, i.e. an increase by 32%.
Backtracking of plant changes due to erroneous functions shows that plant changes with small influence on the (unchanged previous) PSA may have a major influence on plant safety. An example of this is shown in
54

Figure 11. Note that the calculations are based on several conservative as-sumptions.
Figure 11 Backtracking of two specific plant changes.
5.4.2 Success Criteria Changes in the success criteria between PSA-1994 and PSA-2000 as well as between PSA-2000 and PSA-2006 have been studied with backtracking, i.e., new success criteria are implemented in an older PSA model and the impact on the results are studied. The results of backtracking changes in success criteria between PSA-2000 and PSA-1994 are shown in Figure 12. The results of backtracking changes in the success criteria be-tween PSA-2006 and PSA-2000 are shown in Figure 13. Figure 14 presents the CDF for PSA-1994, PSA-2000 and PSA-2006 modi-fied to correspond to the success criteria used for PSA-2006. As shown in the figure, the CDF from the PSA-1994 is considerably higher if the success criteria from PSA-2006 are used. This is mainly due to more strict success criteria regarding failures of the control rods. Stricter success criteria for the control rods are introduced in both PSA-2000 and PSA-2006. Figure 14 also shows that the CDF for the PSA-2000 is considerably lower if the success criteria from PSA-2006 are used. This is mainly because the electro-mechanical control rod insertion system is credited at loss of main feedwater (TF). This causes the previously dominating core damage se-
55

quence in PSA-2000, which includes CCF of control rods, to become less frequent.
Figure 12 CDF with success criteria for PSA-2000 applied to PSA-1994
Figure 13 CDF with success criteria for PSA-2006 applied to PSA-2000
56

Figure 14 Core Damage Frequency with success criteria according to PSA-2006
5.4.3 Data Initiating Event Data Initiating event data have changed over the three generations of PSA. In order to establish to what extent the initiating event frequencies (IE) affect the CDF, a comparison between the results from the three models and IE frequencies has been made for transients and LOCA:s. In order to eliminate the effects from changes in IE frequency, this is done by calculating the con-ditional core damage probability (CCDP) for all IE:s. Some important results of the analysis are:
The CCCP for large and medium sized LOCA is high for PSA-2006. The initiating event frequencies for LOCA:s are considerably higher in this PSA compared to previous models. The main reason for the higher condi-tional core damage frequency is that the modelling of LOCA is more de-tailed than in the previous analysis, with each LOCA case as a separate ini-tiating event.
The CCDP for TF (loss of main feedwater) increased considerably be-tween PSA-1994 and PSA-2000 but decreased between PSA-2000 and PSA-2006. In PSA-2000, some CCI events are included in TF. The initiat-ing event frequency for TF including CCI is however lower than the fre-quency for TF used in PSA-1994. In PSA-2006, CCI:s are fully separated from TF.
It is difficult to draw any conclusions about a general increase or decrease of the conditional core damage probabilities. It can however be noted that the high increase in LOCA frequencies between PSA-2000 and PSA-2006 does
57

not lead to higher core damage frequencies for LOCA since changes in the success criteria for isolation have been implemented in parallel. T-book Data The reliability data used in the PSA-1994 is mainly from version 3 of the Nordic reliability data Handbook (T-book), while the PSA-2000 and PSA-2006 use reliability data from version 5 of the T-book. An analysis was made of the impact of differences between data in the two T-book versions. It turned out that the data for the most important reliability parameters have changed in opposite directions, which reduces the over-all impact, but may cause considerable changes in specific sequences. When the most important failure rates for T-book version 5 are used in the PSA-1994 the CDF in-creases by 4%. Based on the limited analysis presented here it is not possible to conclude if the results are generally higher or lower because of the change of data source. Common Cause Failures The number of modelled CCF groups increases for each generation of the Forsmark 1 PSA and the sources for the CCF data are different in the three generations of the PSA. There are also several changes in the method for modelling CCF. One im-portant change is the modelling of CCF for the reactor shutdown. In PSA-2000, the control rods (221/222), the components of the hydraulic scram system (354) and the power supply to the control rod manoeuvring system (532) are considered in the CCF modelling. In PSA-2006, the electric motors of the control rod manoeuvring system are also considered in the CCF mod-elling. It can be concluded that the changes in the modelling scope and in the method for modelling CCF between PSA-1994 and PSA-2000 have a large impact on the results. The contribution from CCF to the CDF increases from 50% to 97% during this period. The conclusion is that the CCF modelling of reactor shutdown is of high importance to the results for the initiating event group transients. Both changes in success criteria and in modelling of CCF for reactor shutdown are important. The changes in the modelling of CCF between PSA-2000 and PSA-2006 include changes both in the method of modelling and in the data source. These changes have less importance for the total results; the contribution from CCF decreases from 97% to 92%. Human Reliability Data PSA-2006 includes considerably more operator actions than previous gen-erations of the PSA. In parallel, a number of operating actions included in previous generations of the PSA have been excluded in PSA-2006.
58

The analysis shows that the overall CDF for PSA-2000 increases with 1% if HRA data from PSA-2006 is used. It should however be noted that the change of HRA data has a considerable impact on the results for the start up and shut down modes of operation, which are outside the scope of this analysis.
5.4.4 Minimal cut-set cut-off The calculations leading up to the CDF can be performed in different ways. For example, absolute and relative cut-off parameters can be varied. It should be noted that the selection of the cut-off value is always based on test calculations with the model where a suitable balance is searched between accuracy and computation time. Experiences from other studies have shown that cut off can have large influ-ence on PSA results. A comparison of the F1 PSA results using different cut-off values, shows that cut-off values influence the total CDF with less than 1%. However, there are some analysis cases where the CDF has a noticeable influence. Most of those cases have a CDF close to the cut-off limit.
5.4.5 PSA scope and method The level of detail of the PSA has increased over the years. The number of basic events, initiating event, event trees and fault trees generally increases with each model. The general experience from PSA modelling seems to be that a more detailed and complex model leads to a higher CDF because more dependencies (both functional, area related and CCF type) are identified and introduced in the PSA. However, it is worth noting that even if the modelling of the electrical systems has become more and more detailed, the CDF due to failures in the electrical systems has remained on a similar level for all three PSA generations. CCI was not implemented in PSA-1994. In the following PSA generations CCI:s has played an important role. In PSA-2000 CCI’s contribution to the total CDF was 10 % and in PSA-2006 it was 6 %. Thus, one conclusion that can be drawn regarding the level of detail for the modelling is that the intro-duction of CCI has lead a more realistic modelling of the impact of specific transients, which has resulted in a higher CDF.
5.5 Discussion The CDF for the Forsmark 1 PSA has varied between the different PSA gen-erations. There are several reasons for the variations and it is often difficult to identify and separate the influence on the result from specific changes in the PSA.
59
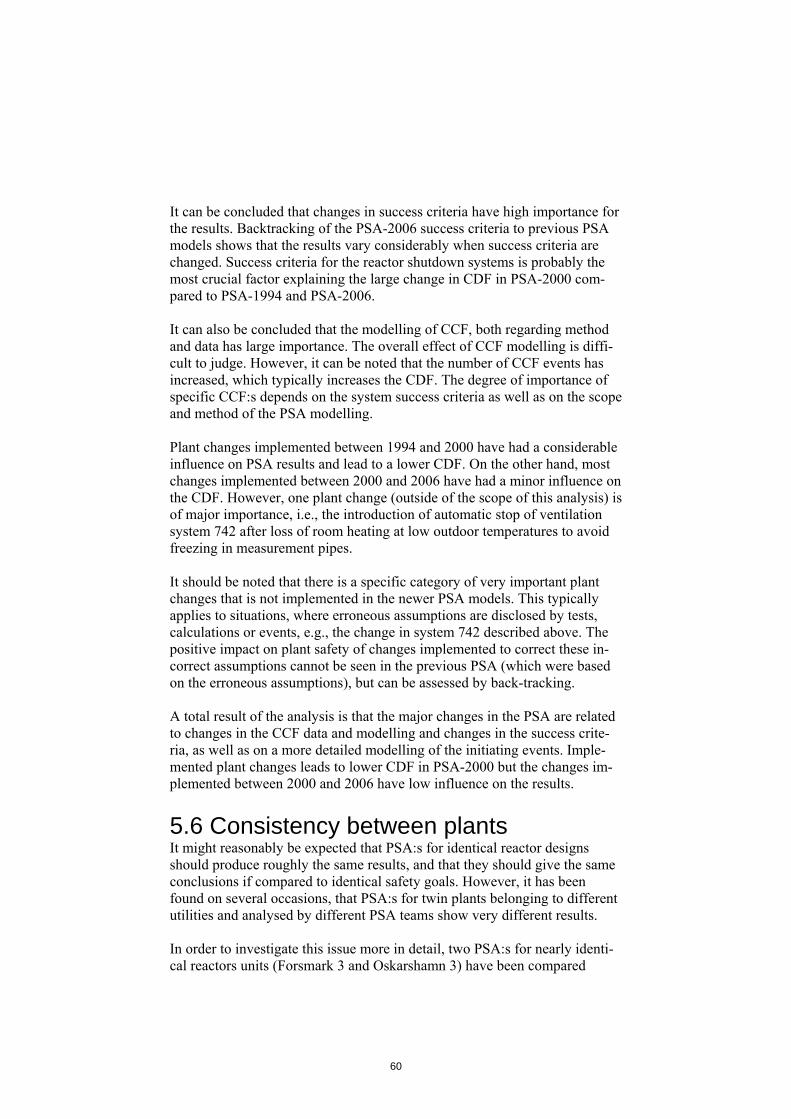
It can be concluded that changes in success criteria have high importance for the results. Backtracking of the PSA-2006 success criteria to previous PSA models shows that the results vary considerably when success criteria are changed. Success criteria for the reactor shutdown systems is probably the most crucial factor explaining the large change in CDF in PSA-2000 com-pared to PSA-1994 and PSA-2006. It can also be concluded that the modelling of CCF, both regarding method and data has large importance. The overall effect of CCF modelling is diffi-cult to judge. However, it can be noted that the number of CCF events has increased, which typically increases the CDF. The degree of importance of specific CCF:s depends on the system success criteria as well as on the scope and method of the PSA modelling. Plant changes implemented between 1994 and 2000 have had a considerable influence on PSA results and lead to a lower CDF. On the other hand, most changes implemented between 2000 and 2006 have had a minor influence on the CDF. However, one plant change (outside of the scope of this analysis) is of major importance, i.e., the introduction of automatic stop of ventilation system 742 after loss of room heating at low outdoor temperatures to avoid freezing in measurement pipes. It should be noted that there is a specific category of very important plant changes that is not implemented in the newer PSA models. This typically applies to situations, where erroneous assumptions are disclosed by tests, calculations or events, e.g., the change in system 742 described above. The positive impact on plant safety of changes implemented to correct these in-correct assumptions cannot be seen in the previous PSA (which were based on the erroneous assumptions), but can be assessed by back-tracking. A total result of the analysis is that the major changes in the PSA are related to changes in the CCF data and modelling and changes in the success crite-ria, as well as on a more detailed modelling of the initiating events. Imple-mented plant changes leads to lower CDF in PSA-2000 but the changes im-plemented between 2000 and 2006 have low influence on the results. 5.6 Consistency between plants It might reasonably be expected that PSA:s for identical reactor designs should produce roughly the same results, and that they should give the same conclusions if compared to identical safety goals. However, it has been found on several occasions, that PSA:s for twin plants belonging to different utilities and analysed by different PSA teams show very different results. In order to investigate this issue more in detail, two PSA:s for nearly identi-cal reactors units (Forsmark 3 and Oskarshamn 3) have been compared
60

[NKS-36]. Two different analysis teams performed the PSA:s, and the analyses became quite different. A major finding of the comparison study was that the two projects had dif-ferent purposes and thus had different resources, scope, and methods. It was concluded that comparison of PSA results from different plants is normally not meaningful. It takes a very deep knowledge of the PSA:s to make a com-parison of the results and usually one has to ensure that the compared studies have the same scope and are based on the same analysis methods. A PSA is an enormous mathematical model based on technical descriptions of sys-tems, experience and data, interpretations of data, engineering judgements and use of various physical models. The analysis process is sensitive to many factors, not all controllable for the analysis team. A PSA is never complete. There are always open issues and things that have been excluded that can have great influence on the quantitative estimate of the accident frequency. The results presented and conclusions drawn in one version can be changed in the next version. The history of the analysis and the status of the PSA programme of the plant should be known when review-ing the PSA. If comparability is considered a desirable property of PSA, the methodology for performing PSA:s should be harmonised. This would also facilitate the review of the studies. Examples of areas for harmonisation are presentation of results, presentation of methods, scope, main limitations and assumptions, definitions of end states (core damage or release categories), definitions of initiating events, and definitions of common cause failures. Harmonisation should follow the experience from the use of studies and results from re-search and development work. Many real uncertainties can be identified by comparing PSAs. Generally, comparisons can be recommended as a method to review the quality of a PSA and as a method to analyse the uncertainties of the study.
61

6. Risk criteria for PSA level 2
6.1 Background As seen from the international overview in chapter 4, there is quite good consensus about the definition of a core damage, but the definitions of a large release vary considerably. There is both a considerably larger variation in the frequency limits, and very different answers to the question of what constitutes an unacceptable release. As with the CDF, the magnitudes are sometimes based on IAEA safety goals suggested for existing plants, i.e., on the level of 10-5 per year [IAEA_INSAG-3, IAEA_INSAG-12]. However, most countries seem to define much stricter limits, between 10-7 per year and 10-6 per year. The definition of what constitutes an unacceptable release differs a lot, and there are many parameters involved in the definition, the most important ones being the time, the amount, and the composition of the release. Addi-tionally, other aspects may be of interest, such as the height above ground of the point of release. The underlying reason for the complexity of the release definition, is largely the fact that it constitutes the link between the PSA level 2 results and an indirect attempt to assess health effects from the re-lease. However, such consequence issues are basically addressed in PSA level 3, and can only be fully covered in such an analysis. In Sweden and Finland, existing definitions of an unacceptable release are directly or indirectly based on the Swedish government decision in 1985 regarding severe accident mitigation, i.e., “0,1 % of an 1800 MWt core”, corresponding to a release of 100 TBq of Cs-137 [SKI_SSI_1985]. This “unacceptable” release is not necessarily large, and the definition includes no timing aspects, which makes the scope of the criterion very wide. Therefore, additional release criteria may be beneficial for the sake of efficient analysis and utilisation of results. Level 2 and level 3 PSA criteria used by different international organisations are summarized in Attachment 1. As discussed in Ch. 0, there are several differences in the definition of these criteria between different countries. In Canada, Japan, Korea and USA both level 2 and level 3 criteria are speci-fied. In other countries or organisations either level 2 criteria (Finland, Rus-sia, Slovakia, Sweden, IAEA and EUR) or level 3 criterion (the Netherlands, UK) are specified. Criteria can be mandatory (in most cases for new plants or designs) or informal (in most cases for existing plants).
62

The release for which a numerical criterion is given is also defined in several different ways (large release, large early release, small release, unacceptable consequence containment failure). The numerical objectives vary from 10-
7/year to 10-5/year, which is quite a large spread, larger than for core damage frequency, where objectives vary between 10-5/year and 10-4/year. Concerning level 3, there are differences in the definitions of criteria, too. However, risk is defined in a way or other as a health risk. Mostly risks are divided into fatal acute or fatal late health risks and these can be calculated for an individual or a group. Typically acute health effects have a threshold dose value under which the probability of health effect is zero, but above which the probability of acute health effect is increased with increasing dose. On the other hand, most late health effects do not have threshold values for dose. Based on these assumptions acute health effects can be expected in the vicinity of the release point, whereas late health effects appear in the public exposed to radiation over larger areas.
6.2 Level 2 vs. level 3 criteria
6.2.1 Basis for comparison If links between criteria at different levels of PSA are considered, a chain in consequences and associated probabilities should be seen. When transferred from level 1 towards level 3, consequences become more and more severe and probabilities are reduced. Level 2 criteria include probabilities of phe-nomena from a core damage to the release. This can be the probability of a containment failure or the probability of a sequence resulting in a direct re-lease to the atmosphere. If finally level 3 is considered, criteria are often defined at the level of individual acute or latent fatality risk, making it possi-ble to compare risk from a radioactive release with other risks occurring in normal life. One way to qualify level 3 criteria is to relate the numerical value to other risks of society. Concerning individual risk of prompt or latent death, statis-tical data is generally available. This data is often divided into different cate-gories, and in this case the number of premature deaths from accidents and from fatal cancers can be useful as a point of reference. These numbers can be changed to risk values. For example, in general accidental death for an individual is on the level of about 10-4 per year. With these numerical values available it needs to be decided how much less the risk from a radioactive release should be. Often the factor of 100 is used, resulting in the value of 10-6 per year, i.e., the safety goal for individual risk from radioactive release should be 10-6 per year. One of the most important factors affecting the off-site consequences is the prevailing weather conditions during the release and dispersion. By means of
63

off-site consequence assessment, various consequences from radioactive releases can be calculated for different weather conditions. Figure 15 illustrates the variability in risk due to the weather, showing the individual risk (early fatality) calculated with a hypothetical level 3 PSA. The figure also shows the safety goal level as specified above.
Early fatality
1E-13
1E-12
1E-11
1E-10
1E-09
1E-08
1E-07
1E-06
1E-05
1 10 100
Distance from the release point [km]
Indi
vidu
al ri
sk [p
er re
acto
r yea
r]
95 %
Mean
5 %
Safety Goal
Figure 15 Individual risk of early fatality as a function of distance. In this case, the effect of the weather variability is illustrated by the percen-tiles. In a probabilistic consequence model, the consequences are evaluated on an r, θ grid around the release point for each meteorological scenario. Probabilities of different weather sequences are based on on-site measured data. Weather fluctuation causes variation in the calculated risk with two orders of magnitude at most. Figure 15 also shows that in this hypothetical case, individual risk decreases when the distance is increased. The value of the safety goal is clearly at a higher level than the calculated risk values. It should be noticed that the fre-quency of the release determines the starting point level of the curves. It is customary to sum up the consequences experienced at each r, θ grid point to show the total consequences observed in the population for each meteorological scenario. Often this is done by presenting the consequence magnitudes and their associated probabilities in the form of complementary cumulative distribution functions (CCDF). Examples from NUREG-1150 are shown in Figure 16.
64

Figure 16 Examples of complementary cumulative distribution func-tions for early and late health effects from NUREG-1150 [USNRC 1990]. In addition to CCDF curves it is usual to produce expectation values and other percentile values for the CCDF. The expected value (mean) of the CCDF is the integral of the CCDF and it is often used as a summary measure of risk. Values of various percentiles can be obtained from the CCDF. For example in Figure 16 on the left hand side one early fatality would be exceeded in one out of two million releases (probability of 5·10-7), but on the right hand side one latent cancer fatality would be exceeded in one out of 100 000 releases (probability of 10-5), if the mean value is considered. In addition to weather distribution, there are a number of other aspects that will affect the results, e.g., population distribution and eating habits. In addi-tion, exploitation of countermeasures and other dose mitigating measures can reduce exposure. Societal risk is often defined as the product of the accident frequency and the magnitude of consequences. If societal risk is considered based on Figure 16, it can be expected to remain very small.
6.2.2 Test application to Finnish site In a test calculation with environmental data from a Finnish nuclear power plant site [Rossi_2007], the definition of a large release in the Finnish Gov-ernment Resolution is used as the reference release [VnP 395/1991]. Accord-ing to the Government Resolution it is required that neither acute harmful health effects nor long-term restrictions for usage of extensive land or water areas in the environment of the nuclear power plant shall be caused by the radioactive release after a severe nuclear power plant accident. Concerning the long-term requirement, the release limit of 100 TBq is assigned for the Cs-137 isotope. In addition it is defined that the combined fallout of other released nuclides shall not cause greater hazard in the long-term, starting three months after the accident, than the defined maximum caesium release.
65

In the Finnish regulatory guide for PSA, YVL Guide 2.8, the numerical ob-jective for a large release is set to 5·10-7/year [STUK_YVL-2.8]. Concerning the release limit of 100 TBq for the Cs-137 isotope, no acute health effects would be expected, but statistical late health effects could be caused. In reality, radiation protection measures both in the early and late phase would certainly be initiated in order to reduce the collective dose, but these measures are assumed not to be applied in this study. In the test calculation, off-site consequences from the reference release were elucidated by calculating various key figures defined in [STUK_YVL-7.2]. Focus is on the assessment of doses and health effects from prolonged expo-sure. Doses can be converted to late health effects by applying dose response functions. The exposure pathways considered here are direct external radiation from the fallout (groundshine), and ingestion dose pathways (cow’s milk and meat). In addition, inhalation and external radiation from the plume (cloud-shine) were included in some calculations to elucidate their significance in long-term exposure. In the ingestion model, Nordic cultivation methods are taken into account in addition to summer-winter seasonal variation. Con-sumption of berries, mushrooms, game or fish are not considered. Local shielding conditions are assumed, ingestion rates are taken from the BIOMOVS project6. The release altitude is 20 m and the release duration is 1 hour. Dispersion calculations are carried out in different weather condi-tions measured at the site, and results are weighed with the annual statistical distribution of the conditions [Ilvonen_1994].
6.2.3 Results from the test application Figure 17 presents individual doses from the reference release of the cae-sium isotopes. 100 TBq Cs-137 release implies release of other caesium isotopes, which can be scaled in the ratio of the reactor inventory. In this case, the release magnitude of Cs-134 is 148 TBq and it is included in the calculations and the source term is known here as the reference source term or release. It is concluded that exposure from groundshine is the dominant dose compo-nent. The dose from inhalation is one order of magnitude lower than from groundshine, and from cloudshine four orders of magnitude lower. The ex-pectation value of groundshine decreases from 10 mSv to 0,3 mSv along a distance change from 1 to 10 km. The corresponding maximum values change from 100 mSv to 1 mSv. 6 BIOMOVS (Biospheric Model Valuation Study) is an international cooperative effort to test models designed to quantify the transfer and accumulation of radionuclides and other trace substances in the environment.
66

Expectation values were found not to exceed the ICRP Publication 82’s limit value of 10 mSv, but the maximum values exceed this limit value as far as 3 km’s distance from the point of release [ICRP_82]. Considering the IAEA’s criterion for terminating temporary relocation (set to 10 mSv/month), this criterion would be exceeded even at the distance of 1 km [IAEA_GS-R-2]. Only the important ingestion dose pathways from cow’s milk and meat are considered here. Due to seasonal variations, results are calculated and pre-sented separately for deposition occurring during the growing and pasturing season and for deposition during the period outside the growing season. In the analysis, it is assumed that the agricultural production is consumed at the place of cultivation without distribution or mixing with fresh food. Figure 18 illustrates that there is a difference by an order of magnitude in the values if deposition occurs during the growing season or not. The ex-pected values of the dose from cow’s milk and meat at the distance of 1 km are in the interval of 100 to 200 mSv. Doses decrease with increasing dis-tance so that at the distance of 10 km the dose values are about two orders of magnitude lower. The expectation value from cow’s milk, as well as the maximum value from cow’s meat, still reaches 10 mSv. Because the first year’s dose dominates the ingestion dose during long-term exposure, it is obvious that a food ban would be enforced to avoid or at least reduce exposure.
Individual dose
1E-07
1E-061E-05
1E-041E-03
1E-021E-01
1E+00
1 2 3 5 10Distance [km]
Dos
e [S
v]
cloudshine(exp)
cloudshine(max)
inhalation(exp)
inhalation(max)
groundshine(exp)
groundshine(max)
Figure 17 Individual dose caused by the reference release (100 TBq Cs-137 and 148 TBq Cs-134) at the Olkiluoto site.
67

Individual ingestion dosesolid line - deposition during growing season
dash line - deposition outside growing season
1E-04
1E-03
1E-02
1E-01
1E+00
1E+01
1 3 5 7 9Distance [km]
Dos
e [S
v]
cows' milk(exp)cows' milk(max)cows' meat(exp)cows' meat(max)cows' milk(exp)cows' milk(max)cows' meat(exp)cows' meat(max)
Figure 18 Individual ingestion dose caused by the reference release at the Olkiluoto site. Contamination areas based on different dose criteria are presented in Table 7. Here the contamination criterion is based on the predicted dose from 30 year’s exposure from groundshine and from ingestion of contami-nated foodstuffs. Table 7. Contamination areas based on long-term exposure from cow’s milk and from groundshine following the reference release.
Contaminated area [km2]
0,03 Sv/30a 0,1 Sv/30a 0,3 Sv/30a
Criterion
Expected 99,5-percen-
tile
Ex-pected
99,5-percentile
Expected 99,5-percentile
Milk during growing season 80 350 20 70 6 20
Milk outside growing season 1 7 0,09 2 0,005 0,5
Groundshine 8 40 2 8 0,2 3 The strictest criterion 0,03 Sv/30a (per 30 years) corresponds to the annual dose of 1 mSv, when the global average natural dose is 2,4 mSv/a. If a less rigorous level for protective actions as defined in the ICRP Publication 82 (0,3 Sv/30a corresponding to 10 mSv/a) would be used, the contaminated areas are reduced roughly by an order of magnitude.
68

If deposition takes place during the growing and pasturing season, the largest contaminated areas are found for doses from cow’s milk,. If instead deposi-tion occurs outside the growing season, the external dose from fallout domi-nates the contaminated area. Then contaminated areas are also strongly re-duced compared to the values of the growing and pasturing season. Figure 19 shows the complementary cumulative probability distribution functions of the collective doses caused by the reference source term at the Olkiluoto site. The highest collective doses are brought about via external exposure from fallout. Ingestion doses are not considered, because no up to date statistical data of production distributions was available. Using the fatal cancer risk factor of 0,05 per manSv, about 25 (0,05·500) or more fatal can-cers would be caused in one out of one-hundred releases (at the 99th percen-tile). Due to simplified calculation, this interpretation gives a restricted indi-cation of societal risk.
6.2.4 Comparison to the safety goal The feasibility of a safety goal can be assessed by comparing it with the cal-culated individual fatal cancer risk. Here the reference source term was modified to take into account also other potential nuclides. The release is assumed to be started 24 hours after the shutdown and the iodine release is set to 1500 TBq as I-131 equivalent besides all noble gases are released. In addition, the caesium release is doubled to cover the effect of other nuclides after three month’s delay as defined in the reference [VnP 395/1991]. Figure 20 illustrates the individual fatal cancer risk at the distance of 1 km. The calculation includes the release probability of 5·10-7/year and the sea-sonal variations of agriculture and weather statistic. The value of the safety goal for individual risk is assumed to be 10-6/year as concluded in the begin-ning of this chapter. It can be seen that the expected value of the calculated individual risk is two orders of magnitude lower than the predefined safety goal value, and that even the 95 % fractile is lower by one order of magni-tude. Thus, in this case the requirement of the safety goal is fulfilled.
69
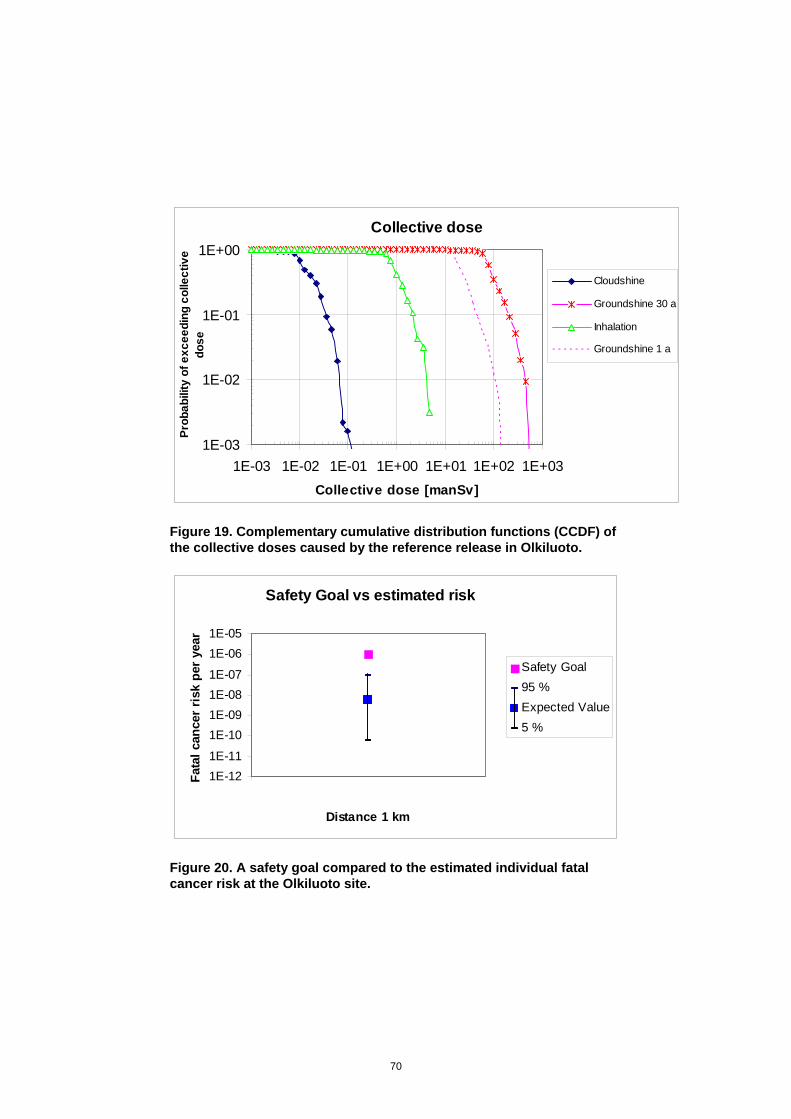
Collective dose
1E-03
1E-02
1E-01
1E+00
1E-03 1E-02 1E-01 1E+00 1E+01 1E+02 1E+03Collective dose [manSv]
Prob
abili
ty o
f exc
eedi
ng c
olle
ctiv
edo
se
Cloudshine
Groundshine 30 a
Inhalation
Groundshine 1 a
Figure 19. Complementary cumulative distribution functions (CCDF) of the collective doses caused by the reference release in Olkiluoto.
Safety Goal vs estimated risk
1E-121E-11
1E-101E-091E-081E-07
1E-061E-05
0,7
Distance 1 km
Fata
l can
cer r
isk
per y
ear
Safety Goal95 %Expected Value5 %
Figure 20. A safety goal compared to the estimated individual fatal cancer risk at the Olkiluoto site.
70

7. Subsidiary risk criteria
7.1 Background A “subsidiary criterion” is a criterion on a lower technical level to assess in a simplified way the consequences on a higher level. The two main subsidiary criteria considered in this context are the core damage frequency (CDF) and large release frequency/ large early release frequency (LRF/LERF). These may be interpreted as subsidiary criteria for risk of offsite consequences in countries where level 3 PSA is not required. In some documents the term “surrogate criterion” is used instead. Subsidiary criteria may be defined at lower level too, i.e., for the reliability of safety functions and systems, meaning that we can, in principle, think the whole range of different criteria related to different levels of defence-in-depth (DID) [INSAG-10]. DID calls for multiple successive methods or barriers to radioactive release to the environment (see also discussion in Chapter 4). Correspondingly, a reference can be made to the international nuclear event scale (INES) [IAEA_INES]. INES is a scale for events corresponding to the safety impact of the event, and it has a close relationship to definitions of the DID framework. The general safety objective of a nuclear power plant is according to [IN-SAG-12] to protect individuals, society and the environment by establishing and maintaining in nuclear power plants an effective defence against radio-logical hazard. In the DID framework, safety objective of a nuclear power plant can be interpreted as reducing the risk of breaching all DID levels to an acceptable level. In the INES framework, it is related to the risk of events INES-4 to INES-7 (accidents). See Figure 21 for an overview of the levels of the INES scale.
71

Figure 21 Overview of the INES scale [IAEA_INES]. In both the frameworks, numerical criteria set to different levels are subsidi-ary risk criteria, the compliance of which, in principle, can be assessed by means of PSA. In practice, it depends on the scope and level of detail of the PSA model. Figure 22 shows suggested links between PSA level 1–3 and DID levels 1–5.
72

Figure 22. Levels of PSA and defence-in-depth (DID). Subsidiary criteria are advocated for several reasons:
To perform a full-scope level 3 PSA is a resource demanding effort, which can be avoided if the safety of a nuclear power plant can be demonstrated by a level 2 PSA.
The uncertainties in the risk assessment of offsite consequences (e.g. so-cietal and individual risk) are considerably larger than in the assessment of risk of large releases or risk of core damage. There are also fewer uncer-tainties in the assessment of compliance with subsidiary risk criteria.
Subsidiary risk criteria put focus on defence-in-depth, in particular atten-tion is paid to the accident prevention and mitigation.
Subsidiary risk criteria can be used as a basis for the definition of safety function or system level reliability requirements, providing better support than higher level criteria to the actual design of safety functions and sys-tems.
Subsidiary risk criteria are closer to day-to-day operational safety man-agement concerns of the utility, and they are closer to risk-informed appli-cations.
The following concerns may be expressed in relation to the use of subsidiary criteria:
73

The metric of different subsidiary risk criteria typically differ a lot (core damage – large release – off-site consequences), which complicates any tries to verify the assumed correspondence with higher level safety criteria.
Technology dependency and site dependency can be difficult to take into account in subsidiary criteria.
Subsidiary criteria (like CDF or LERF) can be difficult to compare to other risks of the society, which are typically expressed on a higher level (degree of damage to individuals or groups).
In the communication with the public, subsidiary criteria (like CDF) may be seen as more abstract and harder to understand than top level risks (like off-site consequences).
The justification of subsidiary criteria is discussed from three perspectives: 1) justification with respect to primary safety goal for a nuclear power plant, 2) justification with cost-benefit analysis and 3) justification with respect to experience from PSA.
7.2 Justification with respect to the pri-mary safety goals for a nuclear power plant Justification with respect to the primary safety goal for a NPP means that the primary safety goals must be interpreted as quantitative risk criteria, which will be then further developed to subsidiary levels. IAEA defines the follow-ing high level safety goals [INSAG-12]:
To protect individuals, society and the environment by establishing and maintaining in nuclear power plants an effective defence against radiologi-cal hazard.
To ensure in normal operation that radiation exposure within the plant and due to any release of radioactive material from the plant is as low as rea-sonably achievable, economic and social factors being taken into account, and below prescribed limits, and to ensure mitigation of the extent of ra-diation exposure due to accidents.
To prevent with high confidence accidents in nuclear plants; to ensure that, for all accidents taken into account in the design of the plant, even those of very low probability, radiological consequences, if any, would be minor; and to ensure that the likelihood of severe accidents with serious radiologi-cal consequences is extremely small.
74
Quantitative risk criteria express the qualitative safety goals in terms of measurable consequences and associated probability/frequency criteria. In the context of nuclear or other also industrial accidents, e.g., the following measurable risks can be defined:
health risk
- societal risk (consequences to the surrounding public expressed in terms of societal radiological detriment)
- group (fatality) risk, subset of the societal risk
- individual (fatality) risk
environmental risk
- restrictions in land use
- damages to biosphere
economical risk
- cost to industry
- cost to society
Typically, high level quantitative risk criteria are restricted to health risk and especially to the risk of fatalities (see chapter Error! Reference source not found.), even though environmental and economical risk would be important factors from the overall risk point of view. A few countries have defined such criteria for nuclear power plants. As an example, the U.S.NRC safety goal policy [USNRC SECY-01-0009] defines the following quantitative (intermediate) risk criteria:
The risk to an average individual in the vicinity of a nuclear power plant of prompt fatalities that might result from reactor accidents should not exceed one-tenth of one percent (0.1%) of the sum of prompt fatality risks result-ing from other accidents to which members of the U.S. population are gen-erally exposed.
The risk to the population in the area near a nuclear power plant of cancer fatalities that might result from nuclear power plant operation should not exceed one-tenth of one percent (0.1%) of the sum of cancer fatality risks resulting from all other causes.
The first criterion is an individual risk criterion and the second one can be associated with a group mortality risk criterion. Such risk criteria can be derived by a comparison with other risks in society.
75

The individual risk is sometimes defined for a hypothetical most exposed person in the vicinity of a nuclear power plant, sometimes for an average person. The individual risk criterion, p*, can be expressed like
p < P*. (4) As a reference for the criterion, the general accidental death, which is about 1·10-4/yr, can be used. Using the factor of 100 or 1000, the safety goal for individual risk from a reactor accident should be 1·10-6/yr or 1·10-7/yr, mean-ing no significant additional accident risk to an individual. Different criteria may be set for a worker and non-worker. Another useful reference is the cancer risk due to natural radiation. The global average natural dose is about 2,4 mSv/a, and the average dose of a Finnish citizen 4 mSv/a where radon is a significant contributor (source www.stuk.fi). According to ICRP fatal cancer risk factor is 0,05 per manSv [ICRP_60], meaning that the collective dose received during 1 year in Finland could thus contribute to 1000 fatal cancer deaths (2·10-4 per individ-ual), which is of same order as the general accidental death rate. For the group risk, references can be found e.g. from results from other risk analyses, legislation in other contexts and by comparison with radiation based cancer risk. The group mortality risk can expressed like
f(n) < F*(n), (5)
i.e., the frequency of a single accident causing n or more fatalities shall be less than F*(n). Examples for F*(n) are 1·10-3/n2 per year used by Dutch authorities for hazardous installations, 1·10-3/n per year, used by Australian authorities for existing dams (1·10-4/n for new dams) and “total risk of 100 or more fatalities,” limit 1·10-5/year, objective 1·10-7/year used by U.K. HSE (see Figure 23).
76

1E-13
1E-12
1E-11
1E-10
1E-09
1E-08
1E-07
1E-06
1E-05
1E-04
1E-03
1 10 100 1000 10000 100000
N
f*(N) = 1E-3/Nf*(N) = 1E-3/(N^2)
Figure 23 Example group mortality risk criteria. To show the compliance with the individual and societal/group risk criteria a level 3 PSA should be performed, or at least some limited level 3 assess-ments should be made. Another alternative is to derive consistent subsidiary risk criteria for the level 2 PSA. Number of fatalities should be interpreted in terms of doses, doses in terms of types of releases (source terms) and effec-tiveness of countermeasures. The procedure can be continued further to de-fine criteria for level 1 PSA and for the reliability of safety functions. It should be noted that such subsidiary criteria will be site specific, since the size of population in the vicinity of the nuclear power plant is an essential factor to the population risk. It is quite evident that use of a single criterion for level 2 resp. level 1 is a limited approach. In level 2, use of a single frequency criterion for certain release can lead to a very strict criterion if the aim is to ensure the fulfilment of higher level criteria. On the other hand, it may be optimistic, if the crite-rion is only defined for an “early” release. Late releases are important for the control of societal risk. A sufficient validity of level 2 criteria can be ensured by defining several release related criteria, as suggested e.g. in [RESS_80(2003)143], where criteria are defined for each INES-class event. Table 8 presents tentative criteria defined for a typical site in Japan, by making an interpretation of INES-classes in terms of release limits such that are coherent with the quan-titative health objectives for individual and societal risk.
77

Table 8. Risk criteria with respect to INES classes 2 to 7 proposed in [RESS_80(2003)143].
Release limit [TBq] Frequency [1/yr] INES-class
Noble gas Iodine Caesium Target Limit
2 Incident –30 –3 –0,3 1E-2 1E-4
3 Serious incident –300 –30 –3 3E-3 3E-5
4 Accident mainly in installa-tion
–3000 –300 –30 1E-3 1E-5
5 Accident with off-site risks –30000 –3000 –300 1E-4 1E-6
6 Serious accident –300000 –30000 –3000 1E-5 1E-7
7 Major accident 300000– 30000– 3000– 1E-6 1E-7 Figure 24 compares INES-class based risk criteria with the STUK's risk criteria in the guide YVL-2.8. YVL-2.8 criteria follows the target curve. It should be noted that the origin for the "100 TBq Cs-137" -definition as the criterion for a large release is the Swedish assessment of a release that will not cause long term restrictions in the land use (0,1 % of the inventory of the caesium isotopes Cs-134 and Cs-137 in a core of 1800 MW, excluding noble gases) [SKI_SSI_1985]. If the definition would be linked to the assessment of a release that no short-term fatalities in acute radiation syndrome, the 5·10-7/yr step would be at 1000 TBq Cs-137 (1 % of the inventory of a core of 1800 MW, excluding noble gases), and the curve would be more in be-tween the ALARP region. If the effort is put on the derivation of valid level 2 criteria, a CDF-criterion becomes irrelevant, from the health objective point of view. CDF-criterion can be used to control the defence-in-depth of the plant, e.g., reliability of DID-levels 1–3. From the health objective point of view it could be worth considering plant damage state dependent criteria, at least distinguishing the containment by-pass sequence. CDF-criterion is also important for risk-informed applications, which is discussed in the next chapter. To summarize, the prompt fatality risk and late cancer risk can be considered as main risk metrics related to the overall safety objectives. Internationally, some variation exist with the quantitative level for these risk metrics, but 1 ·10-7 per year for both the risk metrics seem to be close to what is understood to correspond with a risk level that does not constitute any significant risk increase to the society.
78

1E-7
1E-6
1E-5
1E-4
1E-3
1E-2
1E-1
1E+0
0,1 1 10 100 1000 10000
Cs-137 [TBq]
f [1/
yr] Saji limit
Saji targetYVL-2.8
Figure 24 Comparison of YVL-2.8 risk criteria and INES-scale based criteria proposed by Saji [RESS_80(2003)143].
7.3 Justification with cost-benefit analysis Justification with cost-benefit analysis is based on the decision theory framework. It is assumed that risk (probabilities and consequences) can be assessed quantitatively and that decision maker can express preferences be-tween different lotteries. A lottery is a decision theoretic construction de-fined by prizes x1, ..., xn and probabilities of winning p1, ..., pn., often de-noted as {<x1, p1>, ..., <xn, pn>}. A naive way to derive risk criteria for a NPP is to consider a following kind of a lottery
{<’no reactor accident’, 1 – p1>, <’core damage’, p1 · (1 – p2)>,
<’large release’, p1 · p2>}, where p1 is the probability of a core damage, p2 the conditional probability of large release given a core damage. Consequence ‘no reactor accident’ im-plies the benefits of operating an NPP for the corresponding life time. This is illustrated in Figure 25.
79

Figure 25 A simplified nuclear power plant lottery. Assuming that the profit of an NPP is w and cost of a core damage resp. large release accident is M1 resp. M2, the expected value (EV) of an NPP is
EV = (1 − p1) · w − p1 · (1 − p2) · M1 − p1 · p2 · M2. (6) Denoting the ratios M1 / w = a1 and M2 / w = a2, we get the following equa-tion for the relationship between if p1 and p2, when EV = 0
1 − (1 + a1 − a1p2 + a2p2)p1 = 0. (7) From this equation we can notice that, regardless of the value of p2, • if p1 > 1/(1 + a1) then EV <0, • if p1 < 1/(1 + a2) then EV > 0. This is illustrated in Figure 26.
80

p1 = 1 / (a1 + 1)
p1 = 1 / (a2 + 1)
0
1
1,0E-06 1,0E-05 1,0E-04 1,0E-03 1,0E-02 1,0E-01p1
p2
EV > 0
EV < 0
Figure 26 Core damage probability (p1) and conditional large release probability (p2) making the expected value of an NPP equal to 0. The expected value model above is greatly simplified compared to a real investment problem of an NPP. It does not take into account e.g. the time point when an accident happens, uncertainties related to the life time of the plant, discounting of future cost and benefit, cost and benefit of alternative electricity production methods. Nevertheless, we dare to make the conclu-sion that — for a risk neutral decision maker — quite high accident probabil-ity is acceptable since the cost of an accident is not outrageously larger than the benefit of an NPP. For instance, if a1 = 10 and a2 = 100, i.e., the cost of a core damage is ten times larger than the benefit of an NPP and the cost of a large release is ten times larger than the cost of a core damage, the core damage probability less than 1·10-2 is acceptable, regardless of the conditional probability for large release. The decision theoretic explanation for this is that the society is strongly risk averse against nuclear power plant accidents. Risk aversion can be taken into account by replacing the expected value with the expected utility (EU) where the cost of a reactor and large release acci-dents are punished by some factor. Societal risk acceptance curves, used e.g. in the Netherlands, with the form f(n) = k / n2, where n is the number of fa-talities, are examples of risk averse utility functions.
81

The main difference to the justification with the primary safety goals is that the EV or EU principle takes into account the benefit of the installation. More valuable the installation is, higher societal risk should be accepted. This is maybe not the way a regulator would be willing to evaluate the plant. Therefore EV or EU kind of cost-benefit calculations can only be used in the ALARP context: given that the societal and individual risk criteria are ful-filled, cost-benefit analysis can be carried out to justify or reject safety im-provements. The decision theoretic approach can be criticized for several reasons. Firstly, it is difficult to capture all essential elements, especially uncertainties, affect-ing the decision making in a model. Secondly, people do not follow the rules of decision theory in practical decision making and have difficulties in the interpretation of probabilities. Thirdly, there are many stakeholders whose different interests should be taken into account. Therefore it can be difficult to use the decision theoretic framework as the basis when defining absolute risk criteria for a nuclear power plant. The decision theoretic framework may be more appropriate in PSA applica-tions. Given that we can agree upon overall target values e.g. for CDF and LRF, the decision theoretic framework can be used to derive principles to optimise test intervals, allowed outage times, etc.
7.4 Justification with respect to experience from PSA The scope of PSA is always limited meaning that not all accident scenarios affecting societal and individual risk are accounted. Results of PSA include a lot of uncertainties due to several simplifications, engineering judgements, lack of statistics and use of conservative assumptions. Despite of limitations of PSA, ‘valid’ criteria may be defined, if there is an agreement on the role of PSA in decision making. To reach an agreement, it is necessary to define
objectives with PSA
requirements on PSA
applications of PSA
how PSA criteria and safety goals are used in decision making.
While in the previous justification considerations (w.r.t. overall safety goals and w.r.t. risk-informed applications) the approach to define valid subsidiary criteria is top-down, here the approach is bottom-up. Based on experience from present PSAs CDF and L(E)RF for different reactors can be used as references. In this consideration, it is important to know the scope and limi-tations of the studies. It is also important to look at the contributing factors
82

for the numeric results, and compare the risk information with the concep-tion of the safety of a plant. PSA experience based approach may thus pro-vide a link to deterministic design criteria (effect of redundancy and diver-sity, automated vs. manual functions, active vs. passive designs). In fact, the CDF and L(E)RF criteria used in many countries and e.g. pro-posed by IAEA, have their basis on the experience with PSAs. CDF = 1·10-5/yr is generally regarded as an achievable target for a well designed plant. Regarding large release, the issue is more open due to varying and vague definitions for large release.
7.5 Summary Safety goals typically express primary objectives in a qualitative sense. To apply safety goals, they must be translated into quantitative risk criteria such as societal risk and individual risk. Sometimes these quantitative risk criteria are called intermediate criteria, since they need to be further translated into numeric criteria for the interpretation of results from a PSA study. These criteria are called subsidiary or surrogate criteria, at least when used for level 1 and 2 PSA. There are several approaches to justify subsidiary risk criteria, as listed in Table 9. Taking into account the several aspects means a combination of top-down and bottom-up approaches in the derivation of subsidiary risk criteria. For the top down approach, several references exist for societal and individ-ual level risk criteria to be used as the basis. The decision theory provides the framework for the definition of rational risk criteria. Operating experi-ence can provide references for target incident frequencies, but at reactor accident level data is too scarce and not necessarily representative. Experience from present PSAs may help understanding which kind of sys-tem reliability, CDF and LRF values can be reached with different designs, thus providing a link to deterministic design criteria. Experience from pre-sent PSAs may also help understanding how limitations and uncertainties of PSA may affect the result. Finally, an essential factor in the definition of risk criteria is the usage as-pect. Clearly, risk criteria are going to be used in different context, and therefore different risk criteria may need to be defined. Two main usage areas are
As limits for licensing of new reactors
As targets for operating plants to support interpretation of results and deci-sion making on plant modifications.
83

Table 9. Justification principles for subsidiary risk criteria. Principle Description of the ap-
proach Comments
Compliance with other risks accepted in the society
Societal risk acceptance
Overall safety goals are interpreted as quantita-tive risk targets. Refer-ence is made to societal and individual level risk criteria
Level 3 PSA (at least limited studies) needed to justify re-lease criteria
Site specific criteria
Level 1 PSA criterion may become irrelevant
Compliance with principles of rational decision making under risk
Cost-benefit analysis
Risk of large release and core damage accidents are compared to benefits of operating an NPP Benefits of NPP is accounted
Level 3 PSA needed to estimate cost of an accident
Difficult to take into account point of views of all stake-holders
Compliance with current safety status
Operating experience
Accident and incident statistics from NPPs are used as references Only incident data available,
accident data is scarce and is not representative (e.g. Cher-nobyl)
Compliance with deterministic design criteria
PSA experi-ence
Results from PSA-studies are used as refer-ences to determine an acceptable risk level that should be achieved by a well-designed NPP
Limitations of PSA are ac-knowledged. However, it is dif-ficult to assess the effect of scope limitations and uncertain-ties
84

8. Subsidiary risk criteria
8.1 Main conclusions from the project The main conclusion from the project can be expressed as a number of achievements, identification of some opportunities, and some challenges for future use of probabilistic safety criteria. Achievements The project provides a comprehensive state-of-the-art description and has contributed to clarifying the history of safety goals both nationally and inter-nationally, the concepts involved in defining and applying probabilistic safety criteria, and the international status and trends in general. It has identified critical issues and the main problem areas. Finally, the pro-ject provides useful recommendations and guidance on the definition and application of criteria. Opportunities The project enables stringent definition of criteria, improving the possibili-ties of argumentation on safety. Generally, this supports efficient use of cri-teria, yielding more useful PSA results. In this connection, the introduction of ALARP type criteria is judged to provide a very useful way of balancing stringency with the necessary flexibility. There is a possibility of making more active use of lower level criteria. This makes the connection to defence in depth more evident, and opens the per-spective of increased control of defence in depth by use of probabilistic methods, including the use as design tools. There is an opportunity for comparison of risk of different NPPs, as well as of comparison of NPP risk with other risks in society. This is judged to pro-vide an opportunity for improved communication on risks with non-PSA experts and with the public in general. However, a necessary condition for meaningful comparisons is to agree on the scope of PSA and methods ap-plied. Challenges Obviously, there will also be challenges in the future definition and applica-tion of probabilistic safety criteria. These include very general aspects, such as the interpretation of the probability, quality aspects of PSA, and the defi-nition of meaningful and consistent risk criteria for different usages. The need and usefulness of subsidiary criteria has been stressed, but there is obviously also a challenge in defining a relevant set of criteria on different
85

levels. Defining criteria for L(E)RF is complex, especially if release criteria are defined as subsidiary for societal and individual risk. Finally, it will be a challenge to develop coherent application procedures relative to the criteria defined.
8.2 Specific conclusions Nordic experience In Sweden and Finland there are more than 20 years of experience of per-forming PSA, which includes several revisions of the studies, a gradual in-crease in scope and level of detail, as well as steadily increasing use of PSA for decision making. In spite of the many safety improvements made through the years based on PSA results, a current view is that the safety goals out-lined in the 1980s, i.e., 10-5 per year for CDF and 5·10-7 (Finland) or 1·10-7 (Sweden) per year for large release frequency, are hard to achieve for operat-ing NPP:s. This experience arouses confusion that should be resolved in order to further strengthen the confidence in the PSA methodology. Questions aroused in-clude what safety goals should be applied to operating plants, whether the risk level of the plants is too high, whether PSA:s are too conservative, and if safety goals are being applied in an incorrect way. The situation is some-what different for a new plant, for which risk insights have been utilised already from the design phase. The use of safety goals is mostly understood to have had a positive impact from a PSA quality point of view. Informal use of safety goals and cost-benefit evaluations is preferred by most in comparison to a situation with strictly enforced acceptance criteria. One perceived reason to avoid strict use of safety goals is that this might switch the attention from an open-minded assessment of plant safety to the mere fulfilment of safety goals. In order to fulfil safety goals, unnecessary conservatism needs to be avoided in the modelling, i.e., the basic aim should be to have realistic PSA models. International overview Probabilistic safety criteria, including safety goals, have been progressively introduced by regulatory bodies and utilities in most countries. They range from high level qualitative statements to technical criteria. They have been published in different ways, from legal documents to internal guides. They can be applied as legal limits down to “orientation values”. For most respon-dents to the questionnaire made by OECD/NEA WGRISK, probabilistic risk criteria are target values, orientation values or safety indicators. The reported probabilistic risk criteria can be grouped into four categories, in relation with the tools to be used for assessing compliance: core damage
86

frequency, releases frequency, frequency of doses, and criteria on contain-ment failure. Several respondents use more than one criterion, e.g., CDF and LERF while some others use a range of values for a given criterion (e.g., frequency of doses to the public, to the workers, during accidents, during normal operations). Generally, all respondents considered that introduction of probabilistic risk criteria had resulted in safety improvements. There is a considerable spread in opinions on the benefits of using probabilistic risk criteria for communica-tion with the public, ranging from bad to good experiences. It seems that there is a strong relation with each country culture and circumstances. Safety goals related to other man-made risks in society In order to provide perspective on the project’s detailed treatment of prob-abilistic safety goals for nuclear power plants, some information from other areas has been collected. A generally applied target value for the individual risk is 10-6 per year. This is about a factor 100 below the expected accidental death rate for an individual. When considering the group fatality risk, the spread of the criteria is larger. For instance, some countries use the slope 1/N for the FN-curve while others have 1/N2. Several countries apply the ALARA/ALARP principle. In the offshore oil and gas industry, both qualitative and quantitative risk acceptance criteria are used to express a risk level with respect to a defined period of time or a phase of the activity. It is worth noticing that both the number of precursor events requiring handling, and the number of accidents requiring mitigation is high compared to the nuclear industry, resulting in criteria with a relatively high focus on consequence mitigation. Criteria have a large scope, i.e. they apply to a wide range of accident events and consider a wide range of safety functions. There is also more focus than in the nuclear industry on the different life cycle phases (design, construction, operation, maintenance, decommissioning). Defence-in-depth aspects are considered in the criteria by stating requirements for different safety functions. Finally, like in the nuclear energy context, the ALARP principle is often applied. For European rail systems, a standardisation of risk criteria has been prompted by the expressed aim of making it possible for trains and personnel to cross national borders. The harmonisation has been achieved by letting an industry working group propose risk criteria, which have then been accepted by authorities. The criteria suggested are consensus requirements based on an amalgamation of national practices, mainly from Germany and France. Basic principles relate to a comparison to general health risk, and a require-ment for continuous improvement of safety. Systematic procedures are in place for creating subsidiary goals, which is done by defining a tolerable hazard rate for each subsystem forming part of the overall system. Finally, it is worth noting, that a framework for cross-acceptance has been developed,
87

i.e., an agreed common approach on European level for demonstrating the safety levels of the railway system using common methods and safety tar-gets. Criteria for assessment of results from PSA level 2 Criteria related to large release frequency are a surrogate to the societal risk level criteria. The aim of the definition for large release of the severe reactor accident is such that, first of all, the release magnitude shall be reduced to such an amount that no acute health effects are caused in the environment. It follows from this requirement that only stochastic late effects can be ex-pected. The criterion “100 TBq Cs-137” used in Finland and the differently worded but almost identical criterion “0,1 % of the core inventory of Cs-137 in an 1800 MWt BWR” used in Sweden are examples of criteria fulfilling the above requirement. Internationally, the acceptance criteria for results from level 2 PSA differ considerably between countries. Both definitions for large release and prob-ability values differ. Further, the status of criteria differs from mandatory requirements to informal targets. Some countries do not use probabilistic criteria at all. There are discussions to internationally harmonize the prob-abilistic criteria used, but so far such harmonisation cannot be expected due to different national regulatory practices. The present experience is that the Finnish and Swedish risk criteria for large release are strict when compared to the individual and societal risk otherwise accepted. They are also hard to fulfil for old reactors. Test calculations with environmental data from a Finnish nuclear power plant site shows that this particular release limit would not cause acute health effects and that late effects would be minor. Results from such assessments are strongly depend-ent on population data, weather data, and whether or not countermeasures are accounted. The benefit of the Finnish and Swedish risk criteria is that it is a single num-ber, rather easy to apply and it also controls the long term consequences of a release, i.e., not only the large early release frequency like stipulated in some other countries. From the individual risk point of view, these numbers are acceptable. To justify the target values from the societal risk point of view, realistic risk calculations of environmental consequences of release se-quences would need to be made. The issue of defining workable level 2 PSA risk criteria (and also core dam-age risk criteria) is complex, and basically concerns the more general ques-tion of how to define and justify subsidiary risk criteria. For a top down jus-tification, several references exist for societal and individual level risk crite-ria to be used as the basis, but support from a level 3 PSA type of calcula-tions is also judged to be needed. From a bottom-up justification, experience
88

from present PSAs may help understanding which kind of system reliability, CDF and LRF values can be achieved with different designs, thus also pro-viding a link to deterministic design criteria. Experience from present PSAs may also help understanding how limitations and uncertainties of PSA can affect the result. It is generally recognised that it is a good practice to have both CDF and LRF criteria in order to cover several (at least two) levels of defence-in-depth. In the hypothetical case where the assessed CDF is below the LRF criterion, the requirement on the reactor containment should be expressed with a differential criterion. The probabilistic criteria do not thus supersede the deterministic defence-in-depth and other fundamental design criteria. Consistency in the usage of probabilistic safety criteria Consistency in judgement over time has been perceived to be one of the main problems in the usage of probabilistic safety criteria. Criteria defined in the 80ies were met in the beginning with PSA:s performed to the standards of that time, i.e., by PSA:s that were quite limited in scope and level of detail compared to today’s state of the art. This issue was investigated by performing a comparative review was per-formed of three generations of the same PSA (1994, 2000, 2006), focusing on the impact from changes over time in component failure data, initiating event frequency, and modelling of the plant, including plant changes and changes in success criteria. It proved to be very time-consuming and in some cases next to impossible to correctly identify the basic causes for changes in PSA results. A multitude of different sub-causes turned out to combined and difficult to differentiate. Thus, rigorous book-keeping is needed in order to keep track of how and why PSA results change. This is especially important in order to differentiate “real” differences due to plant changes and updated reliability data from differences that are due to general PSA development. Implemented plant changes often have a considerable influence on the re-sults and lead to lower CDF. Some of these changes are introduced because incidents have shown that systems do not work as previously assumed and modelled in the PSA, e.g., the many plant changes made after the strainer incident in Barsebäck. For these plant changes previous PSA versions have erroneously assumed correct function. To be able to see the actual safety impact of such plant changes, it would be necessary to backtrack the change in previous versions of the PSA. Backtracking shows that some plant changes of this type are of major importance to plant safety. Changes in success criteria have high importance for the results. Backtrack-ing of the success criteria from the latest model version to previous models shows that the results vary considerably with changes in the success criteria. Modelling of CCF, both regarding method and data, is also of high impor-
89

tance and is one of the major contributing factors to the changes in the CDF between the different PSA generations. The reliability data used in the PSA from year 1994 is mainly from the T-book version 3 the PSA from 2000 and 2006 uses reliability data from the T-book version 5. Based on the limited analysis performed it is not possible to conclude if the results are generally higher or lower because of the change of data source. The level of detail in the three generations of the PSA has increased over the years. The number of basic events, initiating event, event trees and fault trees generally has increased with each model. The general experience from PSA modelling seems to be that a more detailed and complex model leads to a higher CDF because of more dependencies are introduced in the PSA. How-ever, even if the modelling of the electrical systems have become more and more detailed, the CDF due to failures in the electrical systems is on the same level of magnitude for all three PSA generations. One conclusion that can be drawn regarding the level of detail for the modelling is that the intro-duction of common cause initiators (CCI) results in higher CDF. Regarding comparison of PSA results between two different plants, it is con-cluded that such comparison is normally not meaningful. A PSA is an enor-mous mathematical model based on technical descriptions of systems, ex-perience and data, interpretations of data, engineering judgements and use of various physical models. The analysis process is sensitive to many factors, and it requires a very deep knowledge of the PSA:s to make a relevant com-parison. If comparability is considered a desirable property of PSA, the methodology for performing PSA:s should be harmonised. Examples of ar-eas for harmonisation are presentation of results, presentation of methods, scope, main limitations and assumptions, definitions of end states (core damage or release categories), definitions of initiating events, and definitions of common cause failures. Handling of uncertainties The major underlying obstacle in the use of safety goals are the uncertainties of PSA. Differences in the scope of PSA, and different methods used in dif-ferent parts of PSA make consistent comparisons of risks difficult. Uncer-tainties of PSA is one of the reasons why one should be cautious when mak-ing interpretations about the safety and when applying numerical risk criteria for such purposes. The recommended way to handle the uncertainty problem is to put emphasis on the justification of PSA results and conclusions. This implies explicit presentation of claims, arguments and the underlying evidence, in order to convince the reviewer of the conclusions that the plant is safe enough. Thor-ough analysis of various risk importances as well as qualitative analysis of
90

uncertainties included with sensitivity studies are helpful in the interpretation of the results. An essential factor in the definition of risk criteria is the usage aspect. Risk criteria can be used in different context, and therefore different risk criteria may need to be defined. Two main usage areas are
As limits for licensing of new reactors
As targets for operating plants to support interpretation of results and deci-sion making on plant modifications.
This means that definitions for safety goals and associated numerical risk criteria cannot be discussed without, at the same time, discussing require-ments on the scope of the risk analysis, usage of risk analysis and application of risk criteria. Harmonisation of the safety goals There seems to be a willingness to internationally harmonise the probabilis-tic safety criteria, while at the same time it is recognised that the national regulatory requirements are still quite different, e.g., with respect to per-formance and application of PSA. A major underlying obstacle in the use of safety goals are the uncertainties of PSA. As the joint European regulatory guidelines document describes [WENRA-2010 and WENRA_RHWG_2009], two arguments were put forward not to adopt a common target: 1) in some countries, this value is considered as being al-ready reached by some existing reactors, 2) the methodologies to calculate the CDF may differ from one country to another. Despite the obstacles to reaching harmonised criteria, the PSA community is willing to jointly develop the criteria and to find better justification of the numbers and definitions used. With respect to core damage risk criteria, the consensus is quite close. The large release risk related criteria need still dis-cussions and back-upping calculations to make the link to the individual and societal risk more transparent.
91

9. REFERENCES 2004/49/EC European Parliament and Council; Directive on safety on
the Community’s railways, licensing of railway undertak-ings, allocation of railway infrastructure capacity, levying of charges for the use of railway infrastructure, and safety certification. (Railway Safety Directive); DIRECTIVE 2004/49/EC OF THE EUROPEAN PARLIAMENT AND OF THE COUNCIL of 29 April 2004; European Parlia-ment and Council; 2004
2006/860/EC EU; Technical specification for interoperability relating to the control-command and signalling subsystem, 2006/860/EC; EU; 2006
Ale_2002 Ale, B.J.M.; Risk assessment practices in The Nether-lands; Safety Science, Volume 40, Number 1, February 2002, pp. 105-126(22).; 2002
Aven_RESS_90(2005) Aven, T., Vinnen, J.-E.; On the use of risk acceptance criteria in the offshore oil and gas industry; Reliability Engineering and System Safety, 90 (2005): 15-24.; 1977
Bengtsson_2010 Bengtsson, Lisa; Consistency in the Usage of Safety Goals; Scandpower Report 32.800.068-R-004; Scand-power; 2010
Beroggi_1997 Beroggi, G.E.G., Abbas, T., Stoop, J., Aebi, M; Risk Assessment in the Netherlands; Akademie für Technikfol-genabschätzung in Baden Württemberg, No. 91, Novem-ber 1997, ISBN 3 932013-14-x, ISSN 0945-9553.; 1997
BNS I.4.2/2006 BNS; Requirements for PSA performance.; Nuclear Regu-latory Authority of the Slovak Republic BNS I.4.2/2006; BNS; 2006
Bottleberghs_2000 Bottleberghs, P. H.; Risk analysis and safety policy devel-opments in the Netherlands; Journal of Hazardous Materi-als, Volume 71, Number 1, 7 January 2000, pp. 59-84(26).; 2000
Davidson_1997 Davidson, G., M., Lindgren, M., Mett, L.; Värdering av risk (Valuation of risk); Räddningsverket – Risk- och miljöavdelningen, Karlstad, Report no. P21 – 182/97.; Räddningsverket; 1997
EN_50129 Railway applications – Communication, signalling and processing systems – Safety related electronic systems for signalling; EN 50129
92

ERA_2009 European Rail Agency; Recommendation on the 1sI set of Common Safety Targets as referred to in Article 7 of Directive 2004/49IEC; European Rail Agency; 2009
ETCS_subset-088 ETCS Application Level 2 – Safety Analysis, Part 1 – Functional Fault Tree, subset-088, part 1
EUR_2002 EUR; European Utility Requirement for LWR Nuclear Power Plants; EUR European Utility Requirement for LWR Nuclear Power Plants; EUR; 2002
Gmünder Gmünder, F.K., Meyerm P., Shiess, M.; The Control of Major Chemical Hazards in Switzerland in the framework of sustainable development – Liquefied Petroleum, Am-monia and Chlorine as Examples.
He_2007 He, X; Risk Acceptance Criteria in the Offshore Oil and Gas Industry; Scandpower report 32.8200.2003-R-2002; Scandpower; 2007
HSE_2004 HSE; Guidance on ‘as low as reasonably practicable’ (ALARP) decision in Control Of Major Accident Hazards (COMAH); SPC/Permissioning/12; HSE; 2004
HSE_APOSC HSE; Assessment principles for offshore safety cases (APOSC); HSE 2006; HSE; 2006
HSE_R2P2 HSE; Reducing Risks, Protecting People. UK HSE’s decision making process [R2P2]; HSE Books 2001, ISBN 0 7176 2151 0.; HSE; 2001
HSE_SCR_3117 HSE; The Offshore Installations (Safety Case) Regula-tions 2005; UK Statutory Instrument 2005 No. 3117; HSE; 2005
HSE_SCReq_2/2006 HSE; Offshore Installations (Safety Case) Regulations 2005 Regulation 12 Demonstrating compliance with the relevant statutory provisions; HSE Offshore Information Sheet No. 2/2006; HSE; 2006
IAEA_GS-R-2 IAEA; Preparedness and response for a nuclear or radio-logical emergency.; International Atomic Energy Agency. Safety Standards Series No. GS-R-2. IAEA, 2002, Vi-enna.; IAEA; 2002
IAEA_INES INES — The international nuclear and radiological event scale; INES-The international nuclear and radiological event scale; IAEA/OECD
93

IAEA_INSAG-10 IAEA; Defence in Depth in Nuclear Safety INSAG-10; IAEA Safety Series No. 75-INSAG-10. ISBN 92-0-103295-1; IAEA; 1996
IAEA_INSAG-12 IAEA; Basic Safety Principles for Nuclear Power Plants. 75-INSAG-3 Rev. 1. INSAG-12; IAEA Safety Series No. 75-INSAG-12. ISBN 92–0–102699–4; IAEA; 1999
IAEA_INSAG-3 IAEA; Basic Safety Principles for Nuclear Power Plants. 75-INSAG-3; IAEA Safety Series No. 75-INSAG-3; IAEA; 1988
IAEA_SRS_12 IAEA; Evaluation of the Safety of Operating Nuclear Power Plants Built to Earlier Standards - A Common Basis for Judgement; IAEA Safety Reports Series No. 12, ISBN 92-0-104498-4; IAEA; 1998
ICRP-60 ICRP, 1991b. 1990 Recommendations of the International Commission on Radiological Protection. ICRP Publica-tion 60, Ann. ICRP 21 (1–3).
ICRP_82 ICRP; Protection of the Public in Situations of Prolonged Radiation Exposure; ICRP Publication 82. Ann. ICRP 29 (1-2).; ICRP; 1999
IEC 62278 Railway applications – Specification and demonstration of reliability, availability, maintainability and safety (RAMS); 1999
IEC_61508 IEC; Functional safety of electri-cal/electronic/programmable electronic safety-related systems; IEC-61508; IEC
Ilvonen_1994 Ilvonen, M; Software development of models that simu-late the dispersion of atmospheric radioactive releases and predict the resulting radiation doses; Thesis of diploma, HUT, Information technology; HUT (Helsinki University of Technology; 1994
Jonkman_2003 Jonkman, S.N., van Gelder P.H.A.J.M., Vrijling, J.K.; An overview of quantitative risk measures for loss of life and economic damage; Journal of Hazardous Materials, Vol-ume 99, Number 1, 4 April 2003, pp. 1-30(30).; 2003
Kafka_1999 Kafka, P.; How safe is safe enough? – An unresolved issue for all technologies; Safety and Reliability, Proceed-ings of ESREL99, Rotterdam, 1999.
94

Kirchsteiger_1999 Kirchsteiger, C.; On the use of probabilistic and determi-nistic methods in risk analysis; Journal of Loss Preventa-tion in the Process Industries; Volume 12, Issue 5, Sep-tember 1999, pp. 399-419; 1999
NEA/CSNI/R(2009)16 Hessel, P. et.al.; Probabilistic Risk Criteria and Safety Goals; NUCLEAR ENERGY AGENCY COMMITTEE ON THE SAFETY OF NUCLEAR INSTALLATIONS; NEA; 2009
NKS-153 Holmberg, J-E; Knochenhauer, M; Probabilistic Safety Goals. Phase 1 - Status and Experiences in Sweden and Finland; NKS-153 ISBN 978-87-7893-216-7; NKS; 2007
NKS-36 Holmberg, J., Pulkkinen, U.; Experience from the com-parison of two PSA-studies; Report NKS:36, 2001. Nord-isk kernesikkerhedsforskning NKS, Roskilde. ISBN 87-7893-087-1; NKS; 40
NORSOK-Z-013 Risk and emergency preparedness analysis; NORSOK Standard Z-013 Rev.2; 2001
NPD_Manreg_2002 NPD; Regulations relating to management in the petro-leum activities (The MANAGEMENT REGULATIONS); http://www.npd.no/regelverk/r2002/frame_e.htm; NPD; 2002
NSC_2006 NSC; Report on Performance Goals for Light Water Power Reactors, - on performance goals consistent with safety goals - (in Japanese); Special Committee on Nu-clear Safety Goals of NSC, March 2006.; NSC; 2006
NUREG-0880 USNRC; Safety Goals for Nuclear Power Plants: A Dis-cussion Paper," U.S. Nuclear Regulatory Commission, February 1982, (Rev. 1); NUREG-0880. Safety Goals for Nuclear Power Plants: A Discussion Paper," U.S. Nuclear Regulatory Commission, February 1982, (Rev. 1) May 1983.; USNRC; 1982
OLF_070 OLF 070; Application of IEC 61508 and IEC 61511 in the Norwegian Petroleum Industry; OLF
Persson_2007 Persson, A; Risk Acceptance Criteria) in the European Railway Industry; Scandpower report 32.8200.2003-R-2001; Scandpower; 2007
95

Pfitzer_2004 Pfitzer, B., Hardwick, M., Pfitzer, T.; A Comparison of QRA Methods used by DOD for Explosives and Range Safety with Methods used by NRC and EPA; Presentation at the 22nd International System Safety Conference, Au-gust 2004.; 2004
Rechard_1999 Rechard, R. P.; Historical relationship between perform-ance assessment for radioactive waste disposal and other types of risk assessment; Risk Analysis 19 5 (1999), pp. 763-807.; 1999
RESS_80(2003)143 Saji, G; A new approach to reactor safety goals in the framework of INES; Reliability Engineering and System Safety 80(2003)143–161; 2003
Rossi_2007 Rossi, J.; Evaluation of the level 3 PSA safety goal.; Re-port VTT-R-04585-07; VTT; 2007
SKI_2007:06 Holmberg, J-E; Knochenhauer, M; Probabilistic Safety Goals. Phase 1 - Status and Experiences in Sweden and Finland; SKI Research Report 2007:06; -; 2007
SKI_SSI_1985 SKI / SSI; Utsläppsbegränsande åtgärder vid svåra härdhaverier; SKI ref 7.1.24 1082/85; SKI / SSI; 1985
SSM_2010:36 Holmberg, J-E; Knochenhauer, M.; Guidance for the Definition and Application of Probabilistic Safety Criteria; SSM Research Report 2010:36; 2011
STUK_YVL-2.8 STUK; Probabilistic safety analysis in safety management of nuclear power plants; Guide YVL-2.8. ISBN 951-712-786-3; STUK; 2003
STUK_YVL-7.2 Assessment of radiation doses to the population in the environment of a nuclear power plant; Guide YVL-7.2 ISBN 951-712-530-5; 1997
Ter_Bekke_2006 Ter Bekke, E.C.A.; Risk Criteria – Background Informa-tion for Maritime Decision Makers; TU Delft; 2006
Trbojevic_2004 Trbojevic, V.M.; Risk Criteria in the UK and EU; Work-shop on ALARP and Societal Risk, Loughborough Uni-versity, 15 September 2004.; 2004
Trbojevic_2005 Trbojevic, V.M.; Risk Criteria in EU; ESREL’05, Poland, 27-30 June 2005.; 2005
UNISIG_Class1 UNISIG; A number of draft (unofficial) documents pro-duced during work with the UNISIG Class 1 specifica-tions and ESROG Report.; UNISIG;
96
97
USNRC 1990 USNRC; Reactor Risk Reference Document; Final Sum-mary Report, NUREG-1150, Vol. 1.; USNRC; 1990
USNRC SECY-01-0009
USNRC; Modified Reactor Safety Goal Policy Statement; USNRC SECY-01-0009; USNRC; 2001
VnA 733/2008 The Council of State; Government Decree (733/2008) on the Safety of Nuclear Power Plants, Finland; 2008
VnP 395/1991 The Council of State, Finland; Decision of the Council of State on the general regulations for the safety of nuclear power plants; Finnish Government Resolution (395/1991); The Council of State, Finland; 1991
WENRA_2010 WENRA; WENRA statement on safety objectives for new nuclear power plants; WENRA_2010; WENRA; 2010
WENRA_RHWG_2009 WENRA; Safety Objectives for New Power Reactors - Study by WENRA Reactor Harmonization Working Group; WENRA_RHWG_2009; WENRA; 2009

Attachment 1. Safety goals and PSA risk criteria defined by nuclear safety au-thorities
Country Safety goals PSA risk criteria Canada Canadian Nuclear Safety Commis-sion
(i) Prevent unreasonable risk, to the environment and to the health and safety of persons, associated with that development, production, possession or use, (ii) Prevent unreasonable risk to national security associated with that development, production, possession or use, [Nuclear Safety and Control Act] i) Individual members of the public shall be provided a level of protection from the consequences of nuclear power plant operation such that there is no significant additional risk to the life and health of individuals, and ii) Societal risks to life and health from nuclear power plant operation shall be comparable to or less than the risks of generating electricity by viable competing technologies, and should not be a significant addition to other societal risks. [Regulatory Document RD-337]
i) Small Release Frequency, The sum of frequencies of all event sequences that can lead to release to the environment of more than 1015 Bq of I-131 should not exceed 10-5 per plant year. ii) Large Release Frequency The sum of frequencies of all event sequences that can lead to release to the environment of more than 1014 Bq of Cs-137 should not exceed 10-6 per plant year. iii) Core Damage Frequency The sum of frequencies of all sequences that can lead to significant core degradation should not exceed 10-5 per plant year. [Regulatory Document RD-337]

99
Country Safety goals PSA risk criteria Finland Radiation and Nuclear Safety Authority
Occupational radiation exposure of nuclear power plant workers shall be kept as low as reasonably achievable. Furthermore, the design and operation of nuclear power plants shall be implemented so that the radiation expo-sure of workers can be restricted in compliance with the provisions of the Radiation Act (592/1991) and Radia-tion Decree (1512/1991). The limit for the annual dose of an individual in the population, arising from the normal operation of a nuclear power plant, is 0.1 millisievert (mSv). Based on this limit, the Radiation and Nuclear Safety Authority (STUK) shall confirm release limits for radioactive materials during the normal operation of a nuclear power plant. The limit for the annual dose of an individual in the population arising as the result of an anticipated operational occurrence is 0.1 mSv. A postulated accident and a design extension condition shall not result in such high releases of radioactive mate-rials that extensive measures should have to be taken in the vicinity of the facility in order to limit the radiation exposure of the population. The limit for the annual dose of an individual in the population arising as the result of an accident is - 1 mSv for Class 1 postulated accidents; - 5 mSv for Class 2 postulated accidents; and - 20 mSv for a design extension condition. The limit for the release of radioactive materials arising from a severe accident is a release which causes neither acute harmful health effects to the population in the vicinity of the nuclear power plant, nor any long-term re-strictions on the use of extensive areas of land and water. The requirement applied to long-term effects will be satisfied if there is only an extremely small possibility that, as the result of a severe accident, atmospheric release of cesium-137 will exceed the limit of 100 terabecquerel (TBq). [VnA 733/2008] The safety level of a nuclear power plant shall be raised as high as practicable to achieve the objectives presented in section 6 of the Nuclear Energy Act and in section 3 of the Council of State Decision (395/1991). The more severe an accident's consequences to man, the environment and property could be, the smaller the likelihood of its occurrence shall be. [Guide YVL 1.0, Ch. 3]
The following numerical design objectives cover the whole nuclear power plant: - The mean value of the probability of core damage is less than 1E–5/a. - The mean value of the probability of a release exceeding the target value defined in section 12 of the Government Resolution (395/1991) must be smaller than 5E–7/a . Should substantial risk factors not recognised earlier appear during operation, the licensee shall upgrade the safety of the plant. In conjunction with the design of safety upgrades the licensee shall demonstrate that the safety of the plant assessed after the upgrades is substantially at the same level or better than the objectives presupposed for the design phase. [Guide YVL 2.8, Ch. 2.1]

100
Country Safety goals PSA risk criteria Hungary Hungarian Atomic Energy Authority
It is a general nuclear safety objective that the protection of individuals and groups of the population as well as that of the environment has to be in place against the dangers of ionising radiation. This has to be ensured by effective protection and its appropriate level maintenance within the nuclear power plant. [Vol. 3 of the Nuclear Safety Codes issued by the Hungarian Governmental Decree No. 89/2005 in paragraph 2.002] It is a radiation protection objective that the exposure of the operating personnel and the population during the operation of the nuclear power plant has to be kept under the prescribed limit, and at the reasonably achievable lowest level. This has to be ensured in cases of exposure during design malfunctions (Anticipated Operational Occurrence and Design Basis Accidents) and the exposure has to be reduced to a reasonably possible extent during severe operational accidents (Beyond Design Basis Accidents). [Vol. 3 of the Nuclear Safety Codes issued by the Hungarian Governmental Decree No. 89/2005 in paragraph 2.003] It is a technical safety objective that operational incidents have to be prevented to a reasonable extent, the possi-ble consequences considered in the design phase of the facility as anticipated initiating event have to be within the prescribed limit and that the probability of accidents has to be reasonably low. [Vol. 3 of the Nuclear Safety Codes issued by the Hungarian Governmental Decree No. 89/2005 in paragraph 2.004]
During the probabilistic safety assessment of the nuclear power plant design it has to be an objective that the core damage frequency coming from the level 1 PSA taking into account all anticipated initiating events and design malfunction, as an annual average should not be higher than 10-5/year, and in any planned operating condition of the nuclear power plant, within the lifecycle of the operations the core damage frequency should not exceed the 5×10⁻⁴/year average value. [Volume 3 of the Nuclear Safety Codes in paragraph 3.072]
Japan The Japanese Nuclear Safety Commission
The likelihood of occurrence of health detriment to the pubic due to emission of radiation or release of radioac-tive materials from activities for nuclear energy utilization should be controlled to such a level that members of the public bear no significant additional risk to their daily life. The average risk of early fatality for members of the public in the vicinity of the site boundary of a nuclear facility due to radiation exposure from nuclear accidents should not exceed approximately one in 1000000 a year. The average risk of cancer fatality for members of the public within a certain distance from a nuclear facility due to radiation exposure from nuclear accidents should not exceed approximately one in 1000000 a year. [NSC_2006]
Core Damage Frequency (CDF): approximately 10-4 per reactor year Containment Failure Frequency (CFF): approximately 10-5 per reactor year Both of the two goals are required to be met at the same time for all events including internal and external initiating events. [NSC_2006]
Korea The Korean Nu-clear Safety Commission
The main objectives of the policy on severe accident are to assure that the possibility of a severe accident occur-rence is extremely low and its risk to the public is sufficiently reduced. The prompt fatality risk resulting from the accidents to an average individual in the vicinity of a NPP should not exceed one-tenth of one percent of the sum of those risks resulting from other accidents which members of the population might generally be encountered. The cancer fatality risk resulting from nuclear power plant operation to the population in the area near a NPP should not exceed one-tenth of one percent of the sum of cancer fatality risks resulting from all other causes. [Policy on Severe Accident in 2001]
The performance goals (Core Damage Frequency, Large Containment Release Frequency) should be established in near future, and so far the official Probabilistic Risk Criteria does not exist in Korea. Tentative criteria are: - CDF for existing plants and life extension : less than 1E-04/ry - CDF for new plants : less than 1E-05/ry - LERF for existing plants and life extension, : less than 1E-05/ry - LERF for new plants : less than 1E-06/ry

101
Country Safety goals PSA risk criteria Slovakia Nuclear Regula-tory Authority of the Slovak Repub-lic
Protect the public and the environment from unreasonable risk. For existing plants. Criteria for the new plant are lower by one order of magnitude Large early release: Significant, or large release is defined through the release of Cs -137. Early release is the release of fission products before applying the offside protective measures. Target f < 10-5 per year [BNS I.4.2/2006]
Sweden SSM (previous SKI)
The focus of the SKI is on avoidance of radiological accidents, i.e., safety goals are directed towards protection of the public rather than towards avoidance of core damage. Long-term ground contamination of large areas shall be avoided. This is judged to be fulfilled if the radioactive release after a severe accident is limited to below 0,1 % of the inventory of the caesium isotopes Cs-134 and Cs-137 in a core of 1800 MW, excluding noble gases. There shall be no short-term fatalities in acute radiation syndrome. This is judged to be fulfilled if the radioactive release after a severe accident is limited to below 1 % of the inventory of a core of 1800 MW, excluding noble gases. The radioactive release after a severe accident is limited to below 0,1 % of the inventory of the caesium isotopes Cs-134 and Cs-137 in a core of 1800 MW, excluding noble gases. The radioactive release after a severe accident is limited to below 1 % of the inventory of a core of 1800 MW, excluding noble gases . Release of more than 0,1 % of the inventory of Cs-134 and Cs-137 in a core of 1800 MWt shall be ”extremely unlikely” (Interpreted as < 1E-7 per year). The containment shall remain intact for 10-15 hours after a core melt. This requirement implies that the core that mitigating measures protecting the containment from over-pressurisation and by-pass shall be designed in a way that practically eliminates the possibility of early releases. A number of acceptance criteria for the mitigating systems after a severe accident are defined: Events with ex-tremely low probabilities (extremt låga sannolikheter) can be neglected. It is accepted that the filtered venting system cannot handle a reactor vessel rupture. [SKI_SSI_1985]
“Extremely unlikely” interpreted as 10-7 per year Release of more than 0,1 % of the inventory of the caesium isotopes Cs-134 and Cs-137 in a core of 1800 MWt shall be ”extremely unlikely” (Interpreted as < 10-7 per year). [SKI_SSI_1985]
Switzerland HSK
General qualitative requirements on the safety level are expressed by the term safety and not by risk. Risk is considered only as one element of the safety. An overall qualitative safety requirement is that in the utilisation of nuclear energy, human beings and the environment must be protected against harm due to ionising radiation. The nuclear energy law requires that sufficient preventive and mitigative measures shall be considered in order to ensure the safety of nuclear power plants in Switzerland. In order to demonstrate that sufficient measures have been taken, the accidents are categorized according to their frequencies. Dose limits are defined for accidents with frequencies larger than 10-6/yr.
The legal basis for the implementation of PSA in the regulatory safety oversight process is defined in the nuclear energy law and an accompa-nying nuclear energy ordinance in Switzerland. The ordinance stipu-lates that for the construction permit of a new nuclear power plant, the applicant is required to demonstrate that the core damage frequency is below 10-5 per year. This risk criterion is also expected to be fulfilled by the existing plants, to the extent that is reasonably achievable. Risk criteria for assessment of operational events and determination of safety significance of active components are under discussion.

102
Country Safety goals PSA risk criteria UK HMI
Protection must be optimized to provide the highest level of safety that is reasonably practicable. Limitation on risks to individuals: “Measures for controlling radiation risks must ensure that no individual bears an unacceptable risk of harm” Prevention of accidents: “All reasonably practicable steps must be taken to prevent and mitigate nuclear or radiation accidents” Protection of present and future generations: “People, present and future, must be protected against radiation risks” HSE’s SAPs (2006 Edition) (paragraph 42)
Target 5: Individual risk of death from on-site accidents – any person on the site, and Target 7: Individual risk to people off the site from accidents - Limit 1E-4 per year - Objective 1E-6 per year Target 6: Frequency dose targets for any single accident – any person on the site, and Target 8: Frequency dose targets for accidents on an individual facility – any person off the site
On site, mSv Off-site, mSv Limit Objective 2–20 0,1–1 1E-1
1E-2
20–200 1–10 1E-2
1E-4 200–2000 10–100 1E-3
1E-5
>2000 >100 1E-4 1E-6 Target 9: Total risk of 100 or more fatalities - Limit 1E-5 per year - Objective 1E-7 per year The targets are not mandatory but, rather, they are guides to inspectors to indicate where there is the need for consideration of additional safety measures.
USA U.S.NRC
Individual members of the public should be provided a level of protection from the consequences of nuclear power plant operation such that individuals bear no significant additional risk to life and health. Societal risks to life and health from nuclear power plant operation should be comparable to or less than the risks of generating electricity by viable competing technologies and should not be a significant addition to other socie-tal risks. The risk to an average individual in the vicinity of a nuclear power plant of prompt fatalities that might result from reactor accidents should not exceed one-tenth of one percent (0.1%) of the sum of prompt fatality risks resulting from other accidents to which members of the U.S. population are generally exposed. The risk to the population in the area near a nuclear power plant of cancer fatalities that might result from nu-clear power plant operation should not exceed one-tenth of one percent (0.1%) of the sum of cancer fatality risks resulting from all other causes. [NRC’s Severe Accident Policy Statement, 1986] [USNRC SECY-01-0009]
NRC, Safety Goal Policy StatementAlthough not part of the Safety Goals, the NRC established measures for core damage frequency (CDF) and large early release frequency (LERF) that are widely used to evaluate the safety of operating nuclear power plants. The CDF measure is 1E-04 and the LERF measure is 1E-05. Using the vast body of severe accident progression and PRA re-search that has been performed for current LWRs, it has been calculated that satisfying these measures will almost certainly satisfy the Safety Goals. [Appendix D to NUREG-1860]

Country Safety goals PSA risk criteria IAEA International Atomic Energy Agency
To protect individuals, society and the environment by establishing and maintaining in nuclear power plants an effective defence against radiological hazard. To ensure in normal operation that radiation exposure within the plant and due to any release of radioactive material from the plant is as low as reasonably achievable, economic and social factors being taken into account, and below prescribed limits, and to ensure mitigation of the extent of radiation exposure due to accidents. To prevent with high confidence accidents in nuclear plants; to ensure that, for all accidents taken into account in the design of the plant, even those of very low probability, radiological consequences, if any, would be minor; and to ensure that the likelihood of severe accidents with serious radiological consequences is extremely small. [IAEA_INSAG-12]
The target for existing nuclear power plants consistent with the techni-cal safety objective is a frequency of occurrence of severe core damage that is below about 10–4 events per plant operating year. Severe acci-dent management and mitigation measures could reduce by a factor of at least ten the probability of large off-site releases requiring short term off-site response. Application of all safety principles and the objectives of paragraph 25 to future plants could lead to the achievement of an improved goal of not more than 10–5 severe core damage events per plant operating year. Another objective for these future plants is the practical elimination of accident sequences that could lead to large early radioactive releases, whereas severe accidents that could imply late containment failure would be considered in the design process with realistic assumptions and best estimate analyses so that their conse-quences would necessitate only protective measures limited in area and in time. [IAEA_INSAG-12]
EUR European Utility Requirements
The general objective of nuclear safety is to protect individuals, society and the environment by establishing and maintaining an effective defence against radiological hazards. radiological consequences, if any, would be minor. To ensure that in normal operation, radiation exposure within the plant and radiation doses due to any release of radioactive material from the plant are kept As Low As Reasonably Achievable (ALARA) and below prescribed limits. To ensure that, for all accidents addressed in the design of the plant, radiological consequences, if any, would be minor.
A Core Damage cumulative frequency of less than 10-5 per year and, A cumulative frequency of less than 10-6 per year of exceeding the Criteria for Limiting Impact*, A significantly lower cumulative frequency to get either earlier or much larger releases. These frequency targets shall include shutdown states which have been shown to be a significant contributor in assessments of present reactor designs. * Criteria for limiting impact (CLI): An acceptance criterion, given by a comparison of a linear combination of families of isotope releases, versus a maximum value. Each criterion is associated with a specific kind of limited consequence to the public. [EUR_2002]
103


Bibliographic Data Sheet NKS-226 Title Probabilistic Safety Goals for Nuclear Power Plants; Phases 2-4 / Final
Report
Author(s) Lisa Bengtsson 1, Jan-Erik Holmberg 2, Jukka Rossi 2, Michael Knochenhauer 1
Affiliation(s) 1 Scandpower AB, Sweden 2 VTT, Finland
ISBN 978-87-7893-296-9
Date May 2011
Project NKS-R / SafetyGoal
No. of pages 102
No. of tables 9
No. of illustrations 26
No. of references 62
Abstract Safety goals are defined in different ways in different countries and also used differently. Many countries are presently developing them in connection to the transfer to risk-informed regulation of both operating nuclear power plants (NPP) and new designs. However, it is far from self-evident how probabilistic safety criteria should be defined and used. On one hand, experience indicates that safety goals are valuable tools for the interpretation of results from a probabilistic safety assessment (PSA), and they tend to enhance the realism of a risk assessment. On the other hand, strict use of probabilistic criteria is usually avoided. A major problem is the large number of different uncertainties in a PSA model, which makes it difficult to demonstrate the compliance with a probabilistic criterion. Further, it has been seen that PSA results can change a lot over time due to scope extensions, revised operating experience data, method development, changes in system requirements, or increases of level of detail, mostly leading to an increase of the frequency of the calculated risk. This can cause a problem of consistency in the judgments.
This report presents the results from the second, third and fourth phases of the project (2007–2009), which have dealt with providing guidance related to the resolution of some specific problems, such as the problem of consistency in judgement, comparability of safety goals used in different industries, the relationship between criteria on different levels, and relations between criteria for level 2 and 3 PSA. In parallel, additional context information has been provided. This was achieved by extending the international overview by contributing to and benefiting from a survey on PSA safety criteria which was initiated in 2006 within the OECD/NEA Working Group Risk.
The results from the project can be used as a platform for discussions at the utilities on how to define and use quantitative safety goals. The results can also be used by safety authorities as a reference for risk-informed regulation. The outcome can have an impact on the requirements on PSA, e.g.,

regarding quality, scope, level of detail, and documen¬tation. Finally, the results can be expected to support on-going activities concerning risk-informed applications.
The project provides a comprehensive state-of-the-art description and has contributed to clarifying the history of safety goals both nationally and internationally, the concepts involved in defining and applying probabilistic safety criteria, and the international status and trends in general. It has identified critical issues and the main problem areas. Finally, the project provides useful recommendations and guidance on the definition and application of criteria.
Furthermore, the project makes it possible to define criteria stringently, improving the possibilities of argumentation on safety. Generally, this supports efficient use of criteria, yielding more useful PSA results. In this connection, the introduction of ALARP type criteria is judged to provide a very useful way of balancing stringency with the necessary flexibility. There is a possibility of making more active use of lower level criteria. This makes the connection to defence in depth more evident, and opens the perspective of increased control of defence in depth by use of probabilistic methods, including the use as design tools. There is an opportunity for comparison of risk of different NPPs, as well as of comparison of NPP risk with other risks in society. This is judged to provide an opportunity for improved communication on risks with non-PSA experts and with the public in general. However, a necessary condition for meaningful comparisons is to agree on the scope of PSA and methods applied.
Obviously, there will also be challenges in the future definition and application of probabilistic safety criteria. These include very general aspects, such as the interpretation of the probability, quality aspects of PSA, and the definition of meaningful and consistent risk criteria for different usages. The need and usefulness of subsidiary criteria has been stressed in the project, but there is obviously also a challenge in defining a relevant set of criteria on different levels. Defining criteria for L(E)RF is complex, especially if release criteria are defined as subsidiary for societal and individual risk. Finally, it will be a challenge to develop coherent application procedures relative to the criteria defined.
Key words Safety Goals, PSA, Safety Targets, ALARP, Decision criteria, Risk informed decision making
Available on request from the NKS Secretariat, P.O.Box 49, DK-4000 Roskilde, Denmark. Phone (+45) 4677 4045, fax (+45) 4677 4046, e-mail [email protected], www.nks.org