NJ MANUFACTURING COMPETITIVENESS. …evidence suggests strongly that physical production activities...
16
NJ MANUFACTURING COMPETITIVENESS
-
Upload
beatrice-edwards -
Category
Documents
-
view
223 -
download
0
Transcript of NJ MANUFACTURING COMPETITIVENESS. …evidence suggests strongly that physical production activities...

NJ MANUFACTURING COMPETITIVENESS

…evidence suggests strongly that physical production activities account for a diminishing share of the final value of manufactured products, with service-related inputs such as research, product design, and marketing becoming more important.
Further, the production of many goods is dispersed across multiple locations along global supply chains, making it difficult to determine where value is added. Such shifts pose a challenge to efforts to capture economic value by promoting goods production in the United States.
http://forbes.house.gov/uploadedfiles/crs_-_hollowing_out_in_u_s__manufacturing.pdf
Proximity to market, value chain for US manufacturing
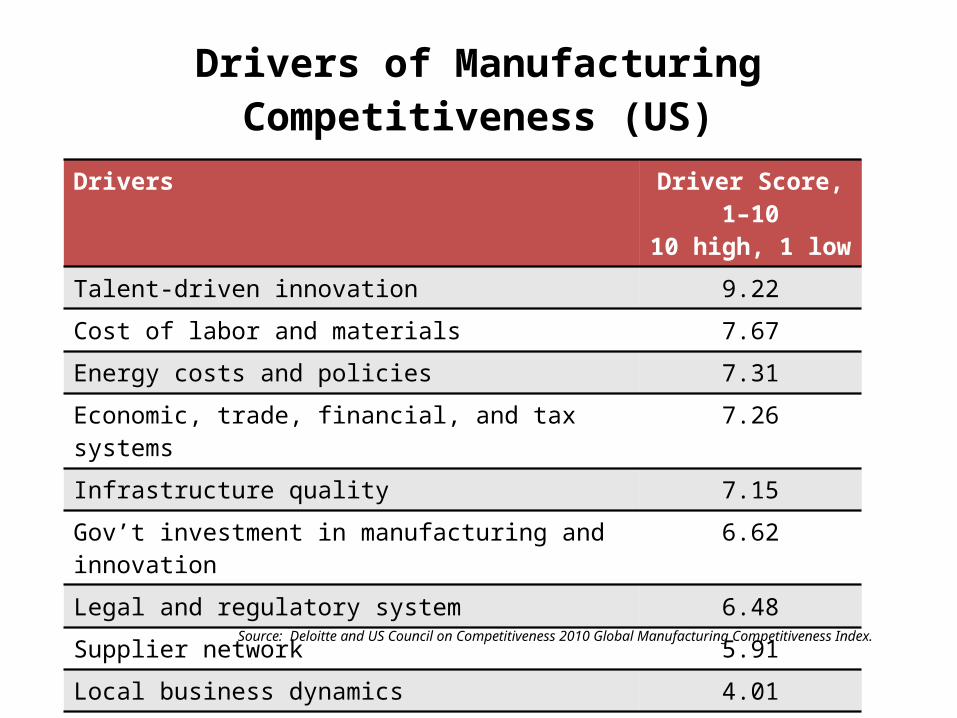
Drivers Driver Score, 1–1010 high, 1 low
Talent-driven innovation 9.22
Cost of labor and materials 7.67
Energy costs and policies 7.31
Economic, trade, financial, and tax systems 7.26
Infrastructure quality 7.15
Gov’t investment in manufacturing and innovation 6.62
Legal and regulatory system 6.48
Supplier network 5.91
Local business dynamics 4.01
Health care 1.81
Drivers of Manufacturing Competitiveness (US)
Source: Deloitte and US Council on Competitiveness 2010 Global Manufacturing Competitiveness Index.

States’ CompetitivenessOverall State Cost of
Business Workforce Quality of Life Economy Infrastructure & Transp.
Technology & Innovation Education Business
FriendlinessAccess to
Capital Cost of Living
1 Texas 28 7 35 5 1 2 26 12 8 3
16 Tennessee 27 11 48 12 4 25 41 6 29 2
4 North Carolina 21 3 26 31 11 9 13 8 18 21
28 Massachusetts 49 32 11 21 45 7 3 29 1 41
40 California 48 23 20 43 30 3 33 43 1 46
14 Indiana 16 26 40 11 18 23 25 5 37 7
17 Wisconsin 15 43 14 34 6 20 10 27 27 23
25 Ohio 6 49 44 31 10 16 23 37 17 15
30 Pennsylvania 41 48 33 26 35 5 7 30 6 32
41 New Jersey 43 28 20 39 41 13 4 48 11 45
Education: measures of K-12 education including test scores, class size and spending; considered the number of higher education institutions in each state.
Workforce: education level of their workforce, as well as the numbers of available workers; union membership. While organized labor contends that a union workforce is a quality workforce, that argument, more often than not, doesn’t resonate with business. We also looked at the relative success of each state’s worker training programs in placing their participants in jobs.
Tech & Innovation: support for innovation, the number of patents issued to their residents, and the deployment of broadband services. We also considered federal health and science research grants to the states.
CNBC Business Rankings 2012

http://www.edweek.org/ew/qc/2012/16src.h31.html?intc=EW-QC12-LFTNAV

…but NJ outmigration after high school
Total freshman enrollment in NJ institutions
Migration of students
Out of state Into state
NetCalifornia 116,252 21,997 13,502 -8,495Massachusetts 50,540 17,832 24,726 6,894
Indiana 45,913 4,802 13,386 8,584Pennsylvania 86,833 16,067 30,408 14,341
South Carolina 22,095 2,414 7,837 5,423Tennessee 29,351 5,428 7,341 1,913
New Jersey 26,223 31,510 4,167 -27,343
Source: National Center for Education Statistics http://nces.ed.gov/programs/digest/d10/tables/dt10_232.asp

…and low capacity and higher ed spendingDemand and Capacity to Serve College-Bound StudentsNet out-migration (loss) of high school graduates attending college 1stPublic four-year college/university enrollment (capacity) per capita (1,000 residents) 47thPublic four-year college/university capacity per 100 public high school graduates 49thNumber of institutions of higher education (59) 28thProjected change AY 2005-2018 in number of all high school graduates:
NJ 8.9% US 7.9%
State and Local Spending on EducationK-12 spending per pupil 2ndHigher education spending per capita 31stHigher education spending as percent of general spending 38thHigher education spending per $1,000 personal income 42ndPercentage increases in appropriations for higher education, FY 2006-FY 2011 42nd

IMPLICATIONS:Lower value-add/production workerLower ratio of managers: production workersFewer professional staffLess R&DLess investment in capital upgradesLess trainingLower wagesOEM primary customer
OEM supply chains shift starting in ‘80sUS manufacturing loses 1 million jobs.
2.5M (large firms) 1.2M (small firms)
89% of NJ’s manufacturing establishments employ 49 or fewer workers (2010) 33% of NJ’s manufacturing employees work in establishments larger than 500
employees (2010)

Business-funded R&D strong in NJ, but…
Performer: Federal FFRDCs Business R&D intensitycFunding All GDP
State source: R&D Federal Total Total GDP rank Percent Rank
Maryland 16,605 8,621 523 4,333 280,509 15 5.92 3Massachusetts 20,090 891 641 15,028 363,064 13 5.53 4New Jersey 20,713 679 78 19,054 484,332 7 4.28 7Pennsylvania 13,068 313 81 9,735 546,145 6 2.39 19U.S. totalg 403,040 29,839 14,835 290,681 14,269,835 na 2.82 na
Science and Engineering Indicators 2012
NJ R&D Federal Contracts (2011): $7.3 Billion• Lockheed Martin $2.3 billion• Mantech, SAIC www.usinnovation.org

Impact of HQ strength, hollowing out of production in NJ
• Know-how and innovation based in production• “design based production” coupling physical
production and design
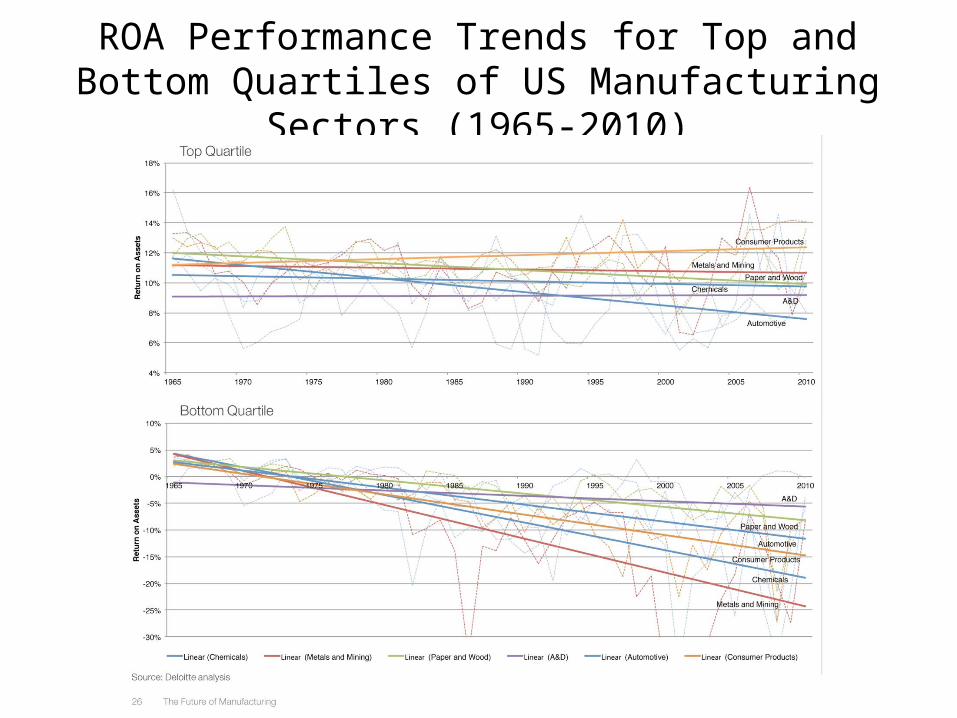
ROA Performance Trends for Top and Bottom Quartiles of US Manufacturing Sectors (1965-2010)

Long-term Topple Rate Trends by US Manufacturing Sector (1965-2010)
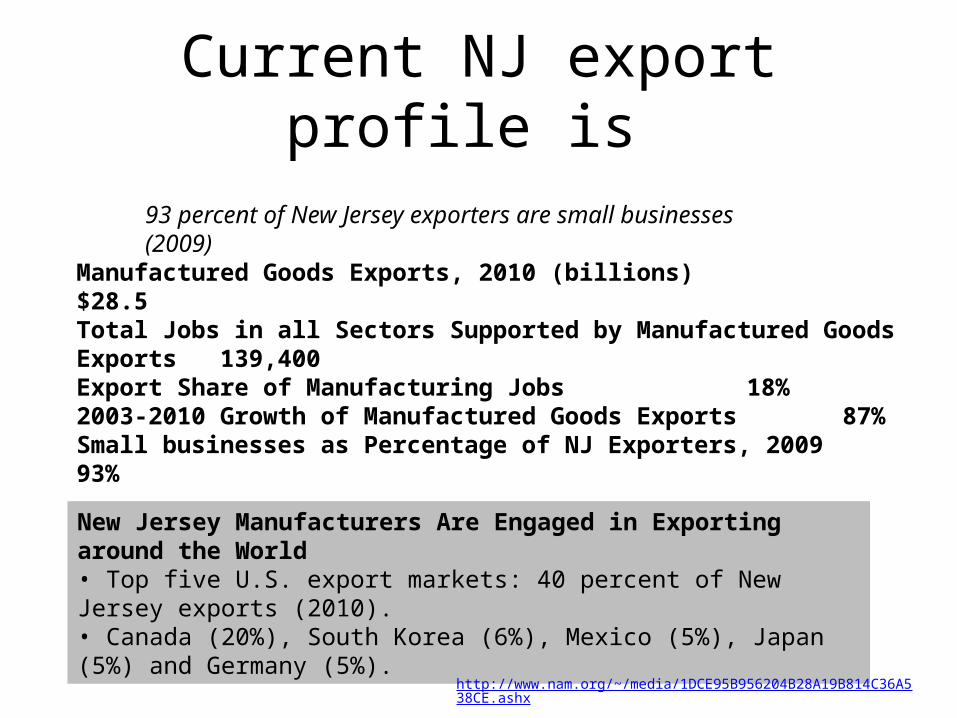
Current NJ export profile is
93 percent of New Jersey exporters are small businesses (2009)
New Jersey Manufacturers Are Engaged in Exporting around the World• Top five U.S. export markets: 40 percent of New Jersey exports (2010).• Canada (20%), South Korea (6%), Mexico (5%), Japan (5%) and Germany (5%).
Manufactured Goods Exports, 2010 (billions) $28.5Total Jobs in all Sectors Supported by Manufactured Goods Exports 139,400Export Share of Manufacturing Jobs 18%2003-2010 Growth of Manufactured Goods Exports 87%Small businesses as Percentage of NJ Exporters, 2009 93%
http://www.nam.org/~/media/1DCE95B956204B28A19B814C36A538CE.ashx

..but not aligned with growth in middle class consumption (2000-2050)
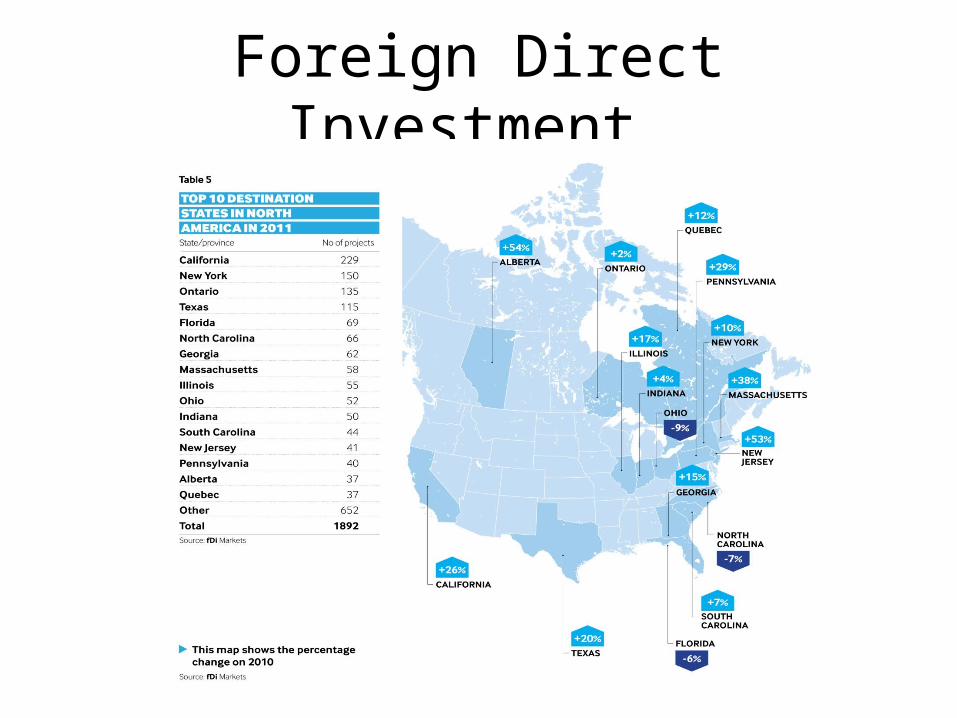
Foreign Direct Investment
New Jersey facts (2012) www.usinnovation.org
• NJ R&D Federal Contracts (2011): $7.3 Billion– Lockheed Martin $2.3 billion– Mantech, SAIC