NITROGEN CONTENT OF WHEAT AND CORN IN RESPONSE TO …
120
NITROGEN CONTENT OF WHEAT AND CORN IN RESPONSE TO THE APPLICATION OF UREA AND THE UREASE INHIBITOR N-(N-BUTYL THIOPHOSPHORIC TRIAMIDE) by Chalone S. Hefley A Thesis Submitted in Partial Fulfillment of the Requirements for the Degree MASTERS OF SCIENCE Major Subject: Plant, Soil and Environmental Science West Texas A&M University Canyon, Texas August 2016
Transcript of NITROGEN CONTENT OF WHEAT AND CORN IN RESPONSE TO …

NITROGEN CONTENT OF WHEAT AND CORN IN RESPONSE TO THE
APPLICATION OF UREA AND THE UREASE INHIBITOR
N-(N-BUTYL THIOPHOSPHORIC TRIAMIDE)
by
Chalone S. Hefley
A Thesis Submitted in Partial Fulfillment
of the Requirements for the Degree
MASTERS OF SCIENCE
Major Subject: Plant, Soil and Environmental Science
West Texas A&M University
Canyon, Texas
August 2016

ii
APPROVED:
Chairman, Thesis Committee Date
Member, Thesis Committee Date
Member, Thesis Committee Date
Head, Major Department Date
Dean, Academic College Date
Dean, Graduate School Date

iii
COPYRIGHT 2016
Copyright is owned by the author of the thesis. Permission is given for a copy to
be used by an individual for the purpose of research only. The thesis may not be
reproduced in any other way without the expressed written consent of the author.
iv
ABSTRACT
Increasing nitrogen (N) uptake by crops is a primary goal of many crop producers
due to the direct relationship between crop N content and higher yields. In order to
increase N uptake by crops, the application of N fertilizer, specifically urea, is often used.
However, N in the soil can be extremely volatile and is easily lost to the atmosphere
through ammonia (NH3) volatilization before it is able to be used by the intended crops.
Urease, an enzyme found in the soil, is a major facilitator of the NH3 volatilization
process. Urease inhibitors were developed in order to delay the volatilization of N from N
fertilizers, allowing more of the N to infiltrate the topsoil, thereby giving crops the
opportunity to absorb the plant available N. This study was performed in an attempt to
evaluate the effects of the urease inhibitor N-(n-butyl) thiophosphoric triamide (NBPT)
on the harvested N content of wheat (Triticum aestivum L.) and corn (Zea mays L.) in the
field. Six treatments, replicated four times each, were observed in completely randomized
field plots each measuring 3.048 X 6.096 meters. The plots were treated with compost
alone, compost treated with the NBPT-based inhibitor, N-YieldTM, urea alone, urea
treated with N-YieldTM, urea treated with another NBPT-based inhibitor, Agrotain® (Ultra
or Advanced, depending on the year), or were designated as a control group, wherein no
fertilizer or urease inhibitor was applied. Once the crops reached maturity, they were
harvested, and lab analyses were run on the dry matter harvested from each plot to
determine nutrient values. In this study, N concentrations in wheat straw ranged from

v
0.64% in the control to 1.36% in the treatment containing urea treated with the NBPT-
based inhibitor N-YieldTM, while N concentrations in wheat grain ranged from 2.09% in
the control to 3.52% in the treatment containing urea treated with the NBPT-based
inhibitor N-YieldTM. Similarly, N concentrations in the corn stover ranged from 0.81% in
the compost treatment to 1.80% in the treatment containing urea treated with the NBPT-
based inhibitor Agrotain®. However, the data analyzed in this study suggest that, in field
conditions, while the application of urea fertilizer greatly increases N concentrations in
wheat and corn, the addition of NBPT (whether Agrotain® or N-YieldTM) to urea before
field application does not significantly increase N concentrations over that of urea alone.

vi
ACKNOWLEDGMENTS
I would like to first acknowledge and thank my advisors, Dr. Marty Rhoades, Dr.
David Parker and Dr. Brock Blaser, for their knowledge, patients, encouragement, and
most of all their guiding hands throughout my college career. All three of whom are
extraordinary educators, with who I am extremely honored to be associated with. Without
their guidance, I would not have found my passion and place in this world of agriculture.
Next, I would like to thank my fellow students, specifically, Brandon Meier,
Brandon Winters, Alyssa Evalle Bello, Jody Gilchrest, Landon Canterberry and Terra
Campbell for all your help when I needed it, and didn’t, encouragement when I needed it,
and didn’t, and all your inspiration, when I needed it, and didn’t. You have all made me
laugh when I truly wanted to cry. I will never forget any of you for these reasons and so
many more.
Last, but most certainly not least, I would like to express my undying gratitude
and thanks to my family. My husband Darren, for his support both at home and school. A
truly amazing husband and father. Thank you for being mine. My children, Dawson,
Logan, and Addison. Dawson and Logan for going with me to my plots to cut weeds,
move irrigation lines, or whatever I asked of them. Addison and Logan for helping me
randomize my experiment. And, all of you for tolerating me being away from our home
so much of the time these past few years. My sister-in-law, Kristi, my father-in-law,
David, my mother, Susan, and my sister Shannon for your love and encouragement. I
could not have accomplished any of this without any of you. I love you!

vii
TABLE OF CONTENTS
CHAPTER ONE: LITERATURE REVIEW ..................................................................1
Nitrogen Uptake and Plant Growth ..................................................................................1
Nitrogen Use Efficiency ...................................................................................................2
Soil Nitrogen ....................................................................................................................3
Urea: Synthetic Nitrogen Fertilizer ..................................................................................5
Urease ...............................................................................................................................6
Nitrogen Losses ................................................................................................................6
Mitigation of N Losses .....................................................................................................9
N-(n-butyl) Thiophosphoric Triamide (NBPT) ..............................................................10
Mode of Action for NBPT: NBPTO ......................................................................11
Research Objectives .......................................................................................................11
CHAPTER TWO: WHEAT EXPERIMENT ...............................................................13
Materials and Methods ...................................................................................................13
Experimental Field Site..........................................................................................13
Soil .............................................................................................................14
Soil Sampling .............................................................................................15
Treatments and Application .......................................................................15
Ground Site Preparation .............................................................................22
Wheat Crop ............................................................................................................23
Precipitation and Irrigation ....................................................................................24
Harvest Samples.....................................................................................................25
Statistical Analysis .................................................................................................27
Results and Discussion ...................................................................................................28
Nutrient Content.....................................................................................................28
Summary ................................................................................................................40
CHAPTER THREE: CORN EXPERIMENT ...............................................................41
Materials and Methods ...................................................................................................41
Experimental Field Site..........................................................................................41

viii
Soil .............................................................................................................42
Soil Sampling .............................................................................................42
2014 Treatments and Application ..............................................................43
2014 Ground Site Preparation ....................................................................47
2015 Treatments and Application ..............................................................48
2015 Ground Site Preparation ....................................................................51
Corn Crop...............................................................................................................52
Precipitation and Irrigation ....................................................................................52
Harvest Samples.....................................................................................................54
Statistical Analysis .................................................................................................55
Results and Discussion ...................................................................................................55
Biomass ..................................................................................................................55
Nutrient Content.....................................................................................................58
Soil Nitrogen ..........................................................................................................67
Nitrogen Mass Balance ..............................................................................67
Summary ................................................................................................................68
CHAPTER FOUR: CONCLUSION ..............................................................................70
Future Research ..............................................................................................................70
REFERENCES CITED ...................................................................................................72
APPENDIX A: Soil Nutrient Content Data...................................................................77
APPENDIX B: Wheat Response Data ...........................................................................85
APPENDIX C: Corn Response Data..............................................................................92
APPENDIX D: SAS Data ................................................................................................97

ix
LIST OF TABLES
TABLE PAGE
2.1 Lab analysis of compost used, retrieved from West Texas A&M
University Feed Yard compost site .................................................................. 19
2.2 Mean nutrient content percentages of 2014 wheat straw and grain
(percentages on dry weight basis) .................................................................... 38
2.3 Mean nutrient content percentages of 2015 wheat straw and grain
(percentages on dry weight basis) .................................................................... 39
3.1 Mean nutrient content of 2014 corn stover (percentage on dry weight
basis) ................................................................................................................ 59
3.2 Mean nutrient content of 2014 corn stover (percentage on dry weight
basis) ................................................................................................................ 60
3.3 Soil nitrogen mass balance for corn plots based upon N concentration
averages per treatment ..................................................................................... 67

x
LIST OF FIGURES
FIGURE PAGE
1.1 Development of the nitrogen cycle process ..................................................... 4
2.1 Arial view of West Texas A&M University Nance Ranch Field
Research Plots .................................................................................................. 14
2.2 2013-2014 wheat plot map and designated treatment applications ................. 16
2.3 Preparation of compost treated with NBPT ..................................................... 19
2.4 Preparation of compost treated with NBPT ..................................................... 20
2.5 2014-2015 wheat plot map and designated treatment applications ................. 21
2.6 Urea treatments containing NBPT (Agrotain® Advanced and N-yieldTM) ...... 22
2.7 Disking plot area prior to planting 2014-2015 wheat crop .............................. 23
2.8 Irrigation system set up for wheat field plots................................................... 24
2.9 2014 wheat harvest .......................................................................................... 26
2.10 2015 wheat harvest using meter square ........................................................... 27
2.11 2014 wheat straw N content ............................................................................. 29
2.12 2014 wheat grain N content ............................................................................. 29
2.13 2015 wheat straw N content ............................................................................. 30
2.14 2015 wheat grain N content ............................................................................. 30
2.15 2014 wheat straw P content ............................................................................. 32
2.16 2014 wheat grain P content .............................................................................. 32
2.17 2014 wheat straw K content ............................................................................. 33
2.18 2014 wheat grain K content ............................................................................. 33
2.19 2014 wheat straw S content ............................................................................. 34

xi
2.20 2014 wheat grain S content .............................................................................. 34
2.21 2015 wheat straw K content ............................................................................. 35
2.22 2014 wheat grain K content ............................................................................. 35
2.23 2015 wheat straw S content ............................................................................. 36
2.24 2015 wheat grain S content .............................................................................. 36
2.25 2015 wheat straw P content ............................................................................. 37
2.26 2015 wheat grain P content .............................................................................. 37
3.1 Arial view of West Texas A&M University Nance Ranch Field
Research Plots .................................................................................................. 42
3.2 2014 corn plot map and designated treatment applications ............................. 44
3.3 Urea measured for 2014 and 2015 corn treatments ......................................... 46
3.4 2014 corn plots showing intense weed problem .............................................. 48
3.5 2015 corn plot map and designated treatment applications ............................. 50
3.6 2014 corn seed in planter at planting ............................................................... 52
3.7 2015 corn irrigation set up ............................................................................... 53
3.8 Weighing of corn for biomass calculations ..................................................... 54
3.9 2014 corn biomass averages by treatment ....................................................... 56
3.10 2015 corn biomass averages by treatment ....................................................... 56
3.11 2014 corn biomass boxplot in kg ha-1 for each treatment ................................ 57
3.12 2015 corn biomass boxplot in kg ha-1 for each treatment ................................ 57
3.13 2014 corn stover N content .............................................................................. 61
3.14 2015 corn stover N content .............................................................................. 61
3.15 2014 corn stover P content ............................................................................... 63

xii
3.16 2015 corn stover P content ............................................................................... 63
3.17 2014 corn stover K content .............................................................................. 65
3.18 2015 corn stover K content .............................................................................. 65
3.19 2014 corn stover S content ............................................................................... 66
3.20 2015 corn stover S content ............................................................................... 66

1
CHAPTER ONE
LITERATURE REVIEW
Nitrogen Uptake and Plant Growth
It has long been known that in order to maximize crop yields, nitrogen (N),
whether obtained from the topsoil profile, or from the application of N rich fertilizers, is
one of, if not the most important essential nutrient (Dai, X. et al, 2013; Delogu et al.,
1998). Without N, plant growth, productivity (yields) and grain quality are adversely
affected. A study conducted by Delogu, et al. (1998) suggests that consistent yields and
grain quality (protein content) are directly related to the speed and measure of N uptake
by crops, and the ability to partition that N effectively.
Nitrogen is frequently acknowledged as the most limiting nutrient in crop
production. Therefore, N fertilizer is one of the most commonly used inputs for cropping
systems (Nassiri-Mahallati et al., 2010). There are many factors that need to be taken into
consideration when trying to determine whether or not N fertilizer is necessary or will be
economically productive. Some of these include crop species, soil type, soil moisture
content, crop rotation/cropping system, previous crop residues, climate, accessible
technology and potential for irrigation, as well as the current N content of the soil
(Nassiri-Mahallati et al., 2010).
Nitrogen absorption by plants is affected by growth stage, the amount of plant
available N present in the soil, the amount of plant available water, and the depth at
which the N is located (Reginato et al., 1988). Some evidence has been shown that heavy

2
application of N fertilizer in early growth stages of a plant may not be necessary (Lian-
Peng et al., 2012). This is not to say that the application of N fertilizer is not needed at
early stages in the crop’s growth. It simply implies not as much may be needed as in later
growth stages, and/or that application of N fertilizer should occur at multiple stages
throughout a plant’s growth cycle in order to produce the best yield results. Lian-Peng et
al, (2012), further concluded that increasing the amounts of N fertilizer applied at mid-
and late-growth stages (after the reproductive stages have begun) fortifies and increases
N absorption and uptake, increasing grain yields. Lian-Peng et al, (2012) found that
reforming N management practices by decreasing early N application rates and then
applying N fertilizer soon after wheat jointing increased ear-bearing tillers to 60%, where
this amount was reduced by approximately 25% in wheat where N fertilizer application
was increased in the early stage of the crop’s growth cycle.
How well a plant is able to take up nutrients from the soil is highly dependent on
how well developed the root system becomes. Reginato et al. (1988) found that placing
the right amount of N fertilizer at the proper depth, and being able to provide adequate
water to the crop will markedly increase development of the crops root system by
significantly increasing root density and, therefore, water uptake (Sharma and
Chaudhary, 1983). Brown (1971) reported that wheat crops that received adequate N
fertilization were able to remove more water from the soil and at a higher rate than those
crops that did not have N fertilizer applied.
Nitrogen Use Efficiency
Nitrogen use efficiency (NUE) can be defined in many ways, including being
calculated as the ratio between the amount of N removed from the field by the crop and

3
the initial amount of N contained in the soil plus the amount of fertilizer N applied
(Johnston and Poulton, 2009). In a research study conducted by Raun and Johnson (1999)
NUE is calculated as the difference of N uptake in the treated plot(s) & N uptake in the
untreated plot(s), divided by the total applied N rate.
(100 [harvested N of fertilized – harvested N of control]/N applied rate)
A study conducted in the late 1990s, determined that typical NUE for various
cereal crops across the world where N fertilizer is applied is only about 33% (Raun and
Johnson, 1999). Raun and Johnson (1999) further determined that over-application of N
fertilizer did not increase NUE, and that NUE actually decreased with increasing N
fertilizer rates. Further, higher N rates can lead to an increase in N losses through
volatilization, potentially leading to an increase in environmental contamination.
A later, but similar research report, goes further to show that NUE can be largely
affected by the type, or lack thereof, of crop residue left by the preceding crop
(Rahimizadh et al., 2010). Rahimizadh et al. (2010) concluded that wheat grown
following a non-wheat crop, where residue was left after harvest prior to planting the
wheat, had up to a 24% increase in NUE, while wheat planted following harvest of a
wheat crop did not see this increase. This suggests that crop rotation can assist with
increasing NUE, thereby increasing grain yields.
Soil Nitrogen
Understanding how N in the soil exists and reacts is essential to its management
in crop production. The amount of N found in the soil is greatly dependent upon the
quantity and quality of organic matter found in the soil (Sheaffer and Moncada, 2009).
However, only a small amount of this total N is plant available. The only forms of N

4
available for plant uptake are nitrate (NO3) and ammonium (NH4). Other forms of N
found in the atmosphere and soil are insoluble in water and are, therefore, unavailable for
plants to use. These forms of N must be converted, or “fixed” through lightening fixation,
ammonification, nitrification, or biological fixation, into soluble forms in order to be
available for plant consumption and usage (Figure 1.1).
There are multiple ways of attempting to increase N in the soil. One way is to
increase soil organic matter. This process, while extremely beneficial on many levels, not
just for the increase of N, takes time, and sometimes resources for this process are not
abundantly available. Another process includes incorporating legumes into the cropping
system. However, while again favorable in multiple ways, this practice may not be
practical for the producer. Therefore, in consideration of time constraints, producers
typically choose to apply synthetic N fertilizers instead. This method increases N content
in the soil more rapidly and can be somewhat controlled.
Figure 1.1: Development of the nitrogen cycle process1
1Adapted from https://rodneyjonesme.files.wordpress.com/2012/02/notorgencycle.jpg

5
Urea: Synthetic Nitrogen Fertilizer
Urea (CO(NH2)2) is the most universally used synthetic N fertilizer. Commercial
production of urea began when the Haber-Bosch process was perfected (Gilbert et al.,
2006) making the production of ammonia (NH3) more efficient than past procedures.
𝑁2 (𝑔𝑎𝑠) + 3𝐻2 (𝑔𝑎𝑠) ↔ 2𝑁𝐻3 (𝑔𝑎𝑠)
Urea is formed through a process which is achievable only under high pressure (50–200
bar) and high temperatures (380–480°C) (Vojvodic et al., 2014). The production of urea
can be seen in the following reactions:
2𝑁𝐻3 + 𝐶𝑂2 ↔ 𝑁𝐻2𝐶𝑂𝑂𝑁𝐻4
𝑁𝐻2𝐶𝑂𝑂𝑁𝐻4 ↔ 𝐻2𝑂 + 𝐶𝑂(𝑁𝐻2)2
Although there are atmospheric and biological means by which insoluble N forms
may be converted into soluble forms, industrial fixation of N is the most prevalent in
global crop production (Sheaffer and Moncada, 2009).
The use of urea as a source of N fertilizer has been progressively increasing over
the past 50 years, along with its global production (Gilbert, et al 2006). According to the
USDA (2012), in the United States alone, utilization of urea fertilizer has increased
approximately 40 fold in the last half century. Much of this is due to the fact that urea is
the most economical form of N fertilizer available today (James, 2010). Urea is high in N
content (46%) (Overdahl et al., 2014), easily accessible, easily stored and transported
(James, 2010), and simple in its application. Urea may be applied in a solid form of prills
or granules to the soil surface or in bands, or as a solution of ammonium nitrate (UAN)
(Overdahl et al., 2014). It is also easily blended with other fertilizers (Overdahl et al.,
2014) which can reduce input application costs.

6
Once applied, urea is hydrolyzed into a soluble form of N that can be easily
converted through nitrification into NO3 for plant uptake. The hydrolyzation reaction
produces NH3 and CO2 as seen in the following (Bremmer, 1995):
𝐶𝑂(𝑁𝐻2)2 + 𝐻2𝑂(𝑙) 𝑢𝑟𝑒𝑎𝑠𝑒↔ 𝑁𝐻3 + 𝐻2𝑁𝐶𝑂𝑂𝐻 → 2𝑁𝐻3(𝑔) + 𝐶𝑂2(𝑔)
Urease
Urease is a naturally occurring soil born enzyme that catalyzes the reaction shown
above, wherein urea is hydrolyzed for plant uptake. However, this catalyst also increases
the rate at which ammonia volatilization occurs, thereby decreasing NUE in most plants
and increasing the probability of N environmental contamination.
It has been found that soil urease activity can be linked to soil organic matter
content and total N content (Uzun and Uyanoz, 2011). Uzun and Uyanoz, 2011, found
that soils with higher organic matter content tend to have a more elevated level of
microbial biomass and therefore, higher potential for urease balance and reduction of
catalytic activity.
Nitrogen Losses
Urea, even with all its advantages, has a significant disadvantage in that it is
extremely susceptible to N loss, especially when left exposed on or near the soil surface.
Urea N loss rates vary and can be between 50% and 90% of total urea N within the first
48 hours after surface application (James, 2010). In a study conducted by Raun and
Johnson in 1999, it was observed that N losses can occur through several different
processes:
Denitrification;

7
Leaching;
Runoff; and
NH3 volatilization.
Denitrification is the process by which nitrates (NO3-) or nitrites (NO2
-) are
reduced to nitric oxide (NO), nitrous oxide (N2O), or nitrogen gas (N2) (Gayon and
Dupetit, 1882). This process is significant in that the NO and N2O produced during the
denitrification process are labeled as significant greenhouse gases, both of which
contribute to the production of nitric acid, a component of acid rain.
Hilton et al., (1994) reported denitrification rates of 10 to 22% of total N from the
application of nitrogen fertilizers to corn crops. While there are various models and
approaches to estimating soil N loss from denitrification (Germon and Philippot, 2012),
the calculated results are highly dependent upon numerous soil characteristics, including
but not limited to soil texture, organic matter content, pH, and cation exchange capacity,
and/or environmental conditions.
Leaching of soil N occurs when N supply exceeds N demand in a copping system
and the excess N is percolated down through the soil profile (Teixeira et al., 2016). The
leaching process can push soil N past the crop root zone making it unavailable to plants
and potentially moving it into water tables or aquifers, causing environmental
contamination of ground water supplies and/or causing eutrophication of nearby bodies
of water. Excess or continuous rainfall or irrigation can escalate this action.
Runoff can occur when a strong or intense rainfall event takes place, or when
excess irrigation is applied to a cropping system. Water from acute rainfall or excessive

8
irrigation can carry unincorporated nutrients from the soil surface to other environmental
areas causing nutrient loss and possible pollution.
Ammonia volatilization is the loss of NH3 gas to the atmosphere. Since the natural
state of NH3 is gaseous, its loss can occur rather quickly (Fageria and Balinger, 2005).
The process of NH3 volatilization is a potential problem for many producers, whether
natural or synthetic N fertilizers are used during crop production. The highest rates of
NH3 volatilization occur when N fertilizers are broadcast applied, unincorporated, and
left without irrigation or adequate precipitation accumulations (Sanz-Cobena et al.,
2011). Nitrogen loss rates, due to NH3 volatilization, as high as 56% of total applied N
fertilizer have been documented (Black et al., 1985, Gioacchini et al., 2002). This can
lead to major environmental concerns and dilemmas, with estimated volatilization rates
having the potential to surpass 25% of applied fertilizer sources (Lauer et al., 1976;
Fillery et al., 1984). Further, in a study conducted by Watson et al. (2008), it was
observed that increased temperatures elevated urea N losses even more, exceeding 30%.
While there are not only multiple ways in which N loss can occur, there are also a
multitude of factors that contribute to the rate at which N loss transpires, specifically NH3
volatilization (Bolan et al., 2012). These include, but are not limited to:
Increasing temperature;
Increasing soil pH;
Unincorporated fertilizers (Rochette et al., 2009);
Soil organic matter content (Singh et al., 2013);
Lack of and/or excessive moisture;
Wind velocity (Hayashi et al., 2008)

9
Crop canopy;
Tillage type (Rochette et al., 2009); and
Types/numbers of soil organisms present.
This complexity is what makes controlling soil N loss a challenging practice that
is difficult to effectively accomplish. Each of the above factors affects NH3 volatilization
rates, and while some can potentially be restricted and/or minimized, not all of them are
within humanistic control.
Mitigation of N Losses
In order to reduce N loss through leaching, run-off, denitrification and NH3
volatilization, and increase NUE potential, crop producers face a conglomerate of
challenges when considering application of urea, or other N fertilizers. Some of these
challenges are:
Understanding soil types, pH, and moisture levels;
Understanding at which point in the growth cycle N uptake is most efficient (for
the crop being grown) in order for it to be most effective in producing high
quality yields in the greatest quantities;
Which method of application is the most economical and effective; and
Knowing the proper amount to apply without over application.
Without considering each of the matters mentioned above, NUE and yields (quality and
quantity) decrease, while the potential for N losses increases, thereby increasing the
probability of environmental contamination.

10
One means by which N loss can be diminished is by the application of water
immediately following the administration of N fertilizer to the soil (Sanz-Cobena et al.,
2011). Since environmental weather conditions are not within the control of the producer,
and if rainfall is not immediately anticipated, it is advantageous to apply irrigation
promptly after application of N fertilizer to curtail the loss of N associated with NH3
volatilization (Black et al., 1987). However, increased amounts of precipitation (rainfall
or irrigation) can facilitate elevated losses of N through leaching and runoff. Careful
monitoring of rainfall and irrigation amounts should be considered.
The integration of N fertilizers into the soil bed is another means by which N
losses can be mitigated (Sommer and Hutchings, 1995). Nonetheless, this practice is not
always a feasible option. This is especially true for those producers who utilize no-till or
reduced-till systems in crop production (Bremmer, 1995).
Other techniques by which to reduce N losses from N fertilizers are proper timing
of application and application of the appropriate amount of N fertilizer required.
However, these actions also can pose dilemmas due to potential inconvenience and guess
work (Chien et al., 2009). These methods are difficult to master in that they require soil,
crop and fertilizer knowledge, field experience, and may be somewhat dependent upon
unpredictable environmental conditions (wind, rain, etc.).
N-(n-butyl) Thiophosphoric Triamide (NBPT)
In addition to, or when the above described approaches to N loss mitigation are
limited, or there is a desire to further reduce N loss from urea application, N fertilizer
stabilizers may be used. In a research study conducted by Hendrickson (1992) it was
demonstrated that one such stabilizer, N-(n-butyl) thiophosphoric triamide (NBPT), is

11
effective at controlling urea hydrolysis and increases NUE, thereby reducing N loss when
applied with urea. Another study involving NBPT conducted by Creason (1990) showed
as much as a 50% inhibition when NBPT was applied. Soares et al., (2012) produced
results that exhibited as much as a 78% reduction in N losses when NBPT was used with
urea.
Mode of Action for NBPT: NBPTO
While NBPT is the compound marketed and used to treat urea in order to impede
N loss, the conversion of NBPT to its oxon analog, NBPTO, must occur in order for the
actual inhibition to take place. Once applied and added to the soil, NBPT is transformed
into NBPTO, hindering the urease catalytic process (Creason et al., 1990). Since this
conversion must happen in order to block the hydrolysis process, N volatilization
continues until NBPTO is formed. This alteration may happen relatively quickly or may
take a number of days to transpire (Byrnes and Freney, 1995).
Urea begins the action of hydrolyzing almost immediately upon application to the
soil surface with the greatest part of N loss due to NH3 volatilization occurring within the
first seven days following urea application (Soares et al., 2012). In a study conducted by
Gezgin and Bayrakll (1995) results showed that urea treated with NBPT had a significant
reduction in NH3 volatilization of up to 63% over that of untreated urea.
Research Objectives
There is evidence to suggest that the use of urea fertilizer treated with NBPT is
beneficial for increasing yields in various crops. However, there is little published
research signifying that the use of NBPT, or other urease inhibitors, in conjunction with
urea fertilizer increases N uptake in winter wheat or corn, or that it potentially reduces

12
nitrate environmental contamination. The objectives of this study were to evaluate the
effect and compare the performance of urea fertilizer treated with two different NBPT
urease inhibitor products, Agrotain® and N-YieldTM, to that of a control (no fertilizer
application), untreated urea fertilizer, and compost treatments on the nitrogen content of
hard red winter wheat and field corn over a two year period.

13
CHAPTER TWO
WHEAT EXPERIMENT
Materials and Methods
Experimental Field Site
A field experiment to determine the effects of the urease inhibitor NBPT on N
uptake and volatilization was conducted for two consecutive growing seasons (2013-2014
and 2014-2015) for hard red winter wheat at the West Texas A&M University Nance
Ranch, located approximately five miles East/Southeast of Canyon, Texas (Figure 2.1).
The experimental site has a climate that is semi-arid. Average annual rainfall is
generally <50 centimeters, of which most is accumulated during the spring and early
summer months (March - June). This climate region is prone to drought. The mean air
temperatures are 11.8 °C (53.3°F) for the winter months (December – February), 22.6 °C
(72.7°F) for the spring months (March – May), 32.4 °C (90.4°F) for the summer months
(June – August), and 17.1 °C (62.8°F) for the fall months (September – November) (US
Climate Data, 2015).

14
Figure 2.1 Arial view of West Texas A&M University Nance Ranch Field Research Plots. 34° 58’ 05” N,
101° 47’ 14” W. Adapted from http://www.gosur.com/map/?satellite=1&z=20&ll=34.968455,-
101.787442&t=hybrid&lang=en
Soil
According to the USDA-NRCS website, the soil type at the experimental site is
100% Olton clay loam, 0 to 1 percent slopes (pH 6.6 - 8.4) (fine, mixed, superactive,
thermic Aridic Paleustolls). The Olton series is comprised of “…very deep, well drained,
moderately slowly permeable soils,” (USDA-NCRS, 2015). The farmland classification
for Olton Clay Loam is designated as prime farmland (USDA-NCRS, 2015). Most of the
area that is comprised of Olton clay loam is irrigated cropland used for the production of
cotton, sorghum and winter wheat (USDA-NCRS, 2015).

15
Soil Sampling
Soil samples were collected and analyzed pre-plant and post-harvest for each
growing season to determine nutrient availability. Composite samples were obtained
separately for each of the designated treatment plots. Three samples 15.24 centimeters –
20.32 centimeters deep were collected and composited from random locations throughout
each plot. A total of 72 composite soil samples were collected and analyzed. The
composite samples from each plot were delivered to Servi-Tech Laboratories (Amarillo,
Texas), and individually analyzed for pH, salts, organic matter (OM), total N, phosphorus
(P), potassium (K), sulfur (S), calcium (Ca), magnesium (Mg), Sodium (Na), zinc (Zn),
and cation exchange capacity (CEC).
Treatments and Application
For both the 2013-2014 and 2014-2015 growing seasons, field experiments were
set up in a completely randomized design. The 2013-2014 growing season wheat crop
experiment contained five treatments and a single control, with four replications each
(Figure 2.2).

16
Figure 2.2 2013-2014 wheat plot map and designated treatment applications
NORTH↑ A B C D
1 U Cntrl CompNY UAG
2 UNY Cntrl Comp UNY
3 Comp Cntrl UAG UAG
4 CompNY Comp Cntrl U
5 U CompNY Comp UNY
6 U CompNY UNY UNY
Control = Cntrl Urea = U
Compost = Comp Urea + Agrotain® Ultra = UAG
Compost + N-YieldTM = CompNY Urea + N-YieldTM = UNY
Treatments described above were prepared and applied as follows:
Control Treatment (Cntrl)-
No compost or fertilizer was applied to the designated plots
Compost Treatment (Comp)-
8.34kg (18.4lbs) of compost (Table 2.1) per plot; rate of compost
application was calculated based upon 4483.40kg ha-1 (2 tons ac-1);
applying approximately 16.8kg N ha-1 (15lbs N ac-1) according to
compost analysis data (Table 2.1)

17
Broadcast evenly throughout each designated plot, then tilled into
the soil bed immediately prior to planting on October 4, 2013
Compost + N-Yield Treatment (CompNY)-
8.34kg (18.4lbs) of compost treated with .003129529ml g-1 (3qts
ton-1) of the NBPT N stabilizer additive N-YieldTM per plot1; rate
of compost application was calculated based upon 4483.40kg ha-1
(2 tons ac-1) (Figures 2.3 and 2.4); applying approximately 16.8kg
N ha-1 (15lbs N ac-1) according to compost analysis data (Table
2.1)
Broadcast evenly throughout each designated plot, then tilled into
the soil bed immediately prior to planting on October 4, 2013
Urea Treatment (U)-
347g of urea prills (46% N) per plot, based upon an application
rate of 84.06kg ha-1 (75lbs ac-1) for wheat; applying approximately
85.2kg N ha-1 (34.5lbs N ac-1)
broadcast applied by hand on May 30, 2014, prior to heading
Irrigation applied immediately following treatment application,
May 30, 2014
Urea + Agrotain® Ultra Treatment (UAG)-
347g of urea prills (46% N) per plot, based upon an application
rate of 84.06kg ha-1 (75lbs ac-1) for wheat, treated with the NBPT
1 There is no recommended treatment rate for N-Yield® use with compost. Therefore,
treatment rate was calculated using the same treatment ratio by weight as is
recommended for use with urea.

18
N stabilizer additive Agrotain® Ultra (26.7% NBPT by weight) at
the recommended application rate of 3qts ton-1, or approximately
1.1ml for every 347g of urea; applying approximately 85.2kg N ha-
1 (34.5lbs N ac-1)
Broadcast applied by hand on May 30, 2014, prior to heading
Irrigation applied immediately following treatment application,
May 30, 2014
Urea + N-YieldTM Treatment (UNY)-
347g of urea prills (46% N) per plot, based upon an application
rate of 84.06kg ha-1 (75lbs ac-1) (34.5lbs N ac-1) for wheat, treated
with the NBPT N stabilizer additive N-YieldTM (20% NBPT by
weight) at the recommended application rate of 3qts ton-1, or
approximately 1.1ml for every 347g of urea; applying
approximately 85.2kg N ha-1 (34.5lbs N ac-1)
Broadcast applied by hand on May 30, 2014, prior to heading
Irrigation applied immediately following treatment application,
May 30, 2014

19
Table 2.1 Lab analysis of compost used for both growing seasons, retrieved from West Texas A&M
University feed yard compost site.
Parameters
Analysis
Total Content
(kg kg-1)
Estimated
Available First
Year (kg kg-1)
Nitrogen 0.807% 0.008 0.004
Phosphorus (P2O5) 0.747% 0.007 0.007
Potassium (K2O) 0.725% 0.009 0.009
Organic Matter 15.0% 0.15 N/A
C:N Ratio 10.8 ratio N/A N/A
Figure 2.3 Preparation of compost treated with NBPT

20
Figure 2.4 Preparation of NBPT treated compost
Field experiments for the 2014-2015 growing season were set up similarly to the
previous year’s wheat crop. However, unlike the previous year’s treatments, treatments
for this growing season consisted of four treatments and a single control, each consisting
of four replications with the exception of the untreated compost treatment, which was
replicated eight times (Figure 2.5).

21
Figure 2.5 2014-2015 wheat plot map and designated treatment applications
NORTH↑ A B C D
1 U Cntrl Comp UAG
2 UAG Cntrl Comp UNY
3 Comp Cntrl UAG UAG
4 Comp Comp Cntrl U
5 U Comp Comp UNY
6 U Comp UNY UNY
Control = Cntrl Urea + Agrotain® Ultra = UAG
Compost = Comp Urea + N-YieldTM = UNY
Urea = U
The decision to eliminate the treatment containing compost treated with the
NBPT N stabilizing product N-yieldTM and using only untreated compost as a treatment
was made because NBPT is a urease inhibitor and therefore should have no effect on
compost N. Also, unlike the previous growing season, the compost treatments were not
applied prior to planting. All treatments were topically applied on May 4, 2015,
preceding heading.
One other difference in treatments for the 2014-2015 growing season was that
treatment three consisted of urea prills treated with the N stabilizer additive Agrotain®
Advanced, of which the formulation is 30% NBPT by weight, instead of Agrotain® Ultra.
Agrotain® Advanced was used instead of Agrotain® Ultra, because Agrotain® Ultra was

22
not obtainable at the time of treatment application. Treatment of the urea with Agrotain®
Advanced was at the recommended application rate of 0.002ml g-1 of urea (2qts ton-1), or
approximately 0.724ml for every 347g of urea (Figure 2.6).
Figure 2.6 Urea treatments containing NBPT (Agrotain® Advanced and N-yieldTM)
Ground Site Preparation
In both growing seasons, 24 field plots of equal size, 6.096 meters X 3.048 meters
(20 feet X 10 feet), were laid out in a four by six grid. Each plot contained approximately
.0046 acre (200 ft2).
Prior to cultivation in both growing seasons, the plots were treated with a pre-
emergent herbicide (Roundup®) to assist in the control of weeds. Irrigation water was
applied to soften the soil bed for plowing, which had become impenetrable due to prior
years’ drought conditions. In early October all 24 plots were plowed east to west, using

23
conventional tillage practices, which consisted of disc plowing the seed bed
approximately six inches deep prior to planting. Each plot consisted of four rows with
wheat planted on 76.2cm (30in.) centers (Figure 2.7).
Figure 2.7 Disking plot area prior to planting 2014-2015 wheat crop
Wheat Crop
Hard red winter wheat (TAM 111 variety) was planted on October 4, 2013, for the
2013-2014 growing season, and on September 18, 2014, for the 2014-2015 growing
season. The seeding rate was 1,111,975 seeds per hectare (450,000 seeds per acre) across
all 24 field plots for both years.
Due to limited precipitation following planting in both growing seasons, irrigation
was applied (Figure 2.8) at regular intervals, beginning October 30, 2013, through
November 20, 2013, and beginning October 8, 2014, through October 20, 2014 to insure
adequate growth prior to dormancy. Additional irrigation was applied, depending on

24
climate conditions, beginning April 1, 2014, through June 18, 2014, for the 2013-2014
growing season, and beginning April 1, 2014, through April 27, 2014, for the 2014-2015
growing season, prior to harvest. Harvest of wheat crop was completed on July 28, 2014,
and July 1, 2014, for the 2013-2014 and 2014-2015 growing seasons, respectively.
Figure 2.8 Irrigation system set up for wheat field plots
Precipitation and Irrigation
Precipitation accumulation for the 2013-2014 growing season (October 1, 2013
through July 28, 2014) was approximately 33.22cm (13.08in) (The Climate Corporation,
2015) with the mean precipitation for this period being approximately 37.78cm (14.87in)
(NOAA, 2015), while the precipitation accumulation for the 2014-2015 growing season
(September 18, 2014 through July 1, 2015) was approximately 53.30cm (20.98in) (The
Climate Corporation, 2015) with the mean precipitation for this period being
approximately 44.30cm (17.44in) (NOAA, 2015). In addition, drought conditions made it
necessary to apply irrigation at regular intervals and levels during each growing season to
insure survival of the wheat crop. Irrigation amounts for the 2013-2014 growing season

25
totaled 37.05cm (14.59in) with the mean irrigation amount for this period being 0.04cm
(0.02in), while the total irrigation applied during the 2014-2015 growing season was
9.76cm (3.76in) with the mean irrigation amount being 0.03cm (0.01in). Total
precipitation and irrigation combined was approximately 70.28cm (27.67in) with the
daily mean total combined precipitation and irrigation being 0.23cm (0.09in) for the
2013-2014 growing season, with total combined accumulations of 63.06cm (24.83in)
with the daily mean total combined precipitation and irrigation being 0.21cm (0.08in) for
the 2014-2015 growing season.
Harvest Samples
The 2013-2014 wheat crop was harvested on July 28, 2014. Due to the production
of a limited stand and weed issues, it was resolved that approximately 75 plants would be
harvested from each test plot in order to obtain adequate samples for analysis (Figure
2.9). All above ground biomass was collected and labeled for analysis. Samples were
dried in an oven at 60°C for a period of seven days. Once dried, the heads were separated
by hand from the straw and were threshed to separate the grain from the straw and chaff
at the Texas A&M AgriLife Facility (Bushland, TX). The grain was then ground into
flour at the WTAMU Greenhouse. Both the grain flour and straw samples were delivered
to Servi-Tech Laboratories (Amarillo, TX), for quality analysis. The grain flour was
analyzed for crude protein, Ca, P, Mg, K, S, Na, Zn, Fe, Mn, Cu, and nitrate nitrogen
(NO3-N). The straw samples were analyzed for total N, P, K, Ca, Mg, S, Zn, Fe, Mn, Cu,
B, and Na content.

26
Figure 2.9 2014 wheat harvest
The 2014-2015 wheat crop was harvested on July 1, 2015. Unlike the 2013-2014
wheat crop, the 2014-2015 wheat crop produced a stand that was sufficient for harvest of
the test plots using a meter square (Figure 2.10). A single sample from each plot was
harvested. All above ground biomass located within the meter square boundaries was
collected and labeled for analysis. Samples were dried in an oven at 60°C for an eight day
period. Once dried, the heads were separated by hand from the straw, counted and
threshed to separate the grain from the chaff at the Texas A&M AgriLife Facility
(Bushland, TX). The grain and straw samples were sent to Servi-Tech Laboratories
(Amarillo, TX), for equivalent quality analysis as the previous year.

27
Figure 2.10 2015 wheat harvest using meter square
Statistical Analysis
All statistical data analysis was conducted using SAS© (v9.4 TS Level 1M2,
Copyright 2002-2012 by SAS Institute, Inc., Cary, NC, USA). Statistically significant
differences were ascertained at α = 0.05.
The nutrient content data for each year’s harvested wheat grain and straw were
analyzed separately, then combined and analyzed for total nutrient content for each
treatment group for each year. Analysis of variances (ANOVA) were calculated for N, P,
K, and S content for both the 2014 and 2015 harvested wheat straw and grain, in order to
identify any significant differences among treatments for each year’s harvest.
When results of the ANOVA produced significant differences, a means separation
test was conducted using Tukey’s HSD.

28
Results and Discussion
Nutrient Content
Lab analysis of the harvested wheat for the 2014 harvest year showed that the
straw and grain removed from the plots treated with the urea treatments containing NBPT
(Treatments UAG and UNY) contained the largest quantities of N, with the treatment
means for straw UAG being 1.30% and UNY being 1.36%, and the treatment means for
grain UAG being 3.30% and UNY being 3.52% (Figures 2.11 and 2.12). Similar results
for phosphorus (P) (Figures 2.15 and 2.16), potassium (K) (Figures 2.17 and 2.18), and
sulfur (S) (Figures 2.19 and 2.20) were also found among treatments, with treatments
UAG and UNY containing the highest percentages of these nutrients. However, analysis
of the harvested wheat for the 2015 harvest year showed that the largest amounts of
nutrient contents varied among treatments (Figures 2.13 and 2.14, and 2.21 through 2.26).
In 2014, Treatments UNY and UAG produced the highest amounts of N content
in both the wheat straw and grain, while in 2015, Treatment UNY Treatment U produced
the highest amounts of N content in both the wheat straw and grain (Figures 2.11- 2.14).
Further, while ANOVA test results evidenced significant differences among treatments
related to straw N content for 2014 (p ≤ 0.0001) and 2015 (p ≤ 0.0141), and produced
significant differences (p ≤ 0.0001) among treatments related to grain N content for both
2014 and 2015, no statistical differences were found among Treatments U, UAG or UNY
regarding N content for wheat straw or grain for either the 2014 or 2015 growing season.
However, Tukey’s HSD test results determined that differences existed between
treatments relative to N, P, K, and S nutrient contents as seen in Table 2.1 and Table 2.2

29
for the 2014 and 2015 wheat crops, respectively. In both years, no statistical differences
were found among any of the urea treatments, untreated or treated.
Figure 2.11 2014 wheat straw N content. Each bar represents the overall mean for each treatment group
with error bars indicating the standard error, estimating the variability between samples throughout
each treatment.
Figure 2.12 2014 wheat grain N content. Each bar represents the overall mean for each treatment group
with error bars indicating the standard error, estimating the variability between samples throughout
each treatment.
0.64 0.69 0.64
1.25 1.30 1.36
0.00
0.50
1.00
1.50
2.00
2.50
3.00
3.50
4.00
Cntrl Comp CompNY U UAG UNY
%N
TREATMENT
2014 WHEAT STRAW N CONCENTRATION
2.192.38
2.13
3.26 3.303.52
0.00
0.50
1.00
1.50
2.00
2.50
3.00
3.50
4.00
Cntrl Comp CompNY U UAG UNY
%N
TREATMENT
2014 WHEAT GRAIN N CONCENTRATION

30
Figure 2.13 2015 wheat straw N content. Each bar represents the overall mean for each treatment group
with error bars indicating the standard error, estimating the variability between samples throughout
each treatment.
Figure 2.14 2015 wheat grain N content. Each bar represents the overall mean for each treatment group
with error bars indicating the standard error, estimating the variability between samples throughout
each treatment.
0.72 0.72
1.030.88
1.06
0.00
0.50
1.00
1.50
2.00
2.50
3.00
Cntrl Comp U UAG UNY
%N
TREATMENT
2015 WHEAT STRAW N CONCENTRATION
2.09 2.11
2.60 2.54 2.62
0.00
0.50
1.00
1.50
2.00
2.50
3.00
Cntrl Comp U UAG UNY
%N
TREATMENT
2015 WHEAT GRAIN N CONCENTRATION

31
In 2014, UNY was also consistently higher in nutrient content for P, K, and S
(Figures 2.15 through 2.20), with significant differences (p ≤ 0.0001) being found among
treatments as shown in Table 2.1. However, in 2015, while UNY was still higher than the
Cntrl and Comp in K, and S content (Figures 2.21 through 2.24), it was not highest in P
content (Figure 2.25 and 2.26). Further, UNY only exhibited significant differences (p ≤
0.0098) when compared to the Cntrl and Comp, in 2015, and was not statistically
different from U or UAG in N, P, K, or S concentrations for either year (Table 2.2).
32
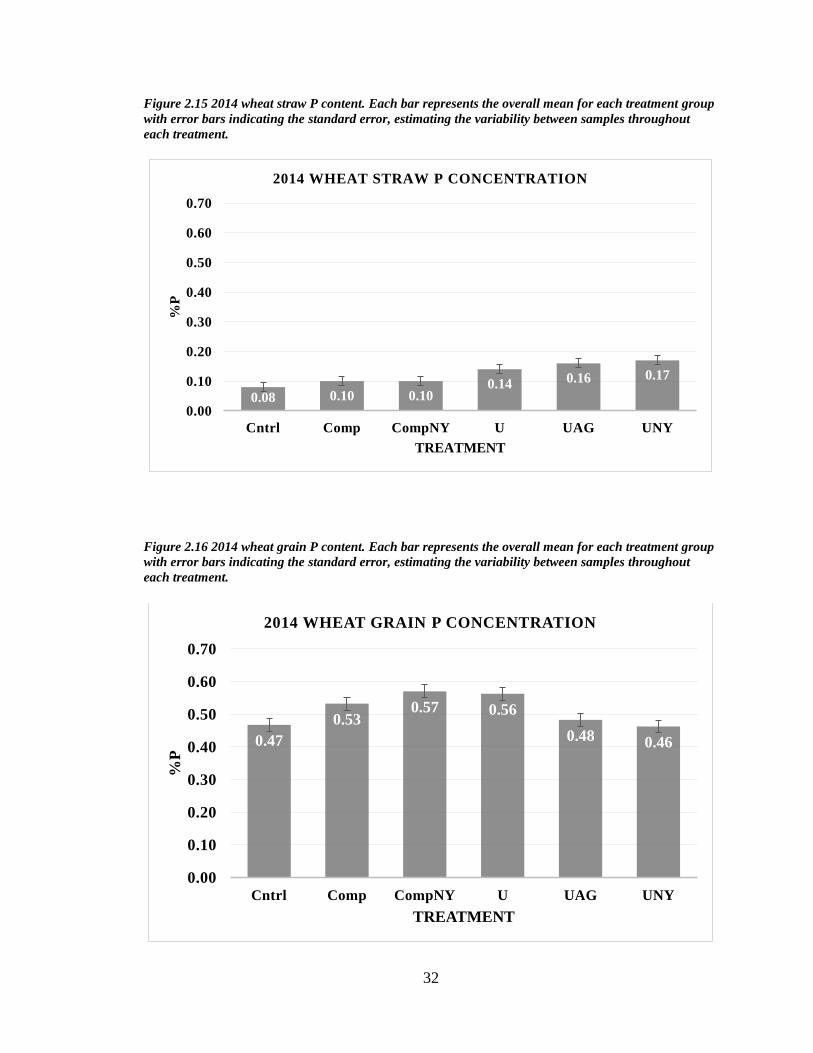
Figure 2.15 2014 wheat straw P content. Each bar represents the overall mean for each treatment group
with error bars indicating the standard error, estimating the variability between samples throughout
each treatment.
Figure 2.16 2014 wheat grain P content. Each bar represents the overall mean for each treatment group
with error bars indicating the standard error, estimating the variability between samples throughout
each treatment.
0.08 0.10 0.100.14 0.16 0.17
0.00
0.10
0.20
0.30
0.40
0.50
0.60
0.70
Cntrl Comp CompNY U UAG UNY
%P
TREATMENT
2014 WHEAT STRAW P CONCENTRATION
0.47
0.530.57 0.56
0.48 0.46
0.00
0.10
0.20
0.30
0.40
0.50
0.60
0.70
Cntrl Comp CompNY U UAG UNY
%P
TREATMENT
2014 WHEAT GRAIN P CONCENTRATION

33
Figure 2.17 2014 wheat straw K content. Each bar represents the overall mean for each treatment group
with error bars indicating the standard error, estimating the variability between samples throughout
each treatment.
Figure 2.18 2014 wheat grain K content. Each bar represents the overall mean for each treatment group
with error bars indicating the standard error, estimating the variability between samples throughout
each treatment.
0.78
1.00
0.82
1.18
1.301.35
0.00
0.20
0.40
0.60
0.80
1.00
1.20
1.40
Cntrl Comp CompNY U UAG UNY
%K
TREATMENT
2014 WHEAT STRAW K CONCENTRATION
0.480.54
0.60 0.570.49 0.47
0.00
0.20
0.40
0.60
0.80
1.00
1.20
1.40
Cntrl Comp CompNY U UAG UNY
%K
TREATMENT
2014 WHEAT GRAIN K CONCENTRATION

34
Figure 2.19 2014 wheat straw S content. Each bar represents the overall mean for each treatment group
with error bars indicating the standard error, estimating the variability between samples throughout
each treatment.
Figure 2.20 2014 wheat grain S content. Each bar represents the overall mean for each treatment group
with error bars indicating the standard error, estimating the variability between samples throughout
each treatment.
0.08 0.08 0.08
0.14 0.140.15
0.00
0.05
0.10
0.15
0.20
0.25
Cntrl Comp CompNY U UAG UNY
%S
TREATMENT
2014 WHEAT STRAW S CONCENTRATION
0.15
0.21 0.22 0.22
0.160.15
0.00
0.05
0.10
0.15
0.20
0.25
Cntrl Comp CompNY U UAG UNY
%S
TREATMENT
2014 WHEAT GRAIN S CONCENTRATION

35
Figure 2.21 2015 wheat straw K content. Each bar represents the overall mean for each treatment group
with error bars indicating the standard error, estimating the variability between samples throughout
each treatment.
Figure 2.22 2015 wheat grain K content. Each bar represents the overall mean for each treatment group
with error bars indicating the standard error, estimating the variability between samples throughout
each treatment.
1.511.66
2.50 2.52 2.58
0.00
0.50
1.00
1.50
2.00
2.50
3.00
Cntrl Comp U UAG UNY
%K
TREATMENT
2015 WHEAT STRAW K CONCENTRATION
0.55 0.56 0.63 0.60 0.62
0.00
0.50
1.00
1.50
2.00
2.50
3.00
Cntrl Comp U UAG UNY
%K
TREATMENT
2015 WHEAT GRAIN K CONCENTRATION

36
Figure 2.23 2015 wheat straw S content. Each bar represents the overall mean for each treatment group
with error bars indicating the standard error, estimating the variability between samples throughout
each treatment.
Figure 2.24 2015 wheat grain S content. Each bar represents the overall mean for each treatment group
with error bars indicating the standard error, estimating the variability between samples throughout
each treatment.
0.110.12
0.150.14
0.15
0.00
0.05
0.10
0.15
0.20
Cntrl Comp U UAG UNY
%S
TREATMENT
2015 WHEAT STRAW S CONCENTRATION
0.14 0.14
0.170.16
0.17
0.00
0.05
0.10
0.15
0.20
Cntrl Comp U UAG UNY
%S
TREATMENT
2015 WHEAT GRAIN S CONCENTRATION

37
Figure 2.25 2015 wheat straw P content. Each bar represents the overall mean for each treatment group
with error bars indicating the standard error, estimating the variability between samples throughout
each treatment.
Figure 2.26 2015 wheat grain P content. Each bar represents the overall mean for each treatment group
with error bars indicating the standard error, estimating the variability between samples throughout
each treatment.
0.20 0.190.14 0.13
0.15
0.00
0.10
0.20
0.30
0.40
0.50
0.60
Cntrl Comp U UAG UNY
%P
TREATMENT
2015 WHEAT STRAW P CONCENTRATION
0.49 0.50 0.480.44
0.48
0.00
0.10
0.20
0.30
0.40
0.50
0.60
Cntrl Comp U UAG UNY
%P
TREATMENT
2015 WHEAT GRAIN P CONCENTRATION

38
Table 2.2 Mean nutrient content percentages of 2014 wheat straw and grain (percentage on dry weight
basis). Means in the same column within the same nutrient type with the same letter are not significantly
different using Tukey’s HSD (p<0.0001 for straw and p<0.0141 for grain).
Nutrient Treatment Straw Grain
CompNY 0.640a 2.132a
Cntrl 0.642a 2.192a
N Comp 0.692a 2.380a
U 1.250b 3.260b
UAG 1.300b 3.304b
UNY 1.360b 3.516b
Cntrl 0.077a 0.467ab
Comp 0.095ab 0.482ab
P U 0.137bcd 0.532bc
UAG 0.155cd 0.562c
UNY 0.170d 0.570c
Cntrl 0.777a 0.475a
CompNY 0.817a 0.472a
K Comp 1.002ab 0.485ab
U 1.185b 0.542bc
UAG 1.305b 0.572c
UNY 1.350b 0.602c
CompNY 0.075a 0.147a
Cntrl 0.075a 0.152a
S Comp 0.080a 0.160a
U 0.135b 0.212b
UAG 0.140b 0.215b
UNY 0.152b 0.220b

39
Table 2.3 Mean nutrient content percentages of 2015 wheat straw and grain (percentage on dry weight
basis). Means in the same column within the same nutrient type with the same letter are not significantly
different using Tukey’s HSD (p≤0.0001 for both straw and grain).
Nutrient Treatment Straw Grain
Cntrl 0.716a 2.088a
Comp 0.724ab 2.108a
N UAG 0.876ab 2.536b
U 1.032ab 2.600b
UNY 1.060b 2.616b
UAG 0.125a 0.442a
U 0.140a 0.480a
P UNY 0.152ab 0.477a
Comp 0.192bc 0.495a
Cntrl 0.200bc 0.485a
Cntrl 1.505a 0.545a
Comp 1.660a 0.562a
K U 2.502b 0.632a
UAG 2.522b 0.602a
UNY 2.575b 0.617a
Cntrl 0.110a 0.140a
Comp 0.117ab 0.140a
S UAG 0.137ab 0.155ab
UNY 0.147b 0.165ab
U 0.150b 0.167b
Observations of P, K, and S concentrations indicate that while application of urea
fertilizer improves the overall content of these nutrients over that of the control and
compost treatments, treatment of urea with NBPT does not notably raise P, K or S
content over that of untreated urea. Further, specific analysis of the wheat N content data
suggests application of untreated urea or urea treated with NBPT significantly improves
N concentrations by approximately 50% in wheat as compared to the control and
compost treatments. This is an expected reaction, by simple reason that the application of

40
urea fertilizer substantially increases the amount of nitrogen available in the soil.
However, it is notable to acknowledge that in wheat, urea treated with NBPT does not
produce results that are statistically different from those of untreated urea.
Summary
It can be concluded from the data collected and statistically analyzed, that urea
fertilizer, untreated and that treated with the urease inhibitor, NBPT, increases N content
of wheat at harvest when compared to wheat grown with compost, or without N fertilizer.
The harvested wheat grown using the treatment containing the NBPT product, N-
YieldTM, ranked highest in N concentration for both harvest years (Tables 2.1 and 2.2). It
was anticipated that the use of NBPT in conjunction with urea would notably raise N
concentrations within the plant. However, based upon statistical analysis, results showed
that although wheat grown using urea treated with the NBPT product, N-YieldTM had the
highest N concentrations in both the wheat straw and grain, it did not significantly
increase the N content over that of the wheat grown using untreated urea or the NBPT
product Agrotain®.
These results are consistent with the conclusions made by McClallen (2014),
wherein it was observed that wheat fertilized with urea treated with NBPT showed a
significant difference in protein content over that of unfertilized wheat, but did not
produce yields that were statistically different than those produced by wheat grown with
untreated urea applied.

41
CHAPTER THREE
CORN EXPERIMENT
Materials and Methods
Experimental Field Site
A field experiment to determine the effects of the urease inhibitor NBPT on N
uptake and N content in field corn was conducted for two consecutive growing seasons
(2014 and 2015) at the West Texas A&M University Nance Ranch, located
approximately five miles East/Southeast of Canyon, Texas. The corn field research plots
were located immediately adjacent to the previously described wheat plots (Figure 3.1).
The experimental site has a climate that is semi-arid. Average annual rainfall is
generally <50cm, of which most is accumulated during the spring and early summer
months (March - June). This climate region is prone to drought. The mean air
temperatures are 11.8 °C (53.3°F) for the winter months (December – February), 22.6 °C
(72.7°F) for the spring months (March – May), 32.4 °C (90.4°F) for the summer months
(June – August), and 17.1 °C (62.8°F) for the fall months (September – November) (US
Climate Data, 2015).

Figure 3.1 Arial view of West Texas A&M University Nance Ranch Field Research Plots. 34° 58’ 05” N,
101° 47’ 14” W. Adapted from http://www.gosur.com/map/?satellite=1&z=20&ll=34.968455,-
101.787442&t=hybrid&lang=en
Soil
According to the USDA-NRCS website, the soil type at the experimental site is
100% Olton clay loam, 0 to 1 percent slopes (pH 6.6 - 8.4) (fine, mixed, superactive,
thermic Aridic Paleustolls). The Olton series is comprised of “…very deep, well drained,
moderately slowly permeable soils,” (USDA-NCRS, 2015). The farmland classification
for Olton Clay Loam is designated as prime farmland (USDA-NCRS, 2015). Most of the
area that is comprised of Olton clay loam is irrigated cropland used for the production of
cotton, sorghum and winter wheat (USDA-NCRS, 2015).
Soil Sampling
Soil samples were collected and analyzed pre-plant and post-harvest for each
growing season to determine nutrient availability. Composite samples were obtained

43
separately for each of the designated treatment plots. Three samples, 15.24cm– 20.32cm
deep, were collected and composited from random locations throughout each plot. A total
of 84 composite soil samples were collected and analyzed for nutrient content. There
were a total of 48 samples (24 plots X 2) for the 2014 harvest season and 36 samples (18
plots X 2) for the 2015 harvest season. All composite samples from each plot were
delivered to Servi-Tech Laboratories (Amarillo, Texas), and individually analyzed for
pH, salts, OM, total N, P, K, S, Ca, Mg, Na, Zn, and CEC.
2014 Treatments and Application
Treatments and their application were comparable to those used for the 2014-
2015 wheat crop experiment, which contained four treatments and a single control, with
four replications each, with the exception of the compost treatment, of which none was
treated with any NBPT additive and contained eight replications. Further, the compost
treatments were applied identically to those used in the 2013-2014 wheat crop
experiment, with the compost being disc plowed into the seed bed prior to planting.
Randomization of the plots was conducted in the same manner as the wheat plots (Figure
3.2).

44
Figure 3.2 2014 corn plot map and designated treatment applications
NORTH↑ A B C D
1 Comp UAG UNY UNY
2 Comp Cntrl Cntrl Comp
3 U Comp U Cntrl
4 UNY UAG Comp UAG
5 UAG U Comp Comp
6 Cntrl U Comp UNY
Control = Cntrl Urea + Agrotain® Ultra = UAG Urea = U
Compost = Comp Urea + N-YieldTM = UNY
Treatments were prepared and applied as follows:
Control (Cntrl)-
No compost or fertilizer was applied to the designated plots
Compost (Comp)-
8.34kg (18.4lbs) of compost per plot; rate of compost application
was calculated based upon 4483.40kg ha-1 (2 tons ac-1); applying
approximately 16.8kg N ha-1 (15lbs N ac-1) according to compost
analysis data (Table 2.1)
45
Applied evenly throughout each of four designated plots, then
tilled into the soil bed immediately prior to planting on May 30,
2014
Urea (U)-
694g of urea prills (46% N) per plot, based upon an application
rate of 168.13kg ha-1 (150lbs ac-1) for corn (Figure 3.3); applying
approximately 170.4kg N ha-1 (69lbs N ac-1)
broadcast applied by hand August 15, 2014, approximately 75 days
following planting
Irrigation applied immediately following treatment application, on
August 15, 2014
Urea + Agrotain® Ultra (UAG)-
694g of urea prills (46% N) treated with the NBPT N stabilizer
additive Agrotain® Ultra (26.7% NBPT by weight) at the
recommended application rate of three quarts per ton (2.2ml for
every 694g urea); applying approximately 170.4kg N ha-1 (69lbs N
ac-1)
broadcast applied by hand August 15, 2014, approximately 75 days
following planting
Irrigation applied immediately following treatment application, on
August 15, 2014
Urea + N-yieldTM (UNY)-

46
694g of urea prills (46% N) treated with the NBPT N stabilizer
additive N-yieldTM (20% NBPT by weight) at the recommended
application rate of 3qts ton-1 (2.2ml for every 694g urea); applying
approximately 170.4kg N ha-1 (69lbs N ac-1)
broadcast applied by hand August 15, 2014, approximately 75 days
following planting
Irrigation applied immediately following treatment application, on
August 15, 2014
Figure 3.3 Urea measured for 2014 and 2015 corn treatments 3, 4 and 5

47
Irrigation was applied immediately following application of all treatments and
was continued at regular intervals and levels until September 18, 2014, just prior to
harvest.
2014 Ground Site Preparation
For the 2014 growing season, 24 field plots of equal size, 6.096 meters X 3.048
meters (20 feet X 10 feet), were laid out in a six by four grid, immediately adjacent to the
wheat plots described above. Each individual plot contained approximately 18.581m2
(200ft2) or 0.002 hectare (.005 acre), with the total plot area measuring 18.288 meters X
24.384 meters (60 feet X 80 feet), containing approximately 445.93m2 or 0.045 hectare
(0.111 acre).
Prior to cultivation, it was necessary to apply irrigation water to soften the soil
bed for plowing, again as a result of drought conditions creating an impervious seed bed.
The plots were also treated with a pre-emergent herbicide (Ortho® Weed B Gon®) to
assist in the control of weeds. However, mid-season it became evident that weed control
throughout the plots was to be a continuous problem (Figure 3.4). It became necessary to
enact other physical forms of weed control, such as hoeing and operation of a weed eater,
in order to effectively reduce the rapidly invading weed population.

48
Figure 3.4 2014 corn plots showing intense weed problem
As with the wheat crop, all corn plots were plowed east to west, using
conventional tillage practices on May 30, 2014. Each plot consisted of four rows with
corn planted on 76.2cm (30in) centers.
2015 Treatments and Application
Field experiments for the 2015 growing season were set up similarly to the 2014
corn crop. However, germination of the most easterly plots (column D) was not
successful enough to produce a proper stand for adequate data collection in this study.
Therefore, although treatments and their application were equivalent to those used for the
2014 corn crop, the treatments for the 2015 growing season consisted of only three
replications each for the control and urea treatments (untreated and treated), and six
replications for the compost treatments.

49
Treatments were prepared and applied as follows:
Control (Cntrl)-
No compost or fertilizer was applied to the designated plots
Compost (Comp)-
8.34kg (18.4lbs) of compost per plot; rate of compost application
was calculated based upon 4483.40kg ha-1 (2 tons ac-1); applying
approximately 16.8kg N ha-1 (15lbs N ac-1) according to compost
analysis data (Table 2.1)
Applied by hand August 31, 2015, approximately 58 days
following planting; not incorporated into the soil bed
Urea (U)-
694g of urea prills (46% N) per plot, based upon an application
rate of 168.13kg ha-1 (150lbs ac-1) for corn (Figure 3.3); applying
approximately 170.4kg N ha-1 (69lbs N ac-1)
Applied by hand August 31, 2015, approximately 58 days
following planting
Urea + Agrotain® Advanced (UAG)-
694g of urea prills (46% N) treated with the NBPT N stabilizer
additive Agrotain® Advanced (30% NBPT by weight) at the
recommended application rate of 2qts ton-1 (1.45ml for every 694g
urea); applying approximately 170.4kg N ha-1 (69lbs N ac-1)
Broadcast applied by hand August 31, 2015, approximately 58
days following planting

50
Urea + N-yieldTM (UNY)-
694g of urea prills (46% N) treated with the NBPT N stabilizer
additive N-yieldTM (20% NBPT by weight) at the recommended
application rate of 3qts ton-1 (2.2ml for every 694g urea); applying
approximately 170.4kg N ha-1 (69lbs N ac-1)
broadcast applied by hand August 31, 2015, approximately 58 days
following planting
Randomization of the plots resulted in a completely randomized plot design
(Figure 3.5).
Figure 3.5 2015 corn plot map and designated treatment applications
NORTH↑ A B C D
1 UAG U Cntl Not viable
2 U UNY Comp Not viable
3 Comp Cntl UNY Not viable
4 Comp UAG Comp Not viable
5 UNY Comp UAG Not viable
6 Cntl U Comp Not viable
Control = Cntrl Urea + Agrotain® Ultra = UAG Urea = U
Compost = Comp Urea + N-YieldTM = UNY

51
No precipitation occurred immediately following application of treatments and
irrigation was withheld for a total of 10 days, then applied at regular intervals and levels
until harvest on October 5, 2015.
2015 Ground Site Preparation
Originally, for the 2015 growing season, 24 field plots identical to those used for
the 2014 growing season were established and cultivated on June 10, 2015. However, due
to the midseason weed problems that occurred during the 2014 growing season, a more
effective pre-emergent herbicide, QuinStar®, was chosen to be applied to the
experimental plots pre-cultivation, on June 3, 2015. Two weeks post planting it became
evident the seed germination rate had been significantly reduced by the application of
QuinStar® herbicide, and a sufficient stand would not be produced from the initial
planting.
A new experimental plot site for the corn, located directly west of the wheat plots
was prepared and planted on July 3, 2015. Ground preparation was identical to that of the
2014 growing season site. However, pre-emergent herbicides were not used prior to the
cultivation or planting in the preparation of this site. Once the seed germinated and a
population was reasonably established, Roundup® herbicide was applied to assist with
weed control.
Once again, all 24 corn plots were plowed east to west, using conventional tillage
practices with each plot consisting of four rows with seeds planted on 76.2cm (30in)
centers.

52
Corn Crop
Channel 216-49VT3P variety field corn (Zea mays L.) was planted on May 30,
2014, for the 2014 growing season with a replant of all the plots due to poor germination
rates (<70%) on June 18, 2014 (Figure 3.6). Due to the germination problem with the
2014 corn crop, Northrup King N75H-GTA variety field corn (Zea mays L.) was chosen
to replace the Channel 216-49VT3P variety for the 2015 field experiment. The crop for
the 2015 growing season was originally planted on June 10, 2015, then fully replanted on
July 3, 2015, due to further germination issues that occurred during the 2015 growing
season caused by erroneous herbicide application. The seeding rate for both growing
seasons was 64,248 seeds ha-1 (26,000 seeds ac-1) across all field plots for both years.
Figure 3.6 2014 corn seed in planter at planting
Precipitation and Irrigation
Total precipitation for the 2014 growing season (May 30, 2014 through October
3, 2014) was approximately 34.67cm (13.65in) (The Climate Corporation, 2015), with

53
the mean precipitation for this period calculated to be around 32.94cm (12.97in) (NOAA,
2015). During the 2015 growing season (July 3, 2015 through October 5, 2015) the total
precipitation was approximately 23.06cm (9.08in) (The Climate Corporation, 2015), with
the mean precipitation during this period calculated to be approximately 25.53cm
(10.05in) (NOAA, 2015).
Due to limited precipitation and the standard demands of corn crops in general,
irrigation was applied (Figure 3.7) at regular intervals and levels to insure crop survival
beginning May 30, 2014, through September 18, 2014, for the 2014 growing season, and
beginning July 3, 2015, through September 30, 2015, for the 2015 growing season.
Irrigation amounts for the 2014 growing season totaled 29.44cm (11.59in), with 45.41cm
(17.87in) being the total irrigation applied during the 2015 growing season.
Total precipitation and irrigation combined was approximately 64.11cm (25.24in)
for the 2014 growing season and 68.47cm (26.96in) for the 2015 growing season.
Figure 3.7 2015 corn irrigation system set up

54
Harvest Samples
The 2014 corn crop was harvested on October 3, 2014 and the 2015 corn crop was
harvested on October 5, 2015. Five plants from two rows located in the center of each
plot were removed from the plots at ground level. The area from where the plants were
harvested was measured in order for total dry matter per area to be calculated. The whole
plant samples were placed in a drying oven at 60°C for a total of 14 days. Once dry, all
plot samples were weighed (Figure 3.8) and total biomass per plot per acre was
calculated. After collecting biomass data, all samples (24 for 2014; 18 for 2015) were
sent to Servi-Tech Laboratories, Amarillo, Texas, for quality analysis. Analysis data
included total N, P, K, Ca, Mg, S, Zn, Fe, Mn, Cu, B, and Na content.
Lab analysis of the corn for both the 2014 and 2015 harvest years was done solely
on the corn stover due to limited availability of grain as a result of deer and rodent
infestation of the field plots.
Figure 3.8 Weighing of corn for biomass calculations

55
Statistical Analysis
All statistical data analysis was conducted using SAS© (v9.4 TS Level 1M2,
Copyright 2002-2012 by SAS Institute, Inc., Cary, NC, USA). Statistically significant
differences were ascertained at α = 0.05.
Nutrient content data for each year’s harvested corn crop (corn stover) was
analyzed for total nutrient content for each treatment group for each year. ANOVA was
calculated for N, P, K, and S content for both the 2014 and 2015 harvest years, in order to
identify any significant differences among treatments for each year’s harvested corn
stover.
When results of the ANOVA produced significant differences, a means separation
test was conducted using Tukey’s HSD.
Results and Discussion
Biomass
The UNY treatment had the highest average biomass weight for both harvest
years, 5858 kg ha-1 and 4893.5 kg ha-1 for 2014 and 2015 respectively (Figures 3.9 and
3.10). Data showed the lowest average biomass weights varied among the remaining
treatments in both years with no consistency among those treatments.
While the data suggests that applying urea treated with N-Yield increases plant
biomass marginally, it does not affirm that the application of urea treated with NBPT
significantly augments plant biomass. Further, results of the ANOVA tests for both 2014
and 2015 harvested corn stover (Figures 3.11 and 3.12) showed no statistical differences
among treatments with regard to biomass weights. However, since corn plant biomass
weight is greatly dependent upon the size and number of grain kernels per ear per plant,

56
these results may not be truly representative of treatment effects due to the loss of grain
and the data that would be associated with it.
Figure 3.9 2014 corn biomass averages (kg ha-1) by treatment. Each bar represents the overall mean for
each treatment group with error bars indicating the standard error, estimating the variability between
samples throughout each treatment.
Figure 3.10 2015 corn biomass averages (kg ha-1) by treatment. Each bar represents the overall mean
for each treatment group with error bars indicating the standard error, estimating the variability between
samples throughout each treatment.
4,5225,015
5,6385,116
5,858
0
1000
2000
3000
4000
5000
6000
7000
Cntrl Comp U UAG UNY
KG
HA
-1
TREATMENT
2014 CORN BIOMASS
4,603
3,667 3,847 4,053
4,894
0
1000
2000
3000
4000
5000
6000
7000
Cntrl Comp U UAG UNY
KG
HA
-1
TREATMENT
2015 CORN BIOMASS

57
Figure 3.11 2014 corn biomass boxplot in kg ha-1 for each treatment. Each box represents 50% of the
values with the line contained within the box representing the median and the diamond marker
representing the mean value.
Figure 3.12 2015 corn biomass boxplot in kg ha-1 for each treatment. Each box represents 50% of the
values with the line contained within the box representing the median and the diamond marker
representing the overall mean value.

58
Nutrient Content
Lab analysis of the corn stover dry matter showed that Treatment U and
Treatment UAG contained the largest quantities of N on average for both the 2014 and
2015 harvest years, with the means for Treatment U being 1.53% for 2014 and 1.25% for
2015, and the means for Treatment UAG being 1.80% for 2014 and 1.27% for 2015
(Figure 3.13 and 3.14). Significant differences (p<0.0367) were found between
Treatment UAG and each of the other treatments in 2014, while in 2015, the test results
reflected that both Treatment U and Treatment UAG were significantly higher
(p<0.0030) in N content than all other treatments, with no difference being found
between Treatment U and Treatment UAG (Table 3.1 and 3.2). While this outcome is in
favor of NBPT being instrumental in increasing N uptake, it is not wholly conclusive for
the reason that only one of the treatments containing NBPT was found to improve N
uptake over that of the other treatments.

59
Table 3.1 Mean nutrient content of 2014 corn stover (percentage on dry weight basis). Means in the
same column within the same nutrient type with the same letter were not significantly different using
Tukey’s HSD
Nutrient Treatment Mean
Cntrl 0.95a
Comp 1.04ab
N UNY 1.34ab
U 1.25b
UAG 1.80b
UNY 0.19a
U 0.25ab
P Comp 0.25ab
UAG 0.28ab
Cntrl 0.36b
U 1.52a
Comp 1.56a
K UAG 1.63a
Cntrl 1.66a
UNY 1.91a
Cntrl 0.09a
UAG 0.10a
S UNY 0.10a
Comp 0.12a
U 0.14a

60
Table 3.2 Mean nutrient content of 2015 corn stover (percentage based on dry weight basis). Means in
the same column within the same nutrient type with the same letter are not significantly different using
Tukey’s HSD
Nutrient Treatment Mean (%)
Comp 0.66a
UNY 0.96ab
N Cntrl 1.04ab
U 1.25b
UAG 1.27b
Comp 0.28a
UNY 0.29a
P UAG 0.30a
Cntrl 0.33a
U 0.34a
Comp 1.14a
UAG 1.23a
K U 1.31a
UNY 1.46a
Cntrl 1.46a
Comp 0.06a
UNY 0.08ab
S UAG 0.09bc
Cntrl 0.10bc
U 0.11c

61
Figure 3.13 2014 corn stover N content. Each bar represents the overall mean for each treatment group
with error bars indicating the standard error, estimating the variability between samples throughout
each treatment.
Figure 3.14 2015 corn stover N content. Each bar represents the overall mean for each treatment group
with error bars indicating the standard error, estimating the variability between samples throughout
each treatment.
0.951.09
1.53
1.80
1.34
0.00
0.20
0.40
0.60
0.80
1.00
1.20
1.40
1.60
1.80
2.00
CNTRL COMP U UAG UNY
% N
TREATMENT
2014 CORN N CONCENTRATION
1.04
0.81
1.25 1.27
0.96
0.00
0.20
0.40
0.60
0.80
1.00
1.20
1.40
1.60
1.80
2.00
CNTRL COMP U UAG UNY
% N
TREATMENT
2015 CORN N CONCENTRATION

62
While the results related to N content in corn contrast somewhat with those
documented by McClallen, 2014, it is important to note that the McClallen research
focused on grain protein only, not whole plant content, while this study lacks grain
content data and is based solely upon corn stover data. Since corn grain generally
contains approximately 59% of the total N contained within the corn plant (International
Plant Nutrition Institute, 2011), it is difficult to accurately access total N concentrations
in this study without adequate grain analysis data, also making it challenging to calculate
total N uptake.
In 2014, the only other nutrient that exhibited a statistical difference (α=0.05)
among treatments was found in the comparison of the means related to corn P content.
Treatment Cntrl contained the highest concentration of P for the 2014 harvest (Figure
3.15), while Treatment U contained the highest concentration for the 2015 harvest
(Figure 3.16). Results of Tukey’s HSD test for 2014 P concentration showed differences
(p<0.006) between Treatment Cntrl and Treatment UAG, with all other treatments
showing no difference between each other or Treatment Cntrl or Treatment UAG (Table
3.1). The P content of the corn harvested in 2015 showed no statistical differences
(p<0.08) within treatments (Table 3.2).

63
Figure 3.15 2014 corn stover P content. Each bar represents the overall mean for each treatment group
with error bars indicating the standard error, estimating the variability between samples throughout
each treatment.
Figure 3.16 2015 corn stover P content. Each bar represents the overall mean for each treatment group
with error bars indicating the standard error, estimating the variability between samples throughout
each treatment.
0.36
0.26 0.250.28
0.19
0.00
0.05
0.10
0.15
0.20
0.25
0.30
0.35
0.40
CNTRL COMP U UAG UNY
% P
TREATMENT
2014 CORN P CONCENTRATION
0.33 0.320.34
0.30 0.29
0.00
0.05
0.10
0.15
0.20
0.25
0.30
0.35
0.40
CNTRL COMP U UAG UNY
% P
TREATMENT
2015 CORN P CONCENTRATION

64
Although K content of the corn stover for both the 2014 and 2015 harvest seasons
(Figure 3.17 and 3.18) showed slight mean variation among treatments, with the highest
concentrations being 1.91% in Treatment UNY for the 2014 harvest year, and 1.46% in
Treatment Cntrl for the 2015 harvest year, the results of the ANOVA tests did not
conclude that any significant differences (2014 p<0.80 and 2015 p<0.20) existed for
either year (Table 3.1 and 3.2).
The corn stover S content for the 2014 harvest year was highest in Treatment
UAG (Figure 3.19), but statistical analysis exhibited no significant differences (p<0.16)
within treatments (Table 3.1). However, the corn stover data for the 2015 harvest year for
S content was highest in Treatment U (Figure 3.20) with significant differences
(p<0.0008) being found between Treatment Comp and Treatments Cntrl, U and UAG,
and between Treatment U and Treatment UNY (Table 3.2).

65
Figure 3.17 2014 corn stover K content. Each bar represents the overall mean for each treatment group
with error bars indicating the standard error, estimating the variability between samples throughout
each treatment.
Figure 3.18 2015 corn stover K content. Each bar represents the overall mean for each treatment group
with error bars indicating the standard error, estimating the variability between samples throughout
each treatment.
1.66 1.641.52
1.63
1.91
0.00
0.20
0.40
0.60
0.80
1.00
1.20
1.40
1.60
1.80
2.00
CNTRL COMP U UAG UNY
% K
TREATMENT
2014 CORN K CONCENTRATION
1.46
1.171.31
1.231.12
0.00
0.20
0.40
0.60
0.80
1.00
1.20
1.40
1.60
1.80
2.00
CNTRL COMP U UAG UNY
% K
TREATMENT NUMBER
2015 CORN K CONCENTRATION
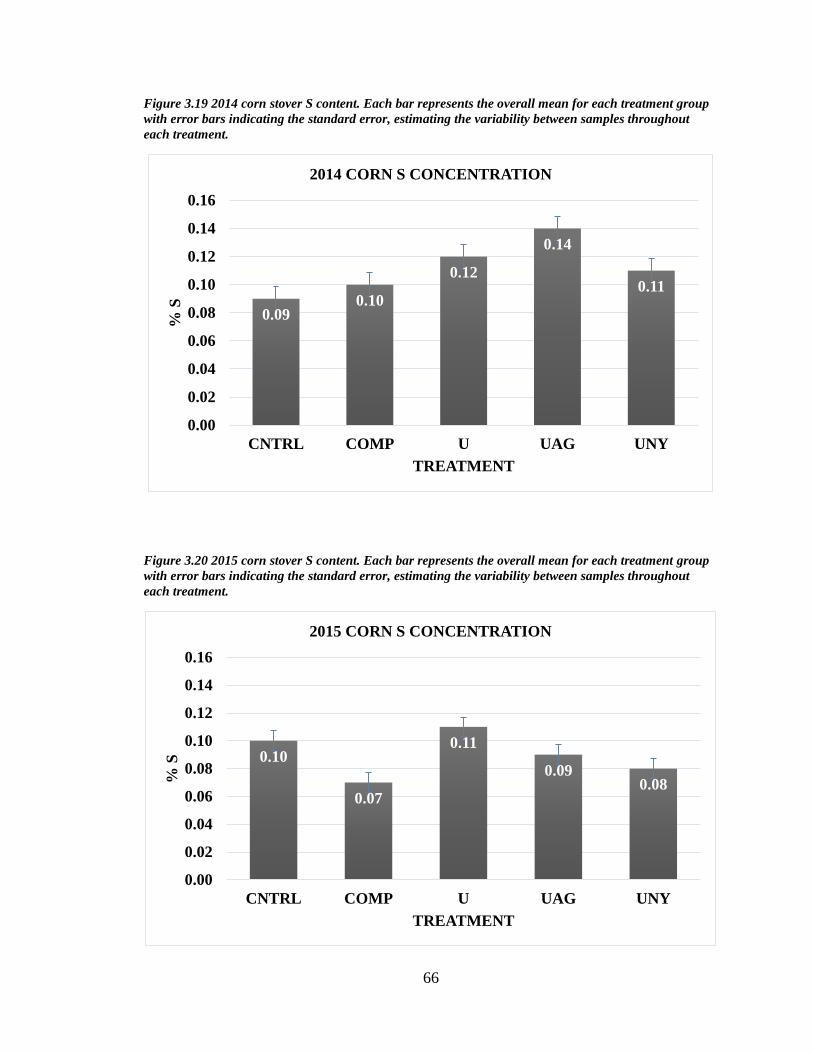
66
Figure 3.19 2014 corn stover S content. Each bar represents the overall mean for each treatment group
with error bars indicating the standard error, estimating the variability between samples throughout
each treatment.
Figure 3.20 2015 corn stover S content. Each bar represents the overall mean for each treatment group
with error bars indicating the standard error, estimating the variability between samples throughout
each treatment.
0.090.10
0.12
0.14
0.11
0.00
0.02
0.04
0.06
0.08
0.10
0.12
0.14
0.16
CNTRL COMP U UAG UNY
% S
TREATMENT
2014 CORN S CONCENTRATION
0.10
0.07
0.11
0.090.08
0.00
0.02
0.04
0.06
0.08
0.10
0.12
0.14
0.16
CNTRL COMP U UAG UNY
% S
TREATMENT
2015 CORN S CONCENTRATION

67
Soil Nitrogen
Nitrogen Mass Balance
A total mass balance was calculated for N (Table 3.3). Loss of N is designated by
positive balances, while N gain is designated by negative balances. Nitrogen losses may
be explained by leaching, runoff, volatilization, or experimental/sampling error, while N
gains may be accounted for by bacterial N fixation, unaccounted for rainfall N, or
experimental/sampling error.
Table 3.3 Soil nitrogen mass balance for corn based upon N concentration averages per treatment. All
calculations are in kg/ha.
Year Treatment Initial Ending Added Removed Balance
Cntrl 17.37 20.74 0 44.19 -47.56
Comp 24.10 21.58 7.40 65.58 -55.66
2014 U 21.58 20 .18 77.34 91.39 -12.65
UAG 24.10 17.09 77.34 93.91 -9.56
UNY 39.51 19.33 77.34 82.52 15
Cntrl 21.66 22.04 0 48.64 -49.02
Comp 17.93 14.94 7.40 22.47 -12.08
2015 U 19.42 20.55 77.34 48.97 27.24
UAG 14.20 21.67 77.34 51.65 18.22
UNY 19.05 22.79 77.34 47.66 25.94
In both 2014 and 2015, N removal rates were highest in Treatments UNY, UAG,
and U, all of which contained urea or urea treated with NBPT solution. While this is a
notable observation, it is also an expected result in that urea contributes an additional
68.93 kg ha-1 of N to the soil as compared to the compost treatments, and an additional
77.34 kg ha-1 of N to the soil as compared to the control.
Treatment UNY exhibited the highest N removal rate for both years. This
suggests that the NBPT concentration rate, which is greater in Treatment UAG than in

68
Treatment UNY, may have some effect on N uptake. However, statistical analysis
conducted on the N removal rates illustrated no significant differences within treatments.
Summary
From the data collected, it can be concluded that the addition of NBPT, as
Agrotain®, to urea prior to application increases N concentrations in harvested corn as
compared all other treatments. In both 2014 and 2015, the corn harvested that received
the treatment containing urea + Agrotain® contained the greatest amount of N
concentration. Statistical analysis found that the treatment containing urea + Agrotain®
was significantly different from the control in 2014, and the compost treatment in 2015.
No other statistical differences were ascertained between any other treatments.
Nitrogen removal rates observed in the mass balance calculations for both years
show that the urea treatments containing Agrotain® have higher removal rates than all
other treatments. Even though the mass balance N removal rates are not significantly
different, the results support the N concentration results from the main effect data.
The results of this field study show that urea + Agrotain® performed better than
any other treatment, including urea + N-YieldTM, to increase N content in corn.
Contrastingly, the McClallen (2014) field study reported that N-YieldTM performed better
than Agrotain®, contradicting the results of this study. These conflicting results may be
explained by the possible decomposition of the N-YieldTM sample used in this field study.
In both harvest years, the treatment containing urea + N-YieldTM did not perform as well
as in the wheat portion of this study, or as well as in any portion of the McClallen (2014)
study. There were concerns at the time of treatment application about the shelf life of the
product on hand, as it was already over 3+ years old. There is a possibility that the

69
product used was in a state of decay and was not as effective as it would have been if a
new sample of N-YieldTM had been obtainable at the time of this study. Observations
made by Watson et al. (2008), concluded that NBPT is sensitive to decomposition, and
provides some support for this theory.

CHAPTER FOUR
CONCLUSION
The objectives of this research study were to evaluate the effect and compare the
performance of urea fertilizer treated with the urease inhibitor, NBPT, with that of
untreated urea fertilizer, and compost on the N content of hard red winter wheat and corn
upon harvest. Although it is evident that urea treated with NBPT does increase N uptake
and N removal rates in wheat and corn, no pattern was found upon statistical analysis of
the data collected in either the wheat or corn studies to suggest that the use of NBPT with
urea will produce results that are significantly different than those that would be attained
by the use of urea alone.
Future Research
It is still unclear if NBPT treated urea significantly improves N removal rates in
wheat, due to missing biomass calculations in this study. Without this information it is
difficult to ascertain if volatilization and leaching are being reduced. Further research
focusing specifically on N removal rates in wheat would be advantageous to evaluate the
effectiveness of NBPT.
Although it was determined that no statistical differences were found among urea
treatments in this study, the urea treatments containing NBPT, whether it was Agrotain or
N-Yield, exhibited the highest N concentrations of any of the treatments. Further, studies
should be conducted to evaluate the possible economic value, if any, of using NBPT.

71
Future research, on a longer timeline and larger scale, is needed in order to
resolve the result conflicts between harvest years within this study, and the McClallen
(2014) corn field study. It would also be prudent to focus on the concentration percentage
of NBPT being used in order to determine whether or not higher concentrations boost the
potential for increasing N uptake, thereby increasing the probability of reducing N loss.

72
REFERENCES CITED
Black, A. S., et al. “Effects of form of nitrogen, season and urea application rate on
ammonia volatilization from pasture.” New Zealand Journal of Agricultural
Research 28 (1985): 469-74.
Black, A. S., R. R. Sherlock, and N. P. Smith. “Effect of timing of simulated rainfall on
ammonia volatilization from urea, applied to soil of varying moisture content.”
Journal of Soil Science 38 (1987): 679-687.
Bolan, N., et al. “Bioavailability of N, P, K, Ca, Mg, S, Si, and micronutrients.”
Handbook of Soil Sciences Resource Management and Environmental Impacts 2nd
Edition (2012) 11:1-11:9.
Bremner, J. M. “Recent research on problems in the use of urea as a nitrogen fertilizer.”
Fertilizer Research 42 (1995): 321-329.
Brown, P. L. “Water use & soil water depletion by dryland wheat as affected by nitrogen
fertilization.” Agronomy Journal 1 (1971): 43-46. Agricola. Web. 24 Oct. 2013.
Byrnes, B., and J. Freney. “Recent developments on the use of urease inhibitors in the
tropics.” Nutrient Cycling in Agroecosystems 42 (1995): 251-259.
Chien, S. H.. L. I. Prochnow, and H. Cantarella. “Recent developments of fertilizer
production and use to improve nitrogen efficiency and minimize environmental
impacts.” Advances in Agronomy 102 (2009): 267-322.
Climate Corporation, The. https://climate.com/static/weather/index.html?field-group-
id=1653981&client-id=135583#widget=past. Web. 2 Jan. 2014.
Creason, G. I., et al. “Urease inhibitory activity associated with N-(n-butyl) thio-
phosphoric triamide is due to formation of its oxon analog.” Soil Biology and
Biochemistry 22 (1990): 209-211. Science Direct. Web. 2 Feb. 2014.
Delogu, G., et al. “Uptake and agronomic efficiency of nitrogen in winter barley and
winter wheat.” European Journal of Agronomy 9 (1998): 11-20. Science Direct.
Web. 24 Oct. 2013.
Dia, Xinglong, et al. “Managing the seeding rate to improve nitrogen-use efficiency of
winter wheat.” Field Crops Research Article In Press (2013). Science Direct.
Web. 24 Oct. 2013.
Fageria, N. K. and V. C. Baligar. “Enhancing nitrogen use efficiency in crop plants.”
Advance in Agronomy 88 (2005): 97-185.

73
Fillery, I. R. P., J. R. Simpson, and S. K. De Datta. “Influence of field environment and
fertilizer management on ammonia loss from flooded Rice.” Soil Science Society
of America Journal 48 (1984): 914-920.
Gayon, U., and G. Dupetit. “Sur la fermentation des nitrates.” Proceedings of the
Academy of Science 95 (1882): 644-646.
Germon, J. C. and L. Philippot. “Nitrogen transformations.” Denitrification. Handbook of
Soil Sciences Resource Management and Environmental Impacts 2nd Edition
(2012) 27.4.
Gezgin S. and F. Bauyrakll. “Ammonia volatilization from ammonium sulphate,
ammonium nitrate, and urea surface applied to winter wheat on a calcareous soil.”
Journal of Plant Nutrition 18 (1995): 2483-2494.
Gilbert, P., et al. “Escalating worldwide use of urea – a global change contributing to
coastal eutrophication.” Biogeochemistry 77.3 (2006): 441-463. Academic Search
Complete. Web. 8 July 2015.
Gioacchini, P., A. Nastri, and C. Marzadori. “Influence of urease and nitrification
inhibitors on N losses from soils fertilized with urea.” Biology and Fertility of
Soils 36 (2002): 129-135.
Hayashi, K., S. Nishimura, and K. Yagi. “Ammonia volatilization from a paddy field
following applications of urea: rice plants are both an absorber and an emitter for
atmospheric ammonia.” Science of the Total Environment 390 (2008): 485-494.
Hendrickson, L. L. “Corn yield response to the urease inhibitor N-(nbutyl)
thiophosphoric triamide: 5 year summary.” Journal of Production Agriculture 5
(1992): 131-137.
Hilton, B. R., P. E. Fixen, and H. J. Woodard. “Effects of tillage, nitrogen placement and
wheel compaction on denitrification rates in the corn cycle of a corn-oats
rotation.” Journal of Plant Nutrition 17 (1994): 1341-1357.
James, D. W. “Urea: a low cost nitrogen fertilizer with special management
requirements.” Utah State University Cooperative Extension Fact Sheet 2010.
Retrieved from
http://extension.usu.edu/files/publications/publication/AG_283.pdf. Web. 15 Jan.
2015.
Johnston, A. E. and P. R. Poulton. “Nitrogen in agriculture: an overview and definitions
of nitrogen use efficiency.” Proceedings International Fertiliser Society (2009)
651, York, UK.

74
Lauer, D. A., D. R. Bouldin, and S. D. Klausner. “Ammonia volatilization from dairy
manure spread on the soil surface.” Journal of Environmental Quality 5 (1976):
134-141.
Liang, B. C. and A. F. MacKenzie. “Corn yield, nitrogen uptake and nitrogen use
efficiency as influenced by nitrogen fertilization.” Canadian Journal of Soil
Science 74 (1994): 235-240. Science Direct. Web. 10 Jan. 2014.
Lian-Peng, L., et al. “Effects of nitrogen management on the yield of winter wheat in
cold area of northeastern China.” Journal of Integrative Agriculture 11.6 (2012):
Science Direct. Web. 24 Oct. 2013.
McClallen, M. “Wheat, rice and corn response to the urease inhibitor N-(n-butyl
thiophosphoric triamide) in a dimethyl sulfoxide/propylene glycol solution.”
Master’s thesis, West Texas A&M University, 2014.
Nassiri-Mahallati, M., et al. “Nitrogen use efficiency of wheat as affected by preceding
crop, application rate of nitrogen and crop residues.” Australian Journal of Crop
Science 4.5 (2010). 363-368. Academic Search Complete. Web. 24 Oct. 2013.
National Centers for Environmental Information, National Oceanic and Atmospheric
Administration (“NOAA”). www.ncdc.noaa.gov/cag/. Web. 27 Jun 2015.
Overdahl, C. J., G. W. Rehm, and H. L. Meredith. “Fertilizer urea.” University of
Minnesota Extension (2014). Retrieved from
http//:www.extension.umn.edu/agriculture/nutrient
management/nitrogen/fertilizer-urea/. Web. 15 Jan 2015.
Rahimizadeh, Majid, et al. “Nitrogen use efficiency of wheat as affected by preceding
crop, application rate of nitrogen and crop residues.” Australian Journal of Crop
Science 4 (5) (2010): 363-368.
Raun, W. R. and G. V. Johnson. “Improving nitrogen use efficiency for cereal
production.” Agronomy Journal 91 (1999): 357-363. Agricola. Web. 24 Oct.
2013.
Reginato, R. J., et al. “Winter wheat response to water and nitrogen in the North
American Great Plains.” Agricultural and Meteorology 44.2 (1988): 105-116.
Science Direct. Web. 24 Oct. 2013.
Rochette, P., et al. “Ammonia volatilization following surface application of urea to tilled
and no-till soils: a laboratory comparison.” Soil & Tillage Research 103 (2009):
310-315.

75
Sanz-Cobena, A., et al. “Effect of water addition and the urease inhibitor NBPT on the
abatement of ammonia emission from surface applied urea.” Atmospheric
Environment 45. (2011): 1517-1524. Science Direct. Web. 10 Apr. 2015.
Sharma, B. R. and T. N. Chaudhary. “Wheat root growth, grain yield, and water uptake
as influenced by soil water regime and depth of nitrogen placement in a loamy
sand soil.” Agriculture Water Management 6 (1983): 356-373. Agricola. Web. 24
Oct. 2013.
Sheaffer, C. C. and K. M. Moncada. “Introduction to agronomy: food, crops and
environment.” 1st. Clifton Park, New York: Delmar Cengage Learning, 2009.
225-228. Print.
Singh, J., et al. “Impact of urease inhibitor on ammonia and nitrous oxide emissions from
temperature pasture soil cores receiving urea fertilizer and cattle urine.” Science
of the Total Environment (2013) (in press):
http://ds.doi.org/10.1016/jscitotenv.2013.02.018.
Soares, J. R., H. Cantarella, and M. L. de Campos Menegale. “Ammonia volatilization
losses from surface applied urea with urease and nitrification inhibitors.” Soil
Biology and Biochemistry 52 (2012): 82-89.
Sommer, S. G. and N. Hutchings. “Techniques and strategies for the reduction of
ammonia emission from agriculture.” Water, Air and Soil Pollution 85 (1995):
237-248.
Teixeira, E. I., et al. “Sources of variability in the effectiveness of winter cover crops for
mitigating N leaching.” Agriculture, Ecosystems and Environment 220 (2016):
226-235.
US Climate Data. www.usclimatedata.com/climate/texas/united-states/3213. Web. 15
Sept. 2015
USDA. “Fertilizer use and price - U.S. consumption of selected nitrogen materials.”
United States Department of Agriculture, Economic Research Service,
Washington, DC, USA. (2012).
http://www.ers.usda.gov/datafiles/Fertilizer_Use_and_Price/Fertilizer_Consumpti
on_and_UseBy_Year_/table4.xls. Web. 10 May 2013
USDA-NCRS, 2015. https://soilseries.sc.egov.usda.gov/OSD_Docs/O/OLTON.html.
www.websoilsurvey.sc.egov.usda.gov/App/WebSoilSurvey.aspx.
Uzun, N. and R. Uyanoz. “Determination of urease catalase activities and CO2 respiration
in different soils obtained from semi-arid region Konya, Turkey.” Trends in Soil
and Plant Sciences Journal 2 (1) (2011): 1-6

76
Vojvodic, A., et al. “Exploring the limits: a low-pressure, low-temperature Haber- Bosch
process.” Chemical Physics Letters 598. (2014): 108-112. Science & Technology
Collection. Web. 10 Apr. 2015.
Watson, et al. “Rate and mode of application of the urease inhibitor N-(nbutyl
thiophosphoric triamide) on ammonia volatilization from surface-applied urea.”
Soil and Use Management 24 (2008): 246-253.

77
APPENDIX A
SOIL NUTRIENT CONTENT DATA

WHEAT PLOTS SOIL NUTRIENT DATA
0-6 inch soil nutrient concentrations for wheat plots. Samples taken September 27, 2013.
TRT pH Salts OM N P K S Ca Mg Na Zn CEC
1 6.3 0.13 1.1 2 58 389 6 1236 284 9 0.9 10
1 6.3 0.08 1 2 56 397 7 1209 287 11 1.1 10
1 6.3 0.11 1 2 62 437 5 1134 274 5 0.8 9
1 5.9 0.11 1.1 4 76 415 7 1087 259 9 1 9
2 6 0.12 1 1 64 423 7 1194 286 10 0.9 11
2 6 0.11 1 2 78 399 6 1084 246 6 0.9 10
2 6 0.14 1.1 4 73 415 6 1147 256 9 0.8 9
2 5.9 0.18 1.1 14 54 449 10 1344 321 12 1 12
3 6.2 0.06 1.1 1 40 359 5 1394 317 8 0.6 11
3 6 0.1 1 1 68 478 6 1193 290 7 0.9 11
3 6 0.06 1 1 63 403 7 1420 294 8 1.2 11
3 6.1 0.09 1 3 65 357 7 1155 248 9 1.1 9
4 6.1 0.06 1.1 2 51 396 6 1299 306 6 0.7 10
4 6.1 0.09 1 2 59 411 5 1178 288 5 0.7 11
4 6.6 0.21 1 4 61 410 14 1725 344 34 1.1 13
4 6 0.12 1 6 80 457 8 1153 253 9 0.9 10
5 6.3 0.1 1.1 2 57 327 6 1251 273 11 0.7 9
5 6 0.12 1 4 96 439 8 1044 233 6 0.9 10
5 5.9 0.09 1 6 79 384 7 974 216 8 0.8 9
5 6.3 0.14 1.1 7 41 365 10 1426 317 15 1.7 11
6 6 0.08 1 2 74 389 9 1127 291 13 0.9 10
6 6.2 0.13 1.2 3 70 462 5 1144 257 11 0.8 9
6 5.9 0.15 1 5 89 468 9 1150 259 8 0.8 10
6 5.8 0.14 1 10 89 389 8 1036 222 7 0.8 8

0-6 inch soil nutrient concentrations for wheat plots. Samples taken September 18, 2014
TRT pH Salts OM N P K S Ca Mg Na Zn Fe Mn Cu CEC
1 6.7 0.14 0.9 4 37 370 9 1322 301 29 0.7 30 19 1.2 10
1 6.7 0.14 1 4 40 405 7 1325 312 25 0.7 28 18 1.2 10
1 6.6 0.16 0.9 4 37 365 12 1320 318 27 0.6 26 18 1.1 10
1 6.6 0.2 0.9 4 50 367 18 1386 322 33 0.7 28 19 1.2 11
2 7 0.15 0.9 4 50 379 7 1341 342 40 0.9 24 15 1.2 11
2 6.7 0.14 0.9 4 59 412 6 1331 300 30 1.1 29 18 1.3 10
2 6.6 0.16 0.9 5 60 376 11 1321 295 33 0.8 27 17 1.2 10
2 7.4 0.17 1.1 7 58 472 8 1769 365 42 1.2 25 15 1.2 13
3 7.3 0.15 0.9 3 45 447 8 1615 351 42 0.9 25 15 1.2 12
3 7.1 0.13 0.9 3 53 382 7 1333 342 38 0.9 23 14 1.1 11
3 7 0.13 0.9 3 45 371 9 1401 333 42 0.7 23 16 1.1 11
3 6.8 0.15 0.9 4 55 392 6 1313 303 34 0.9 25 17 1.2 10
4 6.9 0.16 0.7 4 28 322 8 1439 350 45 0.7 23 15 1.1 11
4 6.8 0.14 0.9 5 32 351 7 1374 328 33 0.7 26 18 1.2 11
4 6.9 0.17 1 6 38 327 9 1566 363 27 0.9 24 15 1.2 12
4 6.6 0.19 0.9 9 61 357 10 1249 275 27 0.7 28 19 1.2 10
5 6.9 0.16 0.9 5 33 362 10 1451 328 25 0.9 27 19 1.3 11
5 6.8 0.17 0.9 6 50 360 9 1404 310 38 0.6 27 18 1.2 11
5 6.5 0.21 0.7 9 61 322 15 1277 274 42 0.6 29 19 1.2 10
5 6.9 0.21 0.8 11 60 330 9 1230 275 34 0.7 27 16 1.2 9
6 7 0.15 0.9 4 58 372 7 1452 317 33 0.7 29 19 1.2 11
6 7 0.17 0.9 7 67 385 9 1261 277 27 0.7 32 21 1.3 10
6 6.8 0.14 0.9 8 65 338 10 1229 280 28 0.7 28 16 1.2 9
6 6.2 0.2 0.9 9 67 375 11 1271 287 21 1.1 30 19 1.3 10

0-6 inch soil nutrient concentrations for wheat plots. Samples taken August 4, 2015
TRT pH Salts OM N P K S Ca Mg Na Zn Fe Mn Cu CEC
1 6.7 0.16 1.2 3 33 319 7 1220 295 30 0.8 35 15 1.1 10
1 7 0.19 1.2 3 36 335 3 1251 319 31 0.9 29 14 1.1 10
1 6.8 0.18 1.5 4 33 353 5 1216 318 22 0.8 29 15 1 10
1 7.1 0.12 1.5 <1 65 403 3 1105 320 19 1.1 36 15 1.1 9
2 6.9 0.09 1.2 1 55 364 3 1206 294 23 1 35 15 1.2 10
2 6.7 0.1 1.2 2 31 297 3 1245 290 20 0.8 27 17 1.2 9
2 7.1 0.13 1.3 2 35 363 3 1326 333 34 0.8 27 14 1.1 10
2 6.9 0.13 1.2 3 46 363 5 1260 309 28 0.9 33 17 1.2 10
3 6.9 0.12 1.2 2 35 381 4 1203 294 31 0.8 27 13 1.1 10
3 7.1 0.14 1.3 2 31 321 2 1343 335 30 0.7 26 15 1 10
3 7 0.13 1.2 2 34 309 6 1295 326 34 0.7 25 14 1 10
3 7 0.13 1.4 3 60 400 3 1276 298 26 1.2 36 14 1.1 10
4 6.8 0.1 1.2 1 29 294 3 1157 278 21 0.8 27 16 1.1 9
4 6.9 0.14 1.1 2 29 297 3 1145 288 27 0.9 27 15 1.1 9
4 6.7 0.1 1.2 2 32 318 3 1159 290 23 0.7 29 16 1.1 9
4 6.9 0.19 1.4 5 46 390 4 1499 331 37 1 31 15 1.2 11
5 6.8 0.14 1.3 2 36 313 1 1222 289 23 0.9 29 17 1.2 9
5 6.8 0.14 1.1 2 35 319 5 1220 307 30 0.8 28 16 1.1 10
5 6.9 0.16 1.3 4 31 357 4 1273 323 31 0.8 30 15 1.1 10
5 6.4 0.16 1.5 5 54 385 2 1077 266 16 0.9 43 19 1.2 9
6 6.8 0.17 1.2 2 31 356 6 1218 302 29 0.8 30 16 1.1 10
6 6.9 0.12 1.2 2 33 315 5 1205 301 29 0.8 29 16 1.2 9
6 6.6 0.1 1.3 3 30 319 4 1236 295 23 0.7 28 16 1.1 10
6 6.4 0.14 1.2 7 54 347 5 1069 259 18 0.8 42 18 1.1 8

CORN PLOTS SOIL NUTRIENT DATA
0-6 inch soil nutrient concentrations for corn east plots. Samples taken May 30, 2014.
TRT pH Salts OM N (ppm)
N (lbs/ac)
P K S Ca Mg Na Zn CEC
1 6.3 0.14 0.9 8 14 54 316 10 1100 256 46 0.6 9
1 6 0.17 0.9 8 14 64 292 8 876 222 23 0.7 7
1 6 0.12 0.9 9 16 70 381 7 1231 261 8 0.7 9
1 6.6 0.19 0.9 10 18 60 333 11 1222 282 56 0.6 10
2 6.4 0.18 0.9 9 16 61 325 6 1126 264 36 0.8 9
2 6.4 0.15 0.9 10 18 60 360 16 1125 260 62 1.1 9
2 5.7 0.17 0.9 14 25 81 410 8 1035 228 10 0.6 9
2 5.7 0.17 0.9 15 27 80 402 7 1036 226 6 0.6 9
3 6.3 0.21 0.9 11 20 68 353 14 1054 225 36 0.9 8
3 5.7 0.17 0.9 12 22 68 366 7 1057 222 7 0.7 9
3 5.5 0.15 0.9 14 25 86 394 11 1029 226 11 0.6 9
3 6.3 0.22 0.9 19 34 63 308 10 1111 275 53 0.7 9
4 5.9 0.11 0.9 8 14 71 375 8 1109 236 9 0.6 9
4 5.9 0.11 0.9 9 16 72 384 6 1092 242 9 0.6 9
4 6 0.22 0.9 12 22 62 329 10 1052 235 51 0.7 9
4 6.7 0.13 0.9 14 25 68 327 11 1087 258 61 0.9 9
5 5.7 0.12 0.9 9 16 71 350 10 1042 225 11 0.6 9
5 6.2 0.13 0.8 12 22 67 304 10 1133 249 33 0.7 9
5 5.7 0.14 1 13 23 78 388 8 1000 217 7 0.7 9
5 5.9 0.12 0.9 14 25 68 401 8 1234 256 6 0.7 9
6 5.8 0.12 0.9 6 11 70 353 6 972 213 5 0.7 9
6 5.9 0.12 0.9 11 20 73 331 9 1069 227 12 0.6 8
6 5.9 0.23 0.9 27 49 53 342 13 1054 232 32 0.5 9
6 5.5 0.31 0.9 34 61 74 373 15 995 241 37 0.7 9

0-6 inch soil nutrient concentrations for corn east plots. Samples taken June 2015.
TRT pH Salts OM N (ppm)
N (lbs/ac)
P K S Ca Mg Na Zn Fe Mn Cu CEC
1 6.4 0.16 0.9 6 14 25 306 5 1137 244 15 0.7 24 17 1.1 9
1 6.4 0.14 0.9 7 17 27 319 7 1114 260 23 0.6 30 18 1.1 9
1 6.4 0.15 1 8 19 12 303 6 1376 293 25 0.4 19 17 1.1 10
1 6.7 0.25 1.4 10 24 36 335 5 1242 323 28 0.8 28 15 1.2 10
2 6.8 0.13 1.3 3 7 30 363 4 1320 330 27 0.7 31 17 1.1 10
2 6.7 0.14 1.3 4 10 38 401 6 1311 317 27 0.8 35 17 1.1 10
2 6.8 0.16 1.1 5 12 24 319 4 1358 316 29 0.6 23 16 1 10
2 6.7 0.17 1.4 20 48 43 347 4 1214 343 26 0.8 25 15 1.1 10
3 6.6 0.14 1 4 10 28 317 6 139 263 24 0.7 35 19 1.2 9
3 6.4 0.17 1.2 5 12 35 338 5 1165 283 24 0.7 31 17 1.1 9
3 6.7 0.17 1.2 11 26 40 336 3 1191 318 27 0.8 25 15 1.1 10
3 6.8 0.18 1.3 13 31 46 350 3 1180 321 35 0.9 25 13 1 10
4 6.4 0.15 0.9 5 12 20 262 6 1110 245 19 0.6 26 19 1.1 8
4 6.5 0.16 1 7 17 24 343 6 1252 281 26 0.5 21 16 1 10
4 6.5 0.19 1.1 8 19 34 371 5 1081 248 19 0.8 22 15 1 9
4 6.3 0.19 1.1 10 24 38 354 6 1113 265 23 0.8 31 18 1.1 9
5 6.5 0.14 1.3 3 7 28 311 4 1273 303 23 0.7 26 16 1.1 10
5 6.4 0.12 0.9 6 14 24 285 5 1132 256 19 0.6 27 18 1.1 9
5 6.4 0.15 1.2 6 14 35 333 6 1268 272 26 0.7 28 16 1.1 10
5 6.4 0.18 1.2 11 26 41 391 6 1078 265 22 0.8 36 15 1.1 9
6 6.8 0.15 1.3 5 12 41 364 4 1268 309 23 0.7 33 17 1.1 10
6 6.5 0.15 0.9 6 14 31 364 4 1160 264 19 0.7 23 16 1.1 9
6 6.5 0.16 1.1 8 19 36 367 4 1209 288 26 0.8 29 17 1.1 9
6 6.3 0.18 1.1 10 24 42 398 6 1132 269 28 0.7 25 16 1.1 9

0-6 inch soil nutrient concentrations for corn west plots. Samples taken July 6, 2015.
TRT pH Salts OM N (ppm)
N (lbs/ac)
P K S Ca Mg Na Zn Fe Mn Cu CEC
1 6.6 0.17 0.9 11 26 38 454 8 1265 290 29 0.8 26 15 1.1 10
1 7.3 0.27 0.9 6 14 36 415 6 1877 375 30 0.9 20 11 1 14
1 6.5 0.21 1.1 8 19 31 366 6 1285 358 29 0.9 27 18 1.2 10
2 6.5 0.14 1.2 6 14 42 400 8 1170 273 21 0.9 33 16 1.2 9
2 6.4 0.12 0.9 5 12 35 318 6 1170 261 28 0.7 27 18 1.2 9
2 6.4 0.16 0.9 6 14 28 337 6 1283 279 19 0.7 26 18 1.1 10
3 7 0.22 1.4 13 31 48 332 8 1210 294 34 1 27 13 1.2 9
3 6.6 0.21 1.1 6 14 31 361 6 1170 260 19 0.7 27 16 1.1 9
3 6.5 0.2 1.1 9 22 41 731 8 2107 430 74 0.8 38 17 1.2 16
4 6.4 0.14 1.1 6 14 37 366 7 1291 303 30 0.8 28 16 1.2 10
4 7 0.2 1.2 12 29 44 364 5 1311 345 35 1 22 11 1 11
4 6.7 0.17 0.9 5 12 26 354 6 1360 310 28 0.7 22 15 1.1 10
5 7.2 0.19 1 9 22 45 317 7 1185 406 39 0.9 18 8 1 10
5 6.6 0.17 1 8 19 39 393 6 1209 281 24 1 23 13 1 9
5 6.5 0.2 1.1 7 17 41 383 8 1091 260 18 0.7 29 18 1.2 9
6 6.6 0.15 1 9 22 48 466 5 1147 269 20 0.9 26 13 1.2 9
6 6.7 0.15 1 7 17 30 357 5 1320 311 25 0.7 25 16 1.1 10
6 6.7 0.21 1.2 9 22 35 336 7 1201 266 23 0.8 27 14 1.1 9

0-6 inch soil nutrient concentrations for corn west plots. Samples taken October 19, 2015.
TRT pH Salts OM N (ppm)
N (lbs/ac)
P K S Ca Mg Na Zn Fe Mn Cu CEC
1 6.4 0.17 1.1 7 17 37 425 6 1474 339 20 0.9 30 19 1.3 11
1 6.8 0.16 0.9 7 17 35 344 6 1150 274 33 0.8 22 13 1 9
1 6.5 0.21 0.9 10 24 38 401 6 1165 261 33 0.9 22 14 1 9
2 6.4 0.14 0.9 5 12 38 326 5 1090 249 27 0.7 24 14 1 8
2 6.8 0.14 1.1 5 12 26 383 6 1558 340 29 0.8 24 15 1.2 12
2 6.7 0.18 0.9 6 14 28 377 5 1330 301 27 0.6 22 15 1.2 10
3 6.7 0.12 0.8 7 17 40 399 5 1149 285 27 0.9 27 13 1.1 9
3 6.4 0.13 0.9 7 17 31 351 4 1255 282 21 0.7 25 16 1.1 10
3 6.8 0.15 1 7 17 33 389 6 1367 310 29 0.7 22 12 1 11
4 6.4 0.12 0.9 3 7 25 274 6 1263 272 28 0.7 23 16 1.1 9
4 6.3 0.14 0.9 5 12 31 334 6 1288 283 23 0.7 27 20 1.1 10
4 6.7 0.19 1.3 12 29 40 406 6 1252 331 31 1 24 14 1.1 10
5 6.3 0.14 0.9 6 14 22 293 5 1253 267 15 0.6 25 18 1.1 9
5 6.6 0.14 1.1 6 14 31 388 5 1344 320 29 0.7 24 15 1.1 11
5 6.7 0.18 1.2 10 24 48 378 6 1254 296 25 1 26 12 1 10
6 6.8 0.15 1 6 14 33 431 7 1583 338 33 0.8 26 15 1.1 12
6 6.5 0.15 1 8 19 40 369 4 1126 249 25 0.8 21 12 1 9
6 6.5 0.18 1.1 8 19 39 437 7 1412 348 25 0.9 27 17 1.2 11

85
APPENDIX B
WHEAT RESPONSE DATA

86
2014 Wheat Straw Nitrogen Analysis Data
Cntrl Comp CompNY U UAG UNY
Rep 1 0.54 0.52 0.57 1.15 1.05 1.16
Rep 2 0.63 0.63 0.59 1.16 1.11 1.26
Rep 3 0.69 0.71 0.70 1.33 1.45 1.48
Rep 4 0.71 0.91 0.70 1.36 1.59 1.54
2014 Wheat Straw Phosphorus Analysis Data
Cntrl Comp CompNY U UAG UNY
Rep 1 0.09 0.07 0.11 0.11 0.11 0.14
Rep 2 0.07 0.11 0.07 0.13 0.14 0.15
Rep 3 0.09 0.09 0.12 0.15 0.19 0.17
Rep 4 0.06 0.11 0.11 0.16 0.18 0.22
2014 Wheat Straw Potassium Analysis Data
Cntrl Comp CompNY U UAG UNY
Rep 1 0.804 0.735 0.832 1.17 1.095 1.192
Rep 2 0.786 1.209 0.932 1.17 1.454 1.296
Rep 3 0.732 1.076 0.817 1.298 1.333 1.161
Rep 4 0.791 0.98 0.694 1.097 1.337 1.749
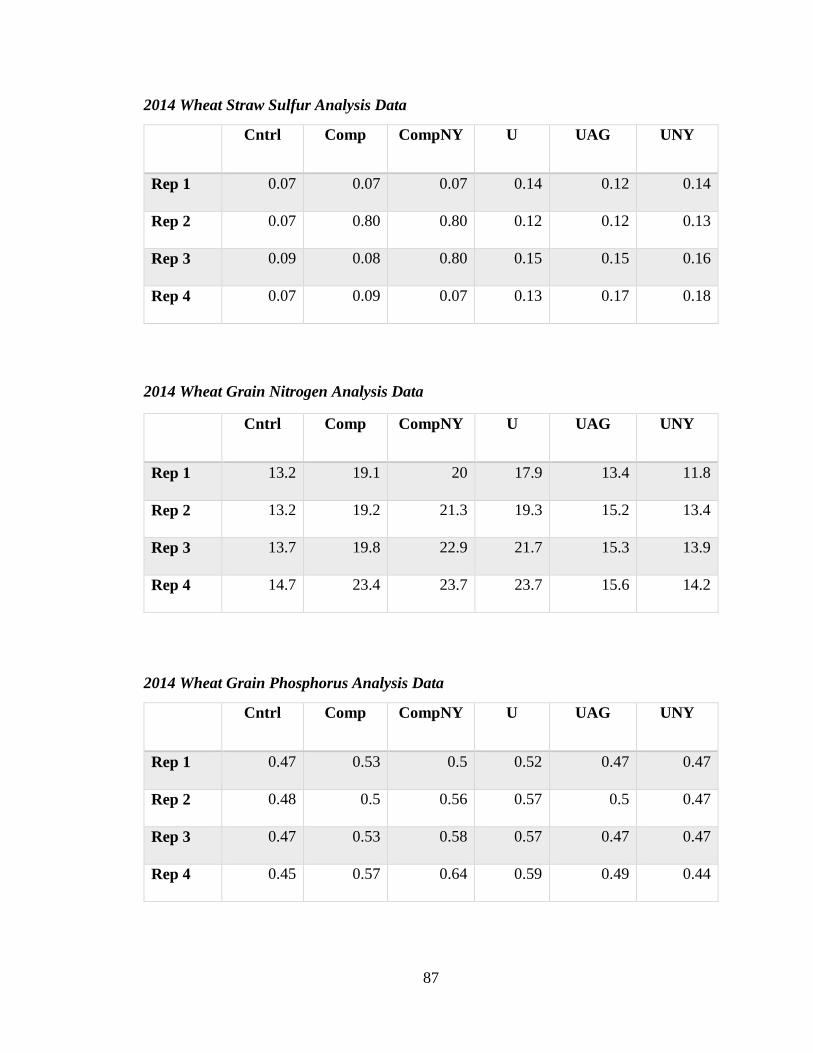
87
2014 Wheat Straw Sulfur Analysis Data
Cntrl Comp CompNY U UAG UNY
Rep 1 0.07 0.07 0.07 0.14 0.12 0.14
Rep 2 0.07 0.80 0.80 0.12 0.12 0.13
Rep 3 0.09 0.08 0.80 0.15 0.15 0.16
Rep 4 0.07 0.09 0.07 0.13 0.17 0.18
2014 Wheat Grain Nitrogen Analysis Data
Cntrl Comp CompNY U UAG UNY
Rep 1 13.2 19.1 20 17.9 13.4 11.8
Rep 2 13.2 19.2 21.3 19.3 15.2 13.4
Rep 3 13.7 19.8 22.9 21.7 15.3 13.9
Rep 4 14.7 23.4 23.7 23.7 15.6 14.2
2014 Wheat Grain Phosphorus Analysis Data
Cntrl Comp CompNY U UAG UNY
Rep 1 0.47 0.53 0.5 0.52 0.47 0.47
Rep 2 0.48 0.5 0.56 0.57 0.5 0.47
Rep 3 0.47 0.53 0.58 0.57 0.47 0.47
Rep 4 0.45 0.57 0.64 0.59 0.49 0.44

88
2014 Wheat Grain Potassium Analysis Data
Cntrl Comp CompNY U UAG UNY
Rep 1 0.48 0.53 0.56 0.55 0.47 0.48
Rep 2 0.48 0.5 0.6 0.55 0.5 0.48
Rep 3 0.49 0.55 0.59 0.58 0.47 0.47
Rep 4 0.45 0.59 0.66 0.61 0.5 0.46
2014 Wheat Grain Sulfur Analysis Data
Cntrl Comp CompNY U UAG UNY
Rep 1 0.15 0.21 0.21 0.19 0.15 0.14
Rep 2 0.15 0.2 0.22 0.22 0.16 0.15
Rep 3 0.15 0.21 0.22 0.22 0.17 0.14
Rep 4 0.16 0.23 0.23 0.23 0.16 0.16
2015 Wheat Straw Nitrogen Analysis Data
Cntrl Comp U UAG UNY
Rep 1 0.624 0.544 0.784 0.784 0.944
Rep 2 0.640 0.640 0.976 0.800 1.008
Rep 3 0.800 0.832 1.008 0.880 1.072
Rep 4 0.800 0.880 1.360 1.040 1.216
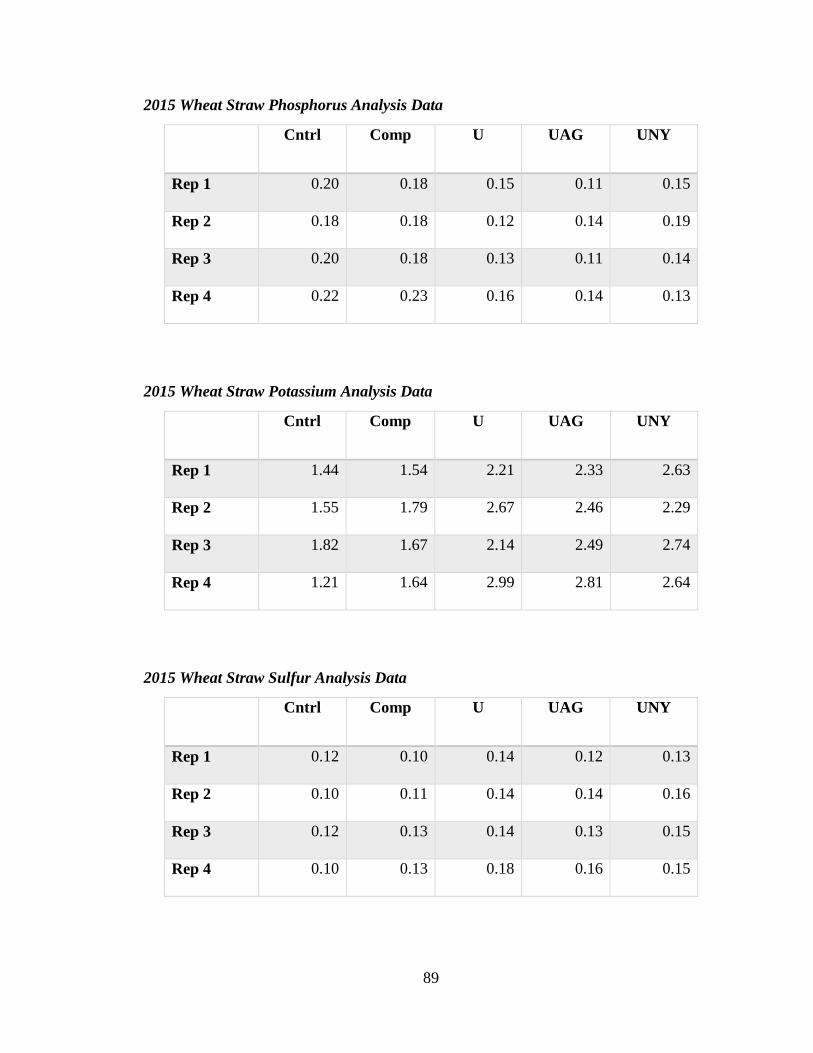
89
2015 Wheat Straw Phosphorus Analysis Data
Cntrl Comp U UAG UNY
Rep 1 0.20 0.18 0.15 0.11 0.15
Rep 2 0.18 0.18 0.12 0.14 0.19
Rep 3 0.20 0.18 0.13 0.11 0.14
Rep 4 0.22 0.23 0.16 0.14 0.13
2015 Wheat Straw Potassium Analysis Data
Cntrl Comp U UAG UNY
Rep 1 1.44 1.54 2.21 2.33 2.63
Rep 2 1.55 1.79 2.67 2.46 2.29
Rep 3 1.82 1.67 2.14 2.49 2.74
Rep 4 1.21 1.64 2.99 2.81 2.64
2015 Wheat Straw Sulfur Analysis Data
Cntrl Comp U UAG UNY
Rep 1 0.12 0.10 0.14 0.12 0.13
Rep 2 0.10 0.11 0.14 0.14 0.16
Rep 3 0.12 0.13 0.14 0.13 0.15
Rep 4 0.10 0.13 0.18 0.16 0.15

90
2015 Wheat Grain Nitrogen Analysis Data
Cntrl Comp U UAG UNY
Rep 1 2.080 2.048 2.416 2.432 2.368
Rep 2 2.080 2.112 2.480 2.448 2.528
Rep 3 2.096 2.128 2.736 2.624 2.784
Rep 4 2.096 2.144 2.768 2.640 2.784
2015 Wheat Grain Phosphorus Analysis Data
Cntrl Comp U UAG UNY
Rep 1 0.500 0.490 0.450 0.480 0.470
Rep 2 0.500 0.480 0.440 0.480 0.490
Rep 3 0.460 0.490 0.510 0.340 0.480
Rep 4 0.480 0.520 0.520 0.470 0.470
2015 Wheat Grain Potassium Analysis Data
Cntrl Comp U UAG UNY
Rep 1 0.580 0.590 0.550 0.630 0.590
Rep 2 0.550 0.520 0.540 0.680 0.600
Rep 3 0.510 0.560 0.710 0.460 0.680
Rep 4 0.540 0.580 0.730 0.640 0.600

91
2015 Wheat Grain Sulfur Analysis Data
Cntrl Comp U UAG UNY
Rep 1 0.140 0.130 0.150 0.160 0.150
Rep 2 0.140 0.140 0.170 0.160 0.160
Rep 3 0.140 0.140 0.170 0.130 0.180
Rep 4 0.140 0.150 0.180 0.170 0.170

92
APPENDIX C
CORN RESPONSE DATA

93
2014 Corn Stover Biomass Analysis Data (lbs/acre)
Cntrl CompA CompB U UAG UNY
Rep 1 2681.95 3352.13 2614.05 2698.91 3586.60 3804.70
Rep 2 4197.53 4316.93 2857.22 4432.60 4205.18 5137.79
Rep 3 4370.59 4971.79 4016.94 5016.09 4862.88 5194.34
Rep 4 4887.12 7903.94 5763.94 7974.62 5603.72 6768.36
2014 Corn Stover Biomass Analysis Data (kg/ha)
Cntrl CompA CompB U UAG UNY
Rep 1 3006.06 3757.23 2929.96 3025.06 4020.03 4264.49
Rep 2 4704.80 4838.63 3202.51 4968.27 4713.37 5758.68
Rep 3 4898.77 5572.62 4502.38 5622.28 5450.55 5822.07
Rep 4 5477.72 8859.12 6460.51 8938.34 6280.93 7586.31
2014 Corn Stover Nitrogen Analysis Data
Cntrl CompA CompB U UAG UNY
Rep 1 0.73 0.63 0.63 1.03 1.48 0.92
Rep 2 0.98 0.67 0.67 1.58 1.79 1.04
Rep 3 1.00 1.38 1.38 1.69 1.89 1.53
Rep 4 1.09 1.46 1.46 1.80 2.05 1.87

94
2014 Corn Stover Phosphorus Analysis Data
Cntrl CompA CompB U UAG UNY
Rep 1 0.34 0.16 0.26 0.18 0.22 0.16
Rep 2 0.42 0.21 0.27 0.31 0.29 0.17
Rep 3 0.33 0.33 0.22 0.29 0.29 0.20
Rep 4 0.34 0.29 0.31 0.23 0.30 0.23
2014 Corn Stover Potassium Analysis Data
Cntrl CompA CompB U UAG UNY
Rep 1 1.58 1.70 1.51 1.62 1.93 2.09
Rep 2 1.73 1.67 2.32 1.40 1.53 1.57
Rep 3 1.57 1.50 1.52 1.56 1.66 2.23
Rep 4 1.75 1.36 1.48 1.49 1.41 1.75
2014 Corn Stover Sulfur Analysis Data
Cntrl CompA CompB U UAG UNY
Rep 1 0.07 0.09 0.10 0.14 0.07 0.08
Rep 2 0.08 0.13 0.08 0.11 0.08 0.09
Rep 3 0.08 0.13 0.13 0.15 0.13 0.09
Rep 4 0.13 0.14 0.13 0.14 0.10 0.15

95
2015 Corn Stover Biomass Analysis Data (lbs/acre)
Cntrl CompA CompB U UAG UNY
Rep 1 3811.16 1842.68 2331.08 3021.01 3207.26 3652.41
Rep 2 3857.71 3207.87 4182.17 3207.25 3549.40 4469.42
Rep 3 4650.78 3741.77 4324.31 4069.52 4092.48 4975.86
2015 Corn Stover Biomass Analysis Data (kg/ha)
Cntrl CompA CompB U UAG UNY
Rep 1 4271.73 2065.36 2612.78 3386.10 3594.85 4093.79
Rep 2 4323.91 3595.53 4687.58 3594.84 3978.34 5009.55
Rep 3 5212.82 4193.96 4846.89 4561.32 4587.05 5577.18
2015 Corn Stover Nitrogen Analysis Data
Cntrl CompA CompB U UAG UNY
Rep 1 0.86 0.58 0.94 1.05 1.16 0.84
Rep 2 0.97 0.62 0.95 1.22 1.29 1.01
Rep 3 1.29 0.79 0.96 1.48 1.35 1.04

96
2015 Corn Stover Phosphorus Analysis Data
Cntrl CompA CompB U UAG UNY
Rep 1 0.31 0.23 0.36 0.36 0.28 0.23
Rep 2 0.33 0.26 0.37 0.33 0.33 0.32
Rep 3 0.35 0.34 0.35 0.34 0.29 0.32
2015 Corn Stover Potassium Analysis Data
Cntrl CompA CompB U UAG UNY
Rep 1 1.15 1.21 1.20 1.24 1.33 1.21
Rep 2 1.88 1.15 1.24 1.34 1.18 1.04
Rep 3 1.36 1.05 1.16 1.35 1.17 1.12
2015 Corn Stover Sulfur Analysis Data
Cntrl CompA CompB U UAG UNY
Rep 1 0.08 0.06 0.08 0.10 0.08 0.07
Rep 2 0.10 0.06 0.08 0.11 0.10 0.08
Rep 3 0.11 0.07 0.08 0.12 0.10 0.08

97
APPENDIX D
SAS DATA

98
SAS code for 2014 harvested wheat straw; analysis for N, P, K, and S.
title1 '2014 Wheat Straw';
DATA wheat;
INPUT trt$ N P K S;
CARDS;
Cntrl 0.540 0.090 0.804 0.070
Cntrl 0.630 0.070 0.786 0.070
Cntrl 0.690 0.090 0.732 0.090
Cntrl 0.710 0.060 0.791 0.070
Comp 0.520 0.070 0.735 0.070
Comp 0.630 0.110 1.209 0.080
Comp 0.710 0.090 1.076 0.080
Comp 0.910 0.110 0.980 0.090
CompNY 0.570 0.110 0.832 0.070
CompNY 0.590 0.070 0.932 0.080
CompNY 0.700 0.110 0.694 0.070
CompNY 0.700 0.120 0.817 0.080
Urea 1.150 0.110 1.170 0.140
Urea 1.160 0.130 1.170 0.120
Urea 1.330 0.150 1.298 0.150
Urea 1.360 0.160 1.097 0.130
UreaA 1.050 0.110 1.095 0.120
UreaA 1.110 0.140 1.454 0.120
UreaA 1.450 0.190 1.333 0.150
UreaA 1.590 0.180 1.337 0.170
UreaNY 1.160 0.140 1.192 0.140
UreaNY 1.260 0.150 1.296 0.130
UreaNY 1.480 0.170 1.161 0.160
UreaNY 1.540 0.220 1.749 0.180
;
PROC GLM data=wheat;
CLASS trt;
MODEL N = trt;
MEANS trt / tukey;
RUN;
PROC GLM data=wheat;
CLASS trt;
MODEL P = trt;
MEANS trt / tukey;
RUN;
PROC GLM data=wheat;
CLASS trt;
MODEL K = trt;
MEANS trt / tukey;
RUN;

99
PROC GLM data=wheat;
CLASS trt;
MODEL S = trt;
MEANS trt / tukey;
RUN;

100
SAS code for 2014 harvested wheat grain; analysis for N, P, K, and S.
title1 '2014 Wheat Grain';
DATA wheat;
INPUT trt$ N P K S;
CARDS;
Cntrl 2.112 0.470 0.480 0.150
Cntrl 2.112 0.480 0.480 0.150
Cntrl 2.192 0.470 0.490 0.150
Cntrl 2.352 0.450 0.450 0.160
Comp 2.144 0.470 0.470 0.150
Comp 2.432 0.500 0.500 0.160
Comp 2.448 0.470 0.470 0.170
Comp 2.496 0.490 0.500 0.160
CompNY 1.888 0.470 0.480 0.140
CompNY 2.144 0.470 0.480 0.150
CompNY 2.224 0.470 0.470 0.140
CompNY 2.272 0.440 0.460 0.160
Urea 3.056 0.530 0.530 0.210
Urea 3.072 0.500 0.500 0.200
Urea 3.168 0.530 0.550 0.210
Urea 3.744 0.570 0.590 0.230
UreaA 2.864 0.520 0.550 0.190
UreaA 3.088 0.570 0.550 0.220
UreaA 3.472 0.570 0.580 0.220
UreaA 3.792 0.590 0.610 0.230
UreaNY 3.200 0.500 0.560 0.210
UreaNY 3.408 0.560 0.600 0.220
UreaNY 3.664 0.580 0.590 0.220
UreaNY 3.792 0.640 0.660 0.230
;
PROC GLM data=wheat;
CLASS trt;
MODEL N = trt;
MEANS trt / tukey;
RUN;
PROC GLM data=wheat;
CLASS trt;
MODEL P = trt;
MEANS trt / tukey;
RUN;
PROC GLM data=wheat;
CLASS trt;
MODEL K = trt;
MEANS trt / tukey;
RUN;

101
PROC GLM data=wheat;
CLASS trt;
MODEL S = trt;
MEANS trt / tukey;
RUN;

102
SAS code for 2015 harvested wheat straw; analysis for N, P, K, and S.
title1 '2015 Wheat Straw';
DATA wheat;
INPUT trt$ N P K S;
CARDS;
Cntrl 0.624 0.200 1.440 0.120
Cntrl 0.640 0.180 1.550 0.100
Cntrl 0.800 0.200 1.820 0.120
Cntrl 0.800 0.220 1.210 0.100
Comp 0.544 0.180 1.540 0.100
Comp 0.640 0.180 1.790 0.110
Comp 0.832 0.180 1.670 0.130
Comp 0.880 0.230 1.640 0.130
Urea 0.784 0.150 2.210 0.140
Urea 0.976 0.120 2.670 0.140
Urea 1.008 0.130 2.140 0.140
Urea 1.360 0.160 2.990 0.180
UreaA 0.784 0.110 2.330 0.120
UreaA 0.800 0.140 2.460 0.140
UreaA 0.880 0.110 2.490 0.130
UreaA 1.040 0.140 2.810 0.160
UreaNY 0.944 0.150 2.630 0.130
UreaNY 1.008 0.190 2.290 0.160
UreaNY 1.072 0.140 2.740 0.150
UreaNY 1.216 0.130 2.640 0.150
;
PROC GLM data=wheat;
CLASS trt;
MODEL N = trt;
MEANS trt / tukey;
RUN;
PROC GLM data=wheat;
CLASS trt;
MODEL P = trt;
MEANS trt / tukey;
RUN;
PROC GLM data=wheat;
CLASS trt;
MODEL K = trt;
MEANS trt / tukey;
RUN;
PROC GLM data=wheat;
CLASS trt;
MODEL S = trt;
MEANS trt / tukey;
RUN;

103
SAS code for 2015 harvested wheat grain; analysis for N, P, K, and S.
title1 '2015 Wheat Grain';
DATA wheat;
INPUT trt$ N P K S;
CARDS;
Cntrl 2.080 0.500 0.580 0.140
Cntrl 2.080 0.500 0.550 0.140
Cntrl 2.096 0.460 0.510 0.140
Cntrl 2.096 0.480 0.540 0.140
Comp 2.048 0.490 0.590 0.130
Comp 2.112 0.480 0.520 0.140
Comp 2.128 0.490 0.560 0.140
Comp 2.144 0.520 0.580 0.150
Urea 2.416 0.450 0.550 0.150
Urea 2.480 0.440 0.540 0.170
Urea 2.736 0.510 0.710 0.170
Urea 2.768 0.520 0.730 0.180
UreaA 2.432 0.480 0.630 0.160
UreaA 2.448 0.480 0.680 0.160
UreaA 2.624 0.340 0.460 0.130
UreaA 2.640 0.470 0.640 0.170
UreaNY 2.368 0.470 0.590 0.150
UreaNY 2.528 0.490 0.600 0.160
UreaNY 2.784 0.480 0.680 0.180
UreaNY 2.784 0.470 0.600 0.170
;
PROC GLM data=wheat;
CLASS trt;
MODEL N = trt;
MEANS trt / tukey;
RUN;
PROC GLM data=wheat;
CLASS trt;
MODEL P = trt;
MEANS trt / tukey;
RUN;
PROC GLM data=wheat;
CLASS trt;
MODEL K = trt;
MEANS trt / tukey;
RUN;
PROC GLM data=wheat;
CLASS trt;
MODEL S = trt;
MEANS trt / tukey;
RUN;

104

105
SAS code for 2014 corn harvested analysis for biomass, N, P, K and S.
title1 '2014 Corn';
DATA corn;
INPUT trt$ Bio N P K S;
CARDS;
Cntrl 3006.06 0.73 0.34 1.58 0.07
Cntrl 4704.8 0.98 0.42 1.73 0.08
Cntrl 4898.77 1.00 0.33 1.57 0.08
Cntrl 5477.72 1.09 0.34 1.75 0.13
CompA 3757.23 0.63 0.16 1.70 0.09
CompA 4838.63 0.67 0.21 1.67 0.13
CompA 5572.62 1.38 0.33 1.50 0.13
CompA 8859.12 1.46 0.29 1.36 0.14
CompB 2929.96 0.73 0.26 1.51 0.10
CompB 3202.51 0.95 0.27 2.32 0.08
CompB 4502.38 1.02 0.22 1.52 0.13
CompB 6460.51 1.84 0.31 1.48 0.13
Urea 3025.06 1.03 0.18 1.62 0.14
Urea 4968.27 1.58 0.31 1.40 0.11
Urea 5622.28 1.69 0.29 1.56 0.15
Urea 8938.34 1.80 0.23 1.49 0.14
UreaA 4020.03 1.48 0.22 1.93 0.07
UreaA 4713.37 1.79 0.29 1.53 0.08
UreaA 5450.55 1.89 0.29 1.66 0.13
UreaA 6280.93 2.05 0.30 1.41 0.10
UreaNY 4264.49 0.92 0.16 2.09 0.08
UreaNY 5758.68 1.04 0.17 1.57 0.09
UreaNY 5822.07 1.53 0.20 2.23 0.09
UreaNY 7586.31 1.87 0.23 1.75 0.15
;
PROC anova data=corn;
CLASS trt;
MODEL Bio = trt;
MEANS trt / tukey;
RUN;
PROC anova data=corn;
CLASS trt;
MODEL N = trt;
MEANS trt / tukey;
RUN;
PROC anova data=corn;
CLASS trt;
MODEL P = trt;
MEANS trt / tukey;
RUN;
PROC anova data=corn;

106
CLASS trt;
MODEL K = trt;
MEANS trt / tukey;
RUN;
PROC anova data=corn;
CLASS trt;
MODEL S = trt;
MEANS trt / tukey;
RUN;

107
SAS code for 2015 corn harvested analysis for biomass, N, P, K and S.
title1 '2015 Corn';
DATA corn;
INPUT trt$ Bio N P K S;
CARDS;
Cntrl 4271.73 0.86 0.31 1.15 0.08
Cntrl 4323.91 0.97 0.33 1.88 0.10
Cntrl 5212.82 1.29 0.35 1.36 0.11
CompA 2065.36 0.58 0.23 1.21 0.06
CompA 3595.53 0.62 0.26 1.15 0.06
CompA 4193.96 0.79 0.34 1.05 0.07
CompB 2612.78 0.94 0.36 1.20 0.08
CompB 4687.58 0.95 0.37 1.24 0.08
CompB 4846.89 0.96 0.35 1.16 0.08
Urea 3386.1 1.05 0.36 1.24 0.10
Urea 3594.84 1.22 0.33 1.34 0.11
Urea 4561.32 1.48 0.34 1.35 0.12
UreaA 3594.85 1.16 0.28 1.33 0.08
UreaA 3978.34 1.29 0.33 1.18 0.10
UreaA 4587.05 1.35 0.29 1.17 0.10
UreaNY 4093.79 0.84 0.23 1.21 0.07
UreaNY 5009.55 1.01 0.32 1.04 0.08
UreaNY 5577.18 1.04 0.32 1.12 0.08
;
PROC anova data=corn;
CLASS trt;
MODEL Bio = trt;
MEANS trt / tukey;
RUN;PROC anova data=corn;
CLASS trt;
MODEL N = trt;
MEANS trt / tukey;
RUN;
PROC anova data=corn;
CLASS trt;
MODEL P = trt;
MEANS trt / tukey;
RUN;
PROC anova data=corn;
CLASS trt;
MODEL K = trt;
MEANS trt / tukey;
RUN;
PROC anova data=corn;
CLASS trt;
MODEL S = trt;

108
MEANS trt / tukey;
RUN;