Nitrogen Abatement Cost Comparison for Cropping …ageconsearch.umn.edu/bitstream/149915/2/Nitrogen...
37
1 Nitrogen Abatement Cost Comparison for Cropping Systems under Alternative Management Choices by Frederick Amon-Armah 1 Emmanuel K. Yiridoe 1* Dale Hebb 2 Rob Jamieson 3 Selected paper prepared for presentation at the Agricultural & Applied Economics Association’s 2013 AAEA & CAES Joint Annual Meeting, Washington, DC, August 4- 6, 2013. 1 Department of Business and Social Sciences, Dalhousie University (Agricultural Campus), Truro, N.S., B2N 5E3, Canada. 2 Atlantic Food and Horticulture Research Centre, 32 Main St., Kentville, N.S., B4N 1J5 Canada. 3 Department of Process Engineering and Applied Science, Dalhousie University, Halifax, NS, B3J 1Z1, Canada. *Corresponding author: Emmanuel K. Yiridoe; Email: [email protected]; Telephone: 1-902-893-6699; Fax: 1-902-897-0038 Copyright 2013 by Amon-Armah F., Yiridoe E. k., Hebb D., and Jamieson R. All rights reserved. Readers may make verbatim copies of this document for non-commercial purposes by any means, provided that this copyright notice appears on all such copies.
Transcript of Nitrogen Abatement Cost Comparison for Cropping …ageconsearch.umn.edu/bitstream/149915/2/Nitrogen...

1
Nitrogen Abatement Cost Comparison for Cropping Systems under Alternative
Management Choices
by
Frederick Amon-Armah1
Emmanuel K. Yiridoe1*
Dale Hebb2
Rob Jamieson3
Selected paper prepared for presentation at the Agricultural & Applied Economics
Association’s 2013 AAEA & CAES Joint Annual Meeting, Washington, DC, August 4-
6, 2013.
1Department of Business and Social Sciences, Dalhousie University (Agricultural
Campus), Truro, N.S., B2N 5E3, Canada. 2Atlantic Food and Horticulture Research Centre, 32 Main St., Kentville, N.S., B4N 1J5
Canada. 3Department of Process Engineering and Applied Science, Dalhousie University, Halifax,
NS, B3J 1Z1, Canada.
*Corresponding author: Emmanuel K. Yiridoe; Email: [email protected];
Telephone: 1-902-893-6699; Fax: 1-902-897-0038
Copyright 2013 by Amon-Armah F., Yiridoe E. k., Hebb D., and Jamieson R. All rights
reserved. Readers may make verbatim copies of this document for non-commercial
purposes by any means, provided that this copyright notice appears on all such copies.

2
Nitrogen Abatement Cost Comparison for Cropping Systems under Alternative
Management Choices
Abstract
There is a need for cost-effective methods to reduce nitrogen pollution from agriculture.
Marginal abatement cost (MAC) curves for nitrate-nitrogen pollution in an agricultural
watershed are evaluated using estimated crop yield and nitrate pollution production
functions for alternative cropping systems. The cropping systems considered in this study
included i) two grain corn-based cropping systems; ii) two potato-based cropping
systems; and iii) a vegetable-horticulture system, managed under conventional tillage
(CT) and no-till (NT). The cost-effective potato-based cropping system which met the
Health Canada maximum contaminant limit (MCL) for nitrate-N, with the highest gross
margin ($6973 ha-1
) and lowest abatement cost ($395 ha-1
) was a potato-barley-winter
wheat-potato-corn rotation under no-till (PBWPC-NT). Similarly, among the vegetable-
horticulture cropping systems, potato-winter wheat-carrot-corn rotation under CT
(PWRC-CT) generated the highest gross margin and lowest on-farm abatement cost
($680 ha-1
). As the Health Canada allowable limit on nitrate-N pollution was relaxed (i.e.,
less stringent), the cost-effective corn-based cropping system shifted from a rotation
involving corn-corn-alfalfa-alfalfa-alfalfa under CT to corn-corn-corn-alfalfa-alfalfa
under NT.
Keywords: Nitrogen abatement cost, mathematical programming, agricultural watershed.
3
Nitrogen Abatement Cost Comparison for Cropping Systems under Alternative
Management Choices
1. Introduction
Cost-effective strategies to reduce groundwater nitrate-N pollution from
agriculture are important, especially in intensive agriculture regions. Beneficial
management practices (BMPs) such as nutrient management planning are commonly used
to manage nonpoint source pollution from agriculture (Bonham et al., 2006), and are also
accepted tools for implementing various government farm environmental risk
management programs (Yiridoe, 2000). Most provinces and territories in Canada, as well
as US states are promoting more widespread adoption and implementation of NMP
programs. Important attributes of nutrient management plans (NMPs) which influence
economic and environmental impacts from agricultural production include crop choice,
rotation sequence, tillage type, and nitrogen (N) fertilizer rates. Although crop nutrient
management has the potential to reduce fertilizer costs, it may also require additional
costs, linked to developing NMPs and adjusting farm management practices.
A major source of drinking water in Atlantic Canada is from groundwater
systems. For example, about 29% of the population in Newfoundland and Labrador, 50%
in Nova Scotia, 64% in New Brunswick, and over 80% in Prince Edward Island rely on
groundwater systems for drinking water (Stratton et al., 2003). On the other hand, in
Kings County, Nova Scotia, for example, drinking water wells tested during 1989-2009,
indicated that about 20% had maximum nitrate concentration levels of 39.1 mg L-1
or
more, almost four times the Health Canada maximum contaminant limit (MCL) of 10 mg
L-1
(Nova Scotia Department of Environment, 2010).
4
Assessing the cost-effectiveness of agricultural nonpoint source pollution control
and associated policy options is commonly based on a general premise that economic
efficiency is improved by adjusting farming practices and switching abatement options to
management choices with lower marginal abatement costs (MACs) (McSweeny and
Shortle, 1990; Byström, 1998). Estimated MACs link nitrate leaching levels with the cost
associated with additional levels of reducing nitrate leachate (McKitrick, 1999).
Application of NMP practices to reduce nitrate leaching into groundwater systems
commonly combines extensive margin management choices (such as crop choice,
rotation sequence, and tillage management) with intensive margin management choices
(e.g., adjusting fertilizer application level) (Yiridoe and Weersink, 1998).
Economic studies which evaluate trade-offs between farm income and pollution
reduction, and explicit abatement costs associated with agricultural pollution control
commonly integrate biophysical simulation modelling with farm economic optimization
models (Antel and Capalbo, 2001; Bonham et al., 2006; Jalota et al., 2007; Mimouni et
al., 2000; Yang et al., 2007) or econometric-process simulation models (Stoorvogel et al.,
2004). An integrated biophysical-economic optimization approach is particularly apt for
evaluating nutrient management planning and other BMPs (assumed to be) implemented
in agricultural watersheds (Yang et al., 2007). The approach applied in this study is
consistent with a general framework in which the optimization model imposes farm
management decisions selected from discrete decision choices such as tillage type, and
rotation sequence (Stoorvogel et al., 2004; Randhir and Lee, 1997; Mimouni et al., 2000).
Alternative maximum contaminant limits from the biophysical simulation modeling are

5
imposed as constraints on the mathematical programming model. Abatement cost
associated with improving water quality is measured as trade-offs between reduction in
farm returns for additional units of water quality improvement (or pollution reduction).
The purpose of this study was to empirically determine on-farm marginal
abatement cost for nitrate-N, and associated reductions in nitrate-N leaching into
groundwater systems resulting from implementing recommended nutrient management
plans for alternative cropping systems resulting. MAC curves were explicitly estimated
and then used to evaluate the cost-effectiveness associated with meeting specific
groundwater nitrate-N quality standards. In a first part of the study, crop yield and nitrate-
N pollution response to added nutrient N fertilizer were estimated, and further used to
evaluate optimal N fertilization rates and the associated abatement costs for cropping
systems as continuous (as opposed to discrete) choice variables.
The crops and rotation systems considered in the study reflect farming systems
commonly managed in the study area. Specifically, the production systems studied were
based on cropping systems commonly managed by farmers in the Annapolis Valley
region of Nova Scotia, Canada. These included: i) a corn-based cropping system (C-C-C-
A-A, C-C-A-A-A); ii) a potato-based cropping system (P-B-WF-P-C, P-C-B-P-C); and
iii) a vegetable horticulture system (P-WF-R-C)11. In addition, the different rotation
systems were compared under conventional tillage (CT) and no-till (NT) management.
The approach used in this study is particularly useful for policy analysts interested in
cost-minimizing abatement strategies for reducing groundwater-N pollution.
1 The crops studied included: A=Alfalfa; C=Grain corn; B=Barley; WF = winter wheat feed; R=Carrot; and
P=Potato.
6
2. Related Studies
2.1 Review of marginal abatement cost studies
MAC represents the cost of reducing incremental units of pollution produced, and
is linked to production technology used (McKitrick 1999). In general, abatement cost
increases with elimination of an additional last remaining unit of pollutant. In addition,
the MAC for a given pollutant (such as nitrate-N) differs across farm-firms and
production systems.
Sumelius et al (2005) estimated MACs associated with N fertilizer tax policies
intended to reduce nitrate levels. In a first stage of the study, Sumelius et al. (2005)
estimated corn yield and associated nitrate-N leaching response to N fertilizer rates, and
then applied data for corn and N fertilizer prices to generate Maximum Economic Rates
of N (MERN) fertilization. Sumelius et al. (2005) developed a profit maximization
problem, which incorporated three nitrate pollution control policy scenarios. The
Lagrangian multipliers associated with the resulting mathematical programming problem
were solved to obtain MACs for each policy scenario.
In a study for southwestern Ontario, Yiridoe and Weersink (1998) explicitly
estimated on-farm MACs associated with reducing groundwater-N leaching for various
field cropping systems. As with Sumelius et al (2005), Yiridoe and Weersink (1998) used
empirically estimated crop yield and associated nitrate-N production response functions
to evaluate optimal N fertilization levels and on-farm abatement costs for the cropping
systems considered.
In a study for Sweden, Bystrom (1998) estimated nitrogen pollution abatement
costs for wetlands in the southwestern region of the country. The approach developed also
allowed for empirically accounting for and testing the effect of physical parameters on
7
nitrogen pollution abatement cost. Wetland construction cost and denitrification functions
were estimated, and then used to generate N abatement costs. Bystrom (1998) integrated
estimated functions for wetland construction cost (as a function of wetland size) with
nitrogen pollution abatement (as a function of wetland size, level of nitrogen load and
regional characteristics). As with Sumelius et al (2005), and Yiridoe and Weersink
(1998), a Lagrangian function was developed from the two functions, and marginal
abatement costs estimated as Lagrangian multipliers. In this study, MACs reflecting loss
in farm revenue resulting from incremental reductions in nitrate leached were estimated
for several cropping systems under both intensive and extensive management choices.
2.2. Theoretical model
Cropping system choice can affect current and future farm profitability, as well as
environmental quality (El-Nazer and McCarl 1986). Thus, farmers’ private decision
choices concerning cropping system type are important when considering options for
mitigating groundwater nitrate-N pollution. Cropping system that maximizes farm profits
while also minimizing nitrate-N pollution abatement cost are preferred. The conceptual
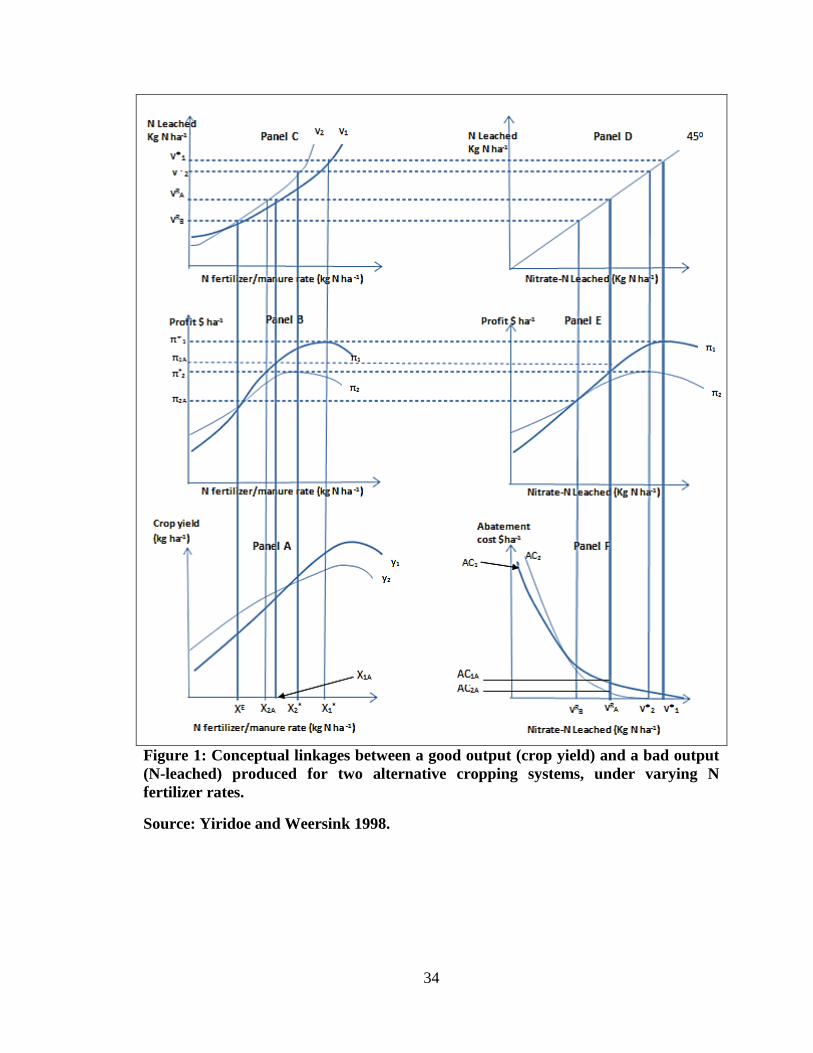
linkages between a good output (Y ) produced and a bad output generated (V ), for two
alternative cropping systems are illustrated in Figure 1 and described in more detail in
Yiridoe and Weersink (1998). Input levels and associated crop outputs, nitrate-N leached,
and abatement cost with subscript “A” may be considered as representing a NMP with for
a specific cropping system or technology combination (i.e., crop choice, rotation
sequence and tillage type).
8
At various N fertilization rates (XI, X2, X1A, and X2A), different output levels and
associated profits (π1, π2, π1A, π2A), and nitrate-N leached levels (VI, V2, V1A, and V2A) are
produced (Figure 1: panels A, B, and C). Figure 1 (panels E and F) conceptually show the
different profits and associated nitrate-N leached abatement costs for the alternative
systems. Profit levels for a particular crop are not only influenced by N fertilizer rate, but
also by the crop rotation system. In this conceptual illustration, it is assumed that if
nitrate-N leaching restriction is set at R
aV , profit for cropping system 1 (π1) is higher than
that of system 2 (π2), and MAC for cropping system 1 (AC1) is higher than that for system
2 (AC2). Thus, nitrate pollution abatement will severely impact cropping system 1 more
than system 2 if (π1- AC1) < (π2- AC2).
With restrictions on pollution levels, a farmer’s objective of maximizing profits
(Equation 1) becomes constrained by the associated nitrate-N pollution level allowed
(Equation 2). Thus, the farmer is faced with a secondary objective of minimizing nitrate-
N pollution which conflicts his/her primary objective.
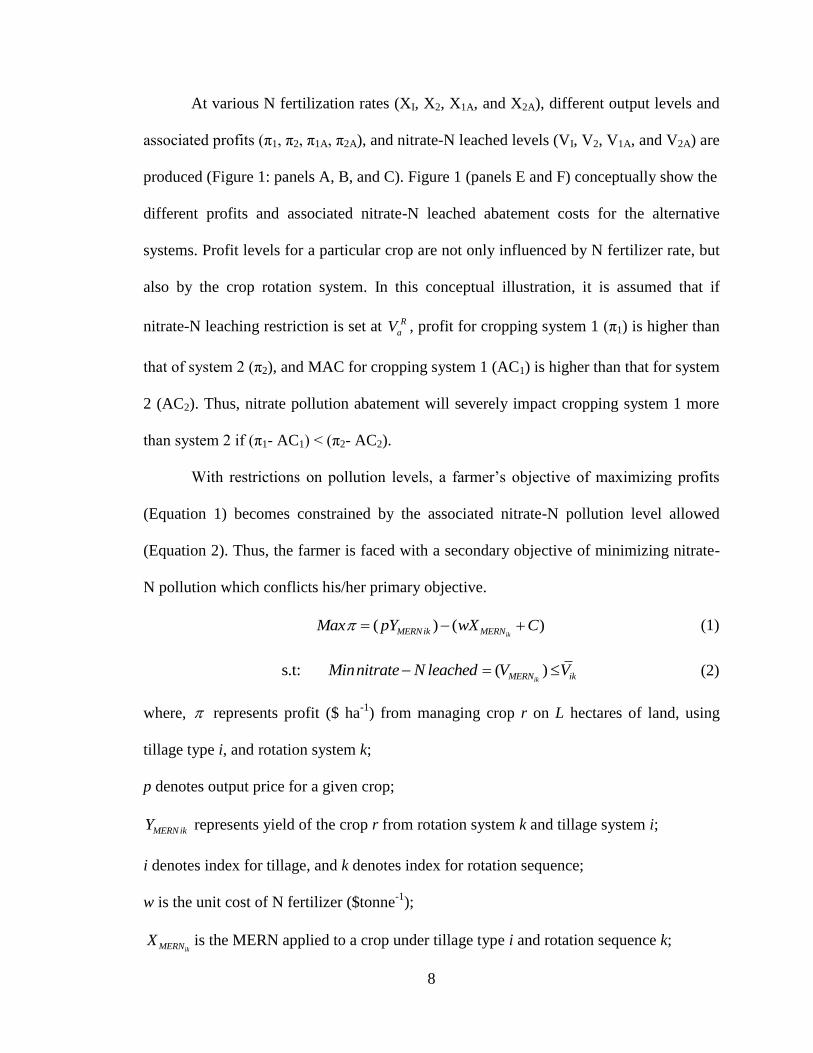
( ) ( )ikMERNik MERNMax pY wX C (1)
s.t: ( ) ikMERN ikMinnitrate N leached V V (2)
where, represents profit ($ ha-1
) from managing crop r on L hectares of land, using
tillage type i, and rotation system k;
p denotes output price for a given crop;
MERN ikY represents yield of the crop r from rotation system k and tillage system i;
i denotes index for tillage, and k denotes index for rotation sequence;
w is the unit cost of N fertilizer ($tonne-1
);
ikMERNX is the MERN applied to a crop under tillage type i and rotation sequence k;

9
C is the normalised cost of production, excluding N fertilizer cost;
ikMERNV represents NO3
N leached (kg ha-1
yr-1
) from managing a crop in rotation system
k and tillage system i;
ikV represents NO3
N leaching restriction (kg ha-1
yr-1
) for a crop in rotation system k
and tillage system i.
A Lagrangian function is obtained by integrating equations 1 and 2:
L ( , , ) ( ) ( ) [ ] ik ikik MERNik MERN ik MERNp w V p Y wX C V V (3)
The first derivative of equation 3 with respect to λ, L
, and solving for X gives an
expression for a new optimal N ( ** )ikX as a function of the groundwater nitrate-N
restriction level ( ** ( )ik ikX f V ). Consequently, the profit maximizing levels of nutrient
N is adjusted from ikMERNX to **
ikX as a result of the groundwater nitrate-N restriction. In
addition, generating the first derivative of equation 3 with respect to ikMERNX ,
ikMERN
L
X
,
and solving for gives the MAC function, ik
d
dV
**, , ikf p w X . Substituting
**
ik ikX f V into the MAC function results in MAC equation as a function of input and
output prices, and groundwater nitrate-N restriction level ( ( , , )ikf p w V ). Integrating
the parameters of crop yield response with nitrate-N leached response functions estimated
into the MAC functions ( ( , , )ikf p w V ) generates marginal cost levels for abating
nitrates leached with groundwater pollution restrictions, and represents a trade-off or

10
abatement cost associated with incremental levels of nitrate pollution reduction for a
cropping system.
The shape of the crop yield and nitrate leached response functions are consistent
with observed positive levels of the two outputs with no N fertilizer application. In
addition, initial applications of N fertilizer increase both crop yield and nitrate-N leached
levels. Further N fertilizer application tends to result in yield plateau, and then eventually
decreases. The technical relationship between crop yield (or nitrate-N leached) and N
fertilizer rate (i.e., rate of increase in yield, characteristics of the plateau, and rate of
decrease of crop yield) tends to differ, depending on the agricultural technology (or crop
type and cropping system). In order words, the magnitude and sign of the estimated
regression parameters will reflect the crop biological and field agronomic practices. For
example, for a quadratic crop response function, (2Y a bX cX ), the signs
(directions) of the parameters are such that, 0; 0; 0a b c . Similarly, for a
Mitscherlich-Baule crop response function, (1 )b c X
a e
, 0; 0; 0a b c . In addition,
the a priori expectation for a quadratic nitrate-N leaching response function (
2V X X ) suggest that, 0; 0; 0 .
From equation 3, the MAC curve is downward slopping, and assumed to be twice
continuously differentiable such that, 0ikV
, and
2
20
ikV
. In general, at higher
(lower) nitrate-N leached levels, the loss in farm revenue from incremental reductions in
pollution (i.e., the on-farm MAC) tends to be lower (higher). Thus, the MAC decreases as
the regulated nitrate leaching levels increases (becomes less stringent), thereby generating
11
a negative slope. Such theoretical properties require that the crop yield and pollution
response functions are also twice continuously differentiable.
McKitrick (1999) noted that the MAC curve does not always have a smooth
downward slopping curve, but may be kinked at some point, even for a simple case
involving a single firm with one pollutant and one abatement strategy. McKitrick (1999)
also noted that although assumptions about twice continuous differentiability are
important, in reality, the assumption tends to be easily violated. Furthermore, a boundary
of non-negativity in activity (i.e., input) levels is imposed on abatement efforts. A non-
differentiable point which results in a kink in the MAC curve may arise when the non-
negativity in activity levels is violated or when important constraints are not binding
(McKitrick 1999). Taking the integral of the MAC with respect to the regulated
groundwater nitrate-N limit generates the pollution abatement cost.
3. Research Methods
2.1 Study area
The Annapolis Valley is the most intensive agricultural region in Nova Scotia
(Sinclair et al 2008; Brooks and Holtz 2009), and generates over 50% of important
agricultural products in the province (Stratton et al 2003). In addition, the Annapolis
Valley is microcosm of water quality issues in rural and agricultural regions of Atlantic
Canada (Timmer et al 2005; Gauthier et al 2009), primarily because the region represents
a range of water quality issues existing in rural and agricultural areas of Eastern Canada
(Brooks et al 2009; Ecology Action Center 2010). This makes agriculture an important
source of non-point source pollution in the region (Fuller et al 2010).
12
Thomas Brook watershed (TBW) in Kings County located in the Annapolis
Valley, is characterised by mixed land-use systems with crop production as the dominant
commodity group. Major economic crops managed within the watershed include grain
corn and small grains (e.g., barley and wheat), as well as strawberries (Gauthier et al
2009; Sinclair et al 2009; Ahmad et al 2011).
3.2 Empirical modelling
Cost effectiveness and farm profit maximization depend not only on intensive
management but also on extensive management choices. Extensive farm management
choices involve management decisions that consider exogenous factors (agricultural
technology), which indirectly affect farm revenue (such as crop rotation and tillage
choices). In this study, the MAC modelling considered a combination of intensive and
extensive management options. Applying both intensive and extensive management to
economic optimization with environmental constraints is consistent with a decision maker
who adopts the social regulations on pollution and faces a problem of allocating available
land (e.g., 1ha) to production of a particular crop, using a choice rotation system and
tillage system (extensive choice). The analyst then determines the N fertilizer rate ( **X )
required to generate the highest farm returns and the lowest cost of complying with the
social regulation.
In this study, MACs were estimated with 30 different extensive management
options (i.e., involving combinations of tillage and rotation systems for the crops
considered), and one intensive management option (i.e., N fertilizer rate). Individual
13
crops considered included corn (C), potato (P), barley (B), winter wheat (WF), carrot (R),
and alfalfa (A). The alternative cropping systems assessed are summarized in Table 1.
The crops and rotation systems were selected in consultation with extension
specialists for the study area, and reflect representative cropping systems for the region.
Although potatoes are not a dominant crop in TBW, it is one of the economically
important crops grown in the Annapolis Valley. Similarly, alfalfa was chosen as
leguminous forage commonly incorporated into grain corn rotation systems. Although
conventional tillage (CT) management is the dominant tillage system in the TBW, no-till
(NT) systems were assessed and their impacts compared with the CT alternatives (Tong
and Naramngam, 2007).
The SWAT model calibrated and validated for TBW conditions was used to
generate crop yield and NO3
N data for various cropping systems assumed to be
managed in the watershed. The SWAT output data was used to investigate the effect of
changes in the groundwater nitrate-N restriction level on farm returns and MAC
associated with seven nutrient N fertilization levels (i.e., 110%, 100%, 90%, 75%, 50%,
25%, and 0% of the NMP recommended rates). Nitrate-N leaching measurements
reflected nitrates transported through the root zone into groundwater systems. The Health
Canada maximum contaminant limit of 10 mg L-1
yr-1
was transformed to kg ha-1
yr-1
using drainage or soil water recharge data generated from the SWAT simulations.
Drainage data was influenced by crop type, tillage, rotation, and nutrient N application
level. Thus, the 10 mg L-1
yr-1
of nitrate-N leached transformations to kg ha-1
yr-1
varied
within and between cropping systems.

14
In this study, farm returns (measured in terms of total revenue less variable cost)
for individual crops were generated using farm enterprise budgets. Crop yields generated
from substituting nutrient N for each rotation and tillage system into the associated
response functions for each crop were used to estimate farm revenue. Nitrate-N leached
from each crop-field was also generated by substituting nutrient N level for a particular
cropping system into the associated nitrate-N pollution response function. Nitrates
leached for the different crops in alternative cropping systems were also converted from
kg ha-1
to mg L-1
for each crop using a method described in Burton et al. (1993).
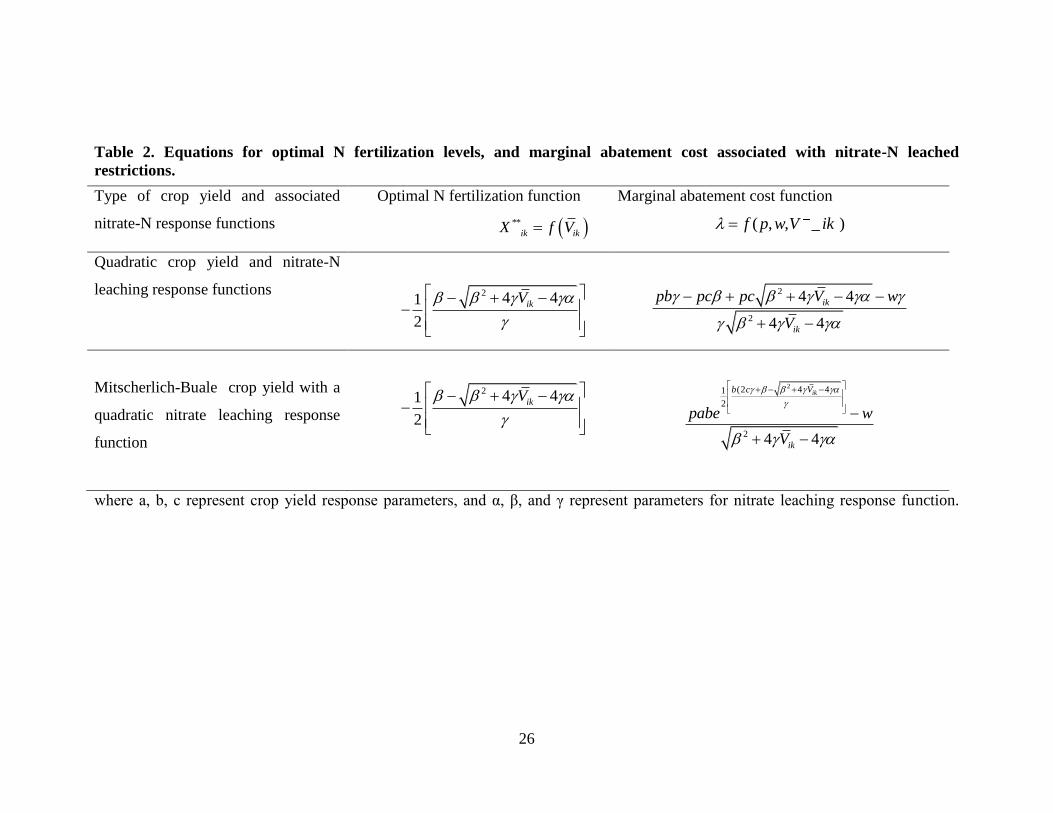
The optimal N demand **( )X equations generated assuming restrictions on
groundwater nitrate-N limits, and MAC equations for alternative response functions
assessed are summarized in Table 2. Gross margins and MACs were first evaluated for
individual crops produced within particular cropping systems using the response
functions estimated. Further analysis was conducted by considering whole-farm cropping
systems.
4. Results and Discussions
4.1. Marginal abatement cost for alternative cropping systems
In this section, MACs associated with meeting the Health Canada maximum
contaminant limit (MCL) of nitrate-N in groundwater systems were estimated for all
crops considered, and then the MCL was varied to generate the MAC curves. The results
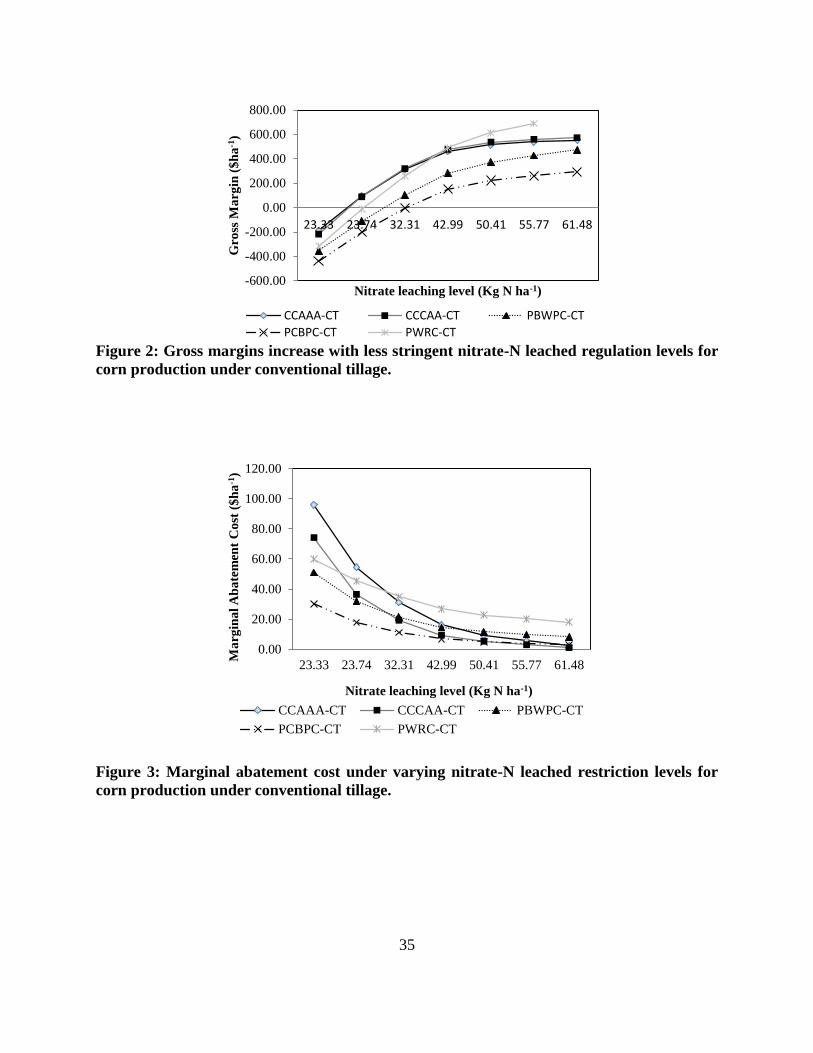
summarized in Tables 3 to 7 are consistent with the theoretical expectations (see Figure 1)
in which less stringent nitrate-N leached restrictions results in higher farm returns (Figure
2). The MAC curves for all crops had negative slopes, as expected (see, for example,
15
Figure 3 for corn production). The only exception was for alfalfa, to which farmers
traditionally do not apply N fertilizer. Figure 2 illustrates the conflict between the
economic and environmental quality objectives faced by a farmer. As nitrate-N leached
regulations become less stringent, more N fertilizer/manure tends to be applied, resulting
in increasing nitrate-N pollution levels. Increasing N fertilizer rate generally increases
crop yields (and farm revenue), while also increasing nitrate-N leaching.
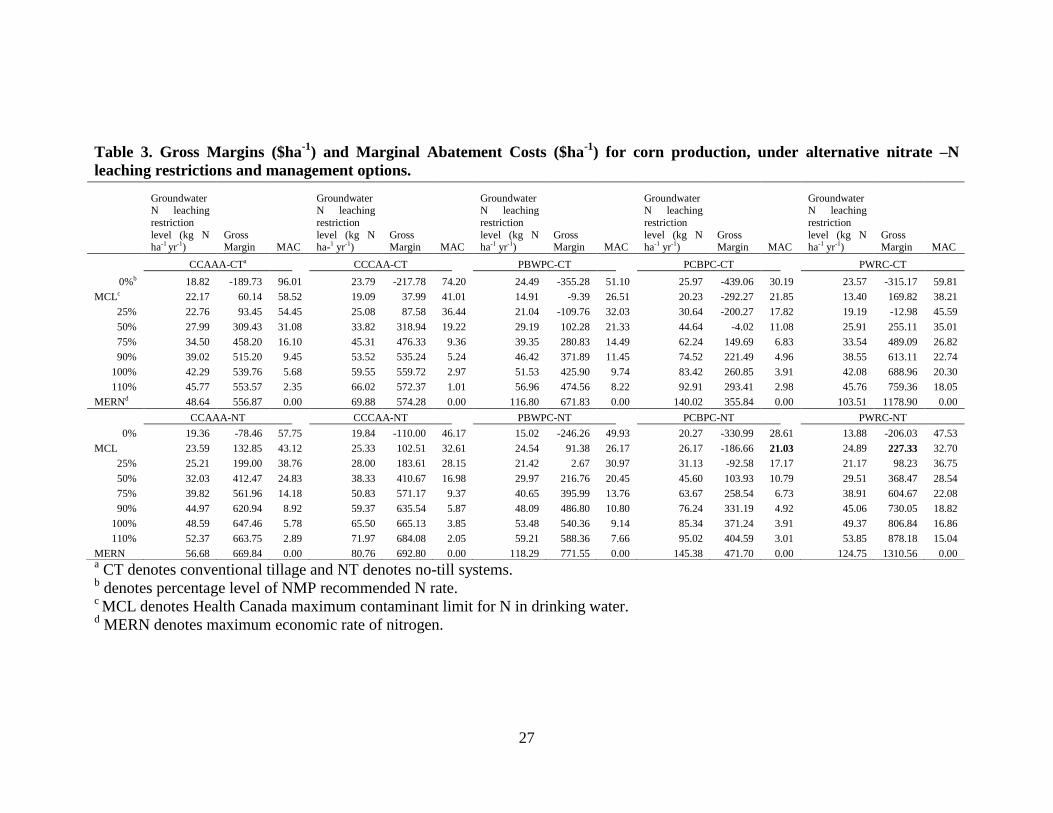
Among the alternative corn production systems considered, MACs associated with
meeting the MCL was highest for CCAAA-CT ($58.5 ha-1
), and lowest for PCBPC-NT
($21.03 ha-1
) (Table 3). The trend in magnitude of the MACs across rotations was
consistent for both CT and NT systems. In addition, MACs for corn production systems
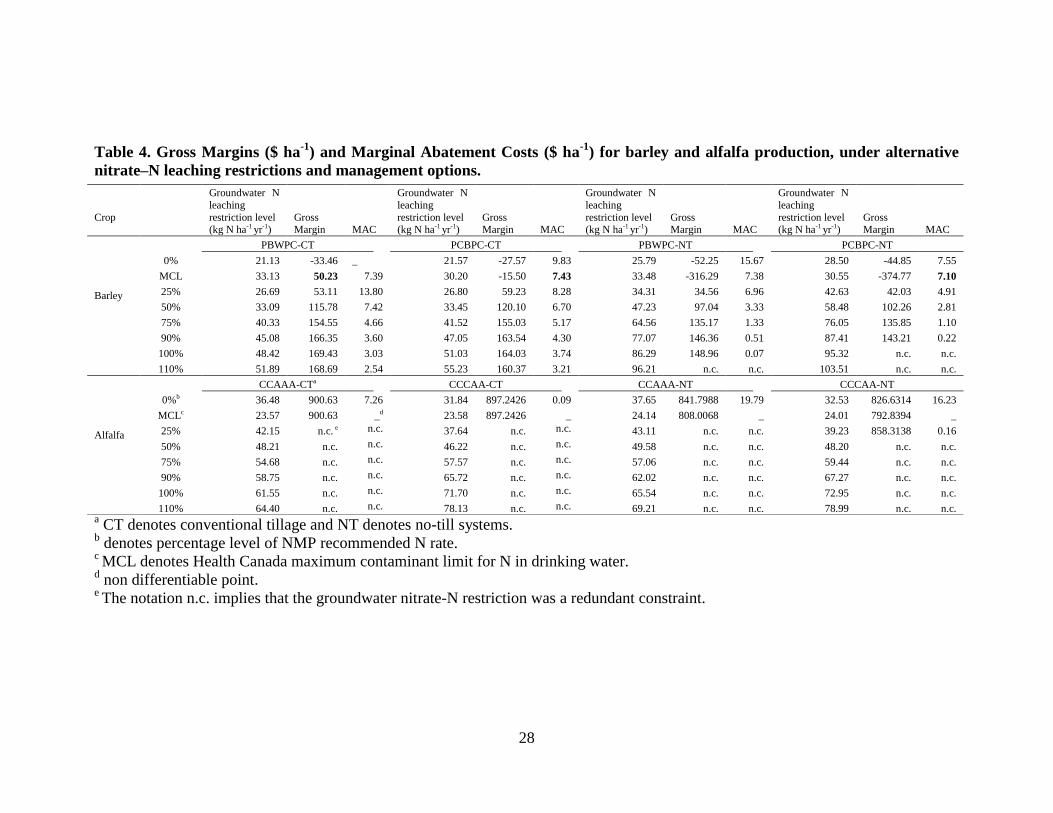
were generally lower for NT than for CT systems. Farmers in the study area generally
apply very little or no chemical fertilizer to alfalfa. Initial analysis of the alfalfa systems
suggests boundary conditions of non-negativity in N fertilizer use, with non-differentiable
points (Table 4).
4.2 Cost effectiveness of nitrate-N pollution control
In this section, cost effectiveness of reducing nitrate-N leached to meet Health
Canada MCL on nitrate-N was assessed for individual farm-fields within the watershed.
The analysis was then extended by considering varying levels of stringency of nitrate-N
pollution regulations. Cropping systems with lowest MAC and highest farm returns were
considered as cost effective.
Cost effectiveness of meeting the Health Canada MCL
The results summarized in Table 3 indicate that the abatement strategy with the
highest farm returns for corn production was not the same strategy with the lowest
abatement cost. PCBPC-NT generated the lowest abatement cost for corn production,

16
while the highest farm returns was from PWRC-NT (Table 3). On the other hand, the
abatement strategy with the highest abatement cost was CCAAA-CT (Table 3). Although
PCBPC-NT generated the lowest cost of pollution abatement, it also resulted in a negative
($-186.66 ha-1
) farm returns (Table 3). As was found for corn, trade-offs associated with
abatement strategies for barley production differed across the alternative cropping
systems considered. The abatement strategy with the lowest abatement cost was not the
same as that with the highest farm returns. The barley production system with the lowest
abatement cost was from PCBPC-NT at $7.10 ha-1
, while the production system with the
highest abatement cost was from PCBPC-CT at $7.43 ha-1
(Table 4).
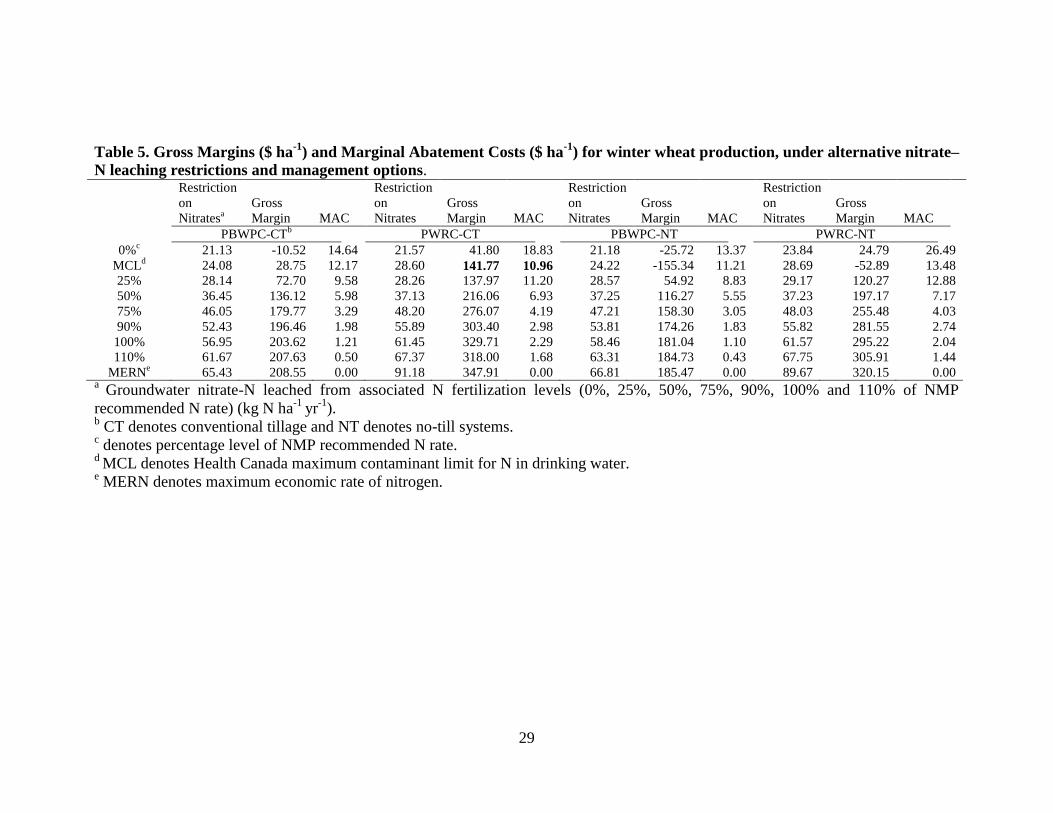
Cost effectiveness assessment for winter wheat production indicates that, at the
Health Canada MCL of 10mg L-1
, PWRC-CT was the preferred abatement strategy with
the highest farm returns and lowest abatement cost (Table 5). The same cropping system
(PWRC-CT) was cost effective among carrot production systems, with the highest farm
returns and the lowest abatement cost (Table 7). As with the results for winter wheat and
carrots, the potato production system with the lowest abatement cost was the same as that
which generated the highest farm returns. Overall, PBWPC-NT was the preferred cost
effective management option for potato production. Abatement cost to meet the MCL was
very high ($8624.30 ha-1
) for producing potato under PWRC-NT (Table 6).
Cost effectiveness of meeting alternative nitrate-N pollution regulations
Varying the nitrate-N restriction levels, ( ikV ), allowed for assessing alternative
trade-off scenarios. In general, farm returns increased as pollution standards became less
stringent, consistent with Yiridoe and Weersink (1998). In general, NT systems were
17
more cost effective among the alternative abatement strategies for corn production that
CT systems, across the nitrate-N pollution restriction range considered, ikV < MCL <
ikV
(Table 3). PWRC-NT generated the highest farm returns and relatively low abatement
cost for nitrate-N leached levels from N fertilization levels above 75% of the
recommended rate. On the other hand, for N pollution regulations below this threshold
(for nitrate-N leaching levels associated with applying less than 75% of NMP
recommended N rate), CCCAA-NT was the cost effective abatement strategy for corn
production (Table 3).
Among alternative pollution control cropping systems for barley, NT systems
generally resulted in lower abatement cost than CT systems. At more stringent pollution
restrictions below MCL = 10mg L-1
yr-1
, PBWPC-NT generated the highest abatement
cost ($16 ha-1
), and negative farm returns of ($-52 ha-1
) (Table 4). The cost effective
option with further less stringent pollution regulation was PCBPC-CT. PBWPC-NT
management was cost effective for barley production for restrictions in N pollution at ikV
> 47.23 kg N ha-1
yr-1
(Table 4).
As with the results for barley, the least cost effective pollution control cropping
system for winter wheat production at ikV < MCL = 10 mg L
-1 yr
-1 was PBWPC-NT
(Table 5). However unlike barley, the preferred cost effective option at ikV MCL = 10
mg L-1
yr-1
was PWRC-CT (Table 5). Among the winter wheat production options,
rotation system effect on abatement cost was generally higher than effects due to tillage
type.
For potato production, a dramatic decrease in abatement cost was observed for
groundwater nitrate-N regulation levels associated with 0% to 75% N fertilization rates
18
(Table 6). A similar trend was observed for carrot production (Table 7). The cost effective
abatement strategy for carrot production was PWRC-CT, across all pollution regulation
levels. The same cropping system (PWRC-CT) was the cost effective pollution reduction
strategy for potato production except at ikV = 30.93 kg N ha
-1 yr
-1 where PWRC-NT was
the preferred abatement system.
Although alfalfa yield does not significantly respond to nitrogen, small increases
in alfalfa yields were observed when N fertilizer rate increased from 0% to 25% of the
recommended N fertilization rate. Further increases in N fertilization beyond this rate
resulted in a yield plateau. As with the yield results, less stringent nitrate regulations
beyond MCL = 10 mg L-1
yr-1
were redundant.
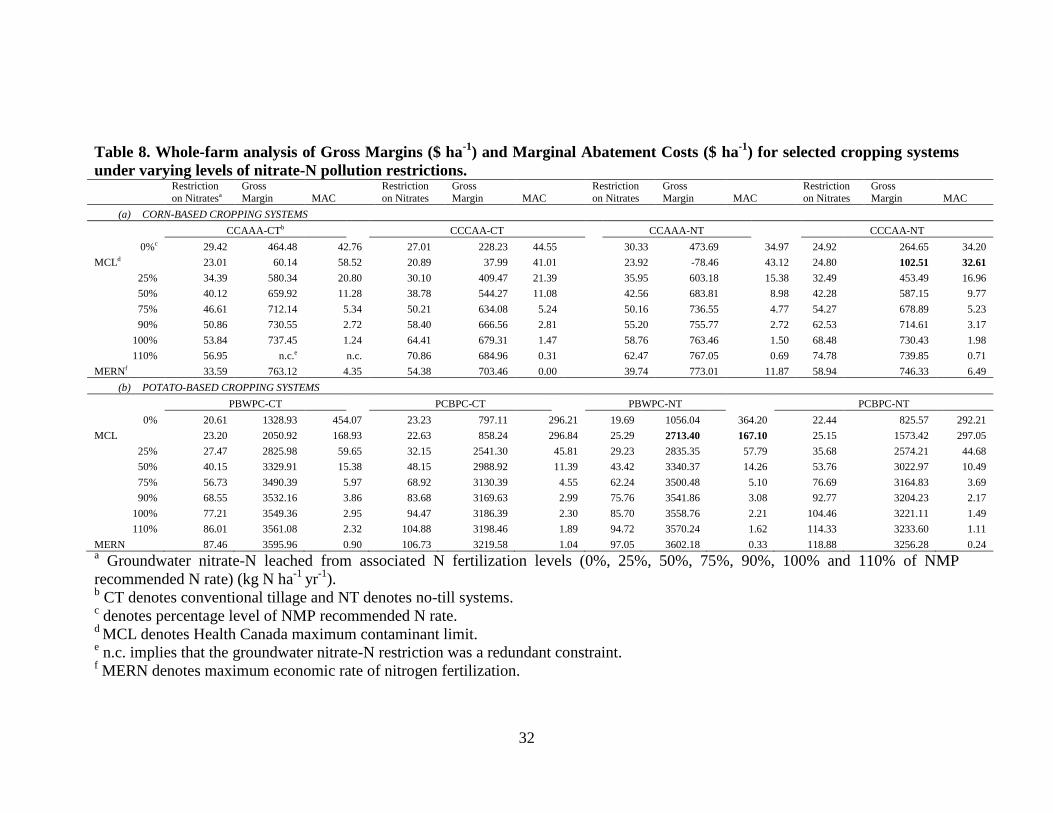
4.3 Cost effectiveness of pollution abatement under whole-farm scenarios
In this section, cost-effectiveness was assessed by comparing farm returns and
marginal abatement costs averaged for all the crops in the whole rotation system. For
corn-based cropping systems, the nitrate-N abatement strategy which met the MCL = 10
mg L-1
yr-1
varied depending on the rotation system. The cropping system with the
highest farm returns ($102.51 ha-1
) was CCCAA-NT. The same cropping system also
resulted in the lowest marginal abatement cost ($32.61 ha-1
) (Table 8).
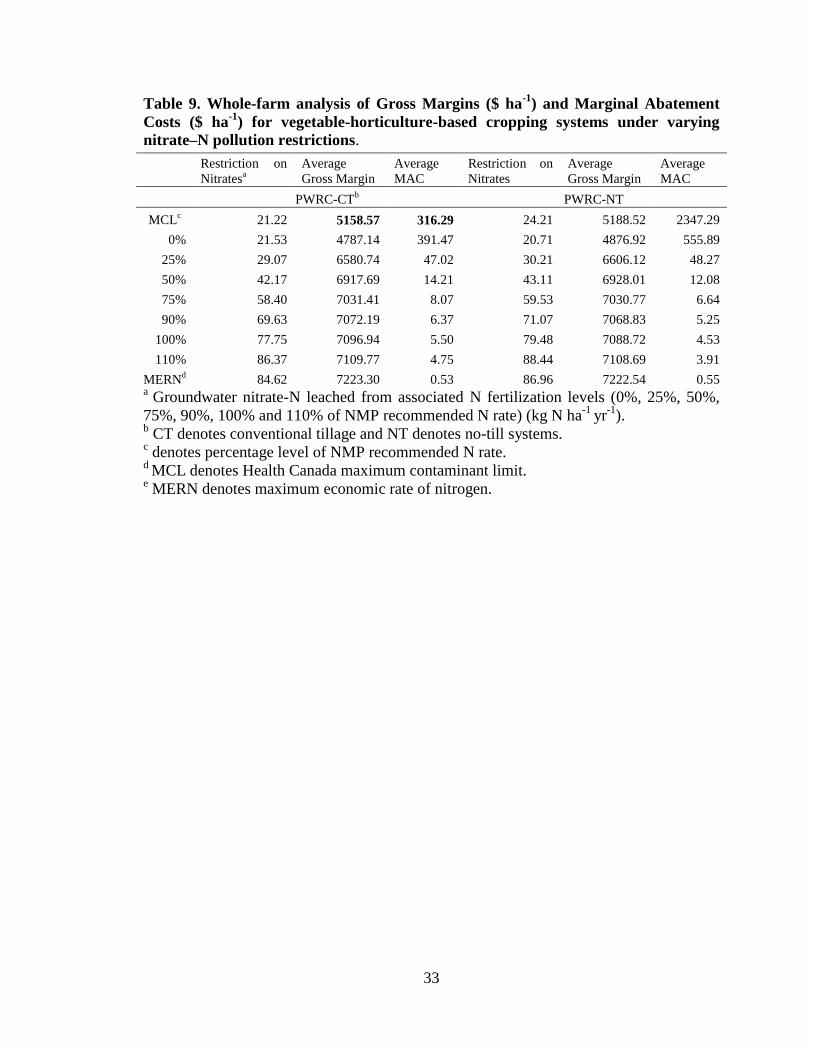
As with the findings for corn-based cropping systems, the cropping system with
the lowest marginal abatement cost (PWBPC-NT) also generated the highest farm returns
at MCL =10 mg L-1
yr-1
. Similarly, for the vegetable-horticulture systems, PWRC-CT
was the cost-effective abatement system (Table 9).

19
As the pollution restriction was varied, CCAAA-NT consistently generated the
highest farm returns. The same cropping system (i.e., CCAAA-NT) also generated the
lowest MACs at all levels of groundwater nitrate-N pollution limits (Figure 4). Thus
CCAAA-NT was the most cost effective system among the corn-based cropping systems
studied (Table 8, Figure 4).
In general, NT systems tended to generate higher farm returns for corn-based and
potato-based systems at the groundwater nitrate-N pollution limits considered. NT
systems also generated the lowest marginal abatement cost across all groundwater nitrate-
N pollution limits, for both corn-based and potato-based systems. Vegetable-horticulture
systems under NT management generated the highest abatement cost at more stringent
nitrate-N leaching restrictions, while cropping systems under CT management generated
the lowest marginal abatement cost. For both corn-based and potato based systems, tillage
type had a dramatic effect on farm returns compared with rotation system.
5. Summary and Conclusion
Trade-offs between farm profitability and improvements in agriculture-induced
water quality is important for agricultural watershed management. In this study, trade-offs
between reduction in gross margins associated with incremental changes in water quality
improvements were investigated, with and without restrictions or regulations on nitrate-N
pollution. The crops considered in the analysis reflect high value and other economically
important crops commonly grown in the Annapolis Valley region of Nova Scotia,
Canada.
Without regulations on nitrate-N pollution, whole-farm analysis of farm returns
suggest that CCAAA under CT generated the highest gross margins for corn-based
20
cropping systems. In the optimization analysis with nitrate-N pollution regulations, gross
margins and abatement costs were estimated by varying the stringency of the policy
regulation above and below the Health Canada MCL of 10 mg L-1
yr-1
. The most cost-
effective cropping systems that met the Health Canada maximum contaminant limit (of
10mg L-1
) on nitrate-N in drinking water were consistent with the cost-effective cropping
systems without regulations on nitrate-N pollution for vegetable-horticulture-based and
potato-based cropping systems. For grain corn-cropping systems, the cost-effective
cropping system varied with the pollution standard or regulation.
In summary, the cost-effective choice of cropping system for nitrate-N pollution
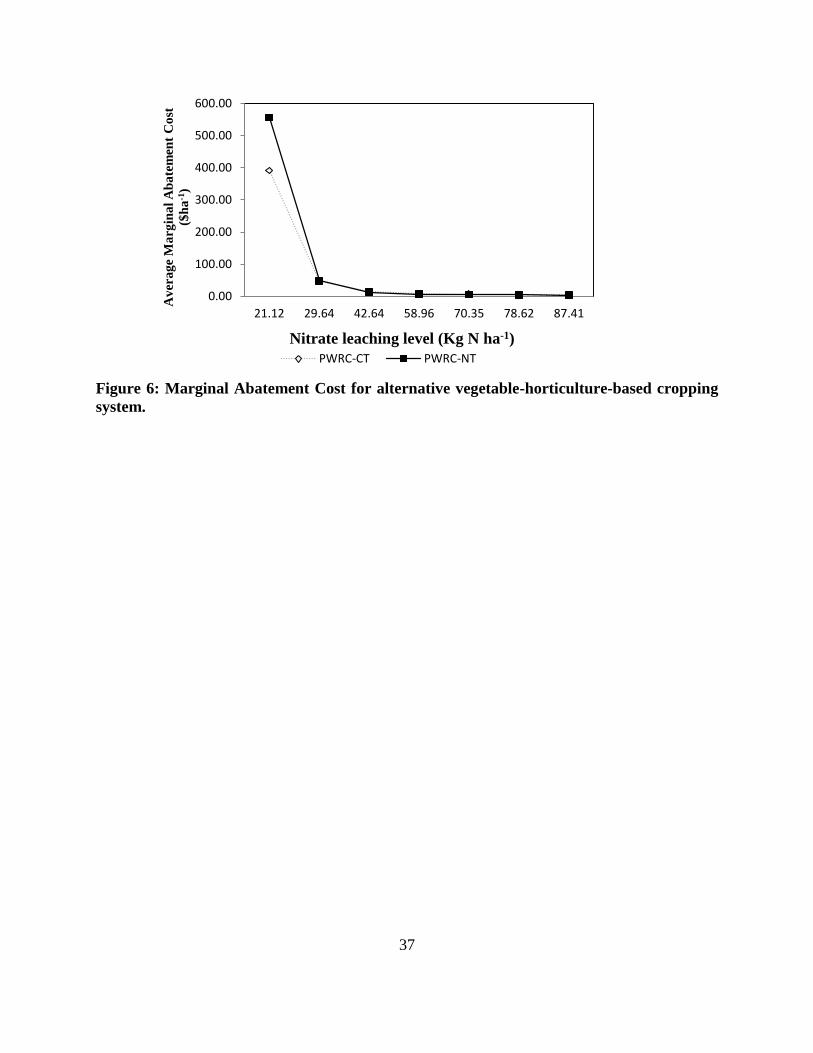
control depended on the stringency of the nitrate-N leached regulation level. The
differences in MACs were not substantial among cropping systems at higher nitrate-N
leached restrictions (i.e., less stringent nitrate-N pollution levels) (Figure 4 to 6). This
implies that at less stringent nitrate-N pollution levels, extensive management choices
(crop rotation and tillage systems) were not as important as the intensive management
choice (i.e., N fertilizer/manure level e.g., MERN) for a particular crop. The findings in
this study are generally consistent with Yiridoe and Weersink (1998) and Swinton and
Clark (1994) who reported that under stringent agricultural pollution regulations, there
tend to be substitution for less N intensive cropping systems.

21
References
Ahmad, H.M.N., A. Sinclair, R. Jamieson, A. Madani, P. Havard, D. Hebb and E.
Yiridoe. 2011. Modeling sediment and nitrogen export for a rural watershed in
eastern Canada using the SWAT model. Journal of Environmental Quality 40
(4): 1182-94.
Bretas, F.S. and D.A. Haith. 1990. Linear programming analysis of pesticide pollution
of groundwater. Trans ASAE 33 (1): 167-172.
Bonham, J.G., D.J. Bosch, and J.W. Pease. 2006. Cost-effectiveness of nutrient
management and buffers: comparison of two spatial scenarios. Journal of
Agricultural and Applied Economics. 38(1): 17-32.
Brooks, D.B. and S. Holtz. 2009. Water soft path analysis: from principles to practice.
Water International 34(2):158-169.
Brooks, D.B., O.M. Brandy and S. Gurman. 2009. Making the Most of the Water We
Have: The Soft Path Approach to Water Management. Toronto, ON: Earthscan.
Burton, DL., M.F. Younie , E.G. Beauchamp. R.G. Kachanoski, D M Brown, and
D.E. Elrick. 1993. Alternate Crop Management Practices and Nitrate
Contamination of Groundwater with Sandy Soils used for Tobacco Production.
Report prepared for Tobacco Diversification Plan/Alternate Enterprise Initiative
Development Branch, Agriculture Canada, and Supplies and Services Canada.
Ottawa, Canada
Byström, O. 1998. The nitrogen abatement cost in wetlands. Ecological Economics 26:
321–331.
Ecology Action Centre. 2010. Headwaters to Coasts: Getting to Watershed Management
in Nova Scotia. Halifax, NS: Ecology Action Centre (EAC).

22
El-Nazer, T. and B.A. McCarl. 1986. The choice of crop rotation: a modeling approach
and case study. American Journal of Agricultural Economics 68: 127-136.
Fuller, K.D., R. Gordonb, M. Grimmettc, S. Fillmorea, A. Madanid, J. VanRoestele,
G.W. Strattond, J. MacLeodc, C. Embreea and E.St. Georgea. 2010.
Seasonal and crop rotational effects of manure management on nitrate–nitrogen
leaching in Nova Scotia. Agricultural Ecosystems and Environment 137: 267–
275.
Gauthier, M.J., M. Camporese, C. Rivard, C. Paniconi and M. Larocque. 2009. A
modeling study of heterogeneity and SW/GW interactions. Hydrology and Earth
System Sciences Discussion 6: 2751–2793.
Jalota, S. K., A. Sood, J. D. Vitale and R. Srinivasan. 2007. Simulated crop yield
response to irrigation water and economic analysis: increasing irrigated water
use efficiency in the Indian Punjab. Agronomy Journal 99: 1073-1084.
McKitrick, R. 1999. A derivation of the marginal abatement cost function. Journal of
Environmental Economics and Management 306-314.
Nova Scotia Department of Environment. 2010. Well Water Nitrate Monitoring
Program - 2010 Report. Halifax, NS: Nova Scotia Department Environment.
Parris, K. 2011. Impact of Agriculture on Water Pollution in OECD Countries: Recent
Trends and Future Prospects. International Journal of Water Resources
Development 27(1): 33-52.
Roberts, W.S. and S. Swinton. 1996. Economic methods for comparing alternative crop
production systems: A review of the literature. American Journal of Alternative
Agriculture 11: 10–17.
23
Sinclair, A., D. Hebb, R. Jamieson, R. Gordon, K. Benedict, K. Fuller, G. Stratton
and A. Madani. 2009. Growing season surface water loading of fecal indicator
organisms within a rural watershed. Water Research 43: 1199-1206.
Stoorvogel, J.J., J.M. Antle, C.C. Crissman, and W. Bowen. 2004. The tradeoff analysis
model: integrated bio-physical and economic modeling of agricultural
production system. Agricultural Systems. 80: 43-66.
Stratton, G.W., S.A. Madani and R.J. Gordon. 2003. Pathogen Management in
Agriculture: Water Quality Monitoring in the Atlantic Canada. Paper presented
at the American Society of Agricultural and biological Engineers (ASAE/CSAE)
annual international meeting Paper No: 022058. Ottawa, ON, July 28-July 31.
Stuart, V., D. B. Harker, T. Scott and R. L. Clearwater. 2010. Watershed Evaluation
of Beneficial management practices (WEBs): towards enhanced agricultural
landscape planning; four year review (2004/5-2007/8). Ottawa, ON, Canada:
Agriculture and Agri-food Canada (AAFC).
Sumelius J., M. Mesic, Z. Grgic, I. Kisic and R. Franic. 2005. Marginal abatement cost
of reducing leaching of nitrates in Croatian agriculture. Agriculture and Food
Science 14:293-309.
Swinton, S.M. and D.S. Clark. 1994. Farm-level evaluation of alternative policy
approaches to reduce nitrate leaching from Midwest agriculture. Agricultural
and Resource Economics Review. 23(1): 66-74.
Timmer, D.K., R.C. de Loe and R.D. Kreutzwiser. 2007. Source water protection in
the Annapolis Valley, Nova Scotia: Lessons for building local capacity. Land
Use Policy 24: 187–198.
Tong, S.T.Y. and S. Naramngam. 2007. Modeling the impacts of farming practices on
water quality in the little Miami River Basin. Environmental Management
39:853-856.
24
Yang, W., A.N. Rousseau, and P. Boxall. 2007. An integrated economic-hydrologic
modeling framework for the watershed evaluation of beneficial management
practices. Journal of Soil and Water Conservation. 62(6): 423-432
Yiridoe, E.K. 2000. Risk of public disclosure in environmental farm plan programs:
characteristics and mitigating legal and policy strategies. Journal of Agricultural
and Environmental Ethics. 13(1): 101-120.
Yiridoe, E.K. and A. Weersink. 1998. Marginal abatement costs of reducing
groundwater-N pollution with intensive farm management choices. Agricultural
and Resource Economics Review 169-185.

25
Table 1. Cropping systems studied
(a) Farming systems
Rotation systems Cropping sequencea Tillage type
b
N Fertilizer
rates (%)c
Grain corn-based
cropping system
CCAAA CT
110% 100%,
90%, 75%,
50%, 25% and
0% of
recommended N
rates.
CCAAA NT
CCCAA CT
CCCAA NT
Potato-based cropping
System
PBWFPC CT
PBWFPC NT
PCBPC CT
PCBPC NT
Vegetable-horticulture-
based cropping system
PWFRC CT
PWFRC NT
(b) Nutrient N application rates
Crop
Nutrient N rates (kg N ha-1
)
Inorganic
N
Organic
N
Total N
(100%) 110% 90% 75%
50
% 25% 0%
Grain
Corn 37 143 180 198 162 135 90 45 0
Alfalfad 42 - 42 46.2 37.8 31.5 21 10.5 0
Winter
wheat
-
114
114
125.4 102.6 85.5 57 28.5 0
Barley
6 86 92 101.2 82.8 69 46 23 0
Potato 150 - 150 165 135 112.
5 75 37.5 0
Carrot 68 - 68 74.8 61.2 51 34 17 0
Notes: a
Crops are denoted by: WF=winter wheat feed, P=Potato, R=Carrot, C=Grain
corn, B=Barley, A=Alfalfa. b
NT management applies only to grain crops (i.e., winter wheat and grain corn).
In both tillage treatments, potatoes and carrots were assumed to be managed under
conventional tillage only, consistent with the practice in the study area. c
Nutrient N applications rates considered included 110% 100%, 90%, 75%, 50%,
25% and 0% of rates recommended in nutrient management plans for the study
region. d “-” denotes no crop nutrients added.
26
Table 2. Equations for optimal N fertilization levels, and marginal abatement cost associated with nitrate-N leached
restrictions.
where a, b, c represent crop yield response parameters, and α, β, and γ represent parameters for nitrate leaching response function.
Type of crop yield and associated
nitrate-N response functions
Optimal N fertilization function
** ik ikX f V
Marginal abatement cost function
( , , _ )f p w V ik
Quadratic crop yield and nitrate-N
leaching response functions
2 4 41
2
ikV
2
2
4 4
4 4
ik
ik
pb pc pc V w
V
Mitscherlich-Buale crop yield with a
quadratic nitrate leaching response
function
2 4 41
2
ikV
2(2 4 41
2
2 4 4
ikb c V
ik
pabe w
V
27
Table 3. Gross Margins ($ha-1
) and Marginal Abatement Costs ($ha-1
) for corn production, under alternative nitrate –N
leaching restrictions and management options.
a CT denotes conventional tillage and NT denotes no-till systems.
b denotes percentage level of NMP recommended N rate.
c MCL denotes Health Canada maximum contaminant limit for N in drinking water.
d MERN denotes maximum economic rate of nitrogen.
Groundwater N leaching
restriction
level (kg N ha-1 yr-1)
Gross Margin MAC
Groundwater N leaching
restriction
level (kg N ha-1 yr-1)
Gross Margin MAC
Groundwater N leaching
restriction
level (kg N ha-1 yr-1)
Gross Margin MAC
Groundwater N leaching
restriction
level (kg N ha-1 yr-1)
Gross Margin MAC
Groundwater N leaching
restriction
level (kg N ha-1 yr-1)
Gross Margin MAC
CCAAA-CTa CCCAA-CT PBWPC-CT PCBPC-CT PWRC-CT
0%b 18.82 -189.73 96.01 23.79 -217.78 74.20 24.49 -355.28 51.10 25.97 -439.06 30.19 23.57 -315.17 59.81
MCLc 22.17 60.14 58.52 19.09 37.99 41.01 14.91 -9.39 26.51 20.23 -292.27 21.85 13.40 169.82 38.21
25% 22.76 93.45 54.45 25.08 87.58 36.44 21.04 -109.76 32.03 30.64 -200.27 17.82 19.19 -12.98 45.59
50% 27.99 309.43 31.08 33.82 318.94 19.22 29.19 102.28 21.33 44.64 -4.02 11.08 25.91 255.11 35.01
75% 34.50 458.20 16.10 45.31 476.33 9.36 39.35 280.83 14.49 62.24 149.69 6.83 33.54 489.09 26.82
90% 39.02 515.20 9.45 53.52 535.24 5.24 46.42 371.89 11.45 74.52 221.49 4.96 38.55 613.11 22.74
100% 42.29 539.76 5.68 59.55 559.72 2.97 51.53 425.90 9.74 83.42 260.85 3.91 42.08 688.96 20.30
110% 45.77 553.57 2.35 66.02 572.37 1.01 56.96 474.56 8.22 92.91 293.41 2.98 45.76 759.36 18.05
MERNd 48.64 556.87 0.00 69.88 574.28 0.00 116.80 671.83 0.00 140.02 355.84 0.00 103.51 1178.90 0.00
CCAAA-NT CCCAA-NT PBWPC-NT PCBPC-NT PWRC-NT
0% 19.36 -78.46 57.75 19.84 -110.00 46.17 15.02 -246.26 49.93 20.27 -330.99 28.61 13.88 -206.03 47.53
MCL 23.59 132.85 43.12 25.33 102.51 32.61 24.54 91.38 26.17 26.17 -186.66 21.03 24.89 227.33 32.70
25% 25.21 199.00 38.76 28.00 183.61 28.15 21.42 2.67 30.97 31.13 -92.58 17.17 21.17 98.23 36.75
50% 32.03 412.47 24.83 38.33 410.67 16.98 29.97 216.76 20.45 45.60 103.93 10.79 29.51 368.47 28.54
75% 39.82 561.96 14.18 50.83 571.17 9.37 40.65 395.99 13.76 63.67 258.54 6.73 38.91 604.67 22.08
90% 44.97 620.94 8.92 59.37 635.54 5.87 48.09 486.80 10.80 76.24 331.19 4.92 45.06 730.05 18.82
100% 48.59 647.46 5.78 65.50 665.13 3.85 53.48 540.36 9.14 85.34 371.24 3.91 49.37 806.84 16.86
110% 52.37 663.75 2.89 71.97 684.08 2.05 59.21 588.36 7.66 95.02 404.59 3.01 53.85 878.18 15.04
MERN 56.68 669.84 0.00 80.76 692.80 0.00 118.29 771.55 0.00 145.38 471.70 0.00 124.75 1310.56 0.00
28
Table 4. Gross Margins ($ ha-1
) and Marginal Abatement Costs ($ ha-1
) for barley and alfalfa production, under alternative
nitrate–N leaching restrictions and management options.
a CT denotes conventional tillage and NT denotes no-till systems.
b denotes percentage level of NMP recommended N rate.
c MCL denotes Health Canada maximum contaminant limit for N in drinking water.
d non differentiable point.
e The notation n.c. implies that the groundwater nitrate-N restriction was a redundant constraint.
Crop
Groundwater N
leaching
restriction level (kg N ha-1 yr-1)
Gross Margin MAC
Groundwater N
leaching
restriction level (kg N ha-1 yr-1)
Gross Margin MAC
Groundwater N
leaching
restriction level (kg N ha-1 yr-1)
Gross Margin MAC
Groundwater N
leaching
restriction level (kg N ha-1 yr-1)
Gross Margin MAC
PBWPC-CT PCBPC-CT PBWPC-NT PCBPC-NT
Barley
0% 21.13 -33.46 _ 21.57 -27.57 9.83 25.79 -52.25 15.67 28.50 -44.85 7.55
MCL 33.13 50.23 7.39 30.20 -15.50 7.43 33.48 -316.29 7.38 30.55 -374.77 7.10
25% 26.69 53.11 13.80 26.80 59.23 8.28 34.31 34.56 6.96 42.63 42.03 4.91
50% 33.09 115.78 7.42 33.45 120.10 6.70 47.23 97.04 3.33 58.48 102.26 2.81
75% 40.33 154.55 4.66 41.52 155.03 5.17 64.56 135.17 1.33 76.05 135.85 1.10
90% 45.08 166.35 3.60 47.05 163.54 4.30 77.07 146.36 0.51 87.41 143.21 0.22
100% 48.42 169.43 3.03 51.03 164.03 3.74 86.29 148.96 0.07 95.32 n.c. n.c.
110% 51.89 168.69 2.54 55.23 160.37 3.21 96.21 n.c. n.c. 103.51 n.c. n.c.
CCAAA-CTa CCCAA-CT CCAAA-NT CCCAA-NT
Alfalfa
0%b 36.48 900.63 7.26 31.84 897.2426 0.09 37.65 841.7988 19.79 32.53 826.6314 16.23
MCLc 23.57 900.63 _d 23.58 897.2426 _ 24.14 808.0068 _ 24.01 792.8394 _
25% 42.15 n.c. e n.c. 37.64 n.c. n.c. 43.11 n.c. n.c. 39.23 858.3138 0.16
50% 48.21 n.c. n.c. 46.22 n.c. n.c. 49.58 n.c. n.c. 48.20 n.c. n.c.
75% 54.68 n.c. n.c. 57.57 n.c. n.c. 57.06 n.c. n.c. 59.44 n.c. n.c.
90% 58.75 n.c. n.c. 65.72 n.c. n.c. 62.02 n.c. n.c. 67.27 n.c. n.c.
100% 61.55 n.c. n.c. 71.70 n.c. n.c. 65.54 n.c. n.c. 72.95 n.c. n.c.
110% 64.40 n.c. n.c. 78.13 n.c. n.c. 69.21 n.c. n.c. 78.99 n.c. n.c.
29
Table 5. Gross Margins ($ ha-1
) and Marginal Abatement Costs ($ ha-1
) for winter wheat production, under alternative nitrate–
N leaching restrictions and management options.
Restriction
on
Nitratesa
Gross
Margin MAC
Restriction
on
Nitrates
Gross
Margin MAC
Restriction
on
Nitrates
Gross
Margin MAC
Restriction
on
Nitrates
Gross
Margin MAC
PBWPC-CTb
PWRC-CT
PBWPC-NT
PWRC-NT
0%c 21.13 -10.52 14.64 21.57 41.80 18.83 21.18 -25.72 13.37 23.84 24.79 26.49
MCLd 24.08 28.75 12.17 28.60 141.77 10.96 24.22 -155.34 11.21 28.69 -52.89 13.48
25% 28.14 72.70 9.58 28.26 137.97 11.20 28.57 54.92 8.83 29.17 120.27 12.88
50% 36.45 136.12 5.98 37.13 216.06 6.93 37.25 116.27 5.55 37.23 197.17 7.17
75% 46.05 179.77 3.29 48.20 276.07 4.19 47.21 158.30 3.05 48.03 255.48 4.03
90% 52.43 196.46 1.98 55.89 303.40 2.98 53.81 174.26 1.83 55.82 281.55 2.74
100% 56.95 203.62 1.21 61.45 329.71 2.29 58.46 181.04 1.10 61.57 295.22 2.04
110% 61.67 207.63 0.50 67.37 318.00 1.68 63.31 184.73 0.43 67.75 305.91 1.44
MERNe 65.43 208.55 0.00 91.18 347.91 0.00 66.81 185.47 0.00 89.67 320.15 0.00
a Groundwater nitrate-N leached from associated N fertilization levels (0%, 25%, 50%, 75%, 90%, 100% and 110% of NMP
recommended N rate) (kg N ha-1
yr-1
).
b CT denotes conventional tillage and NT denotes no-till systems.
c denotes percentage level of NMP recommended N rate.
d MCL denotes Health Canada maximum contaminant limit for N in drinking water.
e MERN denotes maximum economic rate of nitrogen.

30
Table 6. Gross Margins ($ ha-1
) and Marginal Abatement Costs ($ ha-1
) for potato production, under alternative nitrate –N
leaching restrictions and management options.
Restriction
on Nitratesa
Gross Margin MAC Restriction on
Nitrates Gross Margin MAC
Restriction on
Nitrates Gross Margin MAC
PBWPC-CT
b
PCBPC-CT
PWRC-CT
0%c
18.14 2840.76 875.26 21.33 2445.61 705.43 18.55 4477.84 731.71
MCLd
21.95 5092.49 399.29 21.25 2445.61 716.53 19.99 5378.61 535.37
25% 30.74 7056.94 121.44 36.35 6523.92 92.55 32.36 8191.38 88.19
50% 51.01 8147.69 21.08 59.01 7416.26 14.05 53.89 8979.18 12.64
75% 78.96 8418.39 3.71 89.31 7598.76 1.95 83.16 9133.34 1.60
90% 99.41 8463.06 1.13 111.15 7620.80 0.38 104.44 9149.83 0.23
100% 114.58 8473.93 0.39 127.25 n.c.f n.c. 120.16 n.c. n.c
110% 130.98 8476.81 0.01 144.56 n.c. n.c. 137.13 n.c. n.c
PBWPC-NT PCBPC-NT PWRC-NT
0% 18.23 2802.23 871.01 21.58 2417.33 698.13 22.73 3837.64 1343.07
MCL 22.11 6973.62 395.36 21.43 4307.60 718.05 20.34 5727.91 8624.30
25% 30.93 7042.29 121.08 36.75 6507.10 92.09 33.98 8227.81 103.13
50% 51.32 8135.90 20.99 59.56 7402.37 14.02 53.87 8975.69 10.85
75% 79.39 8406.46 3.68 90.03 7585.61 1.95 82.40 9088.71 0.87
90% 99.92 8450.95 1.12 111.98 7607.79 0.38 103.66 n.c n.c.
100% 115.14 8461.73 0.38 128.14 n.c. n.c. 119.56 n.c. n.c.
110% 131.60 8464.54 0.00 145.52 n.c. n.c. 136.84 n.c. n.c. a
Groundwater nitrate-N leached from associated N fertilization levels (0%, 25%, 50%, 75%, 90%, 100% and 110% of NMP
recommended N rate) (kg N ha-1
yr-1
).
b CT denotes conventional tillage and NT denotes no-till systems.
c denotes percentage level of NMP recommended N rate.
d MCL denotes Health Canada maximum contaminant limit for N in drinking water.
f The notation n.c. implies that the groundwater nitrate-N restriction was a redundant constraint.

31
Table 7. Gross Margins ($ ha-1
) and Marginal Abatement Costs ($ ha-1
) for carrot
production, under alternative nitrate –N leaching restrictions and management
options. Restriction on
Nitratesa Gross Margin MAC
Restriction on
Nitrates Gross Margin MAC
PWRC-CTb
PWRC-NT
0%c
22.41 14944.09 755.54 22.40 15851.29 806.46
MCLd
22.89 14944.09 680.62 22.91 14851.72 718.70
25% 36.48 18006.60 43.11 36.52 17978.18 40.33
50% 51.74 18220.42 2.26 51.81 18170.72 1.78
MERNe
55.00 18225.67 1.07 53.82 18173.55 1.08
75% 68.69 n.c.f n.c. 68.77 n.c. n.c.
90% 79.66 n.c. n.c. 79.75 n.c. n.c.
100% 87.32 n.c. n.c. 87.41 n.c. n.c.
110% 95.24 n.c. n.c. 95.33 n.c. n.c. a Groundwater nitrate-N leached from associated N fertilization levels (0%, 25%, 50%,
75%, 90%, 100% and 110% of NMP recommended N rate) (kg N ha-1
yr-1
). b CT denotes conventional tillage and NT denotes no-till systems.
c denotes percentage level of NMP recommended N rate.
d MCL denotes Health Canada maximum contaminant limit for N in drinking water.
e MERN denotes maximum economic rate of nitrogen fertilization.
f n.c. implies that the groundwater nitrate-N restriction was a non-binding constraint.
32
Table 8. Whole-farm analysis of Gross Margins ($ ha-1
) and Marginal Abatement Costs ($ ha-1
) for selected cropping systems
under varying levels of nitrate-N pollution restrictions.
Restriction
on Nitratesa
Gross
Margin MAC
Restriction
on Nitrates
Gross
Margin MAC
Restriction
on Nitrates
Gross
Margin MAC
Restriction
on Nitrates
Gross
Margin MAC
(a) CORN-BASED CROPPING SYSTEMS
CCAAA-CTb
CCCAA-CT
CCAAA-NT
CCCAA-NT
0%c 29.42 464.48 42.76 27.01 228.23 44.55 30.33 473.69 34.97 24.92 264.65 34.20
MCLd 23.01 60.14 58.52 20.89 37.99 41.01 23.92 -78.46 43.12 24.80 102.51 32.61
25% 34.39 580.34 20.80 30.10 409.47 21.39 35.95 603.18 15.38 32.49 453.49 16.96
50% 40.12 659.92 11.28 38.78 544.27 11.08 42.56 683.81 8.98 42.28 587.15 9.77
75% 46.61 712.14 5.34 50.21 634.08 5.24 50.16 736.55 4.77 54.27 678.89 5.23
90% 50.86 730.55 2.72 58.40 666.56 2.81 55.20 755.77 2.72 62.53 714.61 3.17
100% 53.84 737.45 1.24 64.41 679.31 1.47 58.76 763.46 1.50 68.48 730.43 1.98
110% 56.95 n.c.e n.c. 70.86 684.96 0.31 62.47 767.05 0.69 74.78 739.85 0.71
MERNf 33.59 763.12 4.35 54.38 703.46 0.00 39.74 773.01 11.87 58.94 746.33 6.49
(b) POTATO-BASED CROPPING SYSTEMS
PBWPC-CT
PCBPC-CT
PBWPC-NT
PCBPC-NT
0% 20.61 1328.93 454.07 23.23 797.11 296.21 19.69 1056.04 364.20 22.44 825.57 292.21
MCL 23.20 2050.92 168.93 22.63 858.24 296.84 25.29 2713.40 167.10 25.15 1573.42 297.05
25% 27.47 2825.98 59.65 32.15 2541.30 45.81 29.23 2835.35 57.79 35.68 2574.21 44.68
50% 40.15 3329.91 15.38 48.15 2988.92 11.39 43.42 3340.37 14.26 53.76 3022.97 10.49
75% 56.73 3490.39 5.97 68.92 3130.39 4.55 62.24 3500.48 5.10 76.69 3164.83 3.69
90% 68.55 3532.16 3.86 83.68 3169.63 2.99 75.76 3541.86 3.08 92.77 3204.23 2.17
100% 77.21 3549.36 2.95 94.47 3186.39 2.30 85.70 3558.76 2.21 104.46 3221.11 1.49
110% 86.01 3561.08 2.32 104.88 3198.46 1.89 94.72 3570.24 1.62 114.33 3233.60 1.11
MERN 87.46 3595.96 0.90 106.73 3219.58 1.04 97.05 3602.18 0.33 118.88 3256.28 0.24 a Groundwater nitrate-N leached from associated N fertilization levels (0%, 25%, 50%, 75%, 90%, 100% and 110% of NMP
recommended N rate) (kg N ha-1
yr-1
). b CT denotes conventional tillage and NT denotes no-till systems.
c denotes percentage level of NMP recommended N rate.
d MCL denotes Health Canada maximum contaminant limit.
e n.c. implies that the groundwater nitrate-N restriction was a redundant constraint.
f MERN denotes maximum economic rate of nitrogen fertilization.
33
Table 9. Whole-farm analysis of Gross Margins ($ ha-1
) and Marginal Abatement
Costs ($ ha-1
) for vegetable-horticulture-based cropping systems under varying
nitrate–N pollution restrictions.
a Groundwater nitrate-N leached from associated N fertilization levels (0%, 25%, 50%,
75%, 90%, 100% and 110% of NMP recommended N rate) (kg N ha-1
yr-1
). b CT denotes conventional tillage and NT denotes no-till systems.
c denotes percentage level of NMP recommended N rate.
d MCL denotes Health Canada maximum contaminant limit.
e MERN denotes maximum economic rate of nitrogen.
Restriction on
Nitratesa
Average
Gross Margin
Average
MAC
Restriction on
Nitrates
Average
Gross Margin
Average
MAC
PWRC-CTb PWRC-NT
MCLc 21.22 5158.57 316.29 24.21 5188.52 2347.29
0% 21.53 4787.14 391.47 20.71 4876.92 555.89
25% 29.07 6580.74 47.02 30.21 6606.12 48.27
50% 42.17 6917.69 14.21 43.11 6928.01 12.08
75% 58.40 7031.41 8.07 59.53 7030.77 6.64
90% 69.63 7072.19 6.37 71.07 7068.83 5.25
100% 77.75 7096.94 5.50 79.48 7088.72 4.53
110% 86.37 7109.77 4.75 88.44 7108.69 3.91
MERNd 84.62 7223.30 0.53 86.96 7222.54 0.55
34
Figure 1: Conceptual linkages between a good output (crop yield) and a bad output
(N-leached) produced for two alternative cropping systems, under varying N
fertilizer rates.
Source: Yiridoe and Weersink 1998.
35
Figure 2: Gross margins increase with less stringent nitrate-N leached regulation levels for
corn production under conventional tillage.
Figure 3: Marginal abatement cost under varying nitrate-N leached restriction levels for
corn production under conventional tillage.
-600.00
-400.00
-200.00
0.00
200.00
400.00
600.00
800.00
23.33 23.74 32.31 42.99 50.41 55.77 61.48G
ross
Ma
rgin
($
ha
-1)
Nitrate leaching level (Kg N ha-1)
CCAAA-CT CCCAA-CT PBWPC-CT
PCBPC-CT PWRC-CT
0.00
20.00
40.00
60.00
80.00
100.00
120.00
23.33 23.74 32.31 42.99 50.41 55.77 61.48
Ma
rgin
al
Ab
ate
men
t C
ost
($
ha
-1)
Nitrate leaching level (Kg N ha-1)
CCAAA-CT CCCAA-CT PBWPC-CT
PCBPC-CT PWRC-CT

36
Figure 4: Marginal Abatement Cost for alternative corn-based cropping system.
Figure 5: Marginal Abatement Cost for alternative potato-based cropping system.
0.00
5.00
10.00
15.00
20.00
25.00
30.00
35.00
40.00
45.00
50.00
27.92 33.23 40.93 50.31 56.75 61.37 66.27
Mar
gin
al A
bat
em
en
t C
ost
($
ha
-1)
Nitrate leaching level (Kg N ha-1)
CCAAA-CT CCCAA-CT CCAAA-NT CCCAA-NT
0.00
50.00
100.00
150.00
200.00
250.00
300.00
350.00
400.00
450.00
500.00
21.49 31.13 46.37 66.14 80.19 90.46 99.99
Ma
rgin
al
Ab
ate
men
t C
ost
($
ha
-1)
Nitrate leaching level (Kg N ha-1)
PBWPC-CT PCBPC-CT PBWPC-NT PCBPC-NT
37
Figure 6: Marginal Abatement Cost for alternative vegetable-horticulture-based cropping
system.
0.00
100.00
200.00
300.00
400.00
500.00
600.00
21.12 29.64 42.64 58.96 70.35 78.62 87.41
Av
era
ge
Ma
rgin
al
Ab
ate
men
t C
ost
($h
a-1
)
Nitrate leaching level (Kg N ha-1)
PWRC-CT PWRC-NT