Nimsoft Monitor cisco ucs...
89
cisco_ucs Guide v2.1 series Nimsoft® Monitor™
Transcript of Nimsoft Monitor cisco ucs...

cisco_ucs Guide v2.1 series
Nimsoft® Monitor™

Legal Notices Copyright © 2013, CA. All rights reserved.
Warranty
The material contained in this document is provided "as is," and is subject to being changed, without notice, in future editions. Further, to the maximum extent permitted by applicable law, Nimsoft LLC disclaims all warranties, either express or implied, with regard to this manual and any information contained herein, including but not limited to the implied warranties of merchantability and fitness for a particular purpose. Nimsoft LLC shall not be liable for errors or for incidental or consequential damages in connection with the furnishing, use, or performance of this document or of any information contained herein. Should Nimsoft LLC and the user have a separate written agreement with warranty terms covering the material in this document that conflict with these terms, the warranty terms in the separate agreement shall control.
Technology Licenses
The hardware and/or software described in this document are furnished under a license and may be used or copied only in accordance with the terms of such license.
No part of this manual may be reproduced in any form or by any means (including electronic storage and retrieval or translation into a foreign language) without prior agreement and written consent from Nimsoft LLC as governed by United States and international copyright laws.
Restricted Rights Legend
If software is for use in the performance of a U.S. Government prime contract or subcontract, Software is delivered and licensed as "Commercial computer software" as defined in DFAR 252.227-7014 (June 1995), or as a "commercial item" as defined in FAR 2.101(a) or as "Restricted computer software" as defined in FAR 52.227-19 (June 1987) or any equivalent agency regulation or contract clause. Use, duplication or disclosure of Software is subject to Nimsoft LLC’s standard commercial license terms, and non-DOD Departments and Agencies of the U.S. Government will receive no greater than Restricted Rights as defined in FAR 52.227-19(c)(1-2) (June 1987). U.S. Government users will receive no greater than Limited Rights as defined in FAR 52.227-14 (June 1987) or DFAR 252.227-7015 (b)(2) (November 1995), as applicable in any technical data.
Trademarks
Nimsoft is a trademark of CA.
Adobe®, Acrobat®, Acrobat Reader®, and Acrobat Exchange® are registered trademarks of Adobe Systems Incorporated.
Intel® and Pentium® are U.S. registered trademarks of Intel Corporation.
Java(TM) is a U.S. trademark of Sun Microsystems, Inc.
Microsoft® and Windows® are U.S. registered trademarks of Microsoft Corporation.
Netscape(TM) is a U.S. trademark of Netscape Communications Corporation.
Oracle® is a U.S. registered trademark of Oracle Corporation, Redwood City, California.
UNIX® is a registered trademark of the Open Group.
ITIL® is a Registered Trade Mark of the Office of Government Commerce in the United Kingdom and other countries.
All other trademarks, trade names, service marks and logos referenced herein belong to their respective companies.
For information on licensed and public domain software, see the Nimsoft Monitor Third-Party Licenses and Terms of Use document at: http://docs.nimsoft.com/prodhelp/en_US/Library/index.htm?toc.htm?1981724.html.

Contact CA
Contact CA Support
For your convenience, CA Technologies provides one site where you can access the information that you need for your Home Office, Small Business, and Enterprise CA Technologies products. At http://ca.com/support, you can access the following resources:
■ Online and telephone contact information for technical assistance and customer services
■ Information about user communities and forums
■ Product and documentation downloads
■ CA Support policies and guidelines
■ Other helpful resources appropriate for your product
Providing Feedback About Product Documentation
Send comments or questions about CA Technologies Nimsoft product documentation to [email protected].
To provide feedback about general CA Technologies product documentation, complete our short customer survey which is available on the CA Support website at http://ca.com/docs.


Contents 5
Contents
Chapter 1: cisco_ucs 2.1 7
cisco_ucs Overview ...................................................................................................................................................... 7
Chapter 2: cisco_ucs Probe Deployment 9
Requirements ............................................................................................................................................................... 9
Installation Notes ......................................................................................................................................................... 9
Probe Deployment ....................................................................................................................................................... 9
Chapter 3: cisco_ucs configuration 11
Probe Configuration Interface Installation ................................................................................................................. 11
Monitoring Capabilities .............................................................................................................................................. 11
Templates ................................................................................................................................................................... 12
Probe GUI ................................................................................................................................................................... 12
Configuration Interface Navigation ..................................................................................................................... 12
The Toolbar Buttons ............................................................................................................................................ 12
The Navigation (left-side) Pane ........................................................................................................................... 13
The Content (right-side) Pane ............................................................................................................................. 14
Probe Configuration ................................................................................................................................................... 15
General Setup ..................................................................................................................................................... 15
Create a New Resource ....................................................................................................................................... 16
Message Pool Manager ....................................................................................................................................... 17
Create New Template ......................................................................................................................................... 18
Setting the Number of Connection Retries ......................................................................................................... 19
Chapter 4: Adding Monitors 21
Manually Selecting Monitors to be Measured ........................................................................................................... 21
Enabling the Monitors for QoS and Alarming ..................................................................................................... 22
To Edit Monitor Properties ................................................................................................................................. 22
Using Templates .................................................................................................................................................. 25
Using Automatic Configurations ......................................................................................................................... 27
Equipment .................................................................................................................................................................. 29
Chassis Interface Card ......................................................................................................................................... 29
Fabric Interconnects............................................................................................................................................ 31
Rack Mounts ....................................................................................................................................................... 32
Pools ........................................................................................................................................................................... 33

6 cisco_ucs Guide
UCS Service Profiles .................................................................................................................................................... 34
Chapter 5: cisco_ucs Metrics 34

Chapter 1: cisco_ucs 2.1 7
Chapter 1: cisco_ucs 2.1
This description applies to cisco_ucs probe version 2.1.
This section contains the following topics:
cisco_ucs Overview (see page 7) Documentation Changes (see page 8)
cisco_ucs Overview
The Nimsoft cisco_ucs probe is a tool for managing the health and performance of your Unified Computing System (UCS).
The Cisco Unified Computing System is a next-generation data center platform that unites computing, networking, storage access, and virtualization into a cohesive system designed to reduce total cost of ownership (TCO) and increase business agility.

cisco_ucs Overview
8 cisco_ucs Guide
Documentation Changes
This table describes the version history for this document.
Version Date What's New?
2.1 December 2013 Added information about the new Raw Config setting for the number of server connection retries.
2.0 June 2013 Restructured document based on new GUI.
1.5 September 2012
Added support for UCS Manager 2.0; Added Status and Count Indicators for monitors; added predefined QoS for several monitors.
1.4 September 2011
Updated the Advanced tab section and added theWorking with Monitors section.
1.3 June 2011 Added support for rack mounted units; added metrics for Interface Cards; and added support for multiple selection of thresholds.
Related Documentation
Documentation for other versions of the cisco_ucs probe
The Release Notes for the cisco_ucs probe
Monitor Metrics Reference Information for CA Nimsoft Probes (http://docs.nimsoft.com/prodhelp/en_US/Probes/ProbeReference/index.htm)

Chapter 2: cisco_ucs Probe Deployment 9
Chapter 2: cisco_ucs Probe Deployment
The cisco_ucs probe requires a Unified Computing System (UCS) Manager environment.
This section contains the following topics:
Requirements (see page 9) Installation Notes (see page 9) Probe Deployment (see page 9)
Requirements
Platform: Windows, Linux, Solaris
The cisco_ucs probe requires the following software environment:
■ Nimsoft Monitor Server 5.1.1 or later
■ Nimsoft robot version 5.32 or later
■ Java Virtual Machine version 1.6 or later (deployed as part of the probe package)
■ Infrastructure Manager v4.02 or later
■ .NET v3.5 on the hardware running the Infrastructure Manager application
■ Cisco Unified Computing System Manager (Cisco UCSM) v1.4 and later
Installation Notes
The cisco_ucs probe is capable of monitoring the state of VMWare ESX Hypervisors and VMs installed on UCS blade servers.
This requires a secure communication between the VMWare vCenter and Cisco UCS Manager (using vCenter extension files).
Probe Deployment
There are three ways to distribute archive packages. You can distribute the package within the web-based Admin Console (for supported probes), from within Infrastructure Manager, or use the standalone Nimsoft Distribution application.


Chapter 3: cisco_ucs configuration 11
Chapter 3: cisco_ucs configuration
This section describes the configuration concepts and procedures for setting up the cisco_ucs probe.
After installing the cisco_ucs probe, you must define what to monitor. At a high level there are three steps:
1. Connect to the UCS Manager environment.
2. Add monitors (checkpoints). See the description in the section Adding Monitors (Checkpoints).
3. Configure the properties for the checkpoints, in which you define QoS data, and define alarms to be sent if specified thresholds are breached.
Note: You must always click the Apply button to activate any configuration changes.
This section contains the following topics:
Probe Configuration Interface Installation (see page 11) Monitoring Capabilities (see page 11) Templates (see page 12) Probe GUI (see page 12) Probe Configuration (see page 15)
Probe Configuration Interface Installation
The probe configuration interface is automatically downloaded and installed by the Nimsoft Infrastructure Manager when the probe is deployed on a robot.
Monitoring Capabilities
The following component entities may be monitored:
■ Equipment
■ Chassis
■ Fabric Interconnects
■ Rack Mounts
■ Pools
■ UCS Service Profiles

Templates
12 cisco_ucs Guide
Templates
Templates let you define reusable sets of monitors to apply to the various Cisco UCS components. After you create a template and define a set of checkpoints belonging to that template, you can either:
■ Drag and drop the template into the cisco_ucs resource hierarchy where you want to monitor the checkpoints defined for the template. This creates a static monitor for that resource component and its children (recursively) based on the template contents at the time the static monitor is created.
■ Drag and drop the template into the Auto Configuration to add the template contents to the list of auto configuration monitors.
See the section Using Templates for details.
Probe GUI
This section contains the basic GUI information for the cisco_ucs probe.
The cisco_ucs probe collects and stores data and information from the monitored components with a UCS Manager environment.
Double-click the line representing the cisco_ucs probe in the Infrastructure Manager to launch the cisco_ucs probe configuration interface. It initially appears with the Resources hierarchy empty.
Configuration Interface Navigation
The configuration interface consists of a row of tool buttons above a window split into two parts:
■ The Navigation pane
■ The Content pane
In addition, a status bar at the bottom of the window shows version information and date and time when the probe was last started.
The Toolbar Buttons
The configuration interface contains a row of toolbar buttons:
Probe GUI
Chapter 3: cisco_ucs configuration 13
■ The General Setup button allows you to configure the log level for the probe.
■ The New Resource button allows you to add a new resource.
■ The Message Pool Manager button allows you to add, remove or edit alarm messages.
■ The Create New Template button allows you to create a new template.
The Navigation (left-side) Pane
The division on the left side of the window is the navigation pane. It displays the monitored Resources and any Templates you have created.
Resources
You can create a new Resource by clicking the New Resource button, or by right-clicking Resources and selecting New Resource.
The Resource is configured as a link to the UCS Manager environment. Note the following icons for the Resource node:
Resource is inactive
Resource is marked for deletion
Resource is unable to connect
New resource (not yet saved)
Resource is loading inventory. Not ready to browse
Resource is connected and inventory is ready to browse
The Resources node contains the following sub-hierarchies:
■ The Auto Configurations node
One or more checkpoints (or templates) can be added to this node, using drag and drop. These checkpoints can to be used for auto configuring unmonitored devices. See the section Using Automatic Configurations for further information.
■ The Auto Monitors node
This is a list of the monitors that have been created based on the Auto-Configuration entries and the inventory available on the Resource.
See the section Using Automatic Configurations for further information.

Probe GUI
14 cisco_ucs Guide
■ The All Monitors node
This node contains the complete list of Monitors for the Resource. This includes Auto Monitors and manually configured Monitors. See the section Using Automatic Configurations for further information.
■ The Cisco UCS hierarchy
This is a list of the Equipment, Pools, UCS Service Profiles and child components available in the UCS Manager environment for monitoring.
Templates
Templates let you define reusable sets of monitors to apply to the various Cisco UCS components. After you create a template and define a set of checkpoints belonging to that template, you can either:
■ Drag and drop the template into the cisco_ucs resource hierarchy where you want to monitor the checkpoints defined for the template. This creates a static monitor for that resource component and its children (recursively) based on the template contents at the time the static monitor is created.
■ Drag and drop the template into the Auto Configuration to add the template contents to the list of auto configuration monitors.
See the section Using Templates for details.
Navigation Pane Updates
A right-click with the mouse pointer in the navigation pane over the hostname or IP address node opens a pop-up menu with menu items for managing the selected object or creating new objects of its type. Options typically include: New, Edit, Delete, Deactivate, and Refresh.
Note: When available, the Refresh menu item retrieves updated values and refreshes the display.
The Content (right-side) Pane
The content of the right pane depends on the current selection in the navigation pane.
If you select a Resources node in the navigation pane, the content pane lists the UCS Manager environments.

Probe Configuration
Chapter 3: cisco_ucs configuration 15
If you select Equipment, Pools, UCS Service Profiles or a child component in the navigation pane, the content pane lists the available monitors. Active Monitors are check-marked. The following icons can appear:
Monitor is active but not enabled to send alarms. The Enable Monitoring checkbox is not selected for this monitor.
Black: Monitor is NOT activated. The Action option is not set in the properties dialog for the monitor.
Green: Monitor is activated for monitoring and, if an alarm threshold is set, the threshold value defined in the properties dialog for the monitor is not exceeded.
Gray: Monitor is an inactive static monitor.
Other colors: Monitor is activated for monitoring and the threshold value defined in the properties dialog for the monitor is exceeded. The color reflects the message token selected in the properties dialog for the monitor.
No value has been measured.
Note: A monitor name in italics indicates that the monitor has been modified and you must apply the changes before the monitor results are updated.
Content Pane Updates
A right-click with the mouse pointer on objects in the content pane opens a pop-up menu with menu items for managing the selected object type (Edit, Delete, and Add to Template).
Note: When available, the Refresh menu item fetches updated values and refreshes the display.
Probe Configuration
This section contains specific configuration information for the cisco_ucs probe.
General Setup
Click the General Setup button to set the level of details written to the log file for the cisco_ucs probe. Log as little as possible during normal operation to minimize disk consumption. This is a sliding scale with the range of information logged being fatal errors all the way to extremely detailed information used for debugging.
Click the Apply button to implement the new log level immediately.
Note: The probe allows you to change the log level without restarting the probe.

Probe Configuration
16 cisco_ucs Guide
Create a New Resource
There are two ways to create a Resource:
■ Click the New Resource button on the toolbar.
■ Right click Resources in the navigation pane and select New Resource.
The Resource (New) dialog box appears. Enter the appropriate field information:
Hostname or IP Address
The hostname or IP address of the Cisco UCS system to monitor.
Port
The port number for the UCS Manager REST API environment. Default is 443.
Active
Select this checkbox to activate or deactivate monitoring of the Resource.
Username
A valid username to be used by the probe to log on to the UCS Manager environment.
Password
A valid password to be used by the probe to log on to the UCS Manager environment.
Alarm Message
Select the alarm message to be sent if the Resource does not respond.
Note: You can edit the message or define a new message using the Message Pool Manager.
Check Interval
The check interval defines how often the probe checks the values of the monitors. This can be set in seconds, minutes or hours. We recommend polling once every 10 minutes. The polling interval should not be smaller than the time required to collect the data.
Test button
Click the Test button to verify the connection to the Resource.
After completing the fields and testing that the connection works, click OK to add the Resource. The initial data collection/polling cycle starts. The resource hierarchy will populate once the polling cycle has completed.

Probe Configuration
Chapter 3: cisco_ucs configuration 17
Message Pool Manager
You can add, remove, or modify alarm messages.These are the messages sent when a monitor threshold has been breached.
Add a New Alarm Message
To add a new alarm message:
1. Click the Message Pool Manager button on the toolbar.
The Message Pool dialog appears.
2. Click the Add button.
The Message Properties dialog appears.
3. Complete the field information:
Identification Name
The name of the message.
Token
The type of alarm, either "monitor_error" or "resource_error".
Error Alarm Text
The alarm text sent when a violation occurs. Variables can be used in this field.
Example: $monitor
This variable will put the actual monitor name in the alarm text. There are several available variables: $resource, $host, $port, $descr, $key, $unit, $value, $oper, and $thr.
Clear Alarm Text (OK)
The text sent when an alarm is cleared.
Error Severity
Severity of the alarm.
Subsystem string/id
The NAS subsystem ID for the Cisco UCS system.
4. Click OK to save the new message.
Edit an Alarm Message
To edit an alarm message:
1. Click the Message Pool Manager button on the toolbar.
The Message Pool dialog appears.

Probe Configuration
18 cisco_ucs Guide
2. Select a message id in the list.
3. Click the Edit button.
The Message Properties dialog appears.
4. Update the message properties as needed.
5. Click OK.
6. Close the Message Pool Manager window and click Apply to implement the changes.
Delete an Alarm Message
To delete an alarm message:
1. Click the Message Pool Manager button on the toolbar.
The Message Pool dialog appears.
2. Select the message to remove.
3. Click the Remove button.
The alarm message is removed.
4. Close the Message Pool Manager window and click Apply to implement the changes.
Create New Template
There are two ways to create a new template:
■ Click the New Template button on the toolbar.
■ Right click the Templates node in the navigation pane and select New Template.
See the section Using Templates for more information.

Probe Configuration
Chapter 3: cisco_ucs configuration 19
Setting the Number of Connection Retries
By default, the cisco_ucs probe tries to reconnect to the Cisco UCS Manager server three more times after failing to connect. This setting will work for most customers, but you can adjust the number of connection retries if necessary. This may be necessary, for example, if your Cisco UCS Manager has a relatively slow response time.
Follow these steps:
1. In Infrastructure Manager, hold the Shift key down, right-click on the name of the probe and select Raw Configure.
2. Click the setup folder, then click New Key.
3. Create a new key named max_retries with the value of the number of retries you want.
4. Save changes.


Chapter 4: Adding Monitors 21
Chapter 4: Adding Monitors
There are three different ways to add monitors to Cisco UCS entities:
Manually select the monitors
To manually select and enable monitors, navigate to the target entity within the Resource. This lists its monitors in the right pane. Use the available check-boxes to enable QoS monitoring for the selected metrics. To enable Alarm thresholding, you will need to launch the Edit Monitor dialog. See the section Manually Selecting Monitors to be Measured.
Use Templates
Templates let you define reusable sets of monitors to apply to various Cisco UCS monitored entities.
See the section Using Templates for further information.
Use Auto Configurations
Auto Configuration is a powerful way to automatically add monitors to be measured. Monitors are created for new devices (that is, ones not currently monitored) that would otherwise need manual configuration to be monitored.
Example: Auto Configuration contains an auto-monitor for server 'Front Temperature'. When a new server is added to the Cisco UCS, the Auto Configuration feature creates a monitor automatically for monitoring the new server.
See the section Using Automatic Configurations for further information.
This section contains the following topics:
Manually Selecting Monitors to be Measured (see page 21) Equipment (see page 29) Pools (see page 33) UCS Service Profiles (see page 34)
Manually Selecting Monitors to be Measured
To select a monitor you want to be measured for a Resource, click the Resource node in the navigation pane, and navigate through the Resources hierarchy. Select a folder in the hierarchy to see the monitors for it, listed in the right pane. Click the check box beside the Monitors you want to be active.
Note: You can also add monitors to be measured using templates (see the section Using Templates).

Manually Selecting Monitors to be Measured
22 cisco_ucs Guide
Select the All Monitors node to list all monitors currently being measured in the right pane. You can select or deselect monitors here as well.
■ Green icon - the monitor is configured and active
■ Gray icon - the monitor is configured but not active
■ Black icon - the monitor is not configured
Note: If a monitor name is in italics you have changed the configuration however have not applied the changes.
Enabling the Monitors for QoS and Alarming
You can now see the current values for the monitors in the Values column in the monitor list. Selecting the checkbox next to a monitor name only enables the monitor. To configure the probe to send QoS data and/or send alarms you must modify the properties for each monitor.
Double-click a monitor (or right-click and select Edit) to launch the monitor’s properties dialog. See To Edit Monitor Properties for further information.
To Edit Monitor Properties
Double-click a monitor (or right-click and select Edit) to launch the monitor’s properties dialog.
Note the Type column when monitors are listed in the right pane. Monitors of type value and type event have different properties.
Monitors of Type Value
The properties for monitors of type value are as follows:
Name
This is the name of the monitor. The name will be inserted into this field when the monitor is retrieved from the UCS Manager environment.
Key
This is a read-only field, describing the monitor key.
Description
This is a description of the monitor. This description will be inserted into this field when the monitor is retrieved from the UCS Manager environment.
Manually Selecting Monitors to be Measured
Chapter 4: Adding Monitors 23
Value Definition
This drop-down list lets you select which value to be used, both for alarming and QoS:
You have the following options:
■ The current value. The most current value measured will be used.
■ The delta value (current – previous). The delta value calculated from the current and the previous measured sample will be used.
■ Delta per second. The delta value calculated from the samples measured within a second will be used.
■ The average value of the last and current sample: (current + previous) / 2.
■ The average value last ... The user specifies a count. The value is then averaged based on the last "count" items.
Active
This activates the monitoring of the probe.
Enable Alarming
Selecting this option activates the alarming.
Note that the monitor will also be selected in the list of monitors in the right window pane when this option is selected, and that you can enable or disable monitoring of the checkpoint from that list.
This section describes the alarm properties for the monitor.
You can define both a high and a low threshold.
Initially the high threshold is set to the current value. Set this value to match your needs.
The low threshold is initially disabled. If you want to use it, you must select another operator than "disabled" from the list and configure it to match your needs.
Operator
Select from the drop-down list the operator to be used when setting the alarm threshold for the measured value.
Example:
>= 90 means the monitor is in alarm condition if the measured value is equal to or above 90.
= 90 means the monitor is in alarm condition if the measured value is exactly 90.
Threshold
The alarm threshold value. An alarm message is sent when this threshold is violated.

Manually Selecting Monitors to be Measured
24 cisco_ucs Guide
Unit
This field specifies the unit of the monitored value (for example %, Mbytes etc.). The field is read-only.
Message ID
Select the alarm message to be issued if the specified threshold value is breached. These messages reside in the message pool. You can modify the messages in the Message Pool Manager.
Publish Quality of Service
Select this option if you want QoS messages to be issued on the monitor.
QoS Name
The unique QoS metric. This is a read-only field.

Manually Selecting Monitors to be Measured
Chapter 4: Adding Monitors 25
Monitors of Type Event
You can monitor Cisco UCS Faults on each Resource. The event is forwarded as an alarm message and the suppression key is based on the entity.
The properties for monitors of type event are:
Name
This is the name of the monitor. The name will be inserted into this field when the monitor is retrieved from the Cisco UCS, and you are allowed to modify the name.
Key
This is a read-only field, describing the monitor key.
Description
This is a description of the monitor. This description will be inserted into this field when the monitor is retrieved from the Cisco UCS. This is a read-only field.
Subscribe
Selecting this option, an alarm will be sent when this event has been triggered.
Operator
Select the operator to be used when setting the alarm threshold for the event.
This threshold refers to the event’s severity level in Cisco UCS.
Example: >= 1 means alarm condition if the event is triggered, and the severity level in Cisco UCS is equal to or higher than 1 (Warning).
Severity
The threshold severity level for the event in Cisco UCS.
Message Token
Select the alarm message to be issued if the specified threshold value is breached. These messages are kept in the message pool. The messages can be modified in the Message Pool Manager.
Important! Monitoring events may cause a larger than expected increase in alarm messages and possibly decrease in system performance.
Using Templates
Templates let you define reusable sets of monitors to be measured on multiple Equipment, Pools, and UCS Service Profiles. They provide an easy way to accomplish consistent monitoring of your UCS Manager environment.

Manually Selecting Monitors to be Measured
26 cisco_ucs Guide
You can create your own templates and define a set of monitors belonging to each. You can then apply these templates to anything in the Resources or Auto Configurations hierarchies in the navigation pane by dragging the template and dropping it on the appropriate item. This assigns the template monitors to the drop point and everything below it.
If you apply a template to the Auto Configuration, its monitors are applied to all Cisco UCS monitored entities as they appear in the system. If you need a finer level of control, you can apply a template to anything in the Resources hierarchy; in this case the monitors are applied to the drop-point and everything subordinate to it. Any templates applied within the Resources hierarchy are static monitors. The static monitors override any auto monitors for that specific resource entity.
Note: You can do both, placing general-purpose templates in Auto Configuration, and applying special-purpose templates that override the Auto Configuration templates on specific nodes, for specific purposes.
See the Using Automatic Configurations section for details on Auto Configuration.
To Create a New Template
There are two ways to create a template:
■ Click the toolbar button for New Template ( ).
■ Right click the Templates node in the navigation pane, and choose New Template from the menu.
In the resulting Template Properties dialog, specify a Name and a Description for the new template.
Note that you can also edit an existing template: Select one of the templates defined under the Templates node in the navigation pane, right-click it, and select Edit from the menu.
To Add Monitors to a Template
There are two ways to add a monitor to a template:
■ Drag it from the content pane and drop it on the template in the navigation pane.
■ Right-click on a monitor in the content pane and select Add to Template.
You can edit the properties for monitors in the template as described in the section To Edit Monitor Properties.

Manually Selecting Monitors to be Measured
Chapter 4: Adding Monitors 27
To Apply a Template
Drag the template to the Auto Configuration node or the Resource (Equipment, Pools, or UCS Service Profiles) where you want it applied, and drop it there.
Note: You can drop the template on an object containing multiple subordinate objects. This applies the template to the entity and all its subordinate entities. A static monitor is created for this entity.
Using Automatic Configurations
Automatic configuration is an optional but powerful way to automatically add monitors to be measured. This is the preferred method for configuring your resources. When new Cisco UCS monitored entities are detected, "Auto Monitors" are created for devices that are not currently monitored using a static monitor.
The Auto Configuration feature consists of two sub-nodes located under the Resource node in the navigation pane:
Auto Configurations node
You can add contents from one or more templates or individual checkpoints to this node, using drag and drop. You must click the Apply button and restart the probe to activate the changes. The probe then searches through the UCS Manager environment for applicable entities. Auto Monitors representing the monitor(s) under the Auto Configuration node are created (and listed under the Auto Monitor node, see below) for applicable entities where the metric does not already have a static monitor configured against it.
IMPORTANT: If you are experiencing performance problems, we recommend increasing the polling cycle and/or the memory configuration for the probe. Increase memory when the probe is running out of memory. Increase polling cycle when the collection takes longer than the configured interval. .
Auto Monitors node
This node lists Auto Monitors, created based on the contents added to the Auto Configuration node. The Auto Monitors are only created for content without a pre-existing static monitor.
Adding a Template to the Auto Configurations Node
You can add a template's content to the Auto Configurations as follows:
1. Click the Templates node in the navigation pane to list all available templates in the content pane.
2. Add a template to the Auto Configurations node by dragging the template from the list and dropping it on the Auto Configurations node in the navigation pane.

Manually Selecting Monitors to be Measured
28 cisco_ucs Guide
3. Click the Auto Configurations node to verify that the template's content was successfully added.
See the Using Templates section to learn more about templates.
Note: You must click the Apply button and restart the probe to activate configuration changes.
Adding a Monitor to the Auto Configurations Node
You can add a single monitor (checkpoint) to the Auto Configurations node.
To list available monitors:
1. Select the Resource node in the navigation pane and navigate to the point of interest.
2. Select an object to list its monitors in the right pane.
3. Add the monitor to the Auto Configurations node by dragging the monitor to the Auto Configurations node and dropping it there.
4. Click the Auto Configurations node and verify that the monitor was successfully added.
Note: You must click the Apply button and restart the probe to activate configuration changes.
Exploring the Contents of the Auto Configurations Node
To verify that the monitors were successfully added, click the Auto Configurations node in the navigation pane.
■ To edit the properties for a monitor, right-click in the list and choose Edit from the menu. See the section To Edit Monitor Properties for detailed information.
■ To delete a monitor from the list, right-click in the list and choose Delete from the menu.
Note: You must click the Apply button and restart the probe to activate configuration changes.

Equipment
Chapter 4: Adding Monitors 29
Checking the Auto Monitors Node
Note: When monitors have been added to the Auto Configurations node, you must click the Apply button and restart the probe to activate the Auto Configuration feature.
When you restart the probe, it searches through the Resource's entities. For each one that is currently not monitored, an Auto Monitor is created for each of the monitors listed under the Auto Configurations node.
All defined Auto Monitors are listed under the Auto Monitors node.
Equipment
Chassis Interface Card
The server blade interface cards provide the traffic metric states.

Equipment
30 cisco_ucs Guide
If configured, the NICs on the server blade interface cards also provide traffic metrics (number of packets sent, packets dropped, errors, etc.).
The information of the disks attached to the server blades is available at Equipment > Chassis/Rack Mounts > Servers. The metrics collect the disk status values.

Equipment
Chapter 4: Adding Monitors 31
Fabric Interconnects
The ports in the Fixed Module / Expansion Module(s) are grouped into the following categories, based on the "ifRole" property in the Cisco UCS Manager.
■ Expansion Module
■ Storage FC Ports
■ Unconfigured Ports
■ Uplink FC Ports
■ Fixed Module
■ Appliance Ports
■ FCoE Storage Ports
■ Server Ports
■ Unconfigured Ports
■ Uplink Ethernet Ports
■ Uplink FC Ports
The NIC nodes display an aggregated view of bandwidth (the bandwidth available for the Chassis, for Uplink to VSANs etc.).

Equipment
32 cisco_ucs Guide
Rack Mounts
Rack Mounts class is available in the Equipment node. The children nodes of this class are FEX and Servers. Rack Mounts have many similarities with the equipmentChassis class. The cisco_ucs probe should automatically detect if any RackUnits are managed by the UCS Manager.

Pools
Chapter 4: Adding Monitors 33
Pools
The Cisco UCS contains a number of ‘pools’ such as a MAC Pool (list of available MAC addresses), WWNN pool, WWPN pools, etc. It is useful for the system administrators to be aware of how many of these pools are empty, how many are assigned, and so on.
The cisco_ucs probe supports the following pools. They are displayed in the tree view of the probe GUI.
■ MAC Pools
■ Server Pools
■ UUID Pools
■ WWNN Pools
■ WWPN Pools

UCS Service Profiles
34 cisco_ucs Guide
UCS Service Profiles
The service profiles created in the Cisco UCSM are displayed in the tree view of cisco_ucs probe GUI under the UCS Service Profiles node.
Chapter 5: cisco_ucs Metrics
The following table describes the checkpoint metrics that can be configured using the cisco_ucs probe.
Monitor Name Units Description
Application.Cisco_UCS
Status Indicates if the UCS Manager responds to ping.
Authentication Indicate if the cisco_ucs probe has the proper credentials (username/password) to communicate with the UCS Manager.
Fault UCS faults translated into Nimsoft Alarms.
Application.Cisco_UCS.Chassis
Administrative State Type: equipmentChassisAdminState
The potential values can be:
■ acknowledged = 1
■ re-acknowledge = 2
■ decommission = 3
■ remove = 4

UCS Service Profiles
Chapter 5: cisco_ucs Metrics 35
Monitor Name Units Description
Config State Type: equipmentChassisConfigState
The potential values can be:
■ uninitialized = 0
■ unacknowledged = 1
■ unsupported-connectivity = 2
■ ok = 3
■ removing = 4
Input Power Watt (W)

UCS Service Profiles
36 cisco_ucs Guide
Monitor Name Units Description
Operability Type: equipmentOperability
The potential values can be:
■ unknown = 0
■ operable = 1
■ inoperable = 2
■ degraded = 3
■ powered-off = 4
■ power-problem = 5
■ removed = 6
■ voltage-problem = 7
■ thermal-problem = 8
■ performance-problem = 9
■ accessibility-problem = 10
■ identity-unestablishable = 11
■ bios-post-timeout = 12
■ disabled = 13
■ fabric-conn-problem = 51
■ fabric-unsupported-conn = 52
■ config = 81
■ equipment-problem = 82
■ decomissioning = 83
■ chassis-limit-exceeded = 84
■ not-supported = 100
■ discovery = 101
■ discovery-failed = 102
■ identify = 103
■ post-failure = 104
■ upgrade-problem = 105
■ peer-comm-problem = 106
■ auto-upgrade = 107
Output Power Watt (W)

UCS Service Profiles
Chapter 5: cisco_ucs Metrics 37
Monitor Name Units Description
Overall Status Type: equipmentOperability
The potential values can be:
■ unknown = 0
■ operable = 1
■ inoperable = 2
■ degraded = 3
■ powered-off = 4
■ power-problem = 5
■ removed = 6
■ voltage-problem = 7
■ thermal-problem = 8
■ performance-problem = 9
■ accessibility-problem = 10
■ identity-unestablishable = 11
■ bios-post-timeout = 12
■ disabled = 13
■ fabric-conn-problem = 51
■ fabric-unsupported-conn = 52
■ config = 81
■ equipment-problem = 82
■ decomissioning = 83
■ chassis-limit-exceeded = 84
■ not-supported = 100
■ discovery = 101
■ discovery-failed = 102
■ identify = 103
■ post-failure = 104
■ upgrade-problem = 105
■ peer-comm-problem = 106
■ auto-upgrade = 107

UCS Service Profiles
38 cisco_ucs Guide
Monitor Name Units Description
Power Type: equipmentChassisPowerOperState
The potential values can be:
■ unknown = 0
■ ok = 1
■ failed = 2
■ input-failed = 3
■ input-degraded = 4
■ output-failed = 5
■ output-degraded = 6
■ redundancy-failed = 7
■ redundancy-degraded = 8
Presence Type: equipmentPresence
Indicates whether the component exists in the system, regardless of its operational state.
The potential values can be:
■ unknown = 0
■ empty = 1
■ equipped = 10
■ missing = 11
■ mismatch = 12
■ equipped-not-primary = 13
■ equipped-identity-unestablishable = 20
■ mismatch-identity-unestablishable = 21
■ inaccessible = 30
■ unauthorized = 40
■ not-supported = 100

UCS Service Profiles
Chapter 5: cisco_ucs Metrics 39
Monitor Name Units Description
Thermal Type: equipmentSensorThresholdStatus
The potential values can be:
■ unknown = 0
■ ok = 1
■ upper-non-recoverable = 2
■ upper-critical = 3
■ upper-non-critical = 4
■ lower-non-critical = 5
■ lower-critical = 6
■ lower-non-recoverable = 7
■ not-supported = 100
Application.Cisco_UCS.Chassis.FanModule

UCS Service Profiles
40 cisco_ucs Guide
Monitor Name Units Description
Operability Type: equipmentOperability
The potential values can be:
■ unknown = 0
■ operable = 1
■ inoperable = 2
■ degraded = 3
■ powered-off = 4
■ power-problem = 5
■ removed = 6
■ voltage-problem = 7
■ thermal-problem = 8
■ performance-problem = 9
■ accessibility-problem = 10
■ identity-unestablishable = 11
■ bios-post-timeout = 12
■ disabled = 13
■ fabric-conn-problem = 51
■ fabric-unsupported-conn = 52
■ config = 81
■ equipment-problem = 82
■ decomissioning = 83
■ chassis-limit-exceeded = 84
■ not-supported = 100
■ discovery = 101
■ discovery-failed = 102
■ identify = 103
■ post-failure = 104
■ upgrade-problem = 105
■ peer-comm-problem = 106
■ auto-upgrade = 107

UCS Service Profiles
Chapter 5: cisco_ucs Metrics 41
Monitor Name Units Description
Overall Status Type: equipmentOperability
The potential values can be:
■ unknown = 0
■ operable = 1
■ inoperable = 2
■ degraded = 3
■ powered-off = 4
■ power-problem = 5
■ removed = 6
■ voltage-problem = 7
■ thermal-problem = 8
■ performance-problem = 9
■ accessibility-problem = 10
■ identity-unestablishable = 11
■ bios-post-timeout = 12
■ disabled = 13
■ fabric-conn-problem = 51
■ fabric-unsupported-conn = 52
■ config = 81
■ equipment-problem = 82
■ decomissioning = 83
■ chassis-limit-exceeded = 84
■ not-supported = 100
■ discovery = 101
■ discovery-failed = 102
■ identify = 103
■ post-failure = 104
■ upgrade-problem = 105
■ peer-comm-problem = 106
■ auto-upgrade = 107

UCS Service Profiles
42 cisco_ucs Guide
Monitor Name Units Description
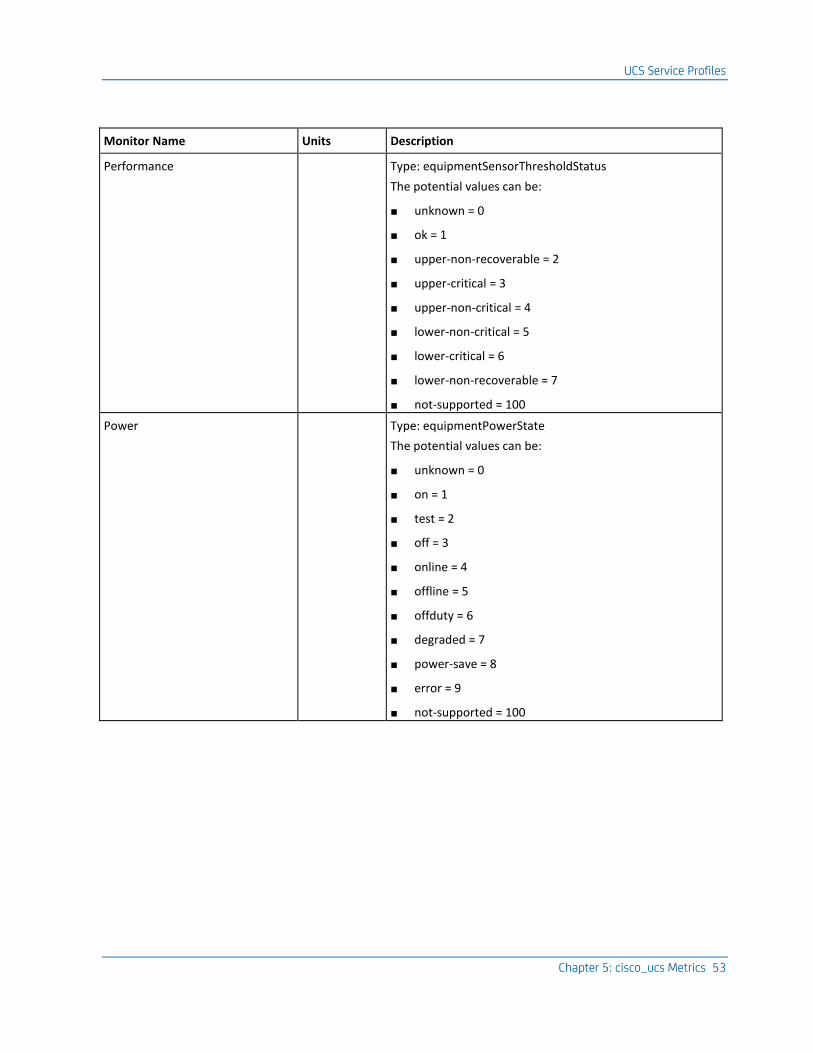
Performance Type: equipmentSensorThresholdStatus
The potential values can be:
■ unknown = 0
■ ok = 1
■ upper-non-recoverable = 2
■ upper-critical = 3
■ upper-non-critical = 4
■ lower-non-critical = 5
■ lower-critical = 6
■ lower-non-recoverable = 7
■ not-supported = 100
Power Type: equipmentPowerState
The potential values can be:
■ unknown = 0
■ on = 1
■ test = 2
■ off = 3
■ online = 4
■ offline = 5
■ offduty = 6
■ degraded = 7
■ power-save = 8
■ error = 9
■ not-supported = 100

UCS Service Profiles
Chapter 5: cisco_ucs Metrics 43
Monitor Name Units Description
Presence Type: equipmentPresence
Indicates whether the component exists in the system, regardless of its operational state.
The potential values can be:
■ unknown = 0
■ empty = 1
■ equipped = 10
■ missing = 11
■ mismatch = 12
■ equipped-not-primary = 13
■ equipped-identity-unestablishable = 20
■ mismatch-identity-unestablishable = 21
■ inaccessible = 30
■ unauthorized = 40
■ not-supported = 100
Thermal Type: equipmentSensorThresholdStatus
The potential values can be:
■ unknown = 0
■ ok = 1
■ upper-non-recoverable = 2
■ upper-critical = 3
■ upper-non-critical = 4
■ lower-non-critical = 5
■ lower-critical = 6
■ lower-non-recoverable = 7
■ not-supported = 100

UCS Service Profiles
44 cisco_ucs Guide
Monitor Name Units Description
Voltage Type: equipmentSensorThresholdStatus
The potential values can be:
■ unknown = 0
■ ok = 1
■ upper-non-recoverable = 2
■ upper-critical = 3
■ upper-non-critical = 4
■ lower-non-critical = 5
■ lower-critical = 6
■ lower-non-recoverable = 7
■ not-supported = 100
Application.Cisco_UCS.Chassis.FanModule.Fan
Speed RPM The fan speed in revolutions per minute

UCS Service Profiles
Chapter 5: cisco_ucs Metrics 45
Monitor Name Units Description
Operability Type: equipmentOperability
The potential values can be:
■ unknown = 0
■ operable = 1
■ inoperable = 2
■ degraded = 3
■ powered-off = 4
■ power-problem = 5
■ removed = 6
■ voltage-problem = 7
■ thermal-problem = 8
■ performance-problem = 9
■ accessibility-problem = 10
■ identity-unestablishable = 11
■ bios-post-timeout = 12
■ disabled = 13
■ fabric-conn-problem = 51
■ fabric-unsupported-conn = 52
■ config = 81
■ equipment-problem = 82
■ decomissioning = 83
■ chassis-limit-exceeded = 84
■ not-supported = 100
■ discovery = 101
■ discovery-failed = 102
■ identify = 103
■ post-failure = 104
■ upgrade-problem = 105
■ peer-comm-problem = 106
■ auto-upgrade = 107

UCS Service Profiles
46 cisco_ucs Guide
Monitor Name Units Description
Overall Status Type: equipmentOperability
The potential values can be:
■ unknown = 0
■ operable = 1
■ inoperable = 2
■ degraded = 3
■ powered-off = 4
■ power-problem = 5
■ removed = 6
■ voltage-problem = 7
■ thermal-problem = 8
■ performance-problem = 9
■ accessibility-problem = 10
■ identity-unestablishable = 11
■ bios-post-timeout = 12
■ disabled = 13
■ fabric-conn-problem = 51
■ fabric-unsupported-conn = 52
■ config = 81
■ equipment-problem = 82
■ decomissioning = 83
■ chassis-limit-exceeded = 84
■ not-supported = 100
■ discovery = 101
■ discovery-failed = 102
■ identify = 103
■ post-failure = 104
■ upgrade-problem = 105
■ peer-comm-problem = 106
■ auto-upgrade = 107

UCS Service Profiles
Chapter 5: cisco_ucs Metrics 47
Monitor Name Units Description
Performance Type: equipmentSensorThresholdStatus
The potential values can be:
■ unknown = 0
■ ok = 1
■ upper-non-recoverable = 2
■ upper-critical = 3
■ upper-non-critical = 4
■ lower-non-critical = 5
■ lower-critical = 6
■ lower-non-recoverable = 7
■ not-supported = 100
Power Type: equipmentPowerState
The potential values can be:
■ unknown = 0
■ on = 1
■ test = 2
■ off = 3
■ online = 4
■ offline = 5
■ offduty = 6
■ degraded = 7
■ power-save = 8
■ error = 9
■ not-supported = 100

UCS Service Profiles
48 cisco_ucs Guide
Monitor Name Units Description
Presence Type: equipmentPresence
Indicates whether the component exists in the system, regardless of its operational state.
The potential values can be:
■ unknown = 0
■ empty = 1
■ equipped = 10
■ missing = 11
■ mismatch = 12
■ equipped-not-primary = 13
■ equipped-identity-unestablishable = 20
■ mismatch-identity-unestablishable = 21
■ inaccessible = 30
■ unauthorized = 40
■ not-supported = 100
Thermal Type: equipmentSensorThresholdStatus
The potential values can be:
■ unknown = 0
■ ok = 1
■ upper-non-recoverable = 2
■ upper-critical = 3
■ upper-non-critical = 4
■ lower-non-critical = 5
■ lower-critical = 6
■ lower-non-recoverable = 7
■ not-supported = 100

UCS Service Profiles
Chapter 5: cisco_ucs Metrics 49
Monitor Name Units Description
Voltage Type: equipmentSensorThresholdStatus
The potential values can be:
■ unknown = 0
■ ok = 1
■ upper-non-recoverable = 2
■ upper-critical = 3
■ upper-non-critical = 4
■ lower-non-critical = 5
■ lower-critical = 6
■ lower-non-recoverable = 7
■ not-supported = 100
Application.Cisco_UCS.Chassis.PSU
Input 210v Volt (V) Type: counter
The actual 210V input voltage
Internal Temperature Celsius (C) Type: counter
The internal PSU temperature

UCS Service Profiles
50 cisco_ucs Guide
Monitor Name Units Description
Operability Type: equipmentOperability
The potential values can be:
■ unknown = 0
■ operable = 1
■ inoperable = 2
■ degraded = 3
■ powered-off = 4
■ power-problem = 5
■ removed = 6
■ voltage-problem = 7
■ thermal-problem = 8
■ performance-problem = 9
■ accessibility-problem = 10
■ identity-unestablishable = 11
■ bios-post-timeout = 12
■ disabled = 13
■ fabric-conn-problem = 51
■ fabric-unsupported-conn = 52
■ config = 81
■ equipment-problem = 82
■ decomissioning = 83
■ chassis-limit-exceeded = 84
■ not-supported = 100
■ discovery = 101
■ discovery-failed = 102
■ identify = 103
■ post-failure = 104
■ upgrade-problem = 105
■ peer-comm-problem = 106
■ auto-upgrade = 107
Output 12v Volt (V) Type: counter
The actual 12V output voltage

UCS Service Profiles
Chapter 5: cisco_ucs Metrics 51
Monitor Name Units Description
Output 3v3 Volt (V) Type: counter
The actual 3.3V output voltage
Output Current Amperes (A) Type: counter
The output current
Output Power Watts (W) Type: counter
The output power

UCS Service Profiles
52 cisco_ucs Guide
Monitor Name Units Description
Overall Status Type: equipmentOperability
The potential values can be:
■ unknown = 0
■ operable = 1
■ inoperable = 2
■ degraded = 3
■ powered-off = 4
■ power-problem = 5
■ removed = 6
■ voltage-problem = 7
■ thermal-problem = 8
■ performance-problem = 9
■ accessibility-problem = 10
■ identity-unestablishable = 11
■ bios-post-timeout = 12
■ disabled = 13
■ fabric-conn-problem = 51
■ fabric-unsupported-conn = 52
■ config = 81
■ equipment-problem = 82
■ decomissioning = 83
■ chassis-limit-exceeded = 84
■ not-supported = 100
■ discovery = 101
■ discovery-failed = 102
■ identify = 103
■ post-failure = 104
■ upgrade-problem = 105
■ peer-comm-problem = 106
■ auto-upgrade = 107
UCS Service Profiles
Chapter 5: cisco_ucs Metrics 53
Monitor Name Units Description
Performance Type: equipmentSensorThresholdStatus
The potential values can be:
■ unknown = 0
■ ok = 1
■ upper-non-recoverable = 2
■ upper-critical = 3
■ upper-non-critical = 4
■ lower-non-critical = 5
■ lower-critical = 6
■ lower-non-recoverable = 7
■ not-supported = 100
Power Type: equipmentPowerState
The potential values can be:
■ unknown = 0
■ on = 1
■ test = 2
■ off = 3
■ online = 4
■ offline = 5
■ offduty = 6
■ degraded = 7
■ power-save = 8
■ error = 9
■ not-supported = 100

UCS Service Profiles
54 cisco_ucs Guide
Monitor Name Units Description
Presence Type: equipmentPresence
Indicates whether the component exists in the system, regardless of its operational state.
The potential values can be:
■ unknown = 0
■ empty = 1
■ equipped = 10
■ missing = 11
■ mismatch = 12
■ equipped-not-primary = 13
■ equipped-identity-unestablishable = 20
■ mismatch-identity-unestablishable = 21
■ inaccessible = 30
■ unauthorized = 40
■ not-supported = 100
Thermal Type: equipmentSensorThresholdStatus
The potential values can be:
■ unknown = 0
■ ok = 1
■ upper-non-recoverable = 2
■ upper-critical = 3
■ upper-non-critical = 4
■ lower-non-critical = 5
■ lower-critical = 6
■ lower-non-recoverable = 7
■ not-supported = 100

UCS Service Profiles
Chapter 5: cisco_ucs Metrics 55
Monitor Name Units Description
Voltage Type: equipmentSensorThresholdStatus
The potential values can be:
■ unknown = 0
■ ok = 1
■ upper-non-recoverable = 2
■ upper-critical = 3
■ upper-non-critical = 4
■ lower-non-critical = 5
■ lower-critical = 6
■ lower-non-recoverable = 7
■ not-supported = 100
Application.Cisco_UCS.Chassis.IOModule
Ambient Temperature Celsius (C) Type: counter
The surrounding temperature
ASIC Temperature Celsius (C) The temperature on the ASIC (Application Specific Integrated Circuit).

UCS Service Profiles
56 cisco_ucs Guide
Monitor Name Units Description
Overall Status Type: equipmentOperability
The potential values can be:
■ unknown = 0
■ operable = 1
■ inoperable = 2
■ degraded = 3
■ powered-off = 4
■ power-problem = 5
■ removed = 6
■ voltage-problem = 7
■ thermal-problem = 8
■ performance-problem = 9
■ accessibility-problem = 10
■ identity-unestablishable = 11
■ bios-post-timeout = 12
■ disabled = 13
■ fabric-conn-problem = 51
■ fabric-unsupported-conn = 52
■ config = 81
■ equipment-problem = 82
■ decomissioning = 83
■ chassis-limit-exceeded = 84
■ not-supported = 100
■ discovery = 101
■ discovery-failed = 102
■ identify = 103
■ post-failure = 104
■ upgrade-problem = 105
■ peer-comm-problem = 106
■ auto-upgrade = 107

UCS Service Profiles
Chapter 5: cisco_ucs Metrics 57
Monitor Name Units Description
Operability Type: equipmentOperability
The potential values can be:
■ unknown = 0
■ operable = 1
■ inoperable = 2
■ degraded = 3
■ powered-off = 4
■ power-problem = 5
■ removed = 6
■ voltage-problem = 7
■ thermal-problem = 8
■ performance-problem = 9
■ accessibility-problem = 10
■ identity-unestablishable = 11
■ bios-post-timeout = 12
■ disabled = 13
■ fabric-conn-problem = 51
■ fabric-unsupported-conn = 52
■ config = 81
■ equipment-problem = 82
■ decomissioning = 83
■ chassis-limit-exceeded = 84
■ not-supported = 100
■ discovery = 101
■ discovery-failed = 102
■ identify = 103
■ post-failure = 104
■ upgrade-problem = 105
■ peer-comm-problem = 106
■ auto-upgrade = 107
Application.Cisco_UCS.Chassis.IOModule.BackplanePort

UCS Service Profiles
58 cisco_ucs Guide
Monitor Name Units Description
Administrative State Type: fabricAdminState
The potential values can be:
■ enabled = 0
■ disabled = 1
Overall Status Type: networkPortOperState
The potential values can be:
■ indeterminate = 0
■ up = 1
■ admin-down = 2
■ link-down = 3
■ failed = 4
■ no-license = 5
■ link-up = 6
■ hardware-failure = 7
■ software-failure = 8
■ error-disabled = 9
■ sfp-not-present = 10
Application.Cisco_UCS.Chassis.IOModule.FabricPort
Acknowledged Type: equipmentChassisConfigState
The potential values can be:
■ un-initialized = 0
■ un-acknowledged = 1
■ unsupported-connectivity = 2
■ ok = 3
■ removing = 4
Administrative State Type: fabricAdminState
The potential values can be:
■ enabled = 0
■ disabled = 1

UCS Service Profiles
Chapter 5: cisco_ucs Metrics 59
Monitor Name Units Description
Discovery Type: etherSatelliteConnectionDisc
The potential values can be:
■ absent = 0
■ present = 1
■ mis-connect = 2
Overall Status Type: networkPortOperState
The potential values can be:
■ indeterminate = 0
■ up = 1
■ admin-down = 2
■ link-down = 3
■ failed = 4
■ no-license = 5
■ link-up = 6
■ hardware-failure = 7
■ software-failure = 8
■ error-disabled = 9
■ sfp-not-present = 10
Application.Cisco_UCS.Chassis.BladeServer
Administrative State Type: computeAdminState
The potential values can be:
■ in-service = 1
■ out-of-service = 2
Availability Type: computeAvailability
The potential values can be:
■ unavailable = 0
■ available = 1
Consumed Power Watt (W) Type: counter
Front Temperature Celsius (C) Type: counter
Input Current Ampere (A) Type: counter
Input Voltage Voltage (V) Type: counter

UCS Service Profiles
60 cisco_ucs Guide
Monitor Name Units Description
Operability Type: equipmentOperability
The potential values can be:
■ unknown = 0
■ operable = 1
■ inoperable = 2
■ degraded = 3
■ powered-off = 4
■ power-problem = 5
■ removed = 6
■ voltage-problem = 7
■ thermal-problem = 8
■ performance-problem = 9
■ accessibility-problem = 10
■ identity-unestablishable = 11
■ bios-post-timeout = 12
■ disabled = 13
■ fabric-conn-problem = 51
■ fabric-unsupported-conn = 52
■ config = 81
■ equipment-problem = 82
■ decomissioning = 83
■ chassis-limit-exceeded = 84
■ not-supported = 100
■ discovery = 101
■ discovery-failed = 102
■ identify = 103
■ post-failure = 104
■ upgrade-problem = 105
■ peer-comm-problem = 106
■ auto-upgrade = 107

UCS Service Profiles
Chapter 5: cisco_ucs Metrics 61
Monitor Name Units Description
Overall Status Type: IsOperState
The potential values can be:
■ indeterminate = 0
■ unassociated = 1
■ ok = 10
■ discovery = 11
■ config = 12
■ unconfig = 13
■ power-off = 14
■ restart = 15
■ maintenance = 20
■ test = 21
■ compute-mismatch = 29
■ compute-failed = 30
■ degraded = 31
■ discovery-failed = 32
■ config-failure = 33
■ unconfig-failed = 34
■ test-failed = 35
■ maintenance-failed = 36
■ removed = 40
■ disabled = 41
■ inaccessible = 50
■ thermal-problem = 60
■ power-problem = 61
■ voltage-problem = 62
■ inoperable = 63
■ decommissioning = 101
■ bios-restore = 201
■ cmos-reset = 202
■ diagnostics = 203
■ diagnostics-failed = 204

UCS Service Profiles
62 cisco_ucs Guide
Monitor Name Units Description
Power Type: equipmentPowerState
The potential values can be:
■ unknown = 0
■ on = 1
■ test = 2
■ off = 3
■ online = 4
■ offline = 5
■ offduty = 6
■ degraded = 7
■ power-save = 8
■ error = 9
■ not-supported = 100
Presence Type: equipmentPresence
Indicates whether the component exists in the system, regardless of its operational state.
The potential values can be:
■ unknown = 0
■ empty = 1
■ equipped = 10
■ missing = 11
■ mismatch = 12
■ equipped-not-primary = 13
■ equipped-identity-unestablishable = 20
■ mismatch-identity-unestablishable = 21
■ inaccessible = 30
■ unauthorized = 40
■ not-supported = 100
Rear Temperature Celsius (C) Type: counter
Application.Cisco_UCS.Chassis.BladeServer.AdaptorUnit
NA NA NA
Application.Cisco_UCS.Chassis.BladeServer.AdaptorUnit.DCE

UCS Service Profiles
Chapter 5: cisco_ucs Metrics 63
Monitor Name Units Description
Administrative State Type: scalarEnum8
The potential values can be:
■ enabled = 0
■ reset-connectivity-active = 44
■ reset-connectivity-passive = 45
■ reset-connectivity = 46
Overall Status Type: networkPortOperState
The potential values can be:
■ indeterminate = 0
■ up = 1
■ admin-down = 2
■ link-down = 3
■ failed = 4
■ no-license = 5
■ link-up = 6
■ hardware-failure = 7
■ software-failure = 8
■ error-disabled = 9
■ sfp-not-present = 10
Application.Cisco_UCS.Chassis.BladeServer.AdaptorUnit.HBA
Administrative State Type: scalarEnum8
The potential values can be:
■ enabled = 0
■ reset-connectivity-active = 44
■ reset-connectivity-passive = 45
■ reset-connectivity = 46

UCS Service Profiles
64 cisco_ucs Guide
Monitor Name Units Description
Operability Type: equipmentOperability
The potential values can be:
■ unknown = 0
■ operable = 1
■ inoperable = 2
■ degraded = 3
■ powered-off = 4
■ power-problem = 5
■ removed = 6
■ voltage-problem = 7
■ thermal-problem = 8
■ performance-problem = 9
■ accessibility-problem = 10
■ identity-unestablishable = 11
■ bios-post-timeout = 12
■ disabled = 13
■ fabric-conn-problem = 51
■ fabric-unsupported-conn = 52
■ config = 81
■ equipment-problem = 82
■ decomissioning = 83
■ chassis-limit-exceeded = 84
■ not-supported = 100
■ discovery = 101
■ discovery-failed = 102
■ identify = 103
■ post-failure = 104
■ upgrade-problem = 105
■ peer-comm-problem = 106
■ auto-upgrade = 107

UCS Service Profiles
Chapter 5: cisco_ucs Metrics 65
Monitor Name Units Description
Overall Status Type: equipmentOperability
The potential values can be:
■ unknown = 0
■ operable = 1
■ inoperable = 2
■ degraded = 3
■ powered-off = 4
■ power-problem = 5
■ removed = 6
■ voltage-problem = 7
■ thermal-problem = 8
■ performance-problem = 9
■ accessibility-problem = 10
■ identity-unestablishable = 11
■ bios-post-timeout = 12
■ disabled = 13
■ fabric-conn-problem = 51
■ fabric-unsupported-conn = 52
■ config = 81
■ equipment-problem = 82
■ decomissioning = 83
■ chassis-limit-exceeded = 84
■ not-supported = 100
■ discovery = 101
■ discovery-failed = 102
■ identify = 103
■ post-failure = 104
■ upgrade-problem = 105
■ peer-comm-problem = 106
■ auto-upgrade = 107

UCS Service Profiles
66 cisco_ucs Guide
Monitor Name Units Description
Performance Type: equipmentSensorThresholdStatus
The potential values can be:
■ unknown = 0
■ ok = 1
■ upper-non-recoverable = 2
■ upper-critical = 3
■ upper-non-critical = 4
■ lower-non-critical = 5
■ lower-critical = 6
■ lower-non-recoverable = 7
■ not-supported = 100
Power Type: equipmentPowerState
The potential values can be:
■ unknown = 0
■ on = 1
■ test = 2
■ off = 3
■ online = 4
■ offline = 5
■ offduty = 6
■ degraded = 7
■ power-save = 8
■ error = 9
■ not-supported = 100

UCS Service Profiles
Chapter 5: cisco_ucs Metrics 67
Monitor Name Units Description
Presence Type: equipmentPresence
Indicates whether the component exists in the system, regardless of its operational state.
The potential values can be:
■ unknown = 0
■ empty = 1
■ equipped = 10
■ missing = 11
■ mismatch = 12
■ equipped-not-primary = 13
■ equipped-identity-unestablishable = 20
■ mismatch-identity-unestablishable = 21
■ inaccessible = 30
■ unauthorized = 40
■ not-supported = 100
Thermal Type: equipmentSensorThresholdStatus
The potential values can be:
■ unknown = 0
■ ok = 1
■ upper-non-recoverable = 2
■ upper-critical = 3
■ upper-non-critical = 4
■ lower-non-critical = 5
■ lower-critical = 6
■ lower-non-recoverable = 7
■ not-supported = 100
UCS Service Profiles
68 cisco_ucs Guide
Monitor Name Units Description
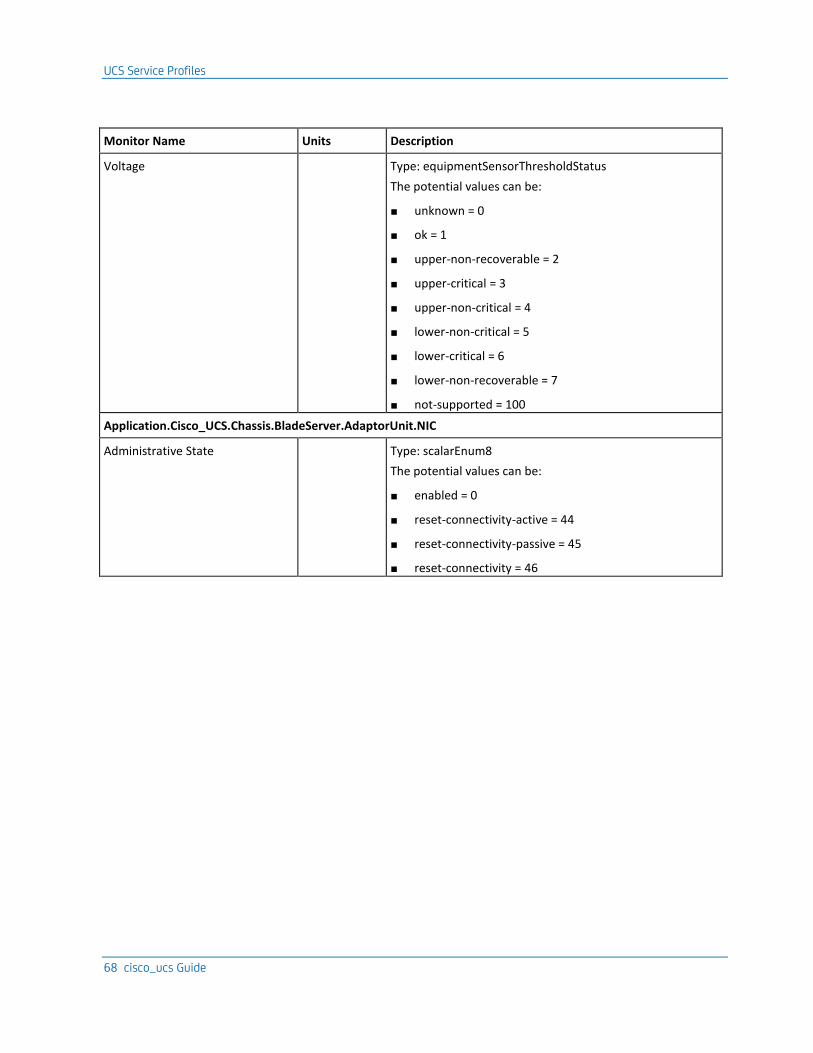
Voltage Type: equipmentSensorThresholdStatus
The potential values can be:
■ unknown = 0
■ ok = 1
■ upper-non-recoverable = 2
■ upper-critical = 3
■ upper-non-critical = 4
■ lower-non-critical = 5
■ lower-critical = 6
■ lower-non-recoverable = 7
■ not-supported = 100
Application.Cisco_UCS.Chassis.BladeServer.AdaptorUnit.NIC
Administrative State Type: scalarEnum8
The potential values can be:
■ enabled = 0
■ reset-connectivity-active = 44
■ reset-connectivity-passive = 45
■ reset-connectivity = 46

UCS Service Profiles
Chapter 5: cisco_ucs Metrics 69
Monitor Name Units Description
Operability Type: equipmentOperability
The potential values can be:
■ unknown = 0
■ operable = 1
■ inoperable = 2
■ degraded = 3
■ powered-off = 4
■ power-problem = 5
■ removed = 6
■ voltage-problem = 7
■ thermal-problem = 8
■ performance-problem = 9
■ accessibility-problem = 10
■ identity-unestablishable = 11
■ bios-post-timeout = 12
■ disabled = 13
■ fabric-conn-problem = 51
■ fabric-unsupported-conn = 52
■ config = 81
■ equipment-problem = 82
■ decomissioning = 83
■ chassis-limit-exceeded = 84
■ not-supported = 100
■ discovery = 101
■ discovery-failed = 102
■ identify = 103
■ post-failure = 104
■ upgrade-problem = 105
■ peer-comm-problem = 106
■ auto-upgrade = 107

UCS Service Profiles
70 cisco_ucs Guide
Monitor Name Units Description
Overall Status Type: equipmentOperability
The potential values can be:
■ unknown = 0
■ operable = 1
■ inoperable = 2
■ degraded = 3
■ powered-off = 4
■ power-problem = 5
■ removed = 6
■ voltage-problem = 7
■ thermal-problem = 8
■ performance-problem = 9
■ accessibility-problem = 10
■ identity-unestablishable = 11
■ bios-post-timeout = 12
■ disabled = 13
■ fabric-conn-problem = 51
■ fabric-unsupported-conn = 52
■ config = 81
■ equipment-problem = 82
■ decomissioning = 83
■ chassis-limit-exceeded = 84
■ not-supported = 100
■ discovery = 101
■ discovery-failed = 102
■ identify = 103
■ post-failure = 104
■ upgrade-problem = 105
■ peer-comm-problem = 106
■ auto-upgrade = 107

UCS Service Profiles
Chapter 5: cisco_ucs Metrics 71
Monitor Name Units Description
Performance Type: equipmentSensorThresholdStatus
The potential values can be:
■ unknown = 0
■ ok = 1
■ upper-non-recoverable = 2
■ upper-critical = 3
■ upper-non-critical = 4
■ lower-non-critical = 5
■ lower-critical = 6
■ lower-non-recoverable = 7
■ not-supported = 100
Power Type: equipmentPowerState
The potential values can be:
■ unknown = 0
■ on = 1
■ test = 2
■ off = 3
■ online = 4
■ offline = 5
■ offduty = 6
■ degraded = 7
■ power-save = 8
■ error = 9
■ not-supported = 100

UCS Service Profiles
72 cisco_ucs Guide
Monitor Name Units Description
Presence Type: equipmentPresence
Indicates whether the component exists in the system, regardless of its operational state.
The potential values can be:
■ unknown = 0
■ empty = 1
■ equipped = 10
■ missing = 11
■ mismatch = 12
■ equipped-not-primary = 13
■ equipped-identity-unestablishable = 20
■ mismatch-identity-unestablishable = 21
■ inaccessible = 30
■ unauthorized = 40
■ not-supported = 100
Thermal Type: equipmentSensorThresholdStatus
The potential values can be:
■ unknown = 0
■ ok = 1
■ upper-non-recoverable = 2
■ upper-critical = 3
■ upper-non-critical = 4
■ lower-non-critical = 5
■ lower-critical = 6
■ lower-non-recoverable = 7
■ not-supported = 100

UCS Service Profiles
Chapter 5: cisco_ucs Metrics 73
Monitor Name Units Description
Voltage Type: equipmentSensorThresholdStatus
The potential values can be:
■ unknown = 0
■ ok = 1
■ upper-non-recoverable = 2
■ upper-critical = 3
■ upper-non-critical = 4
■ lower-non-critical = 5
■ lower-critical = 6
■ lower-non-recoverable = 7
■ not-supported = 100
Application.Cisco_UCS.Chassis.BladeServer.MemArray
Current Capacity MB Type: counter
Max Capacity MB
Application.Cisco_UCS.Chassis.BladeServer.MemArray.Memory
Temperature Celsius (C) Type: counter
Application.Cisco_UCS.Chassis.BladeServer.Processor
CPU Temperature Celsius (C) Type: counter
Input Current Ampere (A)
Application.Cisco_UCS.FabricInterconnect
Available Memory MB
Cached Memory MB
fanCtrlrlnlet1 Celsius (C)
fanCtrlrlnlet2 Celsius (C)
fanCtrlrlnlet3 Celsius (C)
fanCtrlrlnlet4 Celsius (C)
Load Percent (%) CPU Utilization: Load (%) of last 1 minute
mainBoardOutlet1 Celsius (C)
mainBoardOutlet2 Celsius (C)

UCS Service Profiles
74 cisco_ucs Guide
Monitor Name Units Description
Operability Type: equipmentOperability
The potential values can be:
■ unknown = 0
■ operable = 1
■ inoperable = 2
■ degraded = 3
■ powered-off = 4
■ power-problem = 5
■ removed = 6
■ voltage-problem = 7
■ thermal-problem = 8
■ performance-problem = 9
■ accessibility-problem = 10
■ identity-unestablishable = 11
■ bios-post-timeout = 12
■ disabled = 13
■ fabric-conn-problem = 51
■ fabric-unsupported-conn = 52
■ config = 81
■ equipment-problem = 82
■ decomissioning = 83
■ chassis-limit-exceeded = 84
■ not-supported = 100
■ discovery = 101
■ discovery-failed = 102
■ identify = 103
■ post-failure = 104
■ upgrade-problem = 105
■ peer-comm-problem = 106
■ auto-upgrade = 107
psuCtrlrlnlet1 Celsius (C)
psuCtrlrlnlet2 Celsius (C)

UCS Service Profiles
Chapter 5: cisco_ucs Metrics 75
Monitor Name Units Description
Application.Cisco_UCS.FabricInterconnect.Fan
Operability Type: equipmentOperability
The potential values can be:
■ unknown = 0
■ operable = 1
■ inoperable = 2
■ degraded = 3
■ powered-off = 4
■ power-problem = 5
■ removed = 6
■ voltage-problem = 7
■ thermal-problem = 8
■ performance-problem = 9
■ accessibility-problem = 10
■ identity-unestablishable = 11
■ bios-post-timeout = 12
■ disabled = 13
■ fabric-conn-problem = 51
■ fabric-unsupported-conn = 52
■ config = 81
■ equipment-problem = 82
■ decomissioning = 83
■ chassis-limit-exceeded = 84
■ not-supported = 100
■ discovery = 101
■ discovery-failed = 102
■ identify = 103
■ post-failure = 104
■ upgrade-problem = 105
■ peer-comm-problem = 106
■ auto-upgrade = 107

UCS Service Profiles
76 cisco_ucs Guide
Monitor Name Units Description
Overall Status Type: equipmentOperability
The potential values can be:
■ unknown = 0
■ operable = 1
■ inoperable = 2
■ degraded = 3
■ powered-off = 4
■ power-problem = 5
■ removed = 6
■ voltage-problem = 7
■ thermal-problem = 8
■ performance-problem = 9
■ accessibility-problem = 10
■ identity-unestablishable = 11
■ bios-post-timeout = 12
■ disabled = 13
■ fabric-conn-problem = 51
■ fabric-unsupported-conn = 52
■ config = 81
■ equipment-problem = 82
■ decomissioning = 83
■ chassis-limit-exceeded = 84
■ not-supported = 100
■ discovery = 101
■ discovery-failed = 102
■ identify = 103
■ post-failure = 104
■ upgrade-problem = 105
■ peer-comm-problem = 106
■ auto-upgrade = 107

UCS Service Profiles
Chapter 5: cisco_ucs Metrics 77
Monitor Name Units Description
Performance Type: equipmentSensorThresholdStatus
The potential values can be:
■ unknown = 0
■ ok = 1
■ upper-non-recoverable = 2
■ upper-critical = 3
■ upper-non-critical = 4
■ lower-non-critical = 5
■ lower-critical = 6
■ lower-non-recoverable = 7
■ not-supported = 100
Power Type: equipmentPowerState
The potential values can be:
■ unknown = 0
■ on = 1
■ test = 2
■ off = 3
■ online = 4
■ offline = 5
■ offduty = 6
■ degraded = 7
■ power-save = 8
■ error = 9
■ not-supported = 100

UCS Service Profiles
78 cisco_ucs Guide
Monitor Name Units Description
Presence Type: equipmentPresence
Indicates whether the component exists in the system, regardless of its operational state.
The potential values can be:
■ unknown = 0
■ empty = 1
■ equipped = 10
■ missing = 11
■ mismatch = 12
■ equipped-not-primary = 13
■ equipped-identity-unestablishable = 20
■ mismatch-identity-unestablishable = 21
■ inaccessible = 30
■ unauthorized = 40
■ not-supported = 100
Thermal Type: equipmentSensorThresholdStatus
The potential values can be:
■ unknown = 0
■ ok = 1
■ upper-non-recoverable = 2
■ upper-critical = 3
■ upper-non-critical = 4
■ lower-non-critical = 5
■ lower-critical = 6
■ lower-non-recoverable = 7
■ not-supported = 100

UCS Service Profiles
Chapter 5: cisco_ucs Metrics 79
Monitor Name Units Description
Voltage Type: equipmentSensorThresholdStatus
The potential values can be:
■ unknown = 0
■ ok = 1
■ upper-non-recoverable = 2
■ upper-critical = 3
■ upper-non-critical = 4
■ lower-non-critical = 5
■ lower-critical = 6
■ lower-non-recoverable = 7
■ not-supported = 100
Application.Cisco_UCS.FabricInterconnect.PSU

UCS Service Profiles
80 cisco_ucs Guide
Monitor Name Units Description
Operability Type: equipmentOperability
The potential values can be:
■ unknown = 0
■ operable = 1
■ inoperable = 2
■ degraded = 3
■ powered-off = 4
■ power-problem = 5
■ removed = 6
■ voltage-problem = 7
■ thermal-problem = 8
■ performance-problem = 9
■ accessibility-problem = 10
■ identity-unestablishable = 11
■ bios-post-timeout = 12
■ disabled = 13
■ fabric-conn-problem = 51
■ fabric-unsupported-conn = 52
■ config = 81
■ equipment-problem = 82
■ decomissioning = 83
■ chassis-limit-exceeded = 84
■ not-supported = 100
■ discovery = 101
■ discovery-failed = 102
■ identify = 103
■ post-failure = 104
■ upgrade-problem = 105
■ peer-comm-problem = 106
■ auto-upgrade = 107

UCS Service Profiles
Chapter 5: cisco_ucs Metrics 81
Monitor Name Units Description
Overall Status Type: equipmentOperability
The potential values can be:
■ unknown = 0
■ operable = 1
■ inoperable = 2
■ degraded = 3
■ powered-off = 4
■ power-problem = 5
■ removed = 6
■ voltage-problem = 7
■ thermal-problem = 8
■ performance-problem = 9
■ accessibility-problem = 10
■ identity-unestablishable = 11
■ bios-post-timeout = 12
■ disabled = 13
■ fabric-conn-problem = 51
■ fabric-unsupported-conn = 52
■ config = 81
■ equipment-problem = 82
■ decomissioning = 83
■ chassis-limit-exceeded = 84
■ not-supported = 100
■ discovery = 101
■ discovery-failed = 102
■ identify = 103
■ post-failure = 104
■ upgrade-problem = 105
■ peer-comm-problem = 106
■ auto-upgrade = 107

UCS Service Profiles
82 cisco_ucs Guide
Monitor Name Units Description
Performance Type: equipmentSensorThresholdStatus
The potential values can be:
■ unknown = 0
■ ok = 1
■ upper-non-recoverable = 2
■ upper-critical = 3
■ upper-non-critical = 4
■ lower-non-critical = 5
■ lower-critical = 6
■ lower-non-recoverable = 7
■ not-supported = 100
Power Type: equipmentPowerState
The potential values can be:
■ unknown = 0
■ on = 1
■ test = 2
■ off = 3
■ online = 4
■ offline = 5
■ offduty = 6
■ degraded = 7
■ power-save = 8
■ error = 9
■ not-supported = 100

UCS Service Profiles
Chapter 5: cisco_ucs Metrics 83
Monitor Name Units Description
Presence Type: equipmentPresence
Indicates whether the component exists in the system, regardless of its operational state.
The potential values can be:
■ unknown = 0
■ empty = 1
■ equipped = 10
■ missing = 11
■ mismatch = 12
■ equipped-not-primary = 13
■ equipped-identity-unestablishable = 20
■ mismatch-identity-unestablishable = 21
■ inaccessible = 30
■ unauthorized = 40
■ not-supported = 100
Thermal Type: equipmentSensorThresholdStatus
The potential values can be:
■ unknown = 0
■ ok = 1
■ upper-non-recoverable = 2
■ upper-critical = 3
■ upper-non-critical = 4
■ lower-non-critical = 5
■ lower-critical = 6
■ lower-non-recoverable = 7
■ not-supported = 100

UCS Service Profiles
84 cisco_ucs Guide
Monitor Name Units Description
Voltage Type: equipmentSensorThresholdStatus
The potential values can be:
■ unknown = 0
■ ok = 1
■ upper-non-recoverable = 2
■ upper-critical = 3
■ upper-non-critical = 4
■ lower-non-critical = 5
■ lower-critical = 6
■ lower-non-recoverable = 7
■ not-supported = 100
Input Current Ampere (A)
Input Power Watt (W)
Input Voltage Volt (V)
Application.Cisco_UCS.FabricInterconnect.IOModule

UCS Service Profiles
Chapter 5: cisco_ucs Metrics 85
Monitor Name Units Description
Operability Type: equipmentOperability
The potential values can be:
■ unknown = 0
■ operable = 1
■ inoperable = 2
■ degraded = 3
■ powered-off = 4
■ power-problem = 5
■ removed = 6
■ voltage-problem = 7
■ thermal-problem = 8
■ performance-problem = 9
■ accessibility-problem = 10
■ identity-unestablishable = 11
■ bios-post-timeout = 12
■ disabled = 13
■ fabric-conn-problem = 51
■ fabric-unsupported-conn = 52
■ config = 81
■ equipment-problem = 82
■ decomissioning = 83
■ chassis-limit-exceeded = 84
■ not-supported = 100
■ discovery = 101
■ discovery-failed = 102
■ identify = 103
■ post-failure = 104
■ upgrade-problem = 105
■ peer-comm-problem = 106
■ auto-upgrade = 107

UCS Service Profiles
86 cisco_ucs Guide
Monitor Name Units Description
State Type: equipmentPowerState
The potential values can be:
■ unknown = 0
■ on = 1
■ test = 2
■ off = 3
■ online = 4
■ offline = 5
■ offduty = 6
■ degraded = 7
■ power-save = 8
■ error = 9
■ not-supported = 100
Application.Cisco_UCS.FabricInterconnect.IOModule.EtherPort
Administrative State Type: fabricAdminState
The potential values can be:
■ enabled = 0
■ disabled = 1
Align errors
BroadcastPackets(Rx) packets
BroadcastPackets(Tx) packets
Carrier Sense errors
Deferred Tx errors
Excess Collision errors
Fcs errors
Giants errors
Int Mac Rx errors
Int Mac Tx errors
Jumbo Packets (Rx) packets
Jumbo Packets (Tx) packets
Late Collision errors

UCS Service Profiles
Chapter 5: cisco_ucs Metrics 87
Monitor Name Units Description
Multi Collision errors
Multicast Packets(Rx) packets
Multicast Packets(Tx) packets
Out Discard errors
Overall Status Type: networkPortOperState
The potential values can be:
■ indeterminate = 0
■ up = 1
■ admin-down = 2
■ link-down = 3
■ failed = 4
■ no-license = 5
■ link-up = 6
■ hardware-failure = 7
■ software-failure = 8
■ error-disabled = 9
■ sfp-not-present = 10
Rcv errors
Recv Pause pause
Resets resets
Single Collision errors
SQETest errors
Symbol errors
Total Bytes(Rx) Bytes
Total Bytes(Tx) Bytes
Total Packets (Rx) packets
Total Packets (Tx) packets
Under Size errors
Unicast Packets (Rx) packets
Unicast Packets (Tx) packets
Xmit errors

UCS Service Profiles
88 cisco_ucs Guide
Monitor Name Units Description
Xmit Pause pause
Application.Cisco_UCS.FabricInterconnect.IOModule.FCPort
Administrative State Type: fabricAdminState
The potential values can be:
■ enabled = 0
■ disabled = 1
Bytes Rx Bytes
Bytes Tx Bytes
CRC Rx errors
Discard Rx errors
Discard Tx errors
Link Failures errors
Overall Status Type: networkPortOperState
The potential values can be:
■ indeterminate = 0
■ up = 1
■ admin-down = 2
■ link-down = 3
■ failed = 4
■ no-license = 5
■ link-up = 6
■ hardware-failure = 7
■ software-failure = 8
■ error-disabled = 9
■ sfp-not-present = 10
Packets Rx Packets
Packets Tx Packets
Rx errors
Signal Losses errors
Sync Losses errors
Too Long Rx errors

UCS Service Profiles
Chapter 5: cisco_ucs Metrics 89
Monitor Name Units Description
Too Short Rx errors
Tx errors
Application.Cisco_UCS.FabricInterconnect.LocalStorage
bootflash(size) MB
bootflash(used) MB
opt(size) MB
opt(used) MB
workspace(size) MB
workspace(used) MB
Note: In the case of Application.Cisco_UCS.FabricInterconnect.LocalStorage, the names of the storage-partitions may vary as per the hardware; however bootflash, opt and workspace are the ones most commonly found.
Application.Cisco_UCS.Hypervisor
status Type: vmStatus
The potential values can be:
■ unknown = 0
■ online = 1
■ offline = 2
Application.Cisco_UCS.VirtualMachines
status Type: vmStatus
The potential values can be:
■ unknown = 0
■ online = 1
■ offline = 2