Nikonorova Supporting Information - Journal of Biological … Supporting Information ... Strain PBS...
9
1 Supporting Information Time-resolved analysis of amino acid stress identifies eIF2 phosphorylation as necessary to inhibit mTORC1 activity in liver Inna A. Nikonorova 1 , Emily T. Mirek 1 , Christina C. Signore 1 , Michael P. Goudie 1 , Ronald C. Wek 2 , and Tracy G. Anthony 1 * From the 1 Department of Nutritional Sciences, Rutgers University, New Brunswick, NJ 08901; 2 Department of Biochemistry & Molecular Biology, Indiana University School of Medicine, Indianapolis, IN 46202 Running title: eIF2 phosphorylation is necessary to inhibit mTORC1 in liver * To whom correspondence should be addressed: Tracy G. Anthony: 59 Dudley Rd., New Brunswick, NJ 08901; [email protected]; Tel. (848) 932-6331; Fax. (732) 932-6837. Contents Extended Material and Methods ............................................................................................................................. 2 Table S1. Numbers of animals utilized in each strain and treatment group. ........................................................... 3 Table S2. Amino acid content of the sera of WT and Gcn2 -/- mice after a single injection of asparaginase .......... 4 Figure S1. Serum glutamine and glutamate ............................................................................................................ 5 Figure S2. Graphical display of levels of serum amino acids that were significantly increased over 24 h time period following a single injection of asparaginase ................................................................................................ 6 Figure S3. S6K1 phosphorylation in the liver of wild type and Gcn2 -/- mice before and after asparaginase exposure. ................................................................................................................................................................. 7 Figure S4. Translational efficiency of Atf4 mRNA (10-fraction resolution). ......................................................... 8 Figure S5. Translational efficiency of mRNAs unchanged following asparaginase exposure in wild type and Gcn2 -/- strains .......................................................................................................................................................... 9
Transcript of Nikonorova Supporting Information - Journal of Biological … Supporting Information ... Strain PBS...

1
Supporting Information
Time-resolved analysis of amino acid stress identifies eIF2 phosphorylation as necessary to inhibit mTORC1 activity in liver
Inna A. Nikonorova1, Emily T. Mirek1, Christina C. Signore1, Michael P. Goudie1,
Ronald C. Wek2, and Tracy G. Anthony1*
From the 1Department of Nutritional Sciences, Rutgers University, New Brunswick, NJ 08901; 2Department of Biochemistry & Molecular Biology, Indiana University School of Medicine, Indianapolis, IN 46202
Running title: eIF2 phosphorylation is necessary to inhibit mTORC1 in liver
* To whom correspondence should be addressed: Tracy G. Anthony: 59 Dudley Rd., New Brunswick, NJ 08901; [email protected]; Tel. (848) 932-6331; Fax. (732) 932-6837.
Contents
Extended Material and Methods ............................................................................................................................. 2
Table S1. Numbers of animals utilized in each strain and treatment group. ........................................................... 3
Table S2. Amino acid content of the sera of WT and Gcn2-/- mice after a single injection of asparaginase .......... 4
Figure S1. Serum glutamine and glutamate ............................................................................................................ 5
Figure S2. Graphical display of levels of serum amino acids that were significantly increased over 24 h time period following a single injection of asparaginase ................................................................................................ 6
Figure S3. S6K1 phosphorylation in the liver of wild type and Gcn2-/- mice before and after asparaginase exposure. ................................................................................................................................................................. 7
Figure S4. Translational efficiency of Atf4 mRNA (10-fraction resolution). ......................................................... 8
Figure S5. Translational efficiency of mRNAs unchanged following asparaginase exposure in wild type and Gcn2-/- strains .......................................................................................................................................................... 9

2
Extended Material and Methods
Animals
Timeline of tissue collection for asparaginase injections:
Treatment duration Injection time Tissue collection
15-30 min 4:30-4:45 PM 5:00 PM
1 h 3:00 PM 4:00 PM
3 h 2:30 PM 5:30 PM
6 h 12:00 PM 6:00 PM
12 h 11:00 PM 11:00 AM
18 h 6:00 PM -1 day 12:00 PM
24 h 1:00 PM -1 day 1:00 PM
Quantitative RT-PCR analysis
All primer sequences were validated and optimized using standard methods as described
(https://www.sigmaaldrich.com/technical-documents/articles/biology/assay-optimization-and-validation.html).
Atf4 5’-GCCGGTTTAAGTTGTGTGCT-3' 5’-CTGGATTCGAGGAATGTGCT-3'
Fgf21 5’-AGCATACCCCATCCCTGACT-3’ 5’-AGGAGACTTTCTGGACTGCG-3’
Asns 5’-CTGTTACAATGGTGAAATCTACAACCACAAG-3’ 5’-GATGAATGCAAACACCCCGTCCAGCATACAGAT-3’
Trib3 5’ –CAGCAACTGTGAGAGGACGA–3’ 5’-TGGAATGGGTATCTGCCAGC-3’
Redd1 5’-GACCGCTGCGCGAGCCTGGAGAGCTCGGACTG-3’ 5’-GCTGCATCAGGTTGGCACACAGGTGCTCATCCTC-3’
Sesn2 5’-TAGCCTGCAGCCTCACCTAT-3’ 5’-TATCTGATGCCAAAGACGCA-3’
4ebp1 5’-CTTCAGCACCACCCCGGGAGGAACCAGGATTATC-3’ 5’-GAGGCTCATCGCTGGTAGGGCTAGTGACCCCAG-3’
Gapdh 5’-GACAACTCACTCAAGATTGTCAGCAATGC-3’ 5’-GTGGCAGTGATGGCATGGACTGTGGTC-3’
Trf2 5’-TGCAGAGCCAGATCACTATG-3’ 5’-AACCCATTGCTGACCATGGA-3’
Slc3a2 5’-AAGGAAGCTCTGAGTTCTTG-3’ 5’-CAAAAGCCTGTCCTCACTTA-3’
Hspa5 5’-TGAAGGTGAACGACCCCTAA-3’ 5’-TTCAGCTGTCACTCGGAGAA-3’
Pabpc1 5’-CGCTGGACTGCTCAGGGTGC-3’ 5’-GGGGGCGCAGATGCCAACAT-3’
Rps18 5’-GTTCCAGCACATTTTGCGAGT-3’ 5’- GGTGAGGTCGATGTCTGCTT-3’
Rps20 5’-TGACTCACCGCTGTTCGCTCC-3’ 5’-GAGTCGCTTGTGGATCCTCATCTGG-3’)

3
Table S1. Numbers of animals utilized in each strain and treatment group.
Treatment Strains of mice
WT Gcn2-/- ls-Perk-/- ls-Perk-/- Gcn2-/-
Control 16 14 4
ASNase 15 min 7 7 3
ASNase 30 min 5 8 3
ASNase 1 h 6 6 3
ASNase 3 h 6 6
ASNase 6 h 5 5
ASNase 12 h 5 5
ASNase 18 h 5 5
ASNase 24 h 3 3
Tun 30 min 2 2 2
Tun 60 min 2 2 2
Tun 90 min 2 2 2
Tun+ASNase 30 min 4 4 3
Tun+ASNase 60 min 4 4 6 (3 @ 60 min + 3 @ 90 min)
ISRIB 90 min 8 8
ISRIB 120 min 4 4
ISRIB+ASNase 60 min 4 4
ISRIB+ASNase 90 min 5 5

4
Table S2. Amino acid content of the sera of WT and Gcn2-/- mice after a single injection of asparaginase.
Amino acid
Strain PBS 15 min 30 min 1 h 3 h 6 h 12 h 18 h
Glu WT 87 ± 18 524 ± 173 * 760 ± 183 * 832 ± 72 * 952 ± 239 * 714 ± 505 * 245 ± 69 * 303 ± 190 *
Gcn2-/- 77 ± 22 412 ± 219 * 743 ± 224 * 754 ± 251 * 806 ± 356 * 866 ± 343 * 368 ± 191 * 294 ± 135 *
Gln WT 1031 ± 200 409 ± 336 * 175 ± 81 * 35 ± 12 * 44 ± 22 * 382 ± 346 * 893 ± 190 1147 ± 206
Gcn2-/- 904 ± 175 526 ± 331 * 170 ± 133 * 137 ± 169 * 241 ± 487 * 348 ± 270 * 842 ± 354 1223 ± 168
Asp WT 33 ± 16 38 ± 9 41 ± 17 32 ± 6 40 ± 11 32 ± 3 41 ± 13 52 ± 34
Gcn2-/- 33 ± 14 42 ± 15 42 ± 9 32 ± 6 39 ± 9 37 ± 6 50 ± 17 40 ± 11
Asn WT 141 ± 88 105 ± 35 114 ± 35 60 ± 19 * 136 ± 17 118 ± 59 129 ± 47 157 ± 41
Gcn2-/- 149 ± 68 117 ± 24 145 ± 46 132 ± 29 144 ± 38 118 ± 59 102 ± 51 159 ± 64
Ser WT 116 ± 39 125 ± 57 138 ± 43 126 ± 55 156 ± 29 * 215 ± 66 * 203 ± 44 * 346 ± 83 *
Gcn2-/- 122 ± 46 108 ± 42 112 ± 36 110 ± 47 162 ± 44 231 ± 35 * 193 ± 62 279 ± 89 *
His WT 88 ± 15 80 ± 23 81 ± 19 77 ± 27 68 ± 26 79 ± 27 84 ± 34 106 ± 54
Gcn2-/- 76 ± 18 74 ± 13 74 ± 16 65 ± 17 69 ± 30 84 ± 28 83 ± 50 75 ± 30
Gly WT 322 ± 68 401 ± 184 410 ± 127 400 ± 168 488 ± 212 618 ± 161 * 579 ± 270 756 ± 154 *
Gcn2-/- 299 ± 73 289 ± 49 300 ± 56 281 ± 70 331 ± 76 428 ± 49 * 620 ± 250 * 748 ± 225 *
Thr WT 174 ± 27 167 ± 49 170 ± 39 165 ± 45 187 ± 58 251 ± 103 332 ± 69 * 432 ± 90 *
Gcn2-/- 153 ± 40 128 ± 28 149 ± 30 136 ± 41 148 ± 52 220 ± 23 * 205 ± 37 * 297 ± 125
Arg WT 121 ± 25 117 ± 34 114 ± 36 120 ± 42 136 ± 20 123 ± 59 192 ± 49 * 235 ± 18 *
Gcn2-/- 111 ± 40 103 ± 38 104 ± 32 109 ± 41 129 ± 35 186 ± 22 * 153 ± 49 168 ± 29 *
Ala WT 286 ± 70 333 ± 108 * 371 ± 69 * 339 ± 139 437 ± 157 533 ± 179 * 513 ± 49 * 878 ± 313 *
Gcn2-/- 326 ± 104 300 ± 63 337 ± 82 306 ± 116 415 ± 108 573 ± 113 * 567 ± 131 * 653 ± 184 *
Val WT 239 ± 60 198 ± 47 198 ± 21 204 ± 53 260 ± 88 282 ± 49 336 ± 65 * 384 ± 66 *
Gcn2-/- 206 ± 58 183 ± 48 197 ± 48 178 ± 34 202 ± 60 254 ± 27 * 250 ± 47 296 ± 42 *
Met WT 69 ± 15 63 ± 15 63 ± 15 59 ± 16 65 ± 20 76 ± 7 98 ± 26 124 ± 18 *
Gcn2-/- 67 ± 20 55 ± 25 49 ± 23 56 ± 20 60 ± 33 77 ± 16 91 ± 26 89 ± 29
Trp WT 143 ± 15 139 ± 23 135 ± 19 126 ± 27 139 ± 26 154 ± 27 162 ± 34 185 ± 54
Gcn2-/- 110 ± 39 120 ± 46 130 ± 48 110 ± 52 128 ± 46 157 ± 54 166 ± 36 133 ± 39
Iso WT 81 ± 25 65 ± 23 66 ± 16 65 ± 15 78 ± 31 82 ± 14 111 ± 32 125 ± 35 *
Gcn2-/- 69 ± 24 63 ± 21 67 ± 19 52 ± 12 67 ± 23 91 ± 11 * 85 ± 22 102 ± 15 *
Leu WT 144 ± 43 119 ± 32 119 ± 21 120 ± 28 158 ± 53 157 ± 31 185 ± 43 223 ± 39 *
Gcn2-/- 114 ± 34 114 ± 36 117 ± 30 103 ± 21 132 ± 40 176 ± 16 * 160 ± 23 * 182 ± 28 *
Lys WT 223 ± 48 237 ± 77 243 ± 93 228 ± 60 243 ± 42 302 ± 49 * 343 ± 102 415 ± 62 *
Gcn2-/- 221 ± 80 217 ± 90 212 ± 72 219 ± 83 230 ± 87 320 ± 37 * 344 ± 73 * 350 ± 98 * Values are means ± SD expressed as mMol/L; n=3-11 mice/group, * indicates p-values < 0.05 by T-test comparing a given treatment group against the vehicle injected control assuming two-tailed distribution with unequal variance.

Figure S1. A
changes in g
mice.
Glutamine is
black. Time
the control
Upper panel
lower panel
following inj
individual wi
Gcn2-/- mice.
values for W
Each treatme
Asparaginase
glutamine and
s shown in bl
point 0 repre
group of an
shows values
is the close
ection. Close
ild type (WT
Solid and da
WT and Gc
ent group had
e injection ca
d glutamic a
ue, and gluta
esents circula
nimals treate
s over 24 h p
-up of the f
ed circles indi
) mice, and o
ashed lines ind
n2-/- groups,
at least 3 mic
uses acute
cid in sera of
amic acid is i
ating values o
ed with PBS
period, and th
first six hour
icate values o
open circles o
dicate averag
respectively
ce.
f
n
of
S.
he
rs
of
of
ge
y.
5

Figure S2. G
following a s
Each panel s
exposure. Clo/- samples. So
group had at
zero are less
Graphical dis
single injectio
shows linear t
osed circles in
olid and dash
least 3 anima
than 0.01.
splay of level
on of aspara
trend line of
ndicate value
hed lines show
als. For all th
s of serum am
ginase.
changes in s
es of individu
w average val
he amino acid
mino acids th
elect amino a
al wild type (
ues for WT a
ds shown p-va
hat were sign
acid concentr
(WT) sample
and Gcn2-/- gr
alues of the s
nificantly inc
ration over 24
s, and open c
roups, respect
slopes of the t
creased over
4 h after aspa
circles represe
tively. Each t
trend lines be
6
24 h
araginase
ent Gcn2-
treatment
eing non-

Figure S3. Sexposure. Panel A showbiological rep
6K1 phosph
ws multiple biplicates of tot
orylation in
iological repltal S6K1.
the liver of w
icates of phos
wild type and
spho-S6K1 at
d Gcn2-/- mice
t threonine 38
e before and
89 whereas pa
d after aspara
anel B shows
7
aginase
multiple

Figure S4. TTo confirm t
profiling usin
mice. Fractio
profile (this
polysomal fr
indicate the
mRNA amou
Translationalthe shift of A
ng more biolo
ons 19-24 fro
figure). Tra
ractions (10 f
position of e
unt.
l efficiency ofAtf4 mRNA in
ogical sample
om a 30-frac
anslational ef
fractions per
each fraction
f Atf4 mRNAnto polysome
es, and collec
ction profile (
fficiency was
profile were
along the pr
A (10-fractiones in response
cting 10 fract
(Figure 2C)
s assessed v
collected). B
rofile. Symbo
n resolution)e to asparagi
tions per prof
corresponded
ia RT-qPCR
Black dotted
ols represent
). inase, we rep
file in wild ty
d to fractions
R analysis of
outlines of th
individual re
eated liver p
ype (WT) an
s 7-8 in a 10
f RNA isolat
he polysomal
elative values
8
olysomal
nd Gcn2-/-
0-fraction
ted from
l profiles
s of Atf4
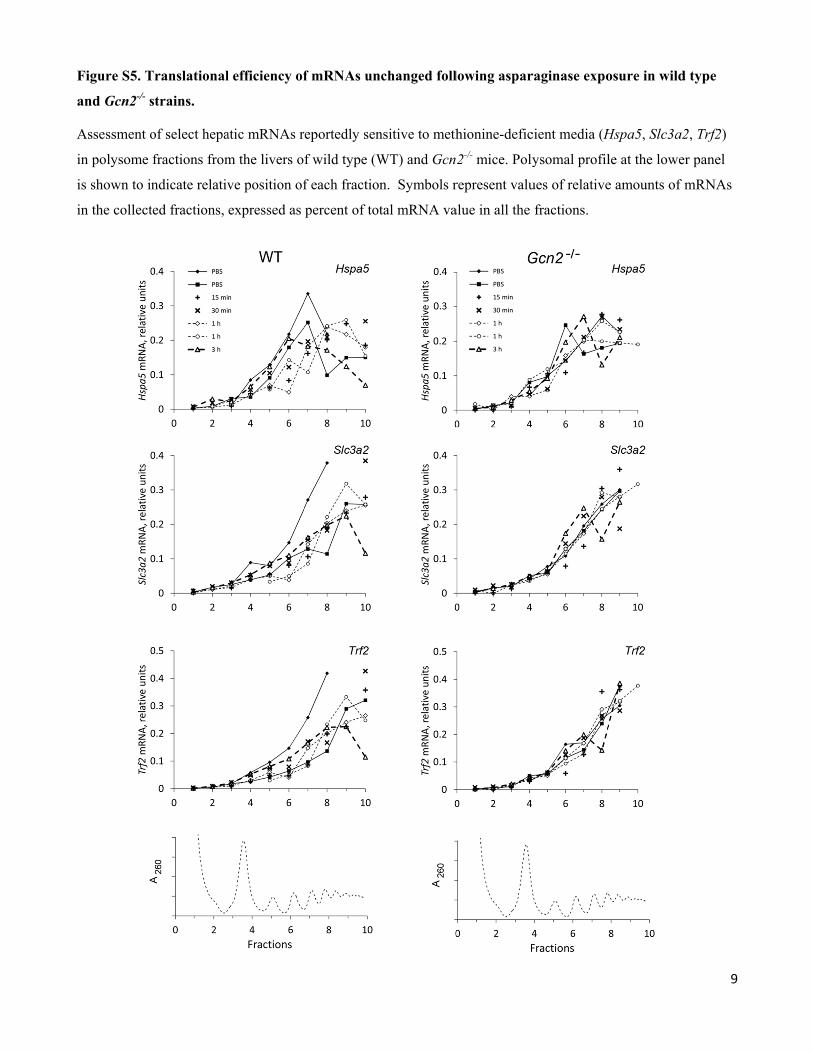
Figure S5. T
and Gcn2-/- s
Assessment o
in polysome
is shown to in
in the collect
Translational
strains.
of select hepa
fractions from
ndicate relativ
ted fractions,
l efficiency of
atic mRNAs r
m the livers o
ve position of
expressed as
f mRNAs un
reportedly sen
f wild type (W
f each fraction
percent of tot
changed foll
nsitive to meth
WT) and Gcn
n. Symbols r
tal mRNA va
lowing aspar
hionine-defic
2-/- mice. Poly
represent valu
alue in all the
raginase expo
cient media (H
ysomal profil
ues of relative
fractions.
osure in wild
Hspa5, Slc3a2
le at the lowe
e amounts of m
9
d type
2, Trf2)
r panel
mRNAs