Niger: Food Security and Safety Nets
140
Africa Social Safety Net and Social Protection Assessment Series February 2009 Niger Food Security and Safety Nets Jenny C. Aker, Carlo del Ninno, Paul A. Dorosh, Menno Mulder-Sibanda and Setareh Razmara DISCUSSION PAPER NO. 1418
-
Upload
the-world-bank-social-protection-labor -
Category
Documents
-
view
218 -
download
1
description
This study aims to assist the Government of Niger in developing a multi-sectoral approach to reducing the population’s vulnerability to food insecurity. The study reviews food security policies and programs in Niger, and provides an action plan for strengthening the existing system and developing an effective safety net strategy. The study finds that targeting of food aid has been either weak with significant leakages. Moreover, although the need to support poor and food insecure households is substantial, safety nets are small, receive limited funding, and are designed for emergency food crises. The study recommends to improve the efficiency and scope of safety net programs in Niger and to promote effective strategies to improve food availability and the emergency response systems.
Transcript of Niger: Food Security and Safety Nets

About this series...
Abstract
Africa Social Safety Net and Social Protection Assessment Series
F e b r u a r y 2 0 0 9
Social Protection & Labor Discussion Papers are published to communicate the results of The World Bank’s work to the development community with the least possible delay. The typescript manuscript of this paper therefore has not been prepared in accordance with the procedures appropriate to formally edited texts.
The findings, interpretations, and conclusions expressed herein are those of the author(s), and do not necessarily reflect the views of the International Bank for Reconstruction and Development / The World Bank and its affiliated organizations, or those of the Executive Directors of The World Bank or the governments they represent. The World Bank does not guarantee the accuracy of the data included in this work. The author(s) attest(s) that the paper represents original work. It fully references and describes all relevant prior work on the same subject.
For more information, please contact the Social Protection Advisory Service, The World Bank, 1818 H Street, N.W., Room G7-803, Washington, DC 20433 USA. Telephone: (202) 458-5267, Fax: (202) 614-0471, E-mail: [email protected] or visit us on-line at www.worldbank.org/sp.© 2013 International Bank for Reconstruction and Development / The World Bank
This study aims to assist the Government of Niger in developing a multi-sectoral approach to reducing the population’s vulnerability to food insecurity. The study reviews food security policies and programs in Niger, and provides an action plan for strengthening the existing system and developing an effective safety net strategy. The study finds that targeting of food aid has been either weak with significant leakages. Moreover, although the need to support poor and food insecure households is substantial, safety nets are small, receive limited funding, and are designed for emergency food crises. The study recommends to improve the efficiency and scope of safety net programs in Niger and to promote effective strategies to improve food availability and the emergency response systems.
Niger
Food Security and Safety Nets
Jenny C. Aker, Carlo del Ninno, Paul A. Dorosh, Menno Mulder-Sibanda and Setareh Razmara
D I S C U S S I O N P A P E R N O . 1 4 1 8

NIGER
Food Security and Safety Nets
Jenny C. Aker, Carlo del Ninno, Paul A. Dorosh, Menno Mulder-Sibanda and Setareh Razmara
February 2009
Africa Social Safety Net and Social Protection Assessment Series
Until recently, most countries in Africa implemented safety nets and social protection programs only on an ad hoc basis. In the wake of the global economic, food and fuel price crises starting in 2008, however, policymakers in Africa began to increasingly view safety nets as core instruments for reducing poverty, addressing inequality, and helping poor and vulnerable households to manage risk more effectively. During FY2009-2013, to support governments in their quest to understand better how to improve the efficiency and effectiveness of safety nets in their countries, the World Bank’s Africa Region undertook social safety net or social protection assessments in a number of countries in Sub-Saharan Africa. By 2014 assessments have been completed or are under preparation for over 25 countries in sub-Saharan Africa. These assessments analyze the status of social protection programs and safety nets, their strengths and weaknesses and identify areas for improvement, all with the aim of helping governments and donors to strengthen African safety net systems and social protection programs to protect and promote poor and vulnerable people. They were all carried-out with the explicit aim of informing governments’ social protection policies and programs. With the results of analytical work like these assessments and other types of support, safety nets and social protection programs are rapidly changing across Africa. For a cross-country regional review, please see "Reducing Poverty and Investing in People: The New Role of Safety Nets in Africa," which pulls together the findings and lessons learned from these assessments and other recent studies of safety net programs in Africa.

Abstract This study aims to assist the Government of Niger in developing a multi-sectoral approach to reducing the population’s vulnerability to food insecurity. The study reviews food security policies and programs in Niger, and provides an action plan for strengthening the existing system and developing an effective safety net strategy. The study finds that targeting of food aid has been either weak with significant leakages. Moreover, although the need to support poor and food insecure households is substantial, safety nets are small, receive limited funding, and are designed for emergency food crises. The study recommends to improve the efficiency and scope of safety net programs in Niger and to promote effective strategies to improve food availability and the emergency response systems. JEL Classification: I32, I38, J32, H53 Keywords: social protection, systems, safety nets, social assistance, welfare, administration, public policy, public sector reform, developing countries

i
CURRENCY EQUIVALENTS
(Exchange Rate as of October 2008 - average) Currency Unit F CFA
US$1.00 F CFA 520
Niger Government Fiscal Year
January 1 to December 31
ABBREVIATIONS AND ACRONYMS CCA Food Crisis Unit/Cellule de Crise Alimentaire CFA African Community Franc/Franc de la Communauté Financière Africaine CFW Cash-for-Work CMC National Consultation Committee/Commission Mixte de Concertation CIC Center for Information and Communication of the National Body for the
Prevention and Management of Food Crises (DNPGCA)/Centre d’information et de communication (CIC) du Dispositif national prévention et de gestion des crises alimentaires (DNPGCA)
CILSS Permanent Inter-state Committee for the Fight Against Drought in the Sahel/Comité Permanent Inter Etats de Lutte contre la Sécheresse dans le
Sahel CRS Catholic Relief Services CV Coefficient of Variation DHS Demographic and Health Survey DNPGCA National Body for the Prevention and Management of Food Crises/Dispositif National de Prévention et de Gestion des Crises Alimentaires DPP Directorate for Plant Protection DSBE Survey on Satisfaction of Basic Needs ECOWAS Economic Community of West African States ECVAM Survey on Business Conditions and Household Food Vulnerability/Enquête sur la Conjoncture et la Vulnérabilité Alimentaire des Ménages EDS/MICS Demographic and Health Survey/Multiple Indicator Cluster Survey EPP2 Second Participatory Survey on Poverty EWS Early Warning System

ii
FAO Food and Agriculture Organization FFW Food for Work GDP Gross Domestic Product GIS Geographic Information System GNI Gross National Income GoBF Government of Burkina Faso GoN Government of Niger HDI Human Development Index HKI Helen Keller International ICRISAT International Crops Research Institute for the Semi-Arid Tropics IPPTE Initiative Pays Pauvres Très Endettés INS National Statistical Office MSF Doctors Without Borders/Médecins Sans Frontières NGOs Non-governmental Organizations OPVN Office of Food Products/Office des Produits Vivriers du Niger PLHAs Persons living with HIV and AIDS PTF Partenaires Techniques et Financiers PRSP2 Second Poverty Reduction Strategy QUIBB Questionnaire on Basic Indicators and Welfare/Questionnaire sur les Indicateurs de Base et de Bien-être RDS Rural Development Strategy SAP Early Warning System Coordination Unit /Cellule de Coordination du Systeme d’Alerte Précoce SFSB Soy-Fortified Bulgar Wheat SIMA Agricultural Market Information System/Système d’Informations sur le Marché Agricole SIMB Livestock Market Information System/Système d’Informations sur le
Marché bétail SVFs Seed Vouchers and Fairs UEMOA Economic and Monetary Union of West Africa/Union Économique et Monétaire Ouest Africaine UNICEF United Nations Children’s Fund UNDP United Nations Development Program USAID United States Agency for International Development FEWS NET USAID’s Famine Early Warning System Network WAEMU West African Economic and Monetary Union WFP World Food Programme WHO World Health Organization

iii
ACKNOWLEDGEMENTS This report was prepared by a team consisting of Jenny C. Aker (Consultant), Paul Dorosh (FEU), Menno Mulder-Sibanda (AFTH2), Carlo Del Ninno (HDNSP, co-task team leader), and Setareh Razmara (AFTH2, co-task team leader). Valuable inputs were provided by Phillippe George Leite (HDNSP), Koffi Akakpo (VAM Officer WFP – Niger), and Khamada Baye (Local Consultant). The report draws from two background papers that provided substantial inputs: (i) Food Security, Social Safety Nets and Food Crises: Country Experience from Niger (Jenny C. Aker, Consultant); and (ii) Production Shocks, Regional Trade and Cereal Prices in Niger: A (Multi-Market) Simulation Analysis (Paul Dorosh). Valuable guidance and suggestions were provided by Ousman Diagana (Country Manager for Niger); Patrick Verissimo, El Hadj Adama Touré, and Amadou Alassane (AFTAR); Xiao Ye (AFRCE); Richard Seifman and Léandre Bassolé (AFTHV); and Amadou Ibrahim (AFTP4). Peer reviewers were Dominique van de Walle (PRMGE) and Harold Alderman (AFTHD). Kathryn Bach and Fanta Touré provided valuable editorial input. Administrative support was provided by Aissatou Chipkaou (AFTH2) and Mohamed Diaw (AFTH2). The preparation of this study was also financed by Trust Funds managed by HDNSP. The team acknowledges valuable support from the Nigerien counterpart in the Prime Minister’s Office (Primature), the Executive Secretariat of Rural Development (SE/RDS), the Ministry of Economy and Finance (MEF), the Office of Food Products OPVN), the Food Crisis Unit (CCA), the Coordination Unit of the Early Warning System (SAP), and the National Institute of Statistics (INS). Particularly the team would like to thank M. Malla Ari, Ex-Director of Cabinet of Prime Minister and Director of the Poverty Reduction Strategy II, M. Ousmane Mahaman, Ex-Director of the Cabinet of the Prime Minister, Mme Zeinabou Maikorema, Former Executive Secretary of the Rural Development Strategy, M. Azara Sully, Ex-Senior Advisor to the Prime Minister’s Cabinet, and M. Diamoitou Boukari, Rural Development Senior Advisor to the Prime Minister’s Cabinet for supporting this study from the earliest stages and facilitating its preparation. At a workshop held in Niger in December 2007, the team presented preliminary results of the assessment to government officials as well as development partners and researchers, and received valuable comments from participants. In October 2008, the draft report was discussed with the government and its technical and financial partners (TFPs). There was a consensus on the recommendations and strategic messages of the report, and in close collaboration with the government and the TFPs, the team finalized a concrete action plan for an effective food security and social protection strategy (with both short-term and medium-term measures). The team also received valuable advice and support from the TFPs (particularly the European Union, the German Organization for Technical Cooperation, the World Food Programme, UNICEF, the Food and Agricultural Organization, and the International Monetary Fund).

iv
Table of Contents
EXECUTIVE SUMMARY .............................................................................................. vii
CHAPTER 1: INTRODUCTION ........................................................................................ 1
BACKGROUND AND MOTIVATION ................................................................................... 1
STRUCTURE OF THE REPORT ............................................................................................ 3
CHAPTER 2: POVERTY AND FOOD INSECURITY ............................................................. 6
CHRONIC AND SEASONAL FOOD INSECURITY ................................................................. 7
RISK, VULNERABILITY, AND HOUSEHOLD FOOD SECURITY ........................................... 18
CHAPTER 3: FOOD AVAILABILITY AND ACCESS ........................................................... 32
FOOD AVAILABILITY: PRODUCTION, IMPORTS, AND FOOD AID ................................... 32
AGRO-FOOD MARKETS AND PRICES .............................................................................. 43
CHAPTER 4: GOVERNMENT INSTITUTIONS AND PROGRAMS AND RESPONSES TO THE 2005 FOOD CRISIS ..................................................................................................... 51
INSTITUTIONAL MECHANISMS FOR RESPONDING TO FOOD CRISES ............................ 52
CAUSES OF THE 2005 FOOD CRISIS ................................................................................ 58
RESPONSES DURING THE FOOD CRISIS .......................................................................... 68
GOVERNMENT SAFETY NET AND SOCIAL PROTECTION PROGRAMS ............................ 71
NIGER 2008: PREPARING FOR AND RESPONDING TO A POTENTIAL FOOD CRISIS ....... 76
CHAPTER 5: SUMMARY AND POLICY OPTIONS ........................................................... 81
SUMMARY OF FINDINGS ................................................................................................ 81
OUTLINE OF A FOOD SECURITY AND SOCIAL PROTECTION STRATEGY ......................... 84
REFERENCES ............................................................................................................. 94
ANNEX I: DESIGN OF EARLY WARNING SYSTEMS ..................................................... 100
Map IBRD 41182 ..................................................................................................... 104

v
List of Tables
Table 1: Socio Economic Indicators, 2005 ............................................................................... 1
Table 2: Poverty Status in Niger by Geographic Area .............................................................. 7
Table 3: Sources and level of household food consumption in 2005 and 2006 .................... 12
Table 4: Prevalence of Chronic Food Insecurity in Niger ....................................................... 15
Table 5: Prevalence of Under nutrition in Children under 5 in Niger, 2006 .......................... 15
Table 6: Percentage of Households Exposed to Shocks by Poverty Level and Quintile ........ 21
Table 7: Distribution of Households Exposed to Drought across Regions of Residence (%) . 22
Table 8: Household Coping Strategies after Exposure to Drought (%) .................................. 23
Table 9: Percentage of Drought-affected Households Receiving Food Aid ........................... 23
Table 10: Coping Mechanisms after Drought by Ownership of Livestock in Rural and Urban Areas (%) ................................................................................................................................. 24
Table 11: Household Food Insecurity Levels .......................................................................... 27
Table 12: Chronic, Transient, and Vulnerable levels of Food Insecurity ............................... 28
Table 13: Dietary Diversification Index .................................................................................. 29
Table 14: Millet and Sorghum Production in Niger, 1985-2004 ............................................ 36
Table 15: Official Cereal Imports for Niger, 1998-2004 ......................................................... 38
Table 16: Niger - Cereal Production and Availability, 1990-2005 .......................................... 40
Table 17: Cereal Production in Niger and Nigeria, Average 2003-2004 ................................ 41
Table 18: Average Grain Prices in Niger, Nigeria and Chad, 1996-2006 (CFA/kg) ................. 47
Table 19: Simulated Price Effects of Production Shock and Net Imports, 2004/05 .............. 64
Table 20: Grain Prices (CFA/kg) by Food Crisis Region in Niger, 2004/2005 ......................... 65
Table 21: Distribution of Safety Net Programs between 2001 and 2006 (percent) .............. 73
Table 22: Sources of Financing for Safety Nets, 2001-2006 .................................................. 74
Table 23: Governmental (Emergency) Safety Net Programs, by Year and by Program ........ 75
List of Boxes
Box 1: How to Measure Food Security? ................................................................................... 7
Box 2: Steps for Identifying the Most Vulnerable in Niger .................................................... 18
Box 3: Methodologies for Estimating Household Food Insecurity ........................................ 26
Box 4: National Mechanism for the Prevention and Management of Food Crises in Niger: the Dispositif National de Prévention et de Gestion des Crises Alimentaires (DNPGCA) ....... 55
Box 5: History of Food Crises in Niger .................................................................................... 59
Box 6: Ethiopia’s Productive Safety Net Program (PSNP) ...................................................... 86
Box 7: Enhancing Food Security in Bangladesh ..................................................................... 90

vi
List of Figures
Figure 1: Poverty Rates in Niger by Department, 2005 ......................................................... 10
Figure 2: Share of Per Capita Caloric Consumption by Commodity Group (2005-2006) ...... 13
Figure 3: Stunting in Sub-Saharan Africa ............................................................................... 16
Figure 4: Number of Cases of Reported Wasting (by Week), 2006 ....................................... 17
Figure 5: Percentage of Departments Affected by Production Shocks by Year, 2000-2006 . 20
Figure 6: Percentage of the Population Vulnerable to Food Insecurity, 2007 ...................... 30
Figure 7: Predictions of Areas Vulnerable to Food Insecurity in Niger, 2006 ........................ 31
Figure 8: Administrative Regions and Agro-ecological Zones ................................................ 34
Figure 9: Key Grain Markets in Niger ..................................................................................... 44
Figure 10: Grain Prices in Niger and Key Regional Markets, 1996-2006 (CFA/kg) ................ 48
Figure 11: Key Forecasting Markets for Niger ....................................................................... 50
Figure 12: Comparison of Millet Prices in Niger and Nigeria ................................................. 50
Figure 13: Quantities of Food Aid Obtained and Distributed by the OPVN and the CCA during 2001-2007 .................................................................................................................... 53
Figure 14: Grain Price Levels of Key Forecasting Markets during the Harvest Period .......... 65
Figure 15: Intra-Seasonal Change of Millet Prices by Year .................................................... 66
Figure 16: Distribution of Children with an Infectious Illness and Acute Under-nutrition, by Age Group ............................................................................................................................... 67
Figure 17: International Prices of Grains (Wheat, Rice, and Maize), 2000-2007 .................. 77
Figure 18: Millet Prices in Key Forecasting Markets during the Harvest Period in 2000, 2004, and 2007 ................................................................................................................................. 78
Figure 19: Changes in Millet Prices between the Harvest and Hungry Periods .................... 79

vii
EXECUTIVE SUMMARY
Niger is a very poor country that faces serious problems of poverty and household food
insecurity. With a per capita gross national income (GNI) of US$240 and an estimated 62
percent of the population living below the poverty line, Niger is one of the lowest-ranked
countries on the United Nations’ Human Development Index. The incidence of poverty has
remained constant since the early 1990s (63 percent in 1993), mainly due to lack of
resources, low agricultural productivity, and high population growth. Currently
approximately 85 percent of the population lives on less than US$2 per day, with 65 percent
living on less than US$1 per day. Although the magnitude of poverty and food insecurity is
most evident during years of drought, the problem is in fact a chronic one. Low levels of
food availability, high population growth, limited economic access to food because of low
incomes relative to market prices, and inadequate health care have resulted in much of the
population being poorly nourished, even in years of normal harvest.
Reducing vulnerability and ensuring food and nutrition security is an overarching priority
for the government. Maintaining food security at the national and household level is an
important priority for developing countries in general, both for the welfare of the poor and
for political stability. In order to ensure food security, governments have adopted various
strategies, including making efforts to increase staple food crop production (often with the
explicit goal of food self-sufficiency), intervening in the market, and introducing a variety of
safety net programs, especially during emergencies. In Niger, where profound
vulnerabilities combined with a high level of population growth (3.3 percent per year) have
resulted in endemic food insecurity, the government is faced with a serious challenge. Food
aid has been an important resource for the government and has been integral to the
provision of safety net interventions, especially emergency responses. In this framework,
since 1998, Niger’s government and major food aid donors have jointly managed a National
Framework for the Prevention and Management of Food Crises (Dispositif National de

viii
Prévention et de Gestion des Crises Alimentaires or DNPGCA). The mandate of the DNPGCA
is to (i) help the government to build up cereal and financial reserves for food aid during
crises and (ii) implement actions to support food-insecure populations during food crises.
Moreover, in the government’s Rural Development Strategy (RDS) and its second Poverty
Reduction Strategy (PRSP2), it has established the strategic vision, policies, and institutional
framework to address food security issues. The RDS, which is the national agriculture policy,
has four objectives as follows: (i) to secure the living conditions of the population by
preventing the occurrence of food crises; (ii) to increase the incomes of the rural population
by increasing their access to economic opportunities; (iii) to strengthen the capacity of
public institutions and professional agricultural organizations; and (iv) to support increased
food production.
In this context, the purpose of this study is to contribute to the existing strategy by helping
the government to develop a holistic, multi-sectoral, and institutional approach to
reducing the population’s vulnerability to food insecurity. A comprehensive food security
strategy needs to find ways to enhance food security by increasing agricultural productivity
as well as through policies related to education, health and nutrition, and population
growth that are crucial for diversifying and increasing household incomes (and thereby
access to food). Since safety nets are also essential for addressing chronic food insecurity,
the report also discusses the food security strategy in the context of social protection
interventions. Within a social protection perspective, this study is designed to synthesize
considerable existing analysis, review food and nutrition security policies and programs in
Niger, and provide an action plan for strengthening the existing system and developing an
effective food security and safety net strategy in the context of the government’s poverty
reduction strategy. This report adds value to the ongoing policy discussions in two ways:
First, it presents new empirical analysis of (i) household food insecurity and
vulnerability during food crises as well as during normal periods, (ii) the structure
and integration of cereal markets within Niger and of markets in neighboring

ix
countries, and (iii) the causes of the 2005 food crisis, and lessons learned about the
implications of various degrees of cross-border flows between Niger and Nigeria.
Second, it provides concrete short-term and medium-term recommendations to
help the government to improve the performance of existing programs aimed at
increasing food security, particularly related to preparedness for and responses to
food crises, and to design efficient safety nets targeted to vulnerable populations.
The policy recommendations presented in this report are aligned with the strategies
proposed in the PRSP2 and the RDS and complement the government’s National
Contingency Plan for Food Security (le Plan National de Contingence sur la Sécurité
Alimentaire) of November 2007. They are also designed to help the government to
respond to recent and future high food world prices, which may contribute to higher
domestic prices and reduce the availability of food aid to supplement Niger’s
domestic food supply.
What are main findings of the study? First, the data suggest that more than 50 percent of
the population suffers from some form of food insecurity, with 22 percent of the population
being suffering from extreme chronic food insecurity. Second, poor households are more
exposed to shocks than richer ones, the poorest regions are the most vulnerable to food
insecurity, and the most common coping mechanisms used by households often increase
their vulnerability to future food insecurity. Third, since two-thirds of the population’s daily
caloric consumption comes from cereals, the production, availability, and market
performance of cereals are crucial determinants of food security. Fourth, the evidence
suggests that the targeting of food aid has been either non-existent or has focused on
helping all households affected by drought rather than only the poor households affected
by drought. Fifth, although the need to support poor and food-insecure households is
substantial, Niger’s current safety net programs are small, receive limited government
funding, and are designed specifically for emergency food crises. Finally, given Niger’s
limited resources, high prevalence of poverty and periodic severe droughts and other

x
shocks as mentioned in program 9 of the RDS, an effective food security and social
protection strategy is essential for Niger. This strategy needs to focus on: (i) increasing the
efficiency and scope of safety net programs; (ii) promoting effective medium-term
strategies and investments to increase food availability, access, and use; and (iii) improving
emergency responses and the information system.
POVERTY AND FOOD INSECURITY
Niger is classified as one of the poorest countries in the world with substantial variations
in poverty between regions. According to 2005 basic indicator household survey (QUIBB),
about 62 percent of the population has incomes that place them below the poverty line.
Since the economy is mainly centered around subsistence crops and livestock and given the
country’s high levels of population growth (3.3 percent per annum) and modest growth in
real GDP, the incidence of poverty has remained constant since 1993. As in many other
countries in Sub-Saharan Africa, poverty is more prevalent in rural areas (65.7 percent) than
in urban areas (55.5 percent). Regional variations of poverty follow this pattern as well:
predominantly rural regions such as Maradi (79.7 percent), Tillaberi (68.9 percent), and
Dosso (67.3 percent) have the highest incidences of poverty, while in the predominantly
urban region of Niamey, poverty incidence is only 27.1 percent.
Since grains account for a high share of total household expenditures and almost all
households are net purchasers of grains, fluctuations in grain production and prices have
a major impact on household food security. Between 61 and 64 percent of total household
expenditures are spent on basic foodstuffs, and grains represent about 50 percent of total
household spending. Grains (millet and sorghum) are also the dominant sources of caloric
consumption, accounting for over 75 percent of food consumption. Moreover, although the
majority of households are engaged in agricultural activities, almost all are net purchasers
of food and are thus negatively affected by increases in food prices.

xi
More than 50 percent of Niger’s population is estimated to be chronically food insecure,
with 22 percent of the total population suffering from extreme chronic food insecurity (per
capita caloric consumption of less than 1,800 kilocalories per person per day). A variety of
indicators demonstrate Niger’s food insecurity, including low per capita food consumption,
the limited dietary diversity of the population, the high prevalence of stunting in children
under the age of 5, and high levels of micronutrient deficiencies (primarily iodine, iron, and
Vitamin A). The causes of food security are complex, however, and result from the
interaction between low food availability, poverty, the poor health and nutritional status of
the population, and the country’s considerable vulnerability to shocks. Although poverty
rates are lower in urban areas, available household data for 2006 suggest that the
percentage of the population with inadequate caloric consumption (less than 2,100 calories
per day) is actually higher in urban areas (58 percent) in all regions than in rural areas (51
percent), with the exception of Dosso. The 2007 survey also confirms these findings,
showing that the 50 percent of the population that are chronically food-insecure are
composed of 30 percent who are suffering from extreme chronic food insecurity and 20
percent who are at risk.
There were substantial variations in food insecurity from region to region between 2005
and 2006. In 2005, Maradi, Dosso, and Niamey experienced the highest levels of extreme
chronic and total food insecurity, with over 48 percent of the population in a state of
extreme chronic food insecurity. In 2006, although extreme chronic food insecurity had
been reduced, Agadez (with about 44 percent of its population being vulnerable to chronic
food insecurity) had taken Maradi’s place as the region with the highest level of food
insecurity in the country because the level of food insecurity had fallen in Maradi.
In addition to chronic food insecurity, much of Niger’s population suffers from seasonal
and transitory food insecurity. Nutritional data show that much of the rural population
suffers from seasonal food insecurity in the annual hungry season (soudure) between June

xii
and September. Both rural and urban populations are also vulnerable to transitory food
insecurity, defined as temporarily reduced food consumption after a shock.
Households have a limited range of strategies to cope with the effects of shocks on their
incomes and food access, and some of these coping mechanisms make affected
households more vulnerable to future food insecurity. Qualitative surveys have shown that
the most common strategies used by Nigerien households to respond to natural shocks are
migrating, selling off their assets or livestock, and borrowing money. In a 2005 household
survey, food aid was the most common strategy used by households to mitigate the effects
of such shocks as droughts and economic and health shocks. In the case of droughts, almost
one in four households used food aid as their main coping strategy. Severe shocks leave
households more vulnerable to future food insecurity with 60 percent of households
remaining in debt after the 2005 food crises (Marinho and Gerard, 2008). In some cases,
their coping strategies exacerbated the households’ vulnerability.
The probability of receiving food aid is not correlated with poverty in rural areas. Among
those affected by the drought in rural areas, only 72 percent of the poor received food aid
compared to almost 80 percent of the non-poor. In urban areas, however, poor households
affected by drought were more likely to receive food aid than non-poor households. These
results suggest that the targeting of food aid has been either non-existent or focused on
helping all of those affected by drought rather than only poor households affected by
drought.
FOOD PRODUCTION AND MARKETS
In light of the importance of staple cereals (millet and sorghum) for producers’ and
consumers’ welfare (over two-thirds of the daily caloric consumption of Nigeriens comes
from cereals), the structure, conduct, and performance of food production and marketing
has important implications for food security in the country.

xiii
Despite unfavorable agro-climatic conditions, agriculture and livestock-raising play a key
role in the economy of Niger. Therefore, the prevalence and severity of the food security
problem in Niger are directly related to the structure, conduct, and performance of food
production and marketing. Overall, the agriculture sector employs more than 80 percent of
the total population and contributes to approximately 40 percent of gross domestic product
(GDP). Agriculture accounts for about 52 percent of rural output, with livestock contributing
another 30 percent.
Niger relies mainly on its own domestic production of grains (dominated by millet and
sorghum) for its cereal supply. The agriculture sector is characterized by subsistence
farming, and the production of food crop is primarily based on rainfed agriculture. Over 80
percent of Niger’s total cereal available for consumption comes from domestic production,
primarily millet and sorghum. Millet is by far the dominant staple food crop (accounting for
76 percent of cereal production), followed by sorghum (accounting for 22 percent of cereal
production). These crops are major determinants of both national food availability and rural
household incomes.
Because of Niger’s irregular rainfall, cereal production varies substantially, which makes
rural households vulnerable to production shocks. Over the past two decades, the lowest
cereal production years (1993, 1997, 2000, and 2004) coincided with natural shocks
(droughts). Although national cereal production increased by 48 percent between 1985 and
2004 (from 1.8 million tons to 2.7 million tons), the increase was primarily due to the
expansion of cultivated areas (from 4.3 million hectares to over 7 million hectares). Because
rainfall is highly variable both geographically and from year to year, there are substantial
regional and annual variations in cereal production. The average coefficients of variation for
national millet and sorghum production are 0.20 and 0.35 respectively. Regionally, in terms
of millet production, the regions of Maradi and Zinder (which account for approximately 40
percent of national millet production) have the lowest coefficients of variation, while the
regions of Tillaberi and Tahoua have the highest, suggesting that rural households in the

xiv
latter regions are exposed to higher production risk than households in other areas of the
country. In addition, the magnitude of production shocks varies quite substantially between
regions.
Given the strong intra-annual variation in staple food crop production, total food
availability in Niger depends strongly on commercial imports (specifically supply and
demand conditions in Nigeria), while food aid does not play an important role. Data on
cereal imports and exports in Niger are highly unreliable due in part to the large volume of
informal trade that occurs between Niger and its neighbors (Benin, Burkina Faso, Chad,
Mali, and Nigeria). Therefore, unofficial net imports of sorghum and millet from Nigeria are
likely to be much larger in most years than is shown by the official records of imports.
Estimates of these imports vary widely by year, but the analysis of the annual supply,
demand, and prices suggests that millet imports may have been as high as 200,000 tons in
2004, equivalent to about 10 percent of total net millet supply. Moreover, since Nigeria
produces much higher levels of millet, sorghum, and maize than Niger, the supply and
demand conditions in Nigeria, especially in the northern regions, have a major influence on
prices and availability in Niger. In comparison with unofficial imports, food aid inflows are
small, accounting for less than 20 percent of total cereal imports and only about 1 percent
of total net cereal availability.
The role played by the Government of Niger in cereal production and marketing has
significantly reduced since the 1990s, and food prices are now determined by market
forces. These reforms have had important implications for the functioning of Niger’s agro-
food sector, particularly in terms of pricing, marketing, and agricultural development and
investment. With the cereal market becoming liberalized, the role of the Office des Produits
Vivriers au Niger (OPVN), established in 1984 to manage the purchase and sales of staple
cereals (millet and sorghum), has been reduced to monitoring the food security situation
within the country and to managing the country’s strategic grain reserves. As a result,
during 2000 and 2004, the OPVN was responsible for distributing subsidized food to the

xv
population, including vulnerable groups, while domestic cereal prices are now influenced by
a host of factors, such as domestic supply and demand, commercial imports, import taxes
and tariffs, regional trade patterns, and market structure. However, depending on the
extent of domestic cereal production in a particular year, the government sometimes
regulates trade flows by limiting either exports or imports of specific commodities.
Although grain markets in Niger are well integrated in general, this varies both over time
and among regions. Staple food crop markets in Niger are somewhat integrated, with an
average correlation coefficient of 0.55 for all markets between 1996 and 2006.
Nevertheless, the degree of domestic market integration varies both over time and across
among regions, with higher levels of integration during low production years. The degree of
integration between markets in Niger and those in its border countries (Benin, Burkina Faso,
Chad, and Nigeria) follow the same pattern as the domestic markets. Market price
integration between Chad and Niger is minor, however, as is the degree of integration
between Burkina Faso and Niger. The highest degree of integration occurs between Niger,
Benin, and Nigeria, with a correlation coefficient of grain prices averaging 0.65. There is also
evidence of strong market integration between three-quarters of the major markets in
southern Niger and markets just across the border in Malanville (in Benin) and Jibia, Illela,
and Mai-Adua (in Nigeria).
THE 2005 FOOD CRISIS
The food crisis in Niger in 2005 provided national policymakers and the international
community with important lessons. Estimates of national food production in late 2004 that
suggested only a modest decline relative to medium-term trends gave little cause for
concern. In one sense, the major cause of the crisis was the extremely low level of
household income, which leaves many households on the brink of serious malnutrition even
in years of normal harvests and prices. The additional shocks in 2005 that tipped the
balance from risk to reality of a food crisis were:

xvi
Losses in food production and incomes for those farmers whose late 2004 harvests
were affected by drought and locusts; and
A sharp rise in food prices (related to even more dramatic price increases in some of
Nigeria’s markets beginning in mid-2004) that reduced household access to food for
all net purchasers. Market analysis suggests that Nigeria’s production shortfall and
high prices likely led to a decline in net imports of millet that significantly worsened
the effects of Niger’s production shortfall.
The government’s response to the 2005 food crisis included various mechanisms to
support households affected by income losses and production shocks. The government
response, with support from non-governmental agencies and international organizations,
consisted mainly of a range of emergency schemes: (i) food aid for direct emergency
distribution; (ii) food-for-work (FFW) programs; (iii) the sale of approximately 40,000 tons of
cereals at subsidized prices; and (iv) the provision of cash-for-work” (CFW) programs to
raise the purchasing power of affected households. These programs relied upon both
imported and local food aid, with some local purchases occurring within Niger (in Niamey
and Maradi) and in northern Nigeria. In spite of these efforts, the gross mortality rate
reached 1.5 deaths per 10,000 per day in some of the worst-affected regions, with child
mortality rates of 4.1 deaths per 10,000 per day, levels well above international thresholds
for humanitarian crises.
The criteria for targeting vulnerable regions that might need emergency programs were
unclear, and there is still no accurate list identifying those regions that were most severely
affected by the 2005 food crisis. Due to the lack of explicit and transparent criteria (or
thresholds) for determining what constitutes a food crisis and for identifying vulnerable
regions, the areas that were most severely affected by the 2005 crisis may not have been
reached by any emergency effort. A list of vulnerable villages was produced by the
xvii
Government in May 2005, but the list did not align with qualitative and quantitative
evidence gathered by international and non-governmental organizations.
To improve the functioning of its emergency response interventions, the Government of
Niger has developed a National Contingency Plan for Food Security with the participation
of a variety of governmental and non-governmental actors. Developed in 2007, the plan
outlines the strategic priorities (including early warning indicators such as a cereal deficit,
high food prices, and severe malnutrition) for the government and its development partners
in preventing and managing food crises in the country. The overall objective of the plan is to
minimize the impact of food crises by ensuring households’ access to staple foods and
protecting their assets, mainly via the national security stock and emergency cash resources
(in other words, general food distribution, FFW programs, CFW programs, subsidized sales
of staples, and seed distribution). However, there is still a lack of agreement among the
government and its partners regarding which are the most effective safety net interventions
in Niger. The list of response interventions outlined by the National Contingency Plan
includes most of the same instruments that have been used in the past few years, with an
increased emphasis on CFW rather than FFW and cereal banks. However there is no good
evidence showing which interventions have been most effective. The general information
from the 1990s show that cereal banks have not been sustainable. CFW programs, which
are usually preferred to FFW, are fairly new interventions that have not been fully evaluated
in Niger.
POLICY OPTIONS TO RESPOND TO FOOD INSECURITY
International experience has shown that social safety net programs play a very important
role in reducing and alleviating chronic poverty and in helping the poorest people after
natural catastrophes. In this study, social safety nets (safety nets for short) refer to non-
contributory transfer programs targeted to the poor and to individuals vulnerable to
poverty and to shocks. These programs have the simultaneous goals of: (i) providing
xviii
assistance to poor households to help them to rise out of poverty and to cope with the
impact of shocks and (ii) reducing the negative effects of globalization, macroeconomic
shocks, and structural changes, thus contributing to more sustainable growth.1 These safety
nets consist of programs such as:
Cash transfers or food coupons, targeted either by category or by income level
(examples include family allowances or social pensions).
In-kind transfers, school meal programs, or supplements designed for mothers and
children and also less frequently the distribution of ready-to-eat meals, school supplies,
or uniforms.
General price subsidies, often for food or energy, targeted to households.
Employment through labor-intensive public works programs, sometimes called
“workfare” (transfers that are conditional on recipients providing their labor for a
specified period of time).
Cash or in-kind transfers to poor households subject to the recipients meeting certain
educational or health conditions.
Exemptions from paying fees for basic services, health services, education, public
services, or transportation.
Given Niger’s limited resources, high poverty incidence, and periodic climatic shocks, an
effective food security and social protection strategy is essential. Such a strategy should
include three key components: (i) increasing the efficiency and scope of safety net
1 See Grosh et al (2008) for a complete description of social safety nets.

xix
programs; (ii) promoting effective medium-term strategies and investments to increase
food availability and access and to improve health and sanitation practices; and (iii)
strengthening the emergency response and information systems. Avoiding future food
crises will also require a greater recognition of the importance of regional markets
(particularly those in Nigeria) in influencing market prices, food imports (and exports), and,
ultimately, household food consumption in Niger. Finally, any social protection strategy,
including safety nets, will need to be consistent with the country’s overall strategy for
growth and poverty reduction, which represents the ultimate solution for food insecurity
and the poor health and nutritional outcomes associated with both poverty and household
food insecurity. The government in close collaboration with its development partners has
developed an action plan containing the policy measures that will need to be implemented
in short and medium terms (see the policy action plan for an effective food security and
strategy matrix on page. xxiv below).
Invest in Safety Nets to Protect Poor and Vulnerable People
Currently, only a small portion of the government’s total budget is allocated to safety net
programs, ranging from 1 to 5 percent of total expenditures between 2001 and 2006.
During this period, almost 70 percent of safety net expenditures were focused on food
crises, with the Food Crisis Unit (CCA)2 being largely responsible for coordinating these
programs and Niger’s Food Production Office (OPVN) and a variety of NGOs serving as the
main implementing agencies.
Safety nets are needed even in years of normal harvests to prevent vulnerable and poor
people from falling deeper into poverty and debt. The main challenge is to design an
effective safety net system and provide adequate funding to ensure its sustainability. The
development of an effective safety net program could include the following steps:
2 Unit within the National Framework for the Prevention and Management of Food Crisis

xx
Developing a comprehensive safety nets system. The mechanisms for preventing and
responding to food crises as currently implemented by the National Mechanism for
the Prevention and Management of Food Crises in Niger (DNPGCA) constitute only
one part of a full-scale safety net system. Consequently, to ensure that Niger has a
safety net system to protect households suffering from chronic, seasonal and
transitory food insecurity, it will be necessary to: (i) formulate a safety net program
that is consistent with the aims of the PRSP2 and RDS; and (ii) ensure coordination
between the government and its technical and financial partners (TFPs). This in turn
will require that safety net programs are included in the government budget as well
as long-term financial commitments from the TFPs.
Increasing the effectiveness of the current safety net system. This would require: (i)
assessing the effectiveness of existing programs labor-intensive public works
programs such as FFW and CFW programs, free distribution of foodstuffs, subsidized
food sales, cereal banks, and school feeding programs; (ii) reviewing the existing
targeting system to determine how best to reach chronically poor people; and (iii)
improving the current program monitoring system. Within this framework, to ensure
that the safety net system is effective (in crisis and normal periods) it should be
possible: (i) to guarantee that the FFW and CFW programs are well-organized and
productive; (ii) to limit the amount of free distribution of food as well as subsidized
sales and pay specific attention to location and timing of sales; (iii) to ensure that the
purchase of local foodstuffs for food aid programs is well planned; and (iv) to ensure
that there are transparent and efficient targeting procedures for selecting the
regions and households to benefit from the program.
Introducing new safety nets programs. Once the vulnerable groups are identified
and the evaluation of the existing programs is completed, it will be necessary to pilot
certain types of programs with transparent eligibility criteria, coverage, and cost,
including cash payments and conditional cash transfers (in other words, transfers

xxi
that are conditional on recipients ensuring that their children attend school and/or
make regular use of health services).
Introduce Medium-term Policies and Investments to Increase the Availability of and
Access to Food and Improve Health and Sanitation Practices
Medium- and long-term policies are also needed to reduce household vulnerability to
production shocks, raise the incomes of the poor, and enhance market efficiency. Actions
aimed at producing these outcomes are already integrated in axis 1 of the RDS as well as in
the Accelerated Development Strategy and the Poverty Reduction Strategy (PRSP2). In this
context, the government might consider:
Increasing the availability of staple food products. This could be achieved by
increasing agricultural productivity and the efficiency of agriculture markets as well
as by reducing the production risks faced by farmers. Efficient domestic agriculture
production could be promoted by investing in agricultural research and extension,
investing in road construction and maintenance, increasing market infrastructure
(such as storage facilities), and increasing access to water for agriculture by investing
in irrigation and water retention.
Ensuring that commercial policies promote the development of cereals markets. In
this context, it will be necessary to: (i) reduce price risks associated with farm
products to increase incentives for production and (ii) reduce the variability of rural
incomes by promoting farmers’ groups. In addition it is crucial to improve the flow of
market information on prices and volumes of production and market supplies. To
ensure that commercial policies do not impede the development of cereals markets,
it will be necessary to promote market efficiency and transparent policies on food
aid flows, imports, and releases of food stocks.

xxii
Expanding access to food for the poor (in rural and urban areas). In this context, it
will be important to support various income-generating activities for households (for
example, by providing micro-credit through local NGOs and investing in education
and skills development to increase labor productivity).
Improving health and sanitation practices. This will require a focus on the overall
health and sanitation environment, particularly in the poorest households.
Strengthen the Emergency Response and Information Systems
Despite recent progress, further steps are needed to improve the functioning of the early
warning and emergency response systems as well the existing information system. This
might include:
Revising and implementing the government’s National Contingency Plan for Food
Security and setting up a comprehensive monitoring system for food procurement,
distribution, and stocks.
Improving the information system and the emergency program by: (i) monitoring
international price movements, particularly in Nigeria, particularly as, depending on
the price incentives for trade between major markets in Niger and northern Nigeria,
net imports of millet could vary by about 200,000 tons (about 10 percent of millet
availability in a normal year); (ii) improving the dissemination of information from
the early warning system to decision-makers and other actors; and (iii)
strengthening the analytical capacities of the key government institutions which are
part of the disaster risk management and early warning systems (CCA, SAP, SIMA,
CIC).

xxiii
Using current and new safety nets programs as an emergency response. In
particular, it is necessary to strengthen efficient safety nets programs and to define
specific targeting mechanisms for use in emergencies.

xxiv
NIGER: POLICY ACTION PLAN FOR AN EFFECTIVE FOOD SECURITY AND SOCIAL PROTECTION STRATEGY MATRIX
Invest in Safety Nets to Protect Poor and Vulnerable People Policy Recommendations Actions and Timeframe Actors Monitoring Indicators
2008/2009 2009/2011
Establish a general safety net system for households suffering from food insecurity (chronic as well as seasonal and transitory). (Cf. PRSP, RDS)
Develop a comprehensive safety nets program aligned with the PRSP2 and RDS.
Ensure coordination between the government and its technical and financial partners (TFPs).
Identify sources of sustainable financing (before May 2009).
Steering committee (CCA, INS, SAP, SIMA).
Expanded national mechanism (Presidency, Prime Ministry RDS, Education, Health, INS, MEF, TFPs, civil society).
Program Document.
Committee Creation Decrees.
Strengthen the effectiveness of current safety nets
FFW and CFW.
Free distribution of food.
Subsidized food sales on a limited scale.
Cereal bank.
School feeding.
Assess the effectiveness of current programs (during normal and crisis situations) - Quick survey and targeted household surveys.
Develop a targeting system for populations with chronic food insecurity.
Improve stocks monitoring and information systems.
Decide which programs to retain.
Adjust implementation mechanisms for the retained programs (targeting, distribution, etc.).
Revise the execution structure for the programs (creation of a rural works agency).
Implement a program monitoring system (resources and beneficiaries).
Steering committee to prepare the TOR for program assessment (CCA, INS, SAP, SIMA, etc.).
Monitoring (CCA, OPVN, technical ministries).
Technical ministries for execution (Rural Works Agency).
Assessment reports.
Criteria for targeting.
Monitoring indicators.
Identify new safety net programs
Cash transfers (conditional and non-conditional).
Develop pilot programs (refine criteria for targeting, period, coverage, cost, etc.).
Test pilot programs and monitor and assess them.
Technical ministries.
Implementation of pilot programs.

xxv
Introduce Medium-term Policies and Investments to Increase the Availability of and Access to Food and Improve Health and Sanitation Practices a/
Policy Recommendations Actions and Time Frame
2008/2009 2009/2011 Actors Monitoring indicators
Increase the availability of staple food products
Increase production and agricultural productivity.
Increase efficiency of domestic agricultural markets.
Reduce production risks for farmers.
Support agricultural production (especially farming) and increase productivity (seeds, fertilizers).
Study the possibility for expanding warrantage operations (inventory credit systems).
Study the possibility of introducing agricultural insurance.
Improve information systems on pricing and production volumes and market supplies.
Develop and adopt a strategy for cereal banks.
Invest in agricultural research and its expansion.
Implement an advisory support mechanism integrated into rural development.
Invest in irrigation and water retention (for example, verify dams, if necessary).
Promote access to agricultural credit.
Provide support for agricultural equipment.
Provide support for processing.
Provide regular access for producers to quality inputs at a competitive cost.
Improve market infrastructure by investing in storage facilities in major markets and in road construction and maintenance.
Promote the development of farmer associations and the private sector in agricultural industries for storage and marketing.
RDS, TFPs.
Technical ministries.
Implementation of agricultural and commercial policies that have been passed.
Study on warrantage and insurance.
Policy considered by the RDS.

xxvi
Ensure that commercial policies promote the development of the cereals market.
Ensure that the cereal market regulatory mechanism is applied.
Evaluate local purchasing programs and purchase locally where production and market conditions allow.
Promote transparent consultations and information exchanges between the government and private sector merchants.
Ministry of Commerce (application of ECOWAS and WAEMU texts).
RDS.
Implementation of commercial policies.
Consultation with private actors.
Expand access to food for the poor in rural and urban areas (Cf. PRSP2, RDS).
Increase household income.
Expand micro credit programs.
Invest in human capital.
Promote access to agricultural credits for households.
PRSP2, TFPs.
Volume of loans granted to poor people.
Improve health and sanitation practices. (Cf. PRSP2).
Improve food distribution programs and expand them to pregnant and nursing women, and infants, especially in poor households.
Continue to invest and promote general health and sanitation programs.
Ministry of Health, Ministry of Water, TFPs.
Implementation of a national nutrition and health protocol.
Improvement of health and sanitation services.
a/ The medium-term actions being proposed do not constitute a new program but represent a series of targeted actions integrated into the government’s development efforts that are in progress. They complement those that the government and its partners have already agreed to under axis no. 1 of the RDS as well as in the Accelerated Development Strategy and the Poverty Reduction Strategy (PRSP2). They must also be coordinated with the activities planned by the Comité National sur la Hausse des prix (National Committee on Price Increases), for which an interagency support mission led by the FAO was conducted in October 2008.

xxvii
Strengthen the Emergency Response and Information Systems
Policy Recommendations Actions and Time Frame Actors Monitoring indicators 2008/2009 2009/2011
Revise and update the Government's National Contingency Plan for Food Security.
Improve information and monitoring of emergency programs.
Improve monitoring and information on food supply.
Improve the crisis activation indicators defined in the national emergency plan.
SAP and PTF.
CCA.
OPVN.
Revised Plan.
Improve the information and early warning systems.
Take into consideration monitoring indicators for trans-border markets (cereal prices, Naira exchange rate, information parity index, volume, flow, etc.).
Improve dissemination of early warning information to decision makers and other actors.
Distribute consensus information and lobby through the CIC.
Strengthen analysis capacity of key government institutions (CCA, SAP, SIMA, CIC).
SAP, SIMA, SIMB.
CCA.
TFPs.
Technical ministries.
CIC.
Periodic bulletin.
Survey reports.
Use current and new safety net programs for emergency response.
Decide which safety nets to be strengthened (expanded in terms of space and coverage for emergencies) and finance them.
Define specific targeting mechanisms for emergencies.
Operationalize intervention mechanisms.
DNPGCA.
Technical ministries.
Rural Works Agency.
Report identifying intervention mechanisms.
Funds allocated for permanent and transitory programs.

1
CHAPTER 1: INTRODUCTION
BACKGROUND AND MOTIVATION
1. Niger is a very poor country with a limited natural and human resource base and
high population growth. Per capita gross national income (GNI) was around US$240 in
2005. Also, according to the United Nations Development Program (UNDP)’s Human
Development Index of 2005, the country was ranked 174th out of 177 countries. Poverty
remains widespread, and social indicators compare poorly to Sub-Saharan African averages
as presented in Table 1. The share of the population living in poverty, estimated at 62
percent in 2005, has been constant since the early 1990s (63 percent in 1993), mainly due
to a lack of resources, low agricultural productivity, and high population growth. In addition,
Niger is frequently hit by adverse shocks such as droughts, insect pests that damage crops,
and surges in prices of imported food.
Table 1: Socio Economic Indicators, 2005

2
2. Niger’s vulnerability to several exogenous factors, as well as its low level of
socioeconomic development, result in chronic food insecurity. Past experience has shown
that Niger’s economy has been affected by the high variability of rainfall, terms of trade
shocks, and the volatility of aid flows. Evidence shows that these shocks result in lower
growth performance, severely affect human development, and cause chronic food security
in Niger. Food insecurity is aggravated by high incidences of rural poverty, which translate
at the household level into low purchasing power, a lack of access to food by vulnerable
groups, rampant malnutrition, and limited access to health facilities. Droughts often result
in increases in the prices of millet, sorghum, and other staple foods, and dramatic decreases
in the prices of livestock (which constitute the “savings accounts” of agro-pastoralists and
pastoralists).3 Since there is no safety net scheme in place in Niger, the rural population
often migrates out of the most vulnerable zones during these difficult times.
3. Reducing vulnerability and ensuring food and nutrition security is an overarching
priority for the government. Food aid has been an important resource for the government
and is widely considered to be integral to the provision of safety net interventions,
especially emergency responses. In this framework, since 1998, Niger’s government and
major food aid donors have managed a National Mechanism for the Prevention and
Management of Food Crises (Dispositif National de Prévention et de Gestion des Crises
Alimentaires or DNPGCA) in Niger with the mandate to: (i) help the government to build up
cereal and financial reserves for food aid during crises and (ii) take actions to support the
population during periods of food crisis. Moreover, the government’s Rural Development
Strategy (RDS)4 action plan has set out the strategic vision, policies, and institutional
framework to address food security issues. Specifically, the RDS proposes that the
government: (i) continue its ongoing efforts to improve the performance of the existing
national system for crisis prevention and mitigation and (ii) adopt a multi-sectoral approach
that focuses on both increasing agricultural production and reducing the country’s
3 The most recent drought in 2005 led to food shortages for millions of Nigeriens.
4 Program 9 of the RDS is focused on “reducing the vulnerability of households.”

3
vulnerability to food crises. In this context, the existing national system for crisis prevention
and mitigation, created in 1989, has been improved over time to better target vulnerable
zones and households. Moreover, in light of lessons learned from the 2005 crisis, the
government is pursuing efforts to improve the performance of the system by: (i) focusing
the monitoring on food accessibility (monitoring of purchasing power and anticipation of
market behavior and household strategies); (ii) integrating the nutrition and health
dimensions of food insecurity into the vulnerability analysis; (iii) improving the targeting of
beneficiaries and the estimation of their needs; (iv) strengthening the role of the communes
in food crisis management; and (v) developing a communication strategy with the media.
Moreover, in collaboration with donors, the government has prepared and validated an
evaluation study on the national system for food crisis management and prevention, along
with an action plan. This action plan aims to establish a better emergency response
mechanism to food crises in Niger, but it is not expected to solve the structural issues that
cause or exacerbate food crises.
STRUCTURE OF THE REPORT
4. In alignment with government thinking, this report aims to take stock of both
existing information and new analysis on vulnerability and provide an analysis of the food
security situation in the country, draw lessons from the experience of the 2005 food crisis,
and discuss policy options for increasing food security. Specifically, this report:
Presents a detailed analysis of household food security in Niger, including the main
sources of risks, household vulnerability to food insecurity, and their coping
mechanisms.
Provides an overview of agriculture production, food availability, and access to grain
markets, highlighting the role played by private unofficial trade with neighboring
countries.

4
Reviews the experience of the food and nutrition crisis in 2005 and gives an
overview of the existing national food security system and safety nets for crisis
prevention and mitigation.
Suggests policy options, aligned with the government’s Development Strategy and
the Poverty Reduction Strategy (PRSP2) and the Rural Development Strategy (RDS),
for: (i) introducing a safety net to protect poor and vulnerable groups; (ii) increasing
the efficiency of medium-term policies and investments to increase food availability
and accessibility; and (iii) strengthening the existing emergency response system.
5. Given the multi-sectoral aspects of the food security, the report explores ways to
enhance food security and prevent reductions in food security. Any comprehensive food
security strategy needs to find ways to enhance food security by increasing agricultural
productivity as well as by adopting policies related to education, health and nutrition, and
population growth that are crucial for diversifying and increasing household incomes (and
thereby their access to food). Since safety nets are essential for reducing chronic food
insecurity, the report discusses the food security strategy in the context of Niger’s social
protection interventions and in the context of other existing and ongoing analytical works
(on, for example, irrigation, agriculture, population, and health).
6. This report relies on several primary and secondary sources of information
conducted between 2004 and 2008, including studies on risks, shocks, and vulnerability to
food insecurity in Niger. The primary sources include surveys of governmental and non-
governmental interventions implemented during and after the food crisis by the National
Statistical Office (INS), as well as a cereal market survey conducted by four non-
governmental organizations in Niger (Catholic Relief Services, CARE International, Helen
Keller International, and World Vision International). The INS has completed several
consumption and expenditures surveys, including: (i) an extended national survey
(Questionnaire sur les Indicateurs de Base et de Bien-être, or QUIBB) in May 2005 and (ii) a

5
survey of food security in households (Enquête sur la Conjoncture et la Vulnérabilité
Alimentaire des Ménages5, or ECVAM) in May 2006. These two surveys have been collected
at different points in time, one during the crises of 2004-5 and the other after a good
harvest in November 2006. They provided the basis for the analysis of poverty and
household food insecurity, which was conducted by the INS in collaboration with the World
Bank.6 Secondary sources of information include the series of poverty and vulnerability
reports prepared by various international partners (including the World Food Programme
and the World Bank) and various consultants between 2006 and 2008. These studies
provide detailed information on the food security situation in Niger, on poverty and
consumption, cereal production and marketing, health and nutrition, and the types of
shocks that affect the country.
7. The rest of this study is organized as follows: Chapter 2 presents a profile of the
poverty and food security situation in Niger, including the sources of risk and vulnerability
to food crises. Chapter 3 provides an overview of the agricultural production and marketing
system in the country, including information on trade flows and food aid. Chapter 4
summarizes the 2005 food crisis, its causes, and the responses of the Government of Niger,
non-governmental and international organizations prior to, during, and after the food crisis.
Chapter 5 outlines policy recommendations for protecting households who are food-
insecure and for responding to future food crises.
5 National Institute of Statistics (May 2006).
6 Note that making comparisons between the two surveys is complicated by the difference in the structure of
the consumption modules in the two surveys. However, they do illustrate the consumption pattern between the period of crises in 2005 and after a good harvest in fall 2006.

6
CHAPTER 2: POVERTY AND FOOD INSECURITY
According to the available information, more than 50 percent of Niger’s population suffers
from some form of food insecurity, including chronic, seasonal, and transitory food
insecurity (defined as reduced access to food after a shock). This is due to the complex
interaction between low food availability, limited economic access, the poor health and
nutritional status of the population, and the country’s high susceptibility to shocks.
According to available household surveys, over two-thirds of the population’s daily caloric
consumption comes from cereals, with regional variations in consumption levels mirroring
the geographical distribution of poverty. Nutritional outcomes are consistent with the
prevalence of seasonal and transitory food security. Strategies for coping with the various
risks and shocks affecting urban and rural households include receiving food aid, reducing
the number of meals consumed per day, migrating, and selling household assets or
livestock. Overall, poor households are more exposed to shocks, the poorest regions are
the most vulnerable to food insecurity, and coping mechanisms make households more
vulnerable to future food insecurity.
8. More than 50 percent of Niger’s population is estimated to suffer from some form
of food insecurity. Regardless of what indicators are used, survey-based evidence
consistently shows that much of Niger’s population suffers from widespread chronic,
seasonal, and transitory food insecurity. This is due to the complex interaction between low
food availability, poverty and limited economic access to food, the poor health and
nutritional status of the population, and the country’s high vulnerability to shocks due to its
economic dependency on subsistence crops and livestock. Per capita food consumption
levels are low for about half of the households in Niger, there is limited dietary diversity for
much of the population, the prevalence of stunting in children under the age of 5 is high,
and micronutrient deficiencies are widespread (see Box 1).
7
Box 1: How to Measure Food Security?
International organizations (such as the United Nations, the Food and Agricultural Organization, the World Food Programme, and the World Bank) define food security as “access by all people at all times to sufficient food for an active, healthy life” (World Bank, 1986). Food insecurity is therefore defined as the absence of one or all of the conditions required to live an active, healthy life and can be classified into one of three categories: (i) chronic food insecurity, defined as having insufficient access to sufficient food on a continuous basis; (ii) seasonal food insecurity, or having insufficient access to food on a cyclical basis; and (iii) transitory food insecurity, whereby households do not have access to sufficient food following a shock, such as a man-made or natural disaster. Although most definitions of food security used by governmental, non-governmental, and international organizations are closely related to the World Bank’s definition, measurability remains problematic. Maxwell and Frankenberger (1992) highlighted the diversity of the points of view regarding food security and concluded that there is no “gold standard” for measuring food security (Maxwell et al, 1999). The most common approaches used include analyzing poverty, consumption patterns such as daily caloric intake, the nutritional status of children under the age of 5 (stunting, wasting, and under-nutrition), and micronutrient deficiencies. Another approach, presented later in this chapter, uses risk and vulnerability analysis to relate the main sources of risk and vulnerability to household-level food security indicators, distinguishing between chronic food insecurity and vulnerability to food insecurity.
CHRONIC AND SEASONAL FOOD INSECURITY
Links between Food Insecurity and Poverty
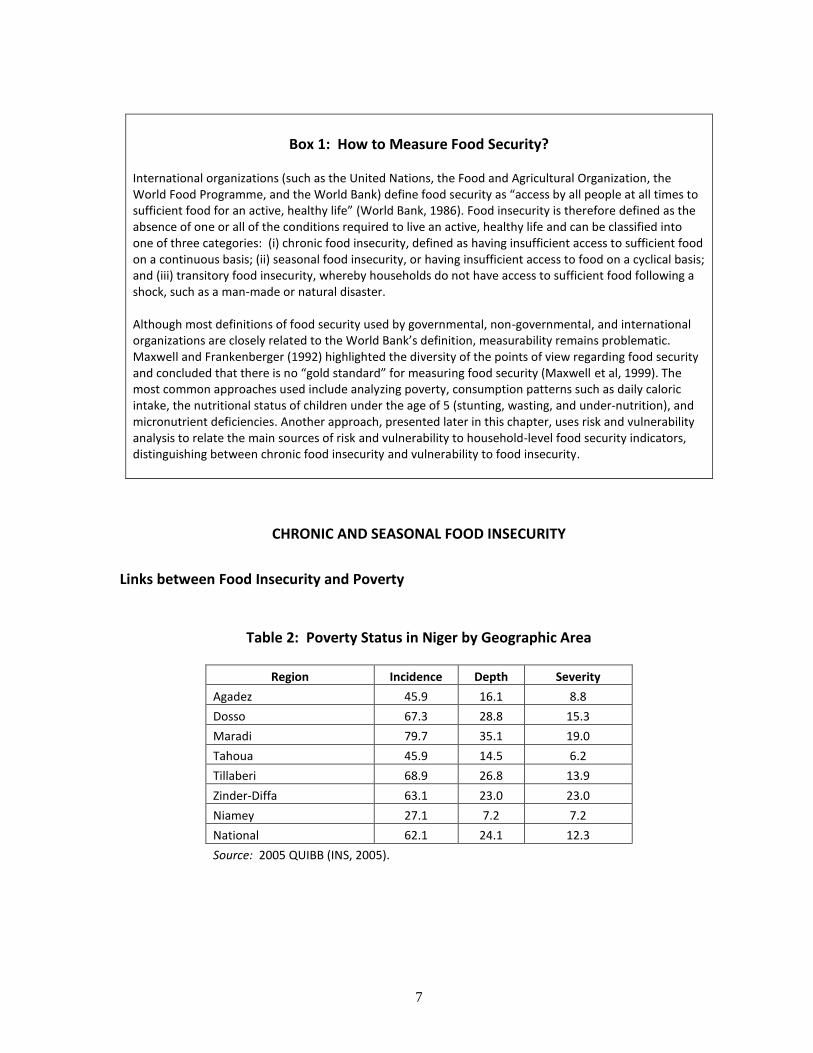
Table 2: Poverty Status in Niger by Geographic Area
Region Incidence Depth Severity
Agadez 45.9 16.1 8.8
Dosso 67.3 28.8 15.3
Maradi 79.7 35.1 19.0
Tahoua 45.9 14.5 6.2
Tillaberi 68.9 26.8 13.9
Zinder-Diffa 63.1 23.0 23.0
Niamey 27.1 7.2 7.2
National 62.1 24.1 12.3
Source: 2005 QUIBB (INS, 2005).

8
9. All methods used for measuring poverty – including the monetary approach, the
living conditions approach, and the subjective approach – show that the incidence of
poverty remains high in Niger. 7/8 With average per capita GDP of US$240 in 2005, Niger is
classified as the fourth poorest country in the world and is the lowest ranked on the UN’s
Human Development Index (HDI).9 According to the Survey on the Satisfaction of Basic
Needs (DSBE) in 2004, 70 percent of households in Niger cannot meet their basic needs for
food, income, employment, farm equipment, land, education, health, and drinking water.
These results are further confirmed by the monetary evaluation of poverty (using data from
the 2005 QUIBB), which shows that the proportion of the population living below the
poverty line was 62.1 percent in 200510 (see Table 2). In fact, the prevalence of poverty in
Niger has remained essentially constant since 1993 (in 1993 the incidence of poverty was 64
percent compared to 62 percent in 2005). Furthermore, according to a participatory poverty
survey (the 2006/07 EPP2), approximately 66 percent of households in Niger consider
themselves to be poor, and 20 percent consider themselves to be extremely poor. Updated
estimates and further analysis of poverty trends are expected after the completion of the
ongoing Household Budget Survey in 2007/08. Moreover, food expenditure is low and
accounts for a significant amount of total household expenditures leading to high levels of
food insecurity.
7 Three poverty surveys have been conducted in Niger since 2000: the Survey on the Satisfaction of Basic
Needs (DSBE) in 2004; the Survey on the Combined Questionnaire of Basic Welfare Indicators (QUIBB) in 2005; and the second participatory survey on poverty (EPP2) in 2005. 8 The incidence of poverty measures the percentage of individuals or households whose consumer spending is
below the monetary poverty line. The poverty line corresponds to a minimum annual level of consumer spending for an individual or household, while the depth of poverty measures the average percentage gap between the level of well-being of poor households and the poverty line. Poverty depth is used to estimate the minimum amount of additional resources that would be needed to raise poor households up to the monetary poverty line. The severity of poverty measures the average gap between consumption by the poor and the poverty line. It gives relative proportions of poor people in various groups. 9 While there is no single and universal definition of poverty, poverty is often defined as “a state of individual
or collective destitution which places man in a situation of shortage or lack of essential needs.” This definition (World Bank (2000) reflects the lack of adequate income to satisfy basic needs in the form of feeding, health, education, drinking water, and decent housing, which results in a lack of opportunities to participate in social and economic life and in an increase in the vulnerability of poor populations to shocks of various types. 10
According to World Bank (2005), the poverty thresholds for Niger in 2005 were 144,750 FCFA (equivalent to about US$175) per capita and per year for urban areas and 105,827 FCFA (equivalent to about US$110) for rural areas.
9
Poverty incidence varies by region though it is higher on average in rural areas than in
urban areas. The prevalence of poverty and extreme poverty is higher in rural areas, with
65.7 percent of the population in rural areas living below the poverty line compared with
55.5 percent in urban areas. Regional variations in poverty are also significant as can be
seen in Table 2. Niger is divided into eight administrative regions, Agadez, Diffa, Dosso,
Maradi, Niamey, Tahoua, Tillaberi, and Zinder, with each region having several
departments. The incidence of poverty is highest in the Maradi (79.7 percent), Tillaberi
(68.9 percent), and Dosso (67.3 percent) regions, whereas it is only 27.1 percent in the
capital Niamey. Likewise, the depth of poverty, which indicates whether families are living
in abject poverty or just below the poverty line, also confirms higher levels of poverty in the
same three regions: Maradi, Tillaberi, and Dosso.
10. Variations in poverty rates are even greater at the department level (see Figure
1).11 Poverty is most widespread in Mayahi (Maradi) department, where almost 90 percent
of the population is living below the poverty line. Departments located in the regions of
Maradi, Tillaberi, Dosso, and Zinder also have very high incidences of poverty, with more
than 50 percent of the population living below the poverty line. Other regions (Tahoua and
Agadez) have localized pockets of poverty, but on average poverty rates range from 35 to
50 percent.
11
See World Bank (2006) and INS (2005).

10
Figure 1: Poverty Rates in Niger by Department, 2005
11. As in other countries, poverty in Niger is strongly correlated with a variety of
household characteristics, such as household size and the gender, educational level, and
economic status of the head of the household. According to the 2005 QUIBB survey, larger
households are poorer than smaller households, as are households with more rather than
fewer children. All else being equal, female-headed households are poorer than male-
headed households, as are households in which the household head did not complete
primary education compared with those heads with a higher level of education. The
household’s source of income also has a major impact on per capita consumption and the
household’s probability of being poor. In general, households in Niger rely on a limited
number of income-generating activities. According to the 2006 ECVAM survey, 20 percent
of households generate income from a single activity (such as agriculture, trade, or
livestock).12 Moreover, approximately 65 percent of households whose head is self-
employed are classified as poor, followed by those headed by unpaid apprentices (61.3
percent) and domestic servants (54.3 percent) (INS, 2005). By contrast, households with
heads whose main source of income is a formal public sector salary job have a higher
standard of living.
12
More recent information confirms that 40 percent of the population generates 80 percent of their income from one activity (Marinho and Gerard, 2008).

11
Consumption Patterns
12. Food accounts for over 60 percent of total household expenditures in Niger.
According to the 2005 and 2006 household budget surveys, between 61 and 64 percent of
total household expenditures were for basic foodstuffs. Among these expenditures, cereals
(including millet and sorghum) represented approximately 50 percent of all spending.
13. Although the majority of households engage in some farming, almost all
households are net purchasers of food. Over 60 percent of households rely in part on their
own production to meet their consumption needs. Nevertheless, over 60 percent of
households were net purchasers of millet in 2005. This implies that Nigerien households do
not produce sufficient quantities to meet their consumption needs (see Table 3).

12
Table 3: Sources and level of household food consumption in 2005 and 2006
Consuming households
Source of consumption Quantity consumed per capita
per day
Expenditure budget shares
Calorie shares
Commodity groups
Own Production
Net market
Purchase
(%) (%) (%) Grams (%) (%)
2005
Millet 86.7 60.4 62.5 385.4 48.2 56.5
Sorghum 42.5 31.7 21.5 75.9 9.5 12.6
Other Cereals 79.2 10.2 77.0 209.3 21.3 16.7
Roots and Tubers 36.2 4.0 33.3 13.6 1.2 0.6
Nuts and pulses 56.3 23.2 40.0 21.5 2.7 2.7
Fruit Legume 83.7 18.9 79.9 101.2 . 1.4
Meat and fish 54.1 22.2 41.1 11.8 5.2 2.7
Milk, Eggs, Cheese 65.1 19.0 53.2 51.0 6.2 2.0
Oil 36.0 0.0 36.0 3.8 2.4 3.3
Sugar 65.2 0.0 65.2 9.6 3.3 1.3
2006
Millet 81.8 57.8 26.3 346.7 46.1 42.0
Sorghum 39.2 27.1 13.3 107.5 8.0 13.0
Other Cereals 76.7 7.8 74.7 130.2 26.8 14.3
Roots and Tubers 14.3 0.1 14.3 12.2 1.9 1.4
Nuts and pulses 65.2 34.8 33.3 67.9 6.4 9.0
Fruit Legume . . .
Meat and fish 52.1 4.5 50.3 53.8 4.9 2.7
Milk, Eggs, cheese 21.7 7.9 15.0 58.0 3.8 2.6
Oil 7.8 0.7 7.2 48.3 2.1 14.9
Sugar 32.5 0.3 32.2 1.0 0.1 0.1
Sources: 2005 QUIBB and 2006 ECVAM.
14. Cereals are the population’s dominant source of calories, and dietary diversity is
limited especially after a crisis. According to the QUIBB and ECVAM surveys, over 80
percent of daily caloric consumption came from cereals (millet, sorghum, and other cereals)
in 2005 and 70 percent in 2006. Less than 5 percent of the population’s daily caloric
consumption is derived from meat and fish, dairy products, and fruits and vegetables, which

13
are important sources of micronutrients, such as iron, iodine, vitamin A, and calcium (Figure
2).13
Figure 2: Share of Per Capita Caloric Consumption by Commodity Group (2005-2006)
Share of Per capita Caloric Consumption in 2005, by commodity group
Millet
Sorghum
Other Cereals
Nuts and pulses
Fruit Legume
Meat and fish
Tubercule
Milk, Eggs, cheese
Oil
Sugar
Share of Per capita Caloric Consumption in 2006, by commodity group
Millet
Sorghum
Other Cereals
Nuts and pulses
Meat and fish
Tubercule
Milk, Eggs, cheese
Oil
Source: 2005 QUIBB and 2006 ECVAM.
13
The calculations of per capita daily caloric consumption are based on different numbers of commodities and different methodologies in the 2005 and 2006 expenditure surveys. However, the ordering of the commodities remains roughly the same.

14
15. The majority of Niger’s population consumes fewer than 2100 calories per day. In
2005, 59 percent of the population consumed less than the minimum caloric requirement
for adults - 2100 calories per day - as defined by the World Health Organization,14 while in
2006, about 52 percent of the population consumed less that this minimum requirement.
Table 4 also shows important geographical variations among regions. Although poverty
rates are lower in urban areas than in rural areas, the percentage of the population with
inadequate caloric consumption is actually higher in urban areas in all regions except Dosso.
This difference between patterns of poverty as measured by the value of expenditures and
estimated calorie consumption reflects differences in food and non-food consumption
patterns, as well as variations in prices between rural and urban areas, confirming the multi-
dimensional nature of food security. For example, urban households tend to eat more rice,
a higher per calorie cost staple, while rural households tend to consume more millet, a
staple with a lower per calorie cost. Moreover, a shortage of food affects urban areas
through the higher prices of products while rural areas are more affected by their inability
to cover own needs from own production. Hence, the best indicator of food insecurity in
rural areas is the fact that they are more likely to receive external assistance in an
emergency or in the face of the threat of famine given its dependence on subsistence crops.
14
The daily caloric requirements for specific populations should be calculated based upon age, height, gender, and the individual’s activity level (mild, moderate, or intense). In the absence of such information, the standard threshold of 2,100 kilocalories per adult per day is used.

15
Table 4: Prevalence of Chronic Food Insecurity in Niger (% of the population consuming fewer than 2,100 calories per day)
2005 (%) 2006 (%)
Region Rural Urban Total Rural Urban Total
Agadez 41.4 64.4 53.3 66.0 64.6 65.2
Diffa 35.2 43.4 36.4 44.5 54.1 45.7
Dosso 68.7 59.1 67.9 58.5 51.6 57.7
Maradi 74.8 72.9 74.6 44.5 52.8 45.2
Tahoua 37.5 39.8 37.7 52.8 55.7 53.0
Tillaberi 55.7 55.5 55.7 55.4 58.9 55.7
Zinder 58.5 73.4 60.3 46.5 68.0 49.6
Niamey 67.3 67.3 50.7 50.7
Total 58.2 64.1 59.2 51.0 58.1 51.9
Sources: 2005 QUIBB and 2006 ECVAM.
The Nutritional Dimension
Table 5: Prevalence of Under nutrition in Children under 5 in Niger, 2006
Region Children 0-59 months
Wasting Stunting
Zinder 10.6 58.7
Maradi 11.6 62.2
Diffa 12.7 46.6
Dosso 10.3 46.6
Tahoua 10.3 46.7
Tillaberi 8.7 46.7
Agadez 10.5 38.8
Niamey 6.7 21.3
Source: 2006 DHS/MICS.
16. Nutrition-based indicators of food insecurity confirm the high level of chronic food
insecurity in Niger. According to the 2006 Demographic and Health Survey/ Multiple
Indicator Cluster Survey (DHS/MICS), the prevalence of stunting (low height-for-age) among
children in Niger is estimated at 50 percent. The situation varies among regions, with
Maradi and Zinder having the highest prevalence of stunting (Table 5). Niger’s stunting rate
makes it the second worst-affected country in Sub-Saharan Africa (Figure 3). The correlation
between under-nutrition and child mortality is high, with under-nutrition associated with 56

16
percent of all deaths of children under the age of 5 according to data from the 2006
DHS/MICS.15
Figure 3: Stunting in Sub-Saharan Africa
Source: UNICEF (2007).
17. Micronutrient deficiencies in the country provide further evidence of chronic food
insecurity. The main micronutrient deficiencies are of iodine, iron, and vitamin A, which are
crucial for vital bodily functions. It is estimated that 20 percent of the population suffers
from goiters (often resulting from iodine deficiency), with higher rates in the Dosso and
Tahoua regions. Furthermore, an estimated 42 percent of children under the age of 6 suffer
from sub-clinical vitamin A deficiency, with 7 percent of their mothers reported to have
suffered from night blindness during pregnancy. In terms of iron deficiencies, 84 percent of
all children, and 46 percent of women aged 15 to 49, are anemic according to the 2006
DHS/MICS.
15
Data from multiple rounds of DHS surveys conducted in Niger since 1992 suggest that chronic food insecurity, as measured by stunting, has increased from 40 percent (between 1992 and 2000) to 50 percent (2006).
0
10
20
30
40
50
60
Bur
undi
Nig
er
Zambia
Malaw
i
Mad
agas
car
Eth
iopia
Rwan
da
Ang
ola
Sud
an
Cha
d
Gha
na
Zimba
bwe
Con
go
Sou
th A
frica
Nam
ibie
Togo
Gab
on
Ivor
y Coa
st
Gam
bia
Sen
egal
Prevalence

17
18. Nutrition outcomes also provide evidence that Niger’s rural population suffers
from seasonal food insecurity. There is qualitative evidence that during the hungry season
(soudure), between June and September, household food consumption is lower in quantity
and worse in quality. This is supported by the prevalence of wasting in Niger (10 percent),
classified as “high” according to the World Health Organization’s (WHO) thresholds for
public health problems. Figure 4 shows the number of reported cases of moderate and
acute malnutrition by week for 2006 and 2007. While the data may be subject to selection
bias (as a higher number of nutritional rehabilitation centers opened during this period), a
general pattern of seasonal food insecurity emerges. In 2006, there was a marked increase
in reported cases of moderate malnutrition between April (week 16) to October (week 39),
coinciding with the pre-harvest period and hungry season. The same pattern, albeit not so
strong, was also observable in 2007.
Figure 4: Number of Cases of Reported Wasting (by Week), 2006

18
RISK, VULNERABILITY, AND HOUSEHOLD FOOD SECURITY
19. Niger’s population is also vulnerable to transitory food insecurity, defined as
reduced access to food after a shock. Shocks such as droughts, floods, pest attacks, health
epidemics and economic shocks16 not only have an immediate impact on households’ food
security but can also have longer-term consequences and leave households in debt or
without the necessary assets to guarantee a minimum level of production.17 As vulnerability
is an ex-ante measure of well-being, an ideal vulnerability analysis would follow the
approach outlined in Box 2. While the data available will not permit covering all the steps
outlined in the box, this section first summarizes the results of other reports and attempts
to conduct a vulnerability analysis using some of the available data surveys (2005 QUIBB
and 2006 ECVAM).
Box 2: Steps for Identifying the Most Vulnerable in Niger
Identify potential shocks or hazards that could affect communities or individuals.
Determine the level of risk (probability of being affected by this shock) of the affected populations.
Note the negative impact of these shocks on individual, household, and community-level food security and how households cope with these shocks (for example, a percentage reduction in the production of staple food crops or an increase in staple food crop prices or a reduction in livestock prices).
Determine the level of households food insecurity and the characteristics of individuals, households, and communities who are the most vulnerable to shocks (those most at risk and most affected by the negative impact of the shock).
Determine whether vulnerable households will have “unacceptable” levels of food insecurity as a result of the shocks. For example, do household reduce the number of meals or their dietary diversity? Is there an increase in malnutrition?
Using this information, construct tables and maps to identify the most vulnerable population groups and regions.
Sources: See Tesliuc and Lindert (2004); Hoddinott, and Quisumbing (2003); Hoogeveen et al (2004); and del Ninno and Arini (2005).
16
UNDP and Government of Niger (2007) notes two main types of risk factors in Niger: conflicts (farmer-herder and farmer-farmer) and natural shocks, such as droughts and production shocks. 17
See Carter and Barrett (2006).

19
Risks and Shocks
20. Although rural and urban households in Niger are susceptible to a variety of risks
and shocks, not all of these shocks result in food insecurity or food crises. Whether or not
food insecurity occurs depends on households’ assets, risks, and risk management
strategies. This section focuses on national and regional covariant shocks18 that are highly
correlated with the production of and access to food, namely, droughts, harvest failures,
and rising grain prices (Holzmann and Jorgensen, 2000).19
21. Over the past 12 years, Niger has experienced three severe droughts, two of which
were associated with food crises. The country experienced droughts in 1996, 2000, and
2004,20 and these weather-related shocks coincided with lower cereal production, higher
cereal prices, and lower incomes for the rural poor. Among these drought years, 1996/1997
and 2004/2005 were identified as severe food crisis years.21 In 2005, an estimated 2.4
million Nigeriens were affected by severe food shortages, with more than 800,000 of these
classified as critically food-insecure (FEWSNET 2005).22 Although the 2004/05 food crisis
was not on the scale of the 1968-74 or 1983-84 famines, the gross mortality rate reached
1.5 deaths per 10,000 per day in certain regions, and the child mortality rate reached 4.1
deaths per 10,000 per day (Médecins sans Frontières 2005).
18
Shocks that affect all the households in an area or group are called covariant shocks, as opposed to idiosyncratic shocks that affect only some households. 19
This paper adopts the definitions proposed by the World Bank (2001) for the concepts of risks, shocks, poverty, and vulnerability. Poverty is defined as an ex-post measure of well-being, whereas vulnerability is an ex-ante measure of well-being (or expected outcome). Central to the concept of vulnerability is risk, which is a probability distribution of events. Examples of risks include natural risks, health risks, economic risks, lifecycle risks, social risks, political risks, or environmental risks. When a risk materializes, it is known as a shock. 20
Annual rainfall was lower than one standard deviation from the mean. See Nicholson et al (2000). 21
Since the 1960s, Niger has experienced drought-related transitory food insecurity in 1966/67 (in Bandabari), 1973/74 (in Dakoussou), 1984/85 (in El Bohari), 1990/91, 1993/94, 1996/97 (in Matche mai), 2000/01, and 2004/05 (in Wazaka gaya ma). Of these years, only 1973/94, 1984/85, 1990/91, 1996/97, and 2004/2005 were classified as severe food crises (Government of Niger/DNPGCA 2007). 22
As the definitions of a food crisis vary, identifying clear thresholds for food crises is problematic. While a number of households were affected by food insecurity in 1997/1998 and 2000/2001, data on the number of households affected are not readily available. Nevertheless, it is commonly agreed that the 2004/2005 food crisis was the most severe, both in terms of number of people affected and the severity of the problem.

20
22. While droughts consistently caused production to decline, the severity of the
impact has varied sharply across sub-regions within Niger and also over time. While the
2000/01 drought resulted in a per capita production decrease of more than 50 percent in
about 15 percent of departments, the 2004/05 drought affected over 25 percent of
departments. Comparatively, during non-drought years (such as 2001/2002 and
2005/2006), less than 3 percent of all departments experienced a per capita drop in
production of more than 50 percent.
Figure 5: Percentage of Departments Affected by Production Shocks by Year, 2000-2006 Figure 5. Percentage of Departments affected by Production Shocks, by Year
0%
10%
20%
30%
40%
50%
60%
2000/2001 2001/2002 2004/2005 2005/2006
0% or +%
-.001%-25%
-25%-50%
-50%-100%
% o
f De
part
men
ts
Source: Aker (2007).
23. These marked differences in regional climate fluctuations are also reflected in
higher dispersion of grain production in drought-prone departments around the observed
production mean in Niger. These fluctuations measured by the coefficient of variation23
range from 0.11 in the Magaria department (Zinder) to 0.75 in the Tillaberi department.
Overall, the regions of Maradi and Zinder (which account approximately 40 percent of
national millet production) have the lowest coefficients of variation (0.22 and 0.27,
respectively), whereas the deficit regions of Tillaberi and Tahoua have the highest
23
The coefficient of variation is the standard deviation of per capita grain production in a particular department over the entire period, divided by mean per capita grain production.

21
coefficients of variation. This suggests that rural households living in drought-prone areas
(such as Tahoua and Tillaberi) are likely to be affected by a higher degree of output risk.
Table 6: Percentage of Households Exposed to Shocks by Poverty Level and Quintile
Drought Production
Shock Death
Illness (severe or chronic) Flood Job Loss Land loss
All HH 47.62 16.59 11.22 10.55 1.99 1.48 0.90
Poor 49.03 19.16 10.91 10.84 2.09 0.63 1.59
Non-poor 46.04 13.68 11.57 10.22 1.88 1.21 1.36
Quintile1 47.57 21.87 10.28 10.9 2.28 0.56 1.94
Quintile2 46.76 14.73 10.82 10.5 1.97 1.15 0.8
Quintile3 45.60 16.34 10.52 10.56 2.01 0.86 1.39
Quintile4 47.85 13.98 10.99 10.20 1.65 0.61 1.10
Quintile5 50.50 15.59 13.99 10.51 2.01 1.37 2.15
Source: 2005 QUIBB.
24. Vulnerability to drought is associated with low levels of household assets and
human capital. Poor households are not more exposed to shocks. Table 6 shows the
relative impact of different types of shocks in Niger on households in different poverty
levels and income quintiles. According to the available information, drought is the most
prevalent type of shock experienced by households in Niger, followed by production shocks.
On average, poor households appear to be more likely to be exposed to natural and health
shocks (droughts, floods, production losses, and illnesses) than richer households. When
stratifying the results by income quintile, however, the correlation between poverty and
risk is less clear. Econometric analysis by Ouedrago (2008) has shown that households
whose head is unemployed, works in the informal sector, is female, has a low level of
education, or does not own livestock and those that have high dependency ratios are most
likely to suffer from drought. In terms of location, households in Tahoua have the highest
combination of numbers of residents and numbers of people having been exposed to
drought and production shocks followed by those in Maradi, Tillabery, and Diffa (see Table
7).

22
Table 7: Distribution of Households Exposed to Drought across Regions of Residence (%)
Region Population % Affected Incidence
Agadez 3.2 2.4 0.74
Diffa 3.7 5.9 1.59
Dosso 9.7 5.1 0.53
Maradi 19.7 20.8 1.06
Tahoua 20.8 32.5 1.56
Tillabery 15.9 16.5 1.04
Zinder 20.2 16.7 0.83
Niamey 6.6 0.2 0.03
Total 100 100 1
Source: 2005 QUIBB.
25. According to the information from the 2005 QUIBB, Nigerien households have
fairly limited coping strategies to deal with covariate and individual shocks. According to
this survey, receiving food aid was rated as the most common strategy used by households
to mitigate the effects of shocks, including natural, economic, and health shocks (see Table
8). For droughts alone, almost one in four households stated that they had used food aid as
a coping strategy. Following food aid, households cited requesting assistance from others
and the sale of agricultural products as the most common strategies, followed by the sale of
household assets, borrowing, and assistance from NGOs.
26. The probability of receiving food aid is not correlated with poverty in rural areas.
Among those affected by the drought in rural areas, only 72 percent of the poor received
food aid compared with almost 80 percent of the non-poor. However, in urban areas, poor
households affected by drought were more likely to receive food aid than non-poor
households. These results suggest that the targeting of food aid has been either non-
existent or it has focused on helping all of those affected by drought rather than only poor
households affected by drought (see Tables 8 and 9).

23
Table 8: Household Coping Strategies after Exposure to Drought (%)
Strategies Drought
Food aid 74.8
Sell agricultural products 15.3
sell agricultural materials 3.0
Sell household assets 8.0
Get help from other households 40.0
Assistance from NGOs 8.1
International assistance 6.2
Borrowing 7.3
Others 1.2
Source: 2005 QUIBB.
Table 9: Percentage of Drought-affected Households Receiving Food Aid in 2005 by Poverty Category and Location
Urban Rural All
Poor 73.0 72.2 72.3
Non-poor 52.4 79.3 78.1
Source: 2005 QUIBB.
27. Qualitative studies conducted by numerous NGOs and the World Food Programme
(WFP) paint a notably different picture of household coping strategies. The WFP’s
Emergency Food Security Assessment (WFP, 2005) noted that the most common strategies
used by households to respond to natural shocks include reducing the number of meals
they eat per day, collecting wild food, borrowing money or food from other households,
migrating, or selling assets, land, or livestock. While the study did not focus on the
prevalence of these strategies (overall or by region) or their relative importance, migration,
the sale of household assets, the sale of livestock, and borrowing were highlighted as the
most common strategies used by Nigerien households.

24
28. Some coping mechanisms make households more vulnerable to future food
insecurity. Existing information confirms that, although borrowing and selling strategies
may enable households to cope with shocks in the short term and help them to smooth
their income, they effectively decapitalize the household of its productive assets (natural
capital, human capital, and financial capital), thereby making it more vulnerable to future
food insecurity. For example, Marinho and Gerard (2008) estimate that 47 percent of
households had sold livestock in response to the impact of the 2005 food crisis, and, as a
consequence, 60 percent of households in the national poverty survey were still in debt
after the crisis, with the average debt equivalent to 427 kilograms of cereals.
29. Livestock ownership affects coping mechanisms. In rural areas food aid is the most
common form of coping mechanism, especially for those who do not have any livestock. In
urban areas, households without any livestock are most likely to receive help from other
households (70 percent).
Table 10: Coping Mechanisms after Drought by Ownership of Livestock in Rural and Urban Areas (%)
RURAL URBAN
Coping Mechanisms No
livestock
Livestock value below
median
Livestock value above
median No
livestock
Livestock value below
median
Livestock value above
median
Food aid 80.7 74.7 72.7 55.8 72.7 76.1
Sell agricultural products 10.7 14.7 18.6 18.6 6.3 33.0
Sell agricultural equipment 3.6 2.5 2.8 1.5 7.4 5.9
Sales of HH assets 8.0 8.3 8.2 1.3 11.3 3.5
Get help from other HH 42.8 33.8 40.5 70.0 48.4 61.3
Assistance from NGO's 7.6 7.5 10.1 4.0 1.0 2.0
International assistance 6.0 4.4 8.3 11.4 1.0 0.0
Borrowing 9.4 5.6 7.0 20.5 8.0 5.4
Others 2.2 1.1 1.5 0.0 0.0 2.0
Source: 2005 QUIBB.

25
Vulnerability to Food Insecurity
30. Despite the wealth of data collected on the subject of household food security, it
has not been possible to develop a common classification of the most vulnerable
households within the country and over time. There have been numerous expenditure,
consumption, and vulnerability surveys conducted by the Government of Niger, the WFP,
and various NGOs between 2004 and 2007.24 Each study used a different set of variables to
define food security and vulnerability, in addition to taking different approaches and
methodologies to data collection. For example, only the 2005 QUIBB and 2006 ECVAM
contain information on expenditure and consumption. Therefore, it is difficult to use a
consistent definition and find comparable sources of information for estimating household
food insecurity (see Box 3).
24
Vulnerability surveys include: Enquete Conjointe sur la Vulnerabilité a l’Insecurité Alimentaire des Ménages au Niger (INS and SAP, November 2006); Enquete sur la Vulnerabilité a l’Insecurité Alimentaire des Ménages au Niger (INS, WFP, FAO, UNICEF, FEWS NET, CILSS, December 2007); and Enquête sur la Sécurité Alimentaire en Situation d’Urgence au Niger (WFP, 2005 a).

26
Box 3: Methodologies for Estimating Household Food Insecurity Besides the simple caloric consumption analysis presented in the first section of this chapter, there are several other methodologies that can be used to calculate household food insecurity: The first measure estimates the expected level of caloric consumption based on household human and
physical assets and capabilities and compares it with the observed level of caloric consumption below 2100 calories per capita per day into three categories of risk:
o Extreme chronic level (A) of food insecurity reflects both observed and expected levels of consumption below the minimum level of caloric consumption
o Vulnerability to chronic level (B) of food insecurity summarizes the share of households with observed consumption levels below the minimum level of caloric consumption that have the human and physical assets that would allow them to consume adequate level of calories but that cannot do so because of particular circumstances like drought.
o Vulnerability to food insecurity level (C) summarizes the share of households exposed to risks and uncertainties that has affected their levels of consumption. These are the households who are expected to consume less than 2100 calories per capita a day in response to a shock but who manage to consume more.
o The overall level of food insecurity is measured by the sum of chronic (A) and transient food insecurity.
(A) Extreme Chronic
(B) V
ulner
able
to ch
ronic
(C) V
ulnera
ble
Poverty LineExtreme poverty line
0
.0002
.0004
.0006
.0008
0 300 600 900 1200 1500 1800 2100 2400 2700 3000 3300 3600 3900 4200 4500 4800 5100 5400 5700 6000
PC daily calories
Actual Expected
The second measure calculates the food variety index named dietary diversity. This index is a simple, or weighted, count of foods or food groups over a given reference period. It emphasizes the importance of consuming a wide variety of food so as to enhance dietary quality. The main disadvantage of this method is that it does not take into account quantity nor does it control diets for caloric composition. However, review of other developing countries analysis confirms a positive correlation between dietary diversity and nutritional adequacy.
The third measure uses principal component analysis to summarize multidimensional data source into fewer indicators to analyze different outcomes. The method makes it possible to identify patterns in multidimensional data and to highlight similarities and differences by reducing the number of dimensions without much loss of information.
The final measure uses a spatial econometric model to determine local household food insecurity using the 2006 ECVAM and Geographic Information System data. This model follows a theoretical methodology to spatially predict food vulnerability using all available source of information at a given geographical level controlling for their geographical correlations.
Sources: Coates et al (2003); Hoddinott and Yohannes (2002); Migotto et al (2006); and del Ninno et al (2006).

27
31. In Niger at least 22 percent of the households are classified as extreme chronic
food-insecure, despite a small reduction in the country’s level of food insecurity in 2006
compared to 2005. According to the first measure of food insecurity presented above in Box
3, overall food insecurity (extreme chronic food insecurity and vulnerable to chronic food
insecurity) is by definition similar of the figure presented in Table 4. The reduction of 7.3
percentage points in food insecurity between 2005 and 2006 was the result of the increase
in the caloric consumption levels of the Nigerien population after the food crisis. The
reduction in the level of extreme chronic food insecurity was particularly large, going down
from 37 to 22 percent. However, this reduction in chronic food insecurity was accompanied
by a smaller increase of about 8 percent in those vulnerable to chronic levels of food
insecurity (see Table 11).
Table 11: Household Food Insecurity Levels
2005 2006
Food Insecurity
Extreme Chronic a/
37.4 22.0
Vulnerable to Chronic b/
21.9 29.9
59.3 51.9
Vulnerable to food insecurity c/
9.7 5.3
Sources: 2005 QUIBB and 2006 ECVAM. Notes: a/ Actual and expected consumption below minimum. b/ Actual consumption below minimum, but expected to have higher levels of consumption. c/ Higher expected consumption levels but still in between extreme poverty line and poverty line.
32. There were substantial variations in food insecurity across regions between 2005
and 2006. In 2005, Maradi, Dosso, and Niamey were the regions with the highest levels of
extreme chronic and total food insecurity. In 2006, Dosso remained the region with the
highest level of chronic food insecurity in the country followed by Niamey and Tillabery,
while the level of food insecurity had fallen in Maradi (see Table 12).
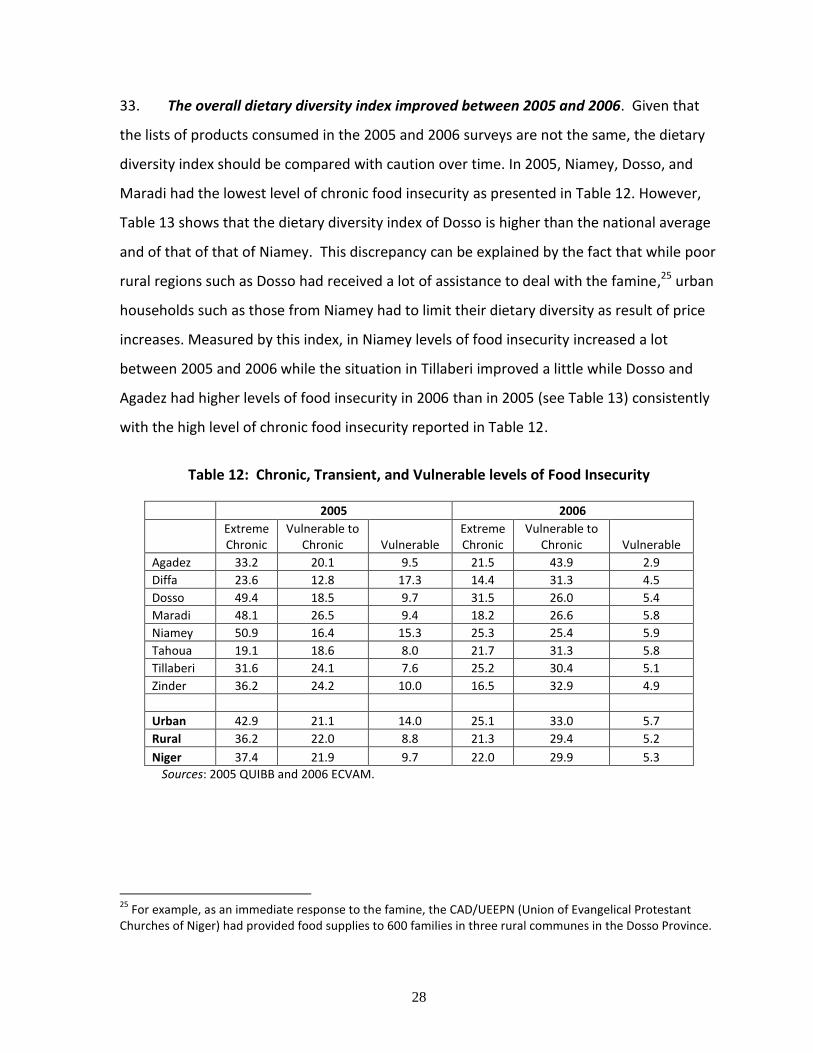
28
33. The overall dietary diversity index improved between 2005 and 2006. Given that
the lists of products consumed in the 2005 and 2006 surveys are not the same, the dietary
diversity index should be compared with caution over time. In 2005, Niamey, Dosso, and
Maradi had the lowest level of chronic food insecurity as presented in Table 12. However,
Table 13 shows that the dietary diversity index of Dosso is higher than the national average
and of that of that of Niamey. This discrepancy can be explained by the fact that while poor
rural regions such as Dosso had received a lot of assistance to deal with the famine,25 urban
households such as those from Niamey had to limit their dietary diversity as result of price
increases. Measured by this index, in Niamey levels of food insecurity increased a lot
between 2005 and 2006 while the situation in Tillaberi improved a little while Dosso and
Agadez had higher levels of food insecurity in 2006 than in 2005 (see Table 13) consistently
with the high level of chronic food insecurity reported in Table 12.
Table 12: Chronic, Transient, and Vulnerable levels of Food Insecurity
2005 2006
Extreme Chronic
Vulnerable to Chronic Vulnerable
Extreme Chronic
Vulnerable to Chronic Vulnerable
Agadez 33.2 20.1 9.5 21.5 43.9 2.9
Diffa 23.6 12.8 17.3 14.4 31.3 4.5
Dosso 49.4 18.5 9.7 31.5 26.0 5.4
Maradi 48.1 26.5 9.4 18.2 26.6 5.8
Niamey 50.9 16.4 15.3 25.3 25.4 5.9
Tahoua 19.1 18.6 8.0 21.7 31.3 5.8
Tillaberi 31.6 24.1 7.6 25.2 30.4 5.1
Zinder 36.2 24.2 10.0 16.5 32.9 4.9
Urban 42.9 21.1 14.0 25.1 33.0 5.7
Rural 36.2 22.0 8.8 21.3 29.4 5.2
Niger 37.4 21.9 9.7 22.0 29.9 5.3
Sources: 2005 QUIBB and 2006 ECVAM.
25
For example, as an immediate response to the famine, the CAD/UEEPN (Union of Evangelical Protestant Churches of Niger) had provided food supplies to 600 families in three rural communes in the Dosso Province.

29
Table 13: Dietary Diversification Index
2005 2006
Agadez 14.0 15.9
Diffa 18.1 18.6
Dosso 20.5 18.3
Maradi 18.0 21.5
Niamey 13.6 23.2
Tahoua 18.2 19.0
Tillaberi 16.6 20.8
Zinder 15.5 19.5
Urban 12.7 19.6
Rural 18.2 19.9
Niger 17.2 19.8
Sources: 2005 QUIBB and 2006 ECVAM 2006.
34. According to the principal component index, the poorest regions measured in
terms of per capita household expenditure are also the most vulnerable to food insecurity.
Based on a demographic, health and nutrition survey carried out in 2007 by the INS,
UNICEF, and Macro International, the regions of Tillaberi, Dosso, and Maradi were the most
vulnerable to food insecurity, with approximately 17, 13, and 11 percent of the affected
population respectively. This is consistent with the results of the 2005 QUIBB survey, which
identified Maradi, Dosso, Tillaberi, and Zinder as the poorest regions. Overall, the survey
data confirm that vulnerability is more heavily concentrated in the rural regions of Niger,
with 12 percent of the rural population vulnerable to food insecurity compared with 6
percent in urban areas. Figure 6 shows the percentage of the population that is vulnerable
to food insecurity by geographic region (INS et al, 2006). Although these are interesting
results, they are not comparable with the results of the previous two indexes of food
insecurity.

30
Figure 6: Percentage of the Population Vulnerable to Food Insecurity, 2007
35. Based on 2006 data and using a spatial framework for vulnerability, it can be
shown that proximity to paved roads and access to water are key determinants of
vulnerability to food insecurity. Figure 7 present results from a study by Marinho and
Gerard (2008), which has estimated that most vulnerable households in Niger are located in
the south with the exception of the extreme south of Tahoua, the middle and the south of
Dosso, or the west of Tillaberi. According to this study, the strongest determinants of food
insecurity in Niger are proximity to a paved road, access to water sources, location within an
agro-climatic zone, the recorded amount of rainfall or the normalized difference vegetation
index (NDVI), and recent shocks or food crises. While the identification of Dosso and
Tillaberi as vulnerable regions is consistent with the 2007 INS survey and previous findings
as presented in Table 2 or Table 9, in terms of dietary diversification, Maradi is not classified
as vulnerable to food insecurity.

31
Figure 7: Predictions of Areas Vulnerable to Food Insecurity in Niger, 2006

32
CHAPTER 3: FOOD AVAILABILITY AND ACCESS
Niger relies mainly on domestic production of grains (primarily millet and sorghum) for its
cereal supply. As production varies substantially from year to year due to extreme rainfall
variations, imports (consisting mainly of wheat, maize, and rice) are required to meet
local consumption needs. However, food aid and commercial imports typically account for
a small percentage of total cereal supply on an annual basis, averaging 7 percent of total
cereal availability between 2000 and 2005. Trade data in Niger are unreliable and
underreported: unofficial imports of grains from Nigeria may account for as much as
200,000 tons of total supply. Survey evidence and analysis of prices indicate that Niger’s
wholesale cereal markets are generally well integrated, but a lack of production data for
Nigeria prevents a detailed analysis of market links between the two countries.
Nonetheless, simulation analysis suggests that a reduction in net imports from Nigeria in
2005 was a major factor in the sharp rise in market prices in Niger during the 2005 food
security crisis.
FOOD AVAILABILITY: PRODUCTION, IMPORTS, AND FOOD AID
Agricultural Production
36. Despite unfavorable agro-climatic conditions and recurrent natural disasters,
agriculture and livestock-raising play a key role in Niger’s economy. The agro-food sector
accounts for approximately 40 percent of Niger’s gross domestic product (GDP) and is the
major source of employment for more than 80 percent of the total population, most of
whom live below the poverty line. In addition to agriculture, which accounts for about 52
percent of rural output, livestock raising is an important source of income for pastoral and
agro-pastoral households, with an estimated 7 million animals in Niger in 2005 according to
the WFP’s EFSA survey (WFP, 2005). Agro-pastoral products account for about 85 percent of

33
Niger’s export revenues (excluding uranium), with the livestock sector alone accounting for
56 percent (mostly live exports).
37. While there are a variety of livelihood zones within the country, agriculture is
primarily characterized by subsistence farming, and production of staple food crops is
based on rain-fed agriculture. Niger is a large country located within the Saharan, Sahelo-
Saharan, and Sahelian agro-ecological bands of Africa, with rainfall ranging from 250 to 800
millimeters per year. Niger is characterized by three distinct agro-ecological areas: the
pastoral zone, the agro-pastoral zone, and the agricultural zone (Figure 8)26 (FEWS NET
2005). In the pastoral zone, which is located in the northern part of the country, natural
conditions make this very good pasture land. However, in recent years, demographics have
brought about a development of agriculture along the southern belt of this area and a
reduction of pasture space. The agro-pastoral and agricultural zones are located in the
southern regions, which involve various sub-systems including a dune system, the Eastern
plains, and the Western plateaux. The dune system primarily produces millet, characterized
by low yields and deficit household production. The Eastern plains include the Maradi and
Zinder regions, where staple food crops (millet and cowpeas) are produced using semi-
intensive agricultural techniques, intercropping, and the use of small livestock. The Western
Plateaux (Tillaberi and Dosso) also cultivate staple food crops, with localized wetlands used
for market garden production. Production of staple food crops in the agro-pastoral and
agricultural zones is primarily based on rain-fed agriculture, with irrigated agriculture
practiced in localized areas (the Niger River basin, the Goulbis in Maradi and Zinder, the
Maggia and Tarka, Lake Chad, and Dallols in the Dosso region). Agriculture is characterized
by a family approach, on plots averaging five hectares (WFP 2005). Overall subsistence
farming and animal husbandry are cultivated using traditional techniques. With increasing
population density in the most productive zones – the population growth rate in Niger
26
In its 2005 Livelihood Profile for Niger, the USAID’s Famine Early Warning Systems Network (FEWS NET) identified eight livelihood zones for the country: the desert, the Bilma oasis sub-zone, air mountain cultivation, pastoral, agro-pastoral, rainfed agriculture, sub-agriculture zones with high out-migration, irrigated cash cropping, the Lake Chad region, and the irrigated rice region (FEWS NET, 2005).

34
averages 2.9 percent per annum – the sustainable management of productive natural
resources, particularly land and water, has become essential to Niger’s agricultural growth
and rural poverty reduction.
Figure 8: Administrative Regions and Agro-ecological Zones
38. Millet and sorghum are the main staple food crops in Niger. The main grains
cultivated are millet, sorghum, rice, fonio27, and maize, with cash crops including cowpeas,
peanuts, cotton, sesame, vouandzou, and souchet.28 Millet is by far the dominant staple
food crop in Niger and is grown in almost every agro-ecological zone, accounting for 76
percent of total cereal production and 72 percent of net availability between 2000 and
2005. Sorghum, which is less drought-resistant than millet, is grown primarily in the
southern regions of Niger; it accounted for 22 percent of cereal production and 20 percent
of net availability during the same period. Rice production accounted for only 2 percent of
total net availability of cereals and is grown primarily in the Niger River basin. The regions of
27
Fonio is a cereal. 28
Vouandzou is a legume (also known as Bambara groundnut) that requires 500 millimeters of rainfall, and is therefore well-suited to the southern Sahelian and northern Sudanian zones of West and Central Africa. Souchet is a type of tuber known as Cyperus esculentus or Chufa Sedge.

35
Maradi and Zinder are considered to be the “bread baskets” of Niger, accounting for
approximately 40 percent of national millet production.
39. Per capita increases in production are the result of an expansion in cultivated land,
rather than higher yields.29 Although national cereal production increased by 48 percent
between 1985 and 2004 (from 1.8 million metric tons in 1985 to 2.7 million metric tons),
the increase was primarily extensive in nature; the total cultivated area increased by more
than 84 percent over the same period from 4.3 million hectares to over 7 million hectares
(Table 14). Cereal yields remained fairly stable over this period, averaging 372 kilogram per
hectare, which is two and a half times lower than other West African with comparable
conditions. These relatively low cereal yields are related to low rates of technological
adoption, the use of rainfed agriculture, and the frequency of natural shocks. These, in turn,
are affected by limited agricultural research and extension projects.
40. The onion and cowpea sub-sectors offer the best growth potential for exports. The
World Bank’s Agro-Pastoral Export Promotion Project identified five priority sub-sectors in
agriculture: onions, cowpeas, sesame, souchet, and gum arabic. Onions are produced around
the vast periodic watercourses (broad dry river beds) that cross much of south-central Niger
and account for 50 percent of the value of the exports of these five sub-sectors. Niger is also
a major producer of cowpeas, which have replaced groundnuts as a cash crop for rural
households. As is the case with staple food crops, the increase in cowpea production over
the past two decades has occurred largely because of an expansion of the area being
cultivated. As per capita cowpea consumption is fairly modest (6 kilograms per capita), 50
to 75 percent of Niger’s cowpea production is exported to Nigeria, mostly on an informal
basis. The potential for higher yields and exports for these crops is constrained by a lack of
storage facilities and practices, marketing channels (especially access to market
information), and improved agricultural techniques.
29
Production shocks are defined as years when per capita cereal production within a given department decline by more than 25 percent compared to the six-year average.

36
41. Niger’s livestock herd and exports are among the largest in West Africa. Despite an
austere natural environment characterized by low rainfall, Niger’s agro-pastoral space is
vast and diversified. Niger’s livestock herd, estimated at 28 million head in 2006 (7.3 million
heads of cattle, 9.2 million sheep, and 11.2 million goats), is the largest in West Africa.
Livestock exports to Nigeria account for more than 90 percent of overall livestock exports,
although little meat is exported from Niger. Major constraints to increasing herd sizes and
increasing productivity include limited veterinary and other inputs, a feed balance deficit,
and limited availability of agricultural and industrial by-products. However, there are
substantial opportunities for increasing the value of livestock exports and meat exports to
coastal countries, primarily Nigeria, Ghana, and Ivory Coast.
Table 14: Millet and Sorghum Production in Niger, 1985-2004
Year Population Cultivated Areas (ha)
Production (Metric Tons)
Area per Capita
Production per capita
1985 6,565,000 4,310,931 1,774,113 0.7 270
1986 6,783,000 4,348,597 1,743,559 0.6 257
1987 7,008,000 4,359,029 1,362,777 0.6 194
1988 7,240,000 4,995,768 2,326,505 0.7 321
1989 7,480,000 5,094,042 1,754,605 0.7 235
Average (85-89) 4,621,673 1,792,312 0.7 256
1990 7,728,000 6,942,899 2,045,960 0.9 265
1991 7,967,568 6,456,771 2,314,991 0.8 291
1992 8,214,563 7,519,314 2,171,693 0.9 264
1993 8,469,214 6,099,128 1,714,310 0.7 202
1994 8,731,760 6,950,251 2,368,538 0.8 271
Average (90-94) 6,793,673 2,123,098 0.8 259
1995 9,002,444 7,164,356 2,034,983 0.8 226
1996 9,286,395 7,138,358 2,172,213 0.8 234
1997 9,574,274 6,386,922 1,641,530 0.7 171
1998 9,871,071 7,607,398 2,894,013 0.8 293
1999 10,177,080 7,449,871 2,772,346 0.7 272
Average (95-99) 7,149,381 2,303,017 0.7 239
2000 10,492,569 7,306,951 2,049,890 0.7 195
2001 11,060,291 7,835,456 3,022,350 0.7 273
2002 11,403,160 7,816,590 3,236,927 0.7 284
2003 11,756,658 8,041,222 3,502,464 0.7 298
2004 12,121,114 7,823,260 2,637,242 0.6 218
Average (00-04) 7,764,696 2,889,775 0.7 254
Average (80-04) 6,085,875 2,128,794 0.72 253
Sources: Production statistics from the Ministry of Agriculture, various years, and WFP (2005b).

37
42. Over the past 22 years, climatic shocks – primarily droughts – have resulted in high
regional and annual fluctuations in staple food crop production. Between 1990 and 2004,
the years of lowest cereal production were 1993, 1997, 2000, and 2004, all of which
coincided with natural shocks (droughts). The high degree of year to year variation in cereal
production is evident when looking at the coefficient of variation (CV).30 The average
coefficient of variation for national millet and sorghum production is 0.20 and 0.35
respectively, with an inter-crop correlation coefficient of 0.91.31 In general, sorghum
production is more variable than millet production, as the most common varieties of
sorghum are of longer duration and less drought-tolerant than millet. Beyond the national-
level variation, there is also significant geographical variation in millet production, as is
evident when assessing the CVs by department. CVs range from 0.11 in the Magaria
department (Zinder) to 0.75 in the Tillaberi department. Overall, the regions of Maradi and
Zinder have the lowest CVs, while the regions of Tillaberi and Tahoua have the highest CVs.
This suggests that rural households in Tillaberi and Tahoua are exposed to higher
production risk than those in other departments.
43. Department-level variations in staple food crop production – as opposed to
national-level production variations – are an important component of grain market
performance and, hence, food prices, which affect households’ access to food. The
geographical distribution of drought and production shocks varies substantially between
drought and non-drought years. In 2000, a severe drought resulted in national production
that was 21 percent lower than the 10-year average. During that year, only 15 percent of
the departments experienced a per capita decrease of more than 50 percent. In 2004, a
drought also contributed to a serious reduction in Niger’s staple food crop production, with
cereal production 12 percent lower than the 10-year average. Although national cereal
30
The CV is calculated as the ratio of the standard deviation of cereal production to the mean of cereal production over the time period. 31
The CVs for millet and sorghum in Nigeria, which has a higher annual average rainfall than Niger, are only 0.16 and 0.10 respectively. Production in Niger and in Nigeria is correlated to a limited extent, with correlation coefficients of 0.43 for millet and 0.51 for sorghum respectively (Dorosh 2008 a).
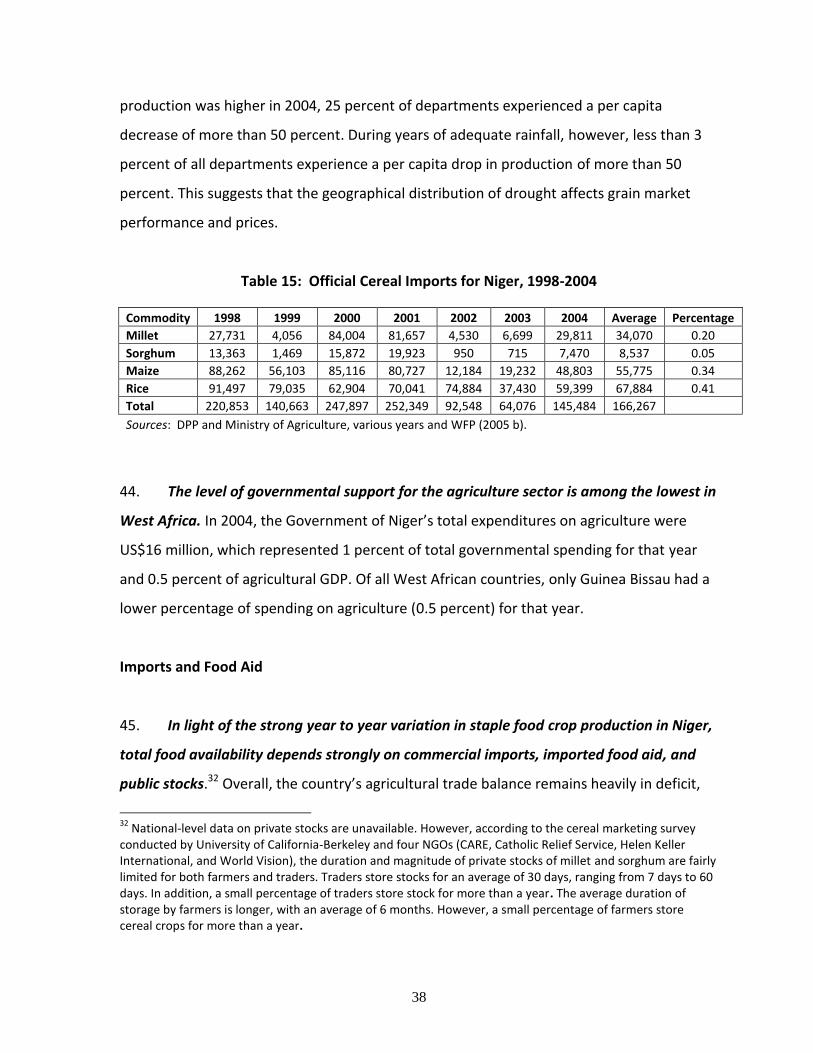
38
production was higher in 2004, 25 percent of departments experienced a per capita
decrease of more than 50 percent. During years of adequate rainfall, however, less than 3
percent of all departments experience a per capita drop in production of more than 50
percent. This suggests that the geographical distribution of drought affects grain market
performance and prices.
Table 15: Official Cereal Imports for Niger, 1998-2004
Commodity 1998 1999 2000 2001 2002 2003 2004 Average Percentage
Millet 27,731 4,056 84,004 81,657 4,530 6,699 29,811 34,070 0.20
Sorghum 13,363 1,469 15,872 19,923 950 715 7,470 8,537 0.05
Maize 88,262 56,103 85,116 80,727 12,184 19,232 48,803 55,775 0.34
Rice 91,497 79,035 62,904 70,041 74,884 37,430 59,399 67,884 0.41
Total 220,853 140,663 247,897 252,349 92,548 64,076 145,484 166,267
Sources: DPP and Ministry of Agriculture, various years and WFP (2005 b).
44. The level of governmental support for the agriculture sector is among the lowest in
West Africa. In 2004, the Government of Niger’s total expenditures on agriculture were
US$16 million, which represented 1 percent of total governmental spending for that year
and 0.5 percent of agricultural GDP. Of all West African countries, only Guinea Bissau had a
lower percentage of spending on agriculture (0.5 percent) for that year.
Imports and Food Aid
45. In light of the strong year to year variation in staple food crop production in Niger,
total food availability depends strongly on commercial imports, imported food aid, and
public stocks.32 Overall, the country’s agricultural trade balance remains heavily in deficit,
32
National-level data on private stocks are unavailable. However, according to the cereal marketing survey conducted by University of California-Berkeley and four NGOs (CARE, Catholic Relief Service, Helen Keller International, and World Vision), the duration and magnitude of private stocks of millet and sorghum are fairly limited for both farmers and traders. Traders store stocks for an average of 30 days, ranging from 7 days to 60 days. In addition, a small percentage of traders store stock for more than a year. The average duration of storage by farmers is longer, with an average of 6 months. However, a small percentage of farmers store cereal crops for more than a year.

39
and imports of foodstuffs represent one-third of the country’s import bill. However, data on
cereal imports and exports in Niger are highly unreliable, due in part to the informal trade
that occurs between Niger and its neighbors Benin, Burkina Faso, Chad, Mali, and Nigeria
(Table 15). Nevertheless, existing data indicate strong year to year fluctuations in cereal
imports.33 Official cereal imports averaged 166,000 metric tons between 1998 and 2004,
with rice and maize representing the highest percentage of total cereal imports. Official
millet imports averaged 34,000 metric tons between 2000 and 2005, representing
approximately 1 percent of total millet availability (Table 16). Millet and sorghum imports
through official channels increased dramatically in 1997/1998, 2000/2001, and 2001/2002,
which coincided with drought years. Nevertheless, official import data suggest that cereal
imports were lower than expected during the first half of the 2004/2005 marketing season.
33
These figures are provided by calendar year rather than by marketing year, which is most useful for the analysis of cereal availability.

40
Table 16: Niger - Cereal Production and Availability, 1990-2005
Average Quantity (thousand tons) Coefficient of variation
1990-1994 1995-1999 2000-2005 1990-2005 1990-2005
Production 2,238 2,363 3,075 2,591 0.23
Millet 1,803 1,914 2,339 2,038 0.20
Sorghum 363 388 661 482 0.40
Maize 1 3 4 3 0.64
Rice 72 57 71 67 0.14
Imports 247 173 181 199 0.21
Millet 47 31 15 30 0.56
Sorghum 15 5 2 7 1.17
Maize 76 56 51 60 0.31
Rice 41 37 42 40 0.26
Wheat 69 44 71 62 0.25
Net Supply 2,149 2,181 2,794 2,401 0.20
Millet 1,579 1,657 2,003 1,762 0.19
Sorghum 323 335 563 417 0.39
Maize 77 59 55 63 0.30
Rice 101 86 102 97 0.15
Wheat 69 44 71 62 0.25
Net Supply/capita (kgs) 263 224 237 241 0.14
Millet 193 170 170 177 0.14
Sorghum 40 34 47 41 0.26
Maize 9 6 5 7 0.40
Rice 12 9 9 10 0.23
Wheat 8 4 6 6 0.30
Net Imports/Supply 11.5% 8.1% 6.7% 8.7% 0.30
Millet 3.0% 1.9% 0.8% 1.8% 0.60
Sorghum 4.5% 1.6% 0.3% 2.0% 1.09
Maize 98.5% 94.6% 93.7% 95.5% 0.03
Rice 40.1% 42.5% 40.0% 40.8% 0.17
Wheat 100.0% 100.0% 100.0% 100.0% 0.00
Source: Calculated from FAO data. Notes: Net supply calculated as production minus assumed losses of 15 percent plus net imports.
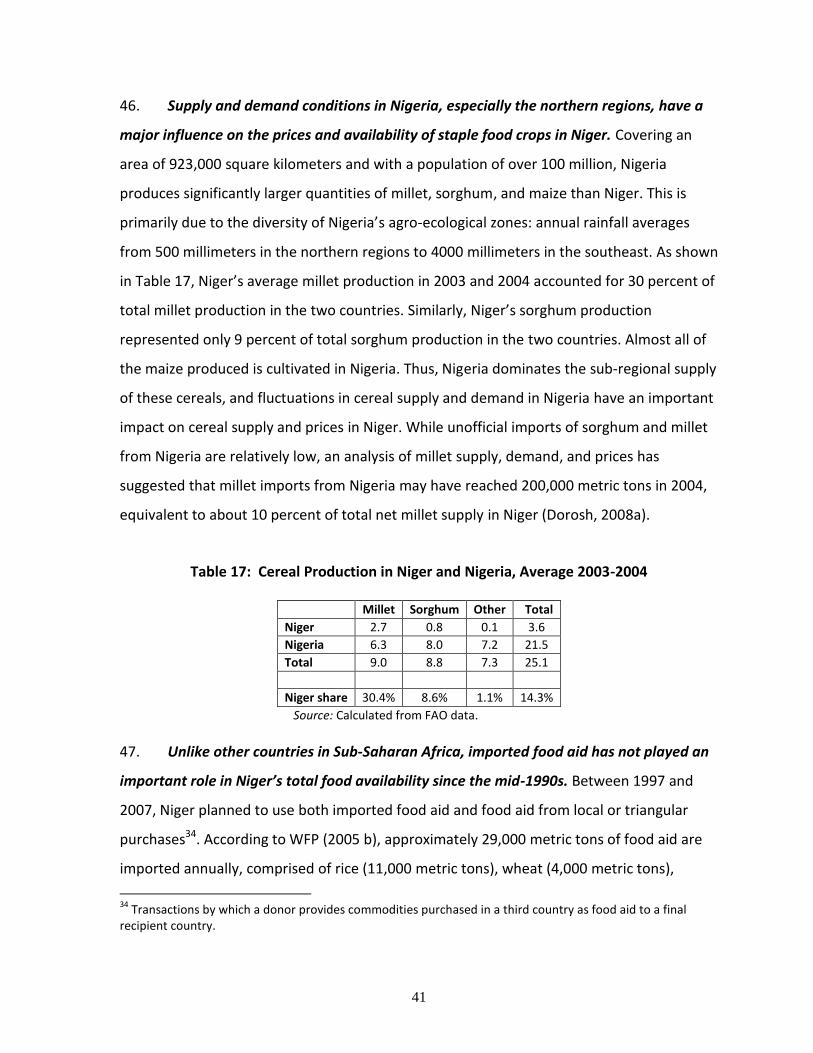
41
46. Supply and demand conditions in Nigeria, especially the northern regions, have a
major influence on the prices and availability of staple food crops in Niger. Covering an
area of 923,000 square kilometers and with a population of over 100 million, Nigeria
produces significantly larger quantities of millet, sorghum, and maize than Niger. This is
primarily due to the diversity of Nigeria’s agro-ecological zones: annual rainfall averages
from 500 millimeters in the northern regions to 4000 millimeters in the southeast. As shown
in Table 17, Niger’s average millet production in 2003 and 2004 accounted for 30 percent of
total millet production in the two countries. Similarly, Niger’s sorghum production
represented only 9 percent of total sorghum production in the two countries. Almost all of
the maize produced is cultivated in Nigeria. Thus, Nigeria dominates the sub-regional supply
of these cereals, and fluctuations in cereal supply and demand in Nigeria have an important
impact on cereal supply and prices in Niger. While unofficial imports of sorghum and millet
from Nigeria are relatively low, an analysis of millet supply, demand, and prices has
suggested that millet imports from Nigeria may have reached 200,000 metric tons in 2004,
equivalent to about 10 percent of total net millet supply in Niger (Dorosh, 2008a).
Table 17: Cereal Production in Niger and Nigeria, Average 2003-2004
Millet Sorghum Other Total
Niger 2.7 0.8 0.1 3.6
Nigeria 6.3 8.0 7.2 21.5
Total 9.0 8.8 7.3 25.1
Niger share 30.4% 8.6% 1.1% 14.3%
Source: Calculated from FAO data.
47. Unlike other countries in Sub-Saharan Africa, imported food aid has not played an
important role in Niger’s total food availability since the mid-1990s. Between 1997 and
2007, Niger planned to use both imported food aid and food aid from local or triangular
purchases34. According to WFP (2005 b), approximately 29,000 metric tons of food aid are
imported annually, comprised of rice (11,000 metric tons), wheat (4,000 metric tons),
34
Transactions by which a donor provides commodities purchased in a third country as food aid to a final recipient country.

42
cereals (14,000 metric tons), and other commodities such as vegetable oil and soy-fortified
bulgur wheat (SFSB). Using official import data, this suggests that food aid represents less
than 20 percent of total cereal imports and 1 percent of total cereal net availability. Overall,
emergency and development food aid programs are managed and executed by a variety of
governmental, non-governmental, and international organizations. Food aid programs
between 2000 and 2007 were implemented by NGOs, including Action Contre la Faim (ACF),
Africare, CARE, Catholic Relief Services (CRS), Helen Keller International (HKI), Concern
Worldwide, Médecins sans Frontières, and Plan-Niger; international organizations, including
UNICEF and the World Food Programme (WFP); and the Government of Niger, including the
Food Crisis Cell (Cellule de Crise Alimentaire or CCA), the National Body for the Prevention
and Management of Food Crises (Dispositif National de Prévention et de Gestion des Crises
Alimentaires or DNPGCA), and the Office of the Food Products of Niger (Office des Produits
Vivriers au Niger or OPVN).
48. Food aid in Niger is used for both direct distribution programs and for
monetization.35 Since the mid-1990s, food aid for distribution has been used in three types
of programs in Niger: emergency response, safety net, and food for work (FFW).36
Emergency response programs have typically been of short duration (for example, during
the year of the shock or the localized food crisis) and have included general distribution,
nutritional rehabilitation of children under the age of 5, and the subsidized sales of cereals.
Safety net programs have typically provided food aid to extremely vulnerable people, such
as the elderly, people living with HIV and AIDS (PLHAs), and orphans. Finally, FFW programs
35
Monetization is defined as “imported food aid sold commercially to local buyers in order to generate proceeds for longer-term development programs.” Between 2000 and 2007, the primary monetization programs were financed by USAID Title II and the US Department of Agriculture (USDA). During this period, four NGOs (including Africare, CARE, CRS, and HKI) imported rice and wheat for sale to local buyers, using the proceeds to implement multi-year agriculture and health programs in Agadez, Dosso, Tahoua, Tillaberi, and Zinder. These imports have averaged 3,000 metric tons of rice and 5,000 metric tons of wheat on an annual basis. 36
There has also been a relatively small school feeding program in Niger for nomadic populations since 2000/2001. However, its geographic coverage has been limited, starting with 250 schools in 2001 and rising only to 500 schools by 2005.

43
have provided food aid to communities during the hungry season in return for their labor on
a community-based infrastructure project, such as health centers, demi-lunes in community
pastures for soil restoration, or farm-to-market roads. FFW projects have typically been
multi-year projects that have been one part of larger sectoral programs, although they have
also been used as part of emergency response efforts during drought years.37 In a few
cases, safety net programs and nutrition recuperation programs have also existed on a
multi-year basis. The sale of staple cereals at subsidized prices has been primarily executed
by the Government of Niger (via the OPVN and the CCA) using locally purchased
commodities (see Chapter 4).
AGRO-FOOD MARKETS AND PRICES
Market Structure
49. The performance of agro-food markets affect households’ economic access to food
products. In light of the importance of staple cereals (millet and sorghum) for producers’
and consumers’ welfare, the structure, conduct, and performance of food production and
marketing has important implications for food security in the country. Staple food crops
(millet, sorghum, cowpeas, and rice) are traded through an extensive system of traditional
markets, which run the length of the country.38 Figure 9 shows the location of key grain
markets in the country. Cereal markets in Niger are classified into four categories depending
upon their primary role and geographic location: (i) collection; (ii) consumer; (iii) wholesale;
and (iv) cross-border. The average distance between these markets is 350 kilometers, but
distances between the markets in which trade takes place ranges from 10 to 900
kilometers. While the density of grain markets varies considerably by department, market
37
During previous drought years, some NGOs also implemented emergency FFW projects in targeted villages. In these cases, food aid was provided during the hungry season for one year only to households who constructed community-based infrastructure, such as a road or a well. 38
According to a census of grain markets conducted in 2006 and 2007, there are over 2,000 grain markets in the country. The number of traders per market ranges from 38 to over 350 (Aker, 2007).

44
density appears to be evenly distributed throughout the country, although there are very
few markets in the northern pastoral zones (Agadez, northern Tahoua, and Diffa).
Figure 9: Key Grain Markets in Niger
50. A variety of market actors are involved in moving cereals from producers to
consumers. These include: (i) farmers, who produce, sell, and buy millet, sorghum, and
cowpeas; (ii) traders, including retailers, intermediaries, semi-wholesalers, and wholesalers;
(iii) transporters, who are responsible for moving goods via truck, car, or boat; (iv) rural and
urban consumers, who purchase the final goods in rural or urban markets; and (v) state
structures, such as OPVN and the CCA. Cereals are first produced by farmers, who sell their
production directly to intermediaries located in the village or in the market. The
intermediaries in turn sell directly to semi-wholesalers and wholesalers in local retail or
wholesale markets. These wholesalers sell to other traders, such as wholesalers located in
other markets or retailers located in the same market. Wholesalers can also sell to
consumers directly, although usually do not sell in small quantities (for example, in bags of
less than 100 kilograms). Retailers in turn sell directly to both urban and rural consumers.
Retailers represent the highest percentage of all traders (57 percent) in the market,

45
followed by wholesalers (16 percent), semi-wholesalers (15 percent), and intermediaries
(10 percent) (Aker, 2007).
Government Agro-Food Policies
51. The role played by the Government of Niger in cereal production and marketing
has been significantly reduced since the 1990s. In the two decades following independence
(1960), the Government of Niger was involved in all aspects of cereal production and
marketing. During this time, the OPVN was established in order to manage the purchase
and sales of staple cereals (millet and sorghum) and functioned as a state-owned monopoly
until 1984. With the implementation of the government's Structural Adjustment Program
(SAP) in the 1990s, however, the Nigerien cereal market became increasingly liberalized. By
the mid-1990s, the OPVN’s role was reduced to monitoring the food security situation
within the country and managing the country’s strategic grain reserves. These reforms had
important implications for the functioning of Niger’s agro-food sector, particularly in terms
of pricing, marketing, and agricultural development and investment (Terpend, 2006).
Between 2000 and 2004, the OPVN was responsible for distributing subsidized food to the
population, including vulnerable groups.
52. In contrast with the pricing support policies of the 1960s and 1970s, food prices in
Niger are now determined by market forces. Domestic cereal prices are influenced by a
host of factors, such as domestic supply and demand, commercial imports, import taxes and
tariffs, regional trade patterns, and market structure. Traders are free to import cereals and
export cowpeas and livestock, provided that they are registered and respect all trading and
tax procedures. However, depending upon the level of domestic cereal production in a

46
particular year, the government may regulate trade flows by limiting either exports or
imports of specific commodities.39
53. Trade tax regulations in Niger are officially aligned with the rules of the West
Africa Economic and Monetary Union (WAEMU in English or UEMOA in French40). The free
exchange of goods and services is permitted within and among West African countries.
Within the WAEMU, there are no official export taxes for local products traded among
member countries. Nevertheless, import and export tax regulations in Niger are integrated
into the rules of UEMOA. Customs duties still exist for imports of cereals originating from
countries outside of the UEMOA area, namely Nigeria and Ghana.41
Grain Prices and Market Integration
54. Millet and sorghum prices in Niger vary significantly from month to month and
from year to year. Table 18 shows average grain prices in Niger by region, and Figure 10
shows average monthly grain prices in Niger and in the sub-region (including Benin, Chad,
and Nigeria) between 1996 and 2006. High-production years in Niger were followed by
relatively lower prices (1998/1999, 1999/2000, and 2003/2004), and low-production years
are followed by relatively higher prices (1997/1998, 2000/2001, and 2004/2005). Grain
price levels in Niger closely follow those in Benin and northern Nigeria (Illela, Jibia, and Mai
Adua) but not those in Burkina Faso and Chad. In addition, the seasonal variation of millet
prices is also important. Millet prices range from 20 to 89 percent higher in August (the
39
While the free exchange of goods and services is permitted within and among West African countries (including between Niger and Nigeria), the Government of Niger may attempt to control cereal exports or imports in particular markets during low production years. Most traders interviewed during the 2005-2007 market survey (CARE International et al. 2007) believe that the exportation of millet and sorghum is prohibited. 40
The West African Economic and Monetary Union (WAEMU, or UEMOA in French) is an organization of 8 West African states, established to promote economic integration among countries that share the CFA franc as a common currency. 41
During the trader survey (Care International, CRS, HKI and WVI, 2007) in cross-border markets, specifically those in Nigeria, traders cited excessive official and unofficial import taxes on millet and sorghum as a constraint to marketing between the two countries.

47
hungry season) than in October (the harvest period), with an average intra-seasonal price
difference of 44 percent. Millet prices increased by 89 percent between October 2004 and
August 2005 and by 75 percent between October 2000 and August 2001.42 Markets are
therefore subject to relatively high price instability, which suggests that households and
traders are subject to high to inter- and intra-annual annual price risks.
Table 18: Average Grain Prices in Niger, Nigeria and Chad, 1996-2006 (CFA/kg)
Variable Obs 10-year mean Std. Dev.
Average Prices (CFA/kg) 120 145.98 40
Niger (Region)
Diffa 120 167.51 47.88
Dosso 120 151.58 40.33
Maradi 120 124.20 38.50
Niamey 120 143.36 30.90
Tahoua 120 155.99 42.39
Tillaberi 120 158.10 41.62
Zinder 120 129.02 41.82
1997/1998 Prices 12 173.25 33.35
2000/2001 Prices 12 160.76 36.89
2004/2005 Prices 12 194.10 53.40
Benin (Malanville) 81 127.17 39.07
Burkina Faso (Kantchari) 47 125.95 32.17
Chad 120 156.18 44.06
Nigeria 81 137.03 40.49
Source: SIMA. Note: Prices are deflated by the consumer price index.
55. Although grain markets in Niger are relatively integrated, this varies by
geographic region and by year. Staple food crop markets in Niger are somewhat
integrated, with an average correlation coefficient of 0.55 for all markets between 1996 and
2006. This is well below the price correlation coefficients that have been computed for
other agricultural products in the developing world (Timmer, 1974). Nevertheless, the
degree of market integration varies from year to year, with higher levels of integration
during low production years. The degree of integration between Niger’s markets and those 42
During non-drought years, prices increase by 10 and 20 percent between the harvest and hungry periods.

48
in its border countries (Benin, Burkina Faso, Chad, and Nigeria) follow the same pattern. On
average, the degree of market integration between Chad and Niger is small, averaging 0.25.
Similarly, the degree of integration between Burkina Faso and Niger is also quite limited,
averaging 0.47 between 1999 and 2006. The highest degree of integration occurs between
Niger, Benin, and Nigeria, with correlation coefficients averaging 0.65. On average, grain
markets in Niger are more integrated with Benin and Nigeria during drought years, with the
highest degree of integration having occurred during the year of the 2005 food crisis.
Figure 10: Grain Prices in Niger and Key Regional Markets, 1996-2006 (CFA/kg)
50
100
150
200
250
300
Oct
-96
Feb-9
7
Jun-
97
Oct
-97
Feb-9
8
Jun-
98
Oct
-98
Feb-9
9
Jun-
99
Oct
-99
Feb-0
0
Jun-
00
Oct
-00
Feb-0
1
Jun-
01
Oct
-01
Feb-0
2
Jun-
02
Oct
-02
Feb-0
3
Jun-
03
Oct
-03
Feb-0
4
Jun-
04
Oct
-04
Feb-0
5
Jun-
05
Oct
-05
Feb-0
6
Jun-
06
Pri
ce C
FA
/kg
Niger
Nigeria
Chad
Benin (Malanville)
Source: Aker (2007).
56. Grain prices in Niger respond to supply shocks, and price movements in surplus
regions within Niger and regional markets are useful for predicting grain price changes in
Niger (using Granger causality forecasting tests). Grain prices in Niger follow well-defined
paths: they start in production centers (such as Maradi and Zinder) and then spread across
the country. This means that grain prices in Niger respond to supply shocks (such as
droughts or locusts) rather than demand shocks. Figure 11 shows the percentage of times
that a market is useful for predicting price changes in other markets in Niger. The map
shows that markets located in surplus regions (the southern and eastern parts of the

49
country, such as Maradi, Zinder, and southern Dosso) are useful for predicting price changes
in other markets. In addition, the cross-border markets of Malanville (Benin) and Jibia, Illela,
and Mai-Adua (Nigeria) predict price changes in over 75 percent of the markets in Niger.43
Notably, price changes in the capital city, Niamey, are not useful for predicting price
changes in Niger. Overall, this means that prices in production regions can be useful in
predicting price changes in Niger. This also suggests that markets located in deficit regions –
primarily Tillaberi, Tahoua, and Diffa – follow price movements in other markets more
frequently rather than reflecting just local production.
57. In addition to supply shocks, grain market performance in Niger is partially
determined by access to information. The access that market actors (farmers and traders)
have to price information has an important impact on grain market performance in Niger.
Between 2001 and 2007, the introduction of cell phone towers throughout Niger enabled
traders to search for price information over a larger number of markets, allowing them to
move commodities to markets with excess demand. This, in turn, reduced grain price
dispersion between markets and lowered average grain prices (Aker, 2008).
58. Niger needs to import grain, but arbitrage opportunities for imports vary both
between and within years. During most years, import parity prices for cereals (millet and
sorghum) from northern Nigeria (Illela, Jibia, and Mai Adua) are typically higher than
domestic millet prices from October until May, meaning that there are no incentives to
import (Figure 12). This pattern changes between June and August when domestic prices in
Niger are higher than import parity prices, implying that there are positive spatial arbitrage
opportunities. During this period – which coincides with the hungry season in Niger –
43
Kano, an important grain market located in northern Nigeria, does not appear to be useful in forecasting millet prices in a significant number of markets in Niger as it only “predicts” price changes in 29 percent of markets. However, price data for Kano are only available for 2003-2007, a relatively short time series for forecasting tests.

50
traders typically import grain from Nigeria.44 This pattern was markedly different during the
2004/2005 marketing season.
Figure 11: Key Forecasting Markets for Niger
Figure 12: Comparison of Millet Prices in Niger and Nigeria
-20
-15
-10
-5
0
5
10
15
20
Oct-Jan Feb-May June-Aug
Dif
fere
nce
nce
in
Im
port
Pari
t an
d D
om
esti
c P
rice
s fo
r M
ille
t, C
FA
/kg
2000-2006 2000/2001 2004/2005
44
In Niger’s trade with Burkina Faso and Benin, net marketing margins are consistently positive, and there are few intra- and inter-annual fluctuations.
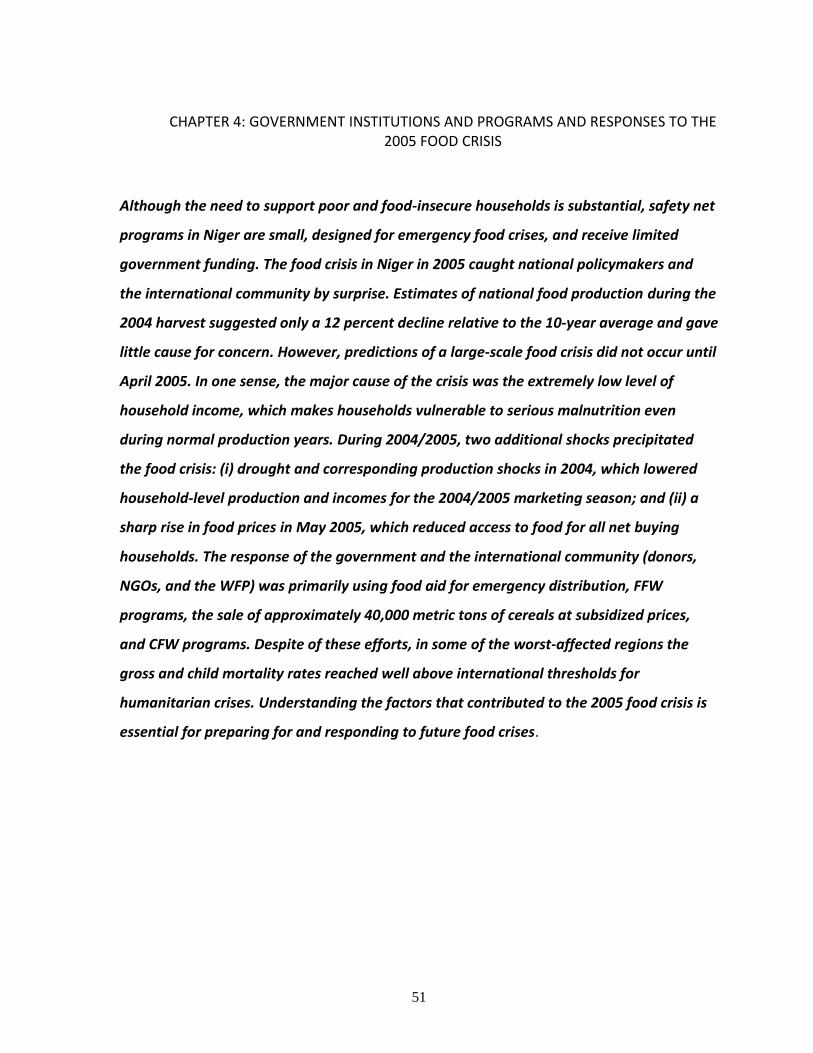
51
CHAPTER 4: GOVERNMENT INSTITUTIONS AND PROGRAMS AND RESPONSES TO THE 2005 FOOD CRISIS
Although the need to support poor and food-insecure households is substantial, safety net
programs in Niger are small, designed for emergency food crises, and receive limited
government funding. The food crisis in Niger in 2005 caught national policymakers and
the international community by surprise. Estimates of national food production during the
2004 harvest suggested only a 12 percent decline relative to the 10-year average and gave
little cause for concern. However, predictions of a large-scale food crisis did not occur until
April 2005. In one sense, the major cause of the crisis was the extremely low level of
household income, which makes households vulnerable to serious malnutrition even
during normal production years. During 2004/2005, two additional shocks precipitated
the food crisis: (i) drought and corresponding production shocks in 2004, which lowered
household-level production and incomes for the 2004/2005 marketing season; and (ii) a
sharp rise in food prices in May 2005, which reduced access to food for all net buying
households. The response of the government and the international community (donors,
NGOs, and the WFP) was primarily using food aid for emergency distribution, FFW
programs, the sale of approximately 40,000 metric tons of cereals at subsidized prices,
and CFW programs. Despite of these efforts, in some of the worst-affected regions the
gross and child mortality rates reached well above international thresholds for
humanitarian crises. Understanding the factors that contributed to the 2005 food crisis is
essential for preparing for and responding to future food crises.

52
INSTITUTIONAL MECHANISMS FOR RESPONDING TO FOOD CRISES
59. Since the Sahelian famines of the 1970s, a variety of governmental and non-
governmental institutions have been established to prepare for and respond to food crises
in Niger. The Office of the Food Products of Niger (Office des Produits Vivriers du Niger or
OPVN) was established in order to manage the purchase and sale of staple cereals (millet
and sorghum) in the country. Between 1990 and 1998, the OPVN focused on monitoring the
food security situation and managing the country’s strategic grain reserves (defined as the
stocks held at the end of the calendar year). During this time, Niger also drastically reduced
its strategic grain reserves, previously an important part of the country’s emergency
response strategy. In 1992, for example, Niger’s strategic grain reserves consisted of 85,000
metric tons but this had fallen to 12,000 metric tons by 1998. Since 2000, the OPVN’s
strategic grain reserves have averaged 27,000 metric tons.

53
Figure 13: Quantities of Food Aid Obtained and Distributed by the OPVN and the CCA during 2001-2007
0
20,000
40,000
60,000
80,000
100,000
120,000
140,000
2001 2002 2003 2004 2005 2006 2007 2008
0
20,000
40,000
60,000
80,000
100,000
120,000
Sources Utilization End Stocks OPVN End Stocks (OPVN+CCA)
Notes: “Sources” refer to the total quantity of food aid obtained (as foreign aid or other sources) by the OPVN and the CCA during a particular year. “Utilization” refers to the total quantity of food aid distributed by both agencies. End stocks are the quantities of food aid remaining at the end of the fiscal year.
In 1998, the government created a new structure for managing food crises, the National
Body for the Prevention and Management of Food Crises (Dispositif National de la
Prévention et la Gestion des Crises Alimentaires or DNPGCA). The objective of this new
structure was to reduce food insecurity by ensuring better coordination among the various
organizations. The DNPGCA, overseen by a National Consultation Committee (Commission
Mixte de Concertation or CMC) is responsible for overseeing and coordinating: (i) the
interventions related to the country’s strategic grain reserves and (ii) donor funds provided
to governmental institutions. Under the broader umbrella of the CMC, the four local
government structures involved in the preparation of and response to food crises are: (i)
the Food Crisis Cell (Cellule de Crises Alimentaires or CCA), which is primarily responsible for
decision-making with respect to food crises; (ii) the Early Warning System (Système d’Alerte

54
Précoce or SAP), which is responsible for collecting and analyzing data on food insecurity at
the local level; (iii) the OPVN, which is responsible for managing the country’s strategic grain
reserves; and (iv) the Agricultural Market Information System (Système d’Informations sur le
Marché Agricole or SIMA), which are local market information systems for agriculture and
livestock (see Box 4).
60. In addition to the DNPGCA, there are a number of non-governmental and
international actors involved in the prevention of and response to food crises. These
include non-governmental organizations (such as Africare, Catholic Relief Services, CARE,
and World Vision International), international bodies (the WFP, the Food and Agricultural
Organization, and UNICEF), regional structures (such as the Permanent Inter-state
Committee for the Fight Against Drought in the Sahel or CILSS), and donors (such as the
European Union and USAID’s Famine Early Warning Systems Network or FEWS NET). These
institutions are all involved in the prevention, preparation, and management of responses
to food crises. These organizations collaborate with the government in establishing famine
early warning systems, executing activities to mitigate the effect of food crises, and
responding to food crises once they occur.

55
Box 4: National Mechanism for the Prevention and Management of Food Crises in Niger:
the Dispositif National de Prévention et de Gestion des Crises Alimentaires (DNPGCA)
Since 1998, Niger’s government and major food aid donors have managed a National Mechanism for the Prevention and Management of Food Crises in Niger (Dispositif National de Prévention et de Gestion des Crises Alimentaires or DNPGCA). Its primary missions are: (i) to help the government to build up cereal and financial reserves to be used as food aid during crises and (ii) to implement actions supporting the population during food crises. Management: The DNPGCA is managed by the National Consultation Committee (CMC) of donors, which is responsible for: (i) defining the DNPGCA’s operational goals and (ii) handling the programming, coordination, and management of the resources allocated to prevent and mitigate food insecurity. The Prime Minister and his office represent the government on the CMC. The technical and financial partners (PTF) consist of 12 members including five from the EU (Germany, Belgium, France, Italy, and the European Commission); one from Europe outside the EU (the Swiss Confederation); two from outside Europe (Canada and the United States); and four United Nations bodies (UNDP, the WFP, the FAO, and UNICEF). A framework agreement, signed by the government and all 12 partners in 2005, defines the methods of operation for the DPNGCA and the mechanism for using its resources. The CMC meets once a year to assess the status of the previous food security campaign and to outline the major lines for intervention for the coming year. It is supported by a Special Advisory Committee (Comité Restreint de Concertation or CRC). This is a technical organization with representation from the Prime Minister's cabinet and from the TFPs that negotiates and approves programs (unanimously), authorizes expenditures and manages the available funds, assesses the operations that have been implemented, and monitors the CMC's actions. DNPGCA Tools: The DNPGCA has two tools:
1. The National Reserve Stock (Stock National de Réserve or SNR): The SNR is used only in years of national or regional crisis to implement a rapid response while awaiting the mobilization of international humanitarian and national solidarity aid. The SNR’s optimal volume is 110,000 tons of cereals. The SNR is composed of: The National Food Security Stock (Stock National de Sécurité or SNS): A physical stock of 80,000 tons of cereals (millet, sorghum, maize, and rice) stored in the warehouses of the OPVN. This stock is used to avoid the development of speculation that can result from implementing subsidized sales. The Food Security Fund (Fonds de Sécurité Alimentaire or FSA): A financial reserve to purchase 30,000 tons of cereals in case of a major crisis and low national stocks. Purchase decisions are governed by a common agreement between the government and its partners and entrusted to the OPVN, which receives a lump sum remuneration of 10,000 FCFA per ton.
2. The Common Donor Common Fund (Fonds Commun des Donateurs or FCD): This fund is the first level of resources that can be used to finance actions responding to small food crises. This fund primarily finances actions for the prevention and moderation of crises (such as cereal banks, cash for work for soil reconstitution, subsidized cereal sales, and the targeted free distribution of cereals).

56
Primary DNPGCA Bodies: Aside from the CRC, the other bodies are:
The Food Crisis Unit (Cellule de Crises Alimentaires or CCA): This is the executive body of the DNPGCA and is responsible for the implementation and monitoring of the programs retained by the CMC. The CCA (created in 1998) is primarily responsible for (i) ensuring the proper coordination of assistance programs; (ii) ensuring the proper operation of the DNPGCA; (iii) assessing food aid needs; and (iv) keeping records of food aid received and actions implemented to moderate crises.
The Early Warning System Coordination Unit (Cellule de Coordination du Système d’Alerte Précoce or SAP): SAP is responsible for collecting and processing information from various information systems such as SIMAgricole, SIMBetail, and the Enquête permanente d’estimation des récoltes (EPER), an agriculture production survey. Additionally, SAP monitors vulnerable areas on a monthly basis.
The Office of the Food Products of Niger (Office des Produits Vivriers du Niger or OPVN): This is responsible for the storage and management of the National Reserve Stock and for the logistical management of food aid (the distribution and the commercialization of food aid, and the management of stocks).
The Information Center: Attached to the Prime Minister's Cabinet, this is the distribution and communication body for the DNPGCA.
Sources: Government of Niger and its FTPs.
Early Warning Systems
61. A variety of local, regional, and international famine early warning systems exist in
Niger to collect, analyze, and disseminate information about possible food crises. These
include the government’s early warning system (SAP) and its Agricultural Market
Information System (Système d’Informations sur le Marché Agricole or SIMA); the USAID-
funded famine early warning system network (FEWS NET); international organizations, such
as the WFP, UNICEF, and various community-based early warning systems established by
international NGOs; and the Permanent Inter-state Committee for the Fight Against
Drought in the Sahel (CILSS). In general, these systems use rainfall data, agricultural
production, remote sensing, and market information (in other words, prices) to generate
predictions about the food security situation in the country.

57
62. Despite significant effort and the availability of climatic, production, price, and
food security data, these national, regional, and international early warning systems were
unable to predict in an accurate and timely manner the magnitude, scope, and location of
the food crisis in 2005. While some institutions warned of a food crisis in drought-affected
regions as early as December 2004, these predictions were based primarily on data on
drought and production shocks. In addition, even though the most vulnerable regions were
identified in 2005, this process was not without problems because of two key factors:45
Different conceptions of food insecurity and vulnerability. In general, each
organization – even among the early warning systems – uses its own framework
for defining food security and vulnerability. While there is considerable overlap
among these frameworks, there is no common understanding of these concepts
among the different actors. Consequently, developing common and transparent
early warning indicators is difficult.
Early warning system indicators exist, but there are no thresholds to trigger
action. Unlike malnutrition data – where there are clear thresholds for a crisis –
there are no thresholds for the drought, production, or price data. Although
considerable data are available in Niger – and the early warning system
organizations (CCA, SAP, SIMA, and FEWS NET) do an excellent job of analyzing
these data – the analyses focus on production and price trends, rather than
threshold levels to trigger a crisis. Such thresholds are required in order to
determine whether a crisis will occur.
45
Government of Niger, Prime Minister’s Office, EC, SAP/CG. Situation Alimentaire dans les Zones Vulnérables (May 2005).

58
CAUSES OF THE 2005 FOOD CRISIS
63. In 2004, Niger experienced a severe drought that contributed to a 12 percent
reduction in cereal production relative to average production over the previous 10 years.
Between January and June 2005, millet prices rose to a level that was 25 percent higher
than the 10-year average, with the price of a 100 kilogram sack of grain representing
approximately 37 percent of national per capita income during the height of the food crisis.
By June 2005, an estimated 2.4 million Nigeriens were affected by severe food shortages,
with more than 800,000 of these classified as critically food-insecure (FEWS NET, 2005).
Although the 2005 food crisis was not of the scale of the 1968-74 or 1983-84 famines, the
gross mortality rate reached 1.5 deaths per 10,000 per day in targeted regions, with a child
mortality rate of 4.1 deaths per 10,000 per day (Médecins sans Frontières, 2005) (see Box
5). Both of these are above the threshold mortality rates used to define a humanitarian
crisis.46
46
The crude mortality rate used to define a humanitarian crisis is one death per 10,000 people per day.

59
Box 5: History of Food Crises in Niger
During the first post-colonial decade, Niger succeeded in becoming food self sufficient due to low demographic growth rates, high rainfall, and acceptable crop yields from rudimentary agricultural systems. Until the mid-1960s, the cereal balance sheets were in excess: a cereal surplus of 49 kilogram per person per year was recorded between 1960 and 1965. However, by the late 1960s, the country registered an important food shortage during the agricultural season of 1968-1969. In 1972 and 1973, food production dropped dramatically. The food shortage was estimated at about 400,000 tons in 1973. The main causes of these food crises were the lack of valorization of marketable agro-pastoral products, fiscal pressure, and the decline in cash crops. All of these factors combined with the effects of harsh climatic conditions resulted in the most serious food crisis that the country had faced since its independence. During the 1976-1982 period, conditions were favorable (substantial uranium revenues, fiscal deficit reduction with the suppression of capitation taxes, increase in support to farmers, and favorable climatic conditions). Between 1975 and 1982, uranium replaced peanuts in terms of foreign currency injections into the development of the public sector. From 1982, the state disengaged from the market and production sectors. Producers were made responsible through sale and production co-operatives, and seeds and pesticide subsidies were eliminated. In 1983-1984, the country faced a new food crisis as a result of the cumulative effects of the deterioration of climatic conditions, the structural adjustment policy, and the closing of the Niger-Nigeria border in 1983. Another food shortage comparable of that of 1973-83 took place due to a heavy drought. In 1984-1985, the Nigerien farmers, who had never known a stable, sustainable and good food situation, again faced a big crisis. The need for food aid was estimated at 410,000 tons (in addition to imports of 125,000 tons). In 1990-1991 and 1993-1994, Nigeriens also faced food shortages. The 1996-1997 crisis, which is still remembered in the Zarma (western part of Niger) and the Haoussa (central part of Niger) regions, resulted from the severe drought in August 1996. In 2001, Niger was part of a trans-regional food crisis, which was particularly severe in many regions due to depletion of both farmers’ food stocks and national security food stocks (the national security stock dropped from 200,000 to 100,000 tons). Food was scarce in almost all regions. The price of a 100 kilogram bag of pearl millet reached CFA 25,000 in many regions of the country. Even neighboring countries such as Mali, Burkina Faso, and Nigeria were affected. Even though the 2004-2005 crisis was not as severe as that of 1973-1984, it exceeded that of 1996-1997. One of the consequences of food crises is the cumulative increase in cereal imports. Since 1973, the importing of staple food (millet and sorghum) has considerably increased, but it is rice that constitutes the major part of the imported products (more than 50 percent of cereal imports).

60
64. As is the case with chronic and seasonal food insecurity in Niger, the causes of the
2004/2005 food crisis are multiple and complex. Although rural households in Niger are
susceptible to a variety of risks, including droughts, floods, pest attacks, health epidemics,
and economic shocks, not all of these shocks result in food insecurity or food crises.
Whether or not the shock results in food insecurity depends on households’ assets, risks,
and risk management strategies. The inter-related factors that contributed to the food crisis
in 2004/2005 included production and marketing factors that had an impact on food
availability and market prices; the high level of poverty, low level of assets, and the limited
household’s income that limited access to food purchases; the population’s poor heath and
sanitation, and, ultimately, delays in the relief response.
Domestic and Regional Food Availability in 2004/2005: Drought, Production Shocks, and
Commercial Imports
65. The lower domestic food availabiliy was a result of widespresd regional drought
and market prices. The food production decline was certainly an important factor, but
staple food crop production was even lower in the 2000 drought year. Yet, according to the
local early warning systems, a severe food crisis did not occur in 2000/2001.47 Thus, it is
important to consider other factors that contributed to the 2005 food crisis. These include
the large number of departments affected by production shocks in 2004 (which dramatically
reduced farm household incomes in these areas); production shocks in key forecasting
markets in Niger and Nigeria; and increases in the quantities of food imported from
neighboring countries (especially Nigeria) due to unfavorable marketing conditions. More
specifically, the inter-related factors that contributed to the food crisis in 2004/2005 include
the following:
47
Although a severe food crisis did not occur in 2001, households did suffer from seasonal food insecurity during the hungry season (soudure) between May and August.

61
Factor #1: Drought contributed to a certain extent to the loss of production.
Between 1996 and 2006, Niger experienced droughts in 1996, 2000, and 2004, with
annual rainfall lower than one standard deviation from the mean (Nicholson et al,
2000). In 2000, 32 percent of departments experienced drought compared with 50
percent of departments in 2004. Nevertheless, staple food crop production was 10
percent higher in 2004 than in 2000. Total production of cereals (millet, sorghum,
fonio, and rice) was estimated at 2.05 million metric tons in 2000 (195 kilograms per
capita) compared with 2.63 million metric tons in 2004 (218 kilograms per capita).
This suggests that drought is not perfectly correlated with levels of per capita grain
production.48
Factor #2: A higher percentage of departments was affected by drought in 2004. In
2000, only 15 percent of the departments experienced a per capita decrease of
more than 50 percent. By contrast, in 2004, over 25 percent of departments
suffered a per capita decrease in grain production of more than 50 percent.49 This
means that the percentage of departments affected by production shocks – as
opposed to national-level production – has an effect on market performance, grain
prices, and food crises in Niger.
Factor #3: Key markets in both Niger and Nigeria were affected by drought in
2004.In addition to the percentage of markets affected by drought, which markets
are affected is also important. Since prices in Niger respond to supply shocks,
drought in surplus-producing regions (such as Maradi and Zinder) will have a larger
impact on price levels than drought in deficit regions (such as Tahoua and Tillaberi).
In 2004, the markets affected by drought were key surplus-producing markets.
48
There was no strong correlation between drought-affected and food crisis zones during the 2004/2005 marketing season. The correlation between food-insecure and drought-affected regions in 2004/2005 was 0.02. 49
During non-drought years, fewer than 3 percent of all departments experience a per capita decrease in grain production greater than 50 percent.
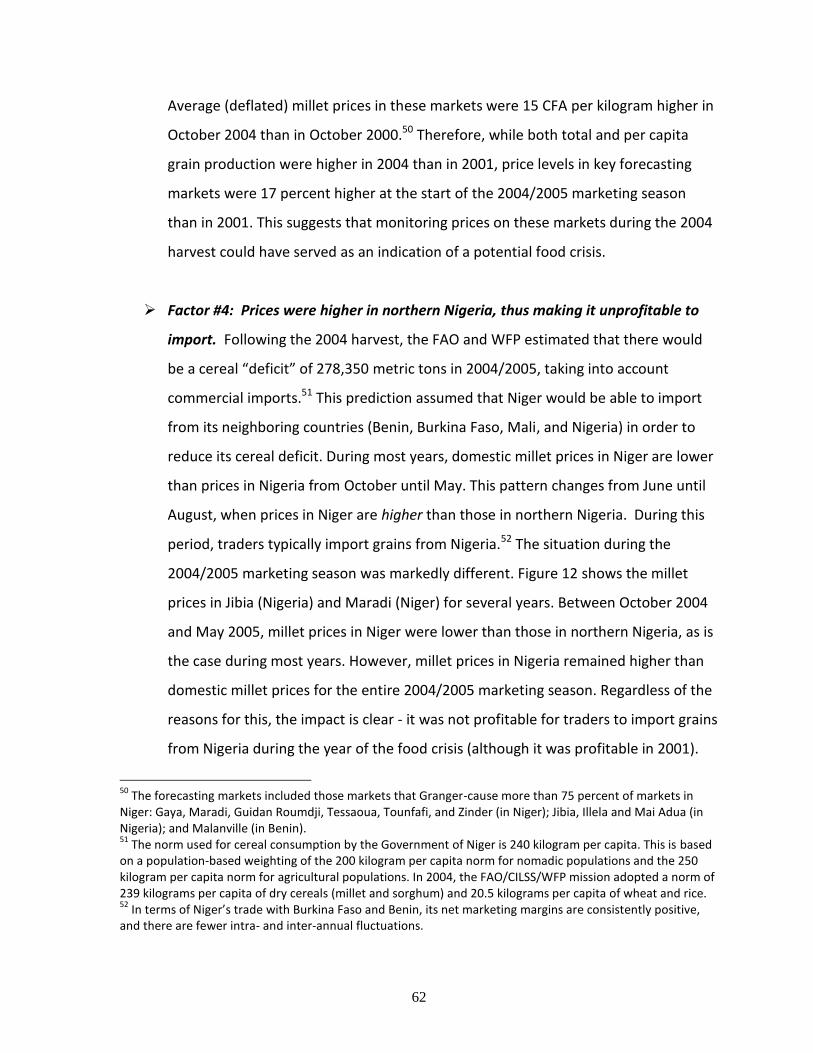
62
Average (deflated) millet prices in these markets were 15 CFA per kilogram higher in
October 2004 than in October 2000.50 Therefore, while both total and per capita
grain production were higher in 2004 than in 2001, price levels in key forecasting
markets were 17 percent higher at the start of the 2004/2005 marketing season
than in 2001. This suggests that monitoring prices on these markets during the 2004
harvest could have served as an indication of a potential food crisis.
Factor #4: Prices were higher in northern Nigeria, thus making it unprofitable to
import. Following the 2004 harvest, the FAO and WFP estimated that there would
be a cereal “deficit” of 278,350 metric tons in 2004/2005, taking into account
commercial imports.51 This prediction assumed that Niger would be able to import
from its neighboring countries (Benin, Burkina Faso, Mali, and Nigeria) in order to
reduce its cereal deficit. During most years, domestic millet prices in Niger are lower
than prices in Nigeria from October until May. This pattern changes from June until
August, when prices in Niger are higher than those in northern Nigeria. During this
period, traders typically import grains from Nigeria.52 The situation during the
2004/2005 marketing season was markedly different. Figure 12 shows the millet
prices in Jibia (Nigeria) and Maradi (Niger) for several years. Between October 2004
and May 2005, millet prices in Niger were lower than those in northern Nigeria, as is
the case during most years. However, millet prices in Nigeria remained higher than
domestic millet prices for the entire 2004/2005 marketing season. Regardless of the
reasons for this, the impact is clear - it was not profitable for traders to import grains
from Nigeria during the year of the food crisis (although it was profitable in 2001).
50
The forecasting markets included those markets that Granger-cause more than 75 percent of markets in Niger: Gaya, Maradi, Guidan Roumdji, Tessaoua, Tounfafi, and Zinder (in Niger); Jibia, Illela and Mai Adua (in Nigeria); and Malanville (in Benin). 51
The norm used for cereal consumption by the Government of Niger is 240 kilogram per capita. This is based on a population-based weighting of the 200 kilogram per capita norm for nomadic populations and the 250 kilogram per capita norm for agricultural populations. In 2004, the FAO/CILSS/WFP mission adopted a norm of 239 kilograms per capita of dry cereals (millet and sorghum) and 20.5 kilograms per capita of wheat and rice. 52
In terms of Niger’s trade with Burkina Faso and Benin, its net marketing margins are consistently positive, and there are fewer intra- and inter-annual fluctuations.

63
While prices in Benin and Burkina Faso were lower than those in Niger during 2005,
it is unclear whether sufficient quantities of grains could have been imported from
these countries.53
66. Simulations of the effects of the shortfall in Niger’s food production in 2004-05 on
market prices suggest that a decline in net imports was partly responsible for the huge
spike in millet prices. If there had been no change in net trade in cereals in unofficial
markets in 2004-05, the 26 percent decline in millet production in that year would have
resulted in an estimated 39 percent increase in the average real market price of millet
(Table 19).54 The actual real price increase in Maradi in the October 2004 -September 2005
crop marketing year was even larger ‒ 58 percent. This suggests that, in addition to the
production shortfall, net availability was further reduced by a reduction in net imports, a
conclusion which is consistent with interviews conducted with traders (Care International,
CRS, HKI and WVI, 2007). The normal flow of informal sector millet imports from Nigeria is
likely to be around 100,000 to 200,000 metric tons per year. The model simulations suggest
that net imports may have fallen by 200,000 tons (equivalent to 10 percent of net millet
supply or 1.98 million tons in 2003-04 and 15 percent of estimated net millet availability
from production only in 2004-05). In combination with the 26 percent drop in millet
production, a decline in net imports of this magnitude would have been enough to result in
an increase in real millet prices of 56 percent, very close to the actual price increase in
Maradi during this period.55
53
Although official import data is of dubious quality, there are several sources that suggest that the quantity of cereal imports fell dramatically during the first half of 2004/2005, particularly from Burkina Faso and Nigeria. WFP (2005 b) noted that the level of imports between October 2004 and June 2005 was 35 percent of the five-year average, 25,000 metric tons compared with 71,000 metric tons. This was not the case during the 2000/2001 marketing year. 54
Note that the model simulations take into account the effects of lower household incomes in that year, which reduced market demand for millet. 55
Because levels of net imports, demand parameters, and the extent of market integration are uncertain, these estimates can only provide a rough approximation of the effects of changes in production and net imports on market prices. See Dorosh (2008a) for sensitivity analysis regarding these assumptions.

64
Table 19: Simulated Price Effects of Production Shock and Net Imports, 2004/05
Source: Dorosh, 2008a.
Access in 2004/2005: Incomes, Grain Prices, and Cereal-Livestock Terms of Trade
67. The drought and subsequent production shock in 2004 not only reduced domestic
supply but also affected households’ purchasing power. The drought reduced households’
production of staple food and cash crops (such as cowpeas), thereby resulting in lower
household incomes for the 2004/2005 marketing year. In fact for the country as a whole, a
0.6 percent drop in real GDP (a proxy for the change in total household incomes) and a 3.3
percent increase in the population implied a 3.9 percent drop in per capita incomes in
2004/2005.
68. Grain price increases in 2004/05 were greater than during the 2000/01 drought,
suggesting a sharper decline in household access to food for net food purchasers. Average
grain prices in 2004/2005 were 25 percent higher than the 10-year average. By contrast,
prices during the 2000/2001 marketing season were only 12 percent higher than the 10-
year average. In addition, grain prices in food crisis regions were 8 percent higher than in
non-crisis regions (Table 20). Although a higher percentage of markets in food crisis regions

65
were affected by drought, the regions were similar with respect to most other
characteristics (Aker, 2007).
Table 20: Grain Prices (CFA/kg) by Food Crisis Region in Niger, 2004/2005
Food Crisis Regions Non-Food Crisis
Regions Difference in Means
Difference in Distributions
Mean (s.d.) Obs Mean (s.d.) Obs s.e. D-statistic p-value
Price dispersion between markets (CFA/kg) 29.6 (22.7) 1392
24.99 (19.7) 3828 4.602
a/(1.6) 0.0872 0
Grain Price (CFA/kg)
164.96 (43.4) 183
151.8 (39.0) 155
13.10a/
(6.63) 0.148 0.051
Notes: Data from SIMA. a/ Significant at the 1 percent level. All prices are in 2001 CFA.
Figure 14: Grain Price Levels of Key Forecasting Markets during the Harvest Period
Gaya
Maradi
Guidan Roumdji
TessaouaIllela
Tounfafi
ZinderMai Adua
60
70
80
90
100
110
120
130
Mil
let
Pric
e C
FA
/kg
Oct-00 Oct-03 Oct-04

66
69. Although grain prices during the 2004 harvest were higher than in 2000, they
initially followed a similar pattern to that of other drought years. However, prices
increased significantly during the last four months of the 2004/2005 marketing season.
Figure 15 shows the seasonal price change for cereals in domestic and cross-border markets
in Niger between 1999 and 2006. The greatest intra-seasonal price increase occurred in
2004/2005, which was the year of the food crisis. During that year, millet prices increased
by 89 percent between the harvest period (October) and the hungry season (August). In
comparison, prices only increased by 75 percent during 2000/2001. Interestingly, prices in
2004/2005 followed a similar pattern to that of the 2000/2001 marketing season until May
2005, whereupon they increased significantly and stayed at this level until the end of the
marketing season. This period also coincided with the height of the food crisis.
Figure 15: Intra-Seasonal Change of Millet Prices by Year
0
50
100
150
200
250
oct nov dec jan feb mar april may june july august sept
Prix
du
Mil
(C
FA
/kg
)
1999/2000
2000/2001
2004/2005
2005/2006
1997/1998

67
Use of Food Stocks in 2004/2005: Diseases, Health Services, and Behavior
70. Although the immediate causes of the 2004/2005 food crisis were related to
drought, production shocks, and price increases, the situation was exacerbated by
structural factors, especially those related to the poor health and nutritional status of the
Nigerien population. Poor nutritional outcomes are determined not only by food intake but
also by a variety of other factors, including infectious diseases and the care and
management of these diseases. Based upon the data from targeted health and nutrition
surveys in 2005 (carried out by HKI, Médecins Sans Frontières, and UNICEF, among others),
there is little to suggest that the 2005 food crisis was due to a health shock, such as an
outbreak of meningitis, malaria, typhoid, or other diarrheal diseases. The DHS/MICS survey
of 2006 provides important information on the health and nutritional status of the
population.
Figure 16: Distribution of Children with an Infectious Illness and Acute Under-nutrition, by Age Group
71. Infectious diseases, particularly those associated with limited access to potable
water and the absence of health-seeking behavior, are of particular concern in Niger.
Infectious diseases affect the growth and nutritional well-being of young children. Figure 16
shows the relationship between infectious diseases and under-nutrition (wasting) in Niger
0
10
20
30
40
0-5 6-11 12-23 24-35 36-47 48-59
Percentage
Wasting
Diarrhea
ARI
Fever
Source : EDS et MICS (2006)

68
by age group. The relationship between the two is clear: (i) a sick child loses weight as a
result of appetite loss, reduced nutrient absorption, and the need for higher energy to fight
off the disease; and (ii) a malnourished child has lower immunity, therefore is at higher risk
of falling ill and getting more severe infections. Reduced consumption and absorption result
in under-nutrition.
72. While there is no evidence that child care practices in households significantly
changed during the 2004/2005 food crisis, limited access to sufficient quality and quantity
of food exacerbated the poor health and nutritional status of the population. The duration
and severity of a child’s illness is partly determined by preventive practices and child care
once the child becomes ill. According to the DHS/MICS survey of 2006, the child care
practices followed by families during illness are poor. Only 36 percent of children under 5
suffering from diarrhea were given more fluids than usual, only 29 percent of children were
treated with an oral rehydration therapy, and only 6 percent were offered more food than
usual. In addition, only 13.5 percent of infants aged 0 to 6 months were exclusively
breastfed, an important protective measure to avoid exposure to pathogens (see the 2006
DHS/MICS survey).56
RESPONSES DURING THE FOOD CRISIS
73. In 2004/2005, a variety of governmental, local, and international organizations
responded to the food crisis.57 These interventions involved: (i) food-based programs, such
as the free distribution of food or therapeutic feeding programs; (ii) food-for-work
programs (FFW); (iii) the sale of cereals at subsidized prices; and (iv) other interventions,
56
Infant and child care and feeding practices are often closely associated with teenage motherhood, short birth intervals, and maternal mortality. While data on health behavior and motherhood status are rare, maternal mortality in Niger is estimated at 1,600 maternal deaths per 100,000 live births, one of the highest maternal mortality rates in the world (2006 DHS/MICS). 57
NGOs that have implemented food aid programs between 2000 and 2007 include Action Contre la Faim, Africare, CARE, Catholic Relief Services (CRS), Helen Keller International (HKI), Concern Worldwide, Médecins sans Frontières, and Plan-Niger; international organizations include UNICEF, the WFP; and the Government of Niger, including the CCA, the DNPGCA, and the OPVN.
69
such as cash-for-work (CFW) programs and seed vouchers and fairs (SVF) programs. In spite
of these efforts, in some of the worst-affected regions the gross mortality rate and child
mortality rates rose well above international thresholds for humanitarian crises.
Food-based Programs. During the 2005 food crisis, food aid resources were used in
two types of programs: vulnerable feeding programs and cereal banks. Vulnerable
feeding programs during the crisis consisted of: (i) general distribution programs,
which provided general rations to entire communities, regardless of gender, age, or
nutritional status; and (ii) therapeutic feeding programs, which involved providing
intensive curative care to severely malnourished recipients, primarily children under
the age of 5.58 Finally, in some communities, food aid was provided to replenish the
stocks of existing cereal banks or new cereal banks were created (in addition to an
initial stock).
FFW Programs. During the crisis, FFW programs provided food (usually to all
households in the community) in return for work on community-based
infrastructure projects, such as half-moons (demi-lunes) in community pastures or
farm-to-market roads.
Cereal Sales at Subsidized Prices. Along with community-based interventions
targeted to individual households, the government also organized the sale of cereals
at subsidized prices during the 2005 crisis. The government sold approximately
40,000 metric tons of subsidized cereals in Niamey and other regions between
February and June 2005 (WFP, 2005 b), with 12,750 metric tons sold between
February and April of 2005 and 30,000 metric tons sold between April and May of
2005. Both of these sales used food aid resources.
58
The establishment of centers for therapeutic feeding should be considered when the rate of malnutrition among under-5s exceeds 10 percent and the capacity of existing facilities is exceeded.

70
Other Emergency Response Programs. In addition to food-based interventions, two
other types of emergency interventions were implemented during the 2005 crisis:
cash-for-work (CFW) programs and seed vouchers and fairs (SVFs). The government
and the International Rescue Committee (IRC) both implemented CFW programs in
targeted areas that were based on the FFW approach. Community members were
provided with cash payments in return for their labor on community-based
infrastructure projects. Additionally, the CRS implemented SVFs in particularly food-
insecure areas. Participants were provided with vouchers (worth a specific amount)
to purchase the seeds, with the seed sellers being farmers and/or traders in the
area. The primary idea behind the SVFs was to mitigate the medium-term impact of
the food crisis by providing households with seeds for the next harvest. However,
rather than importing seeds, the seed fair sought to facilitate exchanges between
buyers and sellers.
74. Food distributed and sold during the food crisis came from two primary sources:
imported food aid, mainly from the US and the EU and local and triangular purchases,
with the latter coming from Nigeria. Although quantitative data on the location,
magnitude, timing, and price of these purchases are not available, the largest local purchase
appears to be the Government of Nigeria’s purchase of 40,000 metric tons between
February and -May 2005. The WFP purchased 5,800 metric tons of cereals locally in
2004/2005, including 3,800 metric tons of millet in October 2004 and 2,000 metric tons of
imported rice in July 2005. In addition to these local purchases, the WFP also bought
approximately 10,500 metric tons of sorghum in Nigeria. Several other NGOs also acquired
food aid via local and triangular purchases in 2004/2005, although the quantities and
locations of these purchases are difficult to verify. Nevertheless, these quantities appear to
be relatively small in magnitude (in other words, less than 1,000 metric tons).

71
75. Understanding the impact of local purchases and developing guidelines and
criteria for using local or triangular purchases as compared to imported food aid, is an
important policy concern for Niger. The impact of these local and triangular purchases on
domestic supply and food prices in Niger is difficult to measure without detailed
information on their location, magnitude, and timing. If the local purchases took place in
key “forecasting” markets in Niger or Nigeria – such as Maradi, Jibia or Mai Adua – and
significant quantities were involved, then the impact on supply and hence local prices may
have been substantial.
76. The criteria for targeting vulnerable regions to benefit from emergency programs
were unclear. Due to the lack of explicit and transparent criteria (or thresholds) for
determining a food crisis and for identifying vulnerable regions, the areas most affected by
the food crisis may have not been reached in 2005. Although a list of vulnerable villages was
first produced in May 2005, this initial list did not coincide with the qualitative and
quantitative evidence observed by international and non-governmental organizations. This
prompted considerable friction between the Government of Niger and the international
community. Although numerous institutions attempted to update this information by
conducting additional food security assessments, so far a list identifying the most severely
affected regions during the 2005 food crisis is still not available.
GOVERNMENT SAFETY NET AND SOCIAL PROTECTION PROGRAMS
The mechanisms for preventing and responding to food crises discussed above represent
only one of a range of interventions that comprise a social protection system. Social safety
nets (safety nets for short) are non-contributory transfer programs targeted to the poor and
to individuals vulnerable to poverty and to shocks. These programs have the simultaneous
goals of: (i) providing assistance to households in poverty, thus reducing the impact of
poverty and to helping to lift them out of poverty and also to helping households to face the
impact of shocks; and (ii) reducing the negative effects of globalization, macroeconomic

72
shocks, and structural changes, thus contributing to more sustainable growth.59 These are
programs such as:
Cash transfers or food coupons, targeted by category or by income level (examples
include family allowances or social pensions).
In-kind transfers, school meal programs, or supplements designed for mothers and
children and also less frequently the distribution of ready-to-eat meals, school supplies,
or uniforms. General price subsidies, often for food or energy, targeted to households.
Employment through labor-intensive public works programs, sometimes called
“workfare” (transfers that are conditional on recipients providing their labor for a
specified period of time).
Cash or in-kind transfers to poor households, subject to the recipients meeting specific
educational or health conditions.
Exemptions from paying fees for basic services, health services, education, public
service, or transportation.
77. Social safety net programs in Niger have primarily been implemented by
governmental, non-governmental, and international actors on an annual basis. These
programs have included the subsidized sale of cereals, free food distribution, and, in a few
cases, food or cash for work. In addition, there are a few safety net programs that help the
poor to access health and education programs, such as school feeding programs and
nutritional support.
59
See Grosh et al (2008) for a complete description of social safety nets.
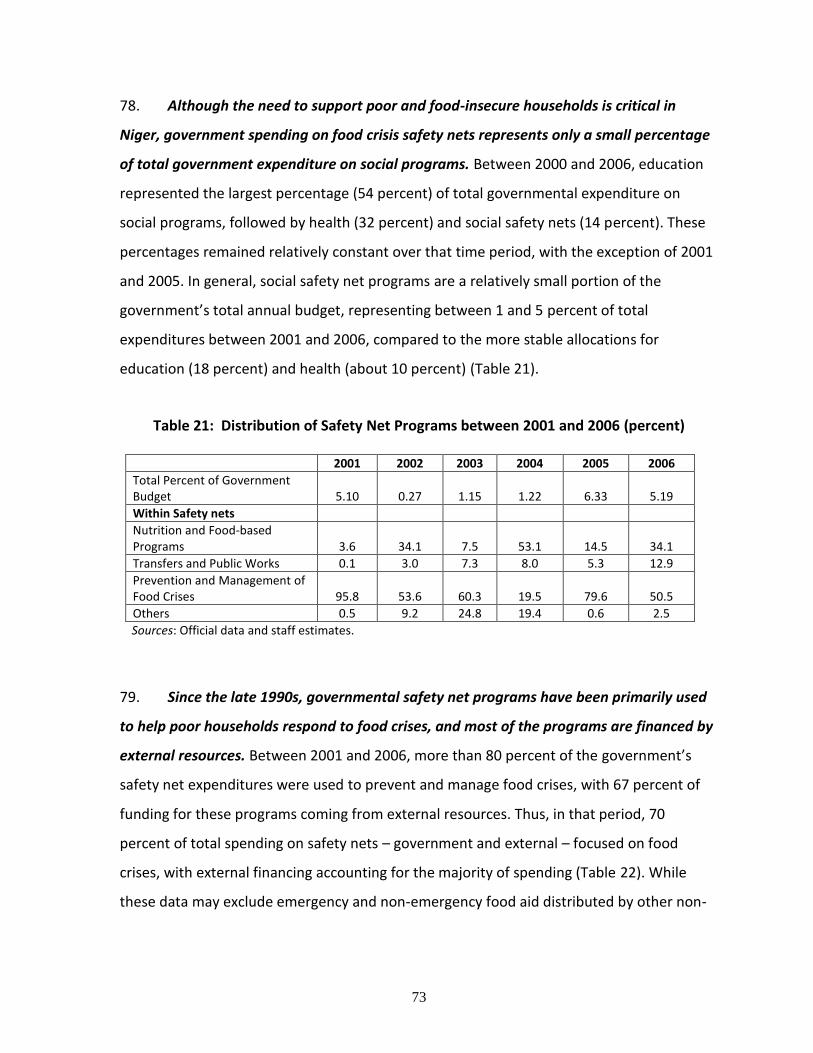
73
78. Although the need to support poor and food-insecure households is critical in
Niger, government spending on food crisis safety nets represents only a small percentage
of total government expenditure on social programs. Between 2000 and 2006, education
represented the largest percentage (54 percent) of total governmental expenditure on
social programs, followed by health (32 percent) and social safety nets (14 percent). These
percentages remained relatively constant over that time period, with the exception of 2001
and 2005. In general, social safety net programs are a relatively small portion of the
government’s total annual budget, representing between 1 and 5 percent of total
expenditures between 2001 and 2006, compared to the more stable allocations for
education (18 percent) and health (about 10 percent) (Table 21).
Table 21: Distribution of Safety Net Programs between 2001 and 2006 (percent)
2001 2002 2003 2004 2005 2006
Total Percent of Government Budget 5.10 0.27 1.15 1.22 6.33 5.19
Within Safety nets
Nutrition and Food-based Programs 3.6 34.1 7.5 53.1 14.5 34.1
Transfers and Public Works 0.1 3.0 7.3 8.0 5.3 12.9
Prevention and Management of Food Crises 95.8 53.6 60.3 19.5 79.6 50.5
Others 0.5 9.2 24.8 19.4 0.6 2.5
Sources: Official data and staff estimates.
79. Since the late 1990s, governmental safety net programs have been primarily used
to help poor households respond to food crises, and most of the programs are financed by
external resources. Between 2001 and 2006, more than 80 percent of the government’s
safety net expenditures were used to prevent and manage food crises, with 67 percent of
funding for these programs coming from external resources. Thus, in that period, 70
percent of total spending on safety nets – government and external – focused on food
crises, with external financing accounting for the majority of spending (Table 22). While
these data may exclude emergency and non-emergency food aid distributed by other non-

74
governmental and international actors during this time period, two things are clear: (i) the
government has only limited resources available for safety nets and (ii) spending on safety
nets strongly favors emergency responses, particularly food crises.
Table 22: Sources of Financing for Safety Nets, 2001-2006
Recurrent budget
Investment budget
Gov External Gov IPPTE
Total
Grand Total
Nutrition and food aid 2.4 - 11.7 5.4 17.0 19.4
Transfers and Public Works (HIMO) 1.6 3.2 0.7 1.0 4.9 6.5
Prevention and management of food crises - 3.2 67.1 - 70.3 70.3
Others - 0.5 3.1 3.7 3.7
Total 4.0 6.4 80.0 9.5 95.9 100.0
Sources: Official data and staff estimates.
80. Since most safety net programs are implemented during food crises, they are
managed by institutions responsible for food emergency interventions. A large percentage
of safety net programs has been coordinated by the CCA and implemented by the CCA, the
OPVN, and a variety of NGOs (Section 1). Table 23 shows the number of in-kind programs
managed by the government by year and by type of program between 2001 and 2007. The
CCA is primarily responsible for FFW and cereal banks, whereas both the CCA and the OPVN
are involved in the sale of cereals at subsidized prices and in general and targeted
distributions. Over the past seven years, the greatest quantities were distributed in
2000/2001 and 2004/2005, the years of drought. Therefore, during non-drought years,
there were relatively few safety net interventions being implemented in Niger, despite the
fact that over 50 percent of the population is food-insecure each year. The CCA and the
OPVN depend on strategic grain reserves, imported food aid, and local purchases in order to
obtain food aid. Between 2000 and 2007, approximately 30 percent of all food aid used in
governmental safety net programs was obtained via local purchases.60
60
Although this is provided in the official figures, the percentage derived from local purchases appears to be greatly underestimated. This could be due to a different classification of local and triangular purchases. For

75
Table 23: Governmental (Emergency) Safety Net Programs, by Year and by Program
Year Subsidized Sales (metric tons)
General distribution
(metric tons)
Cereal Banks (metric tons)
Livestock Banks
CFW (CFA) FFW (metric tons)
Seeds (metric tons)
2001 14,500 0 1 596 11 193,294,625 342 536
2002 3,140 0 0 0 0 0 305
2003 5,000 0 605 25 17,606,250 137 0
2004 0 0 0 0 0 0 0
2005 38,209 65,029 7,235 107 576,663,000 1,160 500
2006 10,130 10,606 4,080 0 1,891,814,958 0 0
2007 0 0 0 0 202,000,000 0 450
2008 (Planned)
7,000 11,561 0 0 1,530,047,648 0 1.100
Source: CCA.
Notes: Cereal banks and seed distributions are planned for May-August 2008, although the tonnage is not available.
81. To improve the functioning of its emergency response interventions, the DNPGCA
developed a national contingency plan for food security and nutrition with the
participation of a variety of governmental and non-governmental actors. Developed in
2007, the document outlines the strategic priorities for the DNPCGA for preventing and
managing food crises in the country. The overall objective of the plan is to minimize the
impact of food crises by ensuring households’ access to staple foods and protecting their
assets, mainly via the national security stock and emergency cash resources. The document
also outlines a variety of early warning indicators (such as cereal deficits, food prices, and
severe malnutrition rates) in order to identify different food crisis scenarios and to
implement appropriate interventions (such as general food distribution, FFW, CFW,
subsidized sales, and seed distributions).
example, in 2005, it is estimated that the OPVN purchased 2,300 metric tons of grains for sales and distribution; at the same time, other documents report that approximately 40,000 metric tons were purchased in 2005 by the Government of Niger. However, the CCA reports that it purchased 50,000 metric tons of food from neighboring countries.

76
82. There is a lack of agreement on what are the most effective safety nets
interventions in Niger. The list of response interventions outlined by the national
contingency plan includes most of the same instruments that have been used in the past
few years and puts more emphasis on CFW than on FFW and cereal banks. However, there
is no good indication of what has been more effective. The data on cereal banks from the
1990s show that these have not been sustainable. CFW programs, which are usually
preferred to FFW, are fairly new interventions that have not been fully evaluated in Niger.
In addition, CFW programs are only appropriate if prices are sufficiently low.
NIGER 2008: PREPARING FOR AND RESPONDING TO A POTENTIAL FOOD CRISIS
83. International prices of major cereals (rice, wheat, and maize) have been on an
upward trend since 2006 (Figure 17). Maize prices have increased by 45 percent in both
Euro and CFA terms between March 2006 and March 2007, due in large part to increased
demand for maize for ethanol production in the US. Wheat prices rose sharply in late 2007
following a poor harvest in Australia (a major exporter of wheat), which aggravated already
low international wheat stocks. By March 2008, international wheat prices (in Euro and CFA
terms) were 96 percent higher than they were in March 2007. The increase in international
rice prices has been the most dramatic. Following India’s ban on private sector exports of
non-Basmati rice in late 2007 as well as similar bans by Vietnam and other exporters,
international rice prices rose to €449 per metric ton in April 2008 (nearly US$700 per metric
ton), 126 percent higher than in March 2007. Overall, prices of maize, wheat, and rice were
106, 71, and 90 percent higher respectively in Euro terms in March 2008 than in March
2006.61
61
In US dollar terms, international maize, wheat, and rice prices were 166, 120, and 145 percent higher in March 2008 than the previous year.

77
Figure 17: International Prices of Grains (Wheat, Rice, and Maize), 2000-2007
International Prices of Cereals, 2000-07
0
50
100
150
200
250
300
350
400
450
500
Jan-
00
Jul-0
0
Jan-
01
Jul-0
1
Jan-
02
Jul-0
2
Jan-
03
Jul-0
3
Jan-
04
Jul-0
4
Jan-
05
Jul-0
5
Jan-
06
Jul-0
6
Jan-
07
Jul-0
7
Jan-
08
(Eu
ro /
ton
)
Wheat (US HRW#2, FOB Gulf) Maize (US #2 Yellow, US Gulf)
Rice (FOB Bangkok, A1 Super)
84. The increase in international food prices should have only a limited impact on food
security in Niger, which primarily imports millet, sorghum, and maize. In this environment
of high international grain and petroleum product prices, poor consumers, especially those
in net food importing countries, face serious threats to their food security. To some extent,
Niger is insulated from the direct effects of these international price increases, as neither
sorghum nor millet is internationally traded in large volumes. Niger’s prices for these
commodities are affected by supply and demand conditions in Nigeria. Similarly, Niger
imports maize from Benin and Nigeria, which are important local producers of this
commodity. Consequently, changes in international maize prices are filtered through
Nigeria. Finally, while wheat and rice prices in Niger are more closely linked with those in
international markets, these commodities are not major staples of the poor in Niger,
especially rural areas.
85. Price increases of staple grains (millet, sorghum, and maize) in 2007/2008 appear
to be driven by irregular rainfall and poor harvests in late 2007 rather than international
price movements. While departmental-level production data are not available, Figure 18

78
shows millet prices in key forecasting markets in Niger and Nigeria for October 2007. The
prices in several of these markets – namely, Gaya, Guidan Roumdji, Tessaoua, Illela,
Tounfafi, Mai Adua, and Dogondoutchi – are higher or close to the price levels of the 2004
harvest. The prices for Benin (Malanville), Maradi, and Jibia, however, are below the
October 2004 levels. This suggests that there were production shocks in these markets
during the 2007 harvest that were similar to those in 2004 but not of the same magnitude.
Therefore, while 2007 was considered to be a normal harvest, the price data suggest that
perhaps key markets were affected during the harvest period.
Figure 18: Millet Prices in Key Forecasting Markets during the Harvest Period in 2000, 2004, and 2007
Gaya
Maradi
Guidan Roumdji
Jibia
TessaouaIllela
Tounfafi
Zinder
Mai Adua
Dogondoutchi
60
70
80
90
100
110
120
130
140
150
Rea
l M
ille
t P
rice
CF
A/k
g
Oct-00 Oct-03 Oct-04 Oct-07
86. The Government of Niger, early warning systems, and NGOs should monitor price
differences between Nigeria and Niger to determine whether grain imports will be
profitable in 2007/2008. During normal years, prices in northern Nigeria are lower than
those in Niger as of May/June, thereby making it profitable for Niger to import grains from
Nigeria. In 2004/2005, prices in northern Nigeria were above those in Niger for the entire

79
marketing season, suggesting that imports were not profitable during that year. In order to
determine whether imports from Nigeria will be profitable in 2007/2008, early warning
systems and NGOs should monitor grain prices on cross-border markets and compare them
with prices in Niger. If prices in northern Nigeria remain higher than those in Niger, this
suggests that Niger will need to import from other countries. The following price pairs
should be compared: Malanville (Benin)-Gaya (Niger), Illela (Nigeria)-Konni (Niger), Jibia
(Nigeria)-Maradi/Dan Issa (Niger), Mai Adua (Nigeria)-Zinder/Matameye (Niger), and
Kantchari (Burkina Faso)-Torodi (Niger). Figure 19 shows how millet prices have been
changing in 2007/2008 compared with other drought and non-drought years (2000/2001,
2003/2004, and 2004/2005). Between October and March, grain prices in Niger and
northern Nigeria have been following a pattern similar to a drought year. However, as of
April 2008, prices have fallen slightly on these markets. This suggests that price movements
in May/June should be monitored carefully and that any emergency preparedness and
response interventions should not put pressure on local and regional supply.
Figure 19: Changes in Millet Prices between the Harvest and Hungry Periods
50
60
70
80
90
100
110
120
130
140
150
160
170
180
190
200
210
220
230
oct nov dec jan feb mar april may june july
Mil
let
Pri
ce (
CF
A/k
g)
2004/2005 2000/2001 2007/2008 2003/2004

80
87. In the meantime, the government and international organizations are preparing a
response program. To cope with the price increases, as part of the emergency measures,
the government has already taken temporary fiscal measures to mitigate the impact while
also replenishing cereal stocks. Specifically, the VAT and customs duties on rice imports
have been suspended for three months in an effort to alleviate the impact of the increase in
food prices on consumers. In addition, with international support, existing governmental
and non-governmental institutions are in the process of preparing a response based on
existing emergency mechanisms, which consist of food-based programs for emergency
distribution, FFW programs, subsidized cereals, and CFW programs to raise the purchasing
power of affected households.
81
CHAPTER 5: SUMMARY AND POLICY OPTIONS
Niger faces serious problems of poverty and household food insecurity. Although the
magnitude of the problem is most evident during years of climatic shocks, especially drought,
the problem is in fact a chronic one. Low levels of food availability, limited economic access to
food, and Nigeriens’ poor health and nutritional status have resulted in food insecurity and
malnutrition for much of the population, even in years of normal harvests. Faced with limited
resources, a high prevalence of poverty, and periodic droughts and other shocks, Niger needs
an effective food security and social protection strategy. Such a strategy should include three
key components: (i) increasing the efficiency and scope of safety net programs; (ii) promoting
effective medium-term strategies and investments to increase food availability and access
and improving health and sanitation practices; and (iii) strengthening emergency responses.
Avoiding future food crises will also require greater recognition of the major importance of
regional markets (particularly Nigeria) in influencing market prices, food imports (and
exports), and, ultimately, household food consumption in Niger. Finally, any social protection
strategy will need to be consistent with the country’s overall strategy for growth and poverty
reduction, which represents the ultimate solution for food insecurity and the poor health and
nutritional outcomes associated with both poverty and household food insecurity.
SUMMARY OF FINDINGS
Poverty and Food Security
88. More than 50 percent of Niger’s population suffers from some form of food
insecurity, and most of the population does not consume the minimum daily caloric
requirements for adequate nutrition. Nutritional data show that much of the rural population
suffers from seasonal food insecurity and that both rural and urban populations are vulnerable
to transitory food insecurity, defined as reduced access to food after a shock. Analysis of

82
household survey data shows that, although there was some improvement between 2005 and
2006, the food security situation of the poor remains very fragile, with many households
consuming only slightly above the minimum daily caloric requirement. Higher food prices would
be likely to prompt these households to reduce their consumption even further unless there
were compensating gains in household incomes (including transfers). Among the various coping
strategies used by households to mitigate shocks are: (i) receiving food aid; (ii) reducing the
number of eaten meals per day; (iii) migrating; and (iv) selling assets or livestock. Overall, poor
households are more exposed to shocks, the poorest regions are the most vulnerable to food
insecurity, and coping mechanisms make households more vulnerable to future food insecurity.
Food Availability and Markets
89. Because over two-thirds of the daily caloric consumption of Nigeriens comes from
cereals, the production, total availability, market prices, and performance of markets for
cereals are crucial determinants of food security. Typically, over 80 percent of Niger’s total
available amount of cereals comes from domestic production, mainly millet and sorghum.
Droughts and pest attacks often cause large fluctuations in domestic production, and
production losses vary substantially between regions within Niger. Formal sector imports (food
aid and commercial imports) consist mainly of wheat, maize and rice and average only a small
share of supply (7 percent of the average 2.8 million tons of annual total net cereal availability
from 2000 to 2005). Unofficial imports of millet from Nigeria may have added as much as
200,000 tons to total net supply in recent years, though there is considerable uncertainty over
these magnitudes. Survey evidence and analysis of prices indicate that Niger’s wholesale cereal
markets are generally well integrated. Markets in southern Niger are also well integrated with
markets in Nigeria close to the border. However, a lack of data makes it impossible to carry out
any detailed analysis of price links between major markets in northern Nigeria (such as Kano)
and those in Niger.

83
The 2005 Food Crisis, the Current Surge in International Prices, and the Government’s
Response
90. In early 2005, national policymakers and the international community were caught
by surprise by reports of sharp price increases and serious malnutrition in southern Niger.
Estimates of national food production in late 2004 had suggested only a modest decline in
production relative to medium-term trends, though it was clear that the October 2004 harvest
was likely to be smaller than that of 2003. One major cause of the crisis was the extremely low
income level of households, which contributes to their low nutritional status in normal years
and makes them highly susceptible to major income and price shocks. In 2005, two major
shocks occured ‒ a sharp rise in food prices (related to even more dramatic price increases in
some of Nigeria’s markets beginning in mid-2004) and losses in food production and incomes
for those farmers whose late 2004 harvests were affected by drought and locusts.
91. The government’s response was not sufficient to mitigate the impact of the 2004/5
crises on the vulnerable groups. The government’s response, with international support,
consisted mainly of food aid for emergency distribution as well as the sale of approximately
40,000 tons of cereals between February and June 2005 and FFW and CFW programs to raise
purchasing power of affected households. Despite of these efforts, in some of the worst-
affected regions the gross mortality rate and child mortality rates rose well above international
thresholds for humanitarian crises. Avoiding such crises in the future will require: (i) better
monitoring of production and prices at the local level to capture information on which
households are experiencing large shocks to their incomes and purchasing power; (ii) more
monitoring and ongoing analysis of cereal markets and likely trade flows from neighboring
countries (especially Nigeria); and (iii) strengthening of the government’s response capacity.
92. Is Niger affected by the international increase in food prices and how should the
government respond in 2007/8? High international world prices for grains are a cause for
concern because of their potential effects on domestic markets, as well as the potential for

84
reduced availability of food aid if Niger (or even Nigeria) should suffer a production shortfall as
appears to have been the case in late 2007. To some extent, Niger is insulated from the direct
effects of these international price increases because neither sorghum nor millet is
internationally traded in large volumes. Niger’s prices for these commodities are affected by
supply and demand conditions in Nigeria. Wheat and rice prices in Niger are more closely linked
with those in international markets, but these commodities are not major staples of the poor,
especially rural areas. However the price increases of maize, sorghum, and millet in Nigeria in
2007 and early 2008, driven mainly by the irregular rainfall and poor harvests in late 2007 and
not by international price movements, might raise some concerns. In the short run, it is
important that the government monitor international and domestic market prices and
recognize that increases in market prices in Niger that coincide with price movements in Nigeria
(for maize, sorghum, and millet) and international markets (for rice and wheat) are unlikely to
be due to non-competitive behavior on the part of domestic traders but on increases in the cost
of additional supply. As such, the government should avoid placing any restrictions on the
storage and trade of cereals but instead make efforts to promote market efficiency by ensuring
the transparency of government policies on food aid flows, other official imports, and releases
of stocks. Sharing information with private sector traders and importers is one way of building
confidence (Minten and Dorosh, 2006 and Dorosh, 2008b). In addition, the Government of
Niger should consider not making any local or triangular purchases of grains in Niger or in
Nigeria to avoid putting pressure on local supply and hence prices.
OUTLINE OF A FOOD SECURITY AND SOCIAL PROTECTION STRATEGY
93. To better address the chronic and severe transitory food insecurity problems in
Niger, a broad response is needed, including: (i) safety nets to protect poor and vulnerable
households; (ii) medium-term policies and investments to increase food availability and
improve health and sanitation practices; and (iii) measures to strengthen the emergency
response system.

85
Safety Nets to Protect Poor and Vulnerable People
94. Although the food insecurity problems that occur in drought years are most visible,
safety nets are needed even in years of normal harvests to address the needs of chronically
food-insecure households. Every year, at least 20 percent of the population of Niger is severely
chronically food-insecure. In addition, there are many poor and vulnerable households that
would be faced with a catastrophic drop in household purchasing power and access to food if
faced with individual-level shocks (such as an injury, sickness, or death in the family or the loss
of a job), which would cause them to fall deeper into poverty. Farmers also face price risks and
suffer income losses if post-harvest prices are low, making it difficult for them to meet their
current consumption needs and repay debts.

86
Box 6: Ethiopia’s Productive Safety Net Program (PSNP)
In Ethiopia, over 40 percent of the population lives below the national poverty line and over 20 percent of the population is extremely poor (consuming less than 1,650 kilocalories per person per day). Since the variability in rainfall in Ethiopia is among the highest in the world and fluctuations in rainfall are inversely related to mean incomes, every year for more than two decades the government of Ethiopia has launched an international emergency appeal for food aid. This annual emergency assistance was designed to meet the consumption needs of both chronically and transitorily food-insecure households. Despite substantial amount of humanitarian assistance, evaluations have shown that emergency assistance was unpredictable for both planners and households, often arriving late relative to need. As a result of the delays and uncertainties, the emergency aid could not be used effectively and did little to protect livelihoods, prevent environmental degradation, generate community assets, or preserve household assets (physical or human capital). Characteristics of the Program. Given the shortcomings of the emergency aid regime, in 2005 the Ethiopian government started implementing a new program, the Productive Safety Net Program (PSNP). The PSNP replaced the emergency humanitarian appeal system as the chief instrument in the country’s safety net. The program is currently operational in 234 chronically food-insecure districts (of a total of 692 districts), and targeted about 7 million people in 2006. The PSNP provides resources to chronically food-insecure households in two ways: (i) through payments to the able-bodied for participating in labor-intensive public works activities and (ii) through direct grants to households consisting of the elderly or those who cannot work for other reasons. Impact of the PSNP. A 2005 beneficiary survey found that the PSNP had had a significant positive effect on beneficiaries’ well-being as calculated by both subjective and objective indicators. The survey found that three in five beneficiaries avoided having to sell their assets to buy food in 2005, and according to 90 percent of the households, this was a result of their participation in the PSNP. Moreover, almost half of the beneficiaries surveyed stated that they had used health care facilities more and 76 percent of these households credited the PSNP with this enhanced access. More than one-third of surveyed households enrolled more of their children in school and 80 percent of them attributed this to their participation in the PSNP. Ongoing Reforms. Significant work is planned to increase implementation capacity and improve systems to a level that was not previously possible when Ethiopia’s safety net consisted of fragmented and temporary programs. Work is also beginning on a conditional cash transfer in the same districts to help temporarily food-insecure households during periods of drought. The mechanism will use a rainfall-based index based on 30 years of rainfall data to trigger funding. Moreover, the PSNP is complemented by a larger food security program that helps households to raise their incomes by means of resettlement grants, household income-generating packages, and water harvesting. Households that benefit from the PSNP are also entitled to assistance under other parts of the food security program. However, food security interventions financed by donors that fall outside the PSNP are rarely coordinated at local levels, and their links to basic rural services are also weak. Lessons Learned. The PSNP illustrates many of the issues that apply to safety nets in very low-income countries, namely:
The program is moving in a clearly beneficial direction by means of a basic design that not only seeks to use resources in ways that save lives but also to increase livelihoods. The progress made to date in implementing the PSNP suggests that this is possible even in a very low-income setting.

87
The Even when fully realized, the program will only provide a safety net in about one-third of the
country. The districts selected are the poorest as is appropriate, but many poor people also live in the unserved districts. Moreover, the program has phased in its implementation, focusing first on consolidating the basic PSNP. The government hopes to enrich it eventually in a number of dimensions, but program managers and donors realized that everything could not be accomplished right away. Thus, for example, the contingent fund for droughts was not implemented until the third year of the PSNP.
Good implementation requires a diligent and sustained effort. By 2007, the program had many positive outcomes and early qualitative assessments of its targeting and impacts have been positive, but more remains to be done. Good implementation also requires flexibility and innovation. For example, the government was initially having problems with the program’s monitoring system, but in the interim, it deployed so-called rapid response teams to visit districts to identify and solve any implementation problems. This gave managers a sense of what was going well and what was not and whether adjustments were needed in individual districts or at a more systemic level. Meanwhile, the design of the monitoring system was simplified and a pilot to computerize it is under way.
An important part of the reform is the shift to a multi-donor, multi-year framework rather than an annual emergency appeal system with each donor running a separate initiative. This is complemented by the decision to deliver the program through regular government systems rather than through the special implementation units that are common in donor-funded programs. The multi-year framework and the reduction in fragmentation should make it possible to develop much more effective administrative systems. The multi-donor framework should also make the program more resilient, in that the withdrawal or a reduced commitment by a single donor will have a less deleterious effect than if the donors were still operating separate programs.
Source: Grosh et al. (2008).
95. The challenge lies in developing an effective general safety net system that can be
adequately financed. The mechanisms for preventing and responding to food crises as
currently implemented by the DNPGCA constitute only a part of a safety net system.
Consequently, to develop a full-scale safety net system for households suffering from chronic,
seasonal, and transitory food insecurity, it will be necessary for the government to: (i)
formulate a safety net program that is consistent with the PRSP2 and RDS and (ii) coordinate
with its technical and financial partners (TFPs). This in turn will require the inclusion of safety
net programs in the government budget and the confirmation of a long-term financial
commitment on the part of the TFPs. The decision about how extensive to make the safety net
program must take into account the costs of the program and any possible tradeoffs with
investments related to the PRSP2. The decision-making process should include consultations

88
with civil society, relevant government agencies, and donors. Once a sustainable safety net
program is in place, it could be scaled up in the event of a major production shortfall both in
terms of the number of beneficiaries and the amounts transferred. In order to ensure
continued support for the safety net program, it is crucial that its financing should be included
in the government budget, perhaps with a commitment of long-term financial support from
donors. For example, in Ethiopia, a country also confronted with recurring food crises, the
government and donors have agreed upon multi-year financing agreements for the country’s
Productive Safety Net Program (PSNP) to replace the annual appeals for funding that often led
to delays in routing food aid or to inappropriate use of funds (see Box 6.) This medium-term
finance mechanism has increased the effectiveness of the design and implementation of safety
net support and has reduced uncertainty among the recipients.
96. Existing government programs involving the distribution of food could be included
in the overall safety net system, though steps should be taken to make them operate more
efficiently. This would require: (i) an assessment of the effectiveness of existing programs
including labor-intensive public works such as FFW and CFW programs, the free distribution of
foodstuffs, subsidized food sales, cereal banks, and school cafeterias; (ii) a review of the
existing targeting system to determine the challenges involved in addressing the needs of
chronically poor people; and (iii) an improvement in the program monitoring system. Within
this framework, to ensure that the safety net system is effective (in both crisis and normal
periods) it must be possible: (i) to guarantee that the FFW and CFW programs are well
organized and yield productive results; (ii) to limit the amount of free distribution of food as
well as subsidized sales and pay specific attention to the timing and localization of sales; (iii) to
ensure that the purchase of local foodstuffs is well planned; and (iv) to ensure that there are
transparent and efficient targeting procedures for selecting the regions and households to
benefit from the program. The free distribution of food and subsidized sales of food should be
done only on a limited scale, with careful attention paid to the timing and location of sales,
particularly avoiding harvest time as this could reduce farmers’ revenue.

89
New safety net programs could be introduced. Once the vulnerable groups are identified and
the evaluation of the existing programs is completed, it will be necessary to pilot certain types
of programs based on transparent participation eligibility criteria, coverage, and cost, including
cash payments and conditional cash transfers. Cash programs have an advantage over in-kind
food distribution because they avoid the operational costs involved in the storage and
movement of food as well as the possible disincentive effects on production during periods
when food is readily available (for example, harvest periods or, more generally, good harvest
years). Conditional cash transfers, which are conditional on recipients meeting certain
requirements such as ensuring that their children attend school and/or make regular use of
health services, offer benefits both in terms of increasing the incomes of targeted households
and forwarding certain socially desirable outcome (such as school attendance and use of health
services for children).
Medium-term Policies and Investments to Increase Food Availability and Improve Health and
Sanitation Practices
97. Medium-term policies and investments are also needed to reduce the vulnerability
of poor households to production shocks, raise their incomes, and enhance market efficiency.
For example, in Bangladesh, long-term investments in rural roads (often built through FFW or
CFW programs) and agricultural research and extension were combined with effective
government policies that promoted the expansion of small-scale irrigation by liberalizing the
import of small pumps and food policy management to ensure that food aid flows did not give
farmers a market price disincentive to reduce domestic food production (see Box 7). As a result,
over a period of about two decades, Bangladesh was able to double its food production, raise
rural incomes, and reduce its dependence on food aid imports. Similarly, India used FFW and
other public works programs to develop irrigation systems that increased agricultural
production and rural incomes.

90
Box 7: Enhancing Food Security in Bangladesh
Bangladesh has made considerable progress in increasing food production and enhancing food security by supporting agricultural research and extension, investing in roads, maintaining price incentives for domestic production, liberalizing domestic and international trade in cereals, and carrying out targeted public food distributions.
Bangladesh suffered a major famine in 1975 following flood-induced production shortfalls in late 1974, as the country lacked foreign exchange for imports and government stocks for targeted distribution. Thereafter, the country invested heavily in small-scale irrigation (including major private sector investments in tube-wells), agricultural technology, and roads. As a result, Bangladesh was able to double its rice production between the mid-1970s and the late 1990s. Particularly important for food security was the increase in winter season crops (boro rice and wheat) that made possible a major harvest following the traditional monsoon season harvest.
Following major production shortfalls due to massive floods in 1988 and 1998, Bangladesh was able to prevent a recurrence of famine. In 1988, the government relied on large public stocks of rice and wheat, government commercial imports, and food aid inflows to stabilize market prices and permit large-scale public distribution of grains. A decade later, following the 1998 floods, trade liberalization made private sector imports of rice and wheat possible, and the private sector responded with over 2 million tons of rice imports from neighboring India. As a result, rice prices were stabilized without large-scale public distribution of grain or food aid flows and at minimal cost to the government. Food aid-supported and other public distribution programs were used, however, to target flood-affected and other poor households. As shown by the Bangladesh experience, an appropriate mix of public and private investments, combined with adequate price incentives, can lead to increased production and reduced variability of major cereals. Moreover, it is possible to promote private trade to increase the availability of food and stabilize prices while operating major targeted food transfer schemes to directly increase access to food for poor households. Such a combination of policies can substantially lower fiscal costs but requires transparency on the part of the government in order to reduce risks for private sector trade. Sources: del Ninno et al (2001) and del Ninno et al (2004 and 2007).
98. There is need to promote efficient domestic agriculture production. In Niger,
increasing agricultural productivity and the level and stability of domestic production would
help to increase food availability, raise rural incomes, and reduce fluctuations in output and
rural incomes. To achieve this, it will be crucial to design and implement policies to promote
efficient domestic agricultural production, including investing in agricultural research and
extension, investing in road construction and maintenance, and increasing market
infrastructure (such as basic storage facilities in major markets). Also essential in Niger’s semi-

91
arid environment is to increase farmers’ access to water for use in agriculture by investing in
irrigation and water retention (for example, check dams, where appropriate).
99. The government must also ensure that its trade policies do not impede the
development of the cereal market. Its internal and external trade policies should consistently
support short-term market efficiency, especially in emergencies, and avoid measures that
impede medium-term market development. In particular, the government should avoid placing
restrictions on the storage and trade of cereals but instead make efforts to promote market
efficiency by ensuring that government policies on food aid flows, other official imports, and
releases of stocks are transparent. Open consultations with private sector traders and
importers to share information are one way of building confidence.
100. Reducing price risk for farm products would also increase incentives for production
and reduce the variability of rural incomes. This need not involve direct government
intervention in markets, which in many countries has proven to be ineffective and expensive,
often reducing the efficiency of markets by reducing incentives for private sector processing,
trade, and storage. Instead, promoting farmers’ groups can help small producers to pool their
products and make use of group storage or transport facilities. Improvements in market
information systems on the prices and volumes of production and market supplies can also help
farmers to increase their bargaining power and make more informed decisions on their sales.
Already, the use of cell phones has proven to be effective in improving the transmission of price
information across markets.
101. Increasing the access of the rural poor to food could also involve helping these
households to diversify their income-generating activities. Encouraging the provision of micro-
credit by local NGOs has been successful in supporting these activities, particular in situations
where there was sufficient effective market demand for the outputs. In the medium term,
investments in education and vocational training are also needed to increase human capital and
raise labor productivity.

92
102. Finally, improvements in heath and sanitation are needed to promote better
nutritional outcomes and overall health. Increases in food consumption alone may not lead to
improved nutrition if disease or otherwise poor health prevents individuals, especially pregnant
and lactating women, small children, and infants, from receiving the full benefit of the food that
they eat. Programs that address the overall health and sanitation environment, as well as the
care and feeding practices of infants, need to be supported, particularly among the poorest
households.
Strengthening Emergency Response System and Improving the Information System
103. Significant progress has been made in monitoring and responding to acute disasters.
Nonetheless, further steps are needed to strengthen early warning systems and the emergency
response system (see Annex 1).
Revise the government’s National Contingency Plan. As discussed earlier, several
institutions are involved in the early warning and emergency response systems.
Implementation of the government’s National Contingency Plan for Food Security is
needed to strengthen the key institutions involved, particularly with regard to timely
analysis and policy design. In this context, the role of the OPVN should be more clearly
defined, along with the operational rules regarding the use of the emergency food
security stock. Given the multiplicity of actors involved (various government agencies,
NGOs, and donors), a more comprehensive system of monitoring food procurement,
distribution, and stocks throughout all of the various programs should be set up.
Improve the early warning system. Current early warning systems provide valuable
information on markets in Niger. However, monitoring and analysis of price movements,
particularly in the whole of Nigeria (not just in border markets) and in the broader
international markets, are also crucial to ensure warnings are received early enough to
arrange for additional food aid or government commercial imports in the event of a

93
poor domestic harvest. This will require a significant strengthening of analytical capacity
within the key government institutions (the CCA, SAP, and SIMA). Likewise, encouraging
the free flow of information in newspapers and other media can help to keep the
government informed of situations where urgent action is needed.
Use safety net programs to complement the emergency response. Once sustainable
safety net programs are developed, it should be possible for the government to scale
them up substantially in the event of a major production shortfall. This will require
effective contingency planning, including arrangements for financing and effective
program implementation, with areas of responsibility clearly delineated.

94
REFERENCES
Africare, CRS, CARE, and HKI (2004). “Initiatives de Sécurité Alimentaire au Niger (ISAN) – Etude quantitative finale, 2004. ” Africare, Catholic Relief Services, CARE International, and Helen Keller International, Niamey, Niger. Aker, Jenny C. (2008). “Does Digital Divide or Provide? The Impact of Cell Phones on Grain Markets in Niger.” BREAD Working Paper No. 177, California, Berkeley. Aker, Jenny C. (2007). “The Structure, Conduct, and Performance of the Cereals Market in Niger: Implications for Preparing for and Responding to Food Crises.” A Report prepared for the World Bank, Washington, D.C. Alderman, H., S. Appleton, L. Haddad, L. Song, and Y. Yohannes (2005). Reducing Child Malnutrition: How Far Does Income Growth Take Us? Centre for Research in Economic Development and International Trade, University of Nottingham, U.K. Barrett, Chris and Daniel Maxwell. (2004). Food Aid After Fifty Years: Recasting Its Role. Routledge, New York, NY. Beekhuis, Geert (2005). “Niger: Profile of Cereal Markets.” World Food Programme, Rome, Italy. CARE International, CRS, HKI, and WVI (2007). “The Cereal Market in Niger: Findings from the 2005-2007 Market Surveys.” CARE International, Catholic Relief Services, Helen Keller International, and World Vision International, Baltimore, MD. Carter, M. and Barrett, C. (2006). ‘The economics of poverty traps and persistent poverty: an asset based approach’. Journal of Development Studies, 42(2), 178–199. Coates, J., P. Webb, and R. Houser (2003). “Measuring Food Insecurity: Going Beyond Indicators of Income and Anthropometry.” Food and Nutrition Technical Assistance Project, Academy for Educational Development, Washington D.C. Cutler, P. (1985). Detecting Food Emergency: Lessons from the Bangladesh Crisis. Food Policy 10: 17-36 del Ninno, C., Giovanni Vecchi, and Noshin Hussain (2006). “Poverty, Risk and Vulnerability in Pakistan.” Centre for Research on Poverty Reduction and Income Distribution (CRPRID), Islamabad, Pakistan. http://undp.org.pk/documents/PAKVulnerabilitytoPoverty.pdf

95
del Ninno, Carlo, Paul A. Dorosh, and Kalanidhi Subbarao (2007). “Food Aid, Domestic Policy, and Food Security: Contrasting Experiences from South Asia and Sub-Saharan Africa.” Food Policy, Volume 32, Issue 4, August 2007, Pages 413-435. del Ninno, Carlo, Paul A. Dorosh, and Kalanidhi Subbarao (2004). “Food Aid and Food Security in the Short and long Run: Country Experience from Asia and Sub-Saharan Africa.” Social Protection Discussion Paper #0538, World Bank, Washington D.C. del Ninno, C, P. Dorosh, L. Smith and Dilip Roy (2001) Household Food Security, Welfare Losses and Recovery in the Aftermath of the 1998 Floods in Bangladesh”. IFPRI Research Report 122, December 2001, Washington D.C. del Ninno, C. and A. Marini (2005). “Household’s Vulnerability to Shocks in Zambia.” Social Protection Discussion Paper #0536, World Bank Washington D.C. De Waal, Alex (1997) Famine Crimes: Politics and the Disaster Relief Industry in Africa. Villeries Publications, London Dorosh, Paul (2008a). “Production Shocks, Regional Trade and Cereal Prices in Niger.” Report prepared for the World Bank, Washington D.C. Dorosh, Paul (2008b). “Food Price Stabilization and Food Security: The International Experience.” Bulletin of Indonesian Economic Studies 44(1): 93-114. FEWSNET (2005). “Niger: An Evidence Base for Understanding the Current Crisis.” USAID/Famine Early Warning Systems Network, Washington, D.C. Fongillo, E.A., and S. Nanama (2006). “Development and Validation of an Experience-based Measure of Household Food Insecurity within and across Seasons in Northern Burkina Faso.” Journal of Nutrition 136: 1409S-19S. Government of Niger/Prime Minister’s Office, EC, SAP/CG (2005). Situation Alimentaire dans les Zones Vulnérables. Government of Niger/Prime Minister’s Office (2007). “Accelerated Development and Poverty Reduction Strategy: 2008-2012.” August. Niamey, Niger. Government of Niger/DNPCGA (2007). “Plan National de Contingence: Volet Sécurité Alimentaire et Nutritionnelle. ” November. Niamey, Niger. Grosh, Margaret, Carlo del Ninno, Emil Tesliuc, and Azedine Ouerghi (2008). For Protection and Promotion: The Design and Implementation of Effective Safety Nets. World Bank Publications, Washington D.C.

96
Guerrant R. L. (1992). “Diarrhea as a Cause and an Effect of malnutrition: Diarrhea Prevents Catch-up Growth and Malnutrition Increases Diarrhea Frequency and Duration.” American Journal of Tropical Medical Hygiene 47: 28-35. Haddad, L. and T. Frankenburger (2003). “Integrating Relief and Development to Accelerate Reductions in Food Insecurity in Shock-Prone Areas.” Occasional Paper No. 2, USAID Office of Food for Peace, Washington, D.C. Helen Keller International, Institut National de la Statistique, Ministère de Santé Publique, UNICEF, and World Food Programme (2007). “Enquête nutrition et survie des enfants de 6-59 mois, 2007.” Niamey, Niger Hoddinott, J. and Agnes Quisumbing (2003). “Methods for Microeconometric Risk and Vulnerability Assessments.” Social Protection Discussion Paper #0324, World Bank, Washington D.C. Hoddinott, J., and Y. Yohannes (2002). “Dietary Diversity as a Food Security Indicator.” FCND Discussion Paper No. 136, Food Consumption and Nutrition Division , International Food Policy Research Institute, Washington D.C. Holzmann, R. and S. Jorgensen (2000) “Social Risk Management: A New Conceptual Framework for Social Protection and Beyond” Social Protection Discussion Paper No. 0006, World Bank, Washington D.C. Hoogeveen, J., E. Tesliuc, R. Vakis, and S. Dercon (2004). “A Guide to the Analysis of Risk, Vulnerability and Vulnerable Groups.” World Bank, Washington D.C. Horton, S. and J. Ross (2003). “The Economics of Iron Deficiency.” Food Policy 28 (1): 51-75. Huss-Ashmore, R. (1997). “Local-Level Data for use as Early Warning Indicators” Internet Journal of African Studies, Issue No. 2 – March; Using Science Against Famine: Food Security, Famine Early Warning, and El Niño Institut National de la Statistique (INS), Macro International, and UNICEF (2006). “Enquête démographique, de la santé et de la nutrition/Multiple indicator cluster survey.” Niamey, Niger and Maryland. Institut National de la Statistique, UNICEF and WFP (2006). “Rapport d’enquête nationale nutrition et survie de l’enfant.” Niamey, Niger. Institut National de la Statistique (2004). “Profil de la pauvreté au Niger, 2004: Application de la méthode de degré de satisfaction des besoins essentiels (DSBE).” Niamey, Niger.

97
Institut National de la Statistique (2005). “Questionnaire des Indicateurs de Base du Bien-être (QUIBB), Profil de Pauvreté.” Niamey, Niger. Macro International (2002). “Enquête démographique et de la santé, 2002.” Maryland. Macro International (1998). “Enquête démographique et de la santé, 1998.” Maryland. Marinho, Eduardo, and Bruno Gerard (2008). “Tracking Vulnerability.” Unpublished mimeo. Maxwell, S., and T. Frankenberger (1992). “Household Food Security: Concepts, Indicators, Measurements. A Technical Review.” UNICEF, New York and IFAD, Rome. Maxwell, D., C. Ahiadeke, C. Levin, M. Armar-Klemesu, S. Zakariah, and G.M. Lamptey (1999). “Alternative Food-Security Indicators : Revising the Frequency and Severity of ‘Coping Strategies.’” Food Policy, Vol. 24, pp.411-429. Médecins sans Frontières 2005. Nutritional crisis in niger - médecins sans frontières calls for free food distribution. Press Release. http://www.msf.org.au/media-room/press-releases/press-release/article/nutritional-crisis-in-niger-medecins-sans-frontieres-calls-for-free-food-distribution.html Mauro Migotto, Benjamin Davis, Gero Carletto, and Kathleen Beegle (2006). “Measuring Food Security Using Respondents’ Perception of Food Consumption Adequacy.” Research Paper No. 88. United Nations University-Wider. http://www.wider.unu.edu/publications/working-papers/research-papers/2006/en_GB/rp2006-88/ McCorkle, C. M. (1987). Food grain Disposals as Early Warning Famine Signals: a Case from Burkina Faso. Disasters 11, 4, 273–281. Minten, Bart, and Paul Dorosh (eds) (2006). “Rice Markets in Madagascar in Disarray: Policy Options for Increased Efficiency and Price Stabilization.” Africa Region Working Paper Series, Number 101, World Bank, Washington, D.C. September. National Institute of Statistics in collaboration with Cooperation Française, European Union, FAO, FEWSNET, SAP, SIMA and WFP (May 2006). “Enquête sur la conjoncture et la vulnérabilité alimentaire des ménages.” Niamey, Niger. National Institute of Statistics and Early Warning System Cell in collaboration with FAO, RGAC, UNICEF (November 2006). Enquête conjointe sur la vulnérabilité à l’insecurité alimentaire des ménages au Niger. Niamey, Niger. http://www.stat-niger.org/statistique/file/Vulnerabilite/vulnerabilite_alimentaire_aout_%202007.pdf

98
Nicholson, S.E., B. Some, and B. Kone (2000). “An Analysis of Recent Rainfall Conditions in West Africa, Including the Rainy Seasons of the 1997 El Nino and the 1998 La Nina Years.” Journal of Climate. Vol. 13: 2628-2640. Ouedrago, A. (2008) – “Reaching the Chronic Poor and Food Insecure after a Disaster: the Case of Niger”- http://scholar.lib.vt.edu/theses/available/etd-07162008-170550/unrestricted/Thesis.pdf Pelletier, D. L. and E. A. Frongillo (2003). “Changes in Child Survival Are Strongly Associated with Changes in Malnutrition in Developing Countries.” Journal of Nutrition 133 (1) 107: 119- Rawlings, L. (2005). “Evaluating the Impact of Conditional Cash Transfer Programs.” World Bank Research Observer 20 (1): 29- 56. Karen A. Ricci, Federico Girosi, Phillip I. Tarr, Yee-Wei Lim, Carl Mason, Mark Miller, James Hughes, Lorenz von Seidlein, Jan M. Agosti & Richard L. Guerrant (2006). Reducing Stunting among Children: the Potential Contribution of Diagnostics. Nature Publishing Group Online, . http://www.nature.com/nature/journal/v444/n1s/full/nature05444.html Subbarao, K. and W. James Smith (2004). “Safety Nets versus Relief Nets: Towards a Medium Term Safety Nets Strategy in Ethiopia.” Unpublished mimeo. World Bank, Washington, D.C. Tesliuc, E. and Kathy Lindert (2004). “Risk and Vulnerabilitv in Guatemala: A Quantitative and Qualitative Assessment.” Social Protection Discussion Paper No. 0404, World Bank, Washington D.C. Terpend, N. Bonnard, P & Beekhuis, G (2006). “An Assessment of Knowledge about Trade and Markets Related Food Security in West Africa”, World Food Program Publication, Emergency Needs Assessment Branch (ODAN), Rome, Italy. http://documents.wfp.org/stellent/groups/public/documents/ena/wfp099369.pdf Timmer, P. (1974). A model of rice marketing margins in Indonesia. Food Research Institute Studies, XIII (2) (1974), pp. 145–167 UNDP and the Government of Niger (2007). “Analyse Intégrée des Facteurs de Risques au Niger. ” Niamey, Niger. UNICEF (2000). “Enquête indicateurs multiple de la fin de la décennie – MICS2, 2000.” Niamey, Niger. UNICEF (2005). “Report of an Emergency Nutrition Survey in Niger.” Niamey, Niger.

99
UNICEF (2007). The State of the World’s Children. New York, UNICEF. Victora, CG; Kirkwood, BR; Ashworth, A; Black, RE; Rogers, S; Sazawal, S; Campbell, H; Gove, S; (1999). “Potential Interventions for the Prevention of Childhood Pneumonia in Developing Countries: Improving Nutrition.” American Journal of Clinical Nutrition 70: 309-320. Walsh, J. (1986). Famine Early Warning System Close to Reality. Science 233(4769):1145-6 World Bank (1986). “Poverty and Hunger: Issues and Options for Food Security in Developing Countries.” Washington D.C. World Bank (2000). “World Development Report 2000-2001. Attacking Poverty”. Washington D.C. World Bank (2001) Dynamic Risk Management and the Poor: Developing a Social Protection Strategy for Africa. World Bank, Washington D.C. World Bank (2005). “Niger Millennium Development Goals: Diagnostic and Tools; June 2005.” Washington D.C. World Bank (2006a). “Carte de Pauvreté pour le Niger.” Unpublished mimeo. Washington D.C. World Bank (2006 b). “Repositioning Nutrition as Central to Development: A Strategy for Large-Scale Action.” Washington D.C. World Food Program (WFP) (2005 a). “Enquête sur la sécurité alimentaire en situation d’urgence (EFSA) au Niger.” World Food Programme, Niamey, Niger. http://reliefweb.int/sites/reliefweb.int/files/resources/8C459780E3D09B66492570BA00239BB3-wfp-ner-31oct.pdf World Food Program (WFP) (2005 b) “Niger: Profile of Cereal markets”, World Food Programme Publication, Emergency Needs Assessment Branch (ODAN), Rome, Italy. http://documents.wfp.org/stellent/groups/public/documents/ena/wfp082957.pdf

100
ANNEX I: DESIGN OF EARLY WARNING SYSTEMS
There is considerable debate as to the appropriate design of early warning systems for the
prediction of drought and famine in Africa. Much of the debate centers on the ability of
current or prospective indicators to provide location-specific, timely, and cost-effective
information. Macro-level environmental data are generally agreed to be useful, but they are
often unable to indicate the individual communities most in need of relief. Furthermore,
while grain prices and dispersion in Niger are strongly affected by climatic shocks, there was
not a strong correlation between drought and food crisis regions in 2005. Consequently, an
early warning system based solely upon climatic indicators would have over-estimated (or
under-estimated) the severity of the crisis. Similarly, although per capita grain production
was higher in 2004 than 2001, the severity of the food crisis was much greater in 2005 than
in 2001; consequently, an early warning system that depends primarily upon production
levels would have underestimated the severity of the food crisis. In an effort to minimize
concerns related to using macro-level indicators, the use of local-level indicators has been
recommended in this report to generate predictions on the food supply at the village or
sub-district level. However, the choice of indicators remains controversial.
Drought and Agricultural Production
Indicators of drought and agricultural production are timely and easy to use and can provide
early information on a possible food crisis in West Africa. Nevertheless, as experience has
shown in Niger, droughts do not necessarily lead to food crises or vice versa. De Waal
(1997) notes that the most effective early warning indicators can be reliably associated with
the development of food crisis conditions; more specifically, they should generate few
responses to situations where food crises do not actually develop (“false positive”
responses) and should not fail to respond when an actual famine is approaching (“false

101
negative” responses). Relying solely upon drought and agricultural production as early
warning indicators for Niger would have generated a “false positive” in 2001, but yielded a
“false negative” in 2004.
While drought-based and agricultural production-based predictions are prone to error,
these indicators can be strengthened by changing the level of analysis. Rather than focusing
on the presence of drought or national per capita production, a more appropriate indicator
would be the percentage of regions or departments affected by drought or by production
shocks. For example, while overall per capital production was higher in 2004 than in 2001,
the percentage of departments affected by production shocks was much higher. Similarly,
drought and production levels in the northern regions of Benin and Nigeria should also be
monitored.
Monitoring Domestic and Regional Market Prices
Market activity at the national, regional, and local levels has been used to signal an
impending food shortage in a variety of early warning systems (Huss-Ashmore 1997). In
general, two aspects have been monitored: the amount of grain or livestock being traded
and changes in the prices of these commodities. These indicators are interconnected, as
changes in the quantity of commodities traded affect their prices. However, monitoring the
amount of grain traded – either domestically or via imports – is difficult, especially in the
West African context. One indication of impending food crisis is an unusually high or rapid
increase in the price of staple food grains (McCorkle, 1987 and Walsh, 1986).
As with all market data, the interpretation of price changes in agricultural markets depends
on local circumstances (Huss-Ashmore 1997). Normal seasonal fluctuations in prices need to
be considered when assessing the meaning of sudden market shifts. Only increases that

102
significantly exceed those expected for a particular period can be considered as signs of an
unusual shortfall.62
The relationship between market performance and food crises in Niger provides some
indications of the appropriate focus, timing, and interpretation of changes in market prices.
Although the current early warning systems in Niger monitor a variety of markets, not all
markets affect grain prices or food security to the same degree. First, early warning systems
should carefully monitor key “forecasting” markets within Niger and in the sub-region
(Benin and Nigeria). To be precise, strategic forecasting markets could be defined as those
markets that “Granger-cause63” a significant number of markets in Niger (for example, over
75 percent), including those located in Benin and Nigeria.
A secondary consideration is the timing of the monitoring of market prices. While current
systems monitor prices on a monthly basis, the harvest (October-November) and hungry
(June-August) periods are of most concern. The relatively higher prices in Granger-causing
markets during October 2004 relative to the previous year could have served as a key
indicator of the potential crisis during the 2004/2005 marketing season. This is especially
important in light of the slow adjustment speed of market prices. Therefore, early warning
systems should also monitor prices in key forecasting markets in Niger, Benin, and Nigeria
during the harvest period in order to determine whether price levels are higher at the
outset of the marketing season.
62
Variations in local circumstances mean that economic activities, as famine indicators, do not function equally well for all populations. Cutler (1985) showed that both the retail price of coarse rice and the demand for fertilizer served as accurate warning signals for famine conditions in Bangladesh in 1979. Similarly, McCorkle (1987) argued that flux in the market prices of cereals and livestock is one of the most promising quantitative markers of famine onset in West Africa. Using data from Burkina Faso, she showed that the food crisis of 1983-84 was accurately signaled by a tripling of the price of sorghum, a sharp fall in the selling price of cattle, and an increase in the number of farmers defaulting on their advance sales agreements with grain merchants. By contrast, de Waal (1997) argued that economic indicators were poor predictors of famine for Darfur in Sudan in 1984-85. Despite two complete harvest failures in northern Darfur and one in southern Darfur, economic data proved to be neither sensitive to nor specific in predicting increased mortality. 63
The Granger causality test is a statistical hypothesis test for determining whether one time series is useful in forecasting another.

103
While monitoring prices and price changes in strategic markets is important, knowing that
prices are “higher” or have “increased” does not provide an effective indicator for
determining whether there will be a food crisis. Based on the livelihood security studies and
poverty studies conducted by international organizations, a threshold grain price in key
national and regional markets should be identified.
Fuel Prices
Traditionally, fuel prices are not included as early warning indicators in the West Africa
region. While grain prices are fairly inelastic to changes in gas prices or transport costs, such
changes do affect geographical arbitrage opportunities. Consequently, changes in fuel
prices can impact the geographical allocation of goods, thereby affecting food supply and
prices. Monthly fuel prices and transport costs could be a timely and cost-effective indicator
of food crises, especially for remote or distant markets.
Market Information
Most early warning systems focus on providing relevant and timely information to
policymakers rather than to the market actors themselves. Market performance, however,
depends on symmetric access to appropriate information. Asymmetric information prevents
market actors from taking advantage of optimal arbitrage opportunities. Although market
information systems collect and disseminate price information in several West African
countries, survey evidence suggests that these are not always used by traders and farmers.
A recent study in Niger found that cell phone coverage is associated with a statistically
significant reduction in grain price dispersion as well as lower grain prices. The main
mechanism for this result was a change in traders’ behavior as traders use cell phones to
gather market information and to make decisions about the optimal allocation of goods.
This suggests that the data on and analysis of early warning systems should not only be
available to policymakers but also to market actors.

104
Map IBRD 41182

Social Protection & Labor Discussion Paper Series Titles 2012-2014
No. Title 1424 Profiling the Unemployed: A Review of OECD Experiences and Implications for
Emerging Economies by Artan Loxha and Matteo Morgandi, August 2014 1423 Any Guarantees? An Analysis of China’s Rural Minimum Living Standard Guarantee
Program by Jennifer Golan, Terry Sicular and Nithin Umapathi, August 2014 1422 World Bank Support for Social Safety Nets 2007-2013: A Review of Financing,
Knowledge Services and Results by Colin Andrews, Adea Kryeziu and Dahye Seo, June 2014 1421 STEP Skills Measurement Surveys: Innovative Tools for Assessing Skills
by Gaëlle Pierre, Maria Laura Sanchez Puerta, Alexandria Valerio and Tania Rajadel, July 2014
1420 Our Daily Bread: What is the Evidence on Comparing Cash versus Food Transfers? by Ugo Gentilini, July 2014
1419 Rwanda: Social Safety Net Assessment by Alex Kamurase, Emily Wylde, Stephen Hitimana and Anka Kitunzi, July 2012 1418 Niger: Food Security and Safety Nets by Jenny C. Aker, Carlo del Ninno, Paul A. Dorosh, Menno Mulder-Sibanda and
Setareh Razmara, February 2009 1417 Benin: Les Filets Sociaux au Bénin Outil de Réduction de la Pauvreté
par Andrea Borgarello et Damien Mededji, Mai 2011 1416 Madagascar Three Years into the Crisis: An Assessment of Vulnerability and Social
Policies and Prospects for the Future by Philippe Auffret, May 2012 1415 Sudan Social Safety Net Assessment
by Annika Kjellgren, Christina Jones-Pauly, Hadyiat El-Tayeb Alyn, Endashaw Tadesse and Andrea Vermehren, May 2014

1414 Tanzania Poverty, Growth, and Public Transfers: Options for a National Productive Safety Net Program by W. James Smith, September 2011
1413 Zambia: Using Social Safety Nets to Accelerate Poverty Reduction and Share
Prosperity by Cornelia Tesliuc, W. James Smith and Musonda Rosemary Sunkutu, March 2013
1412 Mali Social Safety Nets
by Cécile Cherrier, Carlo del Ninno and Setareh Razmara, January 2011 1411 Swaziland: Using Public Transfers to Reduce Extreme Poverty
by Lorraine Blank, Emma Mistiaen and Jeanine Braithwaite, November 2012 1410 Togo: Towards a National Social Protection Policy and Strategy
by Julie van Domelen, June 2012 1409 Lesotho: A Safety Net to End Extreme Poverty
by W. James Smith, Emma Mistiaen, Melis Guven and Morabo Morojele, June 2013 1408 Mozambique Social Protection Assessment: Review of Social Assistance Programs
and Social Protection Expenditures by Jose Silveiro Marques, October 2012
1407 Liberia: A Diagnostic of Social Protection
by Andrea Borgarello, Laura Figazzolo and Emily Weedon, December 2011 1406 Sierra Leone Social Protection Assessment
by José Silvério Marques, John Van Dyck, Suleiman Namara, Rita Costa and Sybil Bailor, June 2013
1405 Botswana Social Protection
by Cornelia Tesliuc, José Silvério Marques, Lillian Mookodi, Jeanine Braithwaite, Siddarth Sharma and Dolly Ntseane, December 2013
1404 Cameroon Social Safety Nets
by Carlo del Ninno and Kaleb Tamiru, June 2012 1403 Burkina Faso Social Safety Nets
by Cécile Cherrier, Carlo del Ninno and Setareh Razmara, January 2011 1402 Social Insurance Reform in Jordan: Awareness and Perceptions of Employment
Opportunities for Women by Stefanie Brodmann, Irene Jillson and Nahla Hassan, June 2014
1401 Social Assistance and Labor Market Programs in Latin America: Methodology and
Key Findings from the Social Protection Database by Paula Cerutti, Anna Fruttero, Margaret Grosh, Silvana Kostenbaum, Maria Laura
Oliveri, Claudia Rodriguez-Alas, Victoria Strokova, June 2014 1308 Youth Employment: A Human Development Agenda for the Next Decade by David Robalino, David Margolis, Friederike Rother, David Newhouse and Mattias
Lundberg, June 2013 1307 Eligibility Thresholds for Minimum Living Guarantee Programs: International
Practices and Implications for China by Nithin Umapathi, Dewen Wang and Philip O’Keefe, November 2013
1306 Tailoring Social Protection to Small Island Developing States: Lessons Learned from
the Caribbean by Asha Williams, Timothy Cheston, Aline Coudouela and Ludovic Subran, August
2013 1305 Improving Payment Mechanisms in Cash-Based Safety Net Programs by Carlo del Ninno, Kalanidhi Subbarao, Annika Kjellgren and Rodrigo Quintana,
August 2013 1304 The Nuts and Bolts of Designing and Implementing Training Programs in Developing
Countries by Maddalena Honorati and Thomas P. McArdle, June 2013
1303 Designing and Implementing Unemployment Benefit Systems in Middle and Low
Income Countries: Key Choices between Insurance and Savings Accounts by David A. Robalino and Michael Weber, May 2013 1302 Entrepreneurship Programs in Developing Countries: A Meta Regression Analysis by Yoonyoung Cho and Maddalena Honorati, April 2013 1301 Skilled Labor Flows: Lessons from the European Union by Martin Kahanec, February 2013 1220 Evaluating the Efficacy of Mass Media and Social Marketing Campaigns in Changing
Consumer Financial Behavior by Florentina Mulaj and William Jack, November 2012 1219 Do Social Benefits Respond to Crises? Evidence from Europe & Central Asia During
the Global Crisis by Aylin Isik-Dikmelik, November 2012

1218 Building Results Frameworks for Safety Nets Projects by Gloria M. Rubio, October 2012 1217 Pension Coverage in Latin America: Trends and Determinants by Rafael Rofman and Maria Laura Oliveri, June 201 1216 Cash for Work in Sierra Leone: A Case Study on the Design and Implementation of a
Safety Net in Response to a Crisis by Colin Andrews, Mirey Ovadiya, Christophe Ribes Ros and Quentin Wodon,
November 2012 1215 Public Employment Services, and Activation Policies by Arvo Kuddo, May 2012 1214 Private Pension Systems: Cross-Country Investment Performance by Alberto R. Musalem and Ricardo Pasquini, May 2012 1213 Global Pension Systems and Their Reform: Worldwide Drivers, Trends, and
Challenges by Robert Holzmann, May 2012 1211 International Patterns of Pension Provision II: A Worldwide Overview of Facts and
Figures by Montserrat Pallares-Miralles, Carolina Romero and Edward Whitehouse, June 2012 1210 Climate-Responsive Social Protection by Anne T. Kuriakose, Rasmus Heltberg, William Wiseman, Cecilia Costella, Rachel
Cipryk and Sabine Cornelius, March 2012 1209 Social Protection in Low Income Countries and Fragile Situations: Challenges and Future
Directions by Colin Andrews, Maitreyi Das, John Elder, Mirey Ovadiya and Giuseppe Zampaglione,
March 2012 1208 World Bank Support for Pensions and Social Security by Mark Dorfman and Robert Palacios, March 2012 1207 Labor Markets in Middle and Low Income Countries: Trends and Implications for Social
Protection and Labor Policies by Yoonyoung Cho, David Margolis, David Newhouse and David Robalino, March 2012

1206 Rules, Roles and Controls: Governance in Social Protection with an Application to Social Assistance
by Lucy Bassett, Sara Giannozzi, Lucian Pop and Dena Ringold, March 2012 1205 Crisis Response in Social Protection by Federica Marzo and Hideki Mori, March 2012 1204 Improving Access to Jobs and Earnings Opportunities: The Role of Activation and
Graduation Policies in Developing Countries by Rita Almeida, Juliana Arbelaez, Maddalena Honorati, Arvo Kuddo, Tanja Lohmann,
Mirey Ovadiya, Lucian Pop, Maria Laura Sanchez Puerta and Michael Weber, March 2012
1203 Productive Role of Safety Nets by Harold Alderman and Ruslan Yemtsov, March 2012 1202 Building Social Protection and Labor Systems: Concepts and Operational Implications by David A. Robalino, Laura Rawlings and Ian Walker, March 2012 1201 MicroDeterminants of Informal Employment in the Middle East and North Africa Region by Diego F. Angel-Urdinola and Kimie Tanabe, January 2012
To view Social Protection & Labor Discussion papers published prior to 2012, please visit www.worldbank.org/spl
About this series...
Abstract
Africa Social Safety Net and Social Protection Assessment Series
F e b r u a r y 2 0 0 9
Social Protection & Labor Discussion Papers are published to communicate the results of The World Bank’s work to the development community with the least possible delay. The typescript manuscript of this paper therefore has not been prepared in accordance with the procedures appropriate to formally edited texts.
The findings, interpretations, and conclusions expressed herein are those of the author(s), and do not necessarily reflect the views of the International Bank for Reconstruction and Development / The World Bank and its affiliated organizations, or those of the Executive Directors of The World Bank or the governments they represent. The World Bank does not guarantee the accuracy of the data included in this work. The author(s) attest(s) that the paper represents original work. It fully references and describes all relevant prior work on the same subject.
For more information, please contact the Social Protection Advisory Service, The World Bank, 1818 H Street, N.W., Room G7-803, Washington, DC 20433 USA. Telephone: (202) 458-5267, Fax: (202) 614-0471, E-mail: [email protected] or visit us on-line at www.worldbank.org/sp.© 2013 International Bank for Reconstruction and Development / The World Bank
This study aims to assist the Government of Niger in developing a multi-sectoral approach to reducing the population’s vulnerability to food insecurity. The study reviews food security policies and programs in Niger, and provides an action plan for strengthening the existing system and developing an effective safety net strategy. The study finds that targeting of food aid has been either weak with significant leakages. Moreover, although the need to support poor and food insecure households is substantial, safety nets are small, receive limited funding, and are designed for emergency food crises. The study recommends to improve the efficiency and scope of safety net programs in Niger and to promote effective strategies to improve food availability and the emergency response systems.
Niger
Food Security and Safety Nets
Jenny C. Aker, Carlo del Ninno, Paul A. Dorosh, Menno Mulder-Sibanda and Setareh Razmara
D I S C U S S I O N P A P E R N O . 1 4 1 8