Nielsen Music – The Fan: Understanding How They Drive Change
36
THE COMPLETE VIEW OF MUSIC
-
Upload
music-business-association -
Category
Data & Analytics
-
view
7.733 -
download
0
Transcript of Nielsen Music – The Fan: Understanding How They Drive Change

THE COMPLETE VIEW OF MUSIC

ARE YOU SEEING THE WHOLE PICTURE?
MEASUREMENT OF MUSIC ACTIVITY AND MUSIC FANS

Co
pyr
igh
t ©
2014
Th
e N
iels
en C
om
pan
y. C
on
fid
enti
al a
nd
pro
pri
etar
y.
4
WE ARE LISTENING TO MORE MUSIC DRIVEN BY ACCESS AND TECHNOLOGY, LISTENING TIME IS RISING
hours spent listening to music in a typical week
19
25
Avg. Weekly Hours
2013
2014
5
+30%

Co
pyr
igh
t ©
2014
Th
e N
iels
en C
om
pan
y. C
on
fid
enti
al a
nd
pro
pri
etar
y.
5
AND MORE GOOD NEWS – OVERALL VOLUME IS UP 14% SO FAR IN 2015
183M
121M
83M
44M 38M 38M
62M
Total MusicVolume (Album
+ TEA + SEA)
Total Sales(Album + TEA)
OverallAlbums
PhysicalAlbums
DigitalAlbums
Digital TEA Streaming SEA
2014 2015TEA Ratio - 10:1 SEA Ratio – 1500:1
+14%
-5%
-3%
-6% +1% -11%
+91%

Co
pyr
igh
t ©
2014
Th
e N
iels
en C
om
pan
y. C
on
fid
enti
al a
nd
pro
pri
etar
y.
6
STREAMING HAS QUICKLY BECOME THE LARGEST SHARE OF THE BUSINESS
20%
34%
27%
21%
24% 21%
29% 24%
2014 YTD 2015 YTD
PHYSICAL ALBUMS
2014 2015
TEA Ratio - 10:1 SEA Ratio – 1500:1

A CLOSER LOOK AT MUSIC FORMATS AND GENRES

Co
pyr
igh
t ©
2014
Th
e N
iels
en C
om
pan
y. C
on
fid
enti
al a
nd
pro
pri
etar
y.
8
ROCK IS THE BIGGEST GENRE, BUT R&B/HIP-HOP AND POP ARE ALSO STRONG IN 2015
30%
21%
17%
9%
5% 4% 3%
Rock R&B/Hip-Hop Pop Country Latin Dance/Elec Christian/Gosp
Share of Total Activity
TEA Ratio - 10:1 SEA Ratio – 1500:1

Co
pyr
igh
t ©
2014
Th
e N
iels
en C
om
pan
y. C
on
fid
enti
al a
nd
pro
pri
etar
y.
9
ROCK DOMINATES ALBUMS, POP DRIVES SONG SALES AND R&B/HIP-HOP LEADS STREAMING
37%
18%
12% 11%
3% 2% 4%
24% 23%
26%
12%
2% 5% 3%
23% 26%
19%
5%
10%
6% 3%
Rock R&B/Hip-Hop Pop Country Latin Dance/Elec Christian/Gosp
GENRE SHARE OF TOTAL
Album Sales % Song Sales % Streams %

Co
pyr
igh
t ©
2014
Th
e N
iels
en C
om
pan
y. C
on
fid
enti
al a
nd
pro
pri
etar
y.
10
STREAMING HAS BECOME THE LEADING FORMAT OVERALL AND IN MOST GENRES SHARE OF TOTAL EQUIVALENTS BY FORMAT
24%
32%
19%
18%
35%
19%
8%
24%
21%
26%
20%
15%
21%
5%
18%
29%
21%
16%
22%
31%
27%
8%
24%
20%
34%
26%
39%
36%
18%
68%
51%
27%
All Music
Rock
R&B/Hip-Hop
Pop
Country
Latin
Dance/Elec
Christian/Gosp
Phys Albums Dig Albums TEA SEA
TEA Ratio - 10:1 SEA Ratio – 1500:1

Co
pyr
igh
t ©
2014
Th
e N
iels
en C
om
pan
y. C
on
fid
enti
al a
nd
pro
pri
etar
y.
11
WHILE SALES ARE EVENLY SPLIT BETWEEN CURRENT AND CATALOG, STREAMS ARE 70% CATALOG
57% 51% 49%
70%
Total Music
Catalog Share of Format
Total Activity Album Sales % Song Sales % Streams %

Co
pyr
igh
t ©
2014
Th
e N
iels
en C
om
pan
y. C
on
fid
enti
al a
nd
pro
pri
etar
y.
12
ROCK IS DRIVEN BY CATALOG AT ALL FORMATS, WHILE POP IS MAINLY DRIVEN BY CURRENT
68%
36%
52% 55%
63%
21%
46%
54%
68%
30%
47% 48%
82%
58% 61%
70%
Rock Pop R&B/Hip-Hop Country
Catalog Share of Format Total Activity Album Sales % Song Sales % Streams %

DIFFERENT TYPES OF CONSUMPTION MEANS DIFFERENT PATHS TO SUCCESS

Co
pyr
igh
t ©
2014
Th
e N
iels
en C
om
pan
y. C
on
fid
enti
al a
nd
pro
pri
etar
y.
14
THE TOP ALBUMS ACHIEVE SUCCESS IN DIFFERENT WAYS
Based on U.S. Album Sales; Track Equivalent Albums; Stream Equivalent Albums
Rank Artist Title Total Volume
(000) Album Share
Song Sales Share
On-Demand Audio Stream
Share
1 TAYLOR SWIFT 1989 1,608 67% 33% 0%
2 DRAKE IF YOU’RE READING
THIS 1,250 71% 13% 16%
3 ED SHEERAN X 1,178 52% 36% 11%
4 SAM SMITH IN THE LONELY HOUR 1,097 61% 27% 12%
5 SOUNDTRACK 50 SHADES OF GREY 1,031 61% 31% 8%
6 MEGHAN TRAINOR TITLE 961 63% 30% 8%
7 MAROON 5 V 762 40% 48% 12%
8 NICKI MINAJ PINKPRINT 699 43% 38% 18%
9 KENDRICK LAMAR TO PIMP A BUTTERFLY 660 84% 5% 11%
10 FALL OUT BOY AMERICAN BEAUTY… 632 65% 25% 10%
Co
pyr
igh
t ©
2014
Th
e N
iels
en C
om
pan
y. C
on
fid
enti
al a
nd
pro
pri
etar
y.
15
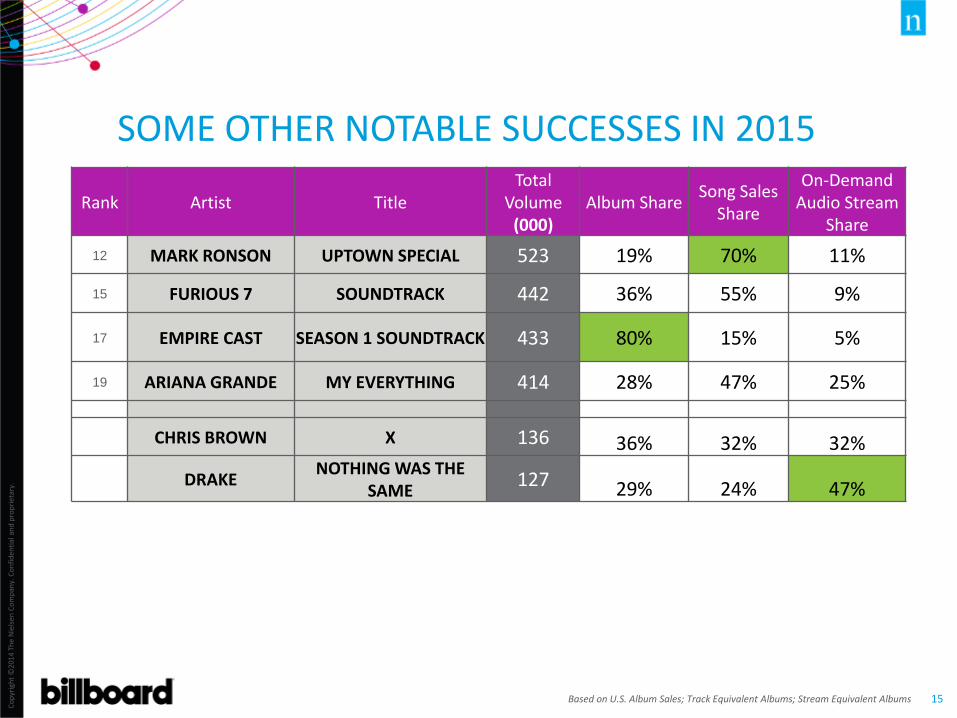
SOME OTHER NOTABLE SUCCESSES IN 2015
Based on U.S. Album Sales; Track Equivalent Albums; Stream Equivalent Albums
Rank Artist Title Total
Volume (000)
Album Share Song Sales
Share
On-Demand Audio Stream
Share
12 MARK RONSON UPTOWN SPECIAL 523 19% 70% 11%
15 FURIOUS 7 SOUNDTRACK 442 36% 55% 9%
17 EMPIRE CAST SEASON 1 SOUNDTRACK 433 80% 15% 5%
19 ARIANA GRANDE MY EVERYTHING 414 28% 47% 25%
CHRIS BROWN X 136 36% 32% 32%
DRAKE NOTHING WAS THE
SAME 127 29% 24% 47%

Co
pyr
igh
t ©
2014
Th
e N
iels
en C
om
pan
y. C
on
fid
enti
al a
nd
pro
pri
etar
y.
16
STRONG CORRELATION BETWEEN STREAMS, SALES AND RADIO AUDIENCE - USUALLY
Top On-Demand Songs YTD
Total On-Demand
Streams (000) Audio Rank
Video Rank
Song Sales Rank
Radio Rank (Audience)
1. MARK RONSON FEAT. BRUNO MARS UPTOWN FUNK!
285,647 #1 #1 #1 #1
2. ED SHEERAN THINKING OUT LOUD
182,310 #2 #3 #2 #2
3. FETTY WAP TRAP QUEEN
146,598 #8 #5 #16 #61
4. MAROON 5 SUGAR
139,387 #4 #8 #3 #4
5. HOZIER TAKE ME TO CHURCH
124,625 #5 #15 #5 #7
6. TAYLOR SWIFT SHAKE IT OFF
119,401 NR #2 #17 #24
7. WEEKND EARNED IT (FIFTY SHADES OF GREY)
117,196 #3 #22 #8 #12
8. ELLIE GOULDING LOVE ME LIKE YOU DO
112,895 #6 #21 #4 #6
9. TAYLOR SWIFT BLANK SPACE
111,181 NR #4 #9 #3
10. MEGHAN TRAINOR ALL ABOUT THAT BASS
109,450 #38 #6 #25 #51

THE ATTRIBUTES OF A SUCCESSFUL ARTIST

N-SCORE CELEBRITY PERCEPTION Our N-Score tool allows us to measure fan affinity and sentiment for individual celebrities – and assess their potential for brand partnerships
Awareness
Attributes
We can evaluate an artist or celebrity’s ability to move products and enhance brand reputation.

Co
pyr
igh
t ©
2014
Th
e N
iels
en C
om
pan
y. C
on
fid
enti
al a
nd
pro
pri
etar
y.
19
TOP ARTISTS ARE SEEN AS TRENDSETTERS Artists of the top 10 albums purchased and top 10 streamed songs are, above all else, seen as Trendsetters in the music industry
Frequency of occurrences of trendsetter score, indexed to music industry mean.
Source: Nieilsen N-Score 01/01/2014 – 2/17/2015
20 30 40 50 60 70 80 90 100 110 120 130 140 150 160 170 180 190 200 210 220 230 240 More
144
147
100 Music Industry Mean
Top 10 Stream Songs
Top 10 Albums
TrendSetter Index

Co
pyr
igh
t ©
2014
Th
e N
iels
en C
om
pan
y. C
on
fid
enti
al a
nd
pro
pri
etar
y.
20
THE MOST SUCCESSFUL COUNTRY ARTISTS ARE SEEN AS LIKEABLE, UNOFFENSIVE, DEPENDABLE AND ROLE-MODELS
Nielsen N-Score. Bases are fans of each genre of music
78
47
73
27
17
37
32
2
24
20
28
60
15
N-Score
Awareness
Likeability
Dependable
Funny
Good Looking
Influential
Offensive
Role Model
Social Media Savvy
Stylish
Successful
Trendsetter
Country

Co
pyr
igh
t ©
2014
Th
e N
iels
en C
om
pan
y. C
on
fid
enti
al a
nd
pro
pri
etar
y.
21
NO WONDER COUNTRY FANS HAVE SO MUCH ENERGY
WHO ARE THEY?
58% of country music fans are female.
81% of country music fans are
white.
THEY STILL LOVE RADIO
Radio is both the most popular platform and the most popular
listening device.
THEY ARE ACTIVE ON SOCIAL MEDIA, PARTICULARLY AROUND LIVE MUSIC EVENTS
20 – 30% more likely than the average music fan to post
photos or update status about live music.
WHAT ARE THEY DRINKING? Far more likely to drink energy
drinks.
Also, favor domestic beers over imported and flavored alcoholic
spirits over wine.

Co
pyr
igh
t ©
2014
Th
e N
iels
en C
om
pan
y. C
on
fid
enti
al a
nd
pro
pri
etar
y.
22
HIP HOP FANS ARE MORE TOLERANT OF THEIR ARTISTS BEING OFFENSIVE, BUT IT IS IMPORTANT FOR THEM TO BE INFLUENTIAL, STYLISH TREND-SETTERS
Nielsen N-Score. Bases are fans of each genre of music
78
47
73
27
17
37
32
2
24
20
28
60
15
70
44
63
19
16
24
32
11
18
24
29
50
22
N-Score
Awareness
Likeability
Dependable
Funny
Good Looking
Influential
Offensive
Role Model
Social Media Savvy
Stylish
Successful
Trendsetter
Country Hip-Hop

Co
pyr
igh
t ©
2014
Th
e N
iels
en C
om
pan
y. C
on
fid
enti
al a
nd
pro
pri
etar
y.
23
HIP-HOP FANS ARE AT THE FOREFRONT OF THE DIGITAL MUSIC MOVEMENT
WHO ARE THEY?
Over twice as likely to be African- American and 50% more likely to be Hispanic.
THEY ARE SPENDING MORE
Hip-hop fans spend 35% more annually on music, including twice as much on club events with live
DJs and 40% more on music festivals.
THEY ARE VERY ENGAGED WITH DIGITAL MUSIC
Far more likely to use streaming services for both consumption
and discovery.
Strong social element – hip-hop consumers are more than twice as likely to connect with friends
through music.
WHAT MOBILE SERVICES? Use Sprint and T-Mobile
significantly more than the average consumer.
Also, 50% more likely to have a
Samsung mobile phone than average.

Co
pyr
igh
t ©
2014
Th
e N
iels
en C
om
pan
y. C
on
fid
enti
al a
nd
pro
pri
etar
y.
24
WHILE EDM HAS LOWER GENERAL AWARENESS, TRAITS OF THE MOST SUCCESSFUL ARTISTS INCLUDE BEING INFLUENTIAL TREND-SETTERS AND SOCIAL MEDIA SAVVY
Nielsen N-Score. Bases are fans of each genre of music
66
25
67
18
17
22
30
5
16
26
22
41
20
78
47
73
27
17
37
32
2
24
20
28
60
15
70
44
63
19
16
24
32
11
18
24
29
50
22
N-Score
Awareness
Likeability
Dependable
Funny
Good Looking
Influential
Offensive
Role Model
Social Media Savvy
Stylish
Successful
Trendsetter
EDM Country Hip-Hop
Co
pyr
igh
t ©
2014
Th
e N
iels
en C
om
pan
y. C
on
fid
enti
al a
nd
pro
pri
etar
y.
25
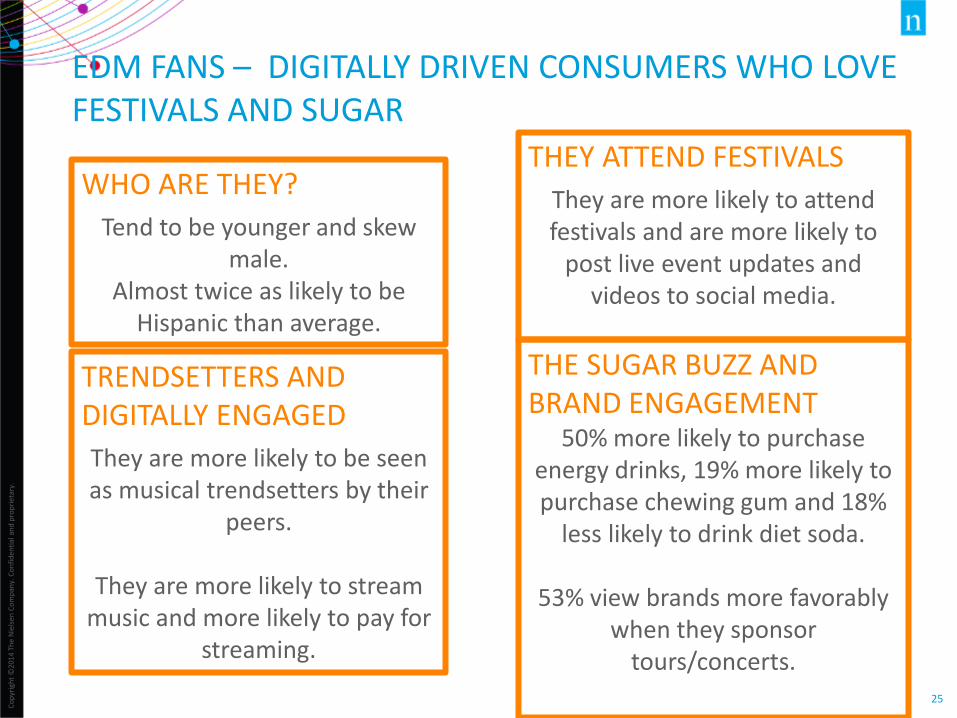
EDM FANS – DIGITALLY DRIVEN CONSUMERS WHO LOVE FESTIVALS AND SUGAR
WHO ARE THEY?
Tend to be younger and skew male.
Almost twice as likely to be Hispanic than average.
THEY ATTEND FESTIVALS
They are more likely to attend festivals and are more likely to
post live event updates and videos to social media.
TRENDSETTERS AND DIGITALLY ENGAGED
They are more likely to be seen as musical trendsetters by their
peers.
They are more likely to stream music and more likely to pay for
streaming.
THE SUGAR BUZZ AND BRAND ENGAGEMENT
50% more likely to purchase energy drinks, 19% more likely to purchase chewing gum and 18%
less likely to drink diet soda.
53% view brands more favorably when they sponsor
tours/concerts.
Co
pyr
igh
t ©
2014
Th
e N
iels
en C
om
pan
y. C
on
fid
enti
al a
nd
pro
pri
etar
y.
26
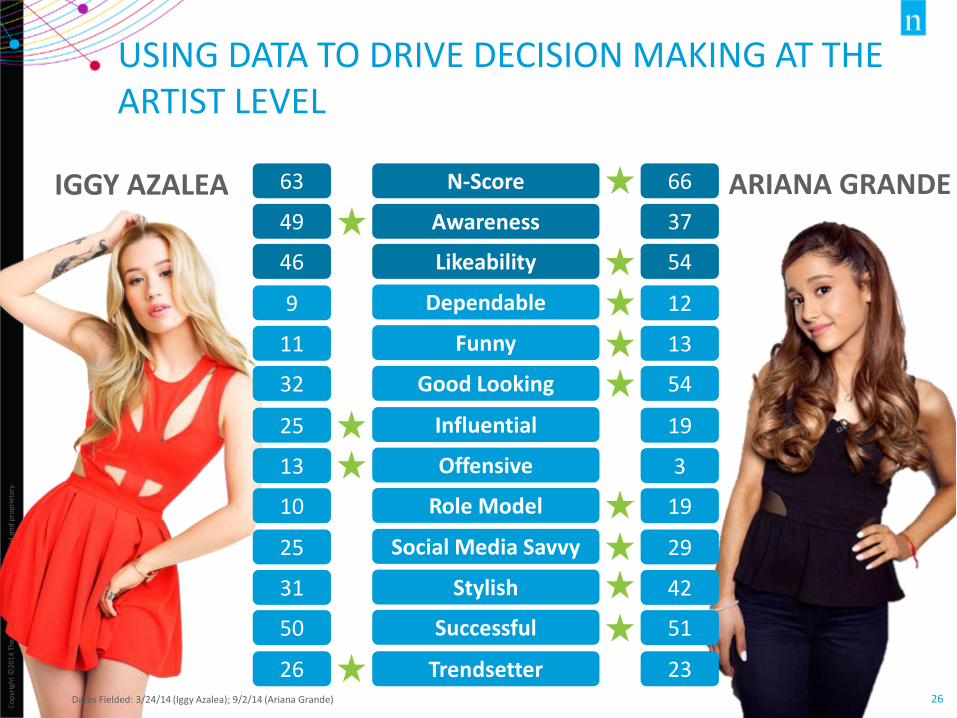
USING DATA TO DRIVE DECISION MAKING AT THE ARTIST LEVEL
Dates Fielded: 3/24/14 (Iggy Azalea); 9/2/14 (Ariana Grande)
N-Score
Awareness
Likeability
Dependable
Funny
Good Looking
Influential
Offensive
Role Model
Social Media Savvy
Stylish
Successful
Trendsetter
66
37
54
12
13
54
19
3
19
29
42
51
23
63
49
46
9
11
32
25
13
10
25
31
50
26
IGGY AZALEA ARIANA GRANDE

AND LET’S NOT FORGET ABOUT THE POWER OF TELEVISION

Co
pyr
igh
t ©
2014
Th
e N
iels
en C
om
pan
y. C
on
fid
enti
al a
nd
pro
pri
etar
y.
28
A MUSIC STORY GROWING FROM TELEVISION EMPIRE
Source: Nielsen TV Ratings – *(Live + Same Day, A18-49). Nielsen Social Guide/Twitter TV Ratings. 1/7/15 – 2/25/15.
-
100,000
200,000
300,000
400,000
-
100,000
200,000
300,000
400,000
500,000
600,000
700,000
800,000
7-Jan 14-Jan 21-Jan 28-Jan 4-Feb 11-Feb 18-Feb 25-Feb
Total Tweets Total Unique Authors
Twee
ts
Un
iqu
e Au
tho
rs
9
10
11
12
13
14
7-Jan 14-Jan 21-Jan 28-Jan 4-Feb 11-Feb 18-Feb 25-Feb
VIEWERS (MILLIONS)
ONLINE
Overall, THE most tweeted about show since its premiere (Cable or Broadcast)
At 382,000 each airing, the show garners the
highest average tweets per episode during live airings of any Broadcast drama this season
SOCIAL TRAFFIC
TELEVISION
As of Feb 25th, Empire ranked as the No.1 show on network television (18-49)
The show became the first series since 1991 to gain
increased viewership for its first 5 consecutive weeks on air
Feb 25th ep. was the highest rated regular Broadcast
drama in approximately 5 years

SEE THE WHOLE PICTURE


© Aptitude


© Aptitude

THANK YOU!